Introduction
This is a report for the insert benchmark with 20M docs and 4 client(s). It is generated by scripts (bash, awk, sed) and Tufte might not be impressed. An overview of the insert benchmark is here and a short update is here. Below, by DBMS, I mean DBMS+version.config. An example is my8020.c10b40 where my means MySQL, 8020 is version 8.0.20 and c10b40 is the name for the configuration file.
The test server has 8 AMD cores, 16G RAM and an NVMe SSD. It is described here as the Beelink. The benchmark was run with 4 clients and there were 1 or 3 connections per client (1 for queries or inserts without rate limits, 1+1 for rate limited inserts+deletes). It uses 4 tables, 1 per client. It loads 20M rows per table without secondary indexes, creates secondary indexes, then inserts 50M rows per table with a delete per insert to avoid growing the table. It then does 3 read+write tests for 1800s each that do queries as fast as possible with 100, 500 and then 1000 inserts/second/client concurrent with the queries and 1000 deletes/second to avoid growing the table. The database is cached by the OS page cache but not by the storage engine. Clients and the DBMS share one server. The per-database configs are in the per-database subdirectories here.
The tested DBMS are:
- fbmy5635_rel.cy10_1g_bee - - MyRocks 5.6.35, the cy10_1g_bee config and compiled with CMAKE_BUILD_TYPE=Release: -O3
- fbmy8028_rel_native_lto.cy10_1g_bee - MyRocks 8.0.28, the cy10_1g_bee config and compiled with CMAKE_BUILD_TYPE=Release: -O3 -flto -march=native -mtune=native
Contents
- Summary
- l.i0: load without secondary indexes
- l.x: create secondary indexes
- l.i1: continue load after secondary indexes created
- q100.1: range queries with 100 insert/s per client
- q500.1: range queries with 500 insert/s per client
- q1000.1: range queries with 1000 insert/s per client
Summary
The numbers are inserts/s for l.i0 and l.i1, indexed docs (or rows) /s for l.x and queries/s for q*.2. The values are the average rate over the entire test for inserts (IPS) and queries (QPS). The range of values for IPS and QPS is split into 3 parts: bottom 25%, middle 50%, top 25%. Values in the bottom 25% have a red background, values in the top 25% have a green background and values in the middle have no color. A gray background is used for values that can be ignored because the DBMS did not sustain the target insert rate. Red backgrounds are not used when the minimum value is within 80% of the max value.
| dbms | l.i0 | l.x | l.i1 | q100.1 | q500.1 | q1000.1 |
|---|---|---|---|---|---|---|
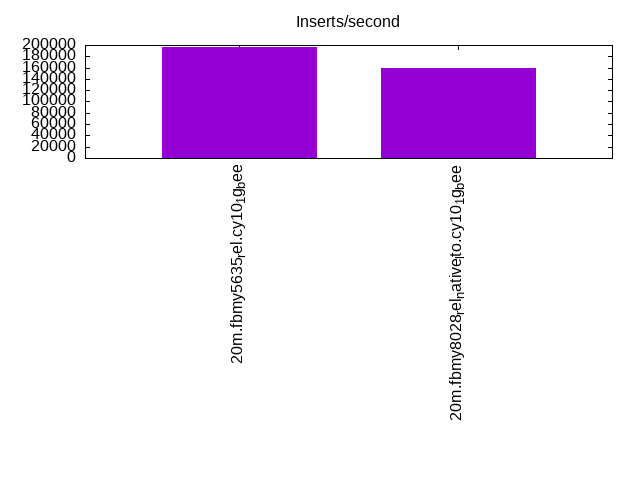
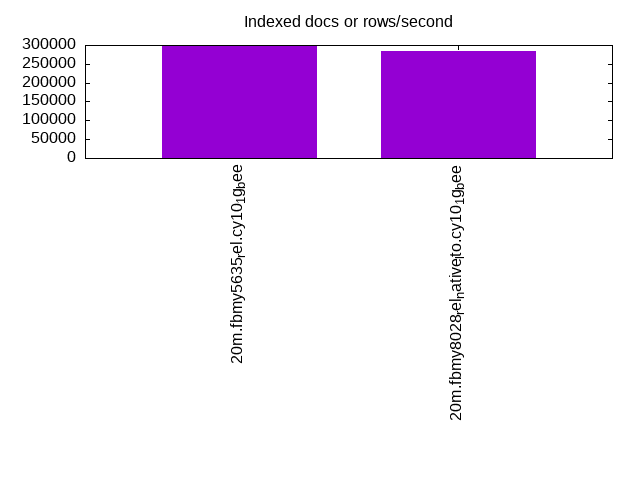
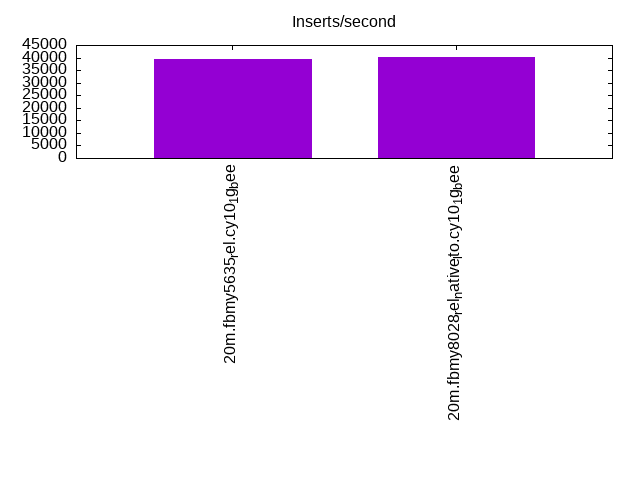
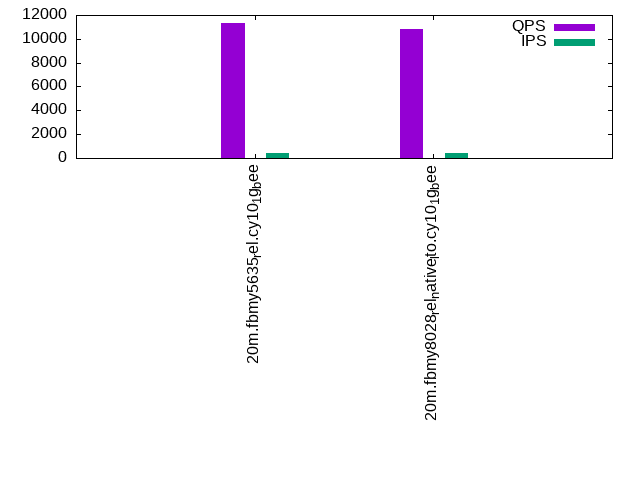
| 20m.fbmy5635_rel.cy10_1g_bee | 196078 | 300000 | 39544 | 11338 | 11080 | 11351 |
| 20m.fbmy8028_rel_native_lto.cy10_1g_bee | 160000 | 283098 | 40310 | 10808 | 10730 | 10346 |
This table has relative throughput, throughput for the DBMS relative to the DBMS in the first line, using the absolute throughput from the previous table.
| dbms | l.i0 | l.x | l.i1 | q100.1 | q500.1 | q1000.1 |
|---|---|---|---|---|---|---|
| 20m.fbmy5635_rel.cy10_1g_bee | 1.00 | 1.00 | 1.00 | 1.00 | 1.00 | 1.00 |
| 20m.fbmy8028_rel_native_lto.cy10_1g_bee | 0.82 | 0.94 | 1.02 | 0.95 | 0.97 | 0.91 |
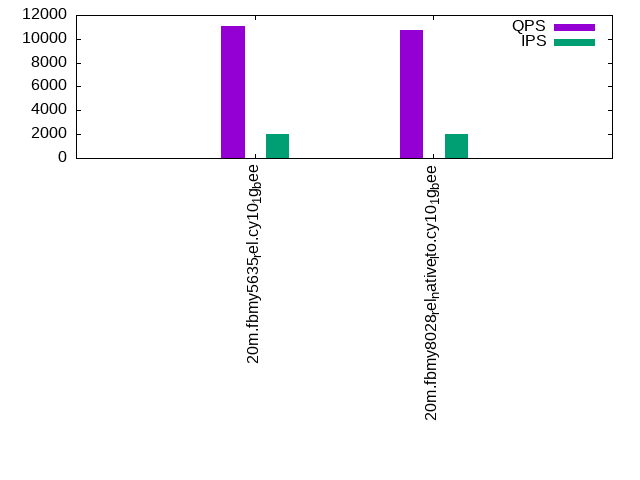
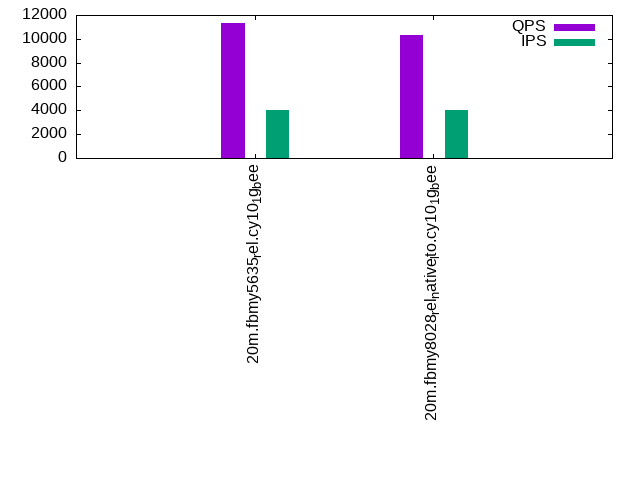
This lists the average rate of inserts/s for the tests that do inserts concurrent with queries. For such tests the query rate is listed in the table above. The read+write tests are setup so that the insert rate should match the target rate every second. Cells that are not at least 95% of the target have a red background to indicate a failure to satisfy the target.
| dbms | q100.1 | q500.1 | q1000.1 |
|---|---|---|---|
| fbmy5635_rel.cy10_1g_bee | 398 | 1993 | 3987 |
| fbmy8028_rel_native_lto.cy10_1g_bee | 398 | 1993 | 3989 |
| target | 400 | 2000 | 4000 |
l.i0
l.i0: load without secondary indexes. Graphs for performance per 1-second interval are here.
Average throughput:
Insert response time histogram: each cell has the percentage of responses that take <= the time in the header and max is the max response time in seconds. For the max column values in the top 25% of the range have a red background and in the bottom 25% of the range have a green background. The red background is not used when the min value is within 80% of the max value.
| dbms | 256us | 1ms | 4ms | 16ms | 64ms | 256ms | 1s | 4s | 16s | gt | max |
|---|---|---|---|---|---|---|---|---|---|---|---|
| fbmy5635_rel.cy10_1g_bee | 99.770 | 0.213 | 0.003 | 0.013 | 0.102 | ||||||
| fbmy8028_rel_native_lto.cy10_1g_bee | 99.319 | 0.487 | 0.182 | 0.013 | 0.115 |
Performance metrics for the DBMS listed above. Some are normalized by throughput, others are not. Legend for results is here.
ips	qps	rps	rmbps	wps	wmbps	rpq	rkbpq	wpi	wkbpi	csps	cpups	cspq	cpupq	dbgb1	dbgb2	rss	maxop	p50	p99	tag
196078	0	0	0.0	121.4	51.5	0.000	0.000	0.001	0.269	20184	71.3	0.103	29	0.9	2.0	0.4	0.102	55160	43153	20m.fbmy5635_rel.cy10_1g_bee
160000	0	0	0.0	111.6	44.3	0.000	0.000	0.001	0.284	16215	65.8	0.101	33	0.7	1.9	0.8	0.115	42853	6495	20m.fbmy8028_rel_native_lto.cy10_1g_bee
l.x
l.x: create secondary indexes.
Average throughput:
Performance metrics for the DBMS listed above. Some are normalized by throughput, others are not. Legend for results is here.
ips	qps	rps	rmbps	wps	wmbps	rpq	rkbpq	wpi	wkbpi	csps	cpups	cspq	cpupq	dbgb1	dbgb2	rss	maxop	p50	p99	tag
300000	0	1	0.0	131.9	55.9	0.000	0.000	0.000	0.191	583	47.1	0.002	13	1.4	2.4	1.6	0.003	NA	NA	20m.fbmy5635_rel.cy10_1g_bee
283098	0	1	0.0	114.8	47.4	0.000	0.000	0.000	0.171	761	45.6	0.003	13	1.4	2.7	2.2	0.013	NA	NA	20m.fbmy8028_rel_native_lto.cy10_1g_bee
l.i1
l.i1: continue load after secondary indexes created. Graphs for performance per 1-second interval are here.
Average throughput:
Insert response time histogram: each cell has the percentage of responses that take <= the time in the header and max is the max response time in seconds. For the max column values in the top 25% of the range have a red background and in the bottom 25% of the range have a green background. The red background is not used when the min value is within 80% of the max value.
| dbms | 256us | 1ms | 4ms | 16ms | 64ms | 256ms | 1s | 4s | 16s | gt | max |
|---|---|---|---|---|---|---|---|---|---|---|---|
| fbmy5635_rel.cy10_1g_bee | 21.635 | 78.332 | 0.028 | 0.005 | 0.117 | ||||||
| fbmy8028_rel_native_lto.cy10_1g_bee | 26.457 | 73.301 | 0.231 | 0.012 | 0.142 |
Delete response time histogram: each cell has the percentage of responses that take <= the time in the header and max is the max response time in seconds. For the max column values in the top 25% of the range have a red background and in the bottom 25% of the range have a green background. The red background is not used when the min value is within 80% of the max value.
| dbms | 256us | 1ms | 4ms | 16ms | 64ms | 256ms | 1s | 4s | 16s | gt | max |
|---|---|---|---|---|---|---|---|---|---|---|---|
| fbmy5635_rel.cy10_1g_bee | 20.864 | 79.101 | 0.030 | 0.005 | 0.162 | ||||||
| fbmy8028_rel_native_lto.cy10_1g_bee | 27.113 | 72.643 | 0.231 | 0.013 | 0.155 |
Performance metrics for the DBMS listed above. Some are normalized by throughput, others are not. Legend for results is here.
ips	qps	rps	rmbps	wps	wmbps	rpq	rkbpq	wpi	wkbpi	csps	cpups	cspq	cpupq	dbgb1	dbgb2	rss	maxop	p50	p99	tag
39544	0	14	0.7	143.7	58.2	0.000	0.018	0.004	1.506	18421	68.1	0.466	138	3.7	3.9	1.5	0.117	9939	8890	20m.fbmy5635_rel.cy10_1g_bee
40310	0	28	0.8	154.3	58.9	0.001	0.020	0.004	1.496	16538	72.1	0.410	143	5.3	5.8	1.9	0.142	10189	8940	20m.fbmy8028_rel_native_lto.cy10_1g_bee
q100.1
q100.1: range queries with 100 insert/s per client. Graphs for performance per 1-second interval are here.
Average throughput:
Query response time histogram: each cell has the percentage of responses that take <= the time in the header and max is the max response time in seconds. For max values in the top 25% of the range have a red background and in the bottom 25% of the range have a green background. The red background is not used when the min value is within 80% of the max value.
| dbms | 256us | 1ms | 4ms | 16ms | 64ms | 256ms | 1s | 4s | 16s | gt | max |
|---|---|---|---|---|---|---|---|---|---|---|---|
| fbmy5635_rel.cy10_1g_bee | 17.471 | 82.514 | 0.014 | nonzero | 0.011 | ||||||
| fbmy8028_rel_native_lto.cy10_1g_bee | 13.550 | 86.427 | 0.023 | 0.001 | nonzero | 0.018 |
Insert response time histogram: each cell has the percentage of responses that take <= the time in the header and max is the max response time in seconds. For max values in the top 25% of the range have a red background and in the bottom 25% of the range have a green background. The red background is not used when the min value is within 80% of the max value.
| dbms | 256us | 1ms | 4ms | 16ms | 64ms | 256ms | 1s | 4s | 16s | gt | max |
|---|---|---|---|---|---|---|---|---|---|---|---|
| fbmy5635_rel.cy10_1g_bee | 98.958 | 1.028 | 0.014 | 0.018 | |||||||
| fbmy8028_rel_native_lto.cy10_1g_bee | 98.549 | 1.361 | 0.090 | 0.029 |
Delete response time histogram: each cell has the percentage of responses that take <= the time in the header and max is the max response time in seconds. For max values in the top 25% of the range have a red background and in the bottom 25% of the range have a green background. The red background is not used when the min value is within 80% of the max value.
| dbms | 256us | 1ms | 4ms | 16ms | 64ms | 256ms | 1s | 4s | 16s | gt | max |
|---|---|---|---|---|---|---|---|---|---|---|---|
| fbmy5635_rel.cy10_1g_bee | 98.889 | 1.097 | 0.014 | 0.023 | |||||||
| fbmy8028_rel_native_lto.cy10_1g_bee | 98.667 | 1.236 | 0.097 | 0.033 |
Performance metrics for the DBMS listed above. Some are normalized by throughput, others are not. Legend for results is here.
ips	qps	rps	rmbps	wps	wmbps	rpq	rkbpq	wpi	wkbpi	csps	cpups	cspq	cpupq	dbgb1	dbgb2	rss	maxop	p50	p99	tag
398	11338	2	0.2	7.6	1.7	0.000	0.019	0.019	4.444	42819	50.3	3.777	355	1.6	2.0	1.5	0.011	2797	2399	20m.fbmy5635_rel.cy10_1g_bee
398	10808	2	0.3	8.2	1.7	0.000	0.026	0.021	4.506	41042	50.9	3.798	377	1.6	2.2	1.8	0.018	2717	2206	20m.fbmy8028_rel_native_lto.cy10_1g_bee
q500.1
q500.1: range queries with 500 insert/s per client. Graphs for performance per 1-second interval are here.
Average throughput:
Query response time histogram: each cell has the percentage of responses that take <= the time in the header and max is the max response time in seconds. For max values in the top 25% of the range have a red background and in the bottom 25% of the range have a green background. The red background is not used when the min value is within 80% of the max value.
| dbms | 256us | 1ms | 4ms | 16ms | 64ms | 256ms | 1s | 4s | 16s | gt | max |
|---|---|---|---|---|---|---|---|---|---|---|---|
| fbmy5635_rel.cy10_1g_bee | 14.731 | 85.207 | 0.058 | 0.004 | nonzero | 0.017 | |||||
| fbmy8028_rel_native_lto.cy10_1g_bee | 10.695 | 89.207 | 0.091 | 0.008 | nonzero | 0.028 |
Insert response time histogram: each cell has the percentage of responses that take <= the time in the header and max is the max response time in seconds. For max values in the top 25% of the range have a red background and in the bottom 25% of the range have a green background. The red background is not used when the min value is within 80% of the max value.
| dbms | 256us | 1ms | 4ms | 16ms | 64ms | 256ms | 1s | 4s | 16s | gt | max |
|---|---|---|---|---|---|---|---|---|---|---|---|
| fbmy5635_rel.cy10_1g_bee | 91.464 | 8.506 | 0.031 | 0.051 | |||||||
| fbmy8028_rel_native_lto.cy10_1g_bee | 79.024 | 20.767 | 0.208 | 0.001 | 0.070 |
Delete response time histogram: each cell has the percentage of responses that take <= the time in the header and max is the max response time in seconds. For max values in the top 25% of the range have a red background and in the bottom 25% of the range have a green background. The red background is not used when the min value is within 80% of the max value.
| dbms | 256us | 1ms | 4ms | 16ms | 64ms | 256ms | 1s | 4s | 16s | gt | max |
|---|---|---|---|---|---|---|---|---|---|---|---|
| fbmy5635_rel.cy10_1g_bee | 92.763 | 7.200 | 0.037 | 0.056 | |||||||
| fbmy8028_rel_native_lto.cy10_1g_bee | 82.014 | 17.786 | 0.200 | 0.063 |
Performance metrics for the DBMS listed above. Some are normalized by throughput, others are not. Legend for results is here.
ips	qps	rps	rmbps	wps	wmbps	rpq	rkbpq	wpi	wkbpi	csps	cpups	cspq	cpupq	dbgb1	dbgb2	rss	maxop	p50	p99	tag
1993	11080	0	0.0	11.7	3.7	0.000	0.000	0.006	1.896	41197	52.1	3.718	376	1.6	2.8	1.5	0.017	2750	2429	20m.fbmy5635_rel.cy10_1g_bee
1993	10730	0	0.0	12.6	3.7	0.000	0.000	0.006	1.905	40170	52.7	3.744	393	1.6	3.0	1.9	0.028	2702	2254	20m.fbmy8028_rel_native_lto.cy10_1g_bee
q1000.1
q1000.1: range queries with 1000 insert/s per client. Graphs for performance per 1-second interval are here.
Average throughput:
Query response time histogram: each cell has the percentage of responses that take <= the time in the header and max is the max response time in seconds. For max values in the top 25% of the range have a red background and in the bottom 25% of the range have a green background. The red background is not used when the min value is within 80% of the max value.
| dbms | 256us | 1ms | 4ms | 16ms | 64ms | 256ms | 1s | 4s | 16s | gt | max |
|---|---|---|---|---|---|---|---|---|---|---|---|
| fbmy5635_rel.cy10_1g_bee | 15.602 | 84.254 | 0.138 | 0.007 | nonzero | 0.030 | |||||
| fbmy8028_rel_native_lto.cy10_1g_bee | 6.980 | 92.748 | 0.256 | 0.016 | nonzero | 0.023 |
Insert response time histogram: each cell has the percentage of responses that take <= the time in the header and max is the max response time in seconds. For max values in the top 25% of the range have a red background and in the bottom 25% of the range have a green background. The red background is not used when the min value is within 80% of the max value.
| dbms | 256us | 1ms | 4ms | 16ms | 64ms | 256ms | 1s | 4s | 16s | gt | max |
|---|---|---|---|---|---|---|---|---|---|---|---|
| fbmy5635_rel.cy10_1g_bee | 93.183 | 6.799 | 0.018 | 0.052 | |||||||
| fbmy8028_rel_native_lto.cy10_1g_bee | 59.524 | 40.065 | 0.410 | 0.001 | 0.072 |
Delete response time histogram: each cell has the percentage of responses that take <= the time in the header and max is the max response time in seconds. For max values in the top 25% of the range have a red background and in the bottom 25% of the range have a green background. The red background is not used when the min value is within 80% of the max value.
| dbms | 256us | 1ms | 4ms | 16ms | 64ms | 256ms | 1s | 4s | 16s | gt | max |
|---|---|---|---|---|---|---|---|---|---|---|---|
| fbmy5635_rel.cy10_1g_bee | 93.751 | 6.226 | 0.023 | 0.053 | |||||||
| fbmy8028_rel_native_lto.cy10_1g_bee | 63.201 | 36.403 | 0.393 | 0.002 | 0.069 |
Performance metrics for the DBMS listed above. Some are normalized by throughput, others are not. Legend for results is here.
ips	qps	rps	rmbps	wps	wmbps	rpq	rkbpq	wpi	wkbpi	csps	cpups	cspq	cpupq	dbgb1	dbgb2	rss	maxop	p50	p99	tag
3987	11351	0	0.0	21.4	7.5	0.000	0.000	0.005	1.930	41198	55.2	3.629	389	1.7	2.4	1.5	0.030	2829	2493	20m.fbmy5635_rel.cy10_1g_bee
3989	10346	0	0.0	22.5	7.5	0.000	0.000	0.006	1.934	37893	55.7	3.662	431	1.7	2.6	1.9	0.023	2605	2175	20m.fbmy8028_rel_native_lto.cy10_1g_bee
l.i0
l.i0: load without secondary indexes
Performance metrics for all DBMS, not just the ones listed above. Some are normalized by throughput, others are not. Legend for results is here.
ips	qps	rps	rmbps	wps	wmbps	rpq	rkbpq	wpi	wkbpi	csps	cpups	cspq	cpupq	dbgb1	dbgb2	rss	maxop	p50	p99	tag
196078	0	0	0.0	121.4	51.5	0.000	0.000	0.001	0.269	20184	71.3	0.103	29	0.9	2.0	0.4	0.102	55160	43153	20m.fbmy5635_rel.cy10_1g_bee
160000	0	0	0.0	111.6	44.3	0.000	0.000	0.001	0.284	16215	65.8	0.101	33	0.7	1.9	0.8	0.115	42853	6495	20m.fbmy8028_rel_native_lto.cy10_1g_bee
l.x
l.x: create secondary indexes
Performance metrics for all DBMS, not just the ones listed above. Some are normalized by throughput, others are not. Legend for results is here.
ips	qps	rps	rmbps	wps	wmbps	rpq	rkbpq	wpi	wkbpi	csps	cpups	cspq	cpupq	dbgb1	dbgb2	rss	maxop	p50	p99	tag
300000	0	1	0.0	131.9	55.9	0.000	0.000	0.000	0.191	583	47.1	0.002	13	1.4	2.4	1.6	0.003	NA	NA	20m.fbmy5635_rel.cy10_1g_bee
283098	0	1	0.0	114.8	47.4	0.000	0.000	0.000	0.171	761	45.6	0.003	13	1.4	2.7	2.2	0.013	NA	NA	20m.fbmy8028_rel_native_lto.cy10_1g_bee
l.i1
l.i1: continue load after secondary indexes created
Performance metrics for all DBMS, not just the ones listed above. Some are normalized by throughput, others are not. Legend for results is here.
ips	qps	rps	rmbps	wps	wmbps	rpq	rkbpq	wpi	wkbpi	csps	cpups	cspq	cpupq	dbgb1	dbgb2	rss	maxop	p50	p99	tag
39544	0	14	0.7	143.7	58.2	0.000	0.018	0.004	1.506	18421	68.1	0.466	138	3.7	3.9	1.5	0.117	9939	8890	20m.fbmy5635_rel.cy10_1g_bee
40310	0	28	0.8	154.3	58.9	0.001	0.020	0.004	1.496	16538	72.1	0.410	143	5.3	5.8	1.9	0.142	10189	8940	20m.fbmy8028_rel_native_lto.cy10_1g_bee
q100.1
q100.1: range queries with 100 insert/s per client
Performance metrics for all DBMS, not just the ones listed above. Some are normalized by throughput, others are not. Legend for results is here.
ips	qps	rps	rmbps	wps	wmbps	rpq	rkbpq	wpi	wkbpi	csps	cpups	cspq	cpupq	dbgb1	dbgb2	rss	maxop	p50	p99	tag
398	11338	2	0.2	7.6	1.7	0.000	0.019	0.019	4.444	42819	50.3	3.777	355	1.6	2.0	1.5	0.011	2797	2399	20m.fbmy5635_rel.cy10_1g_bee
398	10808	2	0.3	8.2	1.7	0.000	0.026	0.021	4.506	41042	50.9	3.798	377	1.6	2.2	1.8	0.018	2717	2206	20m.fbmy8028_rel_native_lto.cy10_1g_bee
q500.1
q500.1: range queries with 500 insert/s per client
Performance metrics for all DBMS, not just the ones listed above. Some are normalized by throughput, others are not. Legend for results is here.
ips	qps	rps	rmbps	wps	wmbps	rpq	rkbpq	wpi	wkbpi	csps	cpups	cspq	cpupq	dbgb1	dbgb2	rss	maxop	p50	p99	tag
1993	11080	0	0.0	11.7	3.7	0.000	0.000	0.006	1.896	41197	52.1	3.718	376	1.6	2.8	1.5	0.017	2750	2429	20m.fbmy5635_rel.cy10_1g_bee
1993	10730	0	0.0	12.6	3.7	0.000	0.000	0.006	1.905	40170	52.7	3.744	393	1.6	3.0	1.9	0.028	2702	2254	20m.fbmy8028_rel_native_lto.cy10_1g_bee
q1000.1
q1000.1: range queries with 1000 insert/s per client
Performance metrics for all DBMS, not just the ones listed above. Some are normalized by throughput, others are not. Legend for results is here.
ips	qps	rps	rmbps	wps	wmbps	rpq	rkbpq	wpi	wkbpi	csps	cpups	cspq	cpupq	dbgb1	dbgb2	rss	maxop	p50	p99	tag
3987	11351	0	0.0	21.4	7.5	0.000	0.000	0.005	1.930	41198	55.2	3.629	389	1.7	2.4	1.5	0.030	2829	2493	20m.fbmy5635_rel.cy10_1g_bee
3989	10346	0	0.0	22.5	7.5	0.000	0.000	0.006	1.934	37893	55.7	3.662	431	1.7	2.6	1.9	0.023	2605	2175	20m.fbmy8028_rel_native_lto.cy10_1g_bee
l.i0
- l.i0: load without secondary indexes
- Legend for results is here.
- Each entry lists the percentage of responses that fit in that bucket (slower than max time for previous bucket, faster than min time for next bucket).
Insert response time histogram
256us	1ms	4ms	16ms	64ms	256ms	1s	4s	16s	gt	max	tag
0.000	0.000	99.770	0.213	0.003	0.013	0.000	0.000	0.000	0.000	0.102	fbmy5635_rel.cy10_1g_bee
0.000	0.000	99.319	0.487	0.182	0.013	0.000	0.000	0.000	0.000	0.115	fbmy8028_rel_native_lto.cy10_1g_bee
l.x
- l.x: create secondary indexes
- Legend for results is here.
- Each entry lists the percentage of responses that fit in that bucket (slower than max time for previous bucket, faster than min time for next bucket).
TODO - determine whether there is data for create index response time
l.i1
- l.i1: continue load after secondary indexes created
- Legend for results is here.
- Each entry lists the percentage of responses that fit in that bucket (slower than max time for previous bucket, faster than min time for next bucket).
Insert response time histogram
256us	1ms	4ms	16ms	64ms	256ms	1s	4s	16s	gt	max	tag
0.000	0.000	21.635	78.332	0.028	0.005	0.000	0.000	0.000	0.000	0.117	fbmy5635_rel.cy10_1g_bee
0.000	0.000	26.457	73.301	0.231	0.012	0.000	0.000	0.000	0.000	0.142	fbmy8028_rel_native_lto.cy10_1g_bee
Delete response time histogram
256us	1ms	4ms	16ms	64ms	256ms	1s	4s	16s	gt	max	tag
0.000	0.000	20.864	79.101	0.030	0.005	0.000	0.000	0.000	0.000	0.162	fbmy5635_rel.cy10_1g_bee
0.000	0.000	27.113	72.643	0.231	0.013	0.000	0.000	0.000	0.000	0.155	fbmy8028_rel_native_lto.cy10_1g_bee
q100.1
- q100.1: range queries with 100 insert/s per client
- Legend for results is here.
- Each entry lists the percentage of responses that fit in that bucket (slower than max time for previous bucket, faster than min time for next bucket).
Query response time histogram
256us	1ms	4ms	16ms	64ms	256ms	1s	4s	16s	gt	max	tag
17.471	82.514	0.014	nonzero	0.000	0.000	0.000	0.000	0.000	0.000	0.011	fbmy5635_rel.cy10_1g_bee
13.550	86.427	0.023	0.001	nonzero	0.000	0.000	0.000	0.000	0.000	0.018	fbmy8028_rel_native_lto.cy10_1g_bee
Insert response time histogram
256us	1ms	4ms	16ms	64ms	256ms	1s	4s	16s	gt	max	tag
0.000	0.000	98.958	1.028	0.014	0.000	0.000	0.000	0.000	0.000	0.018	fbmy5635_rel.cy10_1g_bee
0.000	0.000	98.549	1.361	0.090	0.000	0.000	0.000	0.000	0.000	0.029	fbmy8028_rel_native_lto.cy10_1g_bee
Delete response time histogram
256us	1ms	4ms	16ms	64ms	256ms	1s	4s	16s	gt	max	tag
0.000	0.000	98.889	1.097	0.014	0.000	0.000	0.000	0.000	0.000	0.023	fbmy5635_rel.cy10_1g_bee
0.000	0.000	98.667	1.236	0.097	0.000	0.000	0.000	0.000	0.000	0.033	fbmy8028_rel_native_lto.cy10_1g_bee
q500.1
- q500.1: range queries with 500 insert/s per client
- Legend for results is here.
- Each entry lists the percentage of responses that fit in that bucket (slower than max time for previous bucket, faster than min time for next bucket).
Query response time histogram
256us	1ms	4ms	16ms	64ms	256ms	1s	4s	16s	gt	max	tag
14.731	85.207	0.058	0.004	nonzero	0.000	0.000	0.000	0.000	0.000	0.017	fbmy5635_rel.cy10_1g_bee
10.695	89.207	0.091	0.008	nonzero	0.000	0.000	0.000	0.000	0.000	0.028	fbmy8028_rel_native_lto.cy10_1g_bee
Insert response time histogram
256us	1ms	4ms	16ms	64ms	256ms	1s	4s	16s	gt	max	tag
0.000	0.000	91.464	8.506	0.031	0.000	0.000	0.000	0.000	0.000	0.051	fbmy5635_rel.cy10_1g_bee
0.000	0.000	79.024	20.767	0.208	0.001	0.000	0.000	0.000	0.000	0.070	fbmy8028_rel_native_lto.cy10_1g_bee
Delete response time histogram
256us	1ms	4ms	16ms	64ms	256ms	1s	4s	16s	gt	max	tag
0.000	0.000	92.763	7.200	0.037	0.000	0.000	0.000	0.000	0.000	0.056	fbmy5635_rel.cy10_1g_bee
0.000	0.000	82.014	17.786	0.200	0.000	0.000	0.000	0.000	0.000	0.063	fbmy8028_rel_native_lto.cy10_1g_bee
q1000.1
- q1000.1: range queries with 1000 insert/s per client
- Legend for results is here.
- Each entry lists the percentage of responses that fit in that bucket (slower than max time for previous bucket, faster than min time for next bucket).
Query response time histogram
256us	1ms	4ms	16ms	64ms	256ms	1s	4s	16s	gt	max	tag
15.602	84.254	0.138	0.007	nonzero	0.000	0.000	0.000	0.000	0.000	0.030	fbmy5635_rel.cy10_1g_bee
6.980	92.748	0.256	0.016	nonzero	0.000	0.000	0.000	0.000	0.000	0.023	fbmy8028_rel_native_lto.cy10_1g_bee
Insert response time histogram
256us	1ms	4ms	16ms	64ms	256ms	1s	4s	16s	gt	max	tag
0.000	0.000	93.183	6.799	0.018	0.000	0.000	0.000	0.000	0.000	0.052	fbmy5635_rel.cy10_1g_bee
0.000	0.000	59.524	40.065	0.410	0.001	0.000	0.000	0.000	0.000	0.072	fbmy8028_rel_native_lto.cy10_1g_bee
Delete response time histogram
256us	1ms	4ms	16ms	64ms	256ms	1s	4s	16s	gt	max	tag
0.000	0.000	93.751	6.226	0.023	0.000	0.000	0.000	0.000	0.000	0.053	fbmy5635_rel.cy10_1g_bee
0.000	0.000	63.201	36.403	0.393	0.002	0.000	0.000	0.000	0.000	0.069	fbmy8028_rel_native_lto.cy10_1g_bee