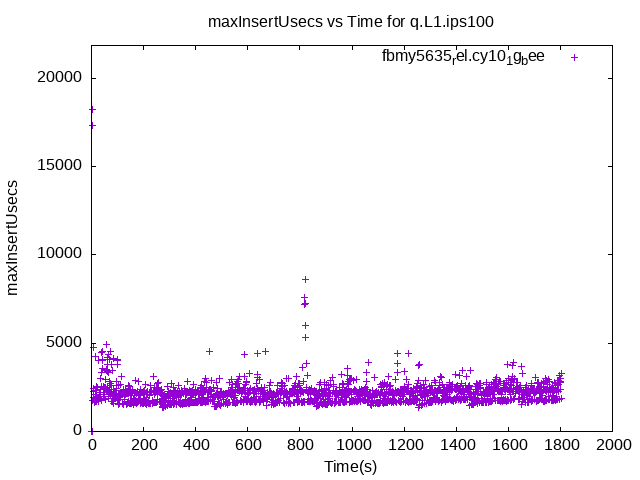
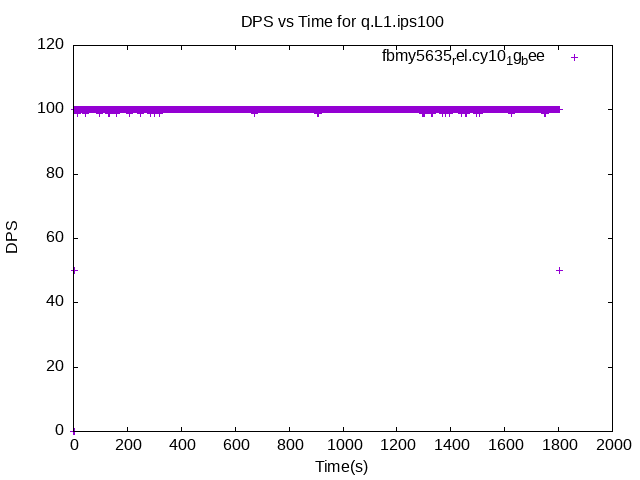
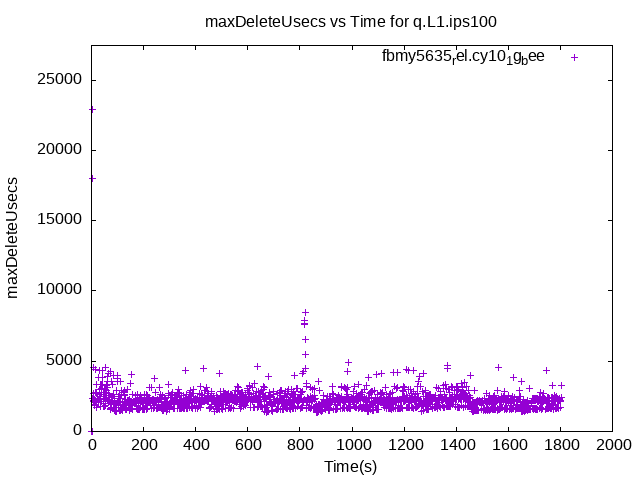
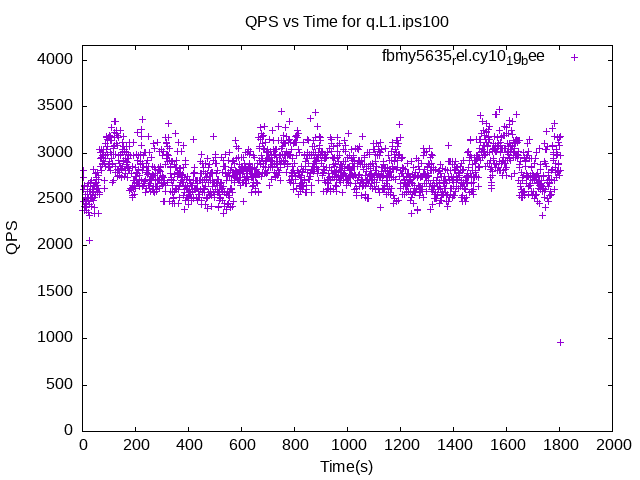
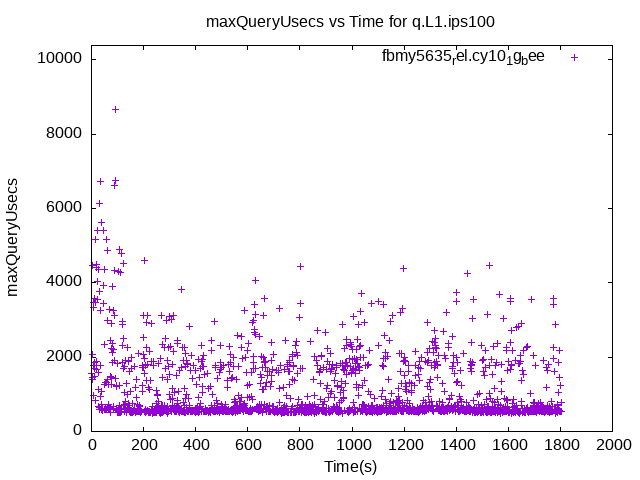
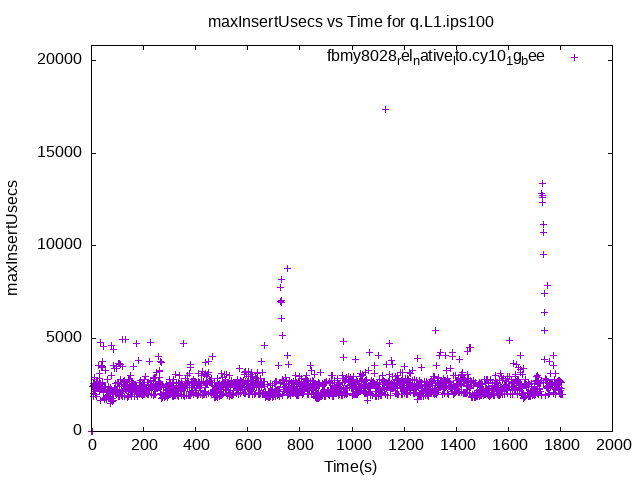
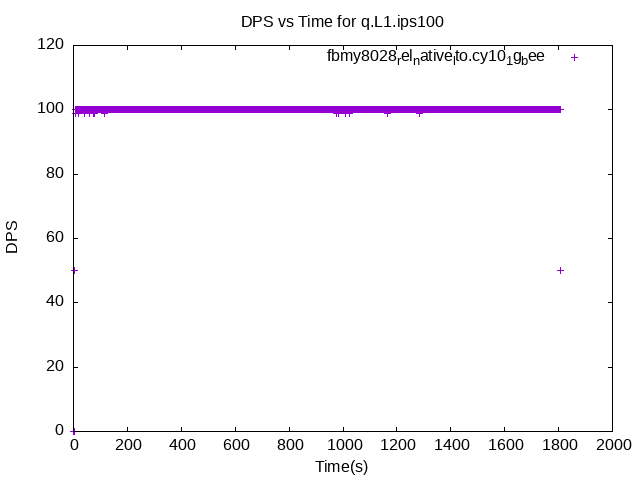
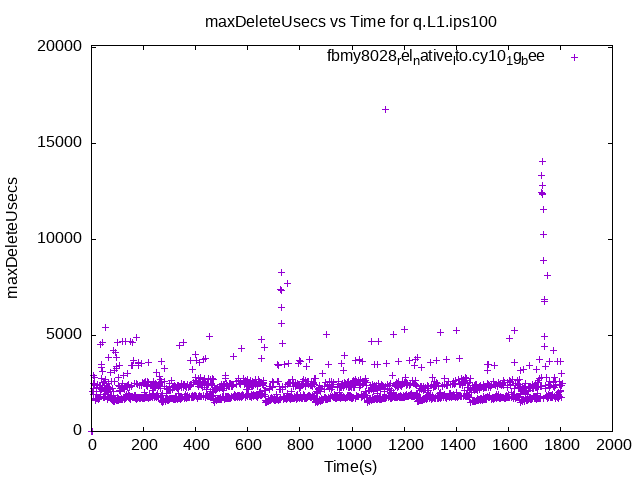
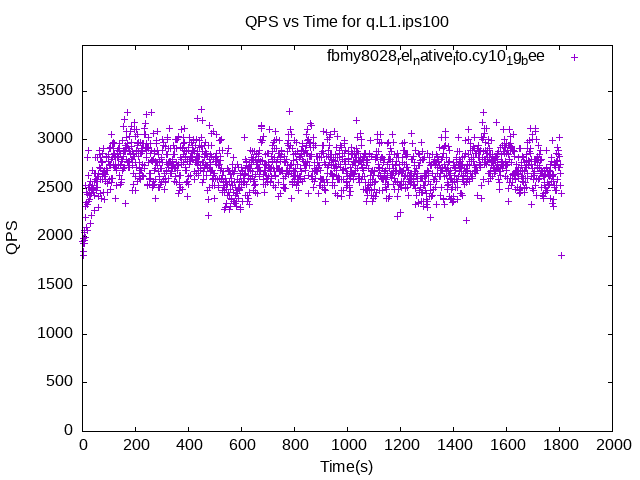
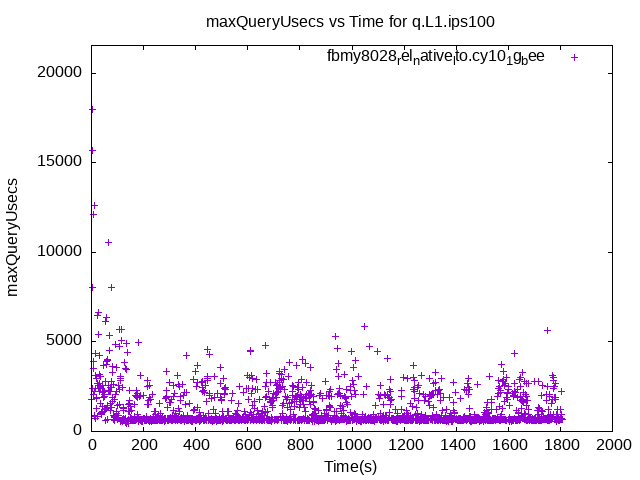
These have results per 1-second interval for: insert rate (IPS), max insert reponse time, delete rate (DPS), max delete response time, query rate (QPS) and max query response time. The results are from 1 client while the test may have N clients where N > 1. Deletes might not have been enabled for this benchmark step, in which case those graphs will show zero values. The test is run with a rate limit for the number of inserts/s. In some cases the DBMS is unable to sustain that rate. When a DBMS can sustain that rate IPS will be a horizontal line.
 fbmy5635_rel.cy10_1g_bee
 fbmy5635_rel.cy10_1g_bee
 fbmy5635_rel.cy10_1g_bee
 fbmy5635_rel.cy10_1g_bee
 fbmy5635_rel.cy10_1g_bee
 fbmy5635_rel.cy10_1g_bee
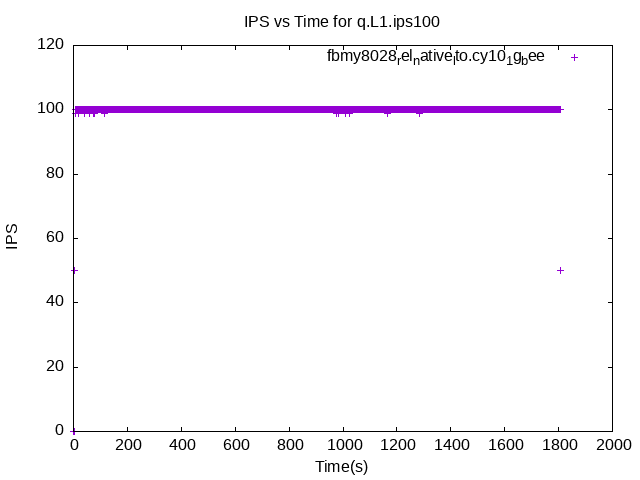 fbmy8028_rel_native_lto.cy10_1g_bee
 fbmy8028_rel_native_lto.cy10_1g_bee
 fbmy8028_rel_native_lto.cy10_1g_bee
 fbmy8028_rel_native_lto.cy10_1g_bee
 fbmy8028_rel_native_lto.cy10_1g_bee
 fbmy8028_rel_native_lto.cy10_1g_bee