Introduction
This is a report for the insert benchmark with 4000M docs and 20 client(s). It is generated by scripts (bash, awk, sed) and Tufte might not be impressed. An overview of the insert benchmark is here and a short update is here. Below, by DBMS, I mean DBMS+version.config. An example is my8020.c10b40 where my means MySQL, 8020 is version 8.0.20 and c10b40 is the name for the configuration file.
The test server has 48 AMD cores, 128G RAM and RAID 10 with 2 NVMe devices. It is described here. The benchmark was run with 20 clients and there were 1 or 3 connections per client (1 for queries or inserts without rate limits, 1+1 for rate limited inserts+deletes). It uses 1 table with a table per client. It loads 200M rows per table without secondary indexes, creates 3 secondary indexes per table, then inserts 4m+1m rows per table with a delete per insert to avoid growing the table. It then does 6 read+write tests for 3600s each that do queries as fast as possible with 100,100,500,500,1000,1000 inserts/s and the same for deletes/s per client concurrent with the queries. The database is larger than memory. Clients and the DBMS share one server. The per-database configs are in the per-database subdirectories here.
The tested DBMS are:
- ma100623_rel_withdbg.cz12a_c32r128 - MariaDB 10.6.23 with the cz12a_c32r128 config
- ma101114_rel_withdbg.cz12a_c32r128 - MariaDB 10.11.14 with the cz12a_c32r128 config
- ma110408_rel_withdbg.cz12b_c32r128 - MariaDB 11.4.8 with the cz12a_c32r128 config
- ma110803_rel_withdbg.cz12b_c32r128 - MariaDB 11.8.3 with the cz12a_c32r128 config
- ma120101_rel_withdbg.cz12b_c32r128 - MariaDB 12.1.1 with the cz12a_c32r128 config
- ma120101_mdev16168_rel_withdbg.cz12b_c32r128 - MariaDB 12.1.1 with a patch for mdev16168 with the cz12a_c32r128 config
Contents
- Summary
- l.i0: load without secondary indexes
- l.x: create secondary indexes
- l.i1: continue load after secondary indexes created with 50 inserts per transaction
- l.i2: continue load after secondary indexes created with 5 inserts per transaction
- qr100.L1: range queries with 100 insert/s per client
- qp100.L2: point queries with 100 insert/s per client
- qr500.L3: range queries with 500 insert/s per client
- qp500.L4: point queries with 500 insert/s per client
- qr1000.L5: range queries with 1000 insert/s per client
- qp1000.L6: point queries with 1000 insert/s per client
Summary
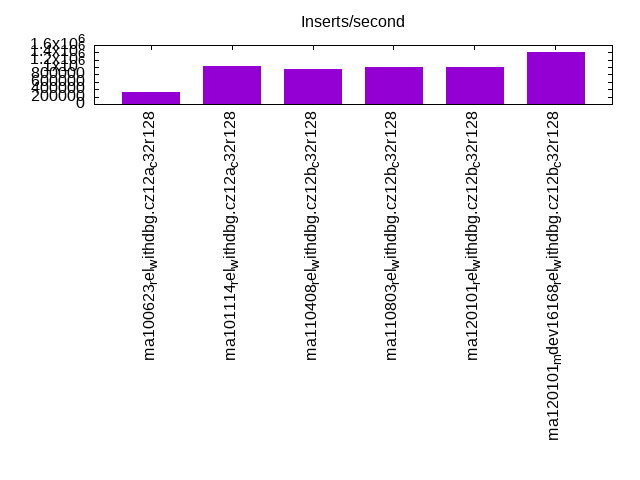
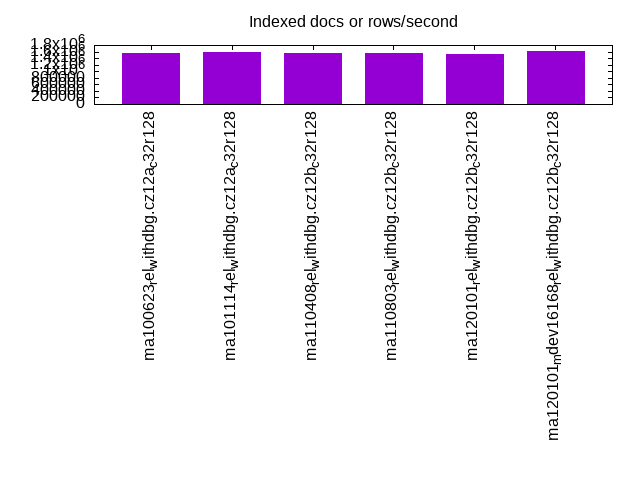
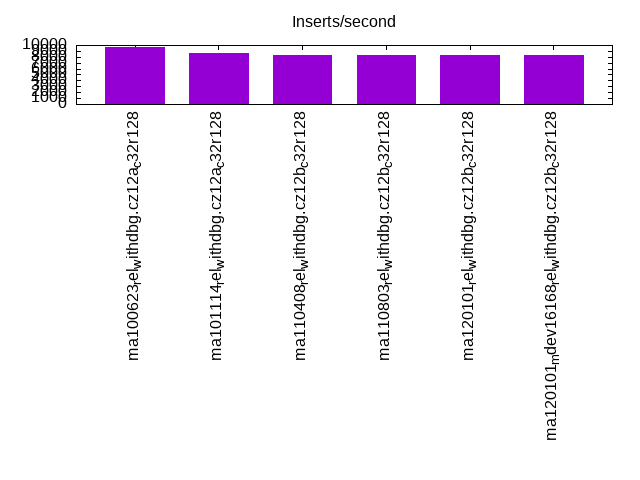
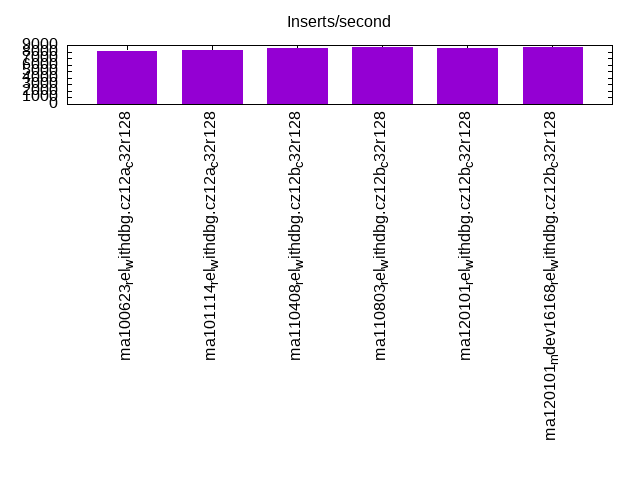
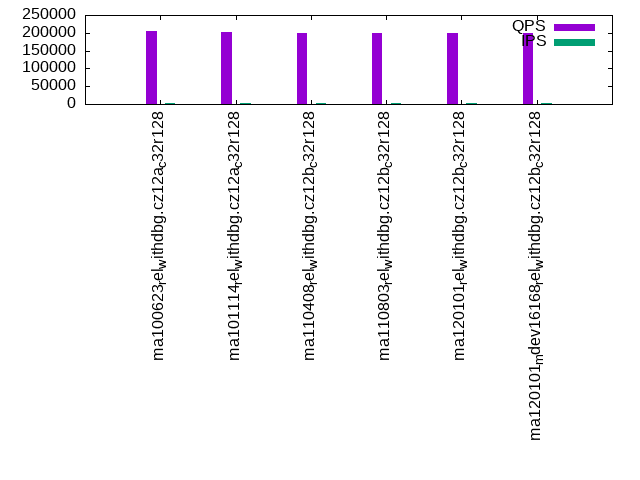
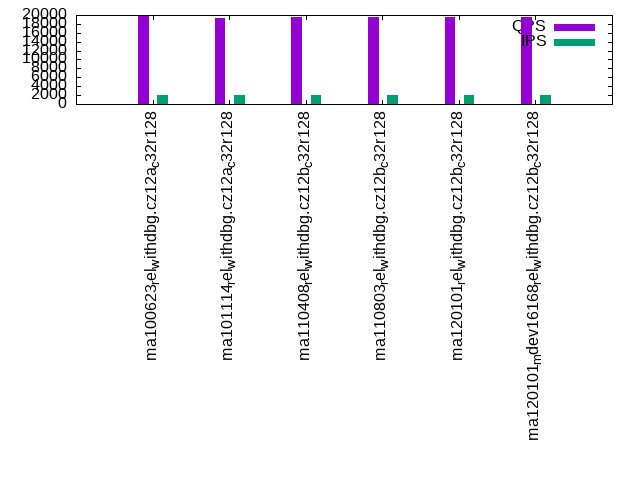
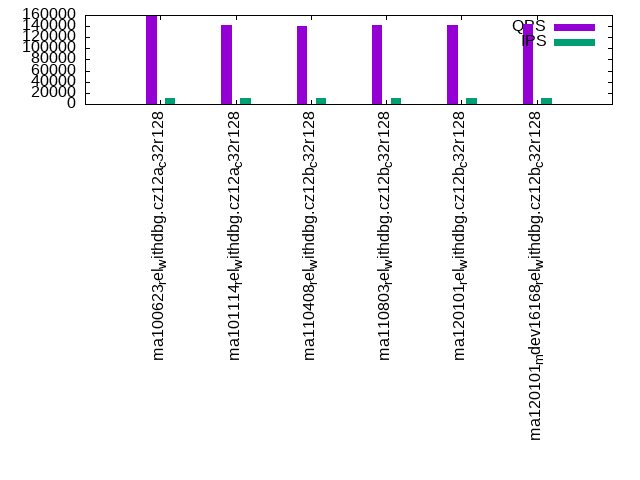
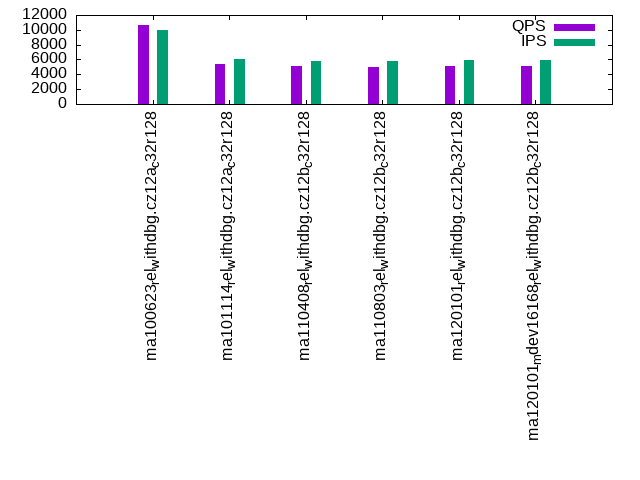
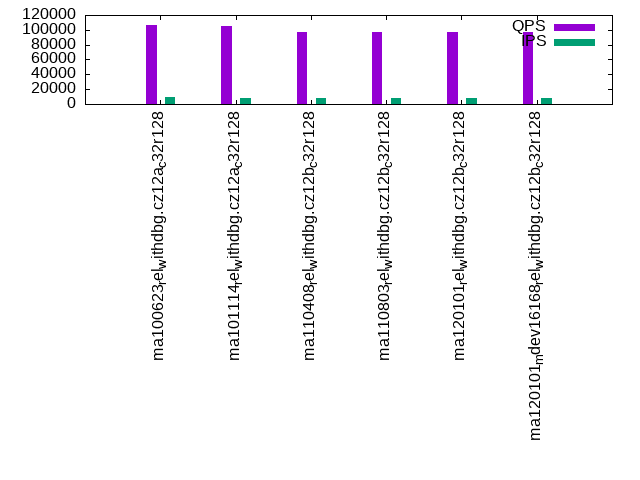
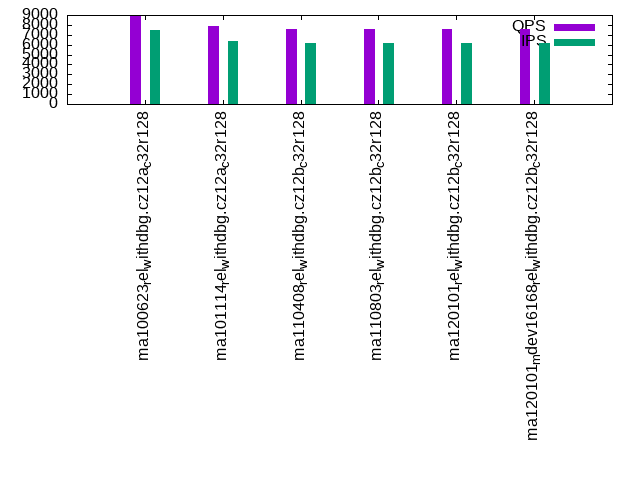
The numbers are inserts/s for l.i0, l.i1 and l.i2, indexed docs (or rows) /s for l.x and queries/s for qr100, qp100 thru qr1000, qp1000" The values are the average rate over the entire test for inserts (IPS) and queries (QPS). The range of values for IPS and QPS is split into 3 parts: bottom 25%, middle 50%, top 25%. Values in the bottom 25% have a red background, values in the top 25% have a green background and values in the middle have no color. A gray background is used for values that can be ignored because the DBMS did not sustain the target insert rate. Red backgrounds are not used when the minimum value is within 80% of the max value.
| dbms | l.i0 | l.x | l.i1 | l.i2 | qr100 | qp100 | qr500 | qp500 | qr1000 | qp1000 |
|---|---|---|---|---|---|---|---|---|---|---|
| ma100623_rel_withdbg.cz12a_c32r128 | 322035 | 1564945 | 9715 | 8140 | 203898 | 19970 | 158867 | 10599 | 106458 | 8999 |
| ma101114_rel_withdbg.cz12a_c32r128 | 1027221 | 1584786 | 8619 | 8217 | 203291 | 19394 | 141520 | 5444 | 105688 | 7854 |
| ma110408_rel_withdbg.cz12b_c32r128 | 957625 | 1546192 | 8270 | 8580 | 200829 | 19472 | 139982 | 5121 | 96466 | 7586 |
| ma110803_rel_withdbg.cz12b_c32r128 | 1013171 | 1565558 | 8265 | 8643 | 200466 | 19575 | 141339 | 5051 | 97069 | 7545 |
| ma120101_rel_withdbg.cz12b_c32r128 | 1004268 | 1537279 | 8305 | 8602 | 199066 | 19507 | 142687 | 5152 | 97256 | 7599 |
| ma120101_mdev16168_rel_withdbg.cz12b_c32r128 | 1410935 | 1615509 | 8336 | 8688 | 198713 | 19587 | 142998 | 5159 | 97423 | 7592 |
This table has relative throughput, throughput for the DBMS relative to the DBMS in the first line, using the absolute throughput from the previous table. Values less than 0.95 have a yellow background. Values greater than 1.05 have a blue background.
| dbms | l.i0 | l.x | l.i1 | l.i2 | qr100 | qp100 | qr500 | qp500 | qr1000 | qp1000 |
|---|---|---|---|---|---|---|---|---|---|---|
| ma100623_rel_withdbg.cz12a_c32r128 | 1.00 | 1.00 | 1.00 | 1.00 | 1.00 | 1.00 | 1.00 | 1.00 | 1.00 | 1.00 |
| ma101114_rel_withdbg.cz12a_c32r128 | 3.19 | 1.01 | 0.89 | 1.01 | 1.00 | 0.97 | 0.89 | 0.51 | 0.99 | 0.87 |
| ma110408_rel_withdbg.cz12b_c32r128 | 2.97 | 0.99 | 0.85 | 1.05 | 0.98 | 0.98 | 0.88 | 0.48 | 0.91 | 0.84 |
| ma110803_rel_withdbg.cz12b_c32r128 | 3.15 | 1.00 | 0.85 | 1.06 | 0.98 | 0.98 | 0.89 | 0.48 | 0.91 | 0.84 |
| ma120101_rel_withdbg.cz12b_c32r128 | 3.12 | 0.98 | 0.85 | 1.06 | 0.98 | 0.98 | 0.90 | 0.49 | 0.91 | 0.84 |
| ma120101_mdev16168_rel_withdbg.cz12b_c32r128 | 4.38 | 1.03 | 0.86 | 1.07 | 0.97 | 0.98 | 0.90 | 0.49 | 0.92 | 0.84 |
This lists the average rate of inserts/s for the tests that do inserts concurrent with queries. For such tests the query rate is listed in the table above. The read+write tests are setup so that the insert rate should match the target rate every second. Cells that are not at least 95% of the target have a red background to indicate a failure to satisfy the target.
| dbms | qr100.L1 | qp100.L2 | qr500.L3 | qp500.L4 | qr1000.L5 | qp1000.L6 |
|---|---|---|---|---|---|---|
| ma100623_rel_withdbg.cz12a_c32r128 | 1987 | 1987 | 9936 | 9920 | 9779 | 7499 |
| ma101114_rel_withdbg.cz12a_c32r128 | 1988 | 1988 | 9939 | 6027 | 7631 | 6350 |
| ma110408_rel_withdbg.cz12b_c32r128 | 1987 | 1987 | 9934 | 5840 | 7646 | 6163 |
| ma110803_rel_withdbg.cz12b_c32r128 | 1987 | 1987 | 9934 | 5747 | 7592 | 6138 |
| ma120101_rel_withdbg.cz12b_c32r128 | 1987 | 1987 | 9936 | 5912 | 7663 | 6205 |
| ma120101_mdev16168_rel_withdbg.cz12b_c32r128 | 1987 | 1987 | 9934 | 5912 | 7711 | 6214 |
| target | 2000 | 2000 | 10000 | 10000 | 20000 | 20000 |
l.i0
l.i0: load without secondary indexes. Graphs for performance per 1-second interval are here.
Average throughput:
Insert response time histogram: each cell has the percentage of responses that take <= the time in the header and max is the max response time in seconds. For the max column values in the top 25% of the range have a red background and in the bottom 25% of the range have a green background. The red background is not used when the min value is within 80% of the max value.
| dbms | 256us | 1ms | 4ms | 16ms | 64ms | 256ms | 1s | 4s | 16s | gt | max |
|---|---|---|---|---|---|---|---|---|---|---|---|
| ma100623_rel_withdbg.cz12a_c32r128 | 0.076 | 0.478 | 97.042 | 2.318 | 0.085 | nonzero | 0.550 | ||||
| ma101114_rel_withdbg.cz12a_c32r128 | 0.757 | 98.321 | 0.665 | 0.163 | 0.090 | 0.003 | 0.648 | ||||
| ma110408_rel_withdbg.cz12b_c32r128 | 0.669 | 97.871 | 1.200 | 0.169 | 0.088 | 0.003 | 0.693 | ||||
| ma110803_rel_withdbg.cz12b_c32r128 | 0.577 | 98.501 | 0.662 | 0.171 | 0.088 | 0.001 | 0.690 | ||||
| ma120101_rel_withdbg.cz12b_c32r128 | 0.786 | 98.601 | 0.356 | 0.168 | 0.088 | nonzero | 0.713 | ||||
| ma120101_mdev16168_rel_withdbg.cz12b_c32r128 | 3.258 | 96.409 | 0.079 | 0.169 | 0.085 | nonzero | 0.309 |
Performance metrics for the DBMS listed above. Some are normalized by throughput, others are not. Legend for results is here.
ips	qps	rps	rmbps	wps	wmbps	rpq	rkbpq	wpi	wkbpi	csps	cpups	cspq	cpupq	dbgb1	dbgb2	rss	maxop	p50	p99	tag
322035	0	1	0.0	2270.6	94.6	0.000	0.000	0.007	0.301	927491	50.9	2.880	76	263.2	365.1	101.2	0.550	16083	14384	ma100623_rel_withdbg.cz12a_c32r128
1027221	0	5	0.1	7282.6	309.4	0.000	0.000	0.007	0.308	188072	58.4	0.183	27	263.2	365.1	101.2	0.648	52344	30167	ma101114_rel_withdbg.cz12a_c32r128
957625	0	7	0.1	6043.3	276.4	0.000	0.000	0.006	0.296	171873	57.8	0.179	29	263.2	365.1	101.1	0.693	48348	26571	ma110408_rel_withdbg.cz12b_c32r128
1013171	0	3	0.0	6370.0	292.2	0.000	0.000	0.006	0.295	182470	58.3	0.180	28	263.2	365.1	101.2	0.690	51044	39957	ma110803_rel_withdbg.cz12b_c32r128
1004268	0	5	0.1	6179.4	287.3	0.000	0.000	0.006	0.293	178307	59.0	0.178	28	263.2	365.1	101.2	0.713	50645	41355	ma120101_rel_withdbg.cz12b_c32r128
1410935	0	6	0.1	8211.6	370.4	0.000	0.000	0.006	0.269	241658	49.7	0.171	17	263.2	364.0	101.2	0.309	70147	58456	ma120101_mdev16168_rel_withdbg.cz12b_c32r128
Average values from iostat.
r/s	rkB/s	rrqm/s	%rrqm	r_await	rareq-s	w/s	wkB/s	wrqm/s	%wrqm	w_await	wareq-s	d/s	dkB/s	drqm/s	%drqm	d_await	dareq-s	f/s	f_await	aqu-sz	%util
1.180	13.23	0.000	0.000	0.109	5.437	2270.6	96901.0	0.000	0.000	6.783	48.75	0.000	0.000	0.000	0.000	0.000	0.000	0.000	0.000	13.05	7.508		ma100623_rel_withdbg.cz12a_c32r128
4.575	62.96	0.000	0.000	0.172	10.08	7282.6	316863	0.000	0.000	7.178	45.23	0.000	0.000	0.000	0.000	0.000	0.000	0.000	0.000	49.05	22.33		ma101114_rel_withdbg.cz12a_c32r128
6.679	91.77	0.000	0.000	0.144	11.96	6043.3	283078	0.000	0.000	9.978	57.01	0.000	0.000	0.000	0.000	0.000	0.000	0.000	0.000	46.80	20.70		ma110408_rel_withdbg.cz12b_c32r128
3.193	33.34	0.000	0.000	0.129	6.861	6370.0	299205	0.000	0.000	11.29	56.76	0.000	0.000	0.000	0.000	0.000	0.000	0.000	0.000	57.84	21.92		ma110803_rel_withdbg.cz12b_c32r128
5.164	68.51	0.000	0.000	0.146	10.67	6179.4	294240	0.000	0.000	10.88	57.36	0.000	0.000	0.000	0.000	0.000	0.000	0.000	0.000	54.04	21.52		ma120101_rel_withdbg.cz12b_c32r128
5.548	65.69	0.000	0.000	0.162	9.208	8211.6	379242	0.000	0.000	12.53	62.57	0.000	0.000	0.000	0.000	0.000	0.000	0.000	0.000	76.74	27.47		ma120101_mdev16168_rel_withdbg.cz12b_c32r128
l.x
l.x: create secondary indexes.
Average throughput:
Performance metrics for the DBMS listed above. Some are normalized by throughput, others are not. Legend for results is here.
ips	qps	rps	rmbps	wps	wmbps	rpq	rkbpq	wpi	wkbpi	csps	cpups	cspq	cpupq	dbgb1	dbgb2	rss	maxop	p50	p99	tag
1564945	0	17128	1395.6	19168.8	1562.6	0.011	0.913	0.012	1.022	105530	23.3	0.067	7	557.5	659.4	101.5	0.005	NA	NA	ma100623_rel_withdbg.cz12a_c32r128
1584786	0	17307	1406.1	19751.6	1581.8	0.011	0.909	0.012	1.022	106423	25.1	0.067	8	557.5	659.4	100.8	0.002	NA	NA	ma101114_rel_withdbg.cz12a_c32r128
1546192	0	16844	1382.4	19340.6	1544.4	0.011	0.916	0.013	1.023	100078	25.2	0.065	8	557.5	659.4	100.8	0.004	NA	NA	ma110408_rel_withdbg.cz12b_c32r128
1565558	0	17024	1396.6	20480.3	1577.6	0.011	0.913	0.013	1.032	115982	23.9	0.074	7	557.5	659.4	100.7	0.004	NA	NA	ma110803_rel_withdbg.cz12b_c32r128
1537279	0	16749	1373.8	20104.5	1549.2	0.011	0.915	0.013	1.032	108785	24.7	0.071	8	557.5	659.4	100.7	0.004	NA	NA	ma120101_rel_withdbg.cz12b_c32r128
1615509	0	17589	1445.1	19617.1	1603.7	0.011	0.916	0.012	1.016	109482	24.1	0.068	7	557.5	658.3	100.7	0.004	NA	NA	ma120101_mdev16168_rel_withdbg.cz12b_c32r128
Average values from iostat.
r/s rkB/s rrqm/s %rrqm r_await rareq-s w/s wkB/s wrqm/s %wrqm w_await wareq-s d/s dkB/s drqm/s %drqm d_await dareq-s f/s f_await aqu-sz %util
l.i1
l.i1: continue load after secondary indexes created with 50 inserts per transaction. Graphs for performance per 1-second interval are here.
Average throughput:
Insert response time histogram: each cell has the percentage of responses that take <= the time in the header and max is the max response time in seconds. For the max column values in the top 25% of the range have a red background and in the bottom 25% of the range have a green background. The red background is not used when the min value is within 80% of the max value.
| dbms | 256us | 1ms | 4ms | 16ms | 64ms | 256ms | 1s | 4s | 16s | gt | max |
|---|---|---|---|---|---|---|---|---|---|---|---|
| ma100623_rel_withdbg.cz12a_c32r128 | 0.085 | 57.619 | 23.436 | 18.859 | 0.562 | ||||||
| ma101114_rel_withdbg.cz12a_c32r128 | 0.155 | 35.710 | 44.487 | 19.647 | 0.702 | ||||||
| ma110408_rel_withdbg.cz12b_c32r128 | 0.275 | 27.766 | 52.651 | 19.308 | 0.900 | ||||||
| ma110803_rel_withdbg.cz12b_c32r128 | 0.325 | 27.741 | 52.793 | 19.141 | 0.822 | ||||||
| ma120101_rel_withdbg.cz12b_c32r128 | 0.335 | 28.373 | 52.121 | 19.170 | 0.790 | ||||||
| ma120101_mdev16168_rel_withdbg.cz12b_c32r128 | 0.297 | 28.030 | 52.675 | 18.999 | 0.979 |
Delete response time histogram: each cell has the percentage of responses that take <= the time in the header and max is the max response time in seconds. For the max column values in the top 25% of the range have a red background and in the bottom 25% of the range have a green background. The red background is not used when the min value is within 80% of the max value.
| dbms | 256us | 1ms | 4ms | 16ms | 64ms | 256ms | 1s | 4s | 16s | gt | max |
|---|---|---|---|---|---|---|---|---|---|---|---|
| ma100623_rel_withdbg.cz12a_c32r128 | 0.216 | 73.619 | 7.729 | 18.436 | 0.522 | ||||||
| ma101114_rel_withdbg.cz12a_c32r128 | 2.194 | 61.981 | 16.564 | 19.261 | 0.477 | ||||||
| ma110408_rel_withdbg.cz12b_c32r128 | 2.304 | 48.672 | 30.096 | 18.927 | 0.561 | ||||||
| ma110803_rel_withdbg.cz12b_c32r128 | 2.596 | 48.034 | 30.601 | 18.768 | 0.520 | ||||||
| ma120101_rel_withdbg.cz12b_c32r128 | 2.529 | 48.789 | 29.895 | 18.787 | 0.736 | ||||||
| ma120101_mdev16168_rel_withdbg.cz12b_c32r128 | 2.402 | 49.279 | 29.628 | 18.691 | 0.539 |
Performance metrics for the DBMS listed above. Some are normalized by throughput, others are not. Legend for results is here.
ips	qps	rps	rmbps	wps	wmbps	rpq	rkbpq	wpi	wkbpi	csps	cpups	cspq	cpupq	dbgb1	dbgb2	rss	maxop	p50	p99	tag
9715	0	58043	906.9	57222.8	1566.9	5.975	95.595	5.890	165.164	817251	17.0	84.126	840	728.6	830.8	100.4	0.562	549	150	ma100623_rel_withdbg.cz12a_c32r128
8619	0	51655	807.1	50703.4	1386.4	5.993	95.894	5.883	164.716	936798	17.1	108.692	952	730.1	832.3	100.4	0.702	450	150	ma101114_rel_withdbg.cz12a_c32r128
8270	0	50028	781.6	49968.4	1340.9	6.050	96.790	6.042	166.047	1011506	16.7	122.318	969	730.1	832.4	100.4	0.900	400	150	ma110408_rel_withdbg.cz12b_c32r128
8265	0	49908	779.8	49680.0	1334.7	6.038	96.606	6.011	165.361	1018980	16.6	123.284	964	730.3	832.5	100.4	0.822	450	150	ma110803_rel_withdbg.cz12b_c32r128
8305	0	50159	783.7	49755.5	1339.8	6.040	96.634	5.991	165.198	1012811	16.5	121.956	954	730.2	832.5	100.5	0.790	450	150	ma120101_rel_withdbg.cz12b_c32r128
8336	0	50336	786.5	50445.0	1350.9	6.039	96.612	6.052	165.942	1018823	16.6	122.221	956	730.2	832.4	100.4	0.979	450	150	ma120101_mdev16168_rel_withdbg.cz12b_c32r128
Average values from iostat.
r/s	rkB/s	rrqm/s	%rrqm	r_await	rareq-s	w/s	wkB/s	wrqm/s	%wrqm	w_await	wareq-s	d/s	dkB/s	drqm/s	%drqm	d_await	dareq-s	f/s	f_await	aqu-sz	%util
58043.4	928669	0.000	0.000	0.224	16.00	57222.8	1604499	0.000	0.000	0.160	28.12	0.000	0.000	0.000	0.000	0.000	0.000	0.000	0.000	22.52	99.99		ma100623_rel_withdbg.cz12a_c32r128
51654.8	826493	0.000	0.000	0.192	16.00	50703.4	1419652	0.000	0.000	0.158	28.02	0.000	0.000	0.000	0.000	0.000	0.000	0.000	0.000	18.06	99.99		ma101114_rel_withdbg.cz12a_c32r128
50028.1	800409	0.000	0.000	0.182	16.00	49968.4	1373124	0.000	0.000	0.136	27.60	0.000	0.000	0.000	0.000	0.000	0.000	0.000	0.000	16.22	99.99		ma110408_rel_withdbg.cz12b_c32r128
49907.9	798480	0.000	0.000	0.180	16.00	49680.0	1366759	0.000	0.000	0.154	27.66	0.000	0.000	0.000	0.000	0.000	0.000	0.000	0.000	16.11	100.00		ma110803_rel_withdbg.cz12b_c32r128
50159.2	802513	0.000	0.000	0.184	16.00	49755.5	1371921	0.000	0.000	0.146	27.70	0.000	0.000	0.000	0.000	0.000	0.000	0.000	0.000	16.49	100.00		ma120101_rel_withdbg.cz12b_c32r128
50336.4	805348	0.000	0.000	0.183	16.00	50445.0	1383280	0.000	0.000	0.144	27.56	0.000	0.000	0.000	0.000	0.000	0.000	0.000	0.000	16.89	100.00		ma120101_mdev16168_rel_withdbg.cz12b_c32r128
l.i2
l.i2: continue load after secondary indexes created with 5 inserts per transaction. Graphs for performance per 1-second interval are here.
Average throughput:
Insert response time histogram: each cell has the percentage of responses that take <= the time in the header and max is the max response time in seconds. For the max column values in the top 25% of the range have a red background and in the bottom 25% of the range have a green background. The red background is not used when the min value is within 80% of the max value.
| dbms | 256us | 1ms | 4ms | 16ms | 64ms | 256ms | 1s | 4s | 16s | gt | max |
|---|---|---|---|---|---|---|---|---|---|---|---|
| ma100623_rel_withdbg.cz12a_c32r128 | 0.075 | 52.864 | 17.928 | 28.934 | 0.199 | 0.242 | |||||
| ma101114_rel_withdbg.cz12a_c32r128 | nonzero | 0.589 | 55.982 | 13.629 | 29.585 | 0.215 | 0.197 | ||||
| ma110408_rel_withdbg.cz12b_c32r128 | 0.717 | 57.684 | 12.985 | 28.484 | 0.129 | nonzero | 0.268 | ||||
| ma110803_rel_withdbg.cz12b_c32r128 | nonzero | 0.786 | 57.545 | 13.259 | 28.294 | 0.115 | 0.215 | ||||
| ma120101_rel_withdbg.cz12b_c32r128 | nonzero | 0.787 | 57.216 | 13.444 | 28.448 | 0.105 | 0.218 | ||||
| ma120101_mdev16168_rel_withdbg.cz12b_c32r128 | nonzero | 0.835 | 57.559 | 13.313 | 28.174 | 0.119 | 0.235 |
Delete response time histogram: each cell has the percentage of responses that take <= the time in the header and max is the max response time in seconds. For the max column values in the top 25% of the range have a red background and in the bottom 25% of the range have a green background. The red background is not used when the min value is within 80% of the max value.
| dbms | 256us | 1ms | 4ms | 16ms | 64ms | 256ms | 1s | 4s | 16s | gt | max |
|---|---|---|---|---|---|---|---|---|---|---|---|
| ma100623_rel_withdbg.cz12a_c32r128 | 0.182 | 60.511 | 10.467 | 28.755 | 0.085 | 0.180 | |||||
| ma101114_rel_withdbg.cz12a_c32r128 | nonzero | 1.860 | 61.182 | 7.554 | 29.324 | 0.080 | 0.161 | ||||
| ma110408_rel_withdbg.cz12b_c32r128 | nonzero | 1.706 | 62.597 | 7.374 | 28.226 | 0.097 | 0.237 | ||||
| ma110803_rel_withdbg.cz12b_c32r128 | nonzero | 1.785 | 62.596 | 7.498 | 28.040 | 0.081 | 0.211 | ||||
| ma120101_rel_withdbg.cz12b_c32r128 | nonzero | 1.760 | 62.332 | 7.638 | 28.195 | 0.075 | 0.217 | ||||
| ma120101_mdev16168_rel_withdbg.cz12b_c32r128 | nonzero | 1.857 | 62.508 | 7.639 | 27.908 | 0.088 | 0.207 |
Performance metrics for the DBMS listed above. Some are normalized by throughput, others are not. Legend for results is here.
ips	qps	rps	rmbps	wps	wmbps	rpq	rkbpq	wpi	wkbpi	csps	cpups	cspq	cpupq	dbgb1	dbgb2	rss	maxop	p50	p99	tag
8140	0	54606	853.2	51405.7	1430.8	6.708	107.334	6.315	179.994	715906	16.1	87.949	949	728.6	830.8	100.4	0.242	524	90	ma100623_rel_withdbg.cz12a_c32r128
8217	0	55157	861.9	51819.2	1441.4	6.713	107.407	6.306	179.628	709242	16.1	86.315	941	730.1	832.3	100.4	0.197	525	90	ma101114_rel_withdbg.cz12a_c32r128
8580	0	58198	909.3	51237.4	1427.2	6.783	108.527	5.972	170.330	696891	16.2	81.223	906	730.1	832.4	100.4	0.268	579	95	ma110408_rel_withdbg.cz12b_c32r128
8643	0	58571	915.2	51662.9	1438.9	6.777	108.426	5.977	170.477	702731	16.2	81.306	900	730.3	832.5	100.3	0.215	579	95	ma110803_rel_withdbg.cz12b_c32r128
8602	0	58307	911.0	51129.7	1428.7	6.778	108.451	5.944	170.072	696756	16.1	80.998	898	730.2	832.5	100.3	0.218	579	95	ma120101_rel_withdbg.cz12b_c32r128
8688	0	58885	920.1	51852.7	1444.2	6.778	108.443	5.968	170.222	706541	16.2	81.324	895	730.2	832.4	100.3	0.235	579	95	ma120101_mdev16168_rel_withdbg.cz12b_c32r128
Average values from iostat.
r/s	rkB/s	rrqm/s	%rrqm	r_await	rareq-s	w/s	wkB/s	wrqm/s	%wrqm	w_await	wareq-s	d/s	dkB/s	drqm/s	%drqm	d_await	dareq-s	f/s	f_await	aqu-sz	%util
54606.4	873696	0.000	0.000	0.190	16.00	51405.7	1465152	0.000	0.000	0.116	28.54	0.000	0.000	0.000	0.000	0.000	0.000	0.000	0.000	16.63	100.00		ma100623_rel_withdbg.cz12a_c32r128
55156.9	882553	0.000	0.000	0.188	16.00	51819.2	1475983	0.000	0.000	0.117	28.52	0.000	0.000	0.000	0.000	0.000	0.000	0.000	0.000	16.75	100.00		ma101114_rel_withdbg.cz12a_c32r128
58198.2	931159	0.000	0.000	0.186	16.00	51237.4	1461435	0.000	0.000	0.111	28.55	0.000	0.000	0.000	0.000	0.000	0.000	0.000	0.000	16.87	100.00		ma110408_rel_withdbg.cz12b_c32r128
58571.0	937128	0.000	0.000	0.185	16.00	51662.9	1473429	0.000	0.000	0.108	28.55	0.000	0.000	0.000	0.000	0.000	0.000	0.000	0.000	16.81	100.00		ma110803_rel_withdbg.cz12b_c32r128
58306.9	932910	0.000	0.000	0.187	16.00	51129.7	1462975	0.000	0.000	0.111	28.64	0.000	0.000	0.000	0.000	0.000	0.000	0.000	0.000	16.99	100.00		ma120101_rel_withdbg.cz12b_c32r128
58885.0	942151	0.000	0.000	0.186	16.00	51852.7	1478893	0.000	0.000	0.111	28.55	0.000	0.000	0.000	0.000	0.000	0.000	0.000	0.000	17.07	100.00		ma120101_mdev16168_rel_withdbg.cz12b_c32r128
qr100.L1
qr100.L1: range queries with 100 insert/s per client. Graphs for performance per 1-second interval are here.
Average throughput:
Query response time histogram: each cell has the percentage of responses that take <= the time in the header and max is the max response time in seconds. For max values in the top 25% of the range have a red background and in the bottom 25% of the range have a green background. The red background is not used when the min value is within 80% of the max value.
| dbms | 256us | 1ms | 4ms | 16ms | 64ms | 256ms | 1s | 4s | 16s | gt | max |
|---|---|---|---|---|---|---|---|---|---|---|---|
| ma100623_rel_withdbg.cz12a_c32r128 | 99.648 | 0.328 | 0.023 | 0.001 | nonzero | 0.047 | |||||
| ma101114_rel_withdbg.cz12a_c32r128 | 99.598 | 0.376 | 0.026 | 0.001 | nonzero | nonzero | 0.072 | ||||
| ma110408_rel_withdbg.cz12b_c32r128 | 99.581 | 0.392 | 0.027 | 0.001 | nonzero | nonzero | 0.079 | ||||
| ma110803_rel_withdbg.cz12b_c32r128 | 99.591 | 0.382 | 0.026 | 0.001 | nonzero | nonzero | 0.083 | ||||
| ma120101_rel_withdbg.cz12b_c32r128 | 99.607 | 0.369 | 0.024 | 0.001 | nonzero | nonzero | 0.084 | ||||
| ma120101_mdev16168_rel_withdbg.cz12b_c32r128 | 99.594 | 0.380 | 0.025 | 0.001 | nonzero | nonzero | 0.077 |
Insert response time histogram: each cell has the percentage of responses that take <= the time in the header and max is the max response time in seconds. For max values in the top 25% of the range have a red background and in the bottom 25% of the range have a green background. The red background is not used when the min value is within 80% of the max value.
| dbms | 256us | 1ms | 4ms | 16ms | 64ms | 256ms | 1s | 4s | 16s | gt | max |
|---|---|---|---|---|---|---|---|---|---|---|---|
| ma100623_rel_withdbg.cz12a_c32r128 | 11.672 | 88.275 | 0.053 | 0.095 | |||||||
| ma101114_rel_withdbg.cz12a_c32r128 | 30.410 | 69.403 | 0.187 | 0.147 | |||||||
| ma110408_rel_withdbg.cz12b_c32r128 | 33.926 | 65.960 | 0.114 | 0.131 | |||||||
| ma110803_rel_withdbg.cz12b_c32r128 | 34.036 | 65.862 | 0.101 | 0.117 | |||||||
| ma120101_rel_withdbg.cz12b_c32r128 | 45.364 | 54.476 | 0.160 | 0.128 | |||||||
| ma120101_mdev16168_rel_withdbg.cz12b_c32r128 | 38.399 | 61.442 | 0.160 | 0.126 |
Delete response time histogram: each cell has the percentage of responses that take <= the time in the header and max is the max response time in seconds. For max values in the top 25% of the range have a red background and in the bottom 25% of the range have a green background. The red background is not used when the min value is within 80% of the max value.
| dbms | 256us | 1ms | 4ms | 16ms | 64ms | 256ms | 1s | 4s | 16s | gt | max |
|---|---|---|---|---|---|---|---|---|---|---|---|
| ma100623_rel_withdbg.cz12a_c32r128 | 20.840 | 79.128 | 0.031 | 0.089 | |||||||
| ma101114_rel_withdbg.cz12a_c32r128 | 67.243 | 32.669 | 0.088 | 0.129 | |||||||
| ma110408_rel_withdbg.cz12b_c32r128 | 61.539 | 38.390 | 0.072 | 0.122 | |||||||
| ma110803_rel_withdbg.cz12b_c32r128 | 62.806 | 37.135 | 0.058 | 0.105 | |||||||
| ma120101_rel_withdbg.cz12b_c32r128 | 68.112 | 31.790 | 0.097 | 0.123 | |||||||
| ma120101_mdev16168_rel_withdbg.cz12b_c32r128 | 65.475 | 34.434 | 0.091 | 0.121 |
Performance metrics for the DBMS listed above. Some are normalized by throughput, others are not. Legend for results is here.
ips	qps	rps	rmbps	wps	wmbps	rpq	rkbpq	wpi	wkbpi	csps	cpups	cspq	cpupq	dbgb1	dbgb2	rss	maxop	p50	p99	tag
1987	203898	8765	137.0	7076.8	197.1	0.043	0.688	3.561	101.584	1251235	44.5	6.137	105	728.6	830.8	100.4	0.047	10357	9430	ma100623_rel_withdbg.cz12a_c32r128
1988	203291	8771	137.0	7057.8	196.4	0.043	0.690	3.551	101.176	1242490	44.5	6.112	105	730.1	832.3	100.4	0.072	10357	9449	ma101114_rel_withdbg.cz12a_c32r128
1987	200829	8801	137.5	7123.5	198.1	0.044	0.701	3.586	102.110	1226939	44.5	6.109	106	730.1	832.4	100.4	0.079	10181	9334	ma110408_rel_withdbg.cz12b_c32r128
1987	200466	8814	137.7	7136.6	198.5	0.044	0.703	3.591	102.266	1225931	44.5	6.115	107	730.3	832.5	100.3	0.083	10229	9430	ma110803_rel_withdbg.cz12b_c32r128
1987	199066	8797	137.5	7099.8	198.1	0.044	0.707	3.574	102.107	1215692	44.4	6.107	107	730.2	832.5	100.4	0.084	10085	9366	ma120101_rel_withdbg.cz12b_c32r128
1987	198713	8801	137.5	7121.2	198.1	0.044	0.709	3.584	102.114	1214462	44.4	6.112	107	730.2	832.4	100.4	0.077	10085	9286	ma120101_mdev16168_rel_withdbg.cz12b_c32r128
Average values from iostat.
r/s	rkB/s	rrqm/s	%rrqm	r_await	rareq-s	w/s	wkB/s	wrqm/s	%wrqm	w_await	wareq-s	d/s	dkB/s	drqm/s	%drqm	d_await	dareq-s	f/s	f_await	aqu-sz	%util
8764.9	140239	0.000	0.000	0.128	16.00	7076.8	201879	0.000	0.000	0.100	30.49	0.000	0.000	0.000	0.000	0.000	0.000	0.000	0.000	1.728	26.94		ma100623_rel_withdbg.cz12a_c32r128
8770.6	140328	0.000	0.000	0.131	16.00	7057.8	201117	0.000	0.000	0.098	30.49	0.000	0.000	0.000	0.000	0.000	0.000	0.000	0.000	1.699	25.36		ma101114_rel_withdbg.cz12a_c32r128
8801.3	140816	0.000	0.000	0.131	16.00	7123.5	202861	0.000	0.000	0.093	30.36	0.000	0.000	0.000	0.000	0.000	0.000	0.000	0.000	1.703	25.08		ma110408_rel_withdbg.cz12b_c32r128
8813.9	141019	0.000	0.000	0.129	16.00	7136.6	203234	0.000	0.000	0.095	30.31	0.000	0.000	0.000	0.000	0.000	0.000	0.000	0.000	1.684	25.22		ma110803_rel_withdbg.cz12b_c32r128
8797.2	140751	0.000	0.000	0.131	16.00	7099.8	202856	0.000	0.000	0.108	30.41	0.000	0.000	0.000	0.000	0.000	0.000	0.000	0.000	1.703	25.67		ma120101_rel_withdbg.cz12b_c32r128
8801.1	140817	0.000	0.000	0.130	16.00	7121.2	202869	0.000	0.000	0.104	30.45	0.000	0.000	0.000	0.000	0.000	0.000	0.000	0.000	1.714	25.47		ma120101_mdev16168_rel_withdbg.cz12b_c32r128
qp100.L2
qp100.L2: point queries with 100 insert/s per client. Graphs for performance per 1-second interval are here.
Average throughput:
Query response time histogram: each cell has the percentage of responses that take <= the time in the header and max is the max response time in seconds. For max values in the top 25% of the range have a red background and in the bottom 25% of the range have a green background. The red background is not used when the min value is within 80% of the max value.
| dbms | 256us | 1ms | 4ms | 16ms | 64ms | 256ms | 1s | 4s | 16s | gt | max |
|---|---|---|---|---|---|---|---|---|---|---|---|
| ma100623_rel_withdbg.cz12a_c32r128 | 0.025 | 68.719 | 31.150 | 0.104 | 0.002 | nonzero | 0.112 | ||||
| ma101114_rel_withdbg.cz12a_c32r128 | 0.015 | 64.978 | 34.892 | 0.112 | 0.003 | nonzero | 0.116 | ||||
| ma110408_rel_withdbg.cz12b_c32r128 | 0.016 | 64.801 | 35.127 | 0.052 | 0.004 | nonzero | 0.173 | ||||
| ma110803_rel_withdbg.cz12b_c32r128 | 0.020 | 65.273 | 34.657 | 0.047 | 0.003 | nonzero | 0.145 | ||||
| ma120101_rel_withdbg.cz12b_c32r128 | 0.017 | 65.494 | 34.417 | 0.067 | 0.004 | nonzero | 0.134 | ||||
| ma120101_mdev16168_rel_withdbg.cz12b_c32r128 | 0.017 | 65.621 | 34.310 | 0.050 | 0.002 | nonzero | 0.141 |
Insert response time histogram: each cell has the percentage of responses that take <= the time in the header and max is the max response time in seconds. For max values in the top 25% of the range have a red background and in the bottom 25% of the range have a green background. The red background is not used when the min value is within 80% of the max value.
| dbms | 256us | 1ms | 4ms | 16ms | 64ms | 256ms | 1s | 4s | 16s | gt | max |
|---|---|---|---|---|---|---|---|---|---|---|---|
| ma100623_rel_withdbg.cz12a_c32r128 | 0.111 | 99.143 | 0.746 | 0.227 | |||||||
| ma101114_rel_withdbg.cz12a_c32r128 | 0.106 | 99.126 | 0.767 | 0.001 | 0.268 | ||||||
| ma110408_rel_withdbg.cz12b_c32r128 | 0.110 | 99.010 | 0.869 | 0.010 | 0.326 | ||||||
| ma110803_rel_withdbg.cz12b_c32r128 | 0.163 | 99.203 | 0.625 | 0.010 | 0.365 | ||||||
| ma120101_rel_withdbg.cz12b_c32r128 | 0.110 | 99.060 | 0.817 | 0.013 | 0.356 | ||||||
| ma120101_mdev16168_rel_withdbg.cz12b_c32r128 | 0.137 | 99.424 | 0.438 | 0.236 |
Delete response time histogram: each cell has the percentage of responses that take <= the time in the header and max is the max response time in seconds. For max values in the top 25% of the range have a red background and in the bottom 25% of the range have a green background. The red background is not used when the min value is within 80% of the max value.
| dbms | 256us | 1ms | 4ms | 16ms | 64ms | 256ms | 1s | 4s | 16s | gt | max |
|---|---|---|---|---|---|---|---|---|---|---|---|
| ma100623_rel_withdbg.cz12a_c32r128 | 0.164 | 99.372 | 0.465 | 0.183 | |||||||
| ma101114_rel_withdbg.cz12a_c32r128 | 0.172 | 99.317 | 0.510 | 0.218 | |||||||
| ma110408_rel_withdbg.cz12b_c32r128 | 0.178 | 99.138 | 0.682 | 0.002 | 0.282 | ||||||
| ma110803_rel_withdbg.cz12b_c32r128 | 0.248 | 99.253 | 0.497 | 0.002 | 0.287 | ||||||
| ma120101_rel_withdbg.cz12b_c32r128 | 0.149 | 99.152 | 0.696 | 0.003 | 0.309 | ||||||
| ma120101_mdev16168_rel_withdbg.cz12b_c32r128 | 0.202 | 99.474 | 0.324 | 0.203 |
Performance metrics for the DBMS listed above. Some are normalized by throughput, others are not. Legend for results is here.
ips	qps	rps	rmbps	wps	wmbps	rpq	rkbpq	wpi	wkbpi	csps	cpups	cspq	cpupq	dbgb1	dbgb2	rss	maxop	p50	p99	tag
1987	19970	143910	2248.6	11601.7	319.9	7.206	115.300	5.840	164.907	525651	14.2	26.322	341	728.6	830.8	100.4	0.112	1023	559	ma100623_rel_withdbg.cz12a_c32r128
1988	19394	140388	2193.6	11585.1	319.4	7.239	115.821	5.828	164.559	575410	15.8	29.670	391	730.1	832.3	100.4	0.116	991	559	ma101114_rel_withdbg.cz12a_c32r128
1987	19472	140568	2196.4	11486.9	316.6	7.219	115.501	5.780	163.138	571384	15.7	29.343	387	730.1	832.4	100.4	0.173	991	543	ma110408_rel_withdbg.cz12b_c32r128
1987	19575	141087	2204.5	11482.5	316.3	7.207	115.319	5.780	163.035	572669	15.3	29.255	375	730.3	832.5	100.4	0.145	991	544	ma110803_rel_withdbg.cz12b_c32r128
1987	19507	140662	2198.0	11446.2	316.4	7.211	115.379	5.761	163.106	574056	15.6	29.428	384	730.2	832.5	100.4	0.134	991	543	ma120101_rel_withdbg.cz12b_c32r128
1987	19587	141186	2206.0	11481.9	316.3	7.208	115.330	5.779	163.051	570523	15.7	29.128	385	730.2	832.4	100.4	0.141	1006	559	ma120101_mdev16168_rel_withdbg.cz12b_c32r128
Average values from iostat.
r/s	rkB/s	rrqm/s	%rrqm	r_await	rareq-s	w/s	wkB/s	wrqm/s	%wrqm	w_await	wareq-s	d/s	dkB/s	drqm/s	%drqm	d_await	dareq-s	f/s	f_await	aqu-sz	%util
143910	2302550	0.000	0.000	0.110	16.00	11601.7	327620	0.000	0.000	0.115	28.29	0.000	0.000	0.000	0.000	0.000	0.000	0.000	0.000	17.18	99.94		ma100623_rel_withdbg.cz12a_c32r128
140388	2246201	0.000	0.000	0.107	16.00	11585.1	327110	0.000	0.000	0.105	28.29	0.000	0.000	0.000	0.000	0.000	0.000	0.000	0.000	16.30	100.00		ma101114_rel_withdbg.cz12a_c32r128
140568	2249087	0.000	0.000	0.107	16.00	11486.9	324204	0.000	0.000	0.098	28.28	0.000	0.000	0.000	0.000	0.000	0.000	0.000	0.000	16.16	100.00		ma110408_rel_withdbg.cz12b_c32r128
141087	2257381	0.000	0.000	0.106	16.00	11482.5	323901	0.000	0.000	0.098	28.26	0.000	0.000	0.000	0.000	0.000	0.000	0.000	0.000	16.14	99.94		ma110803_rel_withdbg.cz12b_c32r128
140662	2250707	0.000	0.000	0.107	16.00	11446.2	324044	0.000	0.000	0.098	28.36	0.000	0.000	0.000	0.000	0.000	0.000	0.000	0.000	16.14	99.94		ma120101_rel_withdbg.cz12b_c32r128
141186	2258969	0.000	0.000	0.105	16.00	11481.9	323934	0.000	0.000	0.093	28.27	0.000	0.000	0.000	0.000	0.000	0.000	0.000	0.000	16.03	99.94		ma120101_mdev16168_rel_withdbg.cz12b_c32r128
qr500.L3
qr500.L3: range queries with 500 insert/s per client. Graphs for performance per 1-second interval are here.
Average throughput:
Query response time histogram: each cell has the percentage of responses that take <= the time in the header and max is the max response time in seconds. For max values in the top 25% of the range have a red background and in the bottom 25% of the range have a green background. The red background is not used when the min value is within 80% of the max value.
| dbms | 256us | 1ms | 4ms | 16ms | 64ms | 256ms | 1s | 4s | 16s | gt | max |
|---|---|---|---|---|---|---|---|---|---|---|---|
| ma100623_rel_withdbg.cz12a_c32r128 | 97.252 | 2.520 | 0.213 | 0.014 | 0.001 | nonzero | 0.194 | ||||
| ma101114_rel_withdbg.cz12a_c32r128 | 95.791 | 3.783 | 0.350 | 0.070 | 0.006 | nonzero | 0.210 | ||||
| ma110408_rel_withdbg.cz12b_c32r128 | 96.326 | 3.312 | 0.265 | 0.076 | 0.020 | 0.001 | 0.208 | ||||
| ma110803_rel_withdbg.cz12b_c32r128 | 96.415 | 3.231 | 0.262 | 0.072 | 0.019 | 0.001 | 0.221 | ||||
| ma120101_rel_withdbg.cz12b_c32r128 | 96.533 | 3.130 | 0.255 | 0.064 | 0.017 | nonzero | 0.221 | ||||
| ma120101_mdev16168_rel_withdbg.cz12b_c32r128 | 96.567 | 3.102 | 0.250 | 0.063 | 0.017 | nonzero | 0.215 |
Insert response time histogram: each cell has the percentage of responses that take <= the time in the header and max is the max response time in seconds. For max values in the top 25% of the range have a red background and in the bottom 25% of the range have a green background. The red background is not used when the min value is within 80% of the max value.
| dbms | 256us | 1ms | 4ms | 16ms | 64ms | 256ms | 1s | 4s | 16s | gt | max |
|---|---|---|---|---|---|---|---|---|---|---|---|
| ma100623_rel_withdbg.cz12a_c32r128 | 0.298 | 95.128 | 4.562 | 0.012 | 0.322 | ||||||
| ma101114_rel_withdbg.cz12a_c32r128 | 6.298 | 75.215 | 18.399 | 0.088 | 0.383 | ||||||
| ma110408_rel_withdbg.cz12b_c32r128 | 12.125 | 69.389 | 18.374 | 0.112 | 0.402 | ||||||
| ma110803_rel_withdbg.cz12b_c32r128 | 12.369 | 69.997 | 17.521 | 0.113 | 0.431 | ||||||
| ma120101_rel_withdbg.cz12b_c32r128 | 13.401 | 70.476 | 16.049 | 0.074 | 0.500 | ||||||
| ma120101_mdev16168_rel_withdbg.cz12b_c32r128 | 13.721 | 70.408 | 15.797 | 0.074 | 0.417 |
Delete response time histogram: each cell has the percentage of responses that take <= the time in the header and max is the max response time in seconds. For max values in the top 25% of the range have a red background and in the bottom 25% of the range have a green background. The red background is not used when the min value is within 80% of the max value.
| dbms | 256us | 1ms | 4ms | 16ms | 64ms | 256ms | 1s | 4s | 16s | gt | max |
|---|---|---|---|---|---|---|---|---|---|---|---|
| ma100623_rel_withdbg.cz12a_c32r128 | 0.166 | 96.129 | 3.704 | 0.001 | 0.286 | ||||||
| ma101114_rel_withdbg.cz12a_c32r128 | 25.331 | 56.857 | 17.793 | 0.019 | 0.321 | ||||||
| ma110408_rel_withdbg.cz12b_c32r128 | 28.733 | 55.061 | 16.161 | 0.045 | 0.366 | ||||||
| ma110803_rel_withdbg.cz12b_c32r128 | 29.616 | 54.840 | 15.493 | 0.051 | 0.372 | ||||||
| ma120101_rel_withdbg.cz12b_c32r128 | 30.503 | 55.440 | 14.029 | 0.028 | 0.399 | ||||||
| ma120101_mdev16168_rel_withdbg.cz12b_c32r128 | 31.392 | 54.816 | 13.765 | 0.027 | 0.368 |
Performance metrics for the DBMS listed above. Some are normalized by throughput, others are not. Legend for results is here.
ips	qps	rps	rmbps	wps	wmbps	rpq	rkbpq	wpi	wkbpi	csps	cpups	cspq	cpupq	dbgb1	dbgb2	rss	maxop	p50	p99	tag
9936	158867	41478	648.1	38258.0	1062.3	0.261	4.177	3.850	109.474	1396878	51.8	8.793	157	728.6	830.8	100.4	0.194	8119	5818	ma100623_rel_withdbg.cz12a_c32r128
9939	141520	41528	648.9	38184.1	1060.0	0.293	4.695	3.842	109.204	1466993	49.9	10.366	169	730.1	832.3	100.5	0.210	7336	4571	ma101114_rel_withdbg.cz12a_c32r128
9934	139982	41721	651.9	36894.7	1025.0	0.298	4.769	3.714	105.662	1453078	48.8	10.380	167	730.1	832.4	100.5	0.208	7305	3500	ma110408_rel_withdbg.cz12b_c32r128
9934	141339	41724	651.9	36814.8	1022.7	0.295	4.723	3.706	105.426	1448596	48.7	10.249	165	730.3	832.5	100.4	0.221	7448	3692	ma110803_rel_withdbg.cz12b_c32r128
9936	142687	41769	652.6	36713.4	1023.3	0.293	4.684	3.695	105.451	1435983	49.1	10.064	165	730.2	832.5	100.4	0.221	7592	3581	ma120101_rel_withdbg.cz12b_c32r128
9934	142998	41722	651.9	36765.1	1021.2	0.292	4.668	3.701	105.273	1433062	49.1	10.022	165	730.2	832.4	100.4	0.215	7610	3709	ma120101_mdev16168_rel_withdbg.cz12b_c32r128
Average values from iostat.
r/s	rkB/s	rrqm/s	%rrqm	r_await	rareq-s	w/s	wkB/s	wrqm/s	%wrqm	w_await	wareq-s	d/s	dkB/s	drqm/s	%drqm	d_await	dareq-s	f/s	f_await	aqu-sz	%util
41478.2	663646	0.000	0.000	0.198	16.00	38258.0	1087791	0.000	0.000	0.102	28.48	0.000	0.000	0.000	0.000	0.000	0.000	0.000	0.000	12.01	86.17		ma100623_rel_withdbg.cz12a_c32r128
41527.5	664436	0.000	0.000	0.175	16.00	38184.1	1085404	0.000	0.000	0.094	28.47	0.000	0.000	0.000	0.000	0.000	0.000	0.000	0.000	10.81	90.55		ma101114_rel_withdbg.cz12a_c32r128
41720.9	667524	0.000	0.000	0.167	16.00	36894.7	1049619	0.000	0.000	0.091	28.48	0.000	0.000	0.000	0.000	0.000	0.000	0.000	0.000	10.25	89.75		ma110408_rel_withdbg.cz12b_c32r128
41723.6	667565	0.000	0.000	0.167	16.00	36814.8	1047271	0.000	0.000	0.092	28.48	0.000	0.000	0.000	0.000	0.000	0.000	0.000	0.000	10.28	89.39		ma110803_rel_withdbg.cz12b_c32r128
41769.3	668300	0.000	0.000	0.171	16.00	36713.4	1047819	0.000	0.000	0.093	28.58	0.000	0.000	0.000	0.000	0.000	0.000	0.000	0.000	10.47	88.89		ma120101_rel_withdbg.cz12b_c32r128
41721.8	667530	0.000	0.000	0.169	16.00	36765.1	1045752	0.000	0.000	0.090	28.48	0.000	0.000	0.000	0.000	0.000	0.000	0.000	0.000	10.27	88.34		ma120101_mdev16168_rel_withdbg.cz12b_c32r128
qp500.L4
qp500.L4: point queries with 500 insert/s per client. Graphs for performance per 1-second interval are here.
Average throughput:
Query response time histogram: each cell has the percentage of responses that take <= the time in the header and max is the max response time in seconds. For max values in the top 25% of the range have a red background and in the bottom 25% of the range have a green background. The red background is not used when the min value is within 80% of the max value.
| dbms | 256us | 1ms | 4ms | 16ms | 64ms | 256ms | 1s | 4s | 16s | gt | max |
|---|---|---|---|---|---|---|---|---|---|---|---|
| ma100623_rel_withdbg.cz12a_c32r128 | nonzero | 11.153 | 87.557 | 1.251 | 0.035 | 0.005 | 0.227 | ||||
| ma101114_rel_withdbg.cz12a_c32r128 | nonzero | 7.214 | 75.887 | 12.971 | 3.914 | 0.012 | 0.206 | ||||
| ma110408_rel_withdbg.cz12b_c32r128 | nonzero | 7.631 | 76.517 | 10.943 | 4.833 | 0.075 | nonzero | 0.277 | |||
| ma110803_rel_withdbg.cz12b_c32r128 | nonzero | 7.943 | 76.054 | 10.923 | 4.993 | 0.085 | 0.231 | ||||
| ma120101_rel_withdbg.cz12b_c32r128 | nonzero | 7.663 | 76.791 | 10.667 | 4.805 | 0.074 | 0.222 | ||||
| ma120101_mdev16168_rel_withdbg.cz12b_c32r128 | nonzero | 7.977 | 76.392 | 10.736 | 4.821 | 0.073 | 0.220 |
Insert response time histogram: each cell has the percentage of responses that take <= the time in the header and max is the max response time in seconds. For max values in the top 25% of the range have a red background and in the bottom 25% of the range have a green background. The red background is not used when the min value is within 80% of the max value.
| dbms | 256us | 1ms | 4ms | 16ms | 64ms | 256ms | 1s | 4s | 16s | gt | max |
|---|---|---|---|---|---|---|---|---|---|---|---|
| ma100623_rel_withdbg.cz12a_c32r128 | 3.244 | 96.056 | 0.685 | 0.015 | 0.365 | ||||||
| ma101114_rel_withdbg.cz12a_c32r128 | 0.058 | 17.757 | 59.628 | 22.556 | 0.774 | ||||||
| ma110408_rel_withdbg.cz12b_c32r128 | 0.047 | 16.081 | 58.233 | 25.639 | 0.681 | ||||||
| ma110803_rel_withdbg.cz12b_c32r128 | 0.068 | 15.427 | 58.266 | 26.238 | 0.782 | ||||||
| ma120101_rel_withdbg.cz12b_c32r128 | 0.060 | 17.739 | 56.748 | 25.453 | 0.738 | ||||||
| ma120101_mdev16168_rel_withdbg.cz12b_c32r128 | 0.079 | 17.075 | 57.626 | 25.220 | 0.680 |
Delete response time histogram: each cell has the percentage of responses that take <= the time in the header and max is the max response time in seconds. For max values in the top 25% of the range have a red background and in the bottom 25% of the range have a green background. The red background is not used when the min value is within 80% of the max value.
| dbms | 256us | 1ms | 4ms | 16ms | 64ms | 256ms | 1s | 4s | 16s | gt | max |
|---|---|---|---|---|---|---|---|---|---|---|---|
| ma100623_rel_withdbg.cz12a_c32r128 | 10.865 | 88.540 | 0.594 | 0.001 | 0.303 | ||||||
| ma101114_rel_withdbg.cz12a_c32r128 | 0.074 | 19.275 | 60.270 | 20.381 | 0.767 | ||||||
| ma110408_rel_withdbg.cz12b_c32r128 | 0.061 | 17.456 | 59.678 | 22.804 | 0.680 | ||||||
| ma110803_rel_withdbg.cz12b_c32r128 | 0.086 | 16.657 | 60.094 | 23.163 | 0.904 | ||||||
| ma120101_rel_withdbg.cz12b_c32r128 | 0.077 | 19.108 | 58.269 | 22.546 | 0.611 | ||||||
| ma120101_mdev16168_rel_withdbg.cz12b_c32r128 | 0.103 | 18.515 | 58.999 | 22.383 | 0.632 |
Performance metrics for the DBMS listed above. Some are normalized by throughput, others are not. Legend for results is here.
ips	qps	rps	rmbps	wps	wmbps	rpq	rkbpq	wpi	wkbpi	csps	cpups	cspq	cpupq	dbgb1	dbgb2	rss	maxop	p50	p99	tag
9920	10599	135167	2112.0	45381.5	1256.4	12.753	204.047	4.575	129.689	789197	20.7	74.460	937	728.6	830.8	100.4	0.227	543	240	ma100623_rel_withdbg.cz12a_c32r128
6027	5444	78459	1225.9	33011.1	910.9	14.413	230.600	5.477	154.761	1138741	19.3	209.181	1702	730.3	832.5	100.5	0.206	144	64	ma101114_rel_withdbg.cz12a_c32r128
5840	5121	74962	1171.3	32739.0	902.7	14.637	234.190	5.606	158.271	1186312	18.8	231.638	1762	730.3	832.6	100.5	0.277	112	48	ma110408_rel_withdbg.cz12b_c32r128
5747	5051	73884	1154.4	32239.7	888.9	14.627	234.030	5.610	158.381	1197654	18.6	237.103	1768	730.4	832.8	100.4	0.231	112	48	ma110803_rel_withdbg.cz12b_c32r128
5912	5152	75608	1181.4	33018.4	913.4	14.677	234.828	5.585	158.198	1188421	18.6	230.694	1733	730.4	832.7	100.4	0.222	112	48	ma120101_rel_withdbg.cz12b_c32r128
5912	5159	75699	1182.8	33124.2	913.3	14.674	234.787	5.603	158.176	1196543	18.8	231.951	1749	730.4	832.7	100.4	0.220	112	48	ma120101_mdev16168_rel_withdbg.cz12b_c32r128
Average values from iostat.
r/s	rkB/s	rrqm/s	%rrqm	r_await	rareq-s	w/s	wkB/s	wrqm/s	%wrqm	w_await	wareq-s	d/s	dkB/s	drqm/s	%drqm	d_await	dareq-s	f/s	f_await	aqu-sz	%util
135167	2162672	0.000	0.000	0.195	16.00	45381.5	1286512	0.000	0.000	0.150	28.35	0.000	0.000	0.000	0.000	0.000	0.000	0.000	0.000	33.21	99.95		ma100623_rel_withdbg.cz12a_c32r128
78459.1	1255341	0.000	0.000	0.160	16.00	33011.1	932758	0.000	0.000	0.104	28.25	0.000	0.000	0.000	0.000	0.000	0.000	0.000	0.000	17.63	100.00		ma101114_rel_withdbg.cz12a_c32r128
74961.7	1199383	0.000	0.000	0.158	16.00	32739.0	924350	0.000	0.000	0.095	28.24	0.000	0.000	0.000	0.000	0.000	0.000	0.000	0.000	16.53	100.00		ma110408_rel_withdbg.cz12b_c32r128
73883.8	1182134	0.000	0.000	0.157	16.00	32239.7	910231	0.000	0.000	0.097	28.24	0.000	0.000	0.000	0.000	0.000	0.000	0.000	0.000	16.21	100.00		ma110803_rel_withdbg.cz12b_c32r128
75607.5	1209715	0.000	0.000	0.160	16.00	33018.4	935314	0.000	0.000	0.096	28.33	0.000	0.000	0.000	0.000	0.000	0.000	0.000	0.000	16.93	100.00		ma120101_rel_withdbg.cz12b_c32r128
75698.6	1211173	0.000	0.000	0.158	16.00	33124.2	935185	0.000	0.000	0.095	28.24	0.000	0.000	0.000	0.000	0.000	0.000	0.000	0.000	16.73	100.00		ma120101_mdev16168_rel_withdbg.cz12b_c32r128
qr1000.L5
qr1000.L5: range queries with 1000 insert/s per client. Graphs for performance per 1-second interval are here.
Average throughput:
Query response time histogram: each cell has the percentage of responses that take <= the time in the header and max is the max response time in seconds. For max values in the top 25% of the range have a red background and in the bottom 25% of the range have a green background. The red background is not used when the min value is within 80% of the max value.
| dbms | 256us | 1ms | 4ms | 16ms | 64ms | 256ms | 1s | 4s | 16s | gt | max |
|---|---|---|---|---|---|---|---|---|---|---|---|
| ma100623_rel_withdbg.cz12a_c32r128 | 92.317 | 6.007 | 1.577 | 0.093 | 0.005 | nonzero | nonzero | 0.292 | |||
| ma101114_rel_withdbg.cz12a_c32r128 | 91.983 | 6.439 | 1.430 | 0.142 | 0.006 | nonzero | nonzero | 0.267 | |||
| ma110408_rel_withdbg.cz12b_c32r128 | 91.647 | 6.666 | 1.445 | 0.196 | 0.045 | 0.001 | 0.251 | ||||
| ma110803_rel_withdbg.cz12b_c32r128 | 91.692 | 6.768 | 1.294 | 0.198 | 0.048 | nonzero | 0.215 | ||||
| ma120101_rel_withdbg.cz12b_c32r128 | 91.698 | 6.773 | 1.291 | 0.191 | 0.046 | nonzero | nonzero | 0.260 | |||
| ma120101_mdev16168_rel_withdbg.cz12b_c32r128 | 91.704 | 6.831 | 1.224 | 0.195 | 0.045 | nonzero | 0.231 |
Insert response time histogram: each cell has the percentage of responses that take <= the time in the header and max is the max response time in seconds. For max values in the top 25% of the range have a red background and in the bottom 25% of the range have a green background. The red background is not used when the min value is within 80% of the max value.
| dbms | 256us | 1ms | 4ms | 16ms | 64ms | 256ms | 1s | 4s | 16s | gt | max |
|---|---|---|---|---|---|---|---|---|---|---|---|
| ma100623_rel_withdbg.cz12a_c32r128 | 0.268 | 47.104 | 36.717 | 15.911 | 0.572 | ||||||
| ma101114_rel_withdbg.cz12a_c32r128 | 0.271 | 20.790 | 56.742 | 22.197 | 0.460 | ||||||
| ma110408_rel_withdbg.cz12b_c32r128 | 0.871 | 23.592 | 54.024 | 21.513 | 0.520 | ||||||
| ma110803_rel_withdbg.cz12b_c32r128 | 0.921 | 22.724 | 54.966 | 21.389 | 0.476 | ||||||
| ma120101_rel_withdbg.cz12b_c32r128 | 0.913 | 24.016 | 53.496 | 21.574 | 0.487 | ||||||
| ma120101_mdev16168_rel_withdbg.cz12b_c32r128 | 1.015 | 23.984 | 53.773 | 21.228 | 0.496 |
Delete response time histogram: each cell has the percentage of responses that take <= the time in the header and max is the max response time in seconds. For max values in the top 25% of the range have a red background and in the bottom 25% of the range have a green background. The red background is not used when the min value is within 80% of the max value.
| dbms | 256us | 1ms | 4ms | 16ms | 64ms | 256ms | 1s | 4s | 16s | gt | max |
|---|---|---|---|---|---|---|---|---|---|---|---|
| ma100623_rel_withdbg.cz12a_c32r128 | 0.375 | 61.025 | 22.834 | 15.765 | 0.571 | ||||||
| ma101114_rel_withdbg.cz12a_c32r128 | 3.476 | 36.230 | 38.391 | 21.902 | 0.454 | ||||||
| ma110408_rel_withdbg.cz12b_c32r128 | 3.802 | 30.741 | 44.213 | 21.244 | 0.515 | ||||||
| ma110803_rel_withdbg.cz12b_c32r128 | 3.720 | 29.916 | 45.271 | 21.093 | 0.475 | ||||||
| ma120101_rel_withdbg.cz12b_c32r128 | 3.844 | 31.029 | 43.835 | 21.292 | 0.483 | ||||||
| ma120101_mdev16168_rel_withdbg.cz12b_c32r128 | 3.958 | 31.169 | 43.925 | 20.947 | 0.491 |
Performance metrics for the DBMS listed above. Some are normalized by throughput, others are not. Legend for results is here.
ips	qps	rps	rmbps	wps	wmbps	rpq	rkbpq	wpi	wkbpi	csps	cpups	cspq	cpupq	dbgb1	dbgb2	rss	maxop	p50	p99	tag
9779	106458	50239	785.0	49526.8	1369.4	0.472	7.551	5.065	143.406	1345616	51.4	12.640	232	728.8	831.1	100.5	0.292	5450	3628	ma100623_rel_withdbg.cz12a_c32r128
7631	105688	43406	678.2	42182.5	1167.2	0.411	6.571	5.528	156.623	1404182	48.6	13.286	221	730.3	832.6	100.5	0.267	5370	3580	ma101114_rel_withdbg.cz12a_c32r128
7646	96466	43691	682.7	42577.3	1177.9	0.453	7.247	5.568	157.741	1415910	46.7	14.678	232	730.4	832.7	100.4	0.251	4923	2222	ma110408_rel_withdbg.cz12b_c32r128
7592	97069	43393	678.0	42288.7	1169.9	0.447	7.153	5.570	157.803	1424444	46.4	14.675	229	730.5	832.8	100.4	0.215	5003	2159	ma110803_rel_withdbg.cz12b_c32r128
7663	97256	43802	684.4	42536.1	1180.7	0.450	7.206	5.551	157.785	1420689	46.6	14.608	230	730.5	832.8	100.4	0.260	5019	2302	ma120101_rel_withdbg.cz12b_c32r128
7711	97423	44050	688.3	42911.4	1187.2	0.452	7.235	5.565	157.647	1426415	46.6	14.642	230	730.4	832.7	100.4	0.231	5035	2222	ma120101_mdev16168_rel_withdbg.cz12b_c32r128
Average values from iostat.
r/s	rkB/s	rrqm/s	%rrqm	r_await	rareq-s	w/s	wkB/s	wrqm/s	%wrqm	w_await	wareq-s	d/s	dkB/s	drqm/s	%drqm	d_await	dareq-s	f/s	f_await	aqu-sz	%util
50239.4	803832	0.000	0.000	0.184	16.00	49526.8	1402309	0.000	0.000	0.091	28.31	0.000	0.000	0.000	0.000	0.000	0.000	0.000	0.000	13.91	100.00		ma100623_rel_withdbg.cz12a_c32r128
43405.5	694491	0.000	0.000	0.156	16.00	42182.5	1195209	0.000	0.000	0.088	28.34	0.000	0.000	0.000	0.000	0.000	0.000	0.000	0.000	10.53	100.00		ma101114_rel_withdbg.cz12a_c32r128
43691.4	699059	0.000	0.000	0.156	16.00	42577.3	1206169	0.000	0.000	0.079	28.33	0.000	0.000	0.000	0.000	0.000	0.000	0.000	0.000	10.19	100.00		ma110408_rel_withdbg.cz12b_c32r128
43393.4	694315	0.000	0.000	0.154	16.00	42288.7	1197995	0.000	0.000	0.079	28.33	0.000	0.000	0.000	0.000	0.000	0.000	0.000	0.000	10.07	100.00		ma110803_rel_withdbg.cz12b_c32r128
43801.5	700816	0.000	0.000	0.158	16.00	42536.1	1209071	0.000	0.000	0.080	28.43	0.000	0.000	0.000	0.000	0.000	0.000	0.000	0.000	10.31	100.00		ma120101_rel_withdbg.cz12b_c32r128
44049.9	704859	0.000	0.000	0.156	16.00	42911.4	1215649	0.000	0.000	0.079	28.33	0.000	0.000	0.000	0.000	0.000	0.000	0.000	0.000	10.28	100.00		ma120101_mdev16168_rel_withdbg.cz12b_c32r128
qp1000.L6
qp1000.L6: point queries with 1000 insert/s per client. Graphs for performance per 1-second interval are here.
Average throughput:
Query response time histogram: each cell has the percentage of responses that take <= the time in the header and max is the max response time in seconds. For max values in the top 25% of the range have a red background and in the bottom 25% of the range have a green background. The red background is not used when the min value is within 80% of the max value.
| dbms | 256us | 1ms | 4ms | 16ms | 64ms | 256ms | 1s | 4s | 16s | gt | max |
|---|---|---|---|---|---|---|---|---|---|---|---|
| ma100623_rel_withdbg.cz12a_c32r128 | nonzero | 7.918 | 87.775 | 3.987 | 0.317 | 0.003 | 0.246 | ||||
| ma101114_rel_withdbg.cz12a_c32r128 | nonzero | 7.671 | 84.614 | 6.646 | 1.065 | 0.004 | 0.210 | ||||
| ma110408_rel_withdbg.cz12b_c32r128 | nonzero | 8.156 | 84.163 | 6.180 | 1.484 | 0.017 | nonzero | 0.282 | |||
| ma110803_rel_withdbg.cz12b_c32r128 | nonzero | 8.572 | 83.675 | 6.197 | 1.537 | 0.019 | 0.222 | ||||
| ma120101_rel_withdbg.cz12b_c32r128 | nonzero | 8.293 | 84.194 | 6.009 | 1.486 | 0.017 | 0.205 | ||||
| ma120101_mdev16168_rel_withdbg.cz12b_c32r128 | nonzero | 8.357 | 84.006 | 6.119 | 1.501 | 0.017 | 0.226 |
Insert response time histogram: each cell has the percentage of responses that take <= the time in the header and max is the max response time in seconds. For max values in the top 25% of the range have a red background and in the bottom 25% of the range have a green background. The red background is not used when the min value is within 80% of the max value.
| dbms | 256us | 1ms | 4ms | 16ms | 64ms | 256ms | 1s | 4s | 16s | gt | max |
|---|---|---|---|---|---|---|---|---|---|---|---|
| ma100623_rel_withdbg.cz12a_c32r128 | 0.022 | 46.660 | 22.194 | 31.124 | 0.685 | ||||||
| ma101114_rel_withdbg.cz12a_c32r128 | 0.023 | 30.707 | 36.263 | 33.007 | 0.566 | ||||||
| ma110408_rel_withdbg.cz12b_c32r128 | 0.031 | 26.528 | 39.222 | 34.219 | 0.627 | ||||||
| ma110803_rel_withdbg.cz12b_c32r128 | 0.042 | 26.451 | 39.235 | 34.272 | 0.601 | ||||||
| ma120101_rel_withdbg.cz12b_c32r128 | 0.031 | 27.891 | 38.011 | 34.067 | 0.620 | ||||||
| ma120101_mdev16168_rel_withdbg.cz12b_c32r128 | 0.036 | 27.280 | 38.895 | 33.789 | 0.607 |
Delete response time histogram: each cell has the percentage of responses that take <= the time in the header and max is the max response time in seconds. For max values in the top 25% of the range have a red background and in the bottom 25% of the range have a green background. The red background is not used when the min value is within 80% of the max value.
| dbms | 256us | 1ms | 4ms | 16ms | 64ms | 256ms | 1s | 4s | 16s | gt | max |
|---|---|---|---|---|---|---|---|---|---|---|---|
| ma100623_rel_withdbg.cz12a_c32r128 | 0.029 | 49.734 | 19.169 | 31.067 | 0.677 | ||||||
| ma101114_rel_withdbg.cz12a_c32r128 | 0.030 | 32.751 | 34.982 | 32.237 | 0.563 | ||||||
| ma110408_rel_withdbg.cz12b_c32r128 | 0.038 | 28.266 | 38.463 | 33.233 | 0.564 | ||||||
| ma110803_rel_withdbg.cz12b_c32r128 | 0.052 | 28.092 | 38.660 | 33.197 | 0.536 | ||||||
| ma120101_rel_withdbg.cz12b_c32r128 | 0.038 | 29.618 | 37.262 | 33.082 | 0.704 | ||||||
| ma120101_mdev16168_rel_withdbg.cz12b_c32r128 | 0.043 | 29.112 | 38.036 | 32.809 | 0.565 |
Performance metrics for the DBMS listed above. Some are normalized by throughput, others are not. Legend for results is here.
ips	qps	rps	rmbps	wps	wmbps	rpq	rkbpq	wpi	wkbpi	csps	cpups	cspq	cpupq	dbgb1	dbgb2	rss	maxop	p50	p99	tag
7499	8999	123860	1935.3	48033.1	1327.7	13.764	220.222	6.405	181.296	877224	20.3	97.481	1083	728.9	831.2	100.4	0.246	479	112	ma100623_rel_withdbg.cz12a_c32r128
6350	7854	106542	1664.7	40823.6	1128.3	13.565	217.038	6.429	181.942	1013020	20.0	128.978	1222	730.4	832.7	100.5	0.210	463	80	ma101114_rel_withdbg.cz12a_c32r128
6163	7586	102946	1608.5	40300.7	1113.6	13.570	217.114	6.539	185.037	1044107	19.6	137.627	1240	730.4	832.8	100.4	0.282	448	64	ma110408_rel_withdbg.cz12b_c32r128
6138	7545	102450	1600.8	40122.5	1108.7	13.578	217.247	6.537	184.953	1058985	19.2	140.350	1221	730.6	832.9	100.4	0.222	432	64	ma110803_rel_withdbg.cz12b_c32r128
6205	7599	103402	1615.7	40437.2	1121.2	13.607	217.709	6.517	185.031	1043469	19.4	137.311	1225	730.5	832.8	100.4	0.205	448	64	ma120101_rel_withdbg.cz12b_c32r128
6214	7592	103363	1615.0	40553.5	1120.7	13.614	217.829	6.526	184.675	1050351	19.5	138.346	1233	730.5	832.8	100.4	0.226	448	64	ma120101_mdev16168_rel_withdbg.cz12b_c32r128
Average values from iostat.
r/s	rkB/s	rrqm/s	%rrqm	r_await	rareq-s	w/s	wkB/s	wrqm/s	%wrqm	w_await	wareq-s	d/s	dkB/s	drqm/s	%drqm	d_await	dareq-s	f/s	f_await	aqu-sz	%util
123860	1981759	0.000	0.000	0.210	16.00	48033.1	1359578	0.000	0.000	0.147	28.31	0.000	0.000	0.000	0.000	0.000	0.000	0.000	0.000	33.16	100.00		ma100623_rel_withdbg.cz12a_c32r128
106542	1704661	0.000	0.000	0.191	16.00	40823.6	1155383	0.000	0.000	0.129	28.30	0.000	0.000	0.000	0.000	0.000	0.000	0.000	0.000	25.86	100.00		ma101114_rel_withdbg.cz12a_c32r128
102946	1647132	0.000	0.000	0.189	16.00	40300.7	1140344	0.000	0.000	0.118	28.30	0.000	0.000	0.000	0.000	0.000	0.000	0.000	0.000	24.40	100.00		ma110408_rel_withdbg.cz12b_c32r128
102450	1639196	0.000	0.000	0.188	16.00	40122.5	1135258	0.000	0.000	0.121	28.30	0.000	0.000	0.000	0.000	0.000	0.000	0.000	0.000	24.41	100.00		ma110803_rel_withdbg.cz12b_c32r128
103402	1654433	0.000	0.000	0.191	16.00	40437.2	1148152	0.000	0.000	0.118	28.39	0.000	0.000	0.000	0.000	0.000	0.000	0.000	0.000	24.78	100.00		ma120101_rel_withdbg.cz12b_c32r128
103363	1653800	0.000	0.000	0.189	16.00	40553.5	1147627	0.000	0.000	0.117	28.30	0.000	0.000	0.000	0.000	0.000	0.000	0.000	0.000	24.57	100.00		ma120101_mdev16168_rel_withdbg.cz12b_c32r128
l.i0
l.i0: load without secondary indexes
Performance metrics for all DBMS, not just the ones listed above. Some are normalized by throughput, others are not. Legend for results is here.
ips	qps	rps	rmbps	wps	wmbps	rpq	rkbpq	wpi	wkbpi	csps	cpups	cspq	cpupq	dbgb1	dbgb2	rss	maxop	p50	p99	tag
322035	0	1	0.0	2270.6	94.6	0.000	0.000	0.007	0.301	927491	50.9	2.880	76	263.2	365.1	101.2	0.550	16083	14384	ma100623_rel_withdbg.cz12a_c32r128
1027221	0	5	0.1	7282.6	309.4	0.000	0.000	0.007	0.308	188072	58.4	0.183	27	263.2	365.1	101.2	0.648	52344	30167	ma101114_rel_withdbg.cz12a_c32r128
957625	0	7	0.1	6043.3	276.4	0.000	0.000	0.006	0.296	171873	57.8	0.179	29	263.2	365.1	101.1	0.693	48348	26571	ma110408_rel_withdbg.cz12b_c32r128
1013171	0	3	0.0	6370.0	292.2	0.000	0.000	0.006	0.295	182470	58.3	0.180	28	263.2	365.1	101.2	0.690	51044	39957	ma110803_rel_withdbg.cz12b_c32r128
1004268	0	5	0.1	6179.4	287.3	0.000	0.000	0.006	0.293	178307	59.0	0.178	28	263.2	365.1	101.2	0.713	50645	41355	ma120101_rel_withdbg.cz12b_c32r128
1410935	0	6	0.1	8211.6	370.4	0.000	0.000	0.006	0.269	241658	49.7	0.171	17	263.2	364.0	101.2	0.309	70147	58456	ma120101_mdev16168_rel_withdbg.cz12b_c32r128
l.x
l.x: create secondary indexes
Performance metrics for all DBMS, not just the ones listed above. Some are normalized by throughput, others are not. Legend for results is here.
ips	qps	rps	rmbps	wps	wmbps	rpq	rkbpq	wpi	wkbpi	csps	cpups	cspq	cpupq	dbgb1	dbgb2	rss	maxop	p50	p99	tag
1564945	0	17128	1395.6	19168.8	1562.6	0.011	0.913	0.012	1.022	105530	23.3	0.067	7	557.5	659.4	101.5	0.005	NA	NA	ma100623_rel_withdbg.cz12a_c32r128
1584786	0	17307	1406.1	19751.6	1581.8	0.011	0.909	0.012	1.022	106423	25.1	0.067	8	557.5	659.4	100.8	0.002	NA	NA	ma101114_rel_withdbg.cz12a_c32r128
1546192	0	16844	1382.4	19340.6	1544.4	0.011	0.916	0.013	1.023	100078	25.2	0.065	8	557.5	659.4	100.8	0.004	NA	NA	ma110408_rel_withdbg.cz12b_c32r128
1565558	0	17024	1396.6	20480.3	1577.6	0.011	0.913	0.013	1.032	115982	23.9	0.074	7	557.5	659.4	100.7	0.004	NA	NA	ma110803_rel_withdbg.cz12b_c32r128
1537279	0	16749	1373.8	20104.5	1549.2	0.011	0.915	0.013	1.032	108785	24.7	0.071	8	557.5	659.4	100.7	0.004	NA	NA	ma120101_rel_withdbg.cz12b_c32r128
1615509	0	17589	1445.1	19617.1	1603.7	0.011	0.916	0.012	1.016	109482	24.1	0.068	7	557.5	658.3	100.7	0.004	NA	NA	ma120101_mdev16168_rel_withdbg.cz12b_c32r128
l.i1
l.i1: continue load after secondary indexes created with 50 inserts per transaction
Performance metrics for all DBMS, not just the ones listed above. Some are normalized by throughput, others are not. Legend for results is here.
ips	qps	rps	rmbps	wps	wmbps	rpq	rkbpq	wpi	wkbpi	csps	cpups	cspq	cpupq	dbgb1	dbgb2	rss	maxop	p50	p99	tag
9715	0	58043	906.9	57222.8	1566.9	5.975	95.595	5.890	165.164	817251	17.0	84.126	840	728.6	830.8	100.4	0.562	549	150	ma100623_rel_withdbg.cz12a_c32r128
8619	0	51655	807.1	50703.4	1386.4	5.993	95.894	5.883	164.716	936798	17.1	108.692	952	730.1	832.3	100.4	0.702	450	150	ma101114_rel_withdbg.cz12a_c32r128
8270	0	50028	781.6	49968.4	1340.9	6.050	96.790	6.042	166.047	1011506	16.7	122.318	969	730.1	832.4	100.4	0.900	400	150	ma110408_rel_withdbg.cz12b_c32r128
8265	0	49908	779.8	49680.0	1334.7	6.038	96.606	6.011	165.361	1018980	16.6	123.284	964	730.3	832.5	100.4	0.822	450	150	ma110803_rel_withdbg.cz12b_c32r128
8305	0	50159	783.7	49755.5	1339.8	6.040	96.634	5.991	165.198	1012811	16.5	121.956	954	730.2	832.5	100.5	0.790	450	150	ma120101_rel_withdbg.cz12b_c32r128
8336	0	50336	786.5	50445.0	1350.9	6.039	96.612	6.052	165.942	1018823	16.6	122.221	956	730.2	832.4	100.4	0.979	450	150	ma120101_mdev16168_rel_withdbg.cz12b_c32r128
l.i2
l.i2: continue load after secondary indexes created with 5 inserts per transaction
Performance metrics for all DBMS, not just the ones listed above. Some are normalized by throughput, others are not. Legend for results is here.
ips	qps	rps	rmbps	wps	wmbps	rpq	rkbpq	wpi	wkbpi	csps	cpups	cspq	cpupq	dbgb1	dbgb2	rss	maxop	p50	p99	tag
8140	0	54606	853.2	51405.7	1430.8	6.708	107.334	6.315	179.994	715906	16.1	87.949	949	728.6	830.8	100.4	0.242	524	90	ma100623_rel_withdbg.cz12a_c32r128
8217	0	55157	861.9	51819.2	1441.4	6.713	107.407	6.306	179.628	709242	16.1	86.315	941	730.1	832.3	100.4	0.197	525	90	ma101114_rel_withdbg.cz12a_c32r128
8580	0	58198	909.3	51237.4	1427.2	6.783	108.527	5.972	170.330	696891	16.2	81.223	906	730.1	832.4	100.4	0.268	579	95	ma110408_rel_withdbg.cz12b_c32r128
8643	0	58571	915.2	51662.9	1438.9	6.777	108.426	5.977	170.477	702731	16.2	81.306	900	730.3	832.5	100.3	0.215	579	95	ma110803_rel_withdbg.cz12b_c32r128
8602	0	58307	911.0	51129.7	1428.7	6.778	108.451	5.944	170.072	696756	16.1	80.998	898	730.2	832.5	100.3	0.218	579	95	ma120101_rel_withdbg.cz12b_c32r128
8688	0	58885	920.1	51852.7	1444.2	6.778	108.443	5.968	170.222	706541	16.2	81.324	895	730.2	832.4	100.3	0.235	579	95	ma120101_mdev16168_rel_withdbg.cz12b_c32r128
qr100.L1
qr100.L1: range queries with 100 insert/s per client
Performance metrics for all DBMS, not just the ones listed above. Some are normalized by throughput, others are not. Legend for results is here.
ips	qps	rps	rmbps	wps	wmbps	rpq	rkbpq	wpi	wkbpi	csps	cpups	cspq	cpupq	dbgb1	dbgb2	rss	maxop	p50	p99	tag
1987	203898	8765	137.0	7076.8	197.1	0.043	0.688	3.561	101.584	1251235	44.5	6.137	105	728.6	830.8	100.4	0.047	10357	9430	ma100623_rel_withdbg.cz12a_c32r128
1988	203291	8771	137.0	7057.8	196.4	0.043	0.690	3.551	101.176	1242490	44.5	6.112	105	730.1	832.3	100.4	0.072	10357	9449	ma101114_rel_withdbg.cz12a_c32r128
1987	200829	8801	137.5	7123.5	198.1	0.044	0.701	3.586	102.110	1226939	44.5	6.109	106	730.1	832.4	100.4	0.079	10181	9334	ma110408_rel_withdbg.cz12b_c32r128
1987	200466	8814	137.7	7136.6	198.5	0.044	0.703	3.591	102.266	1225931	44.5	6.115	107	730.3	832.5	100.3	0.083	10229	9430	ma110803_rel_withdbg.cz12b_c32r128
1987	199066	8797	137.5	7099.8	198.1	0.044	0.707	3.574	102.107	1215692	44.4	6.107	107	730.2	832.5	100.4	0.084	10085	9366	ma120101_rel_withdbg.cz12b_c32r128
1987	198713	8801	137.5	7121.2	198.1	0.044	0.709	3.584	102.114	1214462	44.4	6.112	107	730.2	832.4	100.4	0.077	10085	9286	ma120101_mdev16168_rel_withdbg.cz12b_c32r128
qp100.L2
qp100.L2: point queries with 100 insert/s per client
Performance metrics for all DBMS, not just the ones listed above. Some are normalized by throughput, others are not. Legend for results is here.
ips	qps	rps	rmbps	wps	wmbps	rpq	rkbpq	wpi	wkbpi	csps	cpups	cspq	cpupq	dbgb1	dbgb2	rss	maxop	p50	p99	tag
1987	19970	143910	2248.6	11601.7	319.9	7.206	115.300	5.840	164.907	525651	14.2	26.322	341	728.6	830.8	100.4	0.112	1023	559	ma100623_rel_withdbg.cz12a_c32r128
1988	19394	140388	2193.6	11585.1	319.4	7.239	115.821	5.828	164.559	575410	15.8	29.670	391	730.1	832.3	100.4	0.116	991	559	ma101114_rel_withdbg.cz12a_c32r128
1987	19472	140568	2196.4	11486.9	316.6	7.219	115.501	5.780	163.138	571384	15.7	29.343	387	730.1	832.4	100.4	0.173	991	543	ma110408_rel_withdbg.cz12b_c32r128
1987	19575	141087	2204.5	11482.5	316.3	7.207	115.319	5.780	163.035	572669	15.3	29.255	375	730.3	832.5	100.4	0.145	991	544	ma110803_rel_withdbg.cz12b_c32r128
1987	19507	140662	2198.0	11446.2	316.4	7.211	115.379	5.761	163.106	574056	15.6	29.428	384	730.2	832.5	100.4	0.134	991	543	ma120101_rel_withdbg.cz12b_c32r128
1987	19587	141186	2206.0	11481.9	316.3	7.208	115.330	5.779	163.051	570523	15.7	29.128	385	730.2	832.4	100.4	0.141	1006	559	ma120101_mdev16168_rel_withdbg.cz12b_c32r128
qr500.L3
qr500.L3: range queries with 500 insert/s per client
Performance metrics for all DBMS, not just the ones listed above. Some are normalized by throughput, others are not. Legend for results is here.
ips	qps	rps	rmbps	wps	wmbps	rpq	rkbpq	wpi	wkbpi	csps	cpups	cspq	cpupq	dbgb1	dbgb2	rss	maxop	p50	p99	tag
9936	158867	41478	648.1	38258.0	1062.3	0.261	4.177	3.850	109.474	1396878	51.8	8.793	157	728.6	830.8	100.4	0.194	8119	5818	ma100623_rel_withdbg.cz12a_c32r128
9939	141520	41528	648.9	38184.1	1060.0	0.293	4.695	3.842	109.204	1466993	49.9	10.366	169	730.1	832.3	100.5	0.210	7336	4571	ma101114_rel_withdbg.cz12a_c32r128
9934	139982	41721	651.9	36894.7	1025.0	0.298	4.769	3.714	105.662	1453078	48.8	10.380	167	730.1	832.4	100.5	0.208	7305	3500	ma110408_rel_withdbg.cz12b_c32r128
9934	141339	41724	651.9	36814.8	1022.7	0.295	4.723	3.706	105.426	1448596	48.7	10.249	165	730.3	832.5	100.4	0.221	7448	3692	ma110803_rel_withdbg.cz12b_c32r128
9936	142687	41769	652.6	36713.4	1023.3	0.293	4.684	3.695	105.451	1435983	49.1	10.064	165	730.2	832.5	100.4	0.221	7592	3581	ma120101_rel_withdbg.cz12b_c32r128
9934	142998	41722	651.9	36765.1	1021.2	0.292	4.668	3.701	105.273	1433062	49.1	10.022	165	730.2	832.4	100.4	0.215	7610	3709	ma120101_mdev16168_rel_withdbg.cz12b_c32r128
qp500.L4
qp500.L4: point queries with 500 insert/s per client
Performance metrics for all DBMS, not just the ones listed above. Some are normalized by throughput, others are not. Legend for results is here.
ips	qps	rps	rmbps	wps	wmbps	rpq	rkbpq	wpi	wkbpi	csps	cpups	cspq	cpupq	dbgb1	dbgb2	rss	maxop	p50	p99	tag
9920	10599	135167	2112.0	45381.5	1256.4	12.753	204.047	4.575	129.689	789197	20.7	74.460	937	728.6	830.8	100.4	0.227	543	240	ma100623_rel_withdbg.cz12a_c32r128
6027	5444	78459	1225.9	33011.1	910.9	14.413	230.600	5.477	154.761	1138741	19.3	209.181	1702	730.3	832.5	100.5	0.206	144	64	ma101114_rel_withdbg.cz12a_c32r128
5840	5121	74962	1171.3	32739.0	902.7	14.637	234.190	5.606	158.271	1186312	18.8	231.638	1762	730.3	832.6	100.5	0.277	112	48	ma110408_rel_withdbg.cz12b_c32r128
5747	5051	73884	1154.4	32239.7	888.9	14.627	234.030	5.610	158.381	1197654	18.6	237.103	1768	730.4	832.8	100.4	0.231	112	48	ma110803_rel_withdbg.cz12b_c32r128
5912	5152	75608	1181.4	33018.4	913.4	14.677	234.828	5.585	158.198	1188421	18.6	230.694	1733	730.4	832.7	100.4	0.222	112	48	ma120101_rel_withdbg.cz12b_c32r128
5912	5159	75699	1182.8	33124.2	913.3	14.674	234.787	5.603	158.176	1196543	18.8	231.951	1749	730.4	832.7	100.4	0.220	112	48	ma120101_mdev16168_rel_withdbg.cz12b_c32r128
qr1000.L5
qr1000.L5: range queries with 1000 insert/s per client
Performance metrics for all DBMS, not just the ones listed above. Some are normalized by throughput, others are not. Legend for results is here.
ips	qps	rps	rmbps	wps	wmbps	rpq	rkbpq	wpi	wkbpi	csps	cpups	cspq	cpupq	dbgb1	dbgb2	rss	maxop	p50	p99	tag
9779	106458	50239	785.0	49526.8	1369.4	0.472	7.551	5.065	143.406	1345616	51.4	12.640	232	728.8	831.1	100.5	0.292	5450	3628	ma100623_rel_withdbg.cz12a_c32r128
7631	105688	43406	678.2	42182.5	1167.2	0.411	6.571	5.528	156.623	1404182	48.6	13.286	221	730.3	832.6	100.5	0.267	5370	3580	ma101114_rel_withdbg.cz12a_c32r128
7646	96466	43691	682.7	42577.3	1177.9	0.453	7.247	5.568	157.741	1415910	46.7	14.678	232	730.4	832.7	100.4	0.251	4923	2222	ma110408_rel_withdbg.cz12b_c32r128
7592	97069	43393	678.0	42288.7	1169.9	0.447	7.153	5.570	157.803	1424444	46.4	14.675	229	730.5	832.8	100.4	0.215	5003	2159	ma110803_rel_withdbg.cz12b_c32r128
7663	97256	43802	684.4	42536.1	1180.7	0.450	7.206	5.551	157.785	1420689	46.6	14.608	230	730.5	832.8	100.4	0.260	5019	2302	ma120101_rel_withdbg.cz12b_c32r128
7711	97423	44050	688.3	42911.4	1187.2	0.452	7.235	5.565	157.647	1426415	46.6	14.642	230	730.4	832.7	100.4	0.231	5035	2222	ma120101_mdev16168_rel_withdbg.cz12b_c32r128
qp1000.L6
qp1000.L6: point queries with 1000 insert/s per client
Performance metrics for all DBMS, not just the ones listed above. Some are normalized by throughput, others are not. Legend for results is here.
ips	qps	rps	rmbps	wps	wmbps	rpq	rkbpq	wpi	wkbpi	csps	cpups	cspq	cpupq	dbgb1	dbgb2	rss	maxop	p50	p99	tag
7499	8999	123860	1935.3	48033.1	1327.7	13.764	220.222	6.405	181.296	877224	20.3	97.481	1083	728.9	831.2	100.4	0.246	479	112	ma100623_rel_withdbg.cz12a_c32r128
6350	7854	106542	1664.7	40823.6	1128.3	13.565	217.038	6.429	181.942	1013020	20.0	128.978	1222	730.4	832.7	100.5	0.210	463	80	ma101114_rel_withdbg.cz12a_c32r128
6163	7586	102946	1608.5	40300.7	1113.6	13.570	217.114	6.539	185.037	1044107	19.6	137.627	1240	730.4	832.8	100.4	0.282	448	64	ma110408_rel_withdbg.cz12b_c32r128
6138	7545	102450	1600.8	40122.5	1108.7	13.578	217.247	6.537	184.953	1058985	19.2	140.350	1221	730.6	832.9	100.4	0.222	432	64	ma110803_rel_withdbg.cz12b_c32r128
6205	7599	103402	1615.7	40437.2	1121.2	13.607	217.709	6.517	185.031	1043469	19.4	137.311	1225	730.5	832.8	100.4	0.205	448	64	ma120101_rel_withdbg.cz12b_c32r128
6214	7592	103363	1615.0	40553.5	1120.7	13.614	217.829	6.526	184.675	1050351	19.5	138.346	1233	730.5	832.8	100.4	0.226	448	64	ma120101_mdev16168_rel_withdbg.cz12b_c32r128
l.i0
- l.i0: load without secondary indexes
- Legend for results is here.
- Each entry lists the percentage of responses that fit in that bucket (slower than max time for previous bucket, faster than min time for next bucket).
Insert response time histogram
256us	1ms	4ms	16ms	64ms	256ms	1s	4s	16s	gt	max	tag
0.000	0.076	0.478	97.042	2.318	0.085	nonzero	0.000	0.000	0.000	0.550	ma100623_rel_withdbg.cz12a_c32r128
0.000	0.757	98.321	0.665	0.163	0.090	0.003	0.000	0.000	0.000	0.648	ma101114_rel_withdbg.cz12a_c32r128
0.000	0.669	97.871	1.200	0.169	0.088	0.003	0.000	0.000	0.000	0.693	ma110408_rel_withdbg.cz12b_c32r128
0.000	0.577	98.501	0.662	0.171	0.088	0.001	0.000	0.000	0.000	0.690	ma110803_rel_withdbg.cz12b_c32r128
0.000	0.786	98.601	0.356	0.168	0.088	nonzero	0.000	0.000	0.000	0.713	ma120101_rel_withdbg.cz12b_c32r128
0.000	3.258	96.409	0.079	0.169	0.085	nonzero	0.000	0.000	0.000	0.309	ma120101_mdev16168_rel_withdbg.cz12b_c32r128
l.x
- l.x: create secondary indexes
- Legend for results is here.
- Each entry lists the percentage of responses that fit in that bucket (slower than max time for previous bucket, faster than min time for next bucket).
TODO - determine whether there is data for create index response time
l.i1
- l.i1: continue load after secondary indexes created with 50 inserts per transaction
- Legend for results is here.
- Each entry lists the percentage of responses that fit in that bucket (slower than max time for previous bucket, faster than min time for next bucket).
Insert response time histogram
256us	1ms	4ms	16ms	64ms	256ms	1s	4s	16s	gt	max	tag
0.000	0.000	0.000	0.085	57.619	23.436	18.859	0.000	0.000	0.000	0.562	ma100623_rel_withdbg.cz12a_c32r128
0.000	0.000	0.000	0.155	35.710	44.487	19.647	0.000	0.000	0.000	0.702	ma101114_rel_withdbg.cz12a_c32r128
0.000	0.000	0.000	0.275	27.766	52.651	19.308	0.000	0.000	0.000	0.900	ma110408_rel_withdbg.cz12b_c32r128
0.000	0.000	0.000	0.325	27.741	52.793	19.141	0.000	0.000	0.000	0.822	ma110803_rel_withdbg.cz12b_c32r128
0.000	0.000	0.000	0.335	28.373	52.121	19.170	0.000	0.000	0.000	0.790	ma120101_rel_withdbg.cz12b_c32r128
0.000	0.000	0.000	0.297	28.030	52.675	18.999	0.000	0.000	0.000	0.979	ma120101_mdev16168_rel_withdbg.cz12b_c32r128
Delete response time histogram
256us	1ms	4ms	16ms	64ms	256ms	1s	4s	16s	gt	max	tag
0.000	0.000	0.000	0.216	73.619	7.729	18.436	0.000	0.000	0.000	0.522	ma100623_rel_withdbg.cz12a_c32r128
0.000	0.000	0.000	2.194	61.981	16.564	19.261	0.000	0.000	0.000	0.477	ma101114_rel_withdbg.cz12a_c32r128
0.000	0.000	0.000	2.304	48.672	30.096	18.927	0.000	0.000	0.000	0.561	ma110408_rel_withdbg.cz12b_c32r128
0.000	0.000	0.000	2.596	48.034	30.601	18.768	0.000	0.000	0.000	0.520	ma110803_rel_withdbg.cz12b_c32r128
0.000	0.000	0.000	2.529	48.789	29.895	18.787	0.000	0.000	0.000	0.736	ma120101_rel_withdbg.cz12b_c32r128
0.000	0.000	0.000	2.402	49.279	29.628	18.691	0.000	0.000	0.000	0.539	ma120101_mdev16168_rel_withdbg.cz12b_c32r128
l.i2
- l.i2: continue load after secondary indexes created with 5 inserts per transaction
- Legend for results is here.
- Each entry lists the percentage of responses that fit in that bucket (slower than max time for previous bucket, faster than min time for next bucket).
Insert response time histogram
256us	1ms	4ms	16ms	64ms	256ms	1s	4s	16s	gt	max	tag
0.000	0.075	52.864	17.928	28.934	0.199	0.000	0.000	0.000	0.000	0.242	ma100623_rel_withdbg.cz12a_c32r128
nonzero	0.589	55.982	13.629	29.585	0.215	0.000	0.000	0.000	0.000	0.197	ma101114_rel_withdbg.cz12a_c32r128
0.000	0.717	57.684	12.985	28.484	0.129	nonzero	0.000	0.000	0.000	0.268	ma110408_rel_withdbg.cz12b_c32r128
nonzero	0.786	57.545	13.259	28.294	0.115	0.000	0.000	0.000	0.000	0.215	ma110803_rel_withdbg.cz12b_c32r128
nonzero	0.787	57.216	13.444	28.448	0.105	0.000	0.000	0.000	0.000	0.218	ma120101_rel_withdbg.cz12b_c32r128
nonzero	0.835	57.559	13.313	28.174	0.119	0.000	0.000	0.000	0.000	0.235	ma120101_mdev16168_rel_withdbg.cz12b_c32r128
Delete response time histogram
256us	1ms	4ms	16ms	64ms	256ms	1s	4s	16s	gt	max	tag
0.000	0.182	60.511	10.467	28.755	0.085	0.000	0.000	0.000	0.000	0.180	ma100623_rel_withdbg.cz12a_c32r128
nonzero	1.860	61.182	7.554	29.324	0.080	0.000	0.000	0.000	0.000	0.161	ma101114_rel_withdbg.cz12a_c32r128
nonzero	1.706	62.597	7.374	28.226	0.097	0.000	0.000	0.000	0.000	0.237	ma110408_rel_withdbg.cz12b_c32r128
nonzero	1.785	62.596	7.498	28.040	0.081	0.000	0.000	0.000	0.000	0.211	ma110803_rel_withdbg.cz12b_c32r128
nonzero	1.760	62.332	7.638	28.195	0.075	0.000	0.000	0.000	0.000	0.217	ma120101_rel_withdbg.cz12b_c32r128
nonzero	1.857	62.508	7.639	27.908	0.088	0.000	0.000	0.000	0.000	0.207	ma120101_mdev16168_rel_withdbg.cz12b_c32r128
qr100.L1
- qr100.L1: range queries with 100 insert/s per client
- Legend for results is here.
- Each entry lists the percentage of responses that fit in that bucket (slower than max time for previous bucket, faster than min time for next bucket).
Query response time histogram
256us	1ms	4ms	16ms	64ms	256ms	1s	4s	16s	gt	max	tag
99.648	0.328	0.023	0.001	nonzero	0.000	0.000	0.000	0.000	0.000	0.047	ma100623_rel_withdbg.cz12a_c32r128
99.598	0.376	0.026	0.001	nonzero	nonzero	0.000	0.000	0.000	0.000	0.072	ma101114_rel_withdbg.cz12a_c32r128
99.581	0.392	0.027	0.001	nonzero	nonzero	0.000	0.000	0.000	0.000	0.079	ma110408_rel_withdbg.cz12b_c32r128
99.591	0.382	0.026	0.001	nonzero	nonzero	0.000	0.000	0.000	0.000	0.083	ma110803_rel_withdbg.cz12b_c32r128
99.607	0.369	0.024	0.001	nonzero	nonzero	0.000	0.000	0.000	0.000	0.084	ma120101_rel_withdbg.cz12b_c32r128
99.594	0.380	0.025	0.001	nonzero	nonzero	0.000	0.000	0.000	0.000	0.077	ma120101_mdev16168_rel_withdbg.cz12b_c32r128
Insert response time histogram
256us	1ms	4ms	16ms	64ms	256ms	1s	4s	16s	gt	max	tag
0.000	0.000	0.000	11.672	88.275	0.053	0.000	0.000	0.000	0.000	0.095	ma100623_rel_withdbg.cz12a_c32r128
0.000	0.000	0.000	30.410	69.403	0.187	0.000	0.000	0.000	0.000	0.147	ma101114_rel_withdbg.cz12a_c32r128
0.000	0.000	0.000	33.926	65.960	0.114	0.000	0.000	0.000	0.000	0.131	ma110408_rel_withdbg.cz12b_c32r128
0.000	0.000	0.000	34.036	65.862	0.101	0.000	0.000	0.000	0.000	0.117	ma110803_rel_withdbg.cz12b_c32r128
0.000	0.000	0.000	45.364	54.476	0.160	0.000	0.000	0.000	0.000	0.128	ma120101_rel_withdbg.cz12b_c32r128
0.000	0.000	0.000	38.399	61.442	0.160	0.000	0.000	0.000	0.000	0.126	ma120101_mdev16168_rel_withdbg.cz12b_c32r128
Delete response time histogram
256us	1ms	4ms	16ms	64ms	256ms	1s	4s	16s	gt	max	tag
0.000	0.000	0.000	20.840	79.128	0.031	0.000	0.000	0.000	0.000	0.089	ma100623_rel_withdbg.cz12a_c32r128
0.000	0.000	0.000	67.243	32.669	0.088	0.000	0.000	0.000	0.000	0.129	ma101114_rel_withdbg.cz12a_c32r128
0.000	0.000	0.000	61.539	38.390	0.072	0.000	0.000	0.000	0.000	0.122	ma110408_rel_withdbg.cz12b_c32r128
0.000	0.000	0.000	62.806	37.135	0.058	0.000	0.000	0.000	0.000	0.105	ma110803_rel_withdbg.cz12b_c32r128
0.000	0.000	0.000	68.112	31.790	0.097	0.000	0.000	0.000	0.000	0.123	ma120101_rel_withdbg.cz12b_c32r128
0.000	0.000	0.000	65.475	34.434	0.091	0.000	0.000	0.000	0.000	0.121	ma120101_mdev16168_rel_withdbg.cz12b_c32r128
qp100.L2
- qp100.L2: point queries with 100 insert/s per client
- Legend for results is here.
- Each entry lists the percentage of responses that fit in that bucket (slower than max time for previous bucket, faster than min time for next bucket).
Query response time histogram
256us	1ms	4ms	16ms	64ms	256ms	1s	4s	16s	gt	max	tag
0.025	68.719	31.150	0.104	0.002	nonzero	0.000	0.000	0.000	0.000	0.112	ma100623_rel_withdbg.cz12a_c32r128
0.015	64.978	34.892	0.112	0.003	nonzero	0.000	0.000	0.000	0.000	0.116	ma101114_rel_withdbg.cz12a_c32r128
0.016	64.801	35.127	0.052	0.004	nonzero	0.000	0.000	0.000	0.000	0.173	ma110408_rel_withdbg.cz12b_c32r128
0.020	65.273	34.657	0.047	0.003	nonzero	0.000	0.000	0.000	0.000	0.145	ma110803_rel_withdbg.cz12b_c32r128
0.017	65.494	34.417	0.067	0.004	nonzero	0.000	0.000	0.000	0.000	0.134	ma120101_rel_withdbg.cz12b_c32r128
0.017	65.621	34.310	0.050	0.002	nonzero	0.000	0.000	0.000	0.000	0.141	ma120101_mdev16168_rel_withdbg.cz12b_c32r128
Insert response time histogram
256us	1ms	4ms	16ms	64ms	256ms	1s	4s	16s	gt	max	tag
0.000	0.000	0.000	0.111	99.143	0.746	0.000	0.000	0.000	0.000	0.227	ma100623_rel_withdbg.cz12a_c32r128
0.000	0.000	0.000	0.106	99.126	0.767	0.001	0.000	0.000	0.000	0.268	ma101114_rel_withdbg.cz12a_c32r128
0.000	0.000	0.000	0.110	99.010	0.869	0.010	0.000	0.000	0.000	0.326	ma110408_rel_withdbg.cz12b_c32r128
0.000	0.000	0.000	0.163	99.203	0.625	0.010	0.000	0.000	0.000	0.365	ma110803_rel_withdbg.cz12b_c32r128
0.000	0.000	0.000	0.110	99.060	0.817	0.013	0.000	0.000	0.000	0.356	ma120101_rel_withdbg.cz12b_c32r128
0.000	0.000	0.000	0.137	99.424	0.438	0.000	0.000	0.000	0.000	0.236	ma120101_mdev16168_rel_withdbg.cz12b_c32r128
Delete response time histogram
256us	1ms	4ms	16ms	64ms	256ms	1s	4s	16s	gt	max	tag
0.000	0.000	0.000	0.164	99.372	0.465	0.000	0.000	0.000	0.000	0.183	ma100623_rel_withdbg.cz12a_c32r128
0.000	0.000	0.000	0.172	99.317	0.510	0.000	0.000	0.000	0.000	0.218	ma101114_rel_withdbg.cz12a_c32r128
0.000	0.000	0.000	0.178	99.138	0.682	0.002	0.000	0.000	0.000	0.282	ma110408_rel_withdbg.cz12b_c32r128
0.000	0.000	0.000	0.248	99.253	0.497	0.002	0.000	0.000	0.000	0.287	ma110803_rel_withdbg.cz12b_c32r128
0.000	0.000	0.000	0.149	99.152	0.696	0.003	0.000	0.000	0.000	0.309	ma120101_rel_withdbg.cz12b_c32r128
0.000	0.000	0.000	0.202	99.474	0.324	0.000	0.000	0.000	0.000	0.203	ma120101_mdev16168_rel_withdbg.cz12b_c32r128
qr500.L3
- qr500.L3: range queries with 500 insert/s per client
- Legend for results is here.
- Each entry lists the percentage of responses that fit in that bucket (slower than max time for previous bucket, faster than min time for next bucket).
Query response time histogram
256us	1ms	4ms	16ms	64ms	256ms	1s	4s	16s	gt	max	tag
97.252	2.520	0.213	0.014	0.001	nonzero	0.000	0.000	0.000	0.000	0.194	ma100623_rel_withdbg.cz12a_c32r128
95.791	3.783	0.350	0.070	0.006	nonzero	0.000	0.000	0.000	0.000	0.210	ma101114_rel_withdbg.cz12a_c32r128
96.326	3.312	0.265	0.076	0.020	0.001	0.000	0.000	0.000	0.000	0.208	ma110408_rel_withdbg.cz12b_c32r128
96.415	3.231	0.262	0.072	0.019	0.001	0.000	0.000	0.000	0.000	0.221	ma110803_rel_withdbg.cz12b_c32r128
96.533	3.130	0.255	0.064	0.017	nonzero	0.000	0.000	0.000	0.000	0.221	ma120101_rel_withdbg.cz12b_c32r128
96.567	3.102	0.250	0.063	0.017	nonzero	0.000	0.000	0.000	0.000	0.215	ma120101_mdev16168_rel_withdbg.cz12b_c32r128
Insert response time histogram
256us	1ms	4ms	16ms	64ms	256ms	1s	4s	16s	gt	max	tag
0.000	0.000	0.000	0.298	95.128	4.562	0.012	0.000	0.000	0.000	0.322	ma100623_rel_withdbg.cz12a_c32r128
0.000	0.000	0.000	6.298	75.215	18.399	0.088	0.000	0.000	0.000	0.383	ma101114_rel_withdbg.cz12a_c32r128
0.000	0.000	0.000	12.125	69.389	18.374	0.112	0.000	0.000	0.000	0.402	ma110408_rel_withdbg.cz12b_c32r128
0.000	0.000	0.000	12.369	69.997	17.521	0.113	0.000	0.000	0.000	0.431	ma110803_rel_withdbg.cz12b_c32r128
0.000	0.000	0.000	13.401	70.476	16.049	0.074	0.000	0.000	0.000	0.500	ma120101_rel_withdbg.cz12b_c32r128
0.000	0.000	0.000	13.721	70.408	15.797	0.074	0.000	0.000	0.000	0.417	ma120101_mdev16168_rel_withdbg.cz12b_c32r128
Delete response time histogram
256us	1ms	4ms	16ms	64ms	256ms	1s	4s	16s	gt	max	tag
0.000	0.000	0.000	0.166	96.129	3.704	0.001	0.000	0.000	0.000	0.286	ma100623_rel_withdbg.cz12a_c32r128
0.000	0.000	0.000	25.331	56.857	17.793	0.019	0.000	0.000	0.000	0.321	ma101114_rel_withdbg.cz12a_c32r128
0.000	0.000	0.000	28.733	55.061	16.161	0.045	0.000	0.000	0.000	0.366	ma110408_rel_withdbg.cz12b_c32r128
0.000	0.000	0.000	29.616	54.840	15.493	0.051	0.000	0.000	0.000	0.372	ma110803_rel_withdbg.cz12b_c32r128
0.000	0.000	0.000	30.503	55.440	14.029	0.028	0.000	0.000	0.000	0.399	ma120101_rel_withdbg.cz12b_c32r128
0.000	0.000	0.000	31.392	54.816	13.765	0.027	0.000	0.000	0.000	0.368	ma120101_mdev16168_rel_withdbg.cz12b_c32r128
qp500.L4
- qp500.L4: point queries with 500 insert/s per client
- Legend for results is here.
- Each entry lists the percentage of responses that fit in that bucket (slower than max time for previous bucket, faster than min time for next bucket).
Query response time histogram
256us	1ms	4ms	16ms	64ms	256ms	1s	4s	16s	gt	max	tag
nonzero	11.153	87.557	1.251	0.035	0.005	0.000	0.000	0.000	0.000	0.227	ma100623_rel_withdbg.cz12a_c32r128
nonzero	7.214	75.887	12.971	3.914	0.012	0.000	0.000	0.000	0.000	0.206	ma101114_rel_withdbg.cz12a_c32r128
nonzero	7.631	76.517	10.943	4.833	0.075	nonzero	0.000	0.000	0.000	0.277	ma110408_rel_withdbg.cz12b_c32r128
nonzero	7.943	76.054	10.923	4.993	0.085	0.000	0.000	0.000	0.000	0.231	ma110803_rel_withdbg.cz12b_c32r128
nonzero	7.663	76.791	10.667	4.805	0.074	0.000	0.000	0.000	0.000	0.222	ma120101_rel_withdbg.cz12b_c32r128
nonzero	7.977	76.392	10.736	4.821	0.073	0.000	0.000	0.000	0.000	0.220	ma120101_mdev16168_rel_withdbg.cz12b_c32r128
Insert response time histogram
256us	1ms	4ms	16ms	64ms	256ms	1s	4s	16s	gt	max	tag
0.000	0.000	0.000	3.244	96.056	0.685	0.015	0.000	0.000	0.000	0.365	ma100623_rel_withdbg.cz12a_c32r128
0.000	0.000	0.000	0.058	17.757	59.628	22.556	0.000	0.000	0.000	0.774	ma101114_rel_withdbg.cz12a_c32r128
0.000	0.000	0.000	0.047	16.081	58.233	25.639	0.000	0.000	0.000	0.681	ma110408_rel_withdbg.cz12b_c32r128
0.000	0.000	0.000	0.068	15.427	58.266	26.238	0.000	0.000	0.000	0.782	ma110803_rel_withdbg.cz12b_c32r128
0.000	0.000	0.000	0.060	17.739	56.748	25.453	0.000	0.000	0.000	0.738	ma120101_rel_withdbg.cz12b_c32r128
0.000	0.000	0.000	0.079	17.075	57.626	25.220	0.000	0.000	0.000	0.680	ma120101_mdev16168_rel_withdbg.cz12b_c32r128
Delete response time histogram
256us	1ms	4ms	16ms	64ms	256ms	1s	4s	16s	gt	max	tag
0.000	0.000	0.000	10.865	88.540	0.594	0.001	0.000	0.000	0.000	0.303	ma100623_rel_withdbg.cz12a_c32r128
0.000	0.000	0.000	0.074	19.275	60.270	20.381	0.000	0.000	0.000	0.767	ma101114_rel_withdbg.cz12a_c32r128
0.000	0.000	0.000	0.061	17.456	59.678	22.804	0.000	0.000	0.000	0.680	ma110408_rel_withdbg.cz12b_c32r128
0.000	0.000	0.000	0.086	16.657	60.094	23.163	0.000	0.000	0.000	0.904	ma110803_rel_withdbg.cz12b_c32r128
0.000	0.000	0.000	0.077	19.108	58.269	22.546	0.000	0.000	0.000	0.611	ma120101_rel_withdbg.cz12b_c32r128
0.000	0.000	0.000	0.103	18.515	58.999	22.383	0.000	0.000	0.000	0.632	ma120101_mdev16168_rel_withdbg.cz12b_c32r128
qr1000.L5
- qr1000.L5: range queries with 1000 insert/s per client
- Legend for results is here.
- Each entry lists the percentage of responses that fit in that bucket (slower than max time for previous bucket, faster than min time for next bucket).
Query response time histogram
256us	1ms	4ms	16ms	64ms	256ms	1s	4s	16s	gt	max	tag
92.317	6.007	1.577	0.093	0.005	nonzero	nonzero	0.000	0.000	0.000	0.292	ma100623_rel_withdbg.cz12a_c32r128
91.983	6.439	1.430	0.142	0.006	nonzero	nonzero	0.000	0.000	0.000	0.267	ma101114_rel_withdbg.cz12a_c32r128
91.647	6.666	1.445	0.196	0.045	0.001	0.000	0.000	0.000	0.000	0.251	ma110408_rel_withdbg.cz12b_c32r128
91.692	6.768	1.294	0.198	0.048	nonzero	0.000	0.000	0.000	0.000	0.215	ma110803_rel_withdbg.cz12b_c32r128
91.698	6.773	1.291	0.191	0.046	nonzero	nonzero	0.000	0.000	0.000	0.260	ma120101_rel_withdbg.cz12b_c32r128
91.704	6.831	1.224	0.195	0.045	nonzero	0.000	0.000	0.000	0.000	0.231	ma120101_mdev16168_rel_withdbg.cz12b_c32r128
Insert response time histogram
256us	1ms	4ms	16ms	64ms	256ms	1s	4s	16s	gt	max	tag
0.000	0.000	0.000	0.268	47.104	36.717	15.911	0.000	0.000	0.000	0.572	ma100623_rel_withdbg.cz12a_c32r128
0.000	0.000	0.000	0.271	20.790	56.742	22.197	0.000	0.000	0.000	0.460	ma101114_rel_withdbg.cz12a_c32r128
0.000	0.000	0.000	0.871	23.592	54.024	21.513	0.000	0.000	0.000	0.520	ma110408_rel_withdbg.cz12b_c32r128
0.000	0.000	0.000	0.921	22.724	54.966	21.389	0.000	0.000	0.000	0.476	ma110803_rel_withdbg.cz12b_c32r128
0.000	0.000	0.000	0.913	24.016	53.496	21.574	0.000	0.000	0.000	0.487	ma120101_rel_withdbg.cz12b_c32r128
0.000	0.000	0.000	1.015	23.984	53.773	21.228	0.000	0.000	0.000	0.496	ma120101_mdev16168_rel_withdbg.cz12b_c32r128
Delete response time histogram
256us	1ms	4ms	16ms	64ms	256ms	1s	4s	16s	gt	max	tag
0.000	0.000	0.000	0.375	61.025	22.834	15.765	0.000	0.000	0.000	0.571	ma100623_rel_withdbg.cz12a_c32r128
0.000	0.000	0.000	3.476	36.230	38.391	21.902	0.000	0.000	0.000	0.454	ma101114_rel_withdbg.cz12a_c32r128
0.000	0.000	0.000	3.802	30.741	44.213	21.244	0.000	0.000	0.000	0.515	ma110408_rel_withdbg.cz12b_c32r128
0.000	0.000	0.000	3.720	29.916	45.271	21.093	0.000	0.000	0.000	0.475	ma110803_rel_withdbg.cz12b_c32r128
0.000	0.000	0.000	3.844	31.029	43.835	21.292	0.000	0.000	0.000	0.483	ma120101_rel_withdbg.cz12b_c32r128
0.000	0.000	0.000	3.958	31.169	43.925	20.947	0.000	0.000	0.000	0.491	ma120101_mdev16168_rel_withdbg.cz12b_c32r128
qp1000.L6
- qp1000.L6: point queries with 1000 insert/s per client
- Legend for results is here.
- Each entry lists the percentage of responses that fit in that bucket (slower than max time for previous bucket, faster than min time for next bucket).
Query response time histogram
256us	1ms	4ms	16ms	64ms	256ms	1s	4s	16s	gt	max	tag
nonzero	7.918	87.775	3.987	0.317	0.003	0.000	0.000	0.000	0.000	0.246	ma100623_rel_withdbg.cz12a_c32r128
nonzero	7.671	84.614	6.646	1.065	0.004	0.000	0.000	0.000	0.000	0.210	ma101114_rel_withdbg.cz12a_c32r128
nonzero	8.156	84.163	6.180	1.484	0.017	nonzero	0.000	0.000	0.000	0.282	ma110408_rel_withdbg.cz12b_c32r128
nonzero	8.572	83.675	6.197	1.537	0.019	0.000	0.000	0.000	0.000	0.222	ma110803_rel_withdbg.cz12b_c32r128
nonzero	8.293	84.194	6.009	1.486	0.017	0.000	0.000	0.000	0.000	0.205	ma120101_rel_withdbg.cz12b_c32r128
nonzero	8.357	84.006	6.119	1.501	0.017	0.000	0.000	0.000	0.000	0.226	ma120101_mdev16168_rel_withdbg.cz12b_c32r128
Insert response time histogram
256us	1ms	4ms	16ms	64ms	256ms	1s	4s	16s	gt	max	tag
0.000	0.000	0.000	0.022	46.660	22.194	31.124	0.000	0.000	0.000	0.685	ma100623_rel_withdbg.cz12a_c32r128
0.000	0.000	0.000	0.023	30.707	36.263	33.007	0.000	0.000	0.000	0.566	ma101114_rel_withdbg.cz12a_c32r128
0.000	0.000	0.000	0.031	26.528	39.222	34.219	0.000	0.000	0.000	0.627	ma110408_rel_withdbg.cz12b_c32r128
0.000	0.000	0.000	0.042	26.451	39.235	34.272	0.000	0.000	0.000	0.601	ma110803_rel_withdbg.cz12b_c32r128
0.000	0.000	0.000	0.031	27.891	38.011	34.067	0.000	0.000	0.000	0.620	ma120101_rel_withdbg.cz12b_c32r128
0.000	0.000	0.000	0.036	27.280	38.895	33.789	0.000	0.000	0.000	0.607	ma120101_mdev16168_rel_withdbg.cz12b_c32r128
Delete response time histogram
256us	1ms	4ms	16ms	64ms	256ms	1s	4s	16s	gt	max	tag
0.000	0.000	0.000	0.029	49.734	19.169	31.067	0.000	0.000	0.000	0.677	ma100623_rel_withdbg.cz12a_c32r128
0.000	0.000	0.000	0.030	32.751	34.982	32.237	0.000	0.000	0.000	0.563	ma101114_rel_withdbg.cz12a_c32r128
0.000	0.000	0.000	0.038	28.266	38.463	33.233	0.000	0.000	0.000	0.564	ma110408_rel_withdbg.cz12b_c32r128
0.000	0.000	0.000	0.052	28.092	38.660	33.197	0.000	0.000	0.000	0.536	ma110803_rel_withdbg.cz12b_c32r128
0.000	0.000	0.000	0.038	29.618	37.262	33.082	0.000	0.000	0.000	0.704	ma120101_rel_withdbg.cz12b_c32r128
0.000	0.000	0.000	0.043	29.112	38.036	32.809	0.000	0.000	0.000	0.565	ma120101_mdev16168_rel_withdbg.cz12b_c32r128