Introduction
This is a report for the insert benchmark with 30M docs and 1 client(s). It is generated by scripts (bash, awk, sed) and Tufte might not be impressed. An overview of the insert benchmark is here and a short update is here. Below, by DBMS, I mean DBMS+version.config. An example is my8020.c10b40 where my means MySQL, 8020 is version 8.0.20 and c10b40 is the name for the configuration file.
The test server has 8 AMD cores, 32G RAM and an NVMe device for the database. The benchmark was run with 1 client and there were 1 or 3 connections per client (1 for queries or inserts without rate limits, 1+1 for rate limited inserts+deletes). It uses 1 table with a table per client. It loads 30M rows per table without secondary indexes, creates 3 secondary indexes per table, then inserts 40m+10m rows per table with a delete per insert to avoid growing the table. It then does 6 read+write tests for 1800s each that do queries as fast as possible with 100,100,500,500,1000,1000 inserts/s and the same for deletes/s per client concurrent with the queries. The database is cached by Postgres. Clients and the DBMS share one server.
The tested DBMS are:
- pg1222_o2nofp.cx10a_c8r32 - Postgres 12.22 with my standard config (x10a)
- pg1323_o2nofp.cx10a_c8r32 - Postgres 13.23 with my standard config (x10a)
- pg1422_o2nofp.cx10a_c8r32 - Postgres 14.22 with my standard config (x10a)
- pg1517_o2nofp.cx10a_c8r32 - Postgres 15.17 with my standard config (x10a)
- pg1613_o2nofp.cx10a_c8r32 - Postgres 16.13 with my standard config (x10a)
- pg179_o2nofp.cx10a_c8r32 - Postgres 17.9 with my standard config (x10a)
- pg183_o2nofp.cx10b_c8r32 - Postgres 18.3 with my standard config (x10b)
Contents
- Summary
- l.i0: load without secondary indexes
- l.x: create secondary indexes
- l.i1: continue load after secondary indexes created with 50 inserts per transaction
- l.i2: continue load after secondary indexes created with 5 inserts per transaction
- qr100.L1: range queries with 100 insert/s per client
- qp100.L2: point queries with 100 insert/s per client
- qr500.L3: range queries with 500 insert/s per client
- qp500.L4: point queries with 500 insert/s per client
- qr1000.L5: range queries with 1000 insert/s per client
- qp1000.L6: point queries with 1000 insert/s per client
Summary
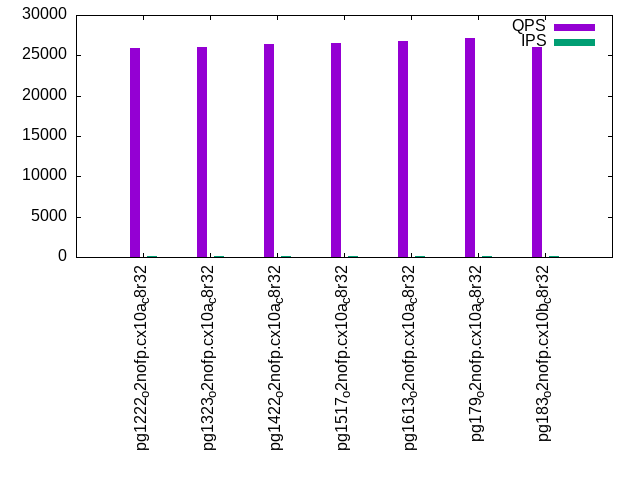
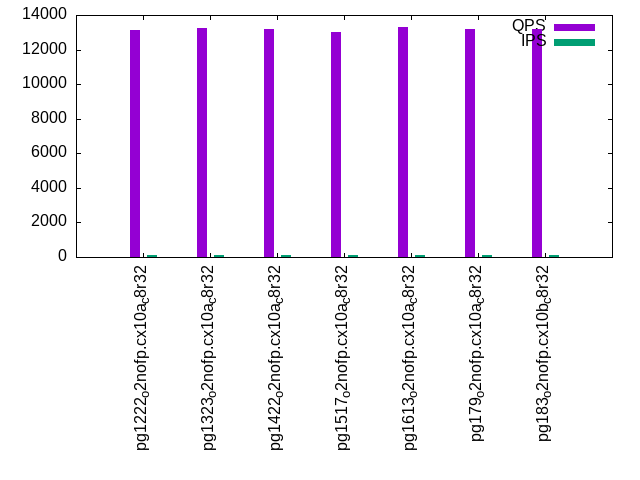
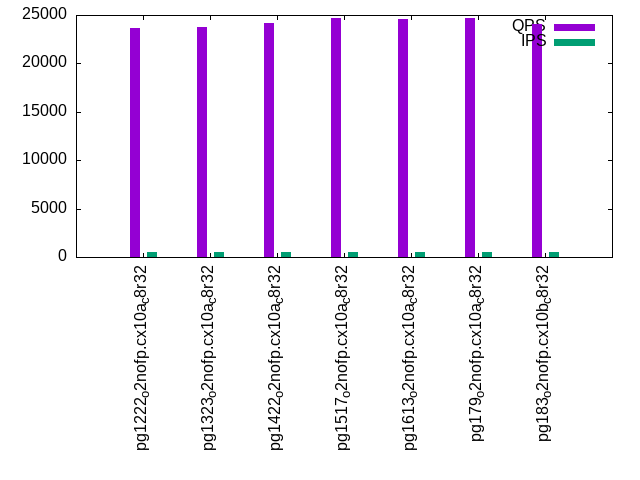
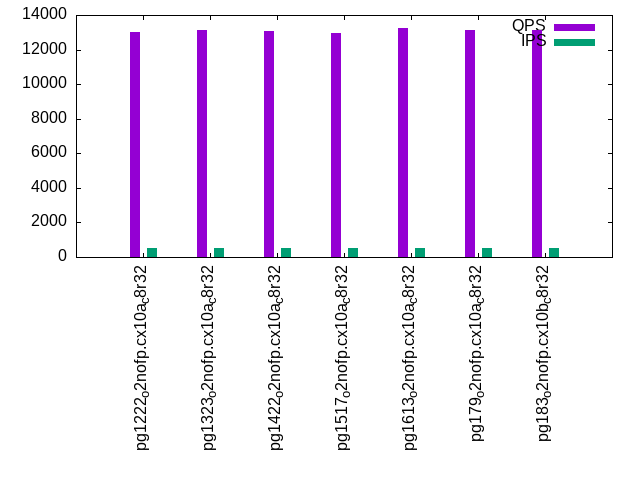
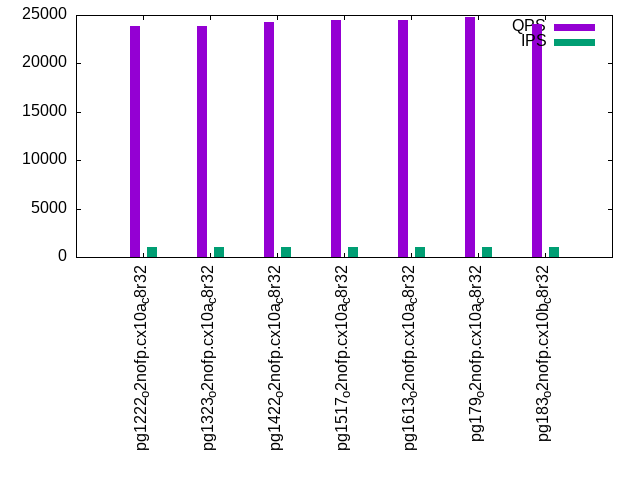
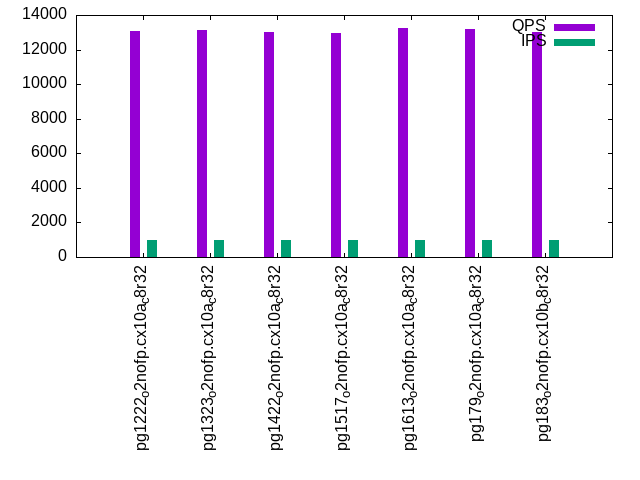
The numbers are inserts/s for l.i0, l.i1 and l.i2, indexed docs (or rows) /s for l.x and queries/s for qr100, qp100 thru qr1000, qp1000" The values are the average rate over the entire test for inserts (IPS) and queries (QPS). The range of values for IPS and QPS is split into 3 parts: bottom 25%, middle 50%, top 25%. Values in the bottom 25% have a red background, values in the top 25% have a green background and values in the middle have no color. A gray background is used for values that can be ignored because the DBMS did not sustain the target insert rate. Red backgrounds are not used when the minimum value is within 80% of the max value.
| dbms | l.i0 | l.x | l.i1 | l.i2 | qr100 | qp100 | qr500 | qp500 | qr1000 | qp1000 |
|---|---|---|---|---|---|---|---|---|---|---|
| pg1222_o2nofp.cx10a_c8r32 | 198675 | 461540 | 24316 | 3126 | 25857 | 13114 | 23695 | 13018 | 23825 | 13082 |
| pg1323_o2nofp.cx10a_c8r32 | 205479 | 454547 | 22779 | 2826 | 26064 | 13244 | 23799 | 13153 | 23851 | 13114 |
| pg1422_o2nofp.cx10a_c8r32 | 201342 | 447763 | 21966 | 2589 | 26411 | 13170 | 24210 | 13075 | 24270 | 13017 |
| pg1517_o2nofp.cx10a_c8r32 | 206896 | 468752 | 23571 | 2863 | 26515 | 13015 | 24642 | 12974 | 24499 | 12980 |
| pg1613_o2nofp.cx10a_c8r32 | 205479 | 483872 | 20555 | 2487 | 26732 | 13294 | 24585 | 13275 | 24444 | 13263 |
| pg179_o2nofp.cx10a_c8r32 | 209790 | 491805 | 20779 | 2509 | 27209 | 13206 | 24727 | 13115 | 24823 | 13204 |
| pg183_o2nofp.cx10b_c8r32 | 206896 | 491805 | 22002 | 2674 | 26083 | 13208 | 24064 | 13140 | 24034 | 13027 |
This table has relative throughput, throughput for the DBMS relative to the DBMS in the first line, using the absolute throughput from the previous table. Values less than 0.95 have a yellow background. Values greater than 1.05 have a blue background.
| dbms | l.i0 | l.x | l.i1 | l.i2 | qr100 | qp100 | qr500 | qp500 | qr1000 | qp1000 |
|---|---|---|---|---|---|---|---|---|---|---|
| pg1222_o2nofp.cx10a_c8r32 | 1.00 | 1.00 | 1.00 | 1.00 | 1.00 | 1.00 | 1.00 | 1.00 | 1.00 | 1.00 |
| pg1323_o2nofp.cx10a_c8r32 | 1.03 | 0.98 | 0.94 | 0.90 | 1.01 | 1.01 | 1.00 | 1.01 | 1.00 | 1.00 |
| pg1422_o2nofp.cx10a_c8r32 | 1.01 | 0.97 | 0.90 | 0.83 | 1.02 | 1.00 | 1.02 | 1.00 | 1.02 | 1.00 |
| pg1517_o2nofp.cx10a_c8r32 | 1.04 | 1.02 | 0.97 | 0.92 | 1.03 | 0.99 | 1.04 | 1.00 | 1.03 | 0.99 |
| pg1613_o2nofp.cx10a_c8r32 | 1.03 | 1.05 | 0.85 | 0.80 | 1.03 | 1.01 | 1.04 | 1.02 | 1.03 | 1.01 |
| pg179_o2nofp.cx10a_c8r32 | 1.06 | 1.07 | 0.85 | 0.80 | 1.05 | 1.01 | 1.04 | 1.01 | 1.04 | 1.01 |
| pg183_o2nofp.cx10b_c8r32 | 1.04 | 1.07 | 0.90 | 0.86 | 1.01 | 1.01 | 1.02 | 1.01 | 1.01 | 1.00 |
This lists the average rate of inserts/s for the tests that do inserts concurrent with queries. For such tests the query rate is listed in the table above. The read+write tests are setup so that the insert rate should match the target rate every second. Cells that are not at least 95% of the target have a red background to indicate a failure to satisfy the target.
| dbms | qr100.L1 | qp100.L2 | qr500.L3 | qp500.L4 | qr1000.L5 | qp1000.L6 |
|---|---|---|---|---|---|---|
| pg1222_o2nofp.cx10a_c8r32 | 100 | 100 | 499 | 500 | 999 | 999 |
| pg1323_o2nofp.cx10a_c8r32 | 100 | 100 | 500 | 500 | 999 | 999 |
| pg1422_o2nofp.cx10a_c8r32 | 100 | 100 | 499 | 499 | 999 | 999 |
| pg1517_o2nofp.cx10a_c8r32 | 100 | 100 | 500 | 500 | 999 | 999 |
| pg1613_o2nofp.cx10a_c8r32 | 100 | 100 | 500 | 500 | 999 | 999 |
| pg179_o2nofp.cx10a_c8r32 | 100 | 100 | 499 | 500 | 999 | 999 |
| pg183_o2nofp.cx10b_c8r32 | 100 | 100 | 500 | 500 | 999 | 999 |
| target | 100 | 100 | 500 | 500 | 1000 | 1000 |
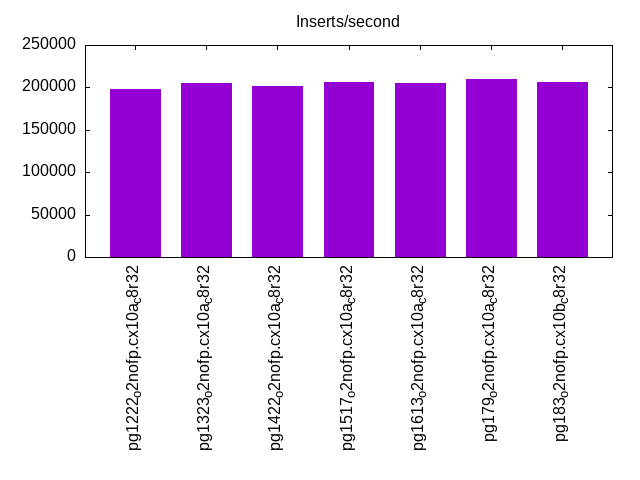
l.i0
l.i0: load without secondary indexes. Graphs for performance per 1-second interval are here.
Average throughput:
Insert response time histogram: each cell has the percentage of responses that take <= the time in the header and max is the max response time in seconds. For the max column values in the top 25% of the range have a red background and in the bottom 25% of the range have a green background. The red background is not used when the min value is within 80% of the max value.
| dbms | 256us | 1ms | 4ms | 16ms | 64ms | 256ms | 1s | 4s | 16s | gt | max |
|---|---|---|---|---|---|---|---|---|---|---|---|
| pg1222_o2nofp.cx10a_c8r32 | 99.984 | 0.016 | 0.003 | ||||||||
| pg1323_o2nofp.cx10a_c8r32 | 99.987 | 0.013 | 0.002 | ||||||||
| pg1422_o2nofp.cx10a_c8r32 | 99.987 | 0.013 | 0.002 | ||||||||
| pg1517_o2nofp.cx10a_c8r32 | 99.992 | 0.008 | 0.003 | ||||||||
| pg1613_o2nofp.cx10a_c8r32 | 99.995 | 0.005 | 0.003 | ||||||||
| pg179_o2nofp.cx10a_c8r32 | 99.990 | 0.010 | 0.003 | ||||||||
| pg183_o2nofp.cx10b_c8r32 | 99.992 | 0.008 | 0.003 |
Performance metrics for the DBMS listed above. Some are normalized by throughput, others are not. Legend for results is here.
ips	qps	rps	rmbps	wps	wmbps	rpq	rkbpq	wpi	wkbpi	csps	cpups	cspq	cpupq	dbgb1	dbgb2	rss	maxop	p50	p99	tag
198675	0	0	0.0	733.8	83.2	0.000	0.000	0.004	0.429	24613	21.8	0.124	9	2.9	7.8	2.3	0.003	198974	196869	pg1222_o2nofp.cx10a_c8r32
205479	0	0	0.0	764.7	86.6	0.000	0.000	0.004	0.432	25330	20.3	0.123	8	2.9	7.8	2.4	0.002	206377	198181	pg1323_o2nofp.cx10a_c8r32
201342	0	0	0.0	750.4	85.2	0.000	0.000	0.004	0.433	24659	19.4	0.122	8	2.9	7.8	1.7	0.002	202173	193880	pg1422_o2nofp.cx10a_c8r32
206896	0	0	0.0	764.6	86.9	0.000	0.000	0.004	0.430	25003	19.5	0.121	8	2.9	7.8	2.4	0.003	207076	199967	pg1517_o2nofp.cx10a_c8r32
205479	0	0	0.0	761.1	86.5	0.000	0.000	0.004	0.431	24865	19.5	0.121	8	2.9	7.8	2.4	0.003	206377	198773	pg1613_o2nofp.cx10a_c8r32
209790	0	0	0.0	781.3	88.8	0.000	0.000	0.004	0.433	21920	19.5	0.104	7	2.9	7.8	2.4	0.003	210373	201867	pg179_o2nofp.cx10a_c8r32
206896	0	0	0.0	765.0	87.0	0.000	0.000	0.004	0.431	21647	19.4	0.105	8	2.9	7.8	2.4	0.003	208471	199967	pg183_o2nofp.cx10b_c8r32
Average values from iostat.
r/s	rkB/s	rrqm/s	%rrqm	r_await	rareq-s	w/s	wkB/s	wrqm/s	%wrqm	w_await	wareq-s	d/s	dkB/s	drqm/s	%drqm	d_await	dareq-s	f/s	f_await	aqu-sz	%util
0.372	1.490	0.000	0.000	0.055	3.862	739.1	85846.5	40.60	5.702	0.420	115.1	2.317	13.02	0.000	0.000	0.667	5.198	41.28	1.390	0.382	10.27		pg1222_o2nofp.cx10a_c8r32
0.371	1.486	0.000	0.000	0.096	3.857	770.9	89510.1	38.92	5.336	0.414	114.8	2.379	12.49	0.000	0.000	0.715	5.028	42.96	1.465	0.370	11.28		pg1323_o2nofp.cx10a_c8r32
0.336	1.343	0.000	0.000	0.074	3.857	756.4	87951.9	37.54	5.171	0.435	115.2	2.435	17.71	0.000	0.000	0.671	6.083	42.10	1.429	0.386	10.82		pg1422_o2nofp.cx10a_c8r32
0.300	1.200	0.000	0.000	0.086	3.571	771.7	89923.1	40.18	5.410	0.471	115.3	0.121	2.629	0.000	0.000	0.237	7.490	43.11	1.614	0.474	11.71		pg1517_o2nofp.cx10a_c8r32
0.371	1.486	0.000	0.000	0.121	3.714	768.1	89462.2	40.19	5.401	0.423	115.3	0.129	2.629	0.000	0.000	0.176	3.316	42.97	1.568	0.395	11.57		pg1613_o2nofp.cx10a_c8r32
0.393	1.570	0.000	0.000	0.169	3.852	788.0	91805.3	37.56	4.984	0.397	115.3	0.067	1.185	0.000	0.000	0.170	2.136	43.39	1.362	0.363	10.67		pg179_o2nofp.cx10a_c8r32
0.314	1.257	0.000	0.000	0.066	3.143	771.1	89852.9	36.83	4.970	0.418	115.3	0.114	1.457	0.000	0.000	0.223	2.086	42.64	1.526	0.390	11.32		pg183_o2nofp.cx10b_c8r32
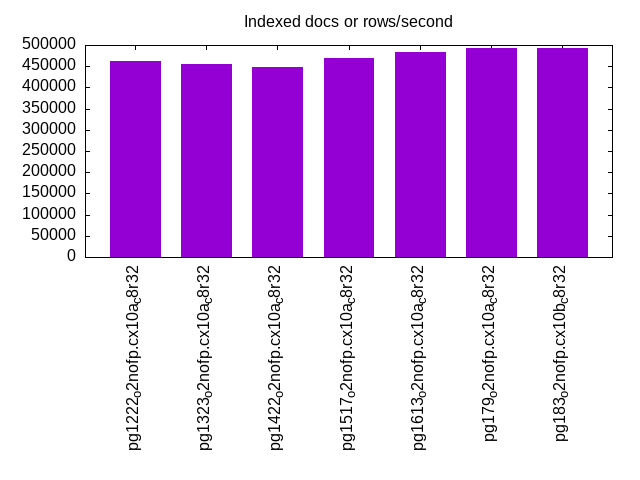
l.x
l.x: create secondary indexes.
Average throughput:
Performance metrics for the DBMS listed above. Some are normalized by throughput, others are not. Legend for results is here.
ips	qps	rps	rmbps	wps	wmbps	rpq	rkbpq	wpi	wkbpi	csps	cpups	cspq	cpupq	dbgb1	dbgb2	rss	maxop	p50	p99	tag
461540	0	0	0.0	834.9	102.4	0.000	0.000	0.002	0.227	2301	11.7	0.005	2	5.8	13.3	3.0	0.001	NA	NA	pg1222_o2nofp.cx10a_c8r32
454547	0	1	0.0	898.0	110.0	0.000	0.000	0.002	0.248	2674	11.7	0.006	2	5.8	13.3	3.0	0.002	NA	NA	pg1323_o2nofp.cx10a_c8r32
447763	0	0	0.0	892.6	109.3	0.000	0.000	0.002	0.250	2637	11.6	0.006	2	5.8	13.3	3.0	0.002	NA	NA	pg1422_o2nofp.cx10a_c8r32
468752	0	0	0.0	897.6	110.2	0.000	0.000	0.002	0.241	2526	11.6	0.005	2	5.8	13.3	3.0	0.002	NA	NA	pg1517_o2nofp.cx10a_c8r32
483872	0	1	0.0	920.2	112.9	0.000	0.000	0.002	0.239	2567	11.6	0.005	2	5.8	13.3	3.1	0.002	NA	NA	pg1613_o2nofp.cx10a_c8r32
491805	0	1	0.0	997.7	122.5	0.000	0.000	0.002	0.255	2894	11.6	0.006	2	5.8	13.3	3.0	0.001	NA	NA	pg179_o2nofp.cx10a_c8r32
491805	0	1	0.0	1072.7	131.8	0.000	0.000	0.002	0.275	2772	11.7	0.006	2	5.8	13.3	3.0	0.002	NA	NA	pg183_o2nofp.cx10b_c8r32
Average values from iostat.
r/s	rkB/s	rrqm/s	%rrqm	r_await	rareq-s	w/s	wkB/s	wrqm/s	%wrqm	w_await	wareq-s	d/s	dkB/s	drqm/s	%drqm	d_await	dareq-s	f/s	f_await	aqu-sz	%util
0.582	2.327	0.000	0.000	0.085	2.182	910.5	114343	30.84	20.40	1.073	82.50	2.273	16.58	0.000	0.000	1.473	6.308	9.382	2.143	0.755	5.842		pg1222_o2nofp.cx10a_c8r32
0.617	2.467	0.000	0.000	0.058	1.667	972.6	122078	35.07	22.05	1.071	76.67	2.200	20.93	0.000	0.000	1.258	8.026	10.90	1.899	0.938	6.613		pg1323_o2nofp.cx10a_c8r32
0.517	2.067	0.000	0.000	0.030	2.000	966.7	121272	34.90	16.36	1.177	75.73	2.683	16.73	0.000	0.000	1.153	5.694	10.85	1.614	1.079	6.397		pg1422_o2nofp.cx10a_c8r32
0.436	1.745	0.000	0.000	0.086	2.545	979.0	123135	32.17	18.94	3.486	83.69	0.364	3.055	0.000	0.000	0.613	2.285	10.70	2.336	1.154	6.561		pg1517_o2nofp.cx10a_c8r32
0.691	2.764	0.000	0.000	0.149	2.545	1003.8	126167	32.84	20.19	3.081	84.21	0.182	1552.5	0.000	0.000	0.108	1109.1	11.25	2.198	1.255	6.849		pg1613_o2nofp.cx10a_c8r32
0.727	2.909	0.000	0.000	0.109	2.909	1088.3	136883	35.80	11.50	1.714	104.4	0.291	4024.9	0.000	0.000	0.381	2875.5	12.25	2.115	0.905	7.565		pg179_o2nofp.cx10a_c8r32
0.636	2.545	0.000	0.000	0.045	1.818	1170.1	147284	37.55	17.26	2.283	94.21	0.655	12961.5	0.000	0.000	0.534	2818.3	12.47	1.661	1.092	6.900		pg183_o2nofp.cx10b_c8r32
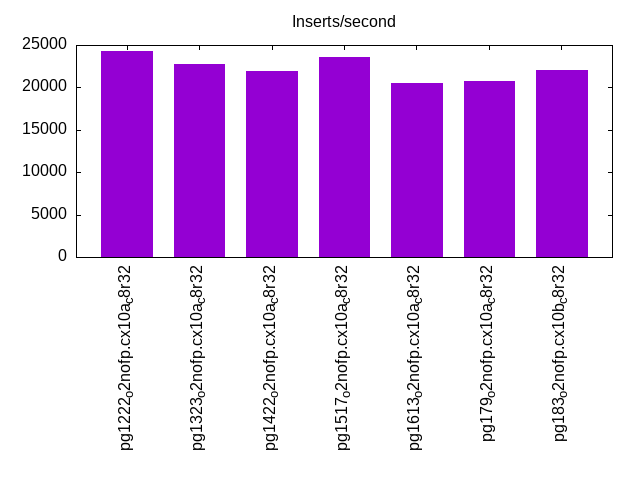
l.i1
l.i1: continue load after secondary indexes created with 50 inserts per transaction. Graphs for performance per 1-second interval are here.
Average throughput:
Insert response time histogram: each cell has the percentage of responses that take <= the time in the header and max is the max response time in seconds. For the max column values in the top 25% of the range have a red background and in the bottom 25% of the range have a green background. The red background is not used when the min value is within 80% of the max value.
| dbms | 256us | 1ms | 4ms | 16ms | 64ms | 256ms | 1s | 4s | 16s | gt | max |
|---|---|---|---|---|---|---|---|---|---|---|---|
| pg1222_o2nofp.cx10a_c8r32 | 60.374 | 39.625 | 0.001 | 0.016 | |||||||
| pg1323_o2nofp.cx10a_c8r32 | 58.417 | 41.581 | 0.001 | nonzero | 0.041 | ||||||
| pg1422_o2nofp.cx10a_c8r32 | 56.924 | 43.076 | nonzero | nonzero | 0.026 | ||||||
| pg1517_o2nofp.cx10a_c8r32 | 57.026 | 42.973 | 0.001 | nonzero | 0.030 | ||||||
| pg1613_o2nofp.cx10a_c8r32 | 63.599 | 36.396 | 0.005 | nonzero | 0.033 | ||||||
| pg179_o2nofp.cx10a_c8r32 | 55.229 | 44.770 | nonzero | 0.001 | 0.034 | ||||||
| pg183_o2nofp.cx10b_c8r32 | 50.193 | 49.805 | nonzero | 0.002 | 0.045 |
Delete response time histogram: each cell has the percentage of responses that take <= the time in the header and max is the max response time in seconds. For the max column values in the top 25% of the range have a red background and in the bottom 25% of the range have a green background. The red background is not used when the min value is within 80% of the max value.
| dbms | 256us | 1ms | 4ms | 16ms | 64ms | 256ms | 1s | 4s | 16s | gt | max |
|---|---|---|---|---|---|---|---|---|---|---|---|
| pg1222_o2nofp.cx10a_c8r32 | 0.007 | 32.052 | 59.559 | 8.381 | nonzero | 0.030 | |||||
| pg1323_o2nofp.cx10a_c8r32 | 0.002 | 28.085 | 61.130 | 10.781 | 0.001 | 0.045 | |||||
| pg1422_o2nofp.cx10a_c8r32 | 0.002 | 29.019 | 56.285 | 14.694 | nonzero | 0.030 | |||||
| pg1517_o2nofp.cx10a_c8r32 | 27.267 | 72.248 | 0.484 | 0.001 | 0.044 | ||||||
| pg1613_o2nofp.cx10a_c8r32 | 0.001 | 27.370 | 53.859 | 18.771 | nonzero | 0.033 | |||||
| pg179_o2nofp.cx10a_c8r32 | 0.003 | 27.183 | 54.944 | 17.867 | 0.002 | 0.037 | |||||
| pg183_o2nofp.cx10b_c8r32 | 0.001 | 26.053 | 71.138 | 2.807 | 0.001 | 0.045 |
Performance metrics for the DBMS listed above. Some are normalized by throughput, others are not. Legend for results is here.
ips	qps	rps	rmbps	wps	wmbps	rpq	rkbpq	wpi	wkbpi	csps	cpups	cspq	cpupq	dbgb1	dbgb2	rss	maxop	p50	p99	tag
24316	0	0	0.0	301.5	32.5	0.000	0.000	0.012	1.370	12248	22.1	0.504	73	8.1	38.6	5.5	0.016	16798	10398	pg1222_o2nofp.cx10a_c8r32
22779	0	0	0.0	284.5	30.7	0.000	0.000	0.012	1.379	11500	21.8	0.505	77	8.1	38.7	8.1	0.041	15998	10049	pg1323_o2nofp.cx10a_c8r32
21966	0	0	0.0	271.6	29.2	0.000	0.000	0.012	1.363	10656	20.3	0.485	74	7.9	38.4	7.0	0.026	15048	9448	pg1422_o2nofp.cx10a_c8r32
23571	0	0	0.0	289.7	31.4	0.000	0.000	0.012	1.364	11845	20.6	0.503	70	7.8	38.4	7.7	0.030	18247	12798	pg1517_o2nofp.cx10a_c8r32
20555	0	0	0.0	251.3	27.2	0.000	0.000	0.012	1.354	10430	19.7	0.507	77	7.8	38.3	6.1	0.033	13898	7149	pg1613_o2nofp.cx10a_c8r32
20779	0	0	0.0	249.3	28.1	0.000	0.000	0.012	1.386	8595	19.8	0.414	76	7.8	38.3	1.6	0.034	13698	9247	pg179_o2nofp.cx10a_c8r32
22002	0	0	0.0	277.5	30.5	0.000	0.000	0.013	1.419	9108	20.2	0.414	73	7.8	38.3	7.8	0.045	16797	11898	pg183_o2nofp.cx10b_c8r32
Average values from iostat.
r/s	rkB/s	rrqm/s	%rrqm	r_await	rareq-s	w/s	wkB/s	wrqm/s	%wrqm	w_await	wareq-s	d/s	dkB/s	drqm/s	%drqm	d_await	dareq-s	f/s	f_await	aqu-sz	%util
0.120	0.478	0.000	0.000	0.043	1.915	301.2	33264.0	18.27	6.163	0.632	110.0	2.097	10.41	0.000	0.000	0.672	4.903	21.56	1.556	0.190	5.579		pg1222_o2nofp.cx10a_c8r32
0.115	0.459	0.000	0.000	0.039	1.863	284.2	31363.7	17.00	5.935	0.659	109.7	2.092	44.85	0.000	0.000	0.672	19.25	20.45	1.547	0.183	5.316		pg1323_o2nofp.cx10a_c8r32
0.104	0.417	0.000	0.000	0.046	1.741	271.3	29897.8	16.50	6.379	0.690	110.1	2.090	10.88	0.000	0.000	0.685	5.132	19.81	1.597	0.178	5.166		pg1422_o2nofp.cx10a_c8r32
0.105	0.421	0.000	0.000	0.049	1.716	289.5	32128.4	14.04	4.785	0.604	112.0	0.006	0.036	0.000	0.000	0.019	0.103	21.22	1.576	0.180	5.314		pg1517_o2nofp.cx10a_c8r32
0.099	0.398	0.000	0.000	0.048	1.660	251.0	27792.8	12.10	4.791	0.680	111.0	0.004	43.24	0.000	0.000	0.010	216.1	18.47	1.530	0.155	4.556		pg1613_o2nofp.cx10a_c8r32
0.104	0.417	0.000	0.000	0.068	1.646	248.9	28763.2	11.50	4.616	0.766	114.7	0.013	21.47	0.000	0.000	0.033	27.00	14.49	1.575	0.163	4.182		pg179_o2nofp.cx10a_c8r32
0.114	0.455	0.000	0.000	0.055	1.823	277.3	31199.2	12.35	4.450	0.685	113.2	0.012	7.140	0.000	0.000	0.043	17.77	18.47	1.589	0.183	5.075		pg183_o2nofp.cx10b_c8r32
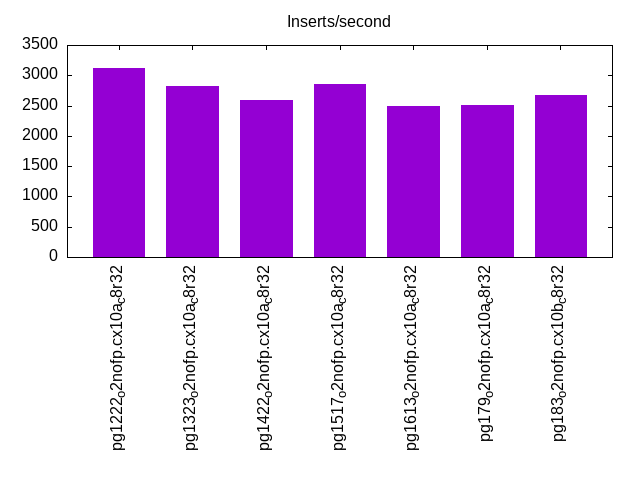
l.i2
l.i2: continue load after secondary indexes created with 5 inserts per transaction. Graphs for performance per 1-second interval are here.
Average throughput:
Insert response time histogram: each cell has the percentage of responses that take <= the time in the header and max is the max response time in seconds. For the max column values in the top 25% of the range have a red background and in the bottom 25% of the range have a green background. The red background is not used when the min value is within 80% of the max value.
| dbms | 256us | 1ms | 4ms | 16ms | 64ms | 256ms | 1s | 4s | 16s | gt | max |
|---|---|---|---|---|---|---|---|---|---|---|---|
| pg1222_o2nofp.cx10a_c8r32 | 60.636 | 39.364 | nonzero | nonzero | 0.023 | ||||||
| pg1323_o2nofp.cx10a_c8r32 | 54.767 | 45.232 | nonzero | 0.003 | |||||||
| pg1422_o2nofp.cx10a_c8r32 | 46.966 | 53.033 | nonzero | 0.003 | |||||||
| pg1517_o2nofp.cx10a_c8r32 | 55.573 | 44.427 | nonzero | nonzero | 0.006 | ||||||
| pg1613_o2nofp.cx10a_c8r32 | 51.130 | 48.870 | nonzero | nonzero | 0.005 | ||||||
| pg179_o2nofp.cx10a_c8r32 | 44.147 | 55.853 | nonzero | 0.003 | |||||||
| pg183_o2nofp.cx10b_c8r32 | 49.579 | 50.421 | 0.001 | nonzero | 0.004 |
Delete response time histogram: each cell has the percentage of responses that take <= the time in the header and max is the max response time in seconds. For the max column values in the top 25% of the range have a red background and in the bottom 25% of the range have a green background. The red background is not used when the min value is within 80% of the max value.
| dbms | 256us | 1ms | 4ms | 16ms | 64ms | 256ms | 1s | 4s | 16s | gt | max |
|---|---|---|---|---|---|---|---|---|---|---|---|
| pg1222_o2nofp.cx10a_c8r32 | 5.287 | 28.365 | 66.307 | 0.040 | nonzero | 0.024 | |||||
| pg1323_o2nofp.cx10a_c8r32 | 4.901 | 32.371 | 62.037 | 0.690 | 0.011 | ||||||
| pg1422_o2nofp.cx10a_c8r32 | 4.833 | 27.857 | 67.149 | 0.161 | 0.007 | ||||||
| pg1517_o2nofp.cx10a_c8r32 | 4.826 | 22.556 | 72.594 | 0.023 | 0.008 | ||||||
| pg1613_o2nofp.cx10a_c8r32 | 4.191 | 31.853 | 56.615 | 7.341 | nonzero | 0.017 | |||||
| pg179_o2nofp.cx10a_c8r32 | 4.576 | 27.340 | 66.904 | 1.179 | 0.007 | ||||||
| pg183_o2nofp.cx10b_c8r32 | 4.355 | 26.289 | 69.322 | 0.034 | nonzero | 0.024 |
Performance metrics for the DBMS listed above. Some are normalized by throughput, others are not. Legend for results is here.
ips	qps	rps	rmbps	wps	wmbps	rpq	rkbpq	wpi	wkbpi	csps	cpups	cspq	cpupq	dbgb1	dbgb2	rss	maxop	p50	p99	tag
3126	0	0	0.0	67.6	6.5	0.000	0.000	0.022	2.115	14706	15.9	4.705	407	8.2	40.8	6.6	0.023	2260	1360	pg1222_o2nofp.cx10a_c8r32
2826	0	0	0.0	65.1	6.2	0.000	0.000	0.023	2.235	13392	15.8	4.739	447	8.1	40.6	5.7	0.003	1925	1235	pg1323_o2nofp.cx10a_c8r32
2589	0	0	0.0	61.0	5.7	0.000	0.000	0.024	2.258	11760	15.2	4.542	470	7.9	40.2	8.0	0.003	1820	1284	pg1422_o2nofp.cx10a_c8r32
2863	0	0	0.0	62.3	6.1	0.000	0.000	0.022	2.174	13013	15.3	4.546	428	7.9	40.3	0.2	0.006	2155	1380	pg1517_o2nofp.cx10a_c8r32
2487	0	0	0.0	56.8	5.5	0.000	0.000	0.023	2.259	11336	15.1	4.558	486	7.9	39.9	6.4	0.005	1620	975	pg1613_o2nofp.cx10a_c8r32
2509	0	0	0.0	55.8	5.5	0.000	0.000	0.022	2.234	9448	15.2	3.765	485	7.9	39.7	0.3	0.003	1780	1190	pg179_o2nofp.cx10a_c8r32
2674	0	0	0.0	58.6	5.8	0.000	0.000	0.022	2.230	10058	15.1	3.762	452	7.9	40.3	1.7	0.004	1920	1375	pg183_o2nofp.cx10b_c8r32
Average values from iostat.
r/s	rkB/s	rrqm/s	%rrqm	r_await	rareq-s	w/s	wkB/s	wrqm/s	%wrqm	w_await	wareq-s	d/s	dkB/s	drqm/s	%drqm	d_await	dareq-s	f/s	f_await	aqu-sz	%util
0.005	0.021	0.000	0.000	0.002	0.107	67.41	6582.8	8.492	8.920	0.505	95.02	2.061	20.18	0.000	0.000	0.652	6.863	8.433	1.580	0.044	2.388		pg1222_o2nofp.cx10a_c8r32
0.005	0.018	0.000	0.000	0.001	0.091	65.19	6321.2	8.167	8.918	0.494	95.06	2.059	15.06	0.000	0.000	0.661	4.884	8.245	1.578	0.045	2.375		pg1323_o2nofp.cx10a_c8r32
0.004	0.018	0.000	0.000	0.003	0.083	61.06	5850.3	7.918	9.382	0.479	93.19	2.053	14.85	0.000	0.000	0.643	5.264	7.963	1.567	0.042	2.286		pg1422_o2nofp.cx10a_c8r32
0.005	0.018	0.000	0.000	0.003	0.086	62.38	6228.7	5.132	3.918	0.530	98.64	0.035	5.681	0.000	0.000	0.004	0.491	8.315	1.553	0.041	2.162		pg1517_o2nofp.cx10a_c8r32
0.003	0.013	0.000	0.000	0.002	0.065	56.75	5610.3	4.267	3.944	0.533	96.55	0.030	4.374	0.000	0.000	0.003	0.380	7.833	1.548	0.038	1.974		pg1613_o2nofp.cx10a_c8r32
0.003	0.013	0.000	0.000	0.003	0.060	55.83	5609.1	3.372	2.736	0.523	98.69	0.008	1.705	0.000	0.000	0.003	0.541	7.355	1.571	0.037	1.804		pg179_o2nofp.cx10a_c8r32
0.004	0.017	0.000	0.000	0.009	0.086	58.60	5968.6	3.623	3.095	0.638	96.24	0.008	1.632	0.000	0.000	0.001	0.529	7.431	1.598	0.040	1.968		pg183_o2nofp.cx10b_c8r32
qr100.L1
qr100.L1: range queries with 100 insert/s per client. Graphs for performance per 1-second interval are here.
Average throughput:
Query response time histogram: each cell has the percentage of responses that take <= the time in the header and max is the max response time in seconds. For max values in the top 25% of the range have a red background and in the bottom 25% of the range have a green background. The red background is not used when the min value is within 80% of the max value.
| dbms | 256us | 1ms | 4ms | 16ms | 64ms | 256ms | 1s | 4s | 16s | gt | max |
|---|---|---|---|---|---|---|---|---|---|---|---|
| pg1222_o2nofp.cx10a_c8r32 | 99.993 | 0.007 | 0.001 | ||||||||
| pg1323_o2nofp.cx10a_c8r32 | 99.994 | 0.006 | 0.001 | ||||||||
| pg1422_o2nofp.cx10a_c8r32 | 99.995 | 0.005 | nonzero | 0.002 | |||||||
| pg1517_o2nofp.cx10a_c8r32 | 99.995 | 0.005 | nonzero | 0.004 | |||||||
| pg1613_o2nofp.cx10a_c8r32 | 99.995 | 0.005 | nonzero | 0.003 | |||||||
| pg179_o2nofp.cx10a_c8r32 | 99.994 | 0.006 | nonzero | 0.003 | |||||||
| pg183_o2nofp.cx10b_c8r32 | 99.993 | 0.007 | 0.001 |
Insert response time histogram: each cell has the percentage of responses that take <= the time in the header and max is the max response time in seconds. For max values in the top 25% of the range have a red background and in the bottom 25% of the range have a green background. The red background is not used when the min value is within 80% of the max value.
| dbms | 256us | 1ms | 4ms | 16ms | 64ms | 256ms | 1s | 4s | 16s | gt | max |
|---|---|---|---|---|---|---|---|---|---|---|---|
| pg1222_o2nofp.cx10a_c8r32 | 9.722 | 90.250 | 0.028 | 0.005 | |||||||
| pg1323_o2nofp.cx10a_c8r32 | 9.944 | 90.028 | 0.028 | 0.005 | |||||||
| pg1422_o2nofp.cx10a_c8r32 | 13.667 | 86.306 | 0.028 | 0.005 | |||||||
| pg1517_o2nofp.cx10a_c8r32 | 13.500 | 86.472 | 0.028 | 0.005 | |||||||
| pg1613_o2nofp.cx10a_c8r32 | 15.528 | 84.444 | 0.028 | 0.005 | |||||||
| pg179_o2nofp.cx10a_c8r32 | 22.306 | 77.667 | 0.028 | 0.005 | |||||||
| pg183_o2nofp.cx10b_c8r32 | 23.972 | 76.000 | 0.028 | 0.005 |
Delete response time histogram: each cell has the percentage of responses that take <= the time in the header and max is the max response time in seconds. For max values in the top 25% of the range have a red background and in the bottom 25% of the range have a green background. The red background is not used when the min value is within 80% of the max value.
| dbms | 256us | 1ms | 4ms | 16ms | 64ms | 256ms | 1s | 4s | 16s | gt | max |
|---|---|---|---|---|---|---|---|---|---|---|---|
| pg1222_o2nofp.cx10a_c8r32 | 66.389 | 33.611 | 0.002 | ||||||||
| pg1323_o2nofp.cx10a_c8r32 | 66.444 | 33.556 | 0.002 | ||||||||
| pg1422_o2nofp.cx10a_c8r32 | 64.444 | 35.556 | 0.002 | ||||||||
| pg1517_o2nofp.cx10a_c8r32 | 0.028 | 66.194 | 33.778 | 0.002 | |||||||
| pg1613_o2nofp.cx10a_c8r32 | 64.472 | 35.528 | 0.002 | ||||||||
| pg179_o2nofp.cx10a_c8r32 | 63.750 | 36.250 | 0.002 | ||||||||
| pg183_o2nofp.cx10b_c8r32 | 61.889 | 38.111 | 0.002 |
Performance metrics for the DBMS listed above. Some are normalized by throughput, others are not. Legend for results is here.
ips	qps	rps	rmbps	wps	wmbps	rpq	rkbpq	wpi	wkbpi	csps	cpups	cspq	cpupq	dbgb1	dbgb2	rss	maxop	p50	p99	tag
100	25857	0	0.0	15.0	0.8	0.000	0.000	0.150	7.776	98735	8.5	3.818	26	8.2	40.8	0.1	0.001	25863	25389	pg1222_o2nofp.cx10a_c8r32
100	26064	0	0.0	14.9	0.8	0.000	0.000	0.149	7.795	99526	8.6	3.818	26	8.1	40.6	0.1	0.001	26060	25574	pg1323_o2nofp.cx10a_c8r32
100	26411	0	0.0	15.4	0.8	0.000	0.000	0.155	7.938	100861	9.0	3.819	27	7.9	40.2	0.1	0.002	26443	26022	pg1422_o2nofp.cx10a_c8r32
100	26515	0	0.0	13.1	0.8	0.000	0.000	0.131	7.692	101173	8.6	3.816	26	7.9	40.3	0.1	0.004	26535	26189	pg1517_o2nofp.cx10a_c8r32
100	26732	0	0.0	13.0	0.8	0.000	0.000	0.130	7.706	102002	8.1	3.816	24	7.9	39.9	0.1	0.003	26731	26299	pg1613_o2nofp.cx10a_c8r32
100	27209	0	0.0	12.2	0.8	0.000	0.000	0.123	7.737	103865	8.3	3.817	24	7.9	39.7	0.1	0.003	27241	26817	pg179_o2nofp.cx10a_c8r32
100	26083	0	0.0	12.3	0.8	0.000	0.000	0.123	7.731	99517	8.5	3.815	26	7.9	40.3	0.1	0.001	26107	25673	pg183_o2nofp.cx10b_c8r32
Average values from iostat.
r/s	rkB/s	rrqm/s	%rrqm	r_await	rareq-s	w/s	wkB/s	wrqm/s	%wrqm	w_await	wareq-s	d/s	dkB/s	drqm/s	%drqm	d_await	dareq-s	f/s	f_await	aqu-sz	%util
0.000	0.000	0.000	0.000	0.000	0.000	14.97	775.0	2.967	17.63	1.600	52.51	2.000	9.597	0.000	0.000	0.852	4.565	3.444	1.885	0.031	1.525		pg1222_o2nofp.cx10a_c8r32
0.000	0.000	0.000	0.000	0.000	0.000	14.91	777.0	2.973	17.74	1.594	52.79	2.000	9.602	0.000	0.000	0.785	4.801	3.399	1.900	0.031	1.455		pg1323_o2nofp.cx10a_c8r32
0.000	0.000	0.000	0.000	0.000	0.000	15.42	790.3	3.059	17.78	1.617	52.39	1.998	9.987	0.000	0.000	0.815	4.980	3.474	1.938	0.032	1.554		pg1422_o2nofp.cx10a_c8r32
0.000	0.000	0.000	0.000	0.000	0.000	13.09	766.4	0.262	2.068	1.941	60.37	0.001	0.002	0.000	0.000	0.000	0.011	3.451	1.950	0.031	1.403		pg1517_o2nofp.cx10a_c8r32
0.000	0.000	0.000	0.000	0.000	0.000	13.02	768.1	0.255	2.047	1.966	60.70	0.001	0.002	0.000	0.000	0.003	0.011	3.424	2.001	0.031	1.402		pg1613_o2nofp.cx10a_c8r32
0.000	0.000	0.000	0.000	0.000	0.000	12.23	770.1	0.249	2.160	1.973	66.53	0.001	0.002	0.000	0.000	0.006	0.011	2.738	2.005	0.028	1.141		pg179_o2nofp.cx10a_c8r32
0.000	0.000	0.000	0.000	0.000	0.000	12.32	770.4	0.247	2.119	1.965	65.89	0.001	0.002	0.000	0.000	0.003	0.011	2.799	1.870	0.028	1.134		pg183_o2nofp.cx10b_c8r32
qp100.L2
qp100.L2: point queries with 100 insert/s per client. Graphs for performance per 1-second interval are here.
Average throughput:
Query response time histogram: each cell has the percentage of responses that take <= the time in the header and max is the max response time in seconds. For max values in the top 25% of the range have a red background and in the bottom 25% of the range have a green background. The red background is not used when the min value is within 80% of the max value.
| dbms | 256us | 1ms | 4ms | 16ms | 64ms | 256ms | 1s | 4s | 16s | gt | max |
|---|---|---|---|---|---|---|---|---|---|---|---|
| pg1222_o2nofp.cx10a_c8r32 | 99.982 | 0.018 | nonzero | 0.001 | |||||||
| pg1323_o2nofp.cx10a_c8r32 | 99.986 | 0.014 | 0.001 | ||||||||
| pg1422_o2nofp.cx10a_c8r32 | 99.986 | 0.014 | nonzero | 0.002 | |||||||
| pg1517_o2nofp.cx10a_c8r32 | 99.987 | 0.013 | nonzero | 0.003 | |||||||
| pg1613_o2nofp.cx10a_c8r32 | 99.986 | 0.014 | nonzero | 0.001 | |||||||
| pg179_o2nofp.cx10a_c8r32 | 99.987 | 0.013 | nonzero | 0.002 | |||||||
| pg183_o2nofp.cx10b_c8r32 | 99.984 | 0.016 | 0.001 |
Insert response time histogram: each cell has the percentage of responses that take <= the time in the header and max is the max response time in seconds. For max values in the top 25% of the range have a red background and in the bottom 25% of the range have a green background. The red background is not used when the min value is within 80% of the max value.
| dbms | 256us | 1ms | 4ms | 16ms | 64ms | 256ms | 1s | 4s | 16s | gt | max |
|---|---|---|---|---|---|---|---|---|---|---|---|
| pg1222_o2nofp.cx10a_c8r32 | 0.639 | 99.333 | 0.028 | 0.005 | |||||||
| pg1323_o2nofp.cx10a_c8r32 | 0.944 | 99.028 | 0.028 | 0.005 | |||||||
| pg1422_o2nofp.cx10a_c8r32 | 1.389 | 98.583 | 0.028 | 0.004 | |||||||
| pg1517_o2nofp.cx10a_c8r32 | 1.028 | 98.944 | 0.028 | 0.004 | |||||||
| pg1613_o2nofp.cx10a_c8r32 | 1.611 | 98.361 | 0.028 | 0.005 | |||||||
| pg179_o2nofp.cx10a_c8r32 | 1.917 | 98.056 | 0.028 | 0.005 | |||||||
| pg183_o2nofp.cx10b_c8r32 | 4.500 | 95.472 | 0.028 | 0.005 |
Delete response time histogram: each cell has the percentage of responses that take <= the time in the header and max is the max response time in seconds. For max values in the top 25% of the range have a red background and in the bottom 25% of the range have a green background. The red background is not used when the min value is within 80% of the max value.
| dbms | 256us | 1ms | 4ms | 16ms | 64ms | 256ms | 1s | 4s | 16s | gt | max |
|---|---|---|---|---|---|---|---|---|---|---|---|
| pg1222_o2nofp.cx10a_c8r32 | 36.194 | 63.806 | 0.003 | ||||||||
| pg1323_o2nofp.cx10a_c8r32 | 27.000 | 73.000 | 0.003 | ||||||||
| pg1422_o2nofp.cx10a_c8r32 | 14.778 | 85.222 | 0.004 | ||||||||
| pg1517_o2nofp.cx10a_c8r32 | 17.778 | 82.222 | 0.003 | ||||||||
| pg1613_o2nofp.cx10a_c8r32 | 14.917 | 85.083 | 0.004 | ||||||||
| pg179_o2nofp.cx10a_c8r32 | 16.444 | 83.556 | 0.004 | ||||||||
| pg183_o2nofp.cx10b_c8r32 | 8.194 | 91.806 | 0.003 |
Performance metrics for the DBMS listed above. Some are normalized by throughput, others are not. Legend for results is here.
ips	qps	rps	rmbps	wps	wmbps	rpq	rkbpq	wpi	wkbpi	csps	cpups	cspq	cpupq	dbgb1	dbgb2	rss	maxop	p50	p99	tag
100	13114	0	0.0	63.4	1.7	0.000	0.000	0.634	17.064	50722	10.1	3.868	62	8.2	40.4	0.2	0.001	13115	12970	pg1222_o2nofp.cx10a_c8r32
100	13244	0	0.0	63.4	1.7	0.000	0.000	0.634	17.056	51220	9.8	3.867	59	8.1	40.4	0.2	0.001	13246	13128	pg1323_o2nofp.cx10a_c8r32
100	13170	0	0.0	62.5	1.7	0.000	0.000	0.626	17.036	50907	10.1	3.866	61	7.9	40.2	0.1	0.002	13182	13067	pg1422_o2nofp.cx10a_c8r32
100	13015	0	0.0	60.3	1.6	0.000	0.000	0.603	16.783	50242	10.0	3.860	61	7.9	40.2	0.1	0.003	13020	12924	pg1517_o2nofp.cx10a_c8r32
100	13294	0	0.0	60.0	1.6	0.000	0.000	0.601	16.787	51316	9.7	3.860	58	7.9	39.9	0.1	0.001	13294	13166	pg1613_o2nofp.cx10a_c8r32
100	13206	0	0.0	59.0	1.6	0.000	0.000	0.591	16.790	50995	10.1	3.861	61	7.9	39.7	0.1	0.002	13214	13102	pg179_o2nofp.cx10a_c8r32
100	13208	0	0.0	58.7	1.6	0.000	0.000	0.588	16.787	50972	10.1	3.859	61	7.9	40.2	0.1	0.001	13214	13086	pg183_o2nofp.cx10b_c8r32
Average values from iostat.
r/s	rkB/s	rrqm/s	%rrqm	r_await	rareq-s	w/s	wkB/s	wrqm/s	%wrqm	w_await	wareq-s	d/s	dkB/s	drqm/s	%drqm	d_await	dareq-s	f/s	f_await	aqu-sz	%util
0.000	0.000	0.000	0.000	0.000	0.000	63.36	1698.9	3.474	6.504	1.156	29.34	2.013	219.5	0.000	0.000	0.662	35.66	3.383	1.719	0.077	1.667		pg1222_o2nofp.cx10a_c8r32
0.000	0.000	0.000	0.000	0.000	0.000	63.35	1697.9	3.530	6.604	1.147	29.47	2.007	119.1	0.000	0.000	0.752	28.61	3.404	1.688	0.078	1.636		pg1323_o2nofp.cx10a_c8r32
0.000	0.000	0.000	0.000	0.000	0.000	62.41	1692.5	3.576	6.794	1.184	29.72	2.001	9.998	0.000	0.000	0.619	4.998	3.419	1.742	0.078	1.648		pg1422_o2nofp.cx10a_c8r32
0.001	0.002	0.000	0.000	0.000	0.011	60.18	1668.9	0.655	1.177	1.291	31.15	0.004	54.77	0.000	0.000	0.005	39.13	3.400	1.745	0.079	1.584		pg1517_o2nofp.cx10a_c8r32
0.000	0.000	0.000	0.000	0.000	0.000	59.94	1669.3	0.642	1.335	1.286	31.13	0.001	0.002	0.000	0.000	0.003	0.011	3.414	1.730	0.079	1.530		pg1613_o2nofp.cx10a_c8r32
0.000	0.000	0.000	0.000	0.000	0.000	58.91	1667.9	0.639	1.268	1.410	32.42	0.001	0.002	0.000	0.000	0.003	0.011	2.589	1.770	0.085	1.440		pg179_o2nofp.cx10a_c8r32
0.000	0.000	0.000	0.000	0.000	0.000	58.62	1669.2	0.653	1.316	1.414	32.65	0.004	54.77	0.000	0.000	0.006	45.65	2.580	1.807	0.084	1.426		pg183_o2nofp.cx10b_c8r32
qr500.L3
qr500.L3: range queries with 500 insert/s per client. Graphs for performance per 1-second interval are here.
Average throughput:
Query response time histogram: each cell has the percentage of responses that take <= the time in the header and max is the max response time in seconds. For max values in the top 25% of the range have a red background and in the bottom 25% of the range have a green background. The red background is not used when the min value is within 80% of the max value.
| dbms | 256us | 1ms | 4ms | 16ms | 64ms | 256ms | 1s | 4s | 16s | gt | max |
|---|---|---|---|---|---|---|---|---|---|---|---|
| pg1222_o2nofp.cx10a_c8r32 | 99.991 | 0.009 | nonzero | 0.002 | |||||||
| pg1323_o2nofp.cx10a_c8r32 | 99.992 | 0.008 | nonzero | 0.002 | |||||||
| pg1422_o2nofp.cx10a_c8r32 | 99.992 | 0.008 | nonzero | 0.002 | |||||||
| pg1517_o2nofp.cx10a_c8r32 | 99.992 | 0.008 | nonzero | 0.002 | |||||||
| pg1613_o2nofp.cx10a_c8r32 | 99.992 | 0.008 | nonzero | 0.002 | |||||||
| pg179_o2nofp.cx10a_c8r32 | 99.992 | 0.008 | nonzero | 0.002 | |||||||
| pg183_o2nofp.cx10b_c8r32 | 99.991 | 0.009 | nonzero | 0.001 |
Insert response time histogram: each cell has the percentage of responses that take <= the time in the header and max is the max response time in seconds. For max values in the top 25% of the range have a red background and in the bottom 25% of the range have a green background. The red background is not used when the min value is within 80% of the max value.
| dbms | 256us | 1ms | 4ms | 16ms | 64ms | 256ms | 1s | 4s | 16s | gt | max |
|---|---|---|---|---|---|---|---|---|---|---|---|
| pg1222_o2nofp.cx10a_c8r32 | 71.056 | 28.939 | 0.006 | 0.004 | |||||||
| pg1323_o2nofp.cx10a_c8r32 | 68.144 | 31.850 | 0.006 | 0.005 | |||||||
| pg1422_o2nofp.cx10a_c8r32 | 73.256 | 26.739 | 0.006 | 0.005 | |||||||
| pg1517_o2nofp.cx10a_c8r32 | 70.328 | 29.667 | 0.006 | 0.005 | |||||||
| pg1613_o2nofp.cx10a_c8r32 | 69.700 | 30.289 | 0.011 | 0.004 | |||||||
| pg179_o2nofp.cx10a_c8r32 | 74.922 | 25.072 | 0.006 | 0.005 | |||||||
| pg183_o2nofp.cx10b_c8r32 | 75.878 | 24.117 | 0.006 | 0.005 |
Delete response time histogram: each cell has the percentage of responses that take <= the time in the header and max is the max response time in seconds. For max values in the top 25% of the range have a red background and in the bottom 25% of the range have a green background. The red background is not used when the min value is within 80% of the max value.
| dbms | 256us | 1ms | 4ms | 16ms | 64ms | 256ms | 1s | 4s | 16s | gt | max |
|---|---|---|---|---|---|---|---|---|---|---|---|
| pg1222_o2nofp.cx10a_c8r32 | 8.072 | 91.511 | 0.417 | 0.005 | |||||||
| pg1323_o2nofp.cx10a_c8r32 | 2.417 | 96.683 | 0.900 | 0.005 | |||||||
| pg1422_o2nofp.cx10a_c8r32 | 1.900 | 97.106 | 0.994 | 0.005 | |||||||
| pg1517_o2nofp.cx10a_c8r32 | 2.256 | 96.783 | 0.961 | 0.005 | |||||||
| pg1613_o2nofp.cx10a_c8r32 | 6.822 | 91.911 | 1.267 | 0.006 | |||||||
| pg179_o2nofp.cx10a_c8r32 | 4.783 | 92.083 | 3.133 | 0.005 | |||||||
| pg183_o2nofp.cx10b_c8r32 | 3.672 | 94.689 | 1.639 | 0.006 |
Performance metrics for the DBMS listed above. Some are normalized by throughput, others are not. Legend for results is here.
ips	qps	rps	rmbps	wps	wmbps	rpq	rkbpq	wpi	wkbpi	csps	cpups	cspq	cpupq	dbgb1	dbgb2	rss	maxop	p50	p99	tag
499	23695	0	0.0	70.5	2.2	0.000	0.000	0.141	4.604	90778	9.4	3.831	32	8.2	39.3	0.4	0.002	23709	22393	pg1222_o2nofp.cx10a_c8r32
500	23799	0	0.0	70.6	2.3	0.000	0.000	0.141	4.618	91128	9.4	3.829	32	8.2	39.3	0.4	0.002	23799	22491	pg1323_o2nofp.cx10a_c8r32
499	24210	0	0.0	69.8	2.3	0.000	0.000	0.140	4.646	92639	9.3	3.826	31	7.9	39.0	0.3	0.002	24216	22874	pg1422_o2nofp.cx10a_c8r32
500	24642	0	0.0	67.5	2.2	0.000	0.000	0.135	4.589	94200	9.3	3.823	30	7.9	39.0	0.3	0.002	24636	23371	pg1517_o2nofp.cx10a_c8r32
500	24585	0	0.0	67.8	2.3	0.000	0.000	0.136	4.642	93980	9.2	3.823	30	8.0	38.8	3.7	0.002	24589	23293	pg1613_o2nofp.cx10a_c8r32
499	24727	0	0.0	66.8	2.2	0.000	0.000	0.134	4.599	94527	9.1	3.823	29	7.9	38.6	0.3	0.002	24779	23210	pg179_o2nofp.cx10a_c8r32
500	24064	0	0.0	66.7	2.2	0.000	0.000	0.134	4.609	91953	9.4	3.821	31	7.9	39.0	0.3	0.001	24039	22620	pg183_o2nofp.cx10b_c8r32
Average values from iostat.
r/s	rkB/s	rrqm/s	%rrqm	r_await	rareq-s	w/s	wkB/s	wrqm/s	%wrqm	w_await	wareq-s	d/s	dkB/s	drqm/s	%drqm	d_await	dareq-s	f/s	f_await	aqu-sz	%util
0.000	0.000	0.000	0.000	0.000	0.000	70.39	2285.8	4.352	7.108	1.029	33.27	2.042	683.7	0.000	0.000	0.654	44.10	4.209	1.704	0.077	1.721		pg1222_o2nofp.cx10a_c8r32
0.000	0.000	0.000	0.000	0.000	0.000	70.46	2293.7	4.417	7.249	1.022	33.25	2.045	685.1	0.000	0.000	0.638	42.74	4.237	1.662	0.078	1.723		pg1323_o2nofp.cx10a_c8r32
0.001	0.002	0.000	0.000	0.000	0.011	69.75	2306.6	4.438	7.284	1.071	33.74	2.045	694.6	0.000	0.000	0.652	43.44	4.236	1.751	0.079	1.810		pg1422_o2nofp.cx10a_c8r32
0.001	0.004	0.000	0.000	0.000	0.011	67.41	2279.1	1.231	2.056	1.148	34.95	0.046	684.6	0.000	0.000	0.005	41.75	4.243	1.754	0.080	1.699		pg1517_o2nofp.cx10a_c8r32
0.003	0.013	0.000	0.000	0.000	0.011	67.69	2305.4	1.623	2.969	1.168	35.51	0.046	675.4	0.000	0.000	0.005	41.20	4.229	1.767	0.081	1.692		pg1613_o2nofp.cx10a_c8r32
0.002	0.007	0.000	0.000	0.000	0.011	66.71	2283.2	1.165	1.848	1.220	35.78	0.045	675.4	0.000	0.000	0.005	42.76	3.731	1.756	0.083	1.609		pg179_o2nofp.cx10a_c8r32
0.002	0.009	0.000	0.000	0.000	0.022	66.61	2289.7	1.253	2.470	1.246	36.17	0.046	684.6	0.000	0.000	0.001	42.27	3.672	1.768	0.084	1.632		pg183_o2nofp.cx10b_c8r32
qp500.L4
qp500.L4: point queries with 500 insert/s per client. Graphs for performance per 1-second interval are here.
Average throughput:
Query response time histogram: each cell has the percentage of responses that take <= the time in the header and max is the max response time in seconds. For max values in the top 25% of the range have a red background and in the bottom 25% of the range have a green background. The red background is not used when the min value is within 80% of the max value.
| dbms | 256us | 1ms | 4ms | 16ms | 64ms | 256ms | 1s | 4s | 16s | gt | max |
|---|---|---|---|---|---|---|---|---|---|---|---|
| pg1222_o2nofp.cx10a_c8r32 | 99.977 | 0.023 | nonzero | 0.001 | |||||||
| pg1323_o2nofp.cx10a_c8r32 | 99.979 | 0.021 | nonzero | 0.003 | |||||||
| pg1422_o2nofp.cx10a_c8r32 | 99.978 | 0.022 | nonzero | 0.001 | |||||||
| pg1517_o2nofp.cx10a_c8r32 | 99.981 | 0.019 | nonzero | 0.002 | |||||||
| pg1613_o2nofp.cx10a_c8r32 | 99.979 | 0.021 | nonzero | 0.002 | |||||||
| pg179_o2nofp.cx10a_c8r32 | 99.979 | 0.021 | nonzero | 0.001 | |||||||
| pg183_o2nofp.cx10b_c8r32 | 99.978 | 0.022 | nonzero | 0.001 |
Insert response time histogram: each cell has the percentage of responses that take <= the time in the header and max is the max response time in seconds. For max values in the top 25% of the range have a red background and in the bottom 25% of the range have a green background. The red background is not used when the min value is within 80% of the max value.
| dbms | 256us | 1ms | 4ms | 16ms | 64ms | 256ms | 1s | 4s | 16s | gt | max |
|---|---|---|---|---|---|---|---|---|---|---|---|
| pg1222_o2nofp.cx10a_c8r32 | 67.933 | 32.044 | 0.017 | 0.006 | 0.017 | ||||||
| pg1323_o2nofp.cx10a_c8r32 | 67.467 | 32.522 | 0.011 | 0.012 | |||||||
| pg1422_o2nofp.cx10a_c8r32 | 68.711 | 31.267 | 0.022 | 0.013 | |||||||
| pg1517_o2nofp.cx10a_c8r32 | 67.161 | 32.817 | 0.017 | 0.006 | 0.017 | ||||||
| pg1613_o2nofp.cx10a_c8r32 | 69.167 | 30.817 | 0.011 | 0.006 | 0.018 | ||||||
| pg179_o2nofp.cx10a_c8r32 | 69.833 | 30.144 | 0.022 | 0.014 | |||||||
| pg183_o2nofp.cx10b_c8r32 | 73.317 | 26.661 | 0.022 | 0.014 |
Delete response time histogram: each cell has the percentage of responses that take <= the time in the header and max is the max response time in seconds. For max values in the top 25% of the range have a red background and in the bottom 25% of the range have a green background. The red background is not used when the min value is within 80% of the max value.
| dbms | 256us | 1ms | 4ms | 16ms | 64ms | 256ms | 1s | 4s | 16s | gt | max |
|---|---|---|---|---|---|---|---|---|---|---|---|
| pg1222_o2nofp.cx10a_c8r32 | 0.378 | 43.067 | 53.828 | 2.722 | 0.006 | 0.016 | |||||
| pg1323_o2nofp.cx10a_c8r32 | 0.211 | 26.411 | 70.278 | 3.100 | 0.012 | ||||||
| pg1422_o2nofp.cx10a_c8r32 | 0.106 | 31.744 | 64.128 | 4.022 | 0.012 | ||||||
| pg1517_o2nofp.cx10a_c8r32 | 0.061 | 31.089 | 64.900 | 3.944 | 0.006 | 0.016 | |||||
| pg1613_o2nofp.cx10a_c8r32 | 0.183 | 32.356 | 62.539 | 4.917 | 0.006 | 0.017 | |||||
| pg179_o2nofp.cx10a_c8r32 | 0.072 | 28.639 | 61.300 | 9.989 | 0.013 | ||||||
| pg183_o2nofp.cx10b_c8r32 | 0.167 | 27.739 | 68.578 | 3.517 | 0.013 |
Performance metrics for the DBMS listed above. Some are normalized by throughput, others are not. Legend for results is here.
ips	qps	rps	rmbps	wps	wmbps	rpq	rkbpq	wpi	wkbpi	csps	cpups	cspq	cpupq	dbgb1	dbgb2	rss	maxop	p50	p99	tag
500	13018	0	0.0	45.9	3.0	0.000	0.000	0.092	6.144	50527	10.7	3.881	66	8.2	37.1	0.3	0.001	13023	12846	pg1222_o2nofp.cx10a_c8r32
500	13153	0	0.0	46.2	3.0	0.000	0.000	0.092	6.138	51025	10.7	3.879	65	8.2	37.2	0.3	0.003	13166	12558	pg1323_o2nofp.cx10a_c8r32
499	13075	0	0.0	45.5	3.0	0.000	0.000	0.091	6.143	50688	10.5	3.877	64	8.0	36.9	0.3	0.001	13086	12926	pg1422_o2nofp.cx10a_c8r32
500	12974	0	0.0	43.4	3.0	0.000	0.000	0.087	6.080	50236	10.6	3.872	65	8.0	36.9	0.3	0.002	12990	12590	pg1517_o2nofp.cx10a_c8r32
500	13275	0	0.0	43.3	3.0	0.000	0.000	0.087	6.083	51377	10.4	3.870	63	8.0	36.7	3.4	0.002	13291	13131	pg1613_o2nofp.cx10a_c8r32
500	13115	0	0.0	42.0	3.0	0.000	0.000	0.084	6.067	50725	10.5	3.868	64	7.9	36.5	0.3	0.001	13129	12958	pg179_o2nofp.cx10a_c8r32
500	13140	0	0.0	41.7	3.0	0.000	0.000	0.084	6.056	50819	10.5	3.868	64	7.9	36.9	8.0	0.001	13150	13003	pg183_o2nofp.cx10b_c8r32
Average values from iostat.
r/s	rkB/s	rrqm/s	%rrqm	r_await	rareq-s	w/s	wkB/s	wrqm/s	%wrqm	w_await	wareq-s	d/s	dkB/s	drqm/s	%drqm	d_await	dareq-s	f/s	f_await	aqu-sz	%util
0.000	0.000	0.000	0.000	0.000	0.000	45.63	3028.9	4.191	8.971	0.634	61.65	2.084	1251.1	0.000	0.000	0.572	44.58	3.999	1.551	0.034	1.434		pg1222_o2nofp.cx10a_c8r32
0.000	0.000	0.000	0.000	0.000	0.000	45.86	3028.4	4.278	9.151	0.629	61.01	2.082	1251.1	0.000	0.000	0.559	76.43	3.993	1.582	0.033	1.431		pg1323_o2nofp.cx10a_c8r32
0.002	0.009	0.000	0.000	0.001	0.011	45.21	3027.6	4.468	9.757	0.668	61.91	2.084	1251.5	0.000	0.000	0.590	76.90	3.996	1.601	0.034	1.475		pg1422_o2nofp.cx10a_c8r32
0.002	0.007	0.000	0.000	0.001	0.011	43.11	2997.6	1.574	2.885	0.742	64.67	0.084	1241.5	0.000	0.000	0.007	41.68	3.987	1.621	0.034	1.374		pg1517_o2nofp.cx10a_c8r32
0.002	0.009	0.000	0.000	0.000	0.011	43.00	2999.5	1.555	2.585	0.767	65.07	0.082	1241.5	0.000	0.000	0.008	42.55	4.020	1.693	0.035	1.441		pg1613_o2nofp.cx10a_c8r32
0.003	0.013	0.000	0.000	0.000	0.011	41.72	2991.8	1.507	2.822	0.768	67.54	0.084	1241.5	0.000	0.000	0.008	41.68	3.271	1.601	0.033	1.269		pg179_o2nofp.cx10a_c8r32
0.003	0.011	0.000	0.000	0.001	0.022	41.42	2985.6	1.434	2.626	0.808	66.61	0.086	1241.5	0.000	0.000	0.010	82.61	3.214	1.665	0.033	1.271		pg183_o2nofp.cx10b_c8r32
qr1000.L5
qr1000.L5: range queries with 1000 insert/s per client. Graphs for performance per 1-second interval are here.
Average throughput:
Query response time histogram: each cell has the percentage of responses that take <= the time in the header and max is the max response time in seconds. For max values in the top 25% of the range have a red background and in the bottom 25% of the range have a green background. The red background is not used when the min value is within 80% of the max value.
| dbms | 256us | 1ms | 4ms | 16ms | 64ms | 256ms | 1s | 4s | 16s | gt | max |
|---|---|---|---|---|---|---|---|---|---|---|---|
| pg1222_o2nofp.cx10a_c8r32 | 99.990 | 0.010 | nonzero | nonzero | 0.005 | ||||||
| pg1323_o2nofp.cx10a_c8r32 | 99.991 | 0.009 | nonzero | nonzero | 0.005 | ||||||
| pg1422_o2nofp.cx10a_c8r32 | 99.990 | 0.010 | nonzero | nonzero | 0.004 | ||||||
| pg1517_o2nofp.cx10a_c8r32 | 99.991 | 0.009 | nonzero | 0.004 | |||||||
| pg1613_o2nofp.cx10a_c8r32 | 99.990 | 0.010 | nonzero | nonzero | 0.004 | ||||||
| pg179_o2nofp.cx10a_c8r32 | 99.990 | 0.010 | nonzero | nonzero | 0.004 | ||||||
| pg183_o2nofp.cx10b_c8r32 | 99.989 | 0.011 | nonzero | nonzero | 0.013 |
Insert response time histogram: each cell has the percentage of responses that take <= the time in the header and max is the max response time in seconds. For max values in the top 25% of the range have a red background and in the bottom 25% of the range have a green background. The red background is not used when the min value is within 80% of the max value.
| dbms | 256us | 1ms | 4ms | 16ms | 64ms | 256ms | 1s | 4s | 16s | gt | max |
|---|---|---|---|---|---|---|---|---|---|---|---|
| pg1222_o2nofp.cx10a_c8r32 | 78.258 | 21.736 | 0.006 | 0.013 | |||||||
| pg1323_o2nofp.cx10a_c8r32 | 76.292 | 23.706 | 0.003 | 0.005 | |||||||
| pg1422_o2nofp.cx10a_c8r32 | 75.917 | 24.081 | 0.003 | 0.004 | |||||||
| pg1517_o2nofp.cx10a_c8r32 | 75.289 | 24.708 | 0.003 | 0.005 | |||||||
| pg1613_o2nofp.cx10a_c8r32 | 74.975 | 25.022 | 0.003 | 0.005 | |||||||
| pg179_o2nofp.cx10a_c8r32 | 73.986 | 26.011 | 0.003 | 0.005 | |||||||
| pg183_o2nofp.cx10b_c8r32 | 74.311 | 25.683 | 0.003 | 0.003 | 0.018 |
Delete response time histogram: each cell has the percentage of responses that take <= the time in the header and max is the max response time in seconds. For max values in the top 25% of the range have a red background and in the bottom 25% of the range have a green background. The red background is not used when the min value is within 80% of the max value.
| dbms | 256us | 1ms | 4ms | 16ms | 64ms | 256ms | 1s | 4s | 16s | gt | max |
|---|---|---|---|---|---|---|---|---|---|---|---|
| pg1222_o2nofp.cx10a_c8r32 | 0.142 | 25.594 | 73.453 | 0.811 | 0.014 | ||||||
| pg1323_o2nofp.cx10a_c8r32 | 0.108 | 21.822 | 77.011 | 1.058 | 0.007 | ||||||
| pg1422_o2nofp.cx10a_c8r32 | 0.108 | 19.417 | 79.350 | 1.125 | 0.007 | ||||||
| pg1517_o2nofp.cx10a_c8r32 | 0.139 | 20.611 | 77.981 | 1.269 | 0.010 | ||||||
| pg1613_o2nofp.cx10a_c8r32 | 0.072 | 19.408 | 78.336 | 2.183 | 0.010 | ||||||
| pg179_o2nofp.cx10a_c8r32 | 0.064 | 20.536 | 74.336 | 5.064 | 0.007 | ||||||
| pg183_o2nofp.cx10b_c8r32 | 0.147 | 19.797 | 78.731 | 1.322 | 0.003 | 0.019 |
Performance metrics for the DBMS listed above. Some are normalized by throughput, others are not. Legend for results is here.
ips	qps	rps	rmbps	wps	wmbps	rpq	rkbpq	wpi	wkbpi	csps	cpups	cspq	cpupq	dbgb1	dbgb2	rss	maxop	p50	p99	tag
999	23825	0	0.0	54.6	3.5	0.000	0.000	0.055	3.555	91528	10.0	3.842	34	8.2	34.8	0.4	0.005	23757	21741	pg1222_o2nofp.cx10a_c8r32
999	23851	0	0.0	54.5	3.5	0.000	0.000	0.055	3.559	91581	9.8	3.840	33	8.2	34.8	0.4	0.005	23789	21756	pg1323_o2nofp.cx10a_c8r32
999	24270	0	0.0	54.2	3.5	0.000	0.000	0.054	3.583	93109	9.6	3.836	32	8.1	34.7	0.4	0.004	24258	22221	pg1422_o2nofp.cx10a_c8r32
999	24499	0	0.0	51.6	3.4	0.000	0.000	0.052	3.519	93891	9.6	3.832	31	8.0	34.6	0.4	0.004	24444	22476	pg1517_o2nofp.cx10a_c8r32
999	24444	0	0.0	51.8	3.4	0.000	0.000	0.052	3.502	93675	9.6	3.832	31	8.0	34.3	4.0	0.004	24392	22280	pg1613_o2nofp.cx10a_c8r32
999	24823	0	0.0	50.9	3.4	0.000	0.000	0.051	3.531	95027	9.6	3.828	31	8.0	34.2	0.4	0.004	24800	22349	pg179_o2nofp.cx10a_c8r32
999	24034	0	0.0	51.3	3.4	0.000	0.000	0.051	3.511	92018	9.8	3.829	33	8.0	34.6	0.3	0.013	23837	21980	pg183_o2nofp.cx10b_c8r32
Average values from iostat.
r/s	rkB/s	rrqm/s	%rrqm	r_await	rareq-s	w/s	wkB/s	wrqm/s	%wrqm	w_await	wareq-s	d/s	dkB/s	drqm/s	%drqm	d_await	dareq-s	f/s	f_await	aqu-sz	%util
0.000	0.000	0.000	0.000	0.000	0.000	54.37	3522.7	4.004	7.500	0.585	66.17	2.092	1387.9	0.000	0.000	0.580	79.62	4.632	1.583	0.035	1.534		pg1222_o2nofp.cx10a_c8r32
0.001	0.002	0.000	0.000	0.000	0.011	54.26	3529.0	3.915	7.255	0.578	66.98	2.092	1387.9	0.000	0.000	0.547	44.62	4.585	1.561	0.034	1.494		pg1323_o2nofp.cx10a_c8r32
0.001	0.004	0.000	0.000	0.000	0.011	53.97	3550.5	4.240	7.888	0.624	67.19	2.089	1379.2	0.000	0.000	0.589	46.48	4.581	1.677	0.037	1.599		pg1422_o2nofp.cx10a_c8r32
0.000	0.000	0.000	0.000	0.000	0.000	51.40	3488.5	1.841	2.921	0.696	70.30	0.091	1378.3	0.000	0.000	0.007	42.29	4.583	1.656	0.037	1.508		pg1517_o2nofp.cx10a_c8r32
0.001	0.002	0.000	0.000	0.000	0.011	51.54	3470.8	1.742	2.870	0.695	69.75	0.095	1378.3	0.000	0.000	0.007	74.42	4.602	1.585	0.037	1.484		pg1613_o2nofp.cx10a_c8r32
0.001	0.002	0.000	0.000	0.000	0.011	50.73	3500.9	1.802	2.892	0.735	71.54	0.091	1378.3	0.000	0.000	0.002	42.55	4.074	1.666	0.037	1.416		pg179_o2nofp.cx10a_c8r32
0.001	0.002	0.000	0.000	0.000	0.011	51.07	3478.8	1.715	2.777	0.745	70.01	0.089	1369.2	0.000	0.000	0.001	43.34	4.086	1.677	0.039	1.454		pg183_o2nofp.cx10b_c8r32
qp1000.L6
qp1000.L6: point queries with 1000 insert/s per client. Graphs for performance per 1-second interval are here.
Average throughput:
Query response time histogram: each cell has the percentage of responses that take <= the time in the header and max is the max response time in seconds. For max values in the top 25% of the range have a red background and in the bottom 25% of the range have a green background. The red background is not used when the min value is within 80% of the max value.
| dbms | 256us | 1ms | 4ms | 16ms | 64ms | 256ms | 1s | 4s | 16s | gt | max |
|---|---|---|---|---|---|---|---|---|---|---|---|
| pg1222_o2nofp.cx10a_c8r32 | 99.976 | 0.024 | nonzero | 0.001 | |||||||
| pg1323_o2nofp.cx10a_c8r32 | 99.977 | 0.023 | nonzero | 0.002 | |||||||
| pg1422_o2nofp.cx10a_c8r32 | 99.976 | 0.024 | nonzero | 0.003 | |||||||
| pg1517_o2nofp.cx10a_c8r32 | 99.979 | 0.021 | nonzero | 0.001 | |||||||
| pg1613_o2nofp.cx10a_c8r32 | 99.976 | 0.024 | 0.001 | ||||||||
| pg179_o2nofp.cx10a_c8r32 | 99.977 | 0.023 | 0.001 | ||||||||
| pg183_o2nofp.cx10b_c8r32 | 99.975 | 0.025 | nonzero | 0.001 |
Insert response time histogram: each cell has the percentage of responses that take <= the time in the header and max is the max response time in seconds. For max values in the top 25% of the range have a red background and in the bottom 25% of the range have a green background. The red background is not used when the min value is within 80% of the max value.
| dbms | 256us | 1ms | 4ms | 16ms | 64ms | 256ms | 1s | 4s | 16s | gt | max |
|---|---|---|---|---|---|---|---|---|---|---|---|
| pg1222_o2nofp.cx10a_c8r32 | 72.386 | 27.611 | 0.003 | 0.004 | |||||||
| pg1323_o2nofp.cx10a_c8r32 | 71.375 | 28.622 | 0.003 | 0.005 | |||||||
| pg1422_o2nofp.cx10a_c8r32 | 71.106 | 28.889 | 0.006 | 0.012 | |||||||
| pg1517_o2nofp.cx10a_c8r32 | 69.175 | 30.822 | 0.003 | 0.005 | |||||||
| pg1613_o2nofp.cx10a_c8r32 | 70.483 | 29.511 | 0.006 | 0.011 | |||||||
| pg179_o2nofp.cx10a_c8r32 | 67.828 | 32.169 | 0.003 | 0.004 | |||||||
| pg183_o2nofp.cx10b_c8r32 | 71.292 | 28.689 | 0.017 | 0.003 | 0.016 |
Delete response time histogram: each cell has the percentage of responses that take <= the time in the header and max is the max response time in seconds. For max values in the top 25% of the range have a red background and in the bottom 25% of the range have a green background. The red background is not used when the min value is within 80% of the max value.
| dbms | 256us | 1ms | 4ms | 16ms | 64ms | 256ms | 1s | 4s | 16s | gt | max |
|---|---|---|---|---|---|---|---|---|---|---|---|
| pg1222_o2nofp.cx10a_c8r32 | 0.122 | 22.922 | 76.081 | 0.875 | 0.008 | ||||||
| pg1323_o2nofp.cx10a_c8r32 | 0.089 | 17.869 | 80.722 | 1.319 | 0.008 | ||||||
| pg1422_o2nofp.cx10a_c8r32 | 0.053 | 17.750 | 80.564 | 1.633 | 0.010 | ||||||
| pg1517_o2nofp.cx10a_c8r32 | 0.072 | 15.517 | 82.819 | 1.592 | 0.008 | ||||||
| pg1613_o2nofp.cx10a_c8r32 | 0.075 | 19.869 | 78.289 | 1.767 | 0.010 | ||||||
| pg179_o2nofp.cx10a_c8r32 | 0.042 | 17.506 | 77.344 | 5.108 | 0.009 | ||||||
| pg183_o2nofp.cx10b_c8r32 | 0.103 | 18.703 | 78.828 | 2.367 | 0.015 |
Performance metrics for the DBMS listed above. Some are normalized by throughput, others are not. Legend for results is here.
ips	qps	rps	rmbps	wps	wmbps	rpq	rkbpq	wpi	wkbpi	csps	cpups	cspq	cpupq	dbgb1	dbgb2	rss	maxop	p50	p99	tag
999	13082	0	0.0	44.8	3.6	0.000	0.000	0.045	3.646	51033	10.9	3.901	67	8.2	32.0	0.3	0.001	13102	12911	pg1222_o2nofp.cx10a_c8r32
999	13114	0	0.0	44.8	3.6	0.000	0.000	0.045	3.653	51134	10.9	3.899	66	8.2	32.0	7.6	0.002	13129	12910	pg1323_o2nofp.cx10a_c8r32
999	13017	0	0.0	44.5	3.5	0.000	0.000	0.045	3.628	50680	10.8	3.893	66	8.1	31.9	0.3	0.003	13036	12877	pg1422_o2nofp.cx10a_c8r32
999	12980	0	0.0	42.5	3.5	0.000	0.000	0.043	3.577	50465	10.8	3.888	67	8.0	31.9	0.3	0.001	12990	12830	pg1517_o2nofp.cx10a_c8r32
999	13263	0	0.0	42.2	3.5	0.000	0.000	0.042	3.573	51581	10.7	3.889	65	8.0	31.5	3.5	0.001	13278	13100	pg1613_o2nofp.cx10a_c8r32
999	13204	0	0.0	41.4	3.5	0.000	0.000	0.041	3.607	51245	10.9	3.881	66	8.1	31.5	0.3	0.001	13213	13051	pg179_o2nofp.cx10a_c8r32
999	13027	0	0.0	46.9	4.2	0.000	0.000	0.047	4.311	50593	11.0	3.884	68	8.0	31.9	0.3	0.001	13038	12830	pg183_o2nofp.cx10b_c8r32
Average values from iostat.
r/s	rkB/s	rrqm/s	%rrqm	r_await	rareq-s	w/s	wkB/s	wrqm/s	%wrqm	w_await	wareq-s	d/s	dkB/s	drqm/s	%drqm	d_await	dareq-s	f/s	f_await	aqu-sz	%util
0.000	0.000	0.000	0.000	0.000	0.000	44.42	3598.0	3.867	7.684	0.504	79.05	2.108	1643.5	0.000	0.000	0.549	45.88	4.124	1.608	0.026	1.334		pg1222_o2nofp.cx10a_c8r32
0.000	0.000	0.000	0.000	0.000	0.000	44.48	3607.3	3.976	8.035	0.511	79.23	2.109	1652.6	0.000	0.000	0.559	46.03	4.117	1.645	0.026	1.346		pg1323_o2nofp.cx10a_c8r32
0.000	0.000	0.000	0.000	0.000	0.000	44.13	3580.8	4.003	8.202	0.525	79.15	2.105	1643.9	0.000	0.000	0.544	46.25	4.146	1.617	0.027	1.373		pg1422_o2nofp.cx10a_c8r32
0.001	0.002	0.000	0.000	0.000	0.011	42.11	3532.1	1.835	2.973	0.608	82.91	0.111	1624.8	0.000	0.000	0.005	41.26	4.129	1.609	0.027	1.316		pg1517_o2nofp.cx10a_c8r32
0.000	0.000	0.000	0.000	0.000	0.000	41.88	3525.7	1.783	2.801	0.590	82.97	0.108	1633.9	0.000	0.000	0.004	42.34	4.127	1.608	0.027	1.278		pg1613_o2nofp.cx10a_c8r32
0.000	0.000	0.000	0.000	0.000	0.000	41.07	3562.6	1.767	3.034	0.610	86.53	0.106	1624.8	0.000	0.000	0.007	85.29	3.445	1.651	0.026	1.162		pg179_o2nofp.cx10a_c8r32
0.000	0.000	0.000	0.000	0.000	0.000	46.49	4258.8	1.792	3.153	0.683	84.09	0.106	1633.9	0.000	0.000	0.004	43.01	3.123	1.704	0.030	1.145		pg183_o2nofp.cx10b_c8r32
l.i0
l.i0: load without secondary indexes
Performance metrics for all DBMS, not just the ones listed above. Some are normalized by throughput, others are not. Legend for results is here.
ips	qps	rps	rmbps	wps	wmbps	rpq	rkbpq	wpi	wkbpi	csps	cpups	cspq	cpupq	dbgb1	dbgb2	rss	maxop	p50	p99	tag
198675	0	0	0.0	733.8	83.2	0.000	0.000	0.004	0.429	24613	21.8	0.124	9	2.9	7.8	2.3	0.003	198974	196869	pg1222_o2nofp.cx10a_c8r32
205479	0	0	0.0	764.7	86.6	0.000	0.000	0.004	0.432	25330	20.3	0.123	8	2.9	7.8	2.4	0.002	206377	198181	pg1323_o2nofp.cx10a_c8r32
201342	0	0	0.0	750.4	85.2	0.000	0.000	0.004	0.433	24659	19.4	0.122	8	2.9	7.8	1.7	0.002	202173	193880	pg1422_o2nofp.cx10a_c8r32
206896	0	0	0.0	764.6	86.9	0.000	0.000	0.004	0.430	25003	19.5	0.121	8	2.9	7.8	2.4	0.003	207076	199967	pg1517_o2nofp.cx10a_c8r32
205479	0	0	0.0	761.1	86.5	0.000	0.000	0.004	0.431	24865	19.5	0.121	8	2.9	7.8	2.4	0.003	206377	198773	pg1613_o2nofp.cx10a_c8r32
209790	0	0	0.0	781.3	88.8	0.000	0.000	0.004	0.433	21920	19.5	0.104	7	2.9	7.8	2.4	0.003	210373	201867	pg179_o2nofp.cx10a_c8r32
206896	0	0	0.0	765.0	87.0	0.000	0.000	0.004	0.431	21647	19.4	0.105	8	2.9	7.8	2.4	0.003	208471	199967	pg183_o2nofp.cx10b_c8r32
l.x
l.x: create secondary indexes
Performance metrics for all DBMS, not just the ones listed above. Some are normalized by throughput, others are not. Legend for results is here.
ips	qps	rps	rmbps	wps	wmbps	rpq	rkbpq	wpi	wkbpi	csps	cpups	cspq	cpupq	dbgb1	dbgb2	rss	maxop	p50	p99	tag
461540	0	0	0.0	834.9	102.4	0.000	0.000	0.002	0.227	2301	11.7	0.005	2	5.8	13.3	3.0	0.001	NA	NA	pg1222_o2nofp.cx10a_c8r32
454547	0	1	0.0	898.0	110.0	0.000	0.000	0.002	0.248	2674	11.7	0.006	2	5.8	13.3	3.0	0.002	NA	NA	pg1323_o2nofp.cx10a_c8r32
447763	0	0	0.0	892.6	109.3	0.000	0.000	0.002	0.250	2637	11.6	0.006	2	5.8	13.3	3.0	0.002	NA	NA	pg1422_o2nofp.cx10a_c8r32
468752	0	0	0.0	897.6	110.2	0.000	0.000	0.002	0.241	2526	11.6	0.005	2	5.8	13.3	3.0	0.002	NA	NA	pg1517_o2nofp.cx10a_c8r32
483872	0	1	0.0	920.2	112.9	0.000	0.000	0.002	0.239	2567	11.6	0.005	2	5.8	13.3	3.1	0.002	NA	NA	pg1613_o2nofp.cx10a_c8r32
491805	0	1	0.0	997.7	122.5	0.000	0.000	0.002	0.255	2894	11.6	0.006	2	5.8	13.3	3.0	0.001	NA	NA	pg179_o2nofp.cx10a_c8r32
491805	0	1	0.0	1072.7	131.8	0.000	0.000	0.002	0.275	2772	11.7	0.006	2	5.8	13.3	3.0	0.002	NA	NA	pg183_o2nofp.cx10b_c8r32
l.i1
l.i1: continue load after secondary indexes created with 50 inserts per transaction
Performance metrics for all DBMS, not just the ones listed above. Some are normalized by throughput, others are not. Legend for results is here.
ips	qps	rps	rmbps	wps	wmbps	rpq	rkbpq	wpi	wkbpi	csps	cpups	cspq	cpupq	dbgb1	dbgb2	rss	maxop	p50	p99	tag
24316	0	0	0.0	301.5	32.5	0.000	0.000	0.012	1.370	12248	22.1	0.504	73	8.1	38.6	5.5	0.016	16798	10398	pg1222_o2nofp.cx10a_c8r32
22779	0	0	0.0	284.5	30.7	0.000	0.000	0.012	1.379	11500	21.8	0.505	77	8.1	38.7	8.1	0.041	15998	10049	pg1323_o2nofp.cx10a_c8r32
21966	0	0	0.0	271.6	29.2	0.000	0.000	0.012	1.363	10656	20.3	0.485	74	7.9	38.4	7.0	0.026	15048	9448	pg1422_o2nofp.cx10a_c8r32
23571	0	0	0.0	289.7	31.4	0.000	0.000	0.012	1.364	11845	20.6	0.503	70	7.8	38.4	7.7	0.030	18247	12798	pg1517_o2nofp.cx10a_c8r32
20555	0	0	0.0	251.3	27.2	0.000	0.000	0.012	1.354	10430	19.7	0.507	77	7.8	38.3	6.1	0.033	13898	7149	pg1613_o2nofp.cx10a_c8r32
20779	0	0	0.0	249.3	28.1	0.000	0.000	0.012	1.386	8595	19.8	0.414	76	7.8	38.3	1.6	0.034	13698	9247	pg179_o2nofp.cx10a_c8r32
22002	0	0	0.0	277.5	30.5	0.000	0.000	0.013	1.419	9108	20.2	0.414	73	7.8	38.3	7.8	0.045	16797	11898	pg183_o2nofp.cx10b_c8r32
l.i2
l.i2: continue load after secondary indexes created with 5 inserts per transaction
Performance metrics for all DBMS, not just the ones listed above. Some are normalized by throughput, others are not. Legend for results is here.
ips	qps	rps	rmbps	wps	wmbps	rpq	rkbpq	wpi	wkbpi	csps	cpups	cspq	cpupq	dbgb1	dbgb2	rss	maxop	p50	p99	tag
3126	0	0	0.0	67.6	6.5	0.000	0.000	0.022	2.115	14706	15.9	4.705	407	8.2	40.8	6.6	0.023	2260	1360	pg1222_o2nofp.cx10a_c8r32
2826	0	0	0.0	65.1	6.2	0.000	0.000	0.023	2.235	13392	15.8	4.739	447	8.1	40.6	5.7	0.003	1925	1235	pg1323_o2nofp.cx10a_c8r32
2589	0	0	0.0	61.0	5.7	0.000	0.000	0.024	2.258	11760	15.2	4.542	470	7.9	40.2	8.0	0.003	1820	1284	pg1422_o2nofp.cx10a_c8r32
2863	0	0	0.0	62.3	6.1	0.000	0.000	0.022	2.174	13013	15.3	4.546	428	7.9	40.3	0.2	0.006	2155	1380	pg1517_o2nofp.cx10a_c8r32
2487	0	0	0.0	56.8	5.5	0.000	0.000	0.023	2.259	11336	15.1	4.558	486	7.9	39.9	6.4	0.005	1620	975	pg1613_o2nofp.cx10a_c8r32
2509	0	0	0.0	55.8	5.5	0.000	0.000	0.022	2.234	9448	15.2	3.765	485	7.9	39.7	0.3	0.003	1780	1190	pg179_o2nofp.cx10a_c8r32
2674	0	0	0.0	58.6	5.8	0.000	0.000	0.022	2.230	10058	15.1	3.762	452	7.9	40.3	1.7	0.004	1920	1375	pg183_o2nofp.cx10b_c8r32
qr100.L1
qr100.L1: range queries with 100 insert/s per client
Performance metrics for all DBMS, not just the ones listed above. Some are normalized by throughput, others are not. Legend for results is here.
ips	qps	rps	rmbps	wps	wmbps	rpq	rkbpq	wpi	wkbpi	csps	cpups	cspq	cpupq	dbgb1	dbgb2	rss	maxop	p50	p99	tag
100	25857	0	0.0	15.0	0.8	0.000	0.000	0.150	7.776	98735	8.5	3.818	26	8.2	40.8	0.1	0.001	25863	25389	pg1222_o2nofp.cx10a_c8r32
100	26064	0	0.0	14.9	0.8	0.000	0.000	0.149	7.795	99526	8.6	3.818	26	8.1	40.6	0.1	0.001	26060	25574	pg1323_o2nofp.cx10a_c8r32
100	26411	0	0.0	15.4	0.8	0.000	0.000	0.155	7.938	100861	9.0	3.819	27	7.9	40.2	0.1	0.002	26443	26022	pg1422_o2nofp.cx10a_c8r32
100	26515	0	0.0	13.1	0.8	0.000	0.000	0.131	7.692	101173	8.6	3.816	26	7.9	40.3	0.1	0.004	26535	26189	pg1517_o2nofp.cx10a_c8r32
100	26732	0	0.0	13.0	0.8	0.000	0.000	0.130	7.706	102002	8.1	3.816	24	7.9	39.9	0.1	0.003	26731	26299	pg1613_o2nofp.cx10a_c8r32
100	27209	0	0.0	12.2	0.8	0.000	0.000	0.123	7.737	103865	8.3	3.817	24	7.9	39.7	0.1	0.003	27241	26817	pg179_o2nofp.cx10a_c8r32
100	26083	0	0.0	12.3	0.8	0.000	0.000	0.123	7.731	99517	8.5	3.815	26	7.9	40.3	0.1	0.001	26107	25673	pg183_o2nofp.cx10b_c8r32
qp100.L2
qp100.L2: point queries with 100 insert/s per client
Performance metrics for all DBMS, not just the ones listed above. Some are normalized by throughput, others are not. Legend for results is here.
ips	qps	rps	rmbps	wps	wmbps	rpq	rkbpq	wpi	wkbpi	csps	cpups	cspq	cpupq	dbgb1	dbgb2	rss	maxop	p50	p99	tag
100	13114	0	0.0	63.4	1.7	0.000	0.000	0.634	17.064	50722	10.1	3.868	62	8.2	40.4	0.2	0.001	13115	12970	pg1222_o2nofp.cx10a_c8r32
100	13244	0	0.0	63.4	1.7	0.000	0.000	0.634	17.056	51220	9.8	3.867	59	8.1	40.4	0.2	0.001	13246	13128	pg1323_o2nofp.cx10a_c8r32
100	13170	0	0.0	62.5	1.7	0.000	0.000	0.626	17.036	50907	10.1	3.866	61	7.9	40.2	0.1	0.002	13182	13067	pg1422_o2nofp.cx10a_c8r32
100	13015	0	0.0	60.3	1.6	0.000	0.000	0.603	16.783	50242	10.0	3.860	61	7.9	40.2	0.1	0.003	13020	12924	pg1517_o2nofp.cx10a_c8r32
100	13294	0	0.0	60.0	1.6	0.000	0.000	0.601	16.787	51316	9.7	3.860	58	7.9	39.9	0.1	0.001	13294	13166	pg1613_o2nofp.cx10a_c8r32
100	13206	0	0.0	59.0	1.6	0.000	0.000	0.591	16.790	50995	10.1	3.861	61	7.9	39.7	0.1	0.002	13214	13102	pg179_o2nofp.cx10a_c8r32
100	13208	0	0.0	58.7	1.6	0.000	0.000	0.588	16.787	50972	10.1	3.859	61	7.9	40.2	0.1	0.001	13214	13086	pg183_o2nofp.cx10b_c8r32
qr500.L3
qr500.L3: range queries with 500 insert/s per client
Performance metrics for all DBMS, not just the ones listed above. Some are normalized by throughput, others are not. Legend for results is here.
ips	qps	rps	rmbps	wps	wmbps	rpq	rkbpq	wpi	wkbpi	csps	cpups	cspq	cpupq	dbgb1	dbgb2	rss	maxop	p50	p99	tag
499	23695	0	0.0	70.5	2.2	0.000	0.000	0.141	4.604	90778	9.4	3.831	32	8.2	39.3	0.4	0.002	23709	22393	pg1222_o2nofp.cx10a_c8r32
500	23799	0	0.0	70.6	2.3	0.000	0.000	0.141	4.618	91128	9.4	3.829	32	8.2	39.3	0.4	0.002	23799	22491	pg1323_o2nofp.cx10a_c8r32
499	24210	0	0.0	69.8	2.3	0.000	0.000	0.140	4.646	92639	9.3	3.826	31	7.9	39.0	0.3	0.002	24216	22874	pg1422_o2nofp.cx10a_c8r32
500	24642	0	0.0	67.5	2.2	0.000	0.000	0.135	4.589	94200	9.3	3.823	30	7.9	39.0	0.3	0.002	24636	23371	pg1517_o2nofp.cx10a_c8r32
500	24585	0	0.0	67.8	2.3	0.000	0.000	0.136	4.642	93980	9.2	3.823	30	8.0	38.8	3.7	0.002	24589	23293	pg1613_o2nofp.cx10a_c8r32
499	24727	0	0.0	66.8	2.2	0.000	0.000	0.134	4.599	94527	9.1	3.823	29	7.9	38.6	0.3	0.002	24779	23210	pg179_o2nofp.cx10a_c8r32
500	24064	0	0.0	66.7	2.2	0.000	0.000	0.134	4.609	91953	9.4	3.821	31	7.9	39.0	0.3	0.001	24039	22620	pg183_o2nofp.cx10b_c8r32
qp500.L4
qp500.L4: point queries with 500 insert/s per client
Performance metrics for all DBMS, not just the ones listed above. Some are normalized by throughput, others are not. Legend for results is here.
ips	qps	rps	rmbps	wps	wmbps	rpq	rkbpq	wpi	wkbpi	csps	cpups	cspq	cpupq	dbgb1	dbgb2	rss	maxop	p50	p99	tag
500	13018	0	0.0	45.9	3.0	0.000	0.000	0.092	6.144	50527	10.7	3.881	66	8.2	37.1	0.3	0.001	13023	12846	pg1222_o2nofp.cx10a_c8r32
500	13153	0	0.0	46.2	3.0	0.000	0.000	0.092	6.138	51025	10.7	3.879	65	8.2	37.2	0.3	0.003	13166	12558	pg1323_o2nofp.cx10a_c8r32
499	13075	0	0.0	45.5	3.0	0.000	0.000	0.091	6.143	50688	10.5	3.877	64	8.0	36.9	0.3	0.001	13086	12926	pg1422_o2nofp.cx10a_c8r32
500	12974	0	0.0	43.4	3.0	0.000	0.000	0.087	6.080	50236	10.6	3.872	65	8.0	36.9	0.3	0.002	12990	12590	pg1517_o2nofp.cx10a_c8r32
500	13275	0	0.0	43.3	3.0	0.000	0.000	0.087	6.083	51377	10.4	3.870	63	8.0	36.7	3.4	0.002	13291	13131	pg1613_o2nofp.cx10a_c8r32
500	13115	0	0.0	42.0	3.0	0.000	0.000	0.084	6.067	50725	10.5	3.868	64	7.9	36.5	0.3	0.001	13129	12958	pg179_o2nofp.cx10a_c8r32
500	13140	0	0.0	41.7	3.0	0.000	0.000	0.084	6.056	50819	10.5	3.868	64	7.9	36.9	8.0	0.001	13150	13003	pg183_o2nofp.cx10b_c8r32
qr1000.L5
qr1000.L5: range queries with 1000 insert/s per client
Performance metrics for all DBMS, not just the ones listed above. Some are normalized by throughput, others are not. Legend for results is here.
ips	qps	rps	rmbps	wps	wmbps	rpq	rkbpq	wpi	wkbpi	csps	cpups	cspq	cpupq	dbgb1	dbgb2	rss	maxop	p50	p99	tag
999	23825	0	0.0	54.6	3.5	0.000	0.000	0.055	3.555	91528	10.0	3.842	34	8.2	34.8	0.4	0.005	23757	21741	pg1222_o2nofp.cx10a_c8r32
999	23851	0	0.0	54.5	3.5	0.000	0.000	0.055	3.559	91581	9.8	3.840	33	8.2	34.8	0.4	0.005	23789	21756	pg1323_o2nofp.cx10a_c8r32
999	24270	0	0.0	54.2	3.5	0.000	0.000	0.054	3.583	93109	9.6	3.836	32	8.1	34.7	0.4	0.004	24258	22221	pg1422_o2nofp.cx10a_c8r32
999	24499	0	0.0	51.6	3.4	0.000	0.000	0.052	3.519	93891	9.6	3.832	31	8.0	34.6	0.4	0.004	24444	22476	pg1517_o2nofp.cx10a_c8r32
999	24444	0	0.0	51.8	3.4	0.000	0.000	0.052	3.502	93675	9.6	3.832	31	8.0	34.3	4.0	0.004	24392	22280	pg1613_o2nofp.cx10a_c8r32
999	24823	0	0.0	50.9	3.4	0.000	0.000	0.051	3.531	95027	9.6	3.828	31	8.0	34.2	0.4	0.004	24800	22349	pg179_o2nofp.cx10a_c8r32
999	24034	0	0.0	51.3	3.4	0.000	0.000	0.051	3.511	92018	9.8	3.829	33	8.0	34.6	0.3	0.013	23837	21980	pg183_o2nofp.cx10b_c8r32
qp1000.L6
qp1000.L6: point queries with 1000 insert/s per client
Performance metrics for all DBMS, not just the ones listed above. Some are normalized by throughput, others are not. Legend for results is here.
ips	qps	rps	rmbps	wps	wmbps	rpq	rkbpq	wpi	wkbpi	csps	cpups	cspq	cpupq	dbgb1	dbgb2	rss	maxop	p50	p99	tag
999	13082	0	0.0	44.8	3.6	0.000	0.000	0.045	3.646	51033	10.9	3.901	67	8.2	32.0	0.3	0.001	13102	12911	pg1222_o2nofp.cx10a_c8r32
999	13114	0	0.0	44.8	3.6	0.000	0.000	0.045	3.653	51134	10.9	3.899	66	8.2	32.0	7.6	0.002	13129	12910	pg1323_o2nofp.cx10a_c8r32
999	13017	0	0.0	44.5	3.5	0.000	0.000	0.045	3.628	50680	10.8	3.893	66	8.1	31.9	0.3	0.003	13036	12877	pg1422_o2nofp.cx10a_c8r32
999	12980	0	0.0	42.5	3.5	0.000	0.000	0.043	3.577	50465	10.8	3.888	67	8.0	31.9	0.3	0.001	12990	12830	pg1517_o2nofp.cx10a_c8r32
999	13263	0	0.0	42.2	3.5	0.000	0.000	0.042	3.573	51581	10.7	3.889	65	8.0	31.5	3.5	0.001	13278	13100	pg1613_o2nofp.cx10a_c8r32
999	13204	0	0.0	41.4	3.5	0.000	0.000	0.041	3.607	51245	10.9	3.881	66	8.1	31.5	0.3	0.001	13213	13051	pg179_o2nofp.cx10a_c8r32
999	13027	0	0.0	46.9	4.2	0.000	0.000	0.047	4.311	50593	11.0	3.884	68	8.0	31.9	0.3	0.001	13038	12830	pg183_o2nofp.cx10b_c8r32
l.i0
- l.i0: load without secondary indexes
- Legend for results is here.
- Each entry lists the percentage of responses that fit in that bucket (slower than max time for previous bucket, faster than min time for next bucket).
Insert response time histogram
256us	1ms	4ms	16ms	64ms	256ms	1s	4s	16s	gt	max	tag
0.000	99.984	0.016	0.000	0.000	0.000	0.000	0.000	0.000	0.000	0.003	pg1222_o2nofp.cx10a_c8r32
0.000	99.987	0.013	0.000	0.000	0.000	0.000	0.000	0.000	0.000	0.002	pg1323_o2nofp.cx10a_c8r32
0.000	99.987	0.013	0.000	0.000	0.000	0.000	0.000	0.000	0.000	0.002	pg1422_o2nofp.cx10a_c8r32
0.000	99.992	0.008	0.000	0.000	0.000	0.000	0.000	0.000	0.000	0.003	pg1517_o2nofp.cx10a_c8r32
0.000	99.995	0.005	0.000	0.000	0.000	0.000	0.000	0.000	0.000	0.003	pg1613_o2nofp.cx10a_c8r32
0.000	99.990	0.010	0.000	0.000	0.000	0.000	0.000	0.000	0.000	0.003	pg179_o2nofp.cx10a_c8r32
0.000	99.992	0.008	0.000	0.000	0.000	0.000	0.000	0.000	0.000	0.003	pg183_o2nofp.cx10b_c8r32
l.x
- l.x: create secondary indexes
- Legend for results is here.
- Each entry lists the percentage of responses that fit in that bucket (slower than max time for previous bucket, faster than min time for next bucket).
TODO - determine whether there is data for create index response time
l.i1
- l.i1: continue load after secondary indexes created with 50 inserts per transaction
- Legend for results is here.
- Each entry lists the percentage of responses that fit in that bucket (slower than max time for previous bucket, faster than min time for next bucket).
Insert response time histogram
256us	1ms	4ms	16ms	64ms	256ms	1s	4s	16s	gt	max	tag
0.000	60.374	39.625	0.001	0.000	0.000	0.000	0.000	0.000	0.000	0.016	pg1222_o2nofp.cx10a_c8r32
0.000	58.417	41.581	0.001	nonzero	0.000	0.000	0.000	0.000	0.000	0.041	pg1323_o2nofp.cx10a_c8r32
0.000	56.924	43.076	nonzero	nonzero	0.000	0.000	0.000	0.000	0.000	0.026	pg1422_o2nofp.cx10a_c8r32
0.000	57.026	42.973	0.001	nonzero	0.000	0.000	0.000	0.000	0.000	0.030	pg1517_o2nofp.cx10a_c8r32
0.000	63.599	36.396	0.005	nonzero	0.000	0.000	0.000	0.000	0.000	0.033	pg1613_o2nofp.cx10a_c8r32
0.000	55.229	44.770	nonzero	0.001	0.000	0.000	0.000	0.000	0.000	0.034	pg179_o2nofp.cx10a_c8r32
0.000	50.193	49.805	nonzero	0.002	0.000	0.000	0.000	0.000	0.000	0.045	pg183_o2nofp.cx10b_c8r32
Delete response time histogram
256us	1ms	4ms	16ms	64ms	256ms	1s	4s	16s	gt	max	tag
0.007	32.052	59.559	8.381	nonzero	0.000	0.000	0.000	0.000	0.000	0.030	pg1222_o2nofp.cx10a_c8r32
0.002	28.085	61.130	10.781	0.001	0.000	0.000	0.000	0.000	0.000	0.045	pg1323_o2nofp.cx10a_c8r32
0.002	29.019	56.285	14.694	nonzero	0.000	0.000	0.000	0.000	0.000	0.030	pg1422_o2nofp.cx10a_c8r32
0.000	27.267	72.248	0.484	0.001	0.000	0.000	0.000	0.000	0.000	0.044	pg1517_o2nofp.cx10a_c8r32
0.001	27.370	53.859	18.771	nonzero	0.000	0.000	0.000	0.000	0.000	0.033	pg1613_o2nofp.cx10a_c8r32
0.003	27.183	54.944	17.867	0.002	0.000	0.000	0.000	0.000	0.000	0.037	pg179_o2nofp.cx10a_c8r32
0.001	26.053	71.138	2.807	0.001	0.000	0.000	0.000	0.000	0.000	0.045	pg183_o2nofp.cx10b_c8r32
l.i2
- l.i2: continue load after secondary indexes created with 5 inserts per transaction
- Legend for results is here.
- Each entry lists the percentage of responses that fit in that bucket (slower than max time for previous bucket, faster than min time for next bucket).
Insert response time histogram
256us	1ms	4ms	16ms	64ms	256ms	1s	4s	16s	gt	max	tag
60.636	39.364	nonzero	0.000	nonzero	0.000	0.000	0.000	0.000	0.000	0.023	pg1222_o2nofp.cx10a_c8r32
54.767	45.232	nonzero	0.000	0.000	0.000	0.000	0.000	0.000	0.000	0.003	pg1323_o2nofp.cx10a_c8r32
46.966	53.033	nonzero	0.000	0.000	0.000	0.000	0.000	0.000	0.000	0.003	pg1422_o2nofp.cx10a_c8r32
55.573	44.427	nonzero	nonzero	0.000	0.000	0.000	0.000	0.000	0.000	0.006	pg1517_o2nofp.cx10a_c8r32
51.130	48.870	nonzero	nonzero	0.000	0.000	0.000	0.000	0.000	0.000	0.005	pg1613_o2nofp.cx10a_c8r32
44.147	55.853	nonzero	0.000	0.000	0.000	0.000	0.000	0.000	0.000	0.003	pg179_o2nofp.cx10a_c8r32
49.579	50.421	0.001	nonzero	0.000	0.000	0.000	0.000	0.000	0.000	0.004	pg183_o2nofp.cx10b_c8r32
Delete response time histogram
256us	1ms	4ms	16ms	64ms	256ms	1s	4s	16s	gt	max	tag
5.287	28.365	66.307	0.040	nonzero	0.000	0.000	0.000	0.000	0.000	0.024	pg1222_o2nofp.cx10a_c8r32
4.901	32.371	62.037	0.690	0.000	0.000	0.000	0.000	0.000	0.000	0.011	pg1323_o2nofp.cx10a_c8r32
4.833	27.857	67.149	0.161	0.000	0.000	0.000	0.000	0.000	0.000	0.007	pg1422_o2nofp.cx10a_c8r32
4.826	22.556	72.594	0.023	0.000	0.000	0.000	0.000	0.000	0.000	0.008	pg1517_o2nofp.cx10a_c8r32
4.191	31.853	56.615	7.341	nonzero	0.000	0.000	0.000	0.000	0.000	0.017	pg1613_o2nofp.cx10a_c8r32
4.576	27.340	66.904	1.179	0.000	0.000	0.000	0.000	0.000	0.000	0.007	pg179_o2nofp.cx10a_c8r32
4.355	26.289	69.322	0.034	nonzero	0.000	0.000	0.000	0.000	0.000	0.024	pg183_o2nofp.cx10b_c8r32
qr100.L1
- qr100.L1: range queries with 100 insert/s per client
- Legend for results is here.
- Each entry lists the percentage of responses that fit in that bucket (slower than max time for previous bucket, faster than min time for next bucket).
Query response time histogram
256us	1ms	4ms	16ms	64ms	256ms	1s	4s	16s	gt	max	tag
99.993	0.007	0.000	0.000	0.000	0.000	0.000	0.000	0.000	0.000	0.001	pg1222_o2nofp.cx10a_c8r32
99.994	0.006	0.000	0.000	0.000	0.000	0.000	0.000	0.000	0.000	0.001	pg1323_o2nofp.cx10a_c8r32
99.995	0.005	nonzero	0.000	0.000	0.000	0.000	0.000	0.000	0.000	0.002	pg1422_o2nofp.cx10a_c8r32
99.995	0.005	nonzero	0.000	0.000	0.000	0.000	0.000	0.000	0.000	0.004	pg1517_o2nofp.cx10a_c8r32
99.995	0.005	nonzero	0.000	0.000	0.000	0.000	0.000	0.000	0.000	0.003	pg1613_o2nofp.cx10a_c8r32
99.994	0.006	nonzero	0.000	0.000	0.000	0.000	0.000	0.000	0.000	0.003	pg179_o2nofp.cx10a_c8r32
99.993	0.007	0.000	0.000	0.000	0.000	0.000	0.000	0.000	0.000	0.001	pg183_o2nofp.cx10b_c8r32
Insert response time histogram
256us	1ms	4ms	16ms	64ms	256ms	1s	4s	16s	gt	max	tag
0.000	9.722	90.250	0.028	0.000	0.000	0.000	0.000	0.000	0.000	0.005	pg1222_o2nofp.cx10a_c8r32
0.000	9.944	90.028	0.028	0.000	0.000	0.000	0.000	0.000	0.000	0.005	pg1323_o2nofp.cx10a_c8r32
0.000	13.667	86.306	0.028	0.000	0.000	0.000	0.000	0.000	0.000	0.005	pg1422_o2nofp.cx10a_c8r32
0.000	13.500	86.472	0.028	0.000	0.000	0.000	0.000	0.000	0.000	0.005	pg1517_o2nofp.cx10a_c8r32
0.000	15.528	84.444	0.028	0.000	0.000	0.000	0.000	0.000	0.000	0.005	pg1613_o2nofp.cx10a_c8r32
0.000	22.306	77.667	0.028	0.000	0.000	0.000	0.000	0.000	0.000	0.005	pg179_o2nofp.cx10a_c8r32
0.000	23.972	76.000	0.028	0.000	0.000	0.000	0.000	0.000	0.000	0.005	pg183_o2nofp.cx10b_c8r32
Delete response time histogram
256us	1ms	4ms	16ms	64ms	256ms	1s	4s	16s	gt	max	tag
0.000	66.389	33.611	0.000	0.000	0.000	0.000	0.000	0.000	0.000	0.002	pg1222_o2nofp.cx10a_c8r32
0.000	66.444	33.556	0.000	0.000	0.000	0.000	0.000	0.000	0.000	0.002	pg1323_o2nofp.cx10a_c8r32
0.000	64.444	35.556	0.000	0.000	0.000	0.000	0.000	0.000	0.000	0.002	pg1422_o2nofp.cx10a_c8r32
0.028	66.194	33.778	0.000	0.000	0.000	0.000	0.000	0.000	0.000	0.002	pg1517_o2nofp.cx10a_c8r32
0.000	64.472	35.528	0.000	0.000	0.000	0.000	0.000	0.000	0.000	0.002	pg1613_o2nofp.cx10a_c8r32
0.000	63.750	36.250	0.000	0.000	0.000	0.000	0.000	0.000	0.000	0.002	pg179_o2nofp.cx10a_c8r32
0.000	61.889	38.111	0.000	0.000	0.000	0.000	0.000	0.000	0.000	0.002	pg183_o2nofp.cx10b_c8r32
qp100.L2
- qp100.L2: point queries with 100 insert/s per client
- Legend for results is here.
- Each entry lists the percentage of responses that fit in that bucket (slower than max time for previous bucket, faster than min time for next bucket).
Query response time histogram
256us	1ms	4ms	16ms	64ms	256ms	1s	4s	16s	gt	max	tag
99.982	0.018	nonzero	0.000	0.000	0.000	0.000	0.000	0.000	0.000	0.001	pg1222_o2nofp.cx10a_c8r32
99.986	0.014	0.000	0.000	0.000	0.000	0.000	0.000	0.000	0.000	0.001	pg1323_o2nofp.cx10a_c8r32
99.986	0.014	nonzero	0.000	0.000	0.000	0.000	0.000	0.000	0.000	0.002	pg1422_o2nofp.cx10a_c8r32
99.987	0.013	nonzero	0.000	0.000	0.000	0.000	0.000	0.000	0.000	0.003	pg1517_o2nofp.cx10a_c8r32
99.986	0.014	nonzero	0.000	0.000	0.000	0.000	0.000	0.000	0.000	0.001	pg1613_o2nofp.cx10a_c8r32
99.987	0.013	nonzero	0.000	0.000	0.000	0.000	0.000	0.000	0.000	0.002	pg179_o2nofp.cx10a_c8r32
99.984	0.016	0.000	0.000	0.000	0.000	0.000	0.000	0.000	0.000	0.001	pg183_o2nofp.cx10b_c8r32
Insert response time histogram
256us	1ms	4ms	16ms	64ms	256ms	1s	4s	16s	gt	max	tag
0.000	0.639	99.333	0.028	0.000	0.000	0.000	0.000	0.000	0.000	0.005	pg1222_o2nofp.cx10a_c8r32
0.000	0.944	99.028	0.028	0.000	0.000	0.000	0.000	0.000	0.000	0.005	pg1323_o2nofp.cx10a_c8r32
0.000	1.389	98.583	0.028	0.000	0.000	0.000	0.000	0.000	0.000	0.004	pg1422_o2nofp.cx10a_c8r32
0.000	1.028	98.944	0.028	0.000	0.000	0.000	0.000	0.000	0.000	0.004	pg1517_o2nofp.cx10a_c8r32
0.000	1.611	98.361	0.028	0.000	0.000	0.000	0.000	0.000	0.000	0.005	pg1613_o2nofp.cx10a_c8r32
0.000	1.917	98.056	0.028	0.000	0.000	0.000	0.000	0.000	0.000	0.005	pg179_o2nofp.cx10a_c8r32
0.000	4.500	95.472	0.028	0.000	0.000	0.000	0.000	0.000	0.000	0.005	pg183_o2nofp.cx10b_c8r32
Delete response time histogram
256us	1ms	4ms	16ms	64ms	256ms	1s	4s	16s	gt	max	tag
0.000	36.194	63.806	0.000	0.000	0.000	0.000	0.000	0.000	0.000	0.003	pg1222_o2nofp.cx10a_c8r32
0.000	27.000	73.000	0.000	0.000	0.000	0.000	0.000	0.000	0.000	0.003	pg1323_o2nofp.cx10a_c8r32
0.000	14.778	85.222	0.000	0.000	0.000	0.000	0.000	0.000	0.000	0.004	pg1422_o2nofp.cx10a_c8r32
0.000	17.778	82.222	0.000	0.000	0.000	0.000	0.000	0.000	0.000	0.003	pg1517_o2nofp.cx10a_c8r32
0.000	14.917	85.083	0.000	0.000	0.000	0.000	0.000	0.000	0.000	0.004	pg1613_o2nofp.cx10a_c8r32
0.000	16.444	83.556	0.000	0.000	0.000	0.000	0.000	0.000	0.000	0.004	pg179_o2nofp.cx10a_c8r32
0.000	8.194	91.806	0.000	0.000	0.000	0.000	0.000	0.000	0.000	0.003	pg183_o2nofp.cx10b_c8r32
qr500.L3
- qr500.L3: range queries with 500 insert/s per client
- Legend for results is here.
- Each entry lists the percentage of responses that fit in that bucket (slower than max time for previous bucket, faster than min time for next bucket).
Query response time histogram
256us	1ms	4ms	16ms	64ms	256ms	1s	4s	16s	gt	max	tag
99.991	0.009	nonzero	0.000	0.000	0.000	0.000	0.000	0.000	0.000	0.002	pg1222_o2nofp.cx10a_c8r32
99.992	0.008	nonzero	0.000	0.000	0.000	0.000	0.000	0.000	0.000	0.002	pg1323_o2nofp.cx10a_c8r32
99.992	0.008	nonzero	0.000	0.000	0.000	0.000	0.000	0.000	0.000	0.002	pg1422_o2nofp.cx10a_c8r32
99.992	0.008	nonzero	0.000	0.000	0.000	0.000	0.000	0.000	0.000	0.002	pg1517_o2nofp.cx10a_c8r32
99.992	0.008	nonzero	0.000	0.000	0.000	0.000	0.000	0.000	0.000	0.002	pg1613_o2nofp.cx10a_c8r32
99.992	0.008	nonzero	0.000	0.000	0.000	0.000	0.000	0.000	0.000	0.002	pg179_o2nofp.cx10a_c8r32
99.991	0.009	nonzero	0.000	0.000	0.000	0.000	0.000	0.000	0.000	0.001	pg183_o2nofp.cx10b_c8r32
Insert response time histogram
256us	1ms	4ms	16ms	64ms	256ms	1s	4s	16s	gt	max	tag
0.000	71.056	28.939	0.006	0.000	0.000	0.000	0.000	0.000	0.000	0.004	pg1222_o2nofp.cx10a_c8r32
0.000	68.144	31.850	0.006	0.000	0.000	0.000	0.000	0.000	0.000	0.005	pg1323_o2nofp.cx10a_c8r32
0.000	73.256	26.739	0.006	0.000	0.000	0.000	0.000	0.000	0.000	0.005	pg1422_o2nofp.cx10a_c8r32
0.000	70.328	29.667	0.006	0.000	0.000	0.000	0.000	0.000	0.000	0.005	pg1517_o2nofp.cx10a_c8r32
0.000	69.700	30.289	0.011	0.000	0.000	0.000	0.000	0.000	0.000	0.004	pg1613_o2nofp.cx10a_c8r32
0.000	74.922	25.072	0.006	0.000	0.000	0.000	0.000	0.000	0.000	0.005	pg179_o2nofp.cx10a_c8r32
0.000	75.878	24.117	0.006	0.000	0.000	0.000	0.000	0.000	0.000	0.005	pg183_o2nofp.cx10b_c8r32
Delete response time histogram
256us	1ms	4ms	16ms	64ms	256ms	1s	4s	16s	gt	max	tag
0.000	8.072	91.511	0.417	0.000	0.000	0.000	0.000	0.000	0.000	0.005	pg1222_o2nofp.cx10a_c8r32
0.000	2.417	96.683	0.900	0.000	0.000	0.000	0.000	0.000	0.000	0.005	pg1323_o2nofp.cx10a_c8r32
0.000	1.900	97.106	0.994	0.000	0.000	0.000	0.000	0.000	0.000	0.005	pg1422_o2nofp.cx10a_c8r32
0.000	2.256	96.783	0.961	0.000	0.000	0.000	0.000	0.000	0.000	0.005	pg1517_o2nofp.cx10a_c8r32
0.000	6.822	91.911	1.267	0.000	0.000	0.000	0.000	0.000	0.000	0.006	pg1613_o2nofp.cx10a_c8r32
0.000	4.783	92.083	3.133	0.000	0.000	0.000	0.000	0.000	0.000	0.005	pg179_o2nofp.cx10a_c8r32
0.000	3.672	94.689	1.639	0.000	0.000	0.000	0.000	0.000	0.000	0.006	pg183_o2nofp.cx10b_c8r32
qp500.L4
- qp500.L4: point queries with 500 insert/s per client
- Legend for results is here.
- Each entry lists the percentage of responses that fit in that bucket (slower than max time for previous bucket, faster than min time for next bucket).
Query response time histogram
256us	1ms	4ms	16ms	64ms	256ms	1s	4s	16s	gt	max	tag
99.977	0.023	nonzero	0.000	0.000	0.000	0.000	0.000	0.000	0.000	0.001	pg1222_o2nofp.cx10a_c8r32
99.979	0.021	nonzero	0.000	0.000	0.000	0.000	0.000	0.000	0.000	0.003	pg1323_o2nofp.cx10a_c8r32
99.978	0.022	nonzero	0.000	0.000	0.000	0.000	0.000	0.000	0.000	0.001	pg1422_o2nofp.cx10a_c8r32
99.981	0.019	nonzero	0.000	0.000	0.000	0.000	0.000	0.000	0.000	0.002	pg1517_o2nofp.cx10a_c8r32
99.979	0.021	nonzero	0.000	0.000	0.000	0.000	0.000	0.000	0.000	0.002	pg1613_o2nofp.cx10a_c8r32
99.979	0.021	nonzero	0.000	0.000	0.000	0.000	0.000	0.000	0.000	0.001	pg179_o2nofp.cx10a_c8r32
99.978	0.022	nonzero	0.000	0.000	0.000	0.000	0.000	0.000	0.000	0.001	pg183_o2nofp.cx10b_c8r32
Insert response time histogram
256us	1ms	4ms	16ms	64ms	256ms	1s	4s	16s	gt	max	tag
0.000	67.933	32.044	0.017	0.006	0.000	0.000	0.000	0.000	0.000	0.017	pg1222_o2nofp.cx10a_c8r32
0.000	67.467	32.522	0.011	0.000	0.000	0.000	0.000	0.000	0.000	0.012	pg1323_o2nofp.cx10a_c8r32
0.000	68.711	31.267	0.022	0.000	0.000	0.000	0.000	0.000	0.000	0.013	pg1422_o2nofp.cx10a_c8r32
0.000	67.161	32.817	0.017	0.006	0.000	0.000	0.000	0.000	0.000	0.017	pg1517_o2nofp.cx10a_c8r32
0.000	69.167	30.817	0.011	0.006	0.000	0.000	0.000	0.000	0.000	0.018	pg1613_o2nofp.cx10a_c8r32
0.000	69.833	30.144	0.022	0.000	0.000	0.000	0.000	0.000	0.000	0.014	pg179_o2nofp.cx10a_c8r32
0.000	73.317	26.661	0.022	0.000	0.000	0.000	0.000	0.000	0.000	0.014	pg183_o2nofp.cx10b_c8r32
Delete response time histogram
256us	1ms	4ms	16ms	64ms	256ms	1s	4s	16s	gt	max	tag
0.378	43.067	53.828	2.722	0.006	0.000	0.000	0.000	0.000	0.000	0.016	pg1222_o2nofp.cx10a_c8r32
0.211	26.411	70.278	3.100	0.000	0.000	0.000	0.000	0.000	0.000	0.012	pg1323_o2nofp.cx10a_c8r32
0.106	31.744	64.128	4.022	0.000	0.000	0.000	0.000	0.000	0.000	0.012	pg1422_o2nofp.cx10a_c8r32
0.061	31.089	64.900	3.944	0.006	0.000	0.000	0.000	0.000	0.000	0.016	pg1517_o2nofp.cx10a_c8r32
0.183	32.356	62.539	4.917	0.006	0.000	0.000	0.000	0.000	0.000	0.017	pg1613_o2nofp.cx10a_c8r32
0.072	28.639	61.300	9.989	0.000	0.000	0.000	0.000	0.000	0.000	0.013	pg179_o2nofp.cx10a_c8r32
0.167	27.739	68.578	3.517	0.000	0.000	0.000	0.000	0.000	0.000	0.013	pg183_o2nofp.cx10b_c8r32
qr1000.L5
- qr1000.L5: range queries with 1000 insert/s per client
- Legend for results is here.
- Each entry lists the percentage of responses that fit in that bucket (slower than max time for previous bucket, faster than min time for next bucket).
Query response time histogram
256us	1ms	4ms	16ms	64ms	256ms	1s	4s	16s	gt	max	tag
99.990	0.010	nonzero	nonzero	0.000	0.000	0.000	0.000	0.000	0.000	0.005	pg1222_o2nofp.cx10a_c8r32
99.991	0.009	nonzero	nonzero	0.000	0.000	0.000	0.000	0.000	0.000	0.005	pg1323_o2nofp.cx10a_c8r32
99.990	0.010	nonzero	nonzero	0.000	0.000	0.000	0.000	0.000	0.000	0.004	pg1422_o2nofp.cx10a_c8r32
99.991	0.009	nonzero	0.000	0.000	0.000	0.000	0.000	0.000	0.000	0.004	pg1517_o2nofp.cx10a_c8r32
99.990	0.010	nonzero	nonzero	0.000	0.000	0.000	0.000	0.000	0.000	0.004	pg1613_o2nofp.cx10a_c8r32
99.990	0.010	nonzero	nonzero	0.000	0.000	0.000	0.000	0.000	0.000	0.004	pg179_o2nofp.cx10a_c8r32
99.989	0.011	nonzero	nonzero	0.000	0.000	0.000	0.000	0.000	0.000	0.013	pg183_o2nofp.cx10b_c8r32
Insert response time histogram
256us	1ms	4ms	16ms	64ms	256ms	1s	4s	16s	gt	max	tag
0.000	78.258	21.736	0.006	0.000	0.000	0.000	0.000	0.000	0.000	0.013	pg1222_o2nofp.cx10a_c8r32
0.000	76.292	23.706	0.003	0.000	0.000	0.000	0.000	0.000	0.000	0.005	pg1323_o2nofp.cx10a_c8r32
0.000	75.917	24.081	0.003	0.000	0.000	0.000	0.000	0.000	0.000	0.004	pg1422_o2nofp.cx10a_c8r32
0.000	75.289	24.708	0.003	0.000	0.000	0.000	0.000	0.000	0.000	0.005	pg1517_o2nofp.cx10a_c8r32
0.000	74.975	25.022	0.003	0.000	0.000	0.000	0.000	0.000	0.000	0.005	pg1613_o2nofp.cx10a_c8r32
0.000	73.986	26.011	0.003	0.000	0.000	0.000	0.000	0.000	0.000	0.005	pg179_o2nofp.cx10a_c8r32
0.000	74.311	25.683	0.003	0.003	0.000	0.000	0.000	0.000	0.000	0.018	pg183_o2nofp.cx10b_c8r32
Delete response time histogram
256us	1ms	4ms	16ms	64ms	256ms	1s	4s	16s	gt	max	tag
0.142	25.594	73.453	0.811	0.000	0.000	0.000	0.000	0.000	0.000	0.014	pg1222_o2nofp.cx10a_c8r32
0.108	21.822	77.011	1.058	0.000	0.000	0.000	0.000	0.000	0.000	0.007	pg1323_o2nofp.cx10a_c8r32
0.108	19.417	79.350	1.125	0.000	0.000	0.000	0.000	0.000	0.000	0.007	pg1422_o2nofp.cx10a_c8r32
0.139	20.611	77.981	1.269	0.000	0.000	0.000	0.000	0.000	0.000	0.010	pg1517_o2nofp.cx10a_c8r32
0.072	19.408	78.336	2.183	0.000	0.000	0.000	0.000	0.000	0.000	0.010	pg1613_o2nofp.cx10a_c8r32
0.064	20.536	74.336	5.064	0.000	0.000	0.000	0.000	0.000	0.000	0.007	pg179_o2nofp.cx10a_c8r32
0.147	19.797	78.731	1.322	0.003	0.000	0.000	0.000	0.000	0.000	0.019	pg183_o2nofp.cx10b_c8r32
qp1000.L6
- qp1000.L6: point queries with 1000 insert/s per client
- Legend for results is here.
- Each entry lists the percentage of responses that fit in that bucket (slower than max time for previous bucket, faster than min time for next bucket).
Query response time histogram
256us	1ms	4ms	16ms	64ms	256ms	1s	4s	16s	gt	max	tag
99.976	0.024	nonzero	0.000	0.000	0.000	0.000	0.000	0.000	0.000	0.001	pg1222_o2nofp.cx10a_c8r32
99.977	0.023	nonzero	0.000	0.000	0.000	0.000	0.000	0.000	0.000	0.002	pg1323_o2nofp.cx10a_c8r32
99.976	0.024	nonzero	0.000	0.000	0.000	0.000	0.000	0.000	0.000	0.003	pg1422_o2nofp.cx10a_c8r32
99.979	0.021	nonzero	0.000	0.000	0.000	0.000	0.000	0.000	0.000	0.001	pg1517_o2nofp.cx10a_c8r32
99.976	0.024	0.000	0.000	0.000	0.000	0.000	0.000	0.000	0.000	0.001	pg1613_o2nofp.cx10a_c8r32
99.977	0.023	0.000	0.000	0.000	0.000	0.000	0.000	0.000	0.000	0.001	pg179_o2nofp.cx10a_c8r32
99.975	0.025	nonzero	0.000	0.000	0.000	0.000	0.000	0.000	0.000	0.001	pg183_o2nofp.cx10b_c8r32
Insert response time histogram
256us	1ms	4ms	16ms	64ms	256ms	1s	4s	16s	gt	max	tag
0.000	72.386	27.611	0.003	0.000	0.000	0.000	0.000	0.000	0.000	0.004	pg1222_o2nofp.cx10a_c8r32
0.000	71.375	28.622	0.003	0.000	0.000	0.000	0.000	0.000	0.000	0.005	pg1323_o2nofp.cx10a_c8r32
0.000	71.106	28.889	0.006	0.000	0.000	0.000	0.000	0.000	0.000	0.012	pg1422_o2nofp.cx10a_c8r32
0.000	69.175	30.822	0.003	0.000	0.000	0.000	0.000	0.000	0.000	0.005	pg1517_o2nofp.cx10a_c8r32
0.000	70.483	29.511	0.006	0.000	0.000	0.000	0.000	0.000	0.000	0.011	pg1613_o2nofp.cx10a_c8r32
0.000	67.828	32.169	0.003	0.000	0.000	0.000	0.000	0.000	0.000	0.004	pg179_o2nofp.cx10a_c8r32
0.000	71.292	28.689	0.017	0.003	0.000	0.000	0.000	0.000	0.000	0.016	pg183_o2nofp.cx10b_c8r32
Delete response time histogram
256us	1ms	4ms	16ms	64ms	256ms	1s	4s	16s	gt	max	tag
0.122	22.922	76.081	0.875	0.000	0.000	0.000	0.000	0.000	0.000	0.008	pg1222_o2nofp.cx10a_c8r32
0.089	17.869	80.722	1.319	0.000	0.000	0.000	0.000	0.000	0.000	0.008	pg1323_o2nofp.cx10a_c8r32
0.053	17.750	80.564	1.633	0.000	0.000	0.000	0.000	0.000	0.000	0.010	pg1422_o2nofp.cx10a_c8r32
0.072	15.517	82.819	1.592	0.000	0.000	0.000	0.000	0.000	0.000	0.008	pg1517_o2nofp.cx10a_c8r32
0.075	19.869	78.289	1.767	0.000	0.000	0.000	0.000	0.000	0.000	0.010	pg1613_o2nofp.cx10a_c8r32
0.042	17.506	77.344	5.108	0.000	0.000	0.000	0.000	0.000	0.000	0.009	pg179_o2nofp.cx10a_c8r32
0.103	18.703	78.828	2.367	0.000	0.000	0.000	0.000	0.000	0.000	0.015	pg183_o2nofp.cx10b_c8r32