Introduction
This is a report for the insert benchmark with 30M docs and 1 client(s). It is generated by scripts (bash, awk, sed) and Tufte might not be impressed. An overview of the insert benchmark is here and a short update is here. Below, by DBMS, I mean DBMS+version.config. An example is my8020.c10b40 where my means MySQL, 8020 is version 8.0.20 and c10b40 is the name for the configuration file.
The test server has 8 AMD cores, 32G RAM and an NVMe device for the database. The benchmark was run with 1 client and there were 1 or 3 connections per client (1 for queries or inserts without rate limits, 1+1 for rate limited inserts+deletes). It uses 1 table with a table per client. It loads 30M rows per table without secondary indexes, creates 3 secondary indexes per table, then inserts 40m+10m rows per table with a delete per insert to avoid growing the table. It then does 6 read+write tests for 3600s each that do queries as fast as possible with 100,100,500,500,1000,1000 inserts/s and the same for deletes/s per client concurrent with the queries. The database is cached by Postgres. Clients and the DBMS share one server.
The tested DBMS are:
- pg182_o2nofp.cx10b_c8r32 - Postgres 18.2 with my standard config (x10b)
- pg182_o2nofp.cx10b_fpw0_c8r32 - Postgres 18.2 with my standard config except full_page_writes=off
- pg182_o2nofp.cx10b_wallz4_c8r32 - Postgres 18.2 with my standard config except wal_compression=lz4
- pg182_o2nofp.cx10b_fpw0_wallz4_c8r32 - Postgres 18.2 with my standard config except full_page_writes=off and wal_compression=lz4
Contents
- Summary
- l.i0: load without secondary indexes
- l.x: create secondary indexes
- l.i1: continue load after secondary indexes created with 50 inserts per transaction
- l.i2: continue load after secondary indexes created with 5 inserts per transaction
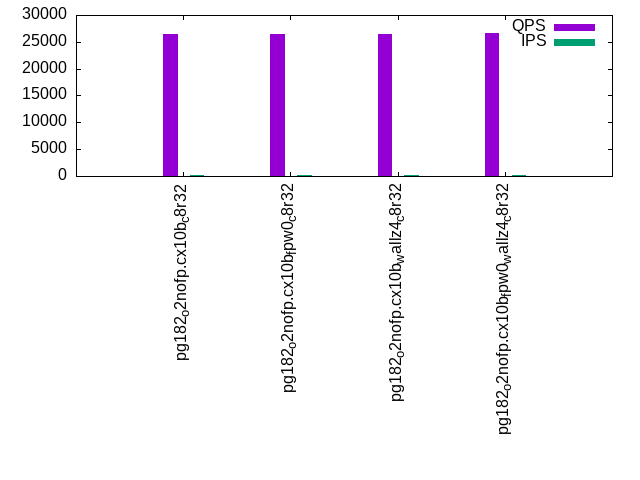
- qr100.L1: range queries with 100 insert/s per client
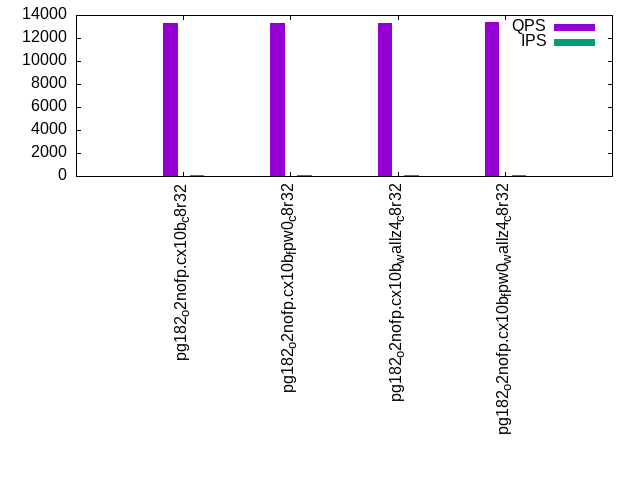
- qp100.L2: point queries with 100 insert/s per client
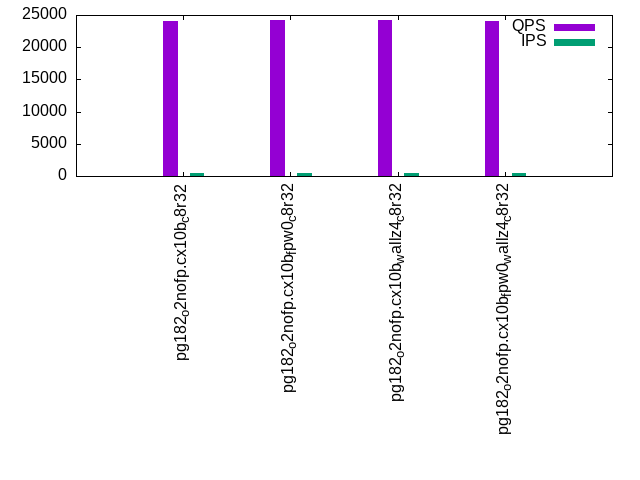
- qr500.L3: range queries with 500 insert/s per client
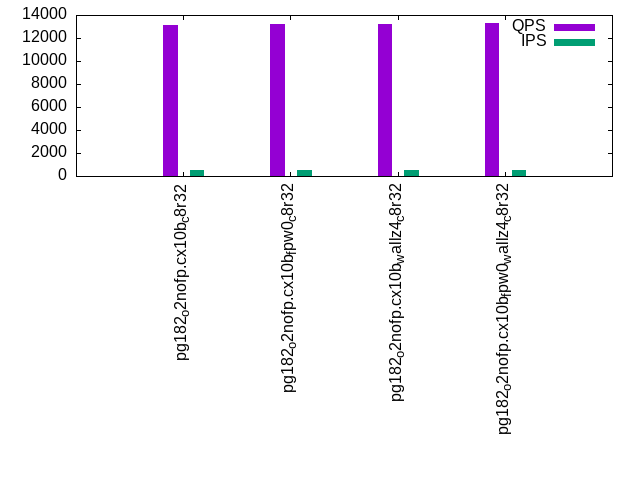
- qp500.L4: point queries with 500 insert/s per client
- qr1000.L5: range queries with 1000 insert/s per client
- qp1000.L6: point queries with 1000 insert/s per client
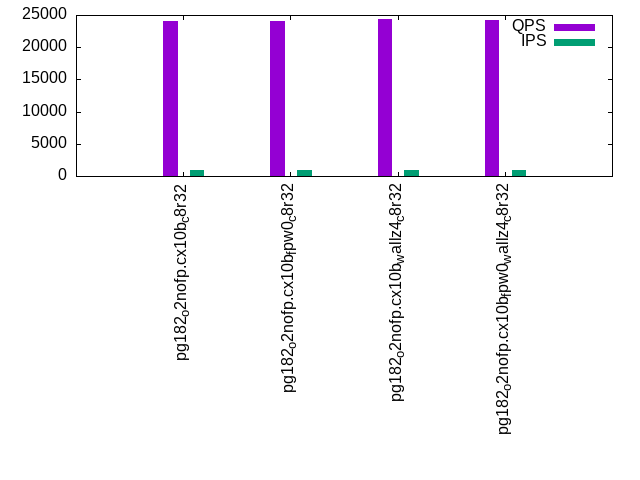
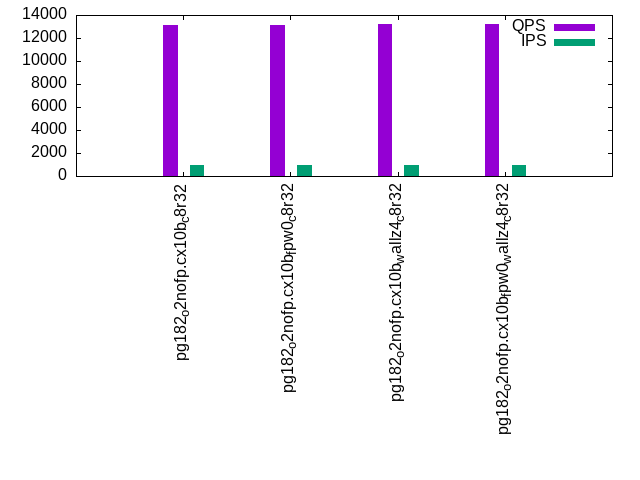
Summary
The numbers are inserts/s for l.i0, l.i1 and l.i2, indexed docs (or rows) /s for l.x and queries/s for qr100, qp100 thru qr1000, qp1000" The values are the average rate over the entire test for inserts (IPS) and queries (QPS). The range of values for IPS and QPS is split into 3 parts: bottom 25%, middle 50%, top 25%. Values in the bottom 25% have a red background, values in the top 25% have a green background and values in the middle have no color. A gray background is used for values that can be ignored because the DBMS did not sustain the target insert rate. Red backgrounds are not used when the minimum value is within 80% of the max value.
| dbms | l.i0 | l.x | l.i1 | l.i2 | qr100 | qp100 | qr500 | qp500 | qr1000 | qp1000 |
|---|---|---|---|---|---|---|---|---|---|---|
| pg182_o2nofp.cx10b_c8r32 | 209790 | 500002 | 21119 | 2608 | 26412 | 13262 | 24084 | 13172 | 24086 | 13135 |
| pg182_o2nofp.cx10b_fpw0_c8r32 | 208333 | 491805 | 21870 | 2751 | 26540 | 13308 | 24164 | 13234 | 24046 | 13116 |
| pg182_o2nofp.cx10b_wallz4_c8r32 | 201342 | 491805 | 20274 | 2582 | 26522 | 13305 | 24168 | 13202 | 24431 | 13176 |
| pg182_o2nofp.cx10b_fpw0_wallz4_c8r32 | 206896 | 500002 | 22663 | 2731 | 26651 | 13370 | 24134 | 13326 | 24245 | 13256 |
This table has relative throughput, throughput for the DBMS relative to the DBMS in the first line, using the absolute throughput from the previous table. Values less than 0.95 have a yellow background. Values greater than 1.05 have a blue background.
| dbms | l.i0 | l.x | l.i1 | l.i2 | qr100 | qp100 | qr500 | qp500 | qr1000 | qp1000 |
|---|---|---|---|---|---|---|---|---|---|---|
| pg182_o2nofp.cx10b_c8r32 | 1.00 | 1.00 | 1.00 | 1.00 | 1.00 | 1.00 | 1.00 | 1.00 | 1.00 | 1.00 |
| pg182_o2nofp.cx10b_fpw0_c8r32 | 0.99 | 0.98 | 1.04 | 1.05 | 1.00 | 1.00 | 1.00 | 1.00 | 1.00 | 1.00 |
| pg182_o2nofp.cx10b_wallz4_c8r32 | 0.96 | 0.98 | 0.96 | 0.99 | 1.00 | 1.00 | 1.00 | 1.00 | 1.01 | 1.00 |
| pg182_o2nofp.cx10b_fpw0_wallz4_c8r32 | 0.99 | 1.00 | 1.07 | 1.05 | 1.01 | 1.01 | 1.00 | 1.01 | 1.01 | 1.01 |
This lists the average rate of inserts/s for the tests that do inserts concurrent with queries. For such tests the query rate is listed in the table above. The read+write tests are setup so that the insert rate should match the target rate every second. Cells that are not at least 95% of the target have a red background to indicate a failure to satisfy the target.
| dbms | qr100.L1 | qp100.L2 | qr500.L3 | qp500.L4 | qr1000.L5 | qp1000.L6 |
|---|---|---|---|---|---|---|
| pg182_o2nofp.cx10b_c8r32 | 100 | 100 | 500 | 500 | 999 | 999 |
| pg182_o2nofp.cx10b_fpw0_c8r32 | 100 | 100 | 500 | 500 | 999 | 999 |
| pg182_o2nofp.cx10b_wallz4_c8r32 | 100 | 100 | 500 | 500 | 999 | 999 |
| pg182_o2nofp.cx10b_fpw0_wallz4_c8r32 | 100 | 100 | 499 | 500 | 999 | 999 |
| target | 100 | 100 | 500 | 500 | 1000 | 1000 |
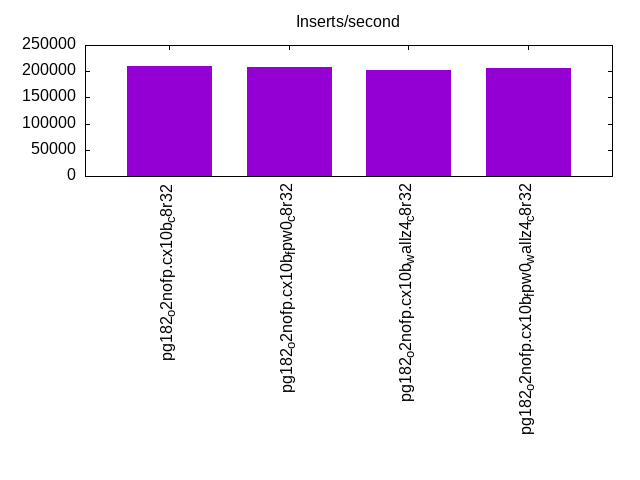
l.i0
l.i0: load without secondary indexes. Graphs for performance per 1-second interval are here.
Average throughput:
Insert response time histogram: each cell has the percentage of responses that take <= the time in the header and max is the max response time in seconds. For the max column values in the top 25% of the range have a red background and in the bottom 25% of the range have a green background. The red background is not used when the min value is within 80% of the max value.
| dbms | 256us | 1ms | 4ms | 16ms | 64ms | 256ms | 1s | 4s | 16s | gt | max |
|---|---|---|---|---|---|---|---|---|---|---|---|
| pg182_o2nofp.cx10b_c8r32 | 99.989 | 0.011 | 0.004 | ||||||||
| pg182_o2nofp.cx10b_fpw0_c8r32 | 99.989 | 0.011 | 0.002 | ||||||||
| pg182_o2nofp.cx10b_wallz4_c8r32 | 99.988 | 0.011 | nonzero | 0.005 | |||||||
| pg182_o2nofp.cx10b_fpw0_wallz4_c8r32 | 99.991 | 0.009 | 0.002 |
Performance metrics for the DBMS listed above. Some are normalized by throughput, others are not. Legend for results is here.
ips	qps	rps	rmbps	wps	wmbps	rpq	rkbpq	wpi	wkbpi	csps	cpups	cspq	cpupq	dbgb1	dbgb2	rss	maxop	p50	p99	tag
209790	0	0	0.0	779.1	88.8	0.000	0.000	0.004	0.433	22153	19.2	0.106	7	2.9	7.8	1.8	0.004	210275	201879	pg182_o2nofp.cx10b_c8r32
208333	0	0	0.0	774.5	88.1	0.000	0.000	0.004	0.433	21719	19.2	0.104	7	2.9	7.8	2.4	0.002	208879	200678	pg182_o2nofp.cx10b_fpw0_c8r32
201342	0	0	0.0	751.3	85.5	0.000	0.000	0.004	0.435	21179	19.3	0.105	8	2.9	7.8	1.7	0.005	203664	195968	pg182_o2nofp.cx10b_wallz4_c8r32
206896	0	0	0.0	764.1	86.9	0.000	0.000	0.004	0.430	21537	19.3	0.104	7	2.9	7.8	2.4	0.002	208163	198579	pg182_o2nofp.cx10b_fpw0_wallz4_c8r32
Average values from iostat.
r/s	rkB/s	rrqm/s	%rrqm	r_await	rareq-s	w/s	wkB/s	wrqm/s	%wrqm	w_await	wareq-s	d/s	dkB/s	drqm/s	%drqm	d_await	dareq-s	f/s	f_await	aqu-sz	%util
0.452	1.807	0.000	0.000	0.114	4.000	786.1	91764.4	37.24	4.933	0.468	115.5	0.148	1.037	0.000	0.000	0.281	1.531	43.16	1.718	0.439	12.36		pg182_o2nofp.cx10b_c8r32
0.022	0.089	0.000	0.000	0.037	0.444	781.4	91092.6	37.64	5.007	0.422	115.3	0.067	0.652	0.000	0.000	0.148	1.358	42.97	1.639	0.403	11.88		pg182_o2nofp.cx10b_fpw0_c8r32
0.014	0.057	0.000	0.000	0.000	0.286	757.2	88253.2	36.63	5.030	0.425	115.3	0.050	0.600	0.000	0.000	0.226	1.381	41.99	1.549	0.396	11.21		pg182_o2nofp.cx10b_wallz4_c8r32
0.007	0.029	0.000	0.000	0.000	0.143	770.2	89781.7	37.08	5.024	0.426	115.4	0.079	0.686	0.000	0.000	0.161	1.310	42.55	1.685	0.394	12.08		pg182_o2nofp.cx10b_fpw0_wallz4_c8r32
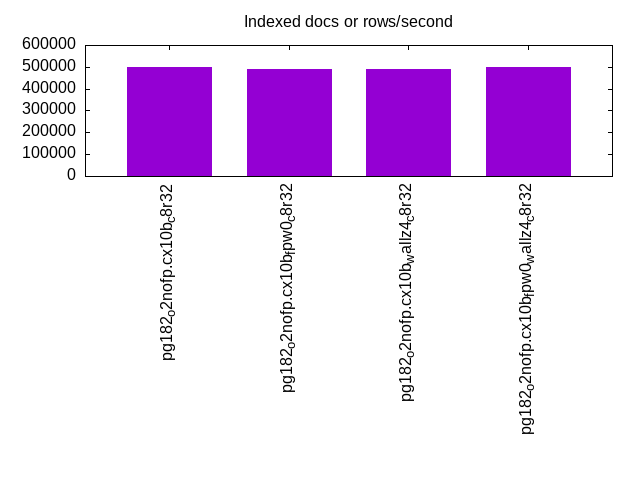
l.x
l.x: create secondary indexes.
Average throughput:
Performance metrics for the DBMS listed above. Some are normalized by throughput, others are not. Legend for results is here.
ips	qps	rps	rmbps	wps	wmbps	rpq	rkbpq	wpi	wkbpi	csps	cpups	cspq	cpupq	dbgb1	dbgb2	rss	maxop	p50	p99	tag
500002	0	1	0.0	1030.9	126.6	0.000	0.000	0.002	0.259	2979	11.1	0.006	2	5.8	13.3	3.0	0.002	NA	NA	pg182_o2nofp.cx10b_c8r32
491805	0	0	0.0	1083.8	133.3	0.000	0.000	0.002	0.278	3031	11.1	0.006	2	5.8	13.3	3.0	0.001	NA	NA	pg182_o2nofp.cx10b_fpw0_c8r32
491805	0	0	0.0	725.8	89.2	0.000	0.000	0.001	0.186	1725	11.3	0.004	2	5.8	12.2	3.0	0.002	NA	NA	pg182_o2nofp.cx10b_wallz4_c8r32
500002	0	0	0.0	802.4	98.7	0.000	0.000	0.002	0.202	1691	11.3	0.003	2	5.8	12.2	3.0	0.002	NA	NA	pg182_o2nofp.cx10b_fpw0_wallz4_c8r32
Average values from iostat.
r/s	rkB/s	rrqm/s	%rrqm	r_await	rareq-s	w/s	wkB/s	wrqm/s	%wrqm	w_await	wareq-s	d/s	dkB/s	drqm/s	%drqm	d_await	dareq-s	f/s	f_await	aqu-sz	%util
0.782	3.127	0.000	0.000	0.171	2.909	1124.5	141465	37.80	9.894	1.714	104.5	0.473	4099.1	0.000	0.000	0.509	5121.9	12.65	2.035	1.129	7.860		pg182_o2nofp.cx10b_c8r32
0.055	0.218	0.000	0.000	0.227	0.727	1181.9	148881	38.33	16.21	2.521	94.61	0.382	11246.1	0.000	0.000	0.307	4325.6	12.64	2.064	1.134	7.375		pg182_o2nofp.cx10b_fpw0_c8r32
0.036	0.145	0.000	0.000	0.091	0.727	791.7	99598.1	22.38	14.55	3.032	100.6	0.200	2533.0	0.000	0.000	0.437	4221.1	8.055	2.277	0.740	5.429		pg182_o2nofp.cx10b_wallz4_c8r32
0.018	0.073	0.000	0.000	0.000	0.364	875.2	110299	23.25	19.10	2.695	94.30	0.473	14947.3	0.000	0.000	0.409	3934.1	8.055	2.057	1.249	5.353		pg182_o2nofp.cx10b_fpw0_wallz4_c8r32
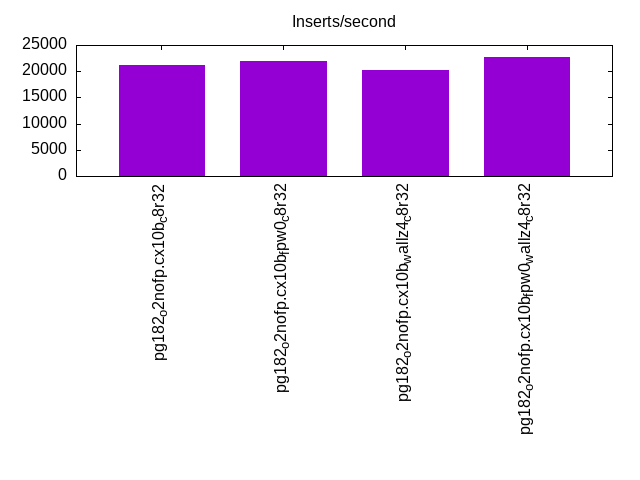
l.i1
l.i1: continue load after secondary indexes created with 50 inserts per transaction. Graphs for performance per 1-second interval are here.
Average throughput:
Insert response time histogram: each cell has the percentage of responses that take <= the time in the header and max is the max response time in seconds. For the max column values in the top 25% of the range have a red background and in the bottom 25% of the range have a green background. The red background is not used when the min value is within 80% of the max value.
| dbms | 256us | 1ms | 4ms | 16ms | 64ms | 256ms | 1s | 4s | 16s | gt | max |
|---|---|---|---|---|---|---|---|---|---|---|---|
| pg182_o2nofp.cx10b_c8r32 | 54.924 | 45.074 | 0.001 | 0.001 | 0.045 | ||||||
| pg182_o2nofp.cx10b_fpw0_c8r32 | 48.965 | 51.035 | nonzero | nonzero | 0.020 | ||||||
| pg182_o2nofp.cx10b_wallz4_c8r32 | 58.328 | 41.672 | nonzero | 0.007 | |||||||
| pg182_o2nofp.cx10b_fpw0_wallz4_c8r32 | 52.424 | 47.575 | nonzero | 0.012 |
Delete response time histogram: each cell has the percentage of responses that take <= the time in the header and max is the max response time in seconds. For the max column values in the top 25% of the range have a red background and in the bottom 25% of the range have a green background. The red background is not used when the min value is within 80% of the max value.
| dbms | 256us | 1ms | 4ms | 16ms | 64ms | 256ms | 1s | 4s | 16s | gt | max |
|---|---|---|---|---|---|---|---|---|---|---|---|
| pg182_o2nofp.cx10b_c8r32 | 0.003 | 26.765 | 57.216 | 16.015 | 0.001 | 0.045 | |||||
| pg182_o2nofp.cx10b_fpw0_c8r32 | nonzero | 26.610 | 70.888 | 2.502 | nonzero | 0.020 | |||||
| pg182_o2nofp.cx10b_wallz4_c8r32 | 0.002 | 27.665 | 53.096 | 19.237 | 0.008 | ||||||
| pg182_o2nofp.cx10b_fpw0_wallz4_c8r32 | 0.002 | 26.657 | 71.965 | 1.377 | 0.006 |
Performance metrics for the DBMS listed above. Some are normalized by throughput, others are not. Legend for results is here.
ips	qps	rps	rmbps	wps	wmbps	rpq	rkbpq	wpi	wkbpi	csps	cpups	cspq	cpupq	dbgb1	dbgb2	rss	maxop	p50	p99	tag
21119	0	0	0.0	266.7	29.3	0.000	0.000	0.013	1.420	8727	19.9	0.413	75	7.8	38.3	0.1	0.045	14098	9399	pg182_o2nofp.cx10b_c8r32
21870	0	0	0.0	237.7	25.9	0.000	0.000	0.011	1.215	8960	20.2	0.410	74	7.8	35.0	5.0	0.020	16547	11998	pg182_o2nofp.cx10b_fpw0_c8r32
20274	0	0	0.0	237.6	26.0	0.000	0.000	0.012	1.311	8392	19.5	0.414	77	7.8	35.7	3.4	0.007	13348	7749	pg182_o2nofp.cx10b_wallz4_c8r32
22663	0	0	0.0	242.7	26.4	0.000	0.000	0.011	1.194	9271	20.3	0.409	72	7.8	33.9	7.9	0.012	17348	12398	pg182_o2nofp.cx10b_fpw0_wallz4_c8r32
Average values from iostat.
r/s	rkB/s	rrqm/s	%rrqm	r_await	rareq-s	w/s	wkB/s	wrqm/s	%wrqm	w_await	wareq-s	d/s	dkB/s	drqm/s	%drqm	d_await	dareq-s	f/s	f_await	aqu-sz	%util
0.111	0.444	0.000	0.000	0.077	1.782	266.4	29968.8	11.69	4.367	0.736	113.0	0.012	0.093	0.000	0.000	0.025	0.117	17.78	1.707	0.177	4.958		pg182_o2nofp.cx10b_c8r32
0.005	0.020	0.000	0.000	0.003	0.099	237.4	26530.2	10.35	4.369	0.695	113.5	0.012	8.873	0.000	0.000	0.031	14.70	16.45	1.746	0.166	4.648		pg182_o2nofp.cx10b_fpw0_c8r32
0.005	0.018	0.000	0.000	0.003	0.092	237.3	26544.7	10.37	4.444	0.861	112.6	0.011	0.112	0.000	0.000	0.023	0.214	16.31	1.698	0.170	4.592		pg182_o2nofp.cx10b_wallz4_c8r32
0.003	0.011	0.000	0.000	0.003	0.057	238.2	26494.6	10.77	4.445	0.676	113.2	0.006	0.093	0.000	0.000	0.036	0.443	17.09	1.735	0.166	4.864		pg182_o2nofp.cx10b_fpw0_wallz4_c8r32
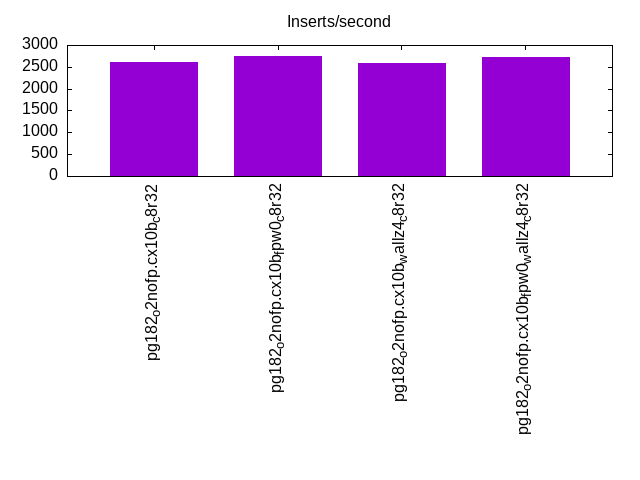
l.i2
l.i2: continue load after secondary indexes created with 5 inserts per transaction. Graphs for performance per 1-second interval are here.
Average throughput:
Insert response time histogram: each cell has the percentage of responses that take <= the time in the header and max is the max response time in seconds. For the max column values in the top 25% of the range have a red background and in the bottom 25% of the range have a green background. The red background is not used when the min value is within 80% of the max value.
| dbms | 256us | 1ms | 4ms | 16ms | 64ms | 256ms | 1s | 4s | 16s | gt | max |
|---|---|---|---|---|---|---|---|---|---|---|---|
| pg182_o2nofp.cx10b_c8r32 | 49.005 | 50.994 | 0.001 | nonzero | 0.018 | ||||||
| pg182_o2nofp.cx10b_fpw0_c8r32 | 51.520 | 48.479 | 0.001 | nonzero | 0.005 | ||||||
| pg182_o2nofp.cx10b_wallz4_c8r32 | 49.648 | 50.350 | 0.002 | nonzero | 0.033 | ||||||
| pg182_o2nofp.cx10b_fpw0_wallz4_c8r32 | 49.760 | 50.239 | nonzero | nonzero | nonzero | 0.020 |
Delete response time histogram: each cell has the percentage of responses that take <= the time in the header and max is the max response time in seconds. For the max column values in the top 25% of the range have a red background and in the bottom 25% of the range have a green background. The red background is not used when the min value is within 80% of the max value.
| dbms | 256us | 1ms | 4ms | 16ms | 64ms | 256ms | 1s | 4s | 16s | gt | max |
|---|---|---|---|---|---|---|---|---|---|---|---|
| pg182_o2nofp.cx10b_c8r32 | 4.336 | 34.646 | 59.276 | 1.743 | nonzero | 0.018 | |||||
| pg182_o2nofp.cx10b_fpw0_c8r32 | 4.162 | 23.979 | 71.833 | 0.026 | 0.009 | ||||||
| pg182_o2nofp.cx10b_wallz4_c8r32 | 4.480 | 34.135 | 58.203 | 3.182 | nonzero | 0.021 | |||||
| pg182_o2nofp.cx10b_fpw0_wallz4_c8r32 | 4.165 | 28.678 | 67.129 | 0.027 | nonzero | 0.020 |
Performance metrics for the DBMS listed above. Some are normalized by throughput, others are not. Legend for results is here.
ips	qps	rps	rmbps	wps	wmbps	rpq	rkbpq	wpi	wkbpi	csps	cpups	cspq	cpupq	dbgb1	dbgb2	rss	maxop	p50	p99	tag
2608	0	0	0.0	58.0	5.7	0.000	0.000	0.022	2.240	9836	15.2	3.771	466	7.9	40.1	0.2	0.018	1695	1125	pg182_o2nofp.cx10b_c8r32
2751	0	0	0.0	49.3	4.7	0.000	0.000	0.018	1.761	10375	15.2	3.771	442	7.9	36.5	1.6	0.005	2020	1389	pg182_o2nofp.cx10b_fpw0_c8r32
2582	0	0	0.0	55.0	5.4	0.000	0.000	0.021	2.125	9749	15.2	3.776	471	7.9	37.4	0.2	0.033	1685	1085	pg182_o2nofp.cx10b_wallz4_c8r32
2731	0	0	0.0	50.0	4.8	0.000	0.000	0.018	1.813	10316	15.3	3.778	448	7.9	35.5	0.2	0.020	1950	1420	pg182_o2nofp.cx10b_fpw0_wallz4_c8r32
Average values from iostat.
r/s	rkB/s	rrqm/s	%rrqm	r_await	rareq-s	w/s	wkB/s	wrqm/s	%wrqm	w_await	wareq-s	d/s	dkB/s	drqm/s	%drqm	d_await	dareq-s	f/s	f_await	aqu-sz	%util
0.002	0.007	0.000	0.000	0.000	0.010	58.06	5848.3	3.501	2.839	0.566	97.00	0.007	5.609	0.000	0.000	0.003	21.27	7.486	1.717	0.038	1.967		pg182_o2nofp.cx10b_c8r32
0.000	0.001	0.000	0.000	0.000	0.006	49.32	4842.6	3.236	2.743	0.506	96.51	0.008	1.730	0.000	0.000	0.004	0.608	6.810	1.732	0.035	1.822		pg182_o2nofp.cx10b_fpw0_c8r32
0.000	0.000	0.000	0.000	0.000	0.000	55.08	5491.9	3.243	2.844	0.591	96.22	0.008	5.137	0.000	0.000	0.006	18.04	7.368	1.714	0.039	1.938		pg182_o2nofp.cx10b_wallz4_c8r32
0.000	0.000	0.000	0.000	0.000	0.000	49.97	4945.6	3.171	2.658	0.497	97.41	0.008	3.222	0.000	0.000	0.004	4.289	6.772	1.704	0.034	1.736		pg182_o2nofp.cx10b_fpw0_wallz4_c8r32
qr100.L1
qr100.L1: range queries with 100 insert/s per client. Graphs for performance per 1-second interval are here.
Average throughput:
Query response time histogram: each cell has the percentage of responses that take <= the time in the header and max is the max response time in seconds. For max values in the top 25% of the range have a red background and in the bottom 25% of the range have a green background. The red background is not used when the min value is within 80% of the max value.
| dbms | 256us | 1ms | 4ms | 16ms | 64ms | 256ms | 1s | 4s | 16s | gt | max |
|---|---|---|---|---|---|---|---|---|---|---|---|
| pg182_o2nofp.cx10b_c8r32 | 99.993 | 0.007 | 0.001 | ||||||||
| pg182_o2nofp.cx10b_fpw0_c8r32 | 99.993 | 0.007 | 0.001 | ||||||||
| pg182_o2nofp.cx10b_wallz4_c8r32 | 99.993 | 0.007 | 0.001 | ||||||||
| pg182_o2nofp.cx10b_fpw0_wallz4_c8r32 | 99.993 | 0.007 | 0.001 |
Insert response time histogram: each cell has the percentage of responses that take <= the time in the header and max is the max response time in seconds. For max values in the top 25% of the range have a red background and in the bottom 25% of the range have a green background. The red background is not used when the min value is within 80% of the max value.
| dbms | 256us | 1ms | 4ms | 16ms | 64ms | 256ms | 1s | 4s | 16s | gt | max |
|---|---|---|---|---|---|---|---|---|---|---|---|
| pg182_o2nofp.cx10b_c8r32 | 24.889 | 75.083 | 0.028 | 0.005 | |||||||
| pg182_o2nofp.cx10b_fpw0_c8r32 | 40.528 | 59.444 | 0.028 | 0.005 | |||||||
| pg182_o2nofp.cx10b_wallz4_c8r32 | 99.944 | 0.056 | 0.006 | ||||||||
| pg182_o2nofp.cx10b_fpw0_wallz4_c8r32 | 41.000 | 58.972 | 0.028 | 0.004 |
Delete response time histogram: each cell has the percentage of responses that take <= the time in the header and max is the max response time in seconds. For max values in the top 25% of the range have a red background and in the bottom 25% of the range have a green background. The red background is not used when the min value is within 80% of the max value.
| dbms | 256us | 1ms | 4ms | 16ms | 64ms | 256ms | 1s | 4s | 16s | gt | max |
|---|---|---|---|---|---|---|---|---|---|---|---|
| pg182_o2nofp.cx10b_c8r32 | 62.444 | 37.556 | 0.002 | ||||||||
| pg182_o2nofp.cx10b_fpw0_c8r32 | 63.778 | 36.222 | 0.002 | ||||||||
| pg182_o2nofp.cx10b_wallz4_c8r32 | 64.306 | 35.694 | 0.002 | ||||||||
| pg182_o2nofp.cx10b_fpw0_wallz4_c8r32 | 63.917 | 36.083 | 0.002 |
Performance metrics for the DBMS listed above. Some are normalized by throughput, others are not. Legend for results is here.
ips	qps	rps	rmbps	wps	wmbps	rpq	rkbpq	wpi	wkbpi	csps	cpups	cspq	cpupq	dbgb1	dbgb2	rss	maxop	p50	p99	tag
100	26412	0	0.0	12.2	0.8	0.000	0.000	0.122	7.727	100766	8.4	3.815	25	7.9	40.1	0.1	0.001	26427	26006	pg182_o2nofp.cx10b_c8r32
100	26540	0	0.0	6.7	0.1	0.000	0.000	0.067	1.125	101259	8.4	3.815	25	7.9	36.5	0.1	0.001	26540	26136	pg182_o2nofp.cx10b_fpw0_c8r32
100	26522	0	0.0	10.3	0.5	0.000	0.000	0.103	5.620	101192	8.5	3.815	26	7.9	37.4	0.1	0.001	26523	26069	pg182_o2nofp.cx10b_wallz4_c8r32
100	26651	0	0.0	6.8	0.1	0.000	0.000	0.068	1.132	101734	8.1	3.817	24	7.9	35.5	0.1	0.001	26691	26235	pg182_o2nofp.cx10b_fpw0_wallz4_c8r32
Average values from iostat.
r/s	rkB/s	rrqm/s	%rrqm	r_await	rareq-s	w/s	wkB/s	wrqm/s	%wrqm	w_await	wareq-s	d/s	dkB/s	drqm/s	%drqm	d_await	dareq-s	f/s	f_await	aqu-sz	%util
0.000	0.000	0.000	0.000	0.000	0.000	12.20	769.9	0.253	2.187	2.023	66.36	0.001	0.002	0.000	0.000	0.003	0.011	2.771	2.161	0.029	1.186		pg182_o2nofp.cx10b_c8r32
0.000	0.000	0.000	0.000	0.000	0.000	6.728	112.6	0.206	3.461	2.318	13.55	0.001	0.002	0.000	0.000	0.000	0.011	2.520	2.351	0.020	1.146		pg182_o2nofp.cx10b_fpw0_c8r32
0.000	0.000	0.000	0.000	0.000	0.000	10.30	560.4	0.233	2.442	2.111	57.27	0.001	0.002	0.000	0.000	0.003	0.011	2.636	2.256	0.026	1.154		pg182_o2nofp.cx10b_wallz4_c8r32
0.000	0.000	0.000	0.000	0.000	0.000	6.832	113.1	0.216	3.549	2.355	13.51	0.001	0.002	0.000	0.000	0.000	0.011	2.544	2.412	0.020	1.153		pg182_o2nofp.cx10b_fpw0_wallz4_c8r32
qp100.L2
qp100.L2: point queries with 100 insert/s per client. Graphs for performance per 1-second interval are here.
Average throughput:
Query response time histogram: each cell has the percentage of responses that take <= the time in the header and max is the max response time in seconds. For max values in the top 25% of the range have a red background and in the bottom 25% of the range have a green background. The red background is not used when the min value is within 80% of the max value.
| dbms | 256us | 1ms | 4ms | 16ms | 64ms | 256ms | 1s | 4s | 16s | gt | max |
|---|---|---|---|---|---|---|---|---|---|---|---|
| pg182_o2nofp.cx10b_c8r32 | 99.982 | 0.018 | nonzero | 0.001 | |||||||
| pg182_o2nofp.cx10b_fpw0_c8r32 | 99.983 | 0.017 | 0.001 | ||||||||
| pg182_o2nofp.cx10b_wallz4_c8r32 | 99.983 | 0.017 | 0.001 | ||||||||
| pg182_o2nofp.cx10b_fpw0_wallz4_c8r32 | 99.984 | 0.016 | nonzero | 0.001 |
Insert response time histogram: each cell has the percentage of responses that take <= the time in the header and max is the max response time in seconds. For max values in the top 25% of the range have a red background and in the bottom 25% of the range have a green background. The red background is not used when the min value is within 80% of the max value.
| dbms | 256us | 1ms | 4ms | 16ms | 64ms | 256ms | 1s | 4s | 16s | gt | max |
|---|---|---|---|---|---|---|---|---|---|---|---|
| pg182_o2nofp.cx10b_c8r32 | 3.639 | 96.333 | 0.028 | 0.005 | |||||||
| pg182_o2nofp.cx10b_fpw0_c8r32 | 18.222 | 81.750 | 0.028 | 0.004 | |||||||
| pg182_o2nofp.cx10b_wallz4_c8r32 | 99.944 | 0.056 | 0.005 | ||||||||
| pg182_o2nofp.cx10b_fpw0_wallz4_c8r32 | 18.111 | 81.861 | 0.028 | 0.004 |
Delete response time histogram: each cell has the percentage of responses that take <= the time in the header and max is the max response time in seconds. For max values in the top 25% of the range have a red background and in the bottom 25% of the range have a green background. The red background is not used when the min value is within 80% of the max value.
| dbms | 256us | 1ms | 4ms | 16ms | 64ms | 256ms | 1s | 4s | 16s | gt | max |
|---|---|---|---|---|---|---|---|---|---|---|---|
| pg182_o2nofp.cx10b_c8r32 | 15.167 | 84.833 | 0.004 | ||||||||
| pg182_o2nofp.cx10b_fpw0_c8r32 | 21.333 | 78.667 | 0.004 | ||||||||
| pg182_o2nofp.cx10b_wallz4_c8r32 | 4.833 | 95.139 | 0.028 | 0.004 | |||||||
| pg182_o2nofp.cx10b_fpw0_wallz4_c8r32 | 13.194 | 86.806 | 0.004 |
Performance metrics for the DBMS listed above. Some are normalized by throughput, others are not. Legend for results is here.
ips	qps	rps	rmbps	wps	wmbps	rpq	rkbpq	wpi	wkbpi	csps	cpups	cspq	cpupq	dbgb1	dbgb2	rss	maxop	p50	p99	tag
100	13262	0	0.0	58.7	1.6	0.000	0.000	0.587	16.794	51180	9.9	3.859	60	7.9	40.1	0.1	0.001	13262	13164	pg182_o2nofp.cx10b_c8r32
100	13308	0	0.0	53.6	1.0	0.000	0.000	0.537	10.409	51357	9.7	3.859	58	7.9	36.5	0.1	0.001	13310	13199	pg182_o2nofp.cx10b_fpw0_c8r32
100	13305	0	0.0	57.2	1.4	0.000	0.000	0.573	14.757	51347	9.7	3.859	58	7.9	37.4	0.1	0.001	13310	13193	pg182_o2nofp.cx10b_wallz4_c8r32
100	13370	0	0.0	53.7	1.0	0.000	0.000	0.538	10.423	51622	9.7	3.861	58	7.9	35.5	0.1	0.001	13389	13275	pg182_o2nofp.cx10b_fpw0_wallz4_c8r32
Average values from iostat.
r/s	rkB/s	rrqm/s	%rrqm	r_await	rareq-s	w/s	wkB/s	wrqm/s	%wrqm	w_await	wareq-s	d/s	dkB/s	drqm/s	%drqm	d_await	dareq-s	f/s	f_await	aqu-sz	%util
0.000	0.000	0.000	0.000	0.000	0.000	58.60	1670.0	0.652	1.440	1.427	32.46	0.001	0.002	0.000	0.000	0.003	0.011	2.608	1.911	0.084	1.490		pg182_o2nofp.cx10b_c8r32
0.000	0.000	0.000	0.000	0.000	0.000	53.59	1039.5	0.416	1.265	1.467	20.45	0.001	0.002	0.000	0.000	0.003	0.011	2.443	2.005	0.079	1.451		pg182_o2nofp.cx10b_fpw0_c8r32
0.000	0.000	0.000	0.000	0.000	0.000	57.20	1470.0	0.577	1.334	1.419	29.31	0.001	0.002	0.000	0.000	0.000	0.011	2.557	1.928	0.083	1.413		pg182_o2nofp.cx10b_wallz4_c8r32
0.000	0.000	0.000	0.000	0.000	0.000	53.63	1039.9	0.428	1.365	1.523	20.43	0.001	0.002	0.000	0.000	0.003	0.011	2.452	2.093	0.081	1.438		pg182_o2nofp.cx10b_fpw0_wallz4_c8r32
qr500.L3
qr500.L3: range queries with 500 insert/s per client. Graphs for performance per 1-second interval are here.
Average throughput:
Query response time histogram: each cell has the percentage of responses that take <= the time in the header and max is the max response time in seconds. For max values in the top 25% of the range have a red background and in the bottom 25% of the range have a green background. The red background is not used when the min value is within 80% of the max value.
| dbms | 256us | 1ms | 4ms | 16ms | 64ms | 256ms | 1s | 4s | 16s | gt | max |
|---|---|---|---|---|---|---|---|---|---|---|---|
| pg182_o2nofp.cx10b_c8r32 | 99.989 | 0.011 | nonzero | 0.002 | |||||||
| pg182_o2nofp.cx10b_fpw0_c8r32 | 99.990 | 0.010 | nonzero | 0.001 | |||||||
| pg182_o2nofp.cx10b_wallz4_c8r32 | 99.990 | 0.010 | nonzero | 0.002 | |||||||
| pg182_o2nofp.cx10b_fpw0_wallz4_c8r32 | 99.989 | 0.011 | nonzero | 0.002 |
Insert response time histogram: each cell has the percentage of responses that take <= the time in the header and max is the max response time in seconds. For max values in the top 25% of the range have a red background and in the bottom 25% of the range have a green background. The red background is not used when the min value is within 80% of the max value.
| dbms | 256us | 1ms | 4ms | 16ms | 64ms | 256ms | 1s | 4s | 16s | gt | max |
|---|---|---|---|---|---|---|---|---|---|---|---|
| pg182_o2nofp.cx10b_c8r32 | 76.006 | 23.989 | 0.006 | 0.004 | |||||||
| pg182_o2nofp.cx10b_fpw0_c8r32 | 84.122 | 15.872 | 0.006 | 0.004 | |||||||
| pg182_o2nofp.cx10b_wallz4_c8r32 | 48.717 | 51.272 | 0.011 | 0.005 | |||||||
| pg182_o2nofp.cx10b_fpw0_wallz4_c8r32 | 83.122 | 16.867 | 0.011 | 0.005 |
Delete response time histogram: each cell has the percentage of responses that take <= the time in the header and max is the max response time in seconds. For max values in the top 25% of the range have a red background and in the bottom 25% of the range have a green background. The red background is not used when the min value is within 80% of the max value.
| dbms | 256us | 1ms | 4ms | 16ms | 64ms | 256ms | 1s | 4s | 16s | gt | max |
|---|---|---|---|---|---|---|---|---|---|---|---|
| pg182_o2nofp.cx10b_c8r32 | 4.344 | 93.822 | 1.833 | 0.007 | |||||||
| pg182_o2nofp.cx10b_fpw0_c8r32 | 6.500 | 91.728 | 1.772 | 0.005 | |||||||
| pg182_o2nofp.cx10b_wallz4_c8r32 | 1.689 | 96.483 | 1.828 | 0.005 | |||||||
| pg182_o2nofp.cx10b_fpw0_wallz4_c8r32 | 2.550 | 95.611 | 1.839 | 0.005 |
Performance metrics for the DBMS listed above. Some are normalized by throughput, others are not. Legend for results is here.
ips	qps	rps	rmbps	wps	wmbps	rpq	rkbpq	wpi	wkbpi	csps	cpups	cspq	cpupq	dbgb1	dbgb2	rss	maxop	p50	p99	tag
500	24084	0	0.0	66.6	2.3	0.000	0.000	0.133	4.612	92026	9.3	3.821	31	7.9	39.0	0.3	0.002	24077	22615	pg182_o2nofp.cx10b_c8r32
500	24164	0	0.0	55.4	1.1	0.000	0.000	0.111	2.221	92327	9.2	3.821	30	7.9	36.4	0.3	0.001	24140	22763	pg182_o2nofp.cx10b_fpw0_c8r32
500	24168	0	0.0	63.1	1.9	0.000	0.000	0.126	3.842	92345	9.3	3.821	31	7.9	36.6	0.3	0.002	24172	22715	pg182_o2nofp.cx10b_wallz4_c8r32
499	24134	0	0.0	55.5	1.1	0.000	0.000	0.111	2.234	92262	9.2	3.823	30	7.9	35.5	0.3	0.002	24109	22716	pg182_o2nofp.cx10b_fpw0_wallz4_c8r32
Average values from iostat.
r/s	rkB/s	rrqm/s	%rrqm	r_await	rareq-s	w/s	wkB/s	wrqm/s	%wrqm	w_await	wareq-s	d/s	dkB/s	drqm/s	%drqm	d_await	dareq-s	f/s	f_await	aqu-sz	%util
0.005	0.020	0.000	0.000	0.000	0.011	66.46	2291.4	1.302	2.536	1.235	36.39	0.043	684.6	0.000	0.000	0.005	44.46	3.710	1.891	0.085	1.681		pg182_o2nofp.cx10b_c8r32
0.001	0.004	0.000	0.000	0.000	0.011	55.41	1110.0	0.690	1.913	1.403	24.88	0.003	45.64	0.000	0.000	0.005	45.65	2.723	2.005	0.080	1.424		pg182_o2nofp.cx10b_fpw0_c8r32
0.000	0.000	0.000	0.000	0.000	0.000	63.06	1911.9	1.155	2.538	1.261	33.12	0.032	474.6	0.000	0.000	0.005	41.65	3.419	1.954	0.082	1.571		pg182_o2nofp.cx10b_wallz4_c8r32
0.000	0.000	0.000	0.000	0.000	0.000	55.46	1115.3	0.794	2.534	1.388	25.03	0.004	45.64	0.000	0.000	0.005	38.04	2.769	1.974	0.079	1.468		pg182_o2nofp.cx10b_fpw0_wallz4_c8r32
qp500.L4
qp500.L4: point queries with 500 insert/s per client. Graphs for performance per 1-second interval are here.
Average throughput:
Query response time histogram: each cell has the percentage of responses that take <= the time in the header and max is the max response time in seconds. For max values in the top 25% of the range have a red background and in the bottom 25% of the range have a green background. The red background is not used when the min value is within 80% of the max value.
| dbms | 256us | 1ms | 4ms | 16ms | 64ms | 256ms | 1s | 4s | 16s | gt | max |
|---|---|---|---|---|---|---|---|---|---|---|---|
| pg182_o2nofp.cx10b_c8r32 | 99.975 | 0.025 | nonzero | 0.002 | |||||||
| pg182_o2nofp.cx10b_fpw0_c8r32 | 99.976 | 0.024 | nonzero | 0.003 | |||||||
| pg182_o2nofp.cx10b_wallz4_c8r32 | 99.977 | 0.023 | nonzero | 0.003 | |||||||
| pg182_o2nofp.cx10b_fpw0_wallz4_c8r32 | 99.975 | 0.025 | nonzero | 0.001 |
Insert response time histogram: each cell has the percentage of responses that take <= the time in the header and max is the max response time in seconds. For max values in the top 25% of the range have a red background and in the bottom 25% of the range have a green background. The red background is not used when the min value is within 80% of the max value.
| dbms | 256us | 1ms | 4ms | 16ms | 64ms | 256ms | 1s | 4s | 16s | gt | max |
|---|---|---|---|---|---|---|---|---|---|---|---|
| pg182_o2nofp.cx10b_c8r32 | 76.472 | 23.494 | 0.011 | 0.022 | 0.024 | ||||||
| pg182_o2nofp.cx10b_fpw0_c8r32 | 78.489 | 21.506 | 0.006 | 0.004 | |||||||
| pg182_o2nofp.cx10b_wallz4_c8r32 | 64.772 | 35.206 | 0.022 | 0.015 | |||||||
| pg182_o2nofp.cx10b_fpw0_wallz4_c8r32 | 78.606 | 21.389 | 0.006 | 0.004 |
Delete response time histogram: each cell has the percentage of responses that take <= the time in the header and max is the max response time in seconds. For max values in the top 25% of the range have a red background and in the bottom 25% of the range have a green background. The red background is not used when the min value is within 80% of the max value.
| dbms | 256us | 1ms | 4ms | 16ms | 64ms | 256ms | 1s | 4s | 16s | gt | max |
|---|---|---|---|---|---|---|---|---|---|---|---|
| pg182_o2nofp.cx10b_c8r32 | 0.239 | 25.539 | 72.528 | 1.678 | 0.017 | 0.018 | |||||
| pg182_o2nofp.cx10b_fpw0_c8r32 | 0.244 | 29.039 | 67.906 | 2.811 | 0.011 | ||||||
| pg182_o2nofp.cx10b_wallz4_c8r32 | 0.128 | 28.922 | 67.244 | 3.706 | 0.014 | ||||||
| pg182_o2nofp.cx10b_fpw0_wallz4_c8r32 | 0.300 | 31.489 | 65.589 | 2.622 | 0.011 |
Performance metrics for the DBMS listed above. Some are normalized by throughput, others are not. Legend for results is here.
ips	qps	rps	rmbps	wps	wmbps	rpq	rkbpq	wpi	wkbpi	csps	cpups	cspq	cpupq	dbgb1	dbgb2	rss	maxop	p50	p99	tag
500	13172	0	0.0	41.4	2.9	0.000	0.000	0.083	6.020	50940	10.5	3.867	64	7.9	36.9	0.2	0.002	13182	13034	pg182_o2nofp.cx10b_c8r32
500	13234	0	0.0	31.6	1.9	0.000	0.000	0.063	3.837	51184	10.4	3.867	63	7.9	36.1	0.2	0.003	13245	13117	pg182_o2nofp.cx10b_fpw0_c8r32
500	13202	0	0.0	38.3	2.6	0.000	0.000	0.077	5.303	51058	10.4	3.867	63	7.9	35.1	0.2	0.003	13213	13050	pg182_o2nofp.cx10b_wallz4_c8r32
500	13326	0	0.0	31.7	1.9	0.000	0.000	0.063	3.845	51531	10.3	3.867	62	7.9	35.1	0.2	0.001	13337	13196	pg182_o2nofp.cx10b_fpw0_wallz4_c8r32
Average values from iostat.
r/s	rkB/s	rrqm/s	%rrqm	r_await	rareq-s	w/s	wkB/s	wrqm/s	%wrqm	w_await	wareq-s	d/s	dkB/s	drqm/s	%drqm	d_await	dareq-s	f/s	f_await	aqu-sz	%util
0.001	0.004	0.000	0.000	0.000	0.011	41.02	2967.5	1.426	2.798	0.829	66.15	0.085	1241.5	0.000	0.000	0.004	41.13	3.048	1.845	0.034	1.281		pg182_o2nofp.cx10b_c8r32
0.000	0.000	0.000	0.000	0.000	0.000	31.62	1917.0	0.867	3.328	0.864	64.23	0.019	237.4	0.000	0.000	0.008	36.00	2.564	1.855	0.028	1.180		pg182_o2nofp.cx10b_fpw0_c8r32
0.001	0.002	0.000	0.000	0.000	0.011	38.15	2628.4	1.256	2.915	0.839	65.93	0.064	912.9	0.000	0.000	0.008	81.13	2.977	1.839	0.033	1.272		pg182_o2nofp.cx10b_wallz4_c8r32
0.000	0.000	0.000	0.000	0.000	0.000	31.68	1921.0	0.899	3.506	0.877	64.10	0.019	237.4	0.000	0.000	0.008	36.00	2.593	1.877	0.028	1.181		pg182_o2nofp.cx10b_fpw0_wallz4_c8r32
qr1000.L5
qr1000.L5: range queries with 1000 insert/s per client. Graphs for performance per 1-second interval are here.
Average throughput:
Query response time histogram: each cell has the percentage of responses that take <= the time in the header and max is the max response time in seconds. For max values in the top 25% of the range have a red background and in the bottom 25% of the range have a green background. The red background is not used when the min value is within 80% of the max value.
| dbms | 256us | 1ms | 4ms | 16ms | 64ms | 256ms | 1s | 4s | 16s | gt | max |
|---|---|---|---|---|---|---|---|---|---|---|---|
| pg182_o2nofp.cx10b_c8r32 | 99.988 | 0.012 | nonzero | nonzero | 0.012 | ||||||
| pg182_o2nofp.cx10b_fpw0_c8r32 | 99.988 | 0.012 | nonzero | nonzero | 0.004 | ||||||
| pg182_o2nofp.cx10b_wallz4_c8r32 | 99.988 | 0.012 | nonzero | nonzero | 0.004 | ||||||
| pg182_o2nofp.cx10b_fpw0_wallz4_c8r32 | 99.988 | 0.012 | nonzero | nonzero | 0.004 |
Insert response time histogram: each cell has the percentage of responses that take <= the time in the header and max is the max response time in seconds. For max values in the top 25% of the range have a red background and in the bottom 25% of the range have a green background. The red background is not used when the min value is within 80% of the max value.
| dbms | 256us | 1ms | 4ms | 16ms | 64ms | 256ms | 1s | 4s | 16s | gt | max |
|---|---|---|---|---|---|---|---|---|---|---|---|
| pg182_o2nofp.cx10b_c8r32 | 73.722 | 26.269 | 0.006 | 0.003 | 0.018 | ||||||
| pg182_o2nofp.cx10b_fpw0_c8r32 | 75.519 | 24.478 | 0.003 | 0.005 | |||||||
| pg182_o2nofp.cx10b_wallz4_c8r32 | 63.003 | 36.994 | 0.003 | 0.005 | |||||||
| pg182_o2nofp.cx10b_fpw0_wallz4_c8r32 | 77.894 | 22.103 | 0.003 | 0.004 |
Delete response time histogram: each cell has the percentage of responses that take <= the time in the header and max is the max response time in seconds. For max values in the top 25% of the range have a red background and in the bottom 25% of the range have a green background. The red background is not used when the min value is within 80% of the max value.
| dbms | 256us | 1ms | 4ms | 16ms | 64ms | 256ms | 1s | 4s | 16s | gt | max |
|---|---|---|---|---|---|---|---|---|---|---|---|
| pg182_o2nofp.cx10b_c8r32 | 0.078 | 13.069 | 85.500 | 1.350 | 0.003 | 0.017 | |||||
| pg182_o2nofp.cx10b_fpw0_c8r32 | 0.069 | 13.714 | 84.861 | 1.356 | 0.007 | ||||||
| pg182_o2nofp.cx10b_wallz4_c8r32 | 0.097 | 16.839 | 81.733 | 1.331 | 0.007 | ||||||
| pg182_o2nofp.cx10b_fpw0_wallz4_c8r32 | 0.125 | 20.111 | 78.300 | 1.464 | 0.007 |
Performance metrics for the DBMS listed above. Some are normalized by throughput, others are not. Legend for results is here.
ips	qps	rps	rmbps	wps	wmbps	rpq	rkbpq	wpi	wkbpi	csps	cpups	cspq	cpupq	dbgb1	dbgb2	rss	maxop	p50	p99	tag
999	24086	0	0.0	51.6	3.4	0.000	0.000	0.052	3.518	92226	9.8	3.829	33	8.0	34.6	0.3	0.012	23821	22300	pg182_o2nofp.cx10b_c8r32
999	24046	0	0.0	38.9	2.2	0.000	0.000	0.039	2.216	92057	9.8	3.828	33	8.0	35.7	0.4	0.004	23849	21970	pg182_o2nofp.cx10b_fpw0_c8r32
999	24431	0	0.0	47.1	3.0	0.000	0.000	0.047	3.062	93539	9.9	3.829	32	8.0	33.4	0.3	0.004	24217	22396	pg182_o2nofp.cx10b_wallz4_c8r32
999	24245	0	0.0	38.6	2.1	0.000	0.000	0.039	2.178	92813	10.0	3.828	33	8.0	34.7	5.1	0.004	23996	22197	pg182_o2nofp.cx10b_fpw0_wallz4_c8r32
Average values from iostat.
r/s	rkB/s	rrqm/s	%rrqm	r_await	rareq-s	w/s	wkB/s	wrqm/s	%wrqm	w_await	wareq-s	d/s	dkB/s	drqm/s	%drqm	d_await	dareq-s	f/s	f_await	aqu-sz	%util
0.002	0.009	0.000	0.000	0.000	0.011	51.29	3484.3	1.729	2.831	0.762	68.93	0.091	1360.1	0.000	0.000	0.008	78.88	4.062	1.811	0.040	1.496		pg182_o2nofp.cx10b_c8r32
0.000	0.000	0.000	0.000	0.000	0.000	38.89	2214.2	1.073	3.330	0.841	67.69	0.019	264.8	0.000	0.000	0.005	38.94	2.867	1.883	0.033	1.225		pg182_o2nofp.cx10b_fpw0_c8r32
0.000	0.000	0.000	0.000	0.000	0.000	47.02	3043.2	1.511	2.926	0.779	68.96	0.066	995.0	0.000	0.000	0.004	42.53	3.666	1.826	0.038	1.410		pg182_o2nofp.cx10b_wallz4_c8r32
0.000	0.000	0.000	0.000	0.000	0.000	38.59	2176.6	0.934	3.022	0.828	67.16	0.021	264.8	0.000	0.000	0.002	36.78	2.842	1.821	0.033	1.246		pg182_o2nofp.cx10b_fpw0_wallz4_c8r32
qp1000.L6
qp1000.L6: point queries with 1000 insert/s per client. Graphs for performance per 1-second interval are here.
Average throughput:
Query response time histogram: each cell has the percentage of responses that take <= the time in the header and max is the max response time in seconds. For max values in the top 25% of the range have a red background and in the bottom 25% of the range have a green background. The red background is not used when the min value is within 80% of the max value.
| dbms | 256us | 1ms | 4ms | 16ms | 64ms | 256ms | 1s | 4s | 16s | gt | max |
|---|---|---|---|---|---|---|---|---|---|---|---|
| pg182_o2nofp.cx10b_c8r32 | 99.973 | 0.027 | nonzero | 0.001 | |||||||
| pg182_o2nofp.cx10b_fpw0_c8r32 | 99.973 | 0.027 | nonzero | 0.001 | |||||||
| pg182_o2nofp.cx10b_wallz4_c8r32 | 99.973 | 0.027 | nonzero | 0.003 | |||||||
| pg182_o2nofp.cx10b_fpw0_wallz4_c8r32 | 99.972 | 0.028 | nonzero | 0.001 |
Insert response time histogram: each cell has the percentage of responses that take <= the time in the header and max is the max response time in seconds. For max values in the top 25% of the range have a red background and in the bottom 25% of the range have a green background. The red background is not used when the min value is within 80% of the max value.
| dbms | 256us | 1ms | 4ms | 16ms | 64ms | 256ms | 1s | 4s | 16s | gt | max |
|---|---|---|---|---|---|---|---|---|---|---|---|
| pg182_o2nofp.cx10b_c8r32 | 78.567 | 21.425 | 0.006 | 0.003 | 0.018 | ||||||
| pg182_o2nofp.cx10b_fpw0_c8r32 | 72.706 | 27.292 | 0.003 | 0.004 | |||||||
| pg182_o2nofp.cx10b_wallz4_c8r32 | 67.547 | 32.431 | 0.019 | 0.003 | 0.023 | ||||||
| pg182_o2nofp.cx10b_fpw0_wallz4_c8r32 | 72.811 | 27.186 | 0.003 | 0.005 |
Delete response time histogram: each cell has the percentage of responses that take <= the time in the header and max is the max response time in seconds. For max values in the top 25% of the range have a red background and in the bottom 25% of the range have a green background. The red background is not used when the min value is within 80% of the max value.
| dbms | 256us | 1ms | 4ms | 16ms | 64ms | 256ms | 1s | 4s | 16s | gt | max |
|---|---|---|---|---|---|---|---|---|---|---|---|
| pg182_o2nofp.cx10b_c8r32 | 0.233 | 34.856 | 63.769 | 1.139 | 0.003 | 0.016 | |||||
| pg182_o2nofp.cx10b_fpw0_c8r32 | 0.231 | 17.525 | 79.481 | 2.764 | 0.010 | ||||||
| pg182_o2nofp.cx10b_wallz4_c8r32 | 0.108 | 17.542 | 79.933 | 2.414 | 0.003 | 0.017 | |||||
| pg182_o2nofp.cx10b_fpw0_wallz4_c8r32 | 0.300 | 17.475 | 79.692 | 2.533 | 0.010 |
Performance metrics for the DBMS listed above. Some are normalized by throughput, others are not. Legend for results is here.
ips	qps	rps	rmbps	wps	wmbps	rpq	rkbpq	wpi	wkbpi	csps	cpups	cspq	cpupq	dbgb1	dbgb2	rss	maxop	p50	p99	tag
999	13135	0	0.0	41.3	3.5	0.000	0.000	0.041	3.623	51008	10.7	3.883	65	8.0	31.8	0.2	0.001	13150	12974	pg182_o2nofp.cx10b_c8r32
999	13116	0	0.0	31.2	2.4	0.000	0.000	0.031	2.473	50903	10.9	3.881	66	8.0	34.9	0.3	0.001	13119	12958	pg182_o2nofp.cx10b_fpw0_c8r32
999	13176	0	0.0	41.5	3.6	0.000	0.000	0.042	3.638	51139	11.0	3.881	67	8.0	31.3	0.3	0.003	13195	12986	pg182_o2nofp.cx10b_wallz4_c8r32
999	13256	0	0.0	31.0	2.4	0.000	0.000	0.031	2.440	51441	11.2	3.881	68	8.0	33.9	0.3	0.001	13262	13038	pg182_o2nofp.cx10b_fpw0_wallz4_c8r32
Average values from iostat.
r/s	rkB/s	rrqm/s	%rrqm	r_await	rareq-s	w/s	wkB/s	wrqm/s	%wrqm	w_await	wareq-s	d/s	dkB/s	drqm/s	%drqm	d_await	dareq-s	f/s	f_await	aqu-sz	%util
0.001	0.002	0.000	0.000	0.000	0.011	40.87	3564.1	1.605	2.341	0.651	85.40	0.108	1643.0	0.000	0.000	0.005	42.80	3.069	1.884	0.028	1.179		pg182_o2nofp.cx10b_c8r32
0.000	0.000	0.000	0.000	0.000	0.000	31.23	2470.9	1.034	3.123	0.680	84.48	0.033	492.9	0.000	0.000	0.001	42.51	2.563	1.862	0.022	1.009		pg182_o2nofp.cx10b_fpw0_c8r32
0.000	0.000	0.000	0.000	0.000	0.000	41.29	3611.2	1.506	3.036	0.711	82.27	0.082	1241.4	0.000	0.000	0.001	42.24	2.945	1.872	0.029	1.121		pg182_o2nofp.cx10b_wallz4_c8r32
0.000	0.000	0.000	0.000	0.000	0.000	31.00	2438.1	1.003	3.143	0.680	83.96	0.033	492.9	0.000	0.000	0.008	83.61	2.570	1.874	0.023	1.029		pg182_o2nofp.cx10b_fpw0_wallz4_c8r32
l.i0
l.i0: load without secondary indexes
Performance metrics for all DBMS, not just the ones listed above. Some are normalized by throughput, others are not. Legend for results is here.
ips	qps	rps	rmbps	wps	wmbps	rpq	rkbpq	wpi	wkbpi	csps	cpups	cspq	cpupq	dbgb1	dbgb2	rss	maxop	p50	p99	tag
209790	0	0	0.0	779.1	88.8	0.000	0.000	0.004	0.433	22153	19.2	0.106	7	2.9	7.8	1.8	0.004	210275	201879	pg182_o2nofp.cx10b_c8r32
208333	0	0	0.0	774.5	88.1	0.000	0.000	0.004	0.433	21719	19.2	0.104	7	2.9	7.8	2.4	0.002	208879	200678	pg182_o2nofp.cx10b_fpw0_c8r32
201342	0	0	0.0	751.3	85.5	0.000	0.000	0.004	0.435	21179	19.3	0.105	8	2.9	7.8	1.7	0.005	203664	195968	pg182_o2nofp.cx10b_wallz4_c8r32
206896	0	0	0.0	764.1	86.9	0.000	0.000	0.004	0.430	21537	19.3	0.104	7	2.9	7.8	2.4	0.002	208163	198579	pg182_o2nofp.cx10b_fpw0_wallz4_c8r32
l.x
l.x: create secondary indexes
Performance metrics for all DBMS, not just the ones listed above. Some are normalized by throughput, others are not. Legend for results is here.
ips	qps	rps	rmbps	wps	wmbps	rpq	rkbpq	wpi	wkbpi	csps	cpups	cspq	cpupq	dbgb1	dbgb2	rss	maxop	p50	p99	tag
500002	0	1	0.0	1030.9	126.6	0.000	0.000	0.002	0.259	2979	11.1	0.006	2	5.8	13.3	3.0	0.002	NA	NA	pg182_o2nofp.cx10b_c8r32
491805	0	0	0.0	1083.8	133.3	0.000	0.000	0.002	0.278	3031	11.1	0.006	2	5.8	13.3	3.0	0.001	NA	NA	pg182_o2nofp.cx10b_fpw0_c8r32
491805	0	0	0.0	725.8	89.2	0.000	0.000	0.001	0.186	1725	11.3	0.004	2	5.8	12.2	3.0	0.002	NA	NA	pg182_o2nofp.cx10b_wallz4_c8r32
500002	0	0	0.0	802.4	98.7	0.000	0.000	0.002	0.202	1691	11.3	0.003	2	5.8	12.2	3.0	0.002	NA	NA	pg182_o2nofp.cx10b_fpw0_wallz4_c8r32
l.i1
l.i1: continue load after secondary indexes created with 50 inserts per transaction
Performance metrics for all DBMS, not just the ones listed above. Some are normalized by throughput, others are not. Legend for results is here.
ips	qps	rps	rmbps	wps	wmbps	rpq	rkbpq	wpi	wkbpi	csps	cpups	cspq	cpupq	dbgb1	dbgb2	rss	maxop	p50	p99	tag
21119	0	0	0.0	266.7	29.3	0.000	0.000	0.013	1.420	8727	19.9	0.413	75	7.8	38.3	0.1	0.045	14098	9399	pg182_o2nofp.cx10b_c8r32
21870	0	0	0.0	237.7	25.9	0.000	0.000	0.011	1.215	8960	20.2	0.410	74	7.8	35.0	5.0	0.020	16547	11998	pg182_o2nofp.cx10b_fpw0_c8r32
20274	0	0	0.0	237.6	26.0	0.000	0.000	0.012	1.311	8392	19.5	0.414	77	7.8	35.7	3.4	0.007	13348	7749	pg182_o2nofp.cx10b_wallz4_c8r32
22663	0	0	0.0	242.7	26.4	0.000	0.000	0.011	1.194	9271	20.3	0.409	72	7.8	33.9	7.9	0.012	17348	12398	pg182_o2nofp.cx10b_fpw0_wallz4_c8r32
l.i2
l.i2: continue load after secondary indexes created with 5 inserts per transaction
Performance metrics for all DBMS, not just the ones listed above. Some are normalized by throughput, others are not. Legend for results is here.
ips	qps	rps	rmbps	wps	wmbps	rpq	rkbpq	wpi	wkbpi	csps	cpups	cspq	cpupq	dbgb1	dbgb2	rss	maxop	p50	p99	tag
2608	0	0	0.0	58.0	5.7	0.000	0.000	0.022	2.240	9836	15.2	3.771	466	7.9	40.1	0.2	0.018	1695	1125	pg182_o2nofp.cx10b_c8r32
2751	0	0	0.0	49.3	4.7	0.000	0.000	0.018	1.761	10375	15.2	3.771	442	7.9	36.5	1.6	0.005	2020	1389	pg182_o2nofp.cx10b_fpw0_c8r32
2582	0	0	0.0	55.0	5.4	0.000	0.000	0.021	2.125	9749	15.2	3.776	471	7.9	37.4	0.2	0.033	1685	1085	pg182_o2nofp.cx10b_wallz4_c8r32
2731	0	0	0.0	50.0	4.8	0.000	0.000	0.018	1.813	10316	15.3	3.778	448	7.9	35.5	0.2	0.020	1950	1420	pg182_o2nofp.cx10b_fpw0_wallz4_c8r32
qr100.L1
qr100.L1: range queries with 100 insert/s per client
Performance metrics for all DBMS, not just the ones listed above. Some are normalized by throughput, others are not. Legend for results is here.
ips	qps	rps	rmbps	wps	wmbps	rpq	rkbpq	wpi	wkbpi	csps	cpups	cspq	cpupq	dbgb1	dbgb2	rss	maxop	p50	p99	tag
100	26412	0	0.0	12.2	0.8	0.000	0.000	0.122	7.727	100766	8.4	3.815	25	7.9	40.1	0.1	0.001	26427	26006	pg182_o2nofp.cx10b_c8r32
100	26540	0	0.0	6.7	0.1	0.000	0.000	0.067	1.125	101259	8.4	3.815	25	7.9	36.5	0.1	0.001	26540	26136	pg182_o2nofp.cx10b_fpw0_c8r32
100	26522	0	0.0	10.3	0.5	0.000	0.000	0.103	5.620	101192	8.5	3.815	26	7.9	37.4	0.1	0.001	26523	26069	pg182_o2nofp.cx10b_wallz4_c8r32
100	26651	0	0.0	6.8	0.1	0.000	0.000	0.068	1.132	101734	8.1	3.817	24	7.9	35.5	0.1	0.001	26691	26235	pg182_o2nofp.cx10b_fpw0_wallz4_c8r32
qp100.L2
qp100.L2: point queries with 100 insert/s per client
Performance metrics for all DBMS, not just the ones listed above. Some are normalized by throughput, others are not. Legend for results is here.
ips	qps	rps	rmbps	wps	wmbps	rpq	rkbpq	wpi	wkbpi	csps	cpups	cspq	cpupq	dbgb1	dbgb2	rss	maxop	p50	p99	tag
100	13262	0	0.0	58.7	1.6	0.000	0.000	0.587	16.794	51180	9.9	3.859	60	7.9	40.1	0.1	0.001	13262	13164	pg182_o2nofp.cx10b_c8r32
100	13308	0	0.0	53.6	1.0	0.000	0.000	0.537	10.409	51357	9.7	3.859	58	7.9	36.5	0.1	0.001	13310	13199	pg182_o2nofp.cx10b_fpw0_c8r32
100	13305	0	0.0	57.2	1.4	0.000	0.000	0.573	14.757	51347	9.7	3.859	58	7.9	37.4	0.1	0.001	13310	13193	pg182_o2nofp.cx10b_wallz4_c8r32
100	13370	0	0.0	53.7	1.0	0.000	0.000	0.538	10.423	51622	9.7	3.861	58	7.9	35.5	0.1	0.001	13389	13275	pg182_o2nofp.cx10b_fpw0_wallz4_c8r32
qr500.L3
qr500.L3: range queries with 500 insert/s per client
Performance metrics for all DBMS, not just the ones listed above. Some are normalized by throughput, others are not. Legend for results is here.
ips	qps	rps	rmbps	wps	wmbps	rpq	rkbpq	wpi	wkbpi	csps	cpups	cspq	cpupq	dbgb1	dbgb2	rss	maxop	p50	p99	tag
500	24084	0	0.0	66.6	2.3	0.000	0.000	0.133	4.612	92026	9.3	3.821	31	7.9	39.0	0.3	0.002	24077	22615	pg182_o2nofp.cx10b_c8r32
500	24164	0	0.0	55.4	1.1	0.000	0.000	0.111	2.221	92327	9.2	3.821	30	7.9	36.4	0.3	0.001	24140	22763	pg182_o2nofp.cx10b_fpw0_c8r32
500	24168	0	0.0	63.1	1.9	0.000	0.000	0.126	3.842	92345	9.3	3.821	31	7.9	36.6	0.3	0.002	24172	22715	pg182_o2nofp.cx10b_wallz4_c8r32
499	24134	0	0.0	55.5	1.1	0.000	0.000	0.111	2.234	92262	9.2	3.823	30	7.9	35.5	0.3	0.002	24109	22716	pg182_o2nofp.cx10b_fpw0_wallz4_c8r32
qp500.L4
qp500.L4: point queries with 500 insert/s per client
Performance metrics for all DBMS, not just the ones listed above. Some are normalized by throughput, others are not. Legend for results is here.
ips	qps	rps	rmbps	wps	wmbps	rpq	rkbpq	wpi	wkbpi	csps	cpups	cspq	cpupq	dbgb1	dbgb2	rss	maxop	p50	p99	tag
500	13172	0	0.0	41.4	2.9	0.000	0.000	0.083	6.020	50940	10.5	3.867	64	7.9	36.9	0.2	0.002	13182	13034	pg182_o2nofp.cx10b_c8r32
500	13234	0	0.0	31.6	1.9	0.000	0.000	0.063	3.837	51184	10.4	3.867	63	7.9	36.1	0.2	0.003	13245	13117	pg182_o2nofp.cx10b_fpw0_c8r32
500	13202	0	0.0	38.3	2.6	0.000	0.000	0.077	5.303	51058	10.4	3.867	63	7.9	35.1	0.2	0.003	13213	13050	pg182_o2nofp.cx10b_wallz4_c8r32
500	13326	0	0.0	31.7	1.9	0.000	0.000	0.063	3.845	51531	10.3	3.867	62	7.9	35.1	0.2	0.001	13337	13196	pg182_o2nofp.cx10b_fpw0_wallz4_c8r32
qr1000.L5
qr1000.L5: range queries with 1000 insert/s per client
Performance metrics for all DBMS, not just the ones listed above. Some are normalized by throughput, others are not. Legend for results is here.
ips	qps	rps	rmbps	wps	wmbps	rpq	rkbpq	wpi	wkbpi	csps	cpups	cspq	cpupq	dbgb1	dbgb2	rss	maxop	p50	p99	tag
999	24086	0	0.0	51.6	3.4	0.000	0.000	0.052	3.518	92226	9.8	3.829	33	8.0	34.6	0.3	0.012	23821	22300	pg182_o2nofp.cx10b_c8r32
999	24046	0	0.0	38.9	2.2	0.000	0.000	0.039	2.216	92057	9.8	3.828	33	8.0	35.7	0.4	0.004	23849	21970	pg182_o2nofp.cx10b_fpw0_c8r32
999	24431	0	0.0	47.1	3.0	0.000	0.000	0.047	3.062	93539	9.9	3.829	32	8.0	33.4	0.3	0.004	24217	22396	pg182_o2nofp.cx10b_wallz4_c8r32
999	24245	0	0.0	38.6	2.1	0.000	0.000	0.039	2.178	92813	10.0	3.828	33	8.0	34.7	5.1	0.004	23996	22197	pg182_o2nofp.cx10b_fpw0_wallz4_c8r32
qp1000.L6
qp1000.L6: point queries with 1000 insert/s per client
Performance metrics for all DBMS, not just the ones listed above. Some are normalized by throughput, others are not. Legend for results is here.
ips	qps	rps	rmbps	wps	wmbps	rpq	rkbpq	wpi	wkbpi	csps	cpups	cspq	cpupq	dbgb1	dbgb2	rss	maxop	p50	p99	tag
999	13135	0	0.0	41.3	3.5	0.000	0.000	0.041	3.623	51008	10.7	3.883	65	8.0	31.8	0.2	0.001	13150	12974	pg182_o2nofp.cx10b_c8r32
999	13116	0	0.0	31.2	2.4	0.000	0.000	0.031	2.473	50903	10.9	3.881	66	8.0	34.9	0.3	0.001	13119	12958	pg182_o2nofp.cx10b_fpw0_c8r32
999	13176	0	0.0	41.5	3.6	0.000	0.000	0.042	3.638	51139	11.0	3.881	67	8.0	31.3	0.3	0.003	13195	12986	pg182_o2nofp.cx10b_wallz4_c8r32
999	13256	0	0.0	31.0	2.4	0.000	0.000	0.031	2.440	51441	11.2	3.881	68	8.0	33.9	0.3	0.001	13262	13038	pg182_o2nofp.cx10b_fpw0_wallz4_c8r32
l.i0
- l.i0: load without secondary indexes
- Legend for results is here.
- Each entry lists the percentage of responses that fit in that bucket (slower than max time for previous bucket, faster than min time for next bucket).
Insert response time histogram
256us	1ms	4ms	16ms	64ms	256ms	1s	4s	16s	gt	max	tag
0.000	99.989	0.011	0.000	0.000	0.000	0.000	0.000	0.000	0.000	0.004	pg182_o2nofp.cx10b_c8r32
0.000	99.989	0.011	0.000	0.000	0.000	0.000	0.000	0.000	0.000	0.002	pg182_o2nofp.cx10b_fpw0_c8r32
0.000	99.988	0.011	nonzero	0.000	0.000	0.000	0.000	0.000	0.000	0.005	pg182_o2nofp.cx10b_wallz4_c8r32
0.000	99.991	0.009	0.000	0.000	0.000	0.000	0.000	0.000	0.000	0.002	pg182_o2nofp.cx10b_fpw0_wallz4_c8r32
l.x
- l.x: create secondary indexes
- Legend for results is here.
- Each entry lists the percentage of responses that fit in that bucket (slower than max time for previous bucket, faster than min time for next bucket).
TODO - determine whether there is data for create index response time
l.i1
- l.i1: continue load after secondary indexes created with 50 inserts per transaction
- Legend for results is here.
- Each entry lists the percentage of responses that fit in that bucket (slower than max time for previous bucket, faster than min time for next bucket).
Insert response time histogram
256us	1ms	4ms	16ms	64ms	256ms	1s	4s	16s	gt	max	tag
0.000	54.924	45.074	0.001	0.001	0.000	0.000	0.000	0.000	0.000	0.045	pg182_o2nofp.cx10b_c8r32
0.000	48.965	51.035	nonzero	nonzero	0.000	0.000	0.000	0.000	0.000	0.020	pg182_o2nofp.cx10b_fpw0_c8r32
0.000	58.328	41.672	nonzero	0.000	0.000	0.000	0.000	0.000	0.000	0.007	pg182_o2nofp.cx10b_wallz4_c8r32
0.000	52.424	47.575	nonzero	0.000	0.000	0.000	0.000	0.000	0.000	0.012	pg182_o2nofp.cx10b_fpw0_wallz4_c8r32
Delete response time histogram
256us	1ms	4ms	16ms	64ms	256ms	1s	4s	16s	gt	max	tag
0.003	26.765	57.216	16.015	0.001	0.000	0.000	0.000	0.000	0.000	0.045	pg182_o2nofp.cx10b_c8r32
nonzero	26.610	70.888	2.502	nonzero	0.000	0.000	0.000	0.000	0.000	0.020	pg182_o2nofp.cx10b_fpw0_c8r32
0.002	27.665	53.096	19.237	0.000	0.000	0.000	0.000	0.000	0.000	0.008	pg182_o2nofp.cx10b_wallz4_c8r32
0.002	26.657	71.965	1.377	0.000	0.000	0.000	0.000	0.000	0.000	0.006	pg182_o2nofp.cx10b_fpw0_wallz4_c8r32
l.i2
- l.i2: continue load after secondary indexes created with 5 inserts per transaction
- Legend for results is here.
- Each entry lists the percentage of responses that fit in that bucket (slower than max time for previous bucket, faster than min time for next bucket).
Insert response time histogram
256us	1ms	4ms	16ms	64ms	256ms	1s	4s	16s	gt	max	tag
49.005	50.994	0.001	0.000	nonzero	0.000	0.000	0.000	0.000	0.000	0.018	pg182_o2nofp.cx10b_c8r32
51.520	48.479	0.001	nonzero	0.000	0.000	0.000	0.000	0.000	0.000	0.005	pg182_o2nofp.cx10b_fpw0_c8r32
49.648	50.350	0.002	0.000	nonzero	0.000	0.000	0.000	0.000	0.000	0.033	pg182_o2nofp.cx10b_wallz4_c8r32
49.760	50.239	nonzero	nonzero	nonzero	0.000	0.000	0.000	0.000	0.000	0.020	pg182_o2nofp.cx10b_fpw0_wallz4_c8r32
Delete response time histogram
256us	1ms	4ms	16ms	64ms	256ms	1s	4s	16s	gt	max	tag
4.336	34.646	59.276	1.743	nonzero	0.000	0.000	0.000	0.000	0.000	0.018	pg182_o2nofp.cx10b_c8r32
4.162	23.979	71.833	0.026	0.000	0.000	0.000	0.000	0.000	0.000	0.009	pg182_o2nofp.cx10b_fpw0_c8r32
4.480	34.135	58.203	3.182	nonzero	0.000	0.000	0.000	0.000	0.000	0.021	pg182_o2nofp.cx10b_wallz4_c8r32
4.165	28.678	67.129	0.027	nonzero	0.000	0.000	0.000	0.000	0.000	0.020	pg182_o2nofp.cx10b_fpw0_wallz4_c8r32
qr100.L1
- qr100.L1: range queries with 100 insert/s per client
- Legend for results is here.
- Each entry lists the percentage of responses that fit in that bucket (slower than max time for previous bucket, faster than min time for next bucket).
Query response time histogram
256us	1ms	4ms	16ms	64ms	256ms	1s	4s	16s	gt	max	tag
99.993	0.007	0.000	0.000	0.000	0.000	0.000	0.000	0.000	0.000	0.001	pg182_o2nofp.cx10b_c8r32
99.993	0.007	0.000	0.000	0.000	0.000	0.000	0.000	0.000	0.000	0.001	pg182_o2nofp.cx10b_fpw0_c8r32
99.993	0.007	0.000	0.000	0.000	0.000	0.000	0.000	0.000	0.000	0.001	pg182_o2nofp.cx10b_wallz4_c8r32
99.993	0.007	0.000	0.000	0.000	0.000	0.000	0.000	0.000	0.000	0.001	pg182_o2nofp.cx10b_fpw0_wallz4_c8r32
Insert response time histogram
256us	1ms	4ms	16ms	64ms	256ms	1s	4s	16s	gt	max	tag
0.000	24.889	75.083	0.028	0.000	0.000	0.000	0.000	0.000	0.000	0.005	pg182_o2nofp.cx10b_c8r32
0.000	40.528	59.444	0.028	0.000	0.000	0.000	0.000	0.000	0.000	0.005	pg182_o2nofp.cx10b_fpw0_c8r32
0.000	0.000	99.944	0.056	0.000	0.000	0.000	0.000	0.000	0.000	0.006	pg182_o2nofp.cx10b_wallz4_c8r32
0.000	41.000	58.972	0.028	0.000	0.000	0.000	0.000	0.000	0.000	0.004	pg182_o2nofp.cx10b_fpw0_wallz4_c8r32
Delete response time histogram
256us	1ms	4ms	16ms	64ms	256ms	1s	4s	16s	gt	max	tag
0.000	62.444	37.556	0.000	0.000	0.000	0.000	0.000	0.000	0.000	0.002	pg182_o2nofp.cx10b_c8r32
0.000	63.778	36.222	0.000	0.000	0.000	0.000	0.000	0.000	0.000	0.002	pg182_o2nofp.cx10b_fpw0_c8r32
0.000	64.306	35.694	0.000	0.000	0.000	0.000	0.000	0.000	0.000	0.002	pg182_o2nofp.cx10b_wallz4_c8r32
0.000	63.917	36.083	0.000	0.000	0.000	0.000	0.000	0.000	0.000	0.002	pg182_o2nofp.cx10b_fpw0_wallz4_c8r32
qp100.L2
- qp100.L2: point queries with 100 insert/s per client
- Legend for results is here.
- Each entry lists the percentage of responses that fit in that bucket (slower than max time for previous bucket, faster than min time for next bucket).
Query response time histogram
256us	1ms	4ms	16ms	64ms	256ms	1s	4s	16s	gt	max	tag
99.982	0.018	nonzero	0.000	0.000	0.000	0.000	0.000	0.000	0.000	0.001	pg182_o2nofp.cx10b_c8r32
99.983	0.017	0.000	0.000	0.000	0.000	0.000	0.000	0.000	0.000	0.001	pg182_o2nofp.cx10b_fpw0_c8r32
99.983	0.017	0.000	0.000	0.000	0.000	0.000	0.000	0.000	0.000	0.001	pg182_o2nofp.cx10b_wallz4_c8r32
99.984	0.016	nonzero	0.000	0.000	0.000	0.000	0.000	0.000	0.000	0.001	pg182_o2nofp.cx10b_fpw0_wallz4_c8r32
Insert response time histogram
256us	1ms	4ms	16ms	64ms	256ms	1s	4s	16s	gt	max	tag
0.000	3.639	96.333	0.028	0.000	0.000	0.000	0.000	0.000	0.000	0.005	pg182_o2nofp.cx10b_c8r32
0.000	18.222	81.750	0.028	0.000	0.000	0.000	0.000	0.000	0.000	0.004	pg182_o2nofp.cx10b_fpw0_c8r32
0.000	0.000	99.944	0.056	0.000	0.000	0.000	0.000	0.000	0.000	0.005	pg182_o2nofp.cx10b_wallz4_c8r32
0.000	18.111	81.861	0.028	0.000	0.000	0.000	0.000	0.000	0.000	0.004	pg182_o2nofp.cx10b_fpw0_wallz4_c8r32
Delete response time histogram
256us	1ms	4ms	16ms	64ms	256ms	1s	4s	16s	gt	max	tag
0.000	15.167	84.833	0.000	0.000	0.000	0.000	0.000	0.000	0.000	0.004	pg182_o2nofp.cx10b_c8r32
0.000	21.333	78.667	0.000	0.000	0.000	0.000	0.000	0.000	0.000	0.004	pg182_o2nofp.cx10b_fpw0_c8r32
0.000	4.833	95.139	0.028	0.000	0.000	0.000	0.000	0.000	0.000	0.004	pg182_o2nofp.cx10b_wallz4_c8r32
0.000	13.194	86.806	0.000	0.000	0.000	0.000	0.000	0.000	0.000	0.004	pg182_o2nofp.cx10b_fpw0_wallz4_c8r32
qr500.L3
- qr500.L3: range queries with 500 insert/s per client
- Legend for results is here.
- Each entry lists the percentage of responses that fit in that bucket (slower than max time for previous bucket, faster than min time for next bucket).
Query response time histogram
256us	1ms	4ms	16ms	64ms	256ms	1s	4s	16s	gt	max	tag
99.989	0.011	nonzero	0.000	0.000	0.000	0.000	0.000	0.000	0.000	0.002	pg182_o2nofp.cx10b_c8r32
99.990	0.010	nonzero	0.000	0.000	0.000	0.000	0.000	0.000	0.000	0.001	pg182_o2nofp.cx10b_fpw0_c8r32
99.990	0.010	nonzero	0.000	0.000	0.000	0.000	0.000	0.000	0.000	0.002	pg182_o2nofp.cx10b_wallz4_c8r32
99.989	0.011	nonzero	0.000	0.000	0.000	0.000	0.000	0.000	0.000	0.002	pg182_o2nofp.cx10b_fpw0_wallz4_c8r32
Insert response time histogram
256us	1ms	4ms	16ms	64ms	256ms	1s	4s	16s	gt	max	tag
0.000	76.006	23.989	0.006	0.000	0.000	0.000	0.000	0.000	0.000	0.004	pg182_o2nofp.cx10b_c8r32
0.000	84.122	15.872	0.006	0.000	0.000	0.000	0.000	0.000	0.000	0.004	pg182_o2nofp.cx10b_fpw0_c8r32
0.000	48.717	51.272	0.011	0.000	0.000	0.000	0.000	0.000	0.000	0.005	pg182_o2nofp.cx10b_wallz4_c8r32
0.000	83.122	16.867	0.011	0.000	0.000	0.000	0.000	0.000	0.000	0.005	pg182_o2nofp.cx10b_fpw0_wallz4_c8r32
Delete response time histogram
256us	1ms	4ms	16ms	64ms	256ms	1s	4s	16s	gt	max	tag
0.000	4.344	93.822	1.833	0.000	0.000	0.000	0.000	0.000	0.000	0.007	pg182_o2nofp.cx10b_c8r32
0.000	6.500	91.728	1.772	0.000	0.000	0.000	0.000	0.000	0.000	0.005	pg182_o2nofp.cx10b_fpw0_c8r32
0.000	1.689	96.483	1.828	0.000	0.000	0.000	0.000	0.000	0.000	0.005	pg182_o2nofp.cx10b_wallz4_c8r32
0.000	2.550	95.611	1.839	0.000	0.000	0.000	0.000	0.000	0.000	0.005	pg182_o2nofp.cx10b_fpw0_wallz4_c8r32
qp500.L4
- qp500.L4: point queries with 500 insert/s per client
- Legend for results is here.
- Each entry lists the percentage of responses that fit in that bucket (slower than max time for previous bucket, faster than min time for next bucket).
Query response time histogram
256us	1ms	4ms	16ms	64ms	256ms	1s	4s	16s	gt	max	tag
99.975	0.025	nonzero	0.000	0.000	0.000	0.000	0.000	0.000	0.000	0.002	pg182_o2nofp.cx10b_c8r32
99.976	0.024	nonzero	0.000	0.000	0.000	0.000	0.000	0.000	0.000	0.003	pg182_o2nofp.cx10b_fpw0_c8r32
99.977	0.023	nonzero	0.000	0.000	0.000	0.000	0.000	0.000	0.000	0.003	pg182_o2nofp.cx10b_wallz4_c8r32
99.975	0.025	nonzero	0.000	0.000	0.000	0.000	0.000	0.000	0.000	0.001	pg182_o2nofp.cx10b_fpw0_wallz4_c8r32
Insert response time histogram
256us	1ms	4ms	16ms	64ms	256ms	1s	4s	16s	gt	max	tag
0.000	76.472	23.494	0.011	0.022	0.000	0.000	0.000	0.000	0.000	0.024	pg182_o2nofp.cx10b_c8r32
0.000	78.489	21.506	0.006	0.000	0.000	0.000	0.000	0.000	0.000	0.004	pg182_o2nofp.cx10b_fpw0_c8r32
0.000	64.772	35.206	0.022	0.000	0.000	0.000	0.000	0.000	0.000	0.015	pg182_o2nofp.cx10b_wallz4_c8r32
0.000	78.606	21.389	0.006	0.000	0.000	0.000	0.000	0.000	0.000	0.004	pg182_o2nofp.cx10b_fpw0_wallz4_c8r32
Delete response time histogram
256us	1ms	4ms	16ms	64ms	256ms	1s	4s	16s	gt	max	tag
0.239	25.539	72.528	1.678	0.017	0.000	0.000	0.000	0.000	0.000	0.018	pg182_o2nofp.cx10b_c8r32
0.244	29.039	67.906	2.811	0.000	0.000	0.000	0.000	0.000	0.000	0.011	pg182_o2nofp.cx10b_fpw0_c8r32
0.128	28.922	67.244	3.706	0.000	0.000	0.000	0.000	0.000	0.000	0.014	pg182_o2nofp.cx10b_wallz4_c8r32
0.300	31.489	65.589	2.622	0.000	0.000	0.000	0.000	0.000	0.000	0.011	pg182_o2nofp.cx10b_fpw0_wallz4_c8r32
qr1000.L5
- qr1000.L5: range queries with 1000 insert/s per client
- Legend for results is here.
- Each entry lists the percentage of responses that fit in that bucket (slower than max time for previous bucket, faster than min time for next bucket).
Query response time histogram
256us	1ms	4ms	16ms	64ms	256ms	1s	4s	16s	gt	max	tag
99.988	0.012	nonzero	nonzero	0.000	0.000	0.000	0.000	0.000	0.000	0.012	pg182_o2nofp.cx10b_c8r32
99.988	0.012	nonzero	nonzero	0.000	0.000	0.000	0.000	0.000	0.000	0.004	pg182_o2nofp.cx10b_fpw0_c8r32
99.988	0.012	nonzero	nonzero	0.000	0.000	0.000	0.000	0.000	0.000	0.004	pg182_o2nofp.cx10b_wallz4_c8r32
99.988	0.012	nonzero	nonzero	0.000	0.000	0.000	0.000	0.000	0.000	0.004	pg182_o2nofp.cx10b_fpw0_wallz4_c8r32
Insert response time histogram
256us	1ms	4ms	16ms	64ms	256ms	1s	4s	16s	gt	max	tag
0.000	73.722	26.269	0.006	0.003	0.000	0.000	0.000	0.000	0.000	0.018	pg182_o2nofp.cx10b_c8r32
0.000	75.519	24.478	0.003	0.000	0.000	0.000	0.000	0.000	0.000	0.005	pg182_o2nofp.cx10b_fpw0_c8r32
0.000	63.003	36.994	0.003	0.000	0.000	0.000	0.000	0.000	0.000	0.005	pg182_o2nofp.cx10b_wallz4_c8r32
0.000	77.894	22.103	0.003	0.000	0.000	0.000	0.000	0.000	0.000	0.004	pg182_o2nofp.cx10b_fpw0_wallz4_c8r32
Delete response time histogram
256us	1ms	4ms	16ms	64ms	256ms	1s	4s	16s	gt	max	tag
0.078	13.069	85.500	1.350	0.003	0.000	0.000	0.000	0.000	0.000	0.017	pg182_o2nofp.cx10b_c8r32
0.069	13.714	84.861	1.356	0.000	0.000	0.000	0.000	0.000	0.000	0.007	pg182_o2nofp.cx10b_fpw0_c8r32
0.097	16.839	81.733	1.331	0.000	0.000	0.000	0.000	0.000	0.000	0.007	pg182_o2nofp.cx10b_wallz4_c8r32
0.125	20.111	78.300	1.464	0.000	0.000	0.000	0.000	0.000	0.000	0.007	pg182_o2nofp.cx10b_fpw0_wallz4_c8r32
qp1000.L6
- qp1000.L6: point queries with 1000 insert/s per client
- Legend for results is here.
- Each entry lists the percentage of responses that fit in that bucket (slower than max time for previous bucket, faster than min time for next bucket).
Query response time histogram
256us	1ms	4ms	16ms	64ms	256ms	1s	4s	16s	gt	max	tag
99.973	0.027	nonzero	0.000	0.000	0.000	0.000	0.000	0.000	0.000	0.001	pg182_o2nofp.cx10b_c8r32
99.973	0.027	nonzero	0.000	0.000	0.000	0.000	0.000	0.000	0.000	0.001	pg182_o2nofp.cx10b_fpw0_c8r32
99.973	0.027	nonzero	0.000	0.000	0.000	0.000	0.000	0.000	0.000	0.003	pg182_o2nofp.cx10b_wallz4_c8r32
99.972	0.028	nonzero	0.000	0.000	0.000	0.000	0.000	0.000	0.000	0.001	pg182_o2nofp.cx10b_fpw0_wallz4_c8r32
Insert response time histogram
256us	1ms	4ms	16ms	64ms	256ms	1s	4s	16s	gt	max	tag
0.000	78.567	21.425	0.006	0.003	0.000	0.000	0.000	0.000	0.000	0.018	pg182_o2nofp.cx10b_c8r32
0.000	72.706	27.292	0.003	0.000	0.000	0.000	0.000	0.000	0.000	0.004	pg182_o2nofp.cx10b_fpw0_c8r32
0.000	67.547	32.431	0.019	0.003	0.000	0.000	0.000	0.000	0.000	0.023	pg182_o2nofp.cx10b_wallz4_c8r32
0.000	72.811	27.186	0.003	0.000	0.000	0.000	0.000	0.000	0.000	0.005	pg182_o2nofp.cx10b_fpw0_wallz4_c8r32
Delete response time histogram
256us	1ms	4ms	16ms	64ms	256ms	1s	4s	16s	gt	max	tag
0.233	34.856	63.769	1.139	0.003	0.000	0.000	0.000	0.000	0.000	0.016	pg182_o2nofp.cx10b_c8r32
0.231	17.525	79.481	2.764	0.000	0.000	0.000	0.000	0.000	0.000	0.010	pg182_o2nofp.cx10b_fpw0_c8r32
0.108	17.542	79.933	2.414	0.003	0.000	0.000	0.000	0.000	0.000	0.017	pg182_o2nofp.cx10b_wallz4_c8r32
0.300	17.475	79.692	2.533	0.000	0.000	0.000	0.000	0.000	0.000	0.010	pg182_o2nofp.cx10b_fpw0_wallz4_c8r32