Introduction
This is a report for the insert benchmark with 40M docs and 4 client(s). It is generated by scripts (bash, awk, sed) and Tufte might not be impressed. An overview of the insert benchmark is here and a short update is here. Below, by DBMS, I mean DBMS+version.config. An example is my8020.c10b40 where my means MySQL, 8020 is version 8.0.20 and c10b40 is the name for the configuration file.
The test server has 8 AMD cores, 32G RAM and an NVMe device for the database. The benchmark was run with 4 clients and there were 1 or 3 connections per client (1 for queries or inserts without rate limits, 1+1 for rate limited inserts+deletes). It uses 4 tables with a table per client. It loads 10M rows per table without secondary indexes, creates 3 secondary indexes per table, then inserts 16m+4m rows per table with a delete per insert to avoid growing the table. It then does 6 read+write tests for 1800s each that do queries as fast as possible with 100,100,500,500,1000,1000 inserts/s and the same for deletes/s per client concurrent with the queries. The database is cached by Postgres. Clients and the DBMS share one server.
The tested DBMS are:
- pg1222_o2nofp.cx10a_c8r32 - Postgres 12.22 with my standard config (x10a)
- pg1323_o2nofp.cx10a_c8r32 - Postgres 13.23 with my standard config (x10a)
- pg1422_o2nofp.cx10a_c8r32 - Postgres 14.22 with my standard config (x10a)
- pg1517_o2nofp.cx10a_c8r32 - Postgres 15.17 with my standard config (x10a)
- pg1613_o2nofp.cx10a_c8r32 - Postgres 16.13 with my standard config (x10a)
- pg179_o2nofp.cx10a_c8r32 - Postgres 17.9 with my standard config (x10a)
- pg183_o2nofp.cx10b_c8r32 - Postgres 18.3 with my standard config (x10b)
Contents
- Summary
- l.i0: load without secondary indexes
- l.x: create secondary indexes
- l.i1: continue load after secondary indexes created with 50 inserts per transaction
- l.i2: continue load after secondary indexes created with 5 inserts per transaction
- qr100.L1: range queries with 100 insert/s per client
- qp100.L2: point queries with 100 insert/s per client
- qr500.L3: range queries with 500 insert/s per client
- qp500.L4: point queries with 500 insert/s per client
- qr1000.L5: range queries with 1000 insert/s per client
- qp1000.L6: point queries with 1000 insert/s per client
Summary
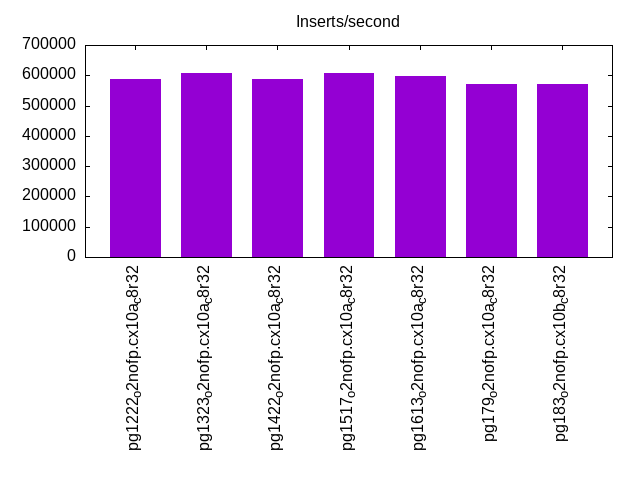
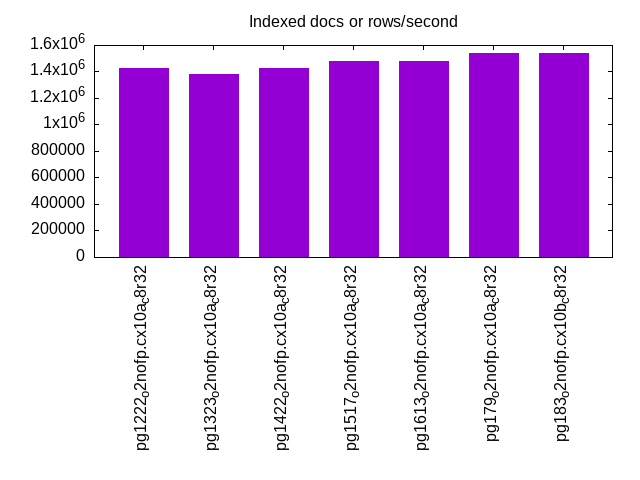
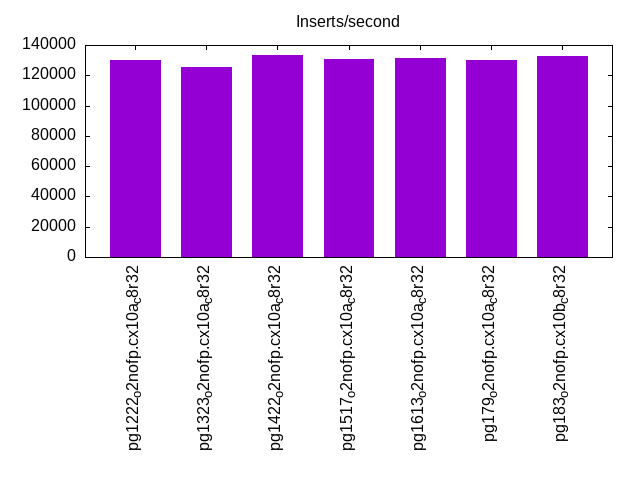
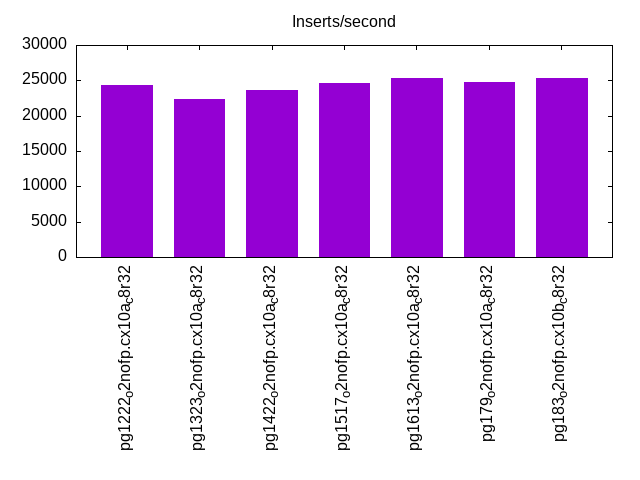
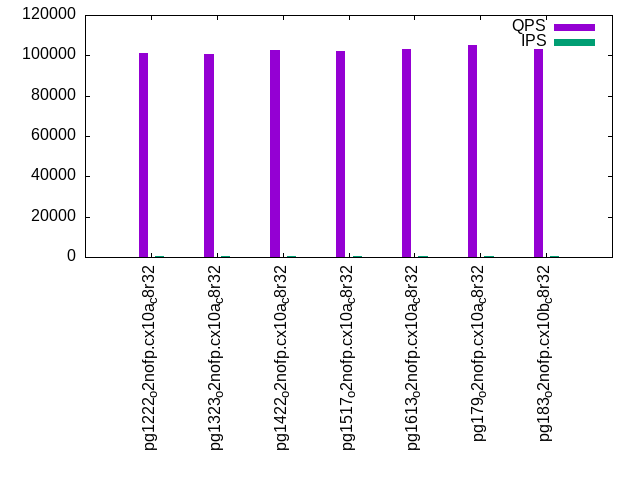
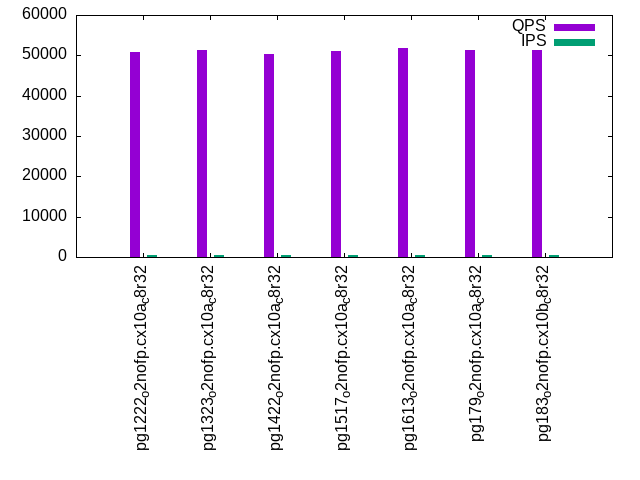
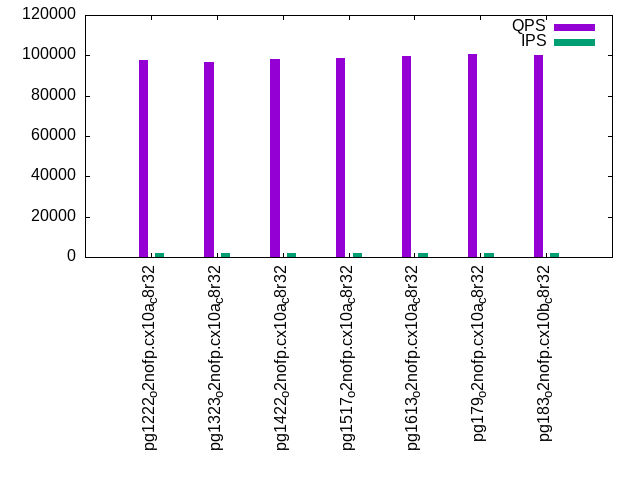
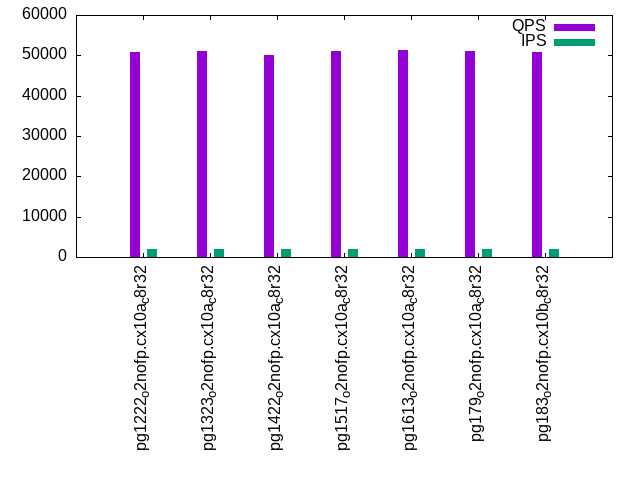
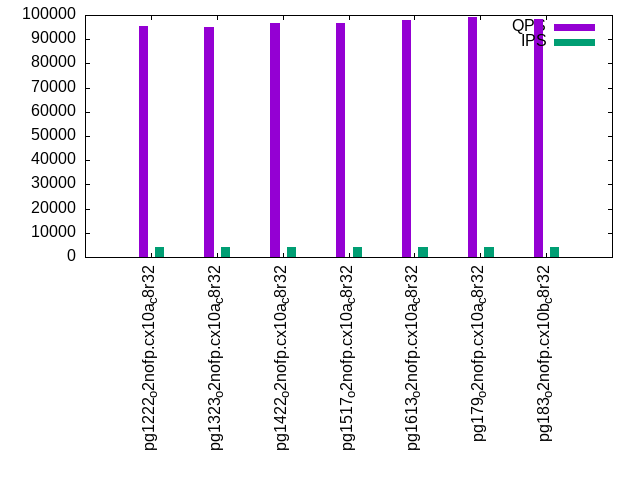
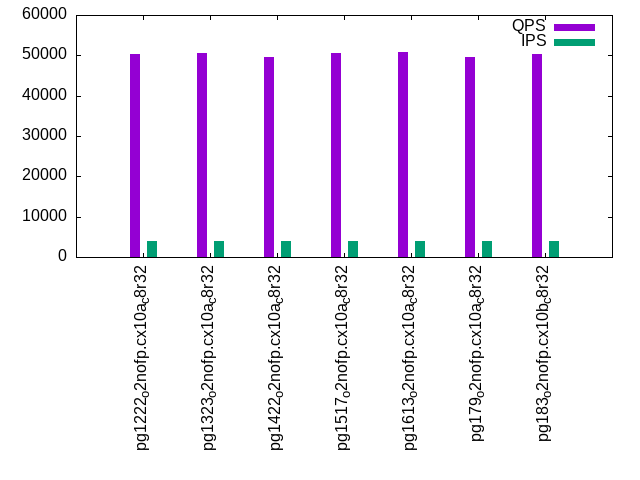
The numbers are inserts/s for l.i0, l.i1 and l.i2, indexed docs (or rows) /s for l.x and queries/s for qr100, qp100 thru qr1000, qp1000" The values are the average rate over the entire test for inserts (IPS) and queries (QPS). The range of values for IPS and QPS is split into 3 parts: bottom 25%, middle 50%, top 25%. Values in the bottom 25% have a red background, values in the top 25% have a green background and values in the middle have no color. A gray background is used for values that can be ignored because the DBMS did not sustain the target insert rate. Red backgrounds are not used when the minimum value is within 80% of the max value.
| dbms | l.i0 | l.x | l.i1 | l.i2 | qr100 | qp100 | qr500 | qp500 | qr1000 | qp1000 |
|---|---|---|---|---|---|---|---|---|---|---|
| pg1222_o2nofp.cx10a_c8r32 | 588235 | 1428575 | 130081 | 24390 | 101056 | 50947 | 97696 | 50840 | 95571 | 50435 |
| pg1323_o2nofp.cx10a_c8r32 | 606061 | 1379314 | 125245 | 22346 | 100737 | 51234 | 96584 | 51176 | 95182 | 50667 |
| pg1422_o2nofp.cx10a_c8r32 | 588235 | 1428575 | 133612 | 23564 | 102514 | 50424 | 98269 | 50143 | 96532 | 49590 |
| pg1517_o2nofp.cx10a_c8r32 | 606061 | 1481485 | 130612 | 24578 | 102359 | 51137 | 98448 | 50958 | 96837 | 50636 |
| pg1613_o2nofp.cx10a_c8r32 | 597015 | 1481485 | 131687 | 25276 | 103167 | 51798 | 99476 | 51290 | 97852 | 50950 |
| pg179_o2nofp.cx10a_c8r32 | 571428 | 1538465 | 129817 | 24730 | 105325 | 51365 | 100836 | 50993 | 99068 | 49554 |
| pg183_o2nofp.cx10b_c8r32 | 571428 | 1538465 | 132780 | 25276 | 103250 | 51440 | 99923 | 50920 | 98416 | 50412 |
This table has relative throughput, throughput for the DBMS relative to the DBMS in the first line, using the absolute throughput from the previous table. Values less than 0.95 have a yellow background. Values greater than 1.05 have a blue background.
| dbms | l.i0 | l.x | l.i1 | l.i2 | qr100 | qp100 | qr500 | qp500 | qr1000 | qp1000 |
|---|---|---|---|---|---|---|---|---|---|---|
| pg1222_o2nofp.cx10a_c8r32 | 1.00 | 1.00 | 1.00 | 1.00 | 1.00 | 1.00 | 1.00 | 1.00 | 1.00 | 1.00 |
| pg1323_o2nofp.cx10a_c8r32 | 1.03 | 0.97 | 0.96 | 0.92 | 1.00 | 1.01 | 0.99 | 1.01 | 1.00 | 1.00 |
| pg1422_o2nofp.cx10a_c8r32 | 1.00 | 1.00 | 1.03 | 0.97 | 1.01 | 0.99 | 1.01 | 0.99 | 1.01 | 0.98 |
| pg1517_o2nofp.cx10a_c8r32 | 1.03 | 1.04 | 1.00 | 1.01 | 1.01 | 1.00 | 1.01 | 1.00 | 1.01 | 1.00 |
| pg1613_o2nofp.cx10a_c8r32 | 1.01 | 1.04 | 1.01 | 1.04 | 1.02 | 1.02 | 1.02 | 1.01 | 1.02 | 1.01 |
| pg179_o2nofp.cx10a_c8r32 | 0.97 | 1.08 | 1.00 | 1.01 | 1.04 | 1.01 | 1.03 | 1.00 | 1.04 | 0.98 |
| pg183_o2nofp.cx10b_c8r32 | 0.97 | 1.08 | 1.02 | 1.04 | 1.02 | 1.01 | 1.02 | 1.00 | 1.03 | 1.00 |
This lists the average rate of inserts/s for the tests that do inserts concurrent with queries. For such tests the query rate is listed in the table above. The read+write tests are setup so that the insert rate should match the target rate every second. Cells that are not at least 95% of the target have a red background to indicate a failure to satisfy the target.
| dbms | qr100.L1 | qp100.L2 | qr500.L3 | qp500.L4 | qr1000.L5 | qp1000.L6 |
|---|---|---|---|---|---|---|
| pg1222_o2nofp.cx10a_c8r32 | 399 | 399 | 1997 | 1997 | 3991 | 3993 |
| pg1323_o2nofp.cx10a_c8r32 | 399 | 399 | 1996 | 1997 | 3993 | 3993 |
| pg1422_o2nofp.cx10a_c8r32 | 399 | 399 | 1996 | 1997 | 3993 | 3991 |
| pg1517_o2nofp.cx10a_c8r32 | 399 | 399 | 1997 | 1996 | 3993 | 3993 |
| pg1613_o2nofp.cx10a_c8r32 | 399 | 399 | 1997 | 1996 | 3993 | 3993 |
| pg179_o2nofp.cx10a_c8r32 | 399 | 399 | 1996 | 1997 | 3993 | 3993 |
| pg183_o2nofp.cx10b_c8r32 | 399 | 399 | 1997 | 1996 | 3993 | 3993 |
| target | 400 | 400 | 2000 | 2000 | 4000 | 4000 |
l.i0
l.i0: load without secondary indexes. Graphs for performance per 1-second interval are here.
Average throughput:
Insert response time histogram: each cell has the percentage of responses that take <= the time in the header and max is the max response time in seconds. For the max column values in the top 25% of the range have a red background and in the bottom 25% of the range have a green background. The red background is not used when the min value is within 80% of the max value.
| dbms | 256us | 1ms | 4ms | 16ms | 64ms | 256ms | 1s | 4s | 16s | gt | max |
|---|---|---|---|---|---|---|---|---|---|---|---|
| pg1222_o2nofp.cx10a_c8r32 | 99.431 | 0.569 | 0.001 | 0.005 | |||||||
| pg1323_o2nofp.cx10a_c8r32 | 99.462 | 0.536 | 0.001 | 0.005 | |||||||
| pg1422_o2nofp.cx10a_c8r32 | 99.459 | 0.541 | 0.004 | ||||||||
| pg1517_o2nofp.cx10a_c8r32 | 99.480 | 0.520 | 0.001 | 0.005 | |||||||
| pg1613_o2nofp.cx10a_c8r32 | 99.444 | 0.556 | 0.001 | 0.004 | |||||||
| pg179_o2nofp.cx10a_c8r32 | 97.680 | 2.317 | 0.003 | 0.005 | |||||||
| pg183_o2nofp.cx10b_c8r32 | 97.688 | 2.308 | 0.003 | 0.010 |
Performance metrics for the DBMS listed above. Some are normalized by throughput, others are not. Legend for results is here.
ips	qps	rps	rmbps	wps	wmbps	rpq	rkbpq	wpi	wkbpi	csps	cpups	cspq	cpupq	dbgb1	dbgb2	rss	maxop	p50	p99	tag
588235	0	1	0.0	2116.0	242.0	0.000	0.000	0.004	0.421	52269	65.1	0.089	9	3.8	10.4	2.8	0.005	177882	172983	pg1222_o2nofp.cx10a_c8r32
606061	0	1	0.0	2159.1	246.3	0.000	0.000	0.004	0.416	52561	65.1	0.087	9	3.8	10.4	0.4	0.005	181782	175206	pg1323_o2nofp.cx10a_c8r32
588235	0	1	0.0	2086.3	237.5	0.000	0.000	0.004	0.413	51938	65.2	0.088	9	3.8	10.4	0.4	0.004	177378	170883	pg1422_o2nofp.cx10a_c8r32
606061	0	1	0.0	2116.8	241.6	0.000	0.000	0.003	0.408	52079	65.1	0.086	9	3.8	10.4	0.4	0.005	182873	176842	pg1517_o2nofp.cx10a_c8r32
597015	0	1	0.0	2109.8	240.9	0.000	0.000	0.004	0.413	51535	65.0	0.086	9	3.8	10.4	0.3	0.004	181078	175990	pg1613_o2nofp.cx10a_c8r32
571428	0	1	0.0	2008.5	228.9	0.000	0.000	0.004	0.410	51944	59.1	0.091	8	3.8	10.4	0.3	0.005	170780	153185	pg179_o2nofp.cx10a_c8r32
571428	0	1	0.0	1998.2	227.7	0.000	0.000	0.003	0.408	51845	59.4	0.091	8	3.8	10.4	0.3	0.010	170470	149485	pg183_o2nofp.cx10b_c8r32
Average values from iostat.
r/s	rkB/s	rrqm/s	%rrqm	r_await	rareq-s	w/s	wkB/s	wrqm/s	%wrqm	w_await	wareq-s	d/s	dkB/s	drqm/s	%drqm	d_await	dareq-s	f/s	f_await	aqu-sz	%util
1.033	4.133	0.000	0.000	0.165	3.333	2244.0	263003	179.2	7.913	0.500	116.5	3.400	27.27	0.000	0.000	1.123	6.507	112.3	1.650	1.472	32.33		pg1222_o2nofp.cx10a_c8r32
0.950	3.800	0.000	0.000	0.187	4.000	2289.9	267711	165.1	7.182	0.434	116.2	3.517	75.40	0.000	0.000	0.698	12.94	116.0	1.158	1.223	27.06		pg1323_o2nofp.cx10a_c8r32
0.700	2.800	0.000	0.000	0.101	3.333	2211.6	257996	140.7	6.482	0.427	115.9	3.767	26.53	0.000	0.000	0.660	5.841	116.4	1.240	1.175	27.96		pg1422_o2nofp.cx10a_c8r32
1.183	4.733	0.000	0.000	0.104	4.000	2246.0	262707	177.3	7.647	0.438	116.4	0.500	126.9	0.000	0.000	0.443	62.19	116.2	1.412	1.192	29.49		pg1517_o2nofp.cx10a_c8r32
0.967	3.867	0.000	0.000	0.152	3.667	2238.6	261934	178.1	7.710	0.442	116.4	0.583	26.67	0.000	0.000	0.452	15.41	114.9	1.572	1.250	31.70		pg1613_o2nofp.cx10a_c8r32
1.000	4.000	0.000	0.000	0.113	3.692	2117.0	247264	146.5	6.860	0.496	116.1	0.538	9.600	0.000	0.000	0.632	6.015	109.5	1.294	1.314	26.59		pg179_o2nofp.cx10a_c8r32
0.923	3.692	0.000	0.000	0.102	4.000	2106.2	245937	129.3	6.075	0.452	116.3	0.492	7.508	0.000	0.000	0.823	10.46	108.4	1.600	1.142	29.73		pg183_o2nofp.cx10b_c8r32
l.x
l.x: create secondary indexes.
Average throughput:
Performance metrics for the DBMS listed above. Some are normalized by throughput, others are not. Legend for results is here.
ips	qps	rps	rmbps	wps	wmbps	rpq	rkbpq	wpi	wkbpi	csps	cpups	cspq	cpupq	dbgb1	dbgb2	rss	maxop	p50	p99	tag
1428575	0	2	0.0	3271.4	400.5	0.000	0.000	0.002	0.287	7992	34.2	0.006	2	7.7	17.7	0.0	0.002	NA	NA	pg1222_o2nofp.cx10a_c8r32
1379314	0	1	0.0	3431.8	420.5	0.000	0.000	0.002	0.312	7327	34.5	0.005	2	7.7	17.8	0.0	0.002	NA	NA	pg1323_o2nofp.cx10a_c8r32
1428575	0	1	0.0	3153.0	386.2	0.000	0.000	0.002	0.277	7554	35.3	0.005	2	7.7	17.8	0.0	0.002	NA	NA	pg1422_o2nofp.cx10a_c8r32
1481485	0	2	0.0	3369.8	412.6	0.000	0.000	0.002	0.285	8289	33.7	0.006	2	7.7	17.8	0.0	0.002	NA	NA	pg1517_o2nofp.cx10a_c8r32
1481485	0	2	0.0	3409.4	417.3	0.000	0.000	0.002	0.288	8396	33.8	0.006	2	7.7	17.8	0.0	0.002	NA	NA	pg1613_o2nofp.cx10a_c8r32
1538465	0	2	0.0	4027.6	493.8	0.000	0.000	0.003	0.329	7877	33.7	0.005	2	7.7	17.7	3.1	0.002	NA	NA	pg179_o2nofp.cx10a_c8r32
1538465	0	2	0.0	4121.4	505.2	0.000	0.000	0.003	0.336	8006	34.0	0.005	2	7.7	17.7	0.0	0.002	NA	NA	pg183_o2nofp.cx10b_c8r32
Average values from iostat.
r/s	rkB/s	rrqm/s	%rrqm	r_await	rareq-s	w/s	wkB/s	wrqm/s	%wrqm	w_await	wareq-s	d/s	dkB/s	drqm/s	%drqm	d_await	dareq-s	f/s	f_await	aqu-sz	%util
1.850	7.400	0.000	0.000	0.075	4.000	4087.7	512616	143.6	3.478	0.833	125.5	3.800	67.80	0.000	0.000	1.077	17.81	43.15	1.238	3.448	24.25		pg1222_o2nofp.cx10a_c8r32
1.450	5.800	0.000	0.000	0.218	4.000	4286.2	538197	141.0	3.292	0.965	125.7	7.750	53414.2	0.000	0.000	1.133	5340.9	39.80	1.443	4.430	24.38		pg1323_o2nofp.cx10a_c8r32
1.300	5.200	0.000	0.000	2.090	4.000	3930.2	493366	139.8	3.475	1.100	125.6	5.200	51.60	0.000	0.000	0.777	10.37	40.00	1.000	4.237	21.23		pg1422_o2nofp.cx10a_c8r32
2.900	11.60	0.000	0.000	0.315	4.000	4211.2	528059	147.6	3.428	0.905	125.4	2.200	5822.4	0.000	0.000	1.050	2645.2	44.10	1.265	3.800	24.64		pg1517_o2nofp.cx10a_c8r32
2.050	8.200	0.000	0.000	0.110	4.000	4075.9	511645	144.2	3.430	0.908	125.5	2.350	9874.4	0.000	0.000	0.580	2608.2	44.40	1.010	3.850	22.73		pg1613_o2nofp.cx10a_c8r32
2.850	11.40	0.000	0.000	0.265	4.000	5024.1	631250	155.2	3.115	1.067	125.6	4.950	62685.0	0.000	0.000	2.442	9978.5	45.20	1.600	5.695	28.13		pg179_o2nofp.cx10a_c8r32
1.900	7.600	0.000	0.000	0.150	4.000	4948.4	621889	158.7	3.268	0.955	125.5	4.350	68118.0	0.000	0.000	1.280	8583.0	46.35	1.067	4.933	24.94		pg183_o2nofp.cx10b_c8r32
l.i1
l.i1: continue load after secondary indexes created with 50 inserts per transaction. Graphs for performance per 1-second interval are here.
Average throughput:
Insert response time histogram: each cell has the percentage of responses that take <= the time in the header and max is the max response time in seconds. For the max column values in the top 25% of the range have a red background and in the bottom 25% of the range have a green background. The red background is not used when the min value is within 80% of the max value.
| dbms | 256us | 1ms | 4ms | 16ms | 64ms | 256ms | 1s | 4s | 16s | gt | max |
|---|---|---|---|---|---|---|---|---|---|---|---|
| pg1222_o2nofp.cx10a_c8r32 | 55.277 | 44.478 | 0.213 | 0.032 | 0.050 | ||||||
| pg1323_o2nofp.cx10a_c8r32 | 59.419 | 40.340 | 0.206 | 0.035 | 0.059 | ||||||
| pg1422_o2nofp.cx10a_c8r32 | 67.937 | 31.899 | 0.124 | 0.040 | nonzero | 0.080 | |||||
| pg1517_o2nofp.cx10a_c8r32 | 60.616 | 39.203 | 0.160 | 0.021 | 0.058 | ||||||
| pg1613_o2nofp.cx10a_c8r32 | 60.230 | 39.572 | 0.163 | 0.035 | 0.063 | ||||||
| pg179_o2nofp.cx10a_c8r32 | 70.562 | 29.305 | 0.089 | 0.043 | nonzero | 0.092 | |||||
| pg183_o2nofp.cx10b_c8r32 | 67.789 | 32.097 | 0.078 | 0.037 | 0.052 |
Delete response time histogram: each cell has the percentage of responses that take <= the time in the header and max is the max response time in seconds. For the max column values in the top 25% of the range have a red background and in the bottom 25% of the range have a green background. The red background is not used when the min value is within 80% of the max value.
| dbms | 256us | 1ms | 4ms | 16ms | 64ms | 256ms | 1s | 4s | 16s | gt | max |
|---|---|---|---|---|---|---|---|---|---|---|---|
| pg1222_o2nofp.cx10a_c8r32 | 0.003 | 39.702 | 59.617 | 0.642 | 0.036 | 0.051 | |||||
| pg1323_o2nofp.cx10a_c8r32 | 0.002 | 38.214 | 60.562 | 1.183 | 0.038 | nonzero | 0.074 | ||||
| pg1422_o2nofp.cx10a_c8r32 | 0.002 | 42.284 | 57.334 | 0.340 | 0.041 | 0.049 | |||||
| pg1517_o2nofp.cx10a_c8r32 | 0.003 | 37.693 | 62.143 | 0.133 | 0.028 | 0.049 | |||||
| pg1613_o2nofp.cx10a_c8r32 | 0.002 | 39.668 | 60.003 | 0.286 | 0.041 | 0.055 | |||||
| pg179_o2nofp.cx10a_c8r32 | 0.012 | 39.235 | 60.568 | 0.141 | 0.045 | nonzero | 0.075 | ||||
| pg183_o2nofp.cx10b_c8r32 | 0.003 | 41.761 | 58.060 | 0.133 | 0.042 | 0.056 |
Performance metrics for the DBMS listed above. Some are normalized by throughput, others are not. Legend for results is here.
ips	qps	rps	rmbps	wps	wmbps	rpq	rkbpq	wpi	wkbpi	csps	cpups	cspq	cpupq	dbgb1	dbgb2	rss	maxop	p50	p99	tag
130081	0	0	0.0	1765.5	187.8	0.000	0.000	0.014	1.478	38340	88.1	0.295	54	11.3	51.3	7.9	0.050	31897	13389	pg1222_o2nofp.cx10a_c8r32
125245	0	0	0.0	1700.2	180.3	0.000	0.000	0.014	1.474	37935	86.3	0.303	55	11.3	51.4	6.2	0.059	30247	8647	pg1323_o2nofp.cx10a_c8r32
133612	0	1	0.0	1796.2	190.1	0.000	0.000	0.013	1.457	40151	85.6	0.301	51	10.9	50.9	8.8	0.080	31946	14345	pg1422_o2nofp.cx10a_c8r32
130612	0	1	0.0	1750.7	184.9	0.000	0.000	0.013	1.449	39819	84.3	0.305	52	10.9	50.9	6.3	0.058	30547	12798	pg1517_o2nofp.cx10a_c8r32
131687	0	0	0.0	1771.2	186.8	0.000	0.000	0.013	1.453	39708	85.1	0.302	52	10.9	50.9	6.8	0.063	30397	13949	pg1613_o2nofp.cx10a_c8r32
129817	0	0	0.0	1653.3	185.1	0.000	0.000	0.013	1.460	37275	82.1	0.287	51	10.8	50.8	2.0	0.092	29447	18548	pg179_o2nofp.cx10a_c8r32
132780	0	0	0.0	1752.1	192.7	0.000	0.000	0.013	1.486	37474	83.6	0.282	50	10.8	50.9	2.5	0.052	30847	14696	pg183_o2nofp.cx10b_c8r32
Average values from iostat.
r/s	rkB/s	rrqm/s	%rrqm	r_await	rareq-s	w/s	wkB/s	wrqm/s	%wrqm	w_await	wareq-s	d/s	dkB/s	drqm/s	%drqm	d_await	dareq-s	f/s	f_await	aqu-sz	%util
0.507	2.342	0.000	0.000	0.156	3.114	1772.4	192939	136.0	7.237	0.409	107.9	2.987	314.1	0.000	0.000	0.991	73.43	129.1	1.575	0.924	31.94		pg1222_o2nofp.cx10a_c8r32
0.451	2.431	0.000	0.000	0.125	2.970	1706.3	185234	110.3	6.058	0.398	107.6	2.982	114.4	0.000	0.000	0.958	17.40	125.2	1.528	0.866	29.99		pg1323_o2nofp.cx10a_c8r32
0.600	3.038	0.000	0.000	0.137	3.387	1804.0	195387	130.0	6.712	0.388	107.4	3.008	119.1	0.000	0.000	0.918	28.23	135.1	1.464	0.894	31.21		pg1422_o2nofp.cx10a_c8r32
0.559	2.235	0.000	0.000	0.144	3.093	1757.9	190007	108.0	5.703	0.395	107.4	0.124	298.8	0.000	0.000	0.076	152.6	134.4	1.505	0.893	31.14		pg1517_o2nofp.cx10a_c8r32
0.502	2.008	0.000	0.000	0.157	3.000	1778.3	192001	105.7	5.496	0.383	107.4	0.123	158.4	0.000	0.000	0.067	86.50	135.8	1.430	0.876	30.66		pg1613_o2nofp.cx10a_c8r32
0.460	1.839	0.000	0.000	0.099	3.052	1659.5	190255	100.6	5.915	0.377	113.4	0.105	210.9	0.000	0.000	0.079	205.3	96.56	1.478	0.780	25.23		pg179_o2nofp.cx10a_c8r32
0.415	1.659	0.000	0.000	0.150	2.821	1759.4	198142	104.4	5.654	0.397	111.3	0.145	421.2	0.000	0.000	0.149	816.8	113.8	1.428	0.859	27.63		pg183_o2nofp.cx10b_c8r32
l.i2
l.i2: continue load after secondary indexes created with 5 inserts per transaction. Graphs for performance per 1-second interval are here.
Average throughput:
Insert response time histogram: each cell has the percentage of responses that take <= the time in the header and max is the max response time in seconds. For the max column values in the top 25% of the range have a red background and in the bottom 25% of the range have a green background. The red background is not used when the min value is within 80% of the max value.
| dbms | 256us | 1ms | 4ms | 16ms | 64ms | 256ms | 1s | 4s | 16s | gt | max |
|---|---|---|---|---|---|---|---|---|---|---|---|
| pg1222_o2nofp.cx10a_c8r32 | 85.578 | 14.295 | 0.122 | 0.005 | 0.010 | ||||||
| pg1323_o2nofp.cx10a_c8r32 | 88.028 | 11.870 | 0.099 | 0.003 | nonzero | 0.035 | |||||
| pg1422_o2nofp.cx10a_c8r32 | 93.364 | 6.585 | 0.050 | nonzero | nonzero | 0.019 | |||||
| pg1517_o2nofp.cx10a_c8r32 | 93.193 | 6.761 | 0.045 | nonzero | 0.005 | ||||||
| pg1613_o2nofp.cx10a_c8r32 | 92.070 | 7.874 | 0.056 | nonzero | nonzero | 0.016 | |||||
| pg179_o2nofp.cx10a_c8r32 | 96.862 | 3.118 | 0.020 | nonzero | 0.015 | ||||||
| pg183_o2nofp.cx10b_c8r32 | 97.588 | 2.392 | 0.021 | nonzero | 0.015 |
Delete response time histogram: each cell has the percentage of responses that take <= the time in the header and max is the max response time in seconds. For the max column values in the top 25% of the range have a red background and in the bottom 25% of the range have a green background. The red background is not used when the min value is within 80% of the max value.
| dbms | 256us | 1ms | 4ms | 16ms | 64ms | 256ms | 1s | 4s | 16s | gt | max |
|---|---|---|---|---|---|---|---|---|---|---|---|
| pg1222_o2nofp.cx10a_c8r32 | 9.395 | 57.549 | 33.045 | 0.011 | 0.010 | ||||||
| pg1323_o2nofp.cx10a_c8r32 | 7.519 | 63.871 | 28.599 | 0.011 | nonzero | 0.035 | |||||
| pg1422_o2nofp.cx10a_c8r32 | 8.666 | 56.417 | 34.917 | 0.001 | nonzero | 0.019 | |||||
| pg1517_o2nofp.cx10a_c8r32 | 7.844 | 62.336 | 29.818 | 0.001 | 0.009 | ||||||
| pg1613_o2nofp.cx10a_c8r32 | 6.558 | 68.198 | 25.243 | 0.001 | nonzero | 0.017 | |||||
| pg179_o2nofp.cx10a_c8r32 | 6.708 | 64.020 | 29.272 | 0.001 | 0.016 | ||||||
| pg183_o2nofp.cx10b_c8r32 | 7.421 | 61.396 | 31.183 | 0.001 | 0.015 |
Performance metrics for the DBMS listed above. Some are normalized by throughput, others are not. Legend for results is here.
ips	qps	rps	rmbps	wps	wmbps	rpq	rkbpq	wpi	wkbpi	csps	cpups	cspq	cpupq	dbgb1	dbgb2	rss	maxop	p50	p99	tag
24390	0	0	0.0	225.2	23.1	0.000	0.000	0.009	0.970	90647	67.1	3.717	220	11.4	51.4	9.1	0.010	4280	2775	pg1222_o2nofp.cx10a_c8r32
22346	0	0	0.0	207.5	21.3	0.000	0.000	0.009	0.974	87514	64.5	3.916	231	11.3	51.4	4.5	0.035	5264	1925	pg1323_o2nofp.cx10a_c8r32
23564	0	0	0.0	216.1	22.0	0.000	0.000	0.009	0.958	94209	64.5	3.998	219	10.9	51.0	4.5	0.019	3955	2515	pg1422_o2nofp.cx10a_c8r32
24578	0	0	0.0	222.0	23.0	0.000	0.000	0.009	0.958	96883	65.8	3.942	214	10.9	51.0	5.7	0.005	4375	3115	pg1517_o2nofp.cx10a_c8r32
25276	0	0	0.0	227.9	23.6	0.000	0.000	0.009	0.955	98064	66.6	3.880	211	10.9	51.0	3.6	0.016	5214	3309	pg1613_o2nofp.cx10a_c8r32
24730	0	0	0.0	218.1	23.0	0.000	0.000	0.009	0.954	86617	64.6	3.503	209	10.9	51.0	8.4	0.015	5339	3230	pg179_o2nofp.cx10a_c8r32
25276	0	0	0.0	226.6	23.7	0.000	0.000	0.009	0.960	88753	65.3	3.511	207	10.9	51.0	6.5	0.015	4475	3150	pg183_o2nofp.cx10b_c8r32
Average values from iostat.
r/s	rkB/s	rrqm/s	%rrqm	r_await	rareq-s	w/s	wkB/s	wrqm/s	%wrqm	w_await	wareq-s	d/s	dkB/s	drqm/s	%drqm	d_await	dareq-s	f/s	f_await	aqu-sz	%util
0.002	0.006	0.000	0.000	0.000	0.031	225.3	23661.1	21.27	5.498	0.252	108.1	2.417	51.53	0.000	0.000	0.627	7.134	23.22	1.467	0.098	5.531		pg1222_o2nofp.cx10a_c8r32
0.000	0.000	0.000	0.000	0.000	0.000	207.4	21739.2	18.46	5.081	0.277	106.7	2.406	148.6	0.000	0.000	0.629	34.76	21.23	1.533	0.090	5.114		pg1323_o2nofp.cx10a_c8r32
0.001	0.006	0.000	0.000	0.007	0.030	215.5	22480.0	18.42	4.713	0.258	106.9	2.400	57.71	0.000	0.000	0.638	10.07	22.41	1.498	0.095	5.326		pg1422_o2nofp.cx10a_c8r32
0.000	0.000	0.000	0.000	0.000	0.000	222.1	23541.9	17.09	3.530	0.242	109.3	0.157	39.75	0.000	0.000	0.010	4.279	23.39	1.363	0.091	5.189		pg1517_o2nofp.cx10a_c8r32
0.000	0.000	0.000	0.000	0.000	0.000	226.9	24009.4	17.59	4.014	0.267	108.9	0.165	41.07	0.000	0.000	0.019	2.592	23.83	1.440	0.103	5.760		pg1613_o2nofp.cx10a_c8r32
0.002	0.006	0.000	0.000	0.000	0.031	216.6	23413.0	9.188	2.468	0.226	109.1	0.002	1.800	0.000	0.000	0.008	9.000	19.89	1.379	0.082	4.213		pg179_o2nofp.cx10a_c8r32
0.003	0.013	0.000	0.000	0.000	0.064	224.8	24046.7	12.90	2.516	0.224	108.9	0.112	31.71	0.000	0.000	0.003	21.28	22.07	1.428	0.090	4.674		pg183_o2nofp.cx10b_c8r32
qr100.L1
qr100.L1: range queries with 100 insert/s per client. Graphs for performance per 1-second interval are here.
Average throughput:
Query response time histogram: each cell has the percentage of responses that take <= the time in the header and max is the max response time in seconds. For max values in the top 25% of the range have a red background and in the bottom 25% of the range have a green background. The red background is not used when the min value is within 80% of the max value.
| dbms | 256us | 1ms | 4ms | 16ms | 64ms | 256ms | 1s | 4s | 16s | gt | max |
|---|---|---|---|---|---|---|---|---|---|---|---|
| pg1222_o2nofp.cx10a_c8r32 | 99.994 | 0.006 | nonzero | 0.002 | |||||||
| pg1323_o2nofp.cx10a_c8r32 | 99.996 | 0.004 | nonzero | 0.002 | |||||||
| pg1422_o2nofp.cx10a_c8r32 | 99.994 | 0.006 | nonzero | 0.002 | |||||||
| pg1517_o2nofp.cx10a_c8r32 | 99.993 | 0.007 | nonzero | 0.001 | |||||||
| pg1613_o2nofp.cx10a_c8r32 | 99.993 | 0.007 | nonzero | 0.001 | |||||||
| pg179_o2nofp.cx10a_c8r32 | 99.993 | 0.007 | nonzero | 0.001 | |||||||
| pg183_o2nofp.cx10b_c8r32 | 99.994 | 0.006 | nonzero | 0.001 |
Insert response time histogram: each cell has the percentage of responses that take <= the time in the header and max is the max response time in seconds. For max values in the top 25% of the range have a red background and in the bottom 25% of the range have a green background. The red background is not used when the min value is within 80% of the max value.
| dbms | 256us | 1ms | 4ms | 16ms | 64ms | 256ms | 1s | 4s | 16s | gt | max |
|---|---|---|---|---|---|---|---|---|---|---|---|
| pg1222_o2nofp.cx10a_c8r32 | 58.639 | 41.333 | 0.028 | 0.005 | |||||||
| pg1323_o2nofp.cx10a_c8r32 | 55.826 | 44.139 | 0.035 | 0.005 | |||||||
| pg1422_o2nofp.cx10a_c8r32 | 66.965 | 33.000 | 0.035 | 0.005 | |||||||
| pg1517_o2nofp.cx10a_c8r32 | 61.021 | 38.938 | 0.042 | 0.005 | |||||||
| pg1613_o2nofp.cx10a_c8r32 | 62.375 | 37.590 | 0.035 | 0.005 | |||||||
| pg179_o2nofp.cx10a_c8r32 | 73.757 | 26.208 | 0.035 | 0.005 | |||||||
| pg183_o2nofp.cx10b_c8r32 | 73.681 | 26.292 | 0.028 | 0.005 |
Delete response time histogram: each cell has the percentage of responses that take <= the time in the header and max is the max response time in seconds. For max values in the top 25% of the range have a red background and in the bottom 25% of the range have a green background. The red background is not used when the min value is within 80% of the max value.
| dbms | 256us | 1ms | 4ms | 16ms | 64ms | 256ms | 1s | 4s | 16s | gt | max |
|---|---|---|---|---|---|---|---|---|---|---|---|
| pg1222_o2nofp.cx10a_c8r32 | 99.035 | 0.965 | 0.003 | ||||||||
| pg1323_o2nofp.cx10a_c8r32 | 99.174 | 0.826 | 0.002 | ||||||||
| pg1422_o2nofp.cx10a_c8r32 | 0.021 | 99.042 | 0.938 | 0.002 | |||||||
| pg1517_o2nofp.cx10a_c8r32 | 0.007 | 98.965 | 1.028 | 0.002 | |||||||
| pg1613_o2nofp.cx10a_c8r32 | 0.007 | 98.847 | 1.146 | 0.002 | |||||||
| pg179_o2nofp.cx10a_c8r32 | 0.028 | 98.007 | 1.965 | 0.002 | |||||||
| pg183_o2nofp.cx10b_c8r32 | 98.410 | 1.590 | 0.002 |
Performance metrics for the DBMS listed above. Some are normalized by throughput, others are not. Legend for results is here.
ips	qps	rps	rmbps	wps	wmbps	rpq	rkbpq	wpi	wkbpi	csps	cpups	cspq	cpupq	dbgb1	dbgb2	rss	maxop	p50	p99	tag
399	101056	0	0.0	23.9	1.7	0.000	0.000	0.060	4.450	385553	41.1	3.815	33	11.4	51.4	2.7	0.002	25133	24701	pg1222_o2nofp.cx10a_c8r32
399	100737	0	0.0	23.9	1.7	0.000	0.000	0.060	4.439	384284	41.1	3.815	33	11.3	51.4	0.3	0.002	25101	24653	pg1323_o2nofp.cx10a_c8r32
399	102514	0	0.0	24.0	1.7	0.000	0.000	0.060	4.465	391039	41.1	3.814	32	10.9	51.0	0.2	0.002	25805	25357	pg1422_o2nofp.cx10a_c8r32
399	102359	0	0.0	21.9	1.7	0.000	0.000	0.055	4.411	390608	40.6	3.816	32	10.9	51.0	0.2	0.001	25581	25085	pg1517_o2nofp.cx10a_c8r32
399	103167	0	0.0	21.9	1.7	0.000	0.000	0.055	4.415	393712	40.7	3.816	32	10.9	51.0	0.2	0.001	25821	25166	pg1613_o2nofp.cx10a_c8r32
399	105325	0	0.0	21.8	1.7	0.000	0.000	0.055	4.420	401706	40.9	3.814	31	10.9	51.0	0.2	0.001	26301	25741	pg179_o2nofp.cx10a_c8r32
399	103250	0	0.0	21.5	1.7	0.000	0.000	0.054	4.415	394008	40.8	3.816	32	10.9	51.0	0.2	0.001	25933	25357	pg183_o2nofp.cx10b_c8r32
Average values from iostat.
r/s	rkB/s	rrqm/s	%rrqm	r_await	rareq-s	w/s	wkB/s	wrqm/s	%wrqm	w_await	wareq-s	d/s	dkB/s	drqm/s	%drqm	d_await	dareq-s	f/s	f_await	aqu-sz	%util
0.000	0.000	0.000	0.000	0.000	0.000	23.84	1771.7	4.121	17.29	1.206	67.11	2.000	9.994	0.000	0.000	1.119	4.997	4.465	1.826	0.034	1.654		pg1222_o2nofp.cx10a_c8r32
0.000	0.000	0.000	0.000	0.000	0.000	23.85	1767.0	2.699	11.99	1.208	66.65	2.000	9.997	0.000	0.000	1.029	4.998	4.480	1.836	0.034	1.671		pg1323_o2nofp.cx10a_c8r32
0.000	0.000	0.000	0.000	0.000	0.000	23.92	1777.7	3.694	15.87	1.206	66.71	2.001	10.40	0.000	0.000	1.198	5.196	4.496	1.778	0.034	1.627		pg1422_o2nofp.cx10a_c8r32
0.000	0.000	0.000	0.000	0.000	0.000	21.81	1754.8	0.384	1.883	1.389	72.89	0.001	0.002	0.000	0.000	0.000	0.011	4.479	1.815	0.032	1.521		pg1517_o2nofp.cx10a_c8r32
0.000	0.000	0.000	0.000	0.000	0.000	21.89	1756.5	0.389	1.894	1.414	72.83	0.001	0.002	0.000	0.000	0.000	0.011	4.514	1.860	0.033	1.590		pg1613_o2nofp.cx10a_c8r32
0.000	0.000	0.000	0.000	0.000	0.000	21.79	1759.4	0.385	1.969	1.636	73.59	0.001	0.002	0.000	0.000	0.003	0.011	4.283	1.826	0.037	1.580		pg179_o2nofp.cx10a_c8r32
0.000	0.000	0.000	0.000	0.000	0.000	21.43	1756.8	0.413	2.135	1.639	74.80	0.001	0.002	0.000	0.000	0.003	0.011	4.103	1.867	0.037	1.552		pg183_o2nofp.cx10b_c8r32
qp100.L2
qp100.L2: point queries with 100 insert/s per client. Graphs for performance per 1-second interval are here.
Average throughput:
Query response time histogram: each cell has the percentage of responses that take <= the time in the header and max is the max response time in seconds. For max values in the top 25% of the range have a red background and in the bottom 25% of the range have a green background. The red background is not used when the min value is within 80% of the max value.
| dbms | 256us | 1ms | 4ms | 16ms | 64ms | 256ms | 1s | 4s | 16s | gt | max |
|---|---|---|---|---|---|---|---|---|---|---|---|
| pg1222_o2nofp.cx10a_c8r32 | 99.966 | 0.034 | nonzero | 0.003 | |||||||
| pg1323_o2nofp.cx10a_c8r32 | 99.975 | 0.025 | nonzero | 0.001 | |||||||
| pg1422_o2nofp.cx10a_c8r32 | 99.966 | 0.034 | nonzero | 0.001 | |||||||
| pg1517_o2nofp.cx10a_c8r32 | 99.961 | 0.039 | nonzero | 0.001 | |||||||
| pg1613_o2nofp.cx10a_c8r32 | 99.959 | 0.041 | nonzero | 0.003 | |||||||
| pg179_o2nofp.cx10a_c8r32 | 99.961 | 0.039 | nonzero | 0.001 | |||||||
| pg183_o2nofp.cx10b_c8r32 | 99.964 | 0.036 | nonzero | 0.001 |
Insert response time histogram: each cell has the percentage of responses that take <= the time in the header and max is the max response time in seconds. For max values in the top 25% of the range have a red background and in the bottom 25% of the range have a green background. The red background is not used when the min value is within 80% of the max value.
| dbms | 256us | 1ms | 4ms | 16ms | 64ms | 256ms | 1s | 4s | 16s | gt | max |
|---|---|---|---|---|---|---|---|---|---|---|---|
| pg1222_o2nofp.cx10a_c8r32 | 40.250 | 59.708 | 0.042 | 0.004 | |||||||
| pg1323_o2nofp.cx10a_c8r32 | 48.646 | 51.306 | 0.049 | 0.005 | |||||||
| pg1422_o2nofp.cx10a_c8r32 | 41.861 | 58.111 | 0.028 | 0.005 | |||||||
| pg1517_o2nofp.cx10a_c8r32 | 47.854 | 52.118 | 0.028 | 0.005 | |||||||
| pg1613_o2nofp.cx10a_c8r32 | 49.528 | 50.444 | 0.028 | 0.005 | |||||||
| pg179_o2nofp.cx10a_c8r32 | 60.153 | 39.806 | 0.042 | 0.005 | |||||||
| pg183_o2nofp.cx10b_c8r32 | 62.146 | 37.819 | 0.035 | 0.005 |
Delete response time histogram: each cell has the percentage of responses that take <= the time in the header and max is the max response time in seconds. For max values in the top 25% of the range have a red background and in the bottom 25% of the range have a green background. The red background is not used when the min value is within 80% of the max value.
| dbms | 256us | 1ms | 4ms | 16ms | 64ms | 256ms | 1s | 4s | 16s | gt | max |
|---|---|---|---|---|---|---|---|---|---|---|---|
| pg1222_o2nofp.cx10a_c8r32 | 33.424 | 66.576 | 0.004 | ||||||||
| pg1323_o2nofp.cx10a_c8r32 | 39.181 | 60.812 | 0.007 | 0.004 | |||||||
| pg1422_o2nofp.cx10a_c8r32 | 22.597 | 77.396 | 0.007 | 0.004 | |||||||
| pg1517_o2nofp.cx10a_c8r32 | 28.701 | 71.292 | 0.007 | 0.004 | |||||||
| pg1613_o2nofp.cx10a_c8r32 | 23.292 | 76.708 | 0.004 | ||||||||
| pg179_o2nofp.cx10a_c8r32 | 15.542 | 84.451 | 0.007 | 0.004 | |||||||
| pg183_o2nofp.cx10b_c8r32 | 21.840 | 78.146 | 0.014 | 0.004 |
Performance metrics for the DBMS listed above. Some are normalized by throughput, others are not. Legend for results is here.
ips	qps	rps	rmbps	wps	wmbps	rpq	rkbpq	wpi	wkbpi	csps	cpups	cspq	cpupq	dbgb1	dbgb2	rss	maxop	p50	p99	tag
399	50947	0	0.0	60.2	3.7	0.000	0.000	0.151	9.383	196531	44.8	3.858	70	11.4	51.2	2.7	0.003	12671	12575	pg1222_o2nofp.cx10a_c8r32
399	51234	0	0.0	60.1	3.6	0.000	0.000	0.151	9.345	197638	44.9	3.858	70	11.3	51.2	0.3	0.001	12863	12719	pg1323_o2nofp.cx10a_c8r32
399	50424	0	0.0	59.2	3.6	0.000	0.000	0.148	9.274	194463	44.5	3.857	71	11.0	50.8	0.3	0.001	12686	12575	pg1422_o2nofp.cx10a_c8r32
399	51137	0	0.0	57.0	3.6	0.000	0.000	0.143	9.208	197149	45.0	3.855	70	10.9	50.8	0.3	0.001	12863	12735	pg1517_o2nofp.cx10a_c8r32
399	51798	0	0.0	56.7	3.6	0.000	0.000	0.142	9.225	199689	44.7	3.855	69	10.9	50.8	2.7	0.003	12943	12847	pg1613_o2nofp.cx10a_c8r32
399	51365	0	0.0	55.7	3.6	0.000	0.000	0.139	9.181	197978	45.5	3.854	71	10.9	50.7	0.2	0.001	12879	12799	pg179_o2nofp.cx10a_c8r32
399	51440	0	0.0	56.2	3.6	0.000	0.000	0.141	9.183	198290	45.1	3.855	70	10.9	50.7	0.2	0.001	13039	12910	pg183_o2nofp.cx10b_c8r32
Average values from iostat.
r/s	rkB/s	rrqm/s	%rrqm	r_await	rareq-s	w/s	wkB/s	wrqm/s	%wrqm	w_await	wareq-s	d/s	dkB/s	drqm/s	%drqm	d_await	dareq-s	f/s	f_await	aqu-sz	%util
0.000	0.000	0.000	0.000	0.000	0.000	59.93	3713.6	5.100	9.028	0.333	61.35	2.008	110.6	0.000	0.000	0.666	25.94	4.306	1.633	0.023	1.131		pg1222_o2nofp.cx10a_c8r32
0.000	0.000	0.000	0.000	0.000	0.000	59.88	3700.8	3.513	6.496	0.366	61.05	2.008	119.7	0.000	0.000	0.641	27.83	4.373	1.710	0.024	1.197		pg1323_o2nofp.cx10a_c8r32
0.000	0.000	0.000	0.000	0.000	0.000	58.92	3672.2	4.767	8.554	0.362	61.84	2.006	129.2	0.000	0.000	0.588	29.94	4.397	1.600	0.023	1.120		pg1422_o2nofp.cx10a_c8r32
0.000	0.000	0.000	0.000	0.000	0.000	56.71	3646.1	1.562	3.037	0.391	64.20	0.010	127.9	0.000	0.000	0.002	37.64	4.402	1.544	0.023	1.083		pg1517_o2nofp.cx10a_c8r32
0.000	0.000	0.000	0.000	0.000	0.000	56.45	3652.8	1.589	3.211	0.412	64.68	0.009	118.8	0.000	0.000	0.004	39.61	4.405	1.593	0.023	1.068		pg1613_o2nofp.cx10a_c8r32
0.000	0.000	0.000	0.000	0.000	0.000	55.42	3635.3	1.427	2.727	0.405	65.94	0.011	137.1	0.000	0.000	0.004	38.08	3.923	1.573	0.021	0.981		pg179_o2nofp.cx10a_c8r32
0.000	0.000	0.000	0.000	0.000	0.000	55.98	3636.0	1.314	2.341	0.418	65.08	0.009	127.9	0.000	0.000	0.004	39.99	3.944	1.583	0.021	0.993		pg183_o2nofp.cx10b_c8r32
qr500.L3
qr500.L3: range queries with 500 insert/s per client. Graphs for performance per 1-second interval are here.
Average throughput:
Query response time histogram: each cell has the percentage of responses that take <= the time in the header and max is the max response time in seconds. For max values in the top 25% of the range have a red background and in the bottom 25% of the range have a green background. The red background is not used when the min value is within 80% of the max value.
| dbms | 256us | 1ms | 4ms | 16ms | 64ms | 256ms | 1s | 4s | 16s | gt | max |
|---|---|---|---|---|---|---|---|---|---|---|---|
| pg1222_o2nofp.cx10a_c8r32 | 99.991 | 0.009 | nonzero | nonzero | 0.013 | ||||||
| pg1323_o2nofp.cx10a_c8r32 | 99.991 | 0.008 | nonzero | nonzero | 0.005 | ||||||
| pg1422_o2nofp.cx10a_c8r32 | 99.989 | 0.010 | nonzero | nonzero | 0.010 | ||||||
| pg1517_o2nofp.cx10a_c8r32 | 99.988 | 0.012 | nonzero | nonzero | 0.011 | ||||||
| pg1613_o2nofp.cx10a_c8r32 | 99.988 | 0.012 | nonzero | nonzero | 0.015 | ||||||
| pg179_o2nofp.cx10a_c8r32 | 99.988 | 0.011 | nonzero | nonzero | 0.015 | ||||||
| pg183_o2nofp.cx10b_c8r32 | 99.990 | 0.009 | nonzero | nonzero | 0.013 |
Insert response time histogram: each cell has the percentage of responses that take <= the time in the header and max is the max response time in seconds. For max values in the top 25% of the range have a red background and in the bottom 25% of the range have a green background. The red background is not used when the min value is within 80% of the max value.
| dbms | 256us | 1ms | 4ms | 16ms | 64ms | 256ms | 1s | 4s | 16s | gt | max |
|---|---|---|---|---|---|---|---|---|---|---|---|
| pg1222_o2nofp.cx10a_c8r32 | 82.867 | 17.026 | 0.107 | 0.015 | |||||||
| pg1323_o2nofp.cx10a_c8r32 | 85.662 | 14.214 | 0.124 | 0.011 | |||||||
| pg1422_o2nofp.cx10a_c8r32 | 83.794 | 15.876 | 0.329 | 0.013 | |||||||
| pg1517_o2nofp.cx10a_c8r32 | 83.061 | 16.758 | 0.181 | 0.013 | |||||||
| pg1613_o2nofp.cx10a_c8r32 | 87.757 | 12.062 | 0.178 | 0.003 | 0.018 | ||||||
| pg179_o2nofp.cx10a_c8r32 | 88.801 | 10.943 | 0.250 | 0.006 | 0.018 | ||||||
| pg183_o2nofp.cx10b_c8r32 | 91.717 | 8.172 | 0.111 | 0.015 |
Delete response time histogram: each cell has the percentage of responses that take <= the time in the header and max is the max response time in seconds. For max values in the top 25% of the range have a red background and in the bottom 25% of the range have a green background. The red background is not used when the min value is within 80% of the max value.
| dbms | 256us | 1ms | 4ms | 16ms | 64ms | 256ms | 1s | 4s | 16s | gt | max |
|---|---|---|---|---|---|---|---|---|---|---|---|
| pg1222_o2nofp.cx10a_c8r32 | 0.171 | 69.243 | 30.431 | 0.156 | 0.014 | ||||||
| pg1323_o2nofp.cx10a_c8r32 | 0.157 | 65.197 | 34.435 | 0.211 | 0.012 | ||||||
| pg1422_o2nofp.cx10a_c8r32 | 0.112 | 67.722 | 31.472 | 0.693 | 0.015 | ||||||
| pg1517_o2nofp.cx10a_c8r32 | 0.085 | 60.356 | 39.315 | 0.244 | 0.014 | ||||||
| pg1613_o2nofp.cx10a_c8r32 | 0.090 | 62.442 | 37.206 | 0.263 | 0.015 | ||||||
| pg179_o2nofp.cx10a_c8r32 | 0.154 | 62.081 | 37.360 | 0.400 | 0.006 | 0.018 | |||||
| pg183_o2nofp.cx10b_c8r32 | 0.287 | 74.825 | 24.731 | 0.157 | 0.013 |
Performance metrics for the DBMS listed above. Some are normalized by throughput, others are not. Legend for results is here.
ips	qps	rps	rmbps	wps	wmbps	rpq	rkbpq	wpi	wkbpi	csps	cpups	cspq	cpupq	dbgb1	dbgb2	rss	maxop	p50	p99	tag
1997	97696	0	0.0	96.2	5.1	0.000	0.000	0.048	2.612	371684	43.5	3.804	36	11.4	48.7	1.4	0.013	24621	19742	pg1222_o2nofp.cx10a_c8r32
1996	96584	0	0.0	96.1	5.1	0.000	0.000	0.048	2.608	367814	43.4	3.808	36	11.3	48.7	0.3	0.005	24365	19758	pg1323_o2nofp.cx10a_c8r32
1996	98269	0	0.0	94.5	5.1	0.000	0.000	0.047	2.617	374300	42.7	3.809	35	11.0	48.4	0.2	0.010	24685	23197	pg1422_o2nofp.cx10a_c8r32
1997	98448	0	0.0	92.2	5.1	0.000	0.000	0.046	2.610	374162	42.5	3.801	35	11.0	48.4	5.1	0.011	24829	23166	pg1517_o2nofp.cx10a_c8r32
1997	99476	0	0.0	92.6	5.1	0.000	0.000	0.046	2.610	378685	42.3	3.807	34	11.0	48.4	1.4	0.015	24971	23422	pg1613_o2nofp.cx10a_c8r32
1996	100836	0	0.0	90.9	5.1	0.000	0.000	0.046	2.604	383920	42.5	3.807	34	11.0	48.3	0.2	0.015	25389	23790	pg179_o2nofp.cx10a_c8r32
1997	99923	0	0.0	90.4	5.1	0.000	0.000	0.045	2.597	380565	42.3	3.809	34	11.0	48.3	0.1	0.013	24989	22525	pg183_o2nofp.cx10b_c8r32
Average values from iostat.
r/s	rkB/s	rrqm/s	%rrqm	r_await	rareq-s	w/s	wkB/s	wrqm/s	%wrqm	w_await	wareq-s	d/s	dkB/s	drqm/s	%drqm	d_await	dareq-s	f/s	f_await	aqu-sz	%util
0.000	0.000	0.000	0.000	0.000	0.000	95.96	5176.9	5.936	6.850	0.408	52.99	2.121	1470.8	0.000	0.000	0.802	72.81	5.633	1.588	0.044	1.610		pg1222_o2nofp.cx10a_c8r32
0.001	0.002	0.000	0.000	0.000	0.011	95.89	5167.8	4.326	4.803	0.422	52.99	2.119	1461.7	0.000	0.000	0.528	42.43	5.675	1.588	0.045	1.604		pg1323_o2nofp.cx10a_c8r32
0.001	0.004	0.000	0.000	0.003	0.022	94.22	5184.5	5.884	6.762	0.435	53.66	2.122	1471.7	0.000	0.000	0.646	73.74	5.642	1.552	0.046	1.610		pg1422_o2nofp.cx10a_c8r32
0.000	0.000	0.000	0.000	0.000	0.000	91.95	5173.5	2.611	2.383	0.438	55.44	0.105	1461.0	0.000	0.000	0.004	40.45	5.619	1.494	0.044	1.460		pg1517_o2nofp.cx10a_c8r32
0.001	0.002	0.000	0.000	0.000	0.011	92.38	5175.1	2.438	2.238	0.461	55.05	0.103	1451.5	0.000	0.000	0.002	39.90	5.728	1.514	0.045	1.517		pg1613_o2nofp.cx10a_c8r32
0.001	0.002	0.000	0.000	0.000	0.011	90.67	5158.4	2.329	2.108	0.543	56.60	0.100	1460.5	0.000	0.000	0.024	42.02	5.054	1.489	0.047	1.430		pg179_o2nofp.cx10a_c8r32
0.000	0.000	0.000	0.000	0.000	0.000	90.14	5146.3	2.230	2.474	0.559	55.99	0.103	1460.6	0.000	0.000	0.021	81.64	4.944	1.520	0.046	1.429		pg183_o2nofp.cx10b_c8r32
qp500.L4
qp500.L4: point queries with 500 insert/s per client. Graphs for performance per 1-second interval are here.
Average throughput:
Query response time histogram: each cell has the percentage of responses that take <= the time in the header and max is the max response time in seconds. For max values in the top 25% of the range have a red background and in the bottom 25% of the range have a green background. The red background is not used when the min value is within 80% of the max value.
| dbms | 256us | 1ms | 4ms | 16ms | 64ms | 256ms | 1s | 4s | 16s | gt | max |
|---|---|---|---|---|---|---|---|---|---|---|---|
| pg1222_o2nofp.cx10a_c8r32 | 99.965 | 0.034 | nonzero | 0.003 | |||||||
| pg1323_o2nofp.cx10a_c8r32 | 99.971 | 0.028 | 0.001 | 0.003 | |||||||
| pg1422_o2nofp.cx10a_c8r32 | 99.961 | 0.039 | nonzero | 0.004 | |||||||
| pg1517_o2nofp.cx10a_c8r32 | 99.954 | 0.046 | nonzero | nonzero | 0.004 | ||||||
| pg1613_o2nofp.cx10a_c8r32 | 99.952 | 0.048 | nonzero | nonzero | 0.004 | ||||||
| pg179_o2nofp.cx10a_c8r32 | 99.957 | 0.043 | nonzero | 0.004 | |||||||
| pg183_o2nofp.cx10b_c8r32 | 99.961 | 0.039 | nonzero | nonzero | 0.008 |
Insert response time histogram: each cell has the percentage of responses that take <= the time in the header and max is the max response time in seconds. For max values in the top 25% of the range have a red background and in the bottom 25% of the range have a green background. The red background is not used when the min value is within 80% of the max value.
| dbms | 256us | 1ms | 4ms | 16ms | 64ms | 256ms | 1s | 4s | 16s | gt | max |
|---|---|---|---|---|---|---|---|---|---|---|---|
| pg1222_o2nofp.cx10a_c8r32 | 81.686 | 18.257 | 0.057 | 0.010 | |||||||
| pg1323_o2nofp.cx10a_c8r32 | 82.129 | 17.772 | 0.099 | 0.007 | |||||||
| pg1422_o2nofp.cx10a_c8r32 | 83.600 | 16.286 | 0.114 | 0.009 | |||||||
| pg1517_o2nofp.cx10a_c8r32 | 84.911 | 15.018 | 0.071 | 0.011 | |||||||
| pg1613_o2nofp.cx10a_c8r32 | 85.868 | 14.072 | 0.060 | 0.010 | |||||||
| pg179_o2nofp.cx10a_c8r32 | 88.122 | 11.790 | 0.088 | 0.008 | |||||||
| pg183_o2nofp.cx10b_c8r32 | 88.231 | 11.518 | 0.251 | 0.015 |
Delete response time histogram: each cell has the percentage of responses that take <= the time in the header and max is the max response time in seconds. For max values in the top 25% of the range have a red background and in the bottom 25% of the range have a green background. The red background is not used when the min value is within 80% of the max value.
| dbms | 256us | 1ms | 4ms | 16ms | 64ms | 256ms | 1s | 4s | 16s | gt | max |
|---|---|---|---|---|---|---|---|---|---|---|---|
| pg1222_o2nofp.cx10a_c8r32 | 0.142 | 59.140 | 40.646 | 0.072 | 0.007 | ||||||
| pg1323_o2nofp.cx10a_c8r32 | 0.086 | 60.288 | 39.439 | 0.188 | 0.007 | ||||||
| pg1422_o2nofp.cx10a_c8r32 | 0.076 | 57.129 | 42.661 | 0.133 | 0.009 | ||||||
| pg1517_o2nofp.cx10a_c8r32 | 0.065 | 54.268 | 45.610 | 0.057 | 0.007 | ||||||
| pg1613_o2nofp.cx10a_c8r32 | 0.061 | 52.412 | 47.479 | 0.047 | 0.007 | ||||||
| pg179_o2nofp.cx10a_c8r32 | 0.179 | 52.406 | 47.251 | 0.164 | 0.007 | ||||||
| pg183_o2nofp.cx10b_c8r32 | 0.204 | 58.951 | 40.436 | 0.408 | 0.014 |
Performance metrics for the DBMS listed above. Some are normalized by throughput, others are not. Legend for results is here.
ips	qps	rps	rmbps	wps	wmbps	rpq	rkbpq	wpi	wkbpi	csps	cpups	cspq	cpupq	dbgb1	dbgb2	rss	maxop	p50	p99	tag
1997	50840	0	0.0	62.8	5.6	0.000	0.000	0.031	2.889	195614	46.2	3.848	73	11.4	45.1	3.0	0.003	12735	11935	pg1222_o2nofp.cx10a_c8r32
1997	51176	0	0.0	62.5	5.6	0.000	0.000	0.031	2.872	196979	45.9	3.849	72	11.4	45.1	10.5	0.003	12799	12015	pg1323_o2nofp.cx10a_c8r32
1997	50143	0	0.0	62.3	5.5	0.000	0.000	0.031	2.840	193110	45.3	3.851	72	11.1	44.8	3.5	0.004	12543	11839	pg1422_o2nofp.cx10a_c8r32
1996	50958	0	0.0	60.0	5.5	0.000	0.000	0.030	2.826	196129	46.1	3.849	72	11.1	44.8	0.4	0.004	12943	12335	pg1517_o2nofp.cx10a_c8r32
1996	51290	0	0.0	59.8	5.5	0.000	0.000	0.030	2.820	197501	45.9	3.851	72	11.0	44.7	9.5	0.004	12847	11887	pg1613_o2nofp.cx10a_c8r32
1997	50993	0	0.0	58.8	5.5	0.000	0.000	0.029	2.819	196201	46.1	3.848	72	11.0	44.7	7.6	0.004	12831	12671	pg179_o2nofp.cx10a_c8r32
1996	50920	0	0.0	59.5	5.5	0.000	0.000	0.030	2.820	196117	46.4	3.852	73	11.0	44.7	0.1	0.008	12799	12335	pg183_o2nofp.cx10b_c8r32
Average values from iostat.
r/s	rkB/s	rrqm/s	%rrqm	r_await	rareq-s	w/s	wkB/s	wrqm/s	%wrqm	w_await	wareq-s	d/s	dkB/s	drqm/s	%drqm	d_await	dareq-s	f/s	f_await	aqu-sz	%util
0.000	0.000	0.000	0.000	0.000	0.000	62.60	5745.6	6.476	9.201	0.349	90.12	2.175	2146.3	0.000	0.000	0.474	41.59	5.677	1.680	0.030	1.446		pg1222_o2nofp.cx10a_c8r32
0.001	0.004	0.000	0.000	0.000	0.011	62.36	5711.9	4.985	6.668	0.323	90.08	2.167	2146.3	0.000	0.000	0.477	42.75	5.665	1.636	0.028	1.416		pg1323_o2nofp.cx10a_c8r32
0.002	0.007	0.000	0.000	0.000	0.011	62.09	5647.0	6.282	8.888	0.327	90.18	2.159	2137.5	0.000	0.000	0.487	44.46	5.723	1.605	0.029	1.422		pg1422_o2nofp.cx10a_c8r32
0.002	0.007	0.000	0.000	0.001	0.011	59.76	5614.3	2.537	2.410	0.347	93.40	0.148	2118.3	0.000	0.000	0.005	69.27	5.692	1.598	0.027	1.331		pg1517_o2nofp.cx10a_c8r32
0.001	0.009	0.000	0.000	0.000	0.022	59.66	5604.9	2.428	2.451	0.341	93.38	0.145	2136.1	0.000	0.000	0.003	74.03	5.690	1.562	0.026	1.308		pg1613_o2nofp.cx10a_c8r32
0.001	0.002	0.000	0.000	0.000	0.011	58.64	5605.4	2.487	2.556	0.393	95.25	0.140	2126.8	0.000	0.000	0.005	84.77	5.081	1.530	0.026	1.223		pg179_o2nofp.cx10a_c8r32
0.001	0.002	0.000	0.000	0.000	0.011	59.24	5595.6	2.436	2.759	0.411	93.49	0.140	2126.8	0.000	0.000	0.008	85.97	5.091	1.572	0.028	1.345		pg183_o2nofp.cx10b_c8r32
qr1000.L5
qr1000.L5: range queries with 1000 insert/s per client. Graphs for performance per 1-second interval are here.
Average throughput:
Query response time histogram: each cell has the percentage of responses that take <= the time in the header and max is the max response time in seconds. For max values in the top 25% of the range have a red background and in the bottom 25% of the range have a green background. The red background is not used when the min value is within 80% of the max value.
| dbms | 256us | 1ms | 4ms | 16ms | 64ms | 256ms | 1s | 4s | 16s | gt | max |
|---|---|---|---|---|---|---|---|---|---|---|---|
| pg1222_o2nofp.cx10a_c8r32 | 99.987 | 0.013 | 0.001 | nonzero | nonzero | 0.032 | |||||
| pg1323_o2nofp.cx10a_c8r32 | 99.987 | 0.012 | 0.001 | nonzero | 0.028 | ||||||
| pg1422_o2nofp.cx10a_c8r32 | 99.984 | 0.016 | nonzero | nonzero | nonzero | 0.022 | |||||
| pg1517_o2nofp.cx10a_c8r32 | 99.984 | 0.016 | nonzero | nonzero | 0.004 | ||||||
| pg1613_o2nofp.cx10a_c8r32 | 99.984 | 0.016 | nonzero | nonzero | nonzero | 0.026 | |||||
| pg179_o2nofp.cx10a_c8r32 | 99.985 | 0.015 | nonzero | nonzero | nonzero | 0.024 | |||||
| pg183_o2nofp.cx10b_c8r32 | 99.987 | 0.013 | nonzero | nonzero | nonzero | 0.029 |
Insert response time histogram: each cell has the percentage of responses that take <= the time in the header and max is the max response time in seconds. For max values in the top 25% of the range have a red background and in the bottom 25% of the range have a green background. The red background is not used when the min value is within 80% of the max value.
| dbms | 256us | 1ms | 4ms | 16ms | 64ms | 256ms | 1s | 4s | 16s | gt | max |
|---|---|---|---|---|---|---|---|---|---|---|---|
| pg1222_o2nofp.cx10a_c8r32 | 83.435 | 16.479 | 0.086 | 0.011 | |||||||
| pg1323_o2nofp.cx10a_c8r32 | 86.130 | 13.725 | 0.145 | 0.013 | |||||||
| pg1422_o2nofp.cx10a_c8r32 | 86.906 | 12.984 | 0.110 | 0.011 | |||||||
| pg1517_o2nofp.cx10a_c8r32 | 87.253 | 12.638 | 0.109 | 0.008 | |||||||
| pg1613_o2nofp.cx10a_c8r32 | 86.952 | 12.942 | 0.106 | 0.013 | |||||||
| pg179_o2nofp.cx10a_c8r32 | 84.289 | 15.631 | 0.081 | 0.007 | |||||||
| pg183_o2nofp.cx10b_c8r32 | 90.107 | 9.716 | 0.177 | 0.015 |
Delete response time histogram: each cell has the percentage of responses that take <= the time in the header and max is the max response time in seconds. For max values in the top 25% of the range have a red background and in the bottom 25% of the range have a green background. The red background is not used when the min value is within 80% of the max value.
| dbms | 256us | 1ms | 4ms | 16ms | 64ms | 256ms | 1s | 4s | 16s | gt | max |
|---|---|---|---|---|---|---|---|---|---|---|---|
| pg1222_o2nofp.cx10a_c8r32 | 0.056 | 67.005 | 32.847 | 0.093 | 0.013 | ||||||
| pg1323_o2nofp.cx10a_c8r32 | 0.062 | 67.415 | 32.372 | 0.151 | 0.010 | ||||||
| pg1422_o2nofp.cx10a_c8r32 | 0.076 | 67.765 | 32.101 | 0.058 | 0.009 | ||||||
| pg1517_o2nofp.cx10a_c8r32 | 0.026 | 64.572 | 35.280 | 0.123 | 0.010 | ||||||
| pg1613_o2nofp.cx10a_c8r32 | 0.025 | 61.698 | 38.192 | 0.085 | 0.013 | ||||||
| pg179_o2nofp.cx10a_c8r32 | 0.092 | 64.178 | 35.515 | 0.215 | 0.009 | ||||||
| pg183_o2nofp.cx10b_c8r32 | 0.125 | 69.768 | 29.701 | 0.406 | 0.013 |
Performance metrics for the DBMS listed above. Some are normalized by throughput, others are not. Legend for results is here.
ips	qps	rps	rmbps	wps	wmbps	rpq	rkbpq	wpi	wkbpi	csps	cpups	cspq	cpupq	dbgb1	dbgb2	rss	maxop	p50	p99	tag
3991	95571	0	0.0	75.7	7.2	0.000	0.000	0.019	1.845	363247	44.4	3.801	37	11.4	42.7	9.3	0.032	23870	19422	pg1222_o2nofp.cx10a_c8r32
3993	95182	0	0.0	75.6	7.2	0.000	0.000	0.019	1.839	361841	44.5	3.802	37	11.3	42.6	5.8	0.028	23885	19326	pg1323_o2nofp.cx10a_c8r32
3993	96532	0	0.0	74.9	7.1	0.000	0.000	0.019	1.811	366924	44.0	3.801	36	11.1	42.4	0.4	0.022	24286	20974	pg1422_o2nofp.cx10a_c8r32
3993	96837	0	0.0	72.3	7.0	0.000	0.000	0.018	1.797	367988	43.9	3.800	36	11.1	42.3	0.5	0.004	24381	20206	pg1517_o2nofp.cx10a_c8r32
3993	97852	0	0.0	72.3	7.0	0.000	0.000	0.018	1.799	371716	43.8	3.799	36	11.0	42.3	3.0	0.026	24637	20173	pg1613_o2nofp.cx10a_c8r32
3993	99068	0	0.0	71.1	7.0	0.000	0.000	0.018	1.797	375589	43.9	3.791	35	11.0	42.3	0.4	0.024	24894	22157	pg179_o2nofp.cx10a_c8r32
3993	98416	0	0.0	72.5	7.0	0.000	0.000	0.018	1.806	373881	43.7	3.799	36	11.0	42.3	8.8	0.029	24813	22237	pg183_o2nofp.cx10b_c8r32
Average values from iostat.
r/s	rkB/s	rrqm/s	%rrqm	r_await	rareq-s	w/s	wkB/s	wrqm/s	%wrqm	w_await	wareq-s	d/s	dkB/s	drqm/s	%drqm	d_await	dareq-s	f/s	f_await	aqu-sz	%util
0.000	0.000	0.000	0.000	0.000	0.000	75.57	7343.4	6.529	8.123	0.309	97.01	2.139	1443.8	0.000	0.000	0.607	46.37	7.100	1.597	0.035	1.658		pg1222_o2nofp.cx10a_c8r32
0.000	0.000	0.000	0.000	0.000	0.000	75.36	7323.3	5.005	6.021	0.312	97.11	2.134	1449.1	0.000	0.000	0.501	49.34	7.151	1.652	0.035	1.698		pg1323_o2nofp.cx10a_c8r32
0.000	0.000	0.000	0.000	0.000	0.000	74.70	7209.2	6.221	7.849	0.305	96.40	2.139	1439.6	0.000	0.000	0.508	44.25	7.217	1.582	0.034	1.654		pg1422_o2nofp.cx10a_c8r32
0.000	0.000	0.000	0.000	0.000	0.000	72.15	7153.5	2.655	2.779	0.324	99.78	0.107	1424.7	0.000	0.000	0.004	38.40	7.197	1.532	0.033	1.579		pg1517_o2nofp.cx10a_c8r32
0.001	0.002	0.000	0.000	0.000	0.011	72.14	7163.9	2.589	2.556	0.316	99.88	0.113	1475.1	0.000	0.000	0.013	269.1	7.101	1.552	0.034	1.611		pg1613_o2nofp.cx10a_c8r32
0.000	0.000	0.000	0.000	0.000	0.000	70.92	7151.0	2.451	2.525	0.365	101.4	0.092	1425.7	0.000	0.000	0.007	70.76	6.363	1.531	0.033	1.453		pg179_o2nofp.cx10a_c8r32
0.000	0.000	0.000	0.000	0.000	0.000	72.16	7172.1	2.570	2.572	0.361	100.4	0.096	1447.1	0.000	0.000	0.007	107.1	6.429	1.539	0.034	1.474		pg183_o2nofp.cx10b_c8r32
qp1000.L6
qp1000.L6: point queries with 1000 insert/s per client. Graphs for performance per 1-second interval are here.
Average throughput:
Query response time histogram: each cell has the percentage of responses that take <= the time in the header and max is the max response time in seconds. For max values in the top 25% of the range have a red background and in the bottom 25% of the range have a green background. The red background is not used when the min value is within 80% of the max value.
| dbms | 256us | 1ms | 4ms | 16ms | 64ms | 256ms | 1s | 4s | 16s | gt | max |
|---|---|---|---|---|---|---|---|---|---|---|---|
| pg1222_o2nofp.cx10a_c8r32 | 99.959 | 0.040 | 0.001 | nonzero | nonzero | 0.041 | |||||
| pg1323_o2nofp.cx10a_c8r32 | 99.964 | 0.035 | 0.001 | nonzero | nonzero | 0.030 | |||||
| pg1422_o2nofp.cx10a_c8r32 | 99.950 | 0.050 | 0.001 | nonzero | nonzero | 0.023 | |||||
| pg1517_o2nofp.cx10a_c8r32 | 99.945 | 0.054 | 0.001 | nonzero | nonzero | 0.018 | |||||
| pg1613_o2nofp.cx10a_c8r32 | 99.941 | 0.058 | 0.001 | nonzero | 0.004 | ||||||
| pg179_o2nofp.cx10a_c8r32 | 99.948 | 0.052 | 0.001 | nonzero | nonzero | 0.034 | |||||
| pg183_o2nofp.cx10b_c8r32 | 99.953 | 0.046 | 0.001 | nonzero | nonzero | 0.021 |
Insert response time histogram: each cell has the percentage of responses that take <= the time in the header and max is the max response time in seconds. For max values in the top 25% of the range have a red background and in the bottom 25% of the range have a green background. The red background is not used when the min value is within 80% of the max value.
| dbms | 256us | 1ms | 4ms | 16ms | 64ms | 256ms | 1s | 4s | 16s | gt | max |
|---|---|---|---|---|---|---|---|---|---|---|---|
| pg1222_o2nofp.cx10a_c8r32 | 82.724 | 17.076 | 0.201 | 0.015 | |||||||
| pg1323_o2nofp.cx10a_c8r32 | 76.642 | 23.131 | 0.226 | 0.001 | 0.016 | ||||||
| pg1422_o2nofp.cx10a_c8r32 | 75.674 | 24.144 | 0.181 | 0.001 | 0.021 | ||||||
| pg1517_o2nofp.cx10a_c8r32 | 84.795 | 15.017 | 0.188 | 0.014 | |||||||
| pg1613_o2nofp.cx10a_c8r32 | 85.878 | 13.982 | 0.140 | 0.010 | |||||||
| pg179_o2nofp.cx10a_c8r32 | 87.528 | 12.303 | 0.167 | 0.001 | 0.017 | ||||||
| pg183_o2nofp.cx10b_c8r32 | 88.462 | 11.365 | 0.172 | 0.001 | 0.016 |
Delete response time histogram: each cell has the percentage of responses that take <= the time in the header and max is the max response time in seconds. For max values in the top 25% of the range have a red background and in the bottom 25% of the range have a green background. The red background is not used when the min value is within 80% of the max value.
| dbms | 256us | 1ms | 4ms | 16ms | 64ms | 256ms | 1s | 4s | 16s | gt | max |
|---|---|---|---|---|---|---|---|---|---|---|---|
| pg1222_o2nofp.cx10a_c8r32 | 0.160 | 69.065 | 30.318 | 0.457 | 0.011 | ||||||
| pg1323_o2nofp.cx10a_c8r32 | 0.122 | 63.287 | 36.009 | 0.581 | 0.012 | ||||||
| pg1422_o2nofp.cx10a_c8r32 | 0.106 | 59.700 | 39.772 | 0.420 | 0.002 | 0.020 | |||||
| pg1517_o2nofp.cx10a_c8r32 | 0.083 | 63.782 | 35.669 | 0.466 | 0.012 | ||||||
| pg1613_o2nofp.cx10a_c8r32 | 0.081 | 60.490 | 39.075 | 0.355 | 0.013 | ||||||
| pg179_o2nofp.cx10a_c8r32 | 0.162 | 60.378 | 38.965 | 0.494 | 0.001 | 0.018 | |||||
| pg183_o2nofp.cx10b_c8r32 | 0.099 | 52.467 | 47.183 | 0.251 | 0.015 |
Performance metrics for the DBMS listed above. Some are normalized by throughput, others are not. Legend for results is here.
ips	qps	rps	rmbps	wps	wmbps	rpq	rkbpq	wpi	wkbpi	csps	cpups	cspq	cpupq	dbgb1	dbgb2	rss	maxop	p50	p99	tag
3993	50435	0	0.0	74.7	7.1	0.000	0.000	0.019	1.822	194003	47.4	3.847	75	11.4	40.9	3.4	0.041	12607	11887	pg1222_o2nofp.cx10a_c8r32
3993	50667	0	0.0	74.5	7.1	0.000	0.000	0.019	1.818	194508	47.4	3.839	75	11.3	40.8	0.3	0.030	12687	11832	pg1323_o2nofp.cx10a_c8r32
3991	49590	0	0.0	73.5	7.0	0.000	0.000	0.018	1.801	190547	46.9	3.842	76	11.1	40.6	0.2	0.023	12399	11455	pg1422_o2nofp.cx10a_c8r32
3993	50636	0	0.0	71.7	7.0	0.000	0.000	0.018	1.794	194722	47.2	3.846	75	11.1	40.6	0.2	0.018	12799	11725	pg1517_o2nofp.cx10a_c8r32
3993	50950	0	0.0	71.6	7.0	0.000	0.000	0.018	1.790	195962	47.1	3.846	74	11.0	40.5	9.2	0.004	12783	11647	pg1613_o2nofp.cx10a_c8r32
3993	49554	0	0.0	70.5	7.0	0.000	0.000	0.018	1.786	190393	47.7	3.842	77	11.0	40.5	0.2	0.034	12671	11503	pg179_o2nofp.cx10a_c8r32
3993	50412	0	0.0	71.6	7.2	0.000	0.000	0.018	1.835	193816	47.5	3.845	75	11.0	40.5	0.4	0.021	12598	11823	pg183_o2nofp.cx10b_c8r32
Average values from iostat.
r/s	rkB/s	rrqm/s	%rrqm	r_await	rareq-s	w/s	wkB/s	wrqm/s	%wrqm	w_await	wareq-s	d/s	dkB/s	drqm/s	%drqm	d_await	dareq-s	f/s	f_await	aqu-sz	%util
0.000	0.000	0.000	0.000	0.000	0.000	74.35	7229.8	6.590	8.031	0.335	96.95	2.132	1050.0	0.000	0.000	0.484	42.59	6.939	1.674	0.037	1.768		pg1222_o2nofp.cx10a_c8r32
0.000	0.000	0.000	0.000	0.000	0.000	74.10	7213.6	5.025	5.982	0.334	97.33	2.126	1088.8	0.000	0.000	0.539	57.32	6.963	1.617	0.036	1.764		pg1323_o2nofp.cx10a_c8r32
0.000	0.000	0.000	0.000	0.000	0.000	73.14	7139.9	6.246	7.735	0.323	96.39	2.126	1064.6	0.000	0.000	0.501	44.80	6.884	1.579	0.036	1.660		pg1422_o2nofp.cx10a_c8r32
0.000	0.000	0.000	0.000	0.000	0.000	71.31	7119.4	2.837	2.781	0.342	99.12	0.085	1034.5	0.000	0.000	0.007	93.35	7.019	1.569	0.035	1.598		pg1517_o2nofp.cx10a_c8r32
0.000	0.000	0.000	0.000	0.000	0.000	71.28	7103.0	2.701	2.436	0.334	99.19	0.087	1032.1	0.000	0.000	0.011	34.61	6.984	1.551	0.035	1.585		pg1613_o2nofp.cx10a_c8r32
0.000	0.000	0.000	0.000	0.000	0.000	70.07	7086.6	2.629	2.440	0.380	100.9	0.073	1061.4	0.000	0.000	0.007	165.2	6.391	1.539	0.034	1.554		pg179_o2nofp.cx10a_c8r32
0.000	0.000	0.000	0.000	0.000	0.000	71.55	7318.9	2.749	2.595	0.360	101.5	0.072	1034.8	0.000	0.000	0.011	123.8	6.217	1.513	0.035	1.494		pg183_o2nofp.cx10b_c8r32
l.i0
l.i0: load without secondary indexes
Performance metrics for all DBMS, not just the ones listed above. Some are normalized by throughput, others are not. Legend for results is here.
ips	qps	rps	rmbps	wps	wmbps	rpq	rkbpq	wpi	wkbpi	csps	cpups	cspq	cpupq	dbgb1	dbgb2	rss	maxop	p50	p99	tag
588235	0	1	0.0	2116.0	242.0	0.000	0.000	0.004	0.421	52269	65.1	0.089	9	3.8	10.4	2.8	0.005	177882	172983	pg1222_o2nofp.cx10a_c8r32
606061	0	1	0.0	2159.1	246.3	0.000	0.000	0.004	0.416	52561	65.1	0.087	9	3.8	10.4	0.4	0.005	181782	175206	pg1323_o2nofp.cx10a_c8r32
588235	0	1	0.0	2086.3	237.5	0.000	0.000	0.004	0.413	51938	65.2	0.088	9	3.8	10.4	0.4	0.004	177378	170883	pg1422_o2nofp.cx10a_c8r32
606061	0	1	0.0	2116.8	241.6	0.000	0.000	0.003	0.408	52079	65.1	0.086	9	3.8	10.4	0.4	0.005	182873	176842	pg1517_o2nofp.cx10a_c8r32
597015	0	1	0.0	2109.8	240.9	0.000	0.000	0.004	0.413	51535	65.0	0.086	9	3.8	10.4	0.3	0.004	181078	175990	pg1613_o2nofp.cx10a_c8r32
571428	0	1	0.0	2008.5	228.9	0.000	0.000	0.004	0.410	51944	59.1	0.091	8	3.8	10.4	0.3	0.005	170780	153185	pg179_o2nofp.cx10a_c8r32
571428	0	1	0.0	1998.2	227.7	0.000	0.000	0.003	0.408	51845	59.4	0.091	8	3.8	10.4	0.3	0.010	170470	149485	pg183_o2nofp.cx10b_c8r32
l.x
l.x: create secondary indexes
Performance metrics for all DBMS, not just the ones listed above. Some are normalized by throughput, others are not. Legend for results is here.
ips	qps	rps	rmbps	wps	wmbps	rpq	rkbpq	wpi	wkbpi	csps	cpups	cspq	cpupq	dbgb1	dbgb2	rss	maxop	p50	p99	tag
1428575	0	2	0.0	3271.4	400.5	0.000	0.000	0.002	0.287	7992	34.2	0.006	2	7.7	17.7	0.0	0.002	NA	NA	pg1222_o2nofp.cx10a_c8r32
1379314	0	1	0.0	3431.8	420.5	0.000	0.000	0.002	0.312	7327	34.5	0.005	2	7.7	17.8	0.0	0.002	NA	NA	pg1323_o2nofp.cx10a_c8r32
1428575	0	1	0.0	3153.0	386.2	0.000	0.000	0.002	0.277	7554	35.3	0.005	2	7.7	17.8	0.0	0.002	NA	NA	pg1422_o2nofp.cx10a_c8r32
1481485	0	2	0.0	3369.8	412.6	0.000	0.000	0.002	0.285	8289	33.7	0.006	2	7.7	17.8	0.0	0.002	NA	NA	pg1517_o2nofp.cx10a_c8r32
1481485	0	2	0.0	3409.4	417.3	0.000	0.000	0.002	0.288	8396	33.8	0.006	2	7.7	17.8	0.0	0.002	NA	NA	pg1613_o2nofp.cx10a_c8r32
1538465	0	2	0.0	4027.6	493.8	0.000	0.000	0.003	0.329	7877	33.7	0.005	2	7.7	17.7	3.1	0.002	NA	NA	pg179_o2nofp.cx10a_c8r32
1538465	0	2	0.0	4121.4	505.2	0.000	0.000	0.003	0.336	8006	34.0	0.005	2	7.7	17.7	0.0	0.002	NA	NA	pg183_o2nofp.cx10b_c8r32
l.i1
l.i1: continue load after secondary indexes created with 50 inserts per transaction
Performance metrics for all DBMS, not just the ones listed above. Some are normalized by throughput, others are not. Legend for results is here.
ips	qps	rps	rmbps	wps	wmbps	rpq	rkbpq	wpi	wkbpi	csps	cpups	cspq	cpupq	dbgb1	dbgb2	rss	maxop	p50	p99	tag
130081	0	0	0.0	1765.5	187.8	0.000	0.000	0.014	1.478	38340	88.1	0.295	54	11.3	51.3	7.9	0.050	31897	13389	pg1222_o2nofp.cx10a_c8r32
125245	0	0	0.0	1700.2	180.3	0.000	0.000	0.014	1.474	37935	86.3	0.303	55	11.3	51.4	6.2	0.059	30247	8647	pg1323_o2nofp.cx10a_c8r32
133612	0	1	0.0	1796.2	190.1	0.000	0.000	0.013	1.457	40151	85.6	0.301	51	10.9	50.9	8.8	0.080	31946	14345	pg1422_o2nofp.cx10a_c8r32
130612	0	1	0.0	1750.7	184.9	0.000	0.000	0.013	1.449	39819	84.3	0.305	52	10.9	50.9	6.3	0.058	30547	12798	pg1517_o2nofp.cx10a_c8r32
131687	0	0	0.0	1771.2	186.8	0.000	0.000	0.013	1.453	39708	85.1	0.302	52	10.9	50.9	6.8	0.063	30397	13949	pg1613_o2nofp.cx10a_c8r32
129817	0	0	0.0	1653.3	185.1	0.000	0.000	0.013	1.460	37275	82.1	0.287	51	10.8	50.8	2.0	0.092	29447	18548	pg179_o2nofp.cx10a_c8r32
132780	0	0	0.0	1752.1	192.7	0.000	0.000	0.013	1.486	37474	83.6	0.282	50	10.8	50.9	2.5	0.052	30847	14696	pg183_o2nofp.cx10b_c8r32
l.i2
l.i2: continue load after secondary indexes created with 5 inserts per transaction
Performance metrics for all DBMS, not just the ones listed above. Some are normalized by throughput, others are not. Legend for results is here.
ips	qps	rps	rmbps	wps	wmbps	rpq	rkbpq	wpi	wkbpi	csps	cpups	cspq	cpupq	dbgb1	dbgb2	rss	maxop	p50	p99	tag
24390	0	0	0.0	225.2	23.1	0.000	0.000	0.009	0.970	90647	67.1	3.717	220	11.4	51.4	9.1	0.010	4280	2775	pg1222_o2nofp.cx10a_c8r32
22346	0	0	0.0	207.5	21.3	0.000	0.000	0.009	0.974	87514	64.5	3.916	231	11.3	51.4	4.5	0.035	5264	1925	pg1323_o2nofp.cx10a_c8r32
23564	0	0	0.0	216.1	22.0	0.000	0.000	0.009	0.958	94209	64.5	3.998	219	10.9	51.0	4.5	0.019	3955	2515	pg1422_o2nofp.cx10a_c8r32
24578	0	0	0.0	222.0	23.0	0.000	0.000	0.009	0.958	96883	65.8	3.942	214	10.9	51.0	5.7	0.005	4375	3115	pg1517_o2nofp.cx10a_c8r32
25276	0	0	0.0	227.9	23.6	0.000	0.000	0.009	0.955	98064	66.6	3.880	211	10.9	51.0	3.6	0.016	5214	3309	pg1613_o2nofp.cx10a_c8r32
24730	0	0	0.0	218.1	23.0	0.000	0.000	0.009	0.954	86617	64.6	3.503	209	10.9	51.0	8.4	0.015	5339	3230	pg179_o2nofp.cx10a_c8r32
25276	0	0	0.0	226.6	23.7	0.000	0.000	0.009	0.960	88753	65.3	3.511	207	10.9	51.0	6.5	0.015	4475	3150	pg183_o2nofp.cx10b_c8r32
qr100.L1
qr100.L1: range queries with 100 insert/s per client
Performance metrics for all DBMS, not just the ones listed above. Some are normalized by throughput, others are not. Legend for results is here.
ips	qps	rps	rmbps	wps	wmbps	rpq	rkbpq	wpi	wkbpi	csps	cpups	cspq	cpupq	dbgb1	dbgb2	rss	maxop	p50	p99	tag
399	101056	0	0.0	23.9	1.7	0.000	0.000	0.060	4.450	385553	41.1	3.815	33	11.4	51.4	2.7	0.002	25133	24701	pg1222_o2nofp.cx10a_c8r32
399	100737	0	0.0	23.9	1.7	0.000	0.000	0.060	4.439	384284	41.1	3.815	33	11.3	51.4	0.3	0.002	25101	24653	pg1323_o2nofp.cx10a_c8r32
399	102514	0	0.0	24.0	1.7	0.000	0.000	0.060	4.465	391039	41.1	3.814	32	10.9	51.0	0.2	0.002	25805	25357	pg1422_o2nofp.cx10a_c8r32
399	102359	0	0.0	21.9	1.7	0.000	0.000	0.055	4.411	390608	40.6	3.816	32	10.9	51.0	0.2	0.001	25581	25085	pg1517_o2nofp.cx10a_c8r32
399	103167	0	0.0	21.9	1.7	0.000	0.000	0.055	4.415	393712	40.7	3.816	32	10.9	51.0	0.2	0.001	25821	25166	pg1613_o2nofp.cx10a_c8r32
399	105325	0	0.0	21.8	1.7	0.000	0.000	0.055	4.420	401706	40.9	3.814	31	10.9	51.0	0.2	0.001	26301	25741	pg179_o2nofp.cx10a_c8r32
399	103250	0	0.0	21.5	1.7	0.000	0.000	0.054	4.415	394008	40.8	3.816	32	10.9	51.0	0.2	0.001	25933	25357	pg183_o2nofp.cx10b_c8r32
qp100.L2
qp100.L2: point queries with 100 insert/s per client
Performance metrics for all DBMS, not just the ones listed above. Some are normalized by throughput, others are not. Legend for results is here.
ips	qps	rps	rmbps	wps	wmbps	rpq	rkbpq	wpi	wkbpi	csps	cpups	cspq	cpupq	dbgb1	dbgb2	rss	maxop	p50	p99	tag
399	50947	0	0.0	60.2	3.7	0.000	0.000	0.151	9.383	196531	44.8	3.858	70	11.4	51.2	2.7	0.003	12671	12575	pg1222_o2nofp.cx10a_c8r32
399	51234	0	0.0	60.1	3.6	0.000	0.000	0.151	9.345	197638	44.9	3.858	70	11.3	51.2	0.3	0.001	12863	12719	pg1323_o2nofp.cx10a_c8r32
399	50424	0	0.0	59.2	3.6	0.000	0.000	0.148	9.274	194463	44.5	3.857	71	11.0	50.8	0.3	0.001	12686	12575	pg1422_o2nofp.cx10a_c8r32
399	51137	0	0.0	57.0	3.6	0.000	0.000	0.143	9.208	197149	45.0	3.855	70	10.9	50.8	0.3	0.001	12863	12735	pg1517_o2nofp.cx10a_c8r32
399	51798	0	0.0	56.7	3.6	0.000	0.000	0.142	9.225	199689	44.7	3.855	69	10.9	50.8	2.7	0.003	12943	12847	pg1613_o2nofp.cx10a_c8r32
399	51365	0	0.0	55.7	3.6	0.000	0.000	0.139	9.181	197978	45.5	3.854	71	10.9	50.7	0.2	0.001	12879	12799	pg179_o2nofp.cx10a_c8r32
399	51440	0	0.0	56.2	3.6	0.000	0.000	0.141	9.183	198290	45.1	3.855	70	10.9	50.7	0.2	0.001	13039	12910	pg183_o2nofp.cx10b_c8r32
qr500.L3
qr500.L3: range queries with 500 insert/s per client
Performance metrics for all DBMS, not just the ones listed above. Some are normalized by throughput, others are not. Legend for results is here.
ips	qps	rps	rmbps	wps	wmbps	rpq	rkbpq	wpi	wkbpi	csps	cpups	cspq	cpupq	dbgb1	dbgb2	rss	maxop	p50	p99	tag
1997	97696	0	0.0	96.2	5.1	0.000	0.000	0.048	2.612	371684	43.5	3.804	36	11.4	48.7	1.4	0.013	24621	19742	pg1222_o2nofp.cx10a_c8r32
1996	96584	0	0.0	96.1	5.1	0.000	0.000	0.048	2.608	367814	43.4	3.808	36	11.3	48.7	0.3	0.005	24365	19758	pg1323_o2nofp.cx10a_c8r32
1996	98269	0	0.0	94.5	5.1	0.000	0.000	0.047	2.617	374300	42.7	3.809	35	11.0	48.4	0.2	0.010	24685	23197	pg1422_o2nofp.cx10a_c8r32
1997	98448	0	0.0	92.2	5.1	0.000	0.000	0.046	2.610	374162	42.5	3.801	35	11.0	48.4	5.1	0.011	24829	23166	pg1517_o2nofp.cx10a_c8r32
1997	99476	0	0.0	92.6	5.1	0.000	0.000	0.046	2.610	378685	42.3	3.807	34	11.0	48.4	1.4	0.015	24971	23422	pg1613_o2nofp.cx10a_c8r32
1996	100836	0	0.0	90.9	5.1	0.000	0.000	0.046	2.604	383920	42.5	3.807	34	11.0	48.3	0.2	0.015	25389	23790	pg179_o2nofp.cx10a_c8r32
1997	99923	0	0.0	90.4	5.1	0.000	0.000	0.045	2.597	380565	42.3	3.809	34	11.0	48.3	0.1	0.013	24989	22525	pg183_o2nofp.cx10b_c8r32
qp500.L4
qp500.L4: point queries with 500 insert/s per client
Performance metrics for all DBMS, not just the ones listed above. Some are normalized by throughput, others are not. Legend for results is here.
ips	qps	rps	rmbps	wps	wmbps	rpq	rkbpq	wpi	wkbpi	csps	cpups	cspq	cpupq	dbgb1	dbgb2	rss	maxop	p50	p99	tag
1997	50840	0	0.0	62.8	5.6	0.000	0.000	0.031	2.889	195614	46.2	3.848	73	11.4	45.1	3.0	0.003	12735	11935	pg1222_o2nofp.cx10a_c8r32
1997	51176	0	0.0	62.5	5.6	0.000	0.000	0.031	2.872	196979	45.9	3.849	72	11.4	45.1	10.5	0.003	12799	12015	pg1323_o2nofp.cx10a_c8r32
1997	50143	0	0.0	62.3	5.5	0.000	0.000	0.031	2.840	193110	45.3	3.851	72	11.1	44.8	3.5	0.004	12543	11839	pg1422_o2nofp.cx10a_c8r32
1996	50958	0	0.0	60.0	5.5	0.000	0.000	0.030	2.826	196129	46.1	3.849	72	11.1	44.8	0.4	0.004	12943	12335	pg1517_o2nofp.cx10a_c8r32
1996	51290	0	0.0	59.8	5.5	0.000	0.000	0.030	2.820	197501	45.9	3.851	72	11.0	44.7	9.5	0.004	12847	11887	pg1613_o2nofp.cx10a_c8r32
1997	50993	0	0.0	58.8	5.5	0.000	0.000	0.029	2.819	196201	46.1	3.848	72	11.0	44.7	7.6	0.004	12831	12671	pg179_o2nofp.cx10a_c8r32
1996	50920	0	0.0	59.5	5.5	0.000	0.000	0.030	2.820	196117	46.4	3.852	73	11.0	44.7	0.1	0.008	12799	12335	pg183_o2nofp.cx10b_c8r32
qr1000.L5
qr1000.L5: range queries with 1000 insert/s per client
Performance metrics for all DBMS, not just the ones listed above. Some are normalized by throughput, others are not. Legend for results is here.
ips	qps	rps	rmbps	wps	wmbps	rpq	rkbpq	wpi	wkbpi	csps	cpups	cspq	cpupq	dbgb1	dbgb2	rss	maxop	p50	p99	tag
3991	95571	0	0.0	75.7	7.2	0.000	0.000	0.019	1.845	363247	44.4	3.801	37	11.4	42.7	9.3	0.032	23870	19422	pg1222_o2nofp.cx10a_c8r32
3993	95182	0	0.0	75.6	7.2	0.000	0.000	0.019	1.839	361841	44.5	3.802	37	11.3	42.6	5.8	0.028	23885	19326	pg1323_o2nofp.cx10a_c8r32
3993	96532	0	0.0	74.9	7.1	0.000	0.000	0.019	1.811	366924	44.0	3.801	36	11.1	42.4	0.4	0.022	24286	20974	pg1422_o2nofp.cx10a_c8r32
3993	96837	0	0.0	72.3	7.0	0.000	0.000	0.018	1.797	367988	43.9	3.800	36	11.1	42.3	0.5	0.004	24381	20206	pg1517_o2nofp.cx10a_c8r32
3993	97852	0	0.0	72.3	7.0	0.000	0.000	0.018	1.799	371716	43.8	3.799	36	11.0	42.3	3.0	0.026	24637	20173	pg1613_o2nofp.cx10a_c8r32
3993	99068	0	0.0	71.1	7.0	0.000	0.000	0.018	1.797	375589	43.9	3.791	35	11.0	42.3	0.4	0.024	24894	22157	pg179_o2nofp.cx10a_c8r32
3993	98416	0	0.0	72.5	7.0	0.000	0.000	0.018	1.806	373881	43.7	3.799	36	11.0	42.3	8.8	0.029	24813	22237	pg183_o2nofp.cx10b_c8r32
qp1000.L6
qp1000.L6: point queries with 1000 insert/s per client
Performance metrics for all DBMS, not just the ones listed above. Some are normalized by throughput, others are not. Legend for results is here.
ips	qps	rps	rmbps	wps	wmbps	rpq	rkbpq	wpi	wkbpi	csps	cpups	cspq	cpupq	dbgb1	dbgb2	rss	maxop	p50	p99	tag
3993	50435	0	0.0	74.7	7.1	0.000	0.000	0.019	1.822	194003	47.4	3.847	75	11.4	40.9	3.4	0.041	12607	11887	pg1222_o2nofp.cx10a_c8r32
3993	50667	0	0.0	74.5	7.1	0.000	0.000	0.019	1.818	194508	47.4	3.839	75	11.3	40.8	0.3	0.030	12687	11832	pg1323_o2nofp.cx10a_c8r32
3991	49590	0	0.0	73.5	7.0	0.000	0.000	0.018	1.801	190547	46.9	3.842	76	11.1	40.6	0.2	0.023	12399	11455	pg1422_o2nofp.cx10a_c8r32
3993	50636	0	0.0	71.7	7.0	0.000	0.000	0.018	1.794	194722	47.2	3.846	75	11.1	40.6	0.2	0.018	12799	11725	pg1517_o2nofp.cx10a_c8r32
3993	50950	0	0.0	71.6	7.0	0.000	0.000	0.018	1.790	195962	47.1	3.846	74	11.0	40.5	9.2	0.004	12783	11647	pg1613_o2nofp.cx10a_c8r32
3993	49554	0	0.0	70.5	7.0	0.000	0.000	0.018	1.786	190393	47.7	3.842	77	11.0	40.5	0.2	0.034	12671	11503	pg179_o2nofp.cx10a_c8r32
3993	50412	0	0.0	71.6	7.2	0.000	0.000	0.018	1.835	193816	47.5	3.845	75	11.0	40.5	0.4	0.021	12598	11823	pg183_o2nofp.cx10b_c8r32
l.i0
- l.i0: load without secondary indexes
- Legend for results is here.
- Each entry lists the percentage of responses that fit in that bucket (slower than max time for previous bucket, faster than min time for next bucket).
Insert response time histogram
256us	1ms	4ms	16ms	64ms	256ms	1s	4s	16s	gt	max	tag
0.000	99.431	0.569	0.001	0.000	0.000	0.000	0.000	0.000	0.000	0.005	pg1222_o2nofp.cx10a_c8r32
0.000	99.462	0.536	0.001	0.000	0.000	0.000	0.000	0.000	0.000	0.005	pg1323_o2nofp.cx10a_c8r32
0.000	99.459	0.541	0.000	0.000	0.000	0.000	0.000	0.000	0.000	0.004	pg1422_o2nofp.cx10a_c8r32
0.000	99.480	0.520	0.001	0.000	0.000	0.000	0.000	0.000	0.000	0.005	pg1517_o2nofp.cx10a_c8r32
0.000	99.444	0.556	0.001	0.000	0.000	0.000	0.000	0.000	0.000	0.004	pg1613_o2nofp.cx10a_c8r32
0.000	97.680	2.317	0.003	0.000	0.000	0.000	0.000	0.000	0.000	0.005	pg179_o2nofp.cx10a_c8r32
0.000	97.688	2.308	0.003	0.000	0.000	0.000	0.000	0.000	0.000	0.010	pg183_o2nofp.cx10b_c8r32
l.x
- l.x: create secondary indexes
- Legend for results is here.
- Each entry lists the percentage of responses that fit in that bucket (slower than max time for previous bucket, faster than min time for next bucket).
TODO - determine whether there is data for create index response time
l.i1
- l.i1: continue load after secondary indexes created with 50 inserts per transaction
- Legend for results is here.
- Each entry lists the percentage of responses that fit in that bucket (slower than max time for previous bucket, faster than min time for next bucket).
Insert response time histogram
256us	1ms	4ms	16ms	64ms	256ms	1s	4s	16s	gt	max	tag
0.000	55.277	44.478	0.213	0.032	0.000	0.000	0.000	0.000	0.000	0.050	pg1222_o2nofp.cx10a_c8r32
0.000	59.419	40.340	0.206	0.035	0.000	0.000	0.000	0.000	0.000	0.059	pg1323_o2nofp.cx10a_c8r32
0.000	67.937	31.899	0.124	0.040	nonzero	0.000	0.000	0.000	0.000	0.080	pg1422_o2nofp.cx10a_c8r32
0.000	60.616	39.203	0.160	0.021	0.000	0.000	0.000	0.000	0.000	0.058	pg1517_o2nofp.cx10a_c8r32
0.000	60.230	39.572	0.163	0.035	0.000	0.000	0.000	0.000	0.000	0.063	pg1613_o2nofp.cx10a_c8r32
0.000	70.562	29.305	0.089	0.043	nonzero	0.000	0.000	0.000	0.000	0.092	pg179_o2nofp.cx10a_c8r32
0.000	67.789	32.097	0.078	0.037	0.000	0.000	0.000	0.000	0.000	0.052	pg183_o2nofp.cx10b_c8r32
Delete response time histogram
256us	1ms	4ms	16ms	64ms	256ms	1s	4s	16s	gt	max	tag
0.003	39.702	59.617	0.642	0.036	0.000	0.000	0.000	0.000	0.000	0.051	pg1222_o2nofp.cx10a_c8r32
0.002	38.214	60.562	1.183	0.038	nonzero	0.000	0.000	0.000	0.000	0.074	pg1323_o2nofp.cx10a_c8r32
0.002	42.284	57.334	0.340	0.041	0.000	0.000	0.000	0.000	0.000	0.049	pg1422_o2nofp.cx10a_c8r32
0.003	37.693	62.143	0.133	0.028	0.000	0.000	0.000	0.000	0.000	0.049	pg1517_o2nofp.cx10a_c8r32
0.002	39.668	60.003	0.286	0.041	0.000	0.000	0.000	0.000	0.000	0.055	pg1613_o2nofp.cx10a_c8r32
0.012	39.235	60.568	0.141	0.045	nonzero	0.000	0.000	0.000	0.000	0.075	pg179_o2nofp.cx10a_c8r32
0.003	41.761	58.060	0.133	0.042	0.000	0.000	0.000	0.000	0.000	0.056	pg183_o2nofp.cx10b_c8r32
l.i2
- l.i2: continue load after secondary indexes created with 5 inserts per transaction
- Legend for results is here.
- Each entry lists the percentage of responses that fit in that bucket (slower than max time for previous bucket, faster than min time for next bucket).
Insert response time histogram
256us	1ms	4ms	16ms	64ms	256ms	1s	4s	16s	gt	max	tag
85.578	14.295	0.122	0.005	0.000	0.000	0.000	0.000	0.000	0.000	0.010	pg1222_o2nofp.cx10a_c8r32
88.028	11.870	0.099	0.003	nonzero	0.000	0.000	0.000	0.000	0.000	0.035	pg1323_o2nofp.cx10a_c8r32
93.364	6.585	0.050	nonzero	nonzero	0.000	0.000	0.000	0.000	0.000	0.019	pg1422_o2nofp.cx10a_c8r32
93.193	6.761	0.045	nonzero	0.000	0.000	0.000	0.000	0.000	0.000	0.005	pg1517_o2nofp.cx10a_c8r32
92.070	7.874	0.056	nonzero	nonzero	0.000	0.000	0.000	0.000	0.000	0.016	pg1613_o2nofp.cx10a_c8r32
96.862	3.118	0.020	nonzero	0.000	0.000	0.000	0.000	0.000	0.000	0.015	pg179_o2nofp.cx10a_c8r32
97.588	2.392	0.021	nonzero	0.000	0.000	0.000	0.000	0.000	0.000	0.015	pg183_o2nofp.cx10b_c8r32
Delete response time histogram
256us	1ms	4ms	16ms	64ms	256ms	1s	4s	16s	gt	max	tag
9.395	57.549	33.045	0.011	0.000	0.000	0.000	0.000	0.000	0.000	0.010	pg1222_o2nofp.cx10a_c8r32
7.519	63.871	28.599	0.011	nonzero	0.000	0.000	0.000	0.000	0.000	0.035	pg1323_o2nofp.cx10a_c8r32
8.666	56.417	34.917	0.001	nonzero	0.000	0.000	0.000	0.000	0.000	0.019	pg1422_o2nofp.cx10a_c8r32
7.844	62.336	29.818	0.001	0.000	0.000	0.000	0.000	0.000	0.000	0.009	pg1517_o2nofp.cx10a_c8r32
6.558	68.198	25.243	0.001	nonzero	0.000	0.000	0.000	0.000	0.000	0.017	pg1613_o2nofp.cx10a_c8r32
6.708	64.020	29.272	0.001	0.000	0.000	0.000	0.000	0.000	0.000	0.016	pg179_o2nofp.cx10a_c8r32
7.421	61.396	31.183	0.001	0.000	0.000	0.000	0.000	0.000	0.000	0.015	pg183_o2nofp.cx10b_c8r32
qr100.L1
- qr100.L1: range queries with 100 insert/s per client
- Legend for results is here.
- Each entry lists the percentage of responses that fit in that bucket (slower than max time for previous bucket, faster than min time for next bucket).
Query response time histogram
256us	1ms	4ms	16ms	64ms	256ms	1s	4s	16s	gt	max	tag
99.994	0.006	nonzero	0.000	0.000	0.000	0.000	0.000	0.000	0.000	0.002	pg1222_o2nofp.cx10a_c8r32
99.996	0.004	nonzero	0.000	0.000	0.000	0.000	0.000	0.000	0.000	0.002	pg1323_o2nofp.cx10a_c8r32
99.994	0.006	nonzero	0.000	0.000	0.000	0.000	0.000	0.000	0.000	0.002	pg1422_o2nofp.cx10a_c8r32
99.993	0.007	nonzero	0.000	0.000	0.000	0.000	0.000	0.000	0.000	0.001	pg1517_o2nofp.cx10a_c8r32
99.993	0.007	nonzero	0.000	0.000	0.000	0.000	0.000	0.000	0.000	0.001	pg1613_o2nofp.cx10a_c8r32
99.993	0.007	nonzero	0.000	0.000	0.000	0.000	0.000	0.000	0.000	0.001	pg179_o2nofp.cx10a_c8r32
99.994	0.006	nonzero	0.000	0.000	0.000	0.000	0.000	0.000	0.000	0.001	pg183_o2nofp.cx10b_c8r32
Insert response time histogram
256us	1ms	4ms	16ms	64ms	256ms	1s	4s	16s	gt	max	tag
0.000	58.639	41.333	0.028	0.000	0.000	0.000	0.000	0.000	0.000	0.005	pg1222_o2nofp.cx10a_c8r32
0.000	55.826	44.139	0.035	0.000	0.000	0.000	0.000	0.000	0.000	0.005	pg1323_o2nofp.cx10a_c8r32
0.000	66.965	33.000	0.035	0.000	0.000	0.000	0.000	0.000	0.000	0.005	pg1422_o2nofp.cx10a_c8r32
0.000	61.021	38.938	0.042	0.000	0.000	0.000	0.000	0.000	0.000	0.005	pg1517_o2nofp.cx10a_c8r32
0.000	62.375	37.590	0.035	0.000	0.000	0.000	0.000	0.000	0.000	0.005	pg1613_o2nofp.cx10a_c8r32
0.000	73.757	26.208	0.035	0.000	0.000	0.000	0.000	0.000	0.000	0.005	pg179_o2nofp.cx10a_c8r32
0.000	73.681	26.292	0.028	0.000	0.000	0.000	0.000	0.000	0.000	0.005	pg183_o2nofp.cx10b_c8r32
Delete response time histogram
256us	1ms	4ms	16ms	64ms	256ms	1s	4s	16s	gt	max	tag
0.000	99.035	0.965	0.000	0.000	0.000	0.000	0.000	0.000	0.000	0.003	pg1222_o2nofp.cx10a_c8r32
0.000	99.174	0.826	0.000	0.000	0.000	0.000	0.000	0.000	0.000	0.002	pg1323_o2nofp.cx10a_c8r32
0.021	99.042	0.938	0.000	0.000	0.000	0.000	0.000	0.000	0.000	0.002	pg1422_o2nofp.cx10a_c8r32
0.007	98.965	1.028	0.000	0.000	0.000	0.000	0.000	0.000	0.000	0.002	pg1517_o2nofp.cx10a_c8r32
0.007	98.847	1.146	0.000	0.000	0.000	0.000	0.000	0.000	0.000	0.002	pg1613_o2nofp.cx10a_c8r32
0.028	98.007	1.965	0.000	0.000	0.000	0.000	0.000	0.000	0.000	0.002	pg179_o2nofp.cx10a_c8r32
0.000	98.410	1.590	0.000	0.000	0.000	0.000	0.000	0.000	0.000	0.002	pg183_o2nofp.cx10b_c8r32
qp100.L2
- qp100.L2: point queries with 100 insert/s per client
- Legend for results is here.
- Each entry lists the percentage of responses that fit in that bucket (slower than max time for previous bucket, faster than min time for next bucket).
Query response time histogram
256us	1ms	4ms	16ms	64ms	256ms	1s	4s	16s	gt	max	tag
99.966	0.034	nonzero	0.000	0.000	0.000	0.000	0.000	0.000	0.000	0.003	pg1222_o2nofp.cx10a_c8r32
99.975	0.025	nonzero	0.000	0.000	0.000	0.000	0.000	0.000	0.000	0.001	pg1323_o2nofp.cx10a_c8r32
99.966	0.034	nonzero	0.000	0.000	0.000	0.000	0.000	0.000	0.000	0.001	pg1422_o2nofp.cx10a_c8r32
99.961	0.039	nonzero	0.000	0.000	0.000	0.000	0.000	0.000	0.000	0.001	pg1517_o2nofp.cx10a_c8r32
99.959	0.041	nonzero	0.000	0.000	0.000	0.000	0.000	0.000	0.000	0.003	pg1613_o2nofp.cx10a_c8r32
99.961	0.039	nonzero	0.000	0.000	0.000	0.000	0.000	0.000	0.000	0.001	pg179_o2nofp.cx10a_c8r32
99.964	0.036	nonzero	0.000	0.000	0.000	0.000	0.000	0.000	0.000	0.001	pg183_o2nofp.cx10b_c8r32
Insert response time histogram
256us	1ms	4ms	16ms	64ms	256ms	1s	4s	16s	gt	max	tag
0.000	40.250	59.708	0.042	0.000	0.000	0.000	0.000	0.000	0.000	0.004	pg1222_o2nofp.cx10a_c8r32
0.000	48.646	51.306	0.049	0.000	0.000	0.000	0.000	0.000	0.000	0.005	pg1323_o2nofp.cx10a_c8r32
0.000	41.861	58.111	0.028	0.000	0.000	0.000	0.000	0.000	0.000	0.005	pg1422_o2nofp.cx10a_c8r32
0.000	47.854	52.118	0.028	0.000	0.000	0.000	0.000	0.000	0.000	0.005	pg1517_o2nofp.cx10a_c8r32
0.000	49.528	50.444	0.028	0.000	0.000	0.000	0.000	0.000	0.000	0.005	pg1613_o2nofp.cx10a_c8r32
0.000	60.153	39.806	0.042	0.000	0.000	0.000	0.000	0.000	0.000	0.005	pg179_o2nofp.cx10a_c8r32
0.000	62.146	37.819	0.035	0.000	0.000	0.000	0.000	0.000	0.000	0.005	pg183_o2nofp.cx10b_c8r32
Delete response time histogram
256us	1ms	4ms	16ms	64ms	256ms	1s	4s	16s	gt	max	tag
0.000	33.424	66.576	0.000	0.000	0.000	0.000	0.000	0.000	0.000	0.004	pg1222_o2nofp.cx10a_c8r32
0.000	39.181	60.812	0.007	0.000	0.000	0.000	0.000	0.000	0.000	0.004	pg1323_o2nofp.cx10a_c8r32
0.000	22.597	77.396	0.007	0.000	0.000	0.000	0.000	0.000	0.000	0.004	pg1422_o2nofp.cx10a_c8r32
0.000	28.701	71.292	0.007	0.000	0.000	0.000	0.000	0.000	0.000	0.004	pg1517_o2nofp.cx10a_c8r32
0.000	23.292	76.708	0.000	0.000	0.000	0.000	0.000	0.000	0.000	0.004	pg1613_o2nofp.cx10a_c8r32
0.000	15.542	84.451	0.007	0.000	0.000	0.000	0.000	0.000	0.000	0.004	pg179_o2nofp.cx10a_c8r32
0.000	21.840	78.146	0.014	0.000	0.000	0.000	0.000	0.000	0.000	0.004	pg183_o2nofp.cx10b_c8r32
qr500.L3
- qr500.L3: range queries with 500 insert/s per client
- Legend for results is here.
- Each entry lists the percentage of responses that fit in that bucket (slower than max time for previous bucket, faster than min time for next bucket).
Query response time histogram
256us	1ms	4ms	16ms	64ms	256ms	1s	4s	16s	gt	max	tag
99.991	0.009	nonzero	nonzero	0.000	0.000	0.000	0.000	0.000	0.000	0.013	pg1222_o2nofp.cx10a_c8r32
99.991	0.008	nonzero	nonzero	0.000	0.000	0.000	0.000	0.000	0.000	0.005	pg1323_o2nofp.cx10a_c8r32
99.989	0.010	nonzero	nonzero	0.000	0.000	0.000	0.000	0.000	0.000	0.010	pg1422_o2nofp.cx10a_c8r32
99.988	0.012	nonzero	nonzero	0.000	0.000	0.000	0.000	0.000	0.000	0.011	pg1517_o2nofp.cx10a_c8r32
99.988	0.012	nonzero	nonzero	0.000	0.000	0.000	0.000	0.000	0.000	0.015	pg1613_o2nofp.cx10a_c8r32
99.988	0.011	nonzero	nonzero	0.000	0.000	0.000	0.000	0.000	0.000	0.015	pg179_o2nofp.cx10a_c8r32
99.990	0.009	nonzero	nonzero	0.000	0.000	0.000	0.000	0.000	0.000	0.013	pg183_o2nofp.cx10b_c8r32
Insert response time histogram
256us	1ms	4ms	16ms	64ms	256ms	1s	4s	16s	gt	max	tag
0.000	82.867	17.026	0.107	0.000	0.000	0.000	0.000	0.000	0.000	0.015	pg1222_o2nofp.cx10a_c8r32
0.000	85.662	14.214	0.124	0.000	0.000	0.000	0.000	0.000	0.000	0.011	pg1323_o2nofp.cx10a_c8r32
0.000	83.794	15.876	0.329	0.000	0.000	0.000	0.000	0.000	0.000	0.013	pg1422_o2nofp.cx10a_c8r32
0.000	83.061	16.758	0.181	0.000	0.000	0.000	0.000	0.000	0.000	0.013	pg1517_o2nofp.cx10a_c8r32
0.000	87.757	12.062	0.178	0.003	0.000	0.000	0.000	0.000	0.000	0.018	pg1613_o2nofp.cx10a_c8r32
0.000	88.801	10.943	0.250	0.006	0.000	0.000	0.000	0.000	0.000	0.018	pg179_o2nofp.cx10a_c8r32
0.000	91.717	8.172	0.111	0.000	0.000	0.000	0.000	0.000	0.000	0.015	pg183_o2nofp.cx10b_c8r32
Delete response time histogram
256us	1ms	4ms	16ms	64ms	256ms	1s	4s	16s	gt	max	tag
0.171	69.243	30.431	0.156	0.000	0.000	0.000	0.000	0.000	0.000	0.014	pg1222_o2nofp.cx10a_c8r32
0.157	65.197	34.435	0.211	0.000	0.000	0.000	0.000	0.000	0.000	0.012	pg1323_o2nofp.cx10a_c8r32
0.112	67.722	31.472	0.693	0.000	0.000	0.000	0.000	0.000	0.000	0.015	pg1422_o2nofp.cx10a_c8r32
0.085	60.356	39.315	0.244	0.000	0.000	0.000	0.000	0.000	0.000	0.014	pg1517_o2nofp.cx10a_c8r32
0.090	62.442	37.206	0.263	0.000	0.000	0.000	0.000	0.000	0.000	0.015	pg1613_o2nofp.cx10a_c8r32
0.154	62.081	37.360	0.400	0.006	0.000	0.000	0.000	0.000	0.000	0.018	pg179_o2nofp.cx10a_c8r32
0.287	74.825	24.731	0.157	0.000	0.000	0.000	0.000	0.000	0.000	0.013	pg183_o2nofp.cx10b_c8r32
qp500.L4
- qp500.L4: point queries with 500 insert/s per client
- Legend for results is here.
- Each entry lists the percentage of responses that fit in that bucket (slower than max time for previous bucket, faster than min time for next bucket).
Query response time histogram
256us	1ms	4ms	16ms	64ms	256ms	1s	4s	16s	gt	max	tag
99.965	0.034	nonzero	0.000	0.000	0.000	0.000	0.000	0.000	0.000	0.003	pg1222_o2nofp.cx10a_c8r32
99.971	0.028	0.001	0.000	0.000	0.000	0.000	0.000	0.000	0.000	0.003	pg1323_o2nofp.cx10a_c8r32
99.961	0.039	nonzero	0.000	0.000	0.000	0.000	0.000	0.000	0.000	0.004	pg1422_o2nofp.cx10a_c8r32
99.954	0.046	nonzero	nonzero	0.000	0.000	0.000	0.000	0.000	0.000	0.004	pg1517_o2nofp.cx10a_c8r32
99.952	0.048	nonzero	nonzero	0.000	0.000	0.000	0.000	0.000	0.000	0.004	pg1613_o2nofp.cx10a_c8r32
99.957	0.043	nonzero	0.000	0.000	0.000	0.000	0.000	0.000	0.000	0.004	pg179_o2nofp.cx10a_c8r32
99.961	0.039	nonzero	nonzero	0.000	0.000	0.000	0.000	0.000	0.000	0.008	pg183_o2nofp.cx10b_c8r32
Insert response time histogram
256us	1ms	4ms	16ms	64ms	256ms	1s	4s	16s	gt	max	tag
0.000	81.686	18.257	0.057	0.000	0.000	0.000	0.000	0.000	0.000	0.010	pg1222_o2nofp.cx10a_c8r32
0.000	82.129	17.772	0.099	0.000	0.000	0.000	0.000	0.000	0.000	0.007	pg1323_o2nofp.cx10a_c8r32
0.000	83.600	16.286	0.114	0.000	0.000	0.000	0.000	0.000	0.000	0.009	pg1422_o2nofp.cx10a_c8r32
0.000	84.911	15.018	0.071	0.000	0.000	0.000	0.000	0.000	0.000	0.011	pg1517_o2nofp.cx10a_c8r32
0.000	85.868	14.072	0.060	0.000	0.000	0.000	0.000	0.000	0.000	0.010	pg1613_o2nofp.cx10a_c8r32
0.000	88.122	11.790	0.088	0.000	0.000	0.000	0.000	0.000	0.000	0.008	pg179_o2nofp.cx10a_c8r32
0.000	88.231	11.518	0.251	0.000	0.000	0.000	0.000	0.000	0.000	0.015	pg183_o2nofp.cx10b_c8r32
Delete response time histogram
256us	1ms	4ms	16ms	64ms	256ms	1s	4s	16s	gt	max	tag
0.142	59.140	40.646	0.072	0.000	0.000	0.000	0.000	0.000	0.000	0.007	pg1222_o2nofp.cx10a_c8r32
0.086	60.288	39.439	0.188	0.000	0.000	0.000	0.000	0.000	0.000	0.007	pg1323_o2nofp.cx10a_c8r32
0.076	57.129	42.661	0.133	0.000	0.000	0.000	0.000	0.000	0.000	0.009	pg1422_o2nofp.cx10a_c8r32
0.065	54.268	45.610	0.057	0.000	0.000	0.000	0.000	0.000	0.000	0.007	pg1517_o2nofp.cx10a_c8r32
0.061	52.412	47.479	0.047	0.000	0.000	0.000	0.000	0.000	0.000	0.007	pg1613_o2nofp.cx10a_c8r32
0.179	52.406	47.251	0.164	0.000	0.000	0.000	0.000	0.000	0.000	0.007	pg179_o2nofp.cx10a_c8r32
0.204	58.951	40.436	0.408	0.000	0.000	0.000	0.000	0.000	0.000	0.014	pg183_o2nofp.cx10b_c8r32
qr1000.L5
- qr1000.L5: range queries with 1000 insert/s per client
- Legend for results is here.
- Each entry lists the percentage of responses that fit in that bucket (slower than max time for previous bucket, faster than min time for next bucket).
Query response time histogram
256us	1ms	4ms	16ms	64ms	256ms	1s	4s	16s	gt	max	tag
99.987	0.013	0.001	nonzero	nonzero	0.000	0.000	0.000	0.000	0.000	0.032	pg1222_o2nofp.cx10a_c8r32
99.987	0.012	0.001	0.000	nonzero	0.000	0.000	0.000	0.000	0.000	0.028	pg1323_o2nofp.cx10a_c8r32
99.984	0.016	nonzero	nonzero	nonzero	0.000	0.000	0.000	0.000	0.000	0.022	pg1422_o2nofp.cx10a_c8r32
99.984	0.016	nonzero	nonzero	0.000	0.000	0.000	0.000	0.000	0.000	0.004	pg1517_o2nofp.cx10a_c8r32
99.984	0.016	nonzero	nonzero	nonzero	0.000	0.000	0.000	0.000	0.000	0.026	pg1613_o2nofp.cx10a_c8r32
99.985	0.015	nonzero	nonzero	nonzero	0.000	0.000	0.000	0.000	0.000	0.024	pg179_o2nofp.cx10a_c8r32
99.987	0.013	nonzero	nonzero	nonzero	0.000	0.000	0.000	0.000	0.000	0.029	pg183_o2nofp.cx10b_c8r32
Insert response time histogram
256us	1ms	4ms	16ms	64ms	256ms	1s	4s	16s	gt	max	tag
0.000	83.435	16.479	0.086	0.000	0.000	0.000	0.000	0.000	0.000	0.011	pg1222_o2nofp.cx10a_c8r32
0.000	86.130	13.725	0.145	0.000	0.000	0.000	0.000	0.000	0.000	0.013	pg1323_o2nofp.cx10a_c8r32
0.000	86.906	12.984	0.110	0.000	0.000	0.000	0.000	0.000	0.000	0.011	pg1422_o2nofp.cx10a_c8r32
0.000	87.253	12.638	0.109	0.000	0.000	0.000	0.000	0.000	0.000	0.008	pg1517_o2nofp.cx10a_c8r32
0.000	86.952	12.942	0.106	0.000	0.000	0.000	0.000	0.000	0.000	0.013	pg1613_o2nofp.cx10a_c8r32
0.000	84.289	15.631	0.081	0.000	0.000	0.000	0.000	0.000	0.000	0.007	pg179_o2nofp.cx10a_c8r32
0.000	90.107	9.716	0.177	0.000	0.000	0.000	0.000	0.000	0.000	0.015	pg183_o2nofp.cx10b_c8r32
Delete response time histogram
256us	1ms	4ms	16ms	64ms	256ms	1s	4s	16s	gt	max	tag
0.056	67.005	32.847	0.093	0.000	0.000	0.000	0.000	0.000	0.000	0.013	pg1222_o2nofp.cx10a_c8r32
0.062	67.415	32.372	0.151	0.000	0.000	0.000	0.000	0.000	0.000	0.010	pg1323_o2nofp.cx10a_c8r32
0.076	67.765	32.101	0.058	0.000	0.000	0.000	0.000	0.000	0.000	0.009	pg1422_o2nofp.cx10a_c8r32
0.026	64.572	35.280	0.123	0.000	0.000	0.000	0.000	0.000	0.000	0.010	pg1517_o2nofp.cx10a_c8r32
0.025	61.698	38.192	0.085	0.000	0.000	0.000	0.000	0.000	0.000	0.013	pg1613_o2nofp.cx10a_c8r32
0.092	64.178	35.515	0.215	0.000	0.000	0.000	0.000	0.000	0.000	0.009	pg179_o2nofp.cx10a_c8r32
0.125	69.768	29.701	0.406	0.000	0.000	0.000	0.000	0.000	0.000	0.013	pg183_o2nofp.cx10b_c8r32
qp1000.L6
- qp1000.L6: point queries with 1000 insert/s per client
- Legend for results is here.
- Each entry lists the percentage of responses that fit in that bucket (slower than max time for previous bucket, faster than min time for next bucket).
Query response time histogram
256us	1ms	4ms	16ms	64ms	256ms	1s	4s	16s	gt	max	tag
99.959	0.040	0.001	nonzero	nonzero	0.000	0.000	0.000	0.000	0.000	0.041	pg1222_o2nofp.cx10a_c8r32
99.964	0.035	0.001	nonzero	nonzero	0.000	0.000	0.000	0.000	0.000	0.030	pg1323_o2nofp.cx10a_c8r32
99.950	0.050	0.001	nonzero	nonzero	0.000	0.000	0.000	0.000	0.000	0.023	pg1422_o2nofp.cx10a_c8r32
99.945	0.054	0.001	nonzero	nonzero	0.000	0.000	0.000	0.000	0.000	0.018	pg1517_o2nofp.cx10a_c8r32
99.941	0.058	0.001	nonzero	0.000	0.000	0.000	0.000	0.000	0.000	0.004	pg1613_o2nofp.cx10a_c8r32
99.948	0.052	0.001	nonzero	nonzero	0.000	0.000	0.000	0.000	0.000	0.034	pg179_o2nofp.cx10a_c8r32
99.953	0.046	0.001	nonzero	nonzero	0.000	0.000	0.000	0.000	0.000	0.021	pg183_o2nofp.cx10b_c8r32
Insert response time histogram
256us	1ms	4ms	16ms	64ms	256ms	1s	4s	16s	gt	max	tag
0.000	82.724	17.076	0.201	0.000	0.000	0.000	0.000	0.000	0.000	0.015	pg1222_o2nofp.cx10a_c8r32
0.000	76.642	23.131	0.226	0.001	0.000	0.000	0.000	0.000	0.000	0.016	pg1323_o2nofp.cx10a_c8r32
0.000	75.674	24.144	0.181	0.001	0.000	0.000	0.000	0.000	0.000	0.021	pg1422_o2nofp.cx10a_c8r32
0.000	84.795	15.017	0.188	0.000	0.000	0.000	0.000	0.000	0.000	0.014	pg1517_o2nofp.cx10a_c8r32
0.000	85.878	13.982	0.140	0.000	0.000	0.000	0.000	0.000	0.000	0.010	pg1613_o2nofp.cx10a_c8r32
0.000	87.528	12.303	0.167	0.001	0.000	0.000	0.000	0.000	0.000	0.017	pg179_o2nofp.cx10a_c8r32
0.000	88.462	11.365	0.172	0.001	0.000	0.000	0.000	0.000	0.000	0.016	pg183_o2nofp.cx10b_c8r32
Delete response time histogram
256us	1ms	4ms	16ms	64ms	256ms	1s	4s	16s	gt	max	tag
0.160	69.065	30.318	0.457	0.000	0.000	0.000	0.000	0.000	0.000	0.011	pg1222_o2nofp.cx10a_c8r32
0.122	63.287	36.009	0.581	0.000	0.000	0.000	0.000	0.000	0.000	0.012	pg1323_o2nofp.cx10a_c8r32
0.106	59.700	39.772	0.420	0.002	0.000	0.000	0.000	0.000	0.000	0.020	pg1422_o2nofp.cx10a_c8r32
0.083	63.782	35.669	0.466	0.000	0.000	0.000	0.000	0.000	0.000	0.012	pg1517_o2nofp.cx10a_c8r32
0.081	60.490	39.075	0.355	0.000	0.000	0.000	0.000	0.000	0.000	0.013	pg1613_o2nofp.cx10a_c8r32
0.162	60.378	38.965	0.494	0.001	0.000	0.000	0.000	0.000	0.000	0.018	pg179_o2nofp.cx10a_c8r32
0.099	52.467	47.183	0.251	0.000	0.000	0.000	0.000	0.000	0.000	0.015	pg183_o2nofp.cx10b_c8r32