Introduction
This is a report for the insert benchmark with 40M docs and 4 client(s). It is generated by scripts (bash, awk, sed) and Tufte might not be impressed. An overview of the insert benchmark is here and a short update is here. Below, by DBMS, I mean DBMS+version.config. An example is my8020.c10b40 where my means MySQL, 8020 is version 8.0.20 and c10b40 is the name for the configuration file.
The test server has 8 AMD cores, 32G RAM and an NVMe device for the database. The benchmark was run with 4 clients and there were 1 or 3 connections per client (1 for queries or inserts without rate limits, 1+1 for rate limited inserts+deletes). It uses 4 tables with a table per client. It loads 10M rows per table without secondary indexes, creates 3 secondary indexes per table, then inserts 16m+4m rows per table with a delete per insert to avoid growing the table. It then does 6 read+write tests for 1800s each that do queries as fast as possible with 100,100,500,500,1000,1000 inserts/s and the same for deletes/s per client concurrent with the queries. The database is cached by Postgres. Clients and the DBMS share one server.
The tested DBMS are:
- pg182_o2nofp.cx10b_c8r32 - Postgres 18.2 with my standard config (x10b)
- pg182_o2nofp.cx10b_fpw0_c8r32 - Postgres 18.2 with my standard config except full_page_writes=off
- pg182_o2nofp.cx10b_wallz4_c8r32 - Postgres 18.2 with my standard config except wal_compression=lz4
- pg182_o2nofp.cx10b_fpw0_wallz4_c8r32 - Postgres 18.2 with my standard config except full_page_writes=off and wal_compression=lz4
Contents
- Summary
- l.i0: load without secondary indexes
- l.x: create secondary indexes
- l.i1: continue load after secondary indexes created with 50 inserts per transaction
- l.i2: continue load after secondary indexes created with 5 inserts per transaction
- qr100.L1: range queries with 100 insert/s per client
- qp100.L2: point queries with 100 insert/s per client
- qr500.L3: range queries with 500 insert/s per client
- qp500.L4: point queries with 500 insert/s per client
- qr1000.L5: range queries with 1000 insert/s per client
- qp1000.L6: point queries with 1000 insert/s per client
Summary
The numbers are inserts/s for l.i0, l.i1 and l.i2, indexed docs (or rows) /s for l.x and queries/s for qr100, qp100 thru qr1000, qp1000" The values are the average rate over the entire test for inserts (IPS) and queries (QPS). The range of values for IPS and QPS is split into 3 parts: bottom 25%, middle 50%, top 25%. Values in the bottom 25% have a red background, values in the top 25% have a green background and values in the middle have no color. A gray background is used for values that can be ignored because the DBMS did not sustain the target insert rate. Red backgrounds are not used when the minimum value is within 80% of the max value.
| dbms | l.i0 | l.x | l.i1 | l.i2 | qr100 | qp100 | qr500 | qp500 | qr1000 | qp1000 |
|---|---|---|---|---|---|---|---|---|---|---|
| pg182_o2nofp.cx10b_c8r32 | 563380 | 1481485 | 127744 | 23880 | 101796 | 50972 | 98009 | 50723 | 97230 | 50086 |
| pg182_o2nofp.cx10b_fpw0_c8r32 | 563380 | 1538465 | 130879 | 25157 | 101756 | 50787 | 97470 | 50580 | 96304 | 49960 |
| pg182_o2nofp.cx10b_wallz4_c8r32 | 571428 | 1600004 | 129032 | 25039 | 102176 | 50522 | 98191 | 50070 | 96979 | 49518 |
| pg182_o2nofp.cx10b_fpw0_wallz4_c8r32 | 571428 | 1538465 | 127744 | 23392 | 102235 | 50680 | 98271 | 50544 | 96786 | 49957 |
This table has relative throughput, throughput for the DBMS relative to the DBMS in the first line, using the absolute throughput from the previous table. Values less than 0.95 have a yellow background. Values greater than 1.05 have a blue background.
| dbms | l.i0 | l.x | l.i1 | l.i2 | qr100 | qp100 | qr500 | qp500 | qr1000 | qp1000 |
|---|---|---|---|---|---|---|---|---|---|---|
| pg182_o2nofp.cx10b_c8r32 | 1.00 | 1.00 | 1.00 | 1.00 | 1.00 | 1.00 | 1.00 | 1.00 | 1.00 | 1.00 |
| pg182_o2nofp.cx10b_fpw0_c8r32 | 1.00 | 1.04 | 1.02 | 1.05 | 1.00 | 1.00 | 0.99 | 1.00 | 0.99 | 1.00 |
| pg182_o2nofp.cx10b_wallz4_c8r32 | 1.01 | 1.08 | 1.01 | 1.05 | 1.00 | 0.99 | 1.00 | 0.99 | 1.00 | 0.99 |
| pg182_o2nofp.cx10b_fpw0_wallz4_c8r32 | 1.01 | 1.04 | 1.00 | 0.98 | 1.00 | 0.99 | 1.00 | 1.00 | 1.00 | 1.00 |
This lists the average rate of inserts/s for the tests that do inserts concurrent with queries. For such tests the query rate is listed in the table above. The read+write tests are setup so that the insert rate should match the target rate every second. Cells that are not at least 95% of the target have a red background to indicate a failure to satisfy the target.
| dbms | qr100.L1 | qp100.L2 | qr500.L3 | qp500.L4 | qr1000.L5 | qp1000.L6 |
|---|---|---|---|---|---|---|
| pg182_o2nofp.cx10b_c8r32 | 399 | 399 | 1996 | 1997 | 3993 | 3993 |
| pg182_o2nofp.cx10b_fpw0_c8r32 | 399 | 399 | 1996 | 1997 | 3993 | 3991 |
| pg182_o2nofp.cx10b_wallz4_c8r32 | 399 | 399 | 1996 | 1997 | 3993 | 3991 |
| pg182_o2nofp.cx10b_fpw0_wallz4_c8r32 | 399 | 399 | 1996 | 1997 | 3993 | 3991 |
| target | 400 | 400 | 2000 | 2000 | 4000 | 4000 |
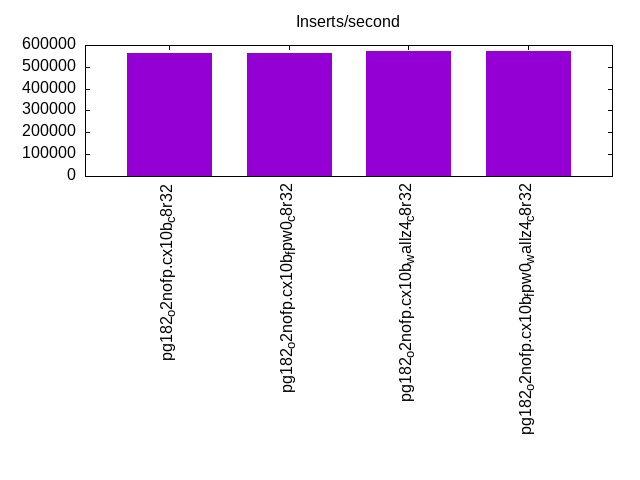
l.i0
l.i0: load without secondary indexes. Graphs for performance per 1-second interval are here.
Average throughput:
Insert response time histogram: each cell has the percentage of responses that take <= the time in the header and max is the max response time in seconds. For the max column values in the top 25% of the range have a red background and in the bottom 25% of the range have a green background. The red background is not used when the min value is within 80% of the max value.
| dbms | 256us | 1ms | 4ms | 16ms | 64ms | 256ms | 1s | 4s | 16s | gt | max |
|---|---|---|---|---|---|---|---|---|---|---|---|
| pg182_o2nofp.cx10b_c8r32 | 97.462 | 2.535 | 0.003 | 0.006 | |||||||
| pg182_o2nofp.cx10b_fpw0_c8r32 | 97.617 | 2.382 | 0.001 | 0.005 | |||||||
| pg182_o2nofp.cx10b_wallz4_c8r32 | 97.564 | 2.434 | 0.002 | 0.005 | |||||||
| pg182_o2nofp.cx10b_fpw0_wallz4_c8r32 | 97.586 | 2.412 | 0.003 | 0.005 |
Performance metrics for the DBMS listed above. Some are normalized by throughput, others are not. Legend for results is here.
ips	qps	rps	rmbps	wps	wmbps	rpq	rkbpq	wpi	wkbpi	csps	cpups	cspq	cpupq	dbgb1	dbgb2	rss	maxop	p50	p99	tag
563380	0	1	0.0	1995.3	227.8	0.000	0.000	0.004	0.414	52176	59.2	0.093	8	3.8	10.4	0.3	0.006	168283	151585	pg182_o2nofp.cx10b_c8r32
563380	0	1	0.0	1998.8	228.2	0.000	0.000	0.004	0.415	51834	59.1	0.092	8	3.8	10.4	0.3	0.005	171085	153672	pg182_o2nofp.cx10b_fpw0_c8r32
571428	0	1	0.0	2009.4	229.2	0.000	0.000	0.004	0.411	51870	59.2	0.091	8	3.8	10.4	0.3	0.005	170784	142772	pg182_o2nofp.cx10b_wallz4_c8r32
571428	0	1	0.0	1999.3	228.3	0.000	0.000	0.003	0.409	51764	59.3	0.091	8	3.8	10.4	0.3	0.005	168682	153584	pg182_o2nofp.cx10b_fpw0_wallz4_c8r32
Average values from iostat.
r/s	rkB/s	rrqm/s	%rrqm	r_await	rareq-s	w/s	wkB/s	wrqm/s	%wrqm	w_await	wareq-s	d/s	dkB/s	drqm/s	%drqm	d_await	dareq-s	f/s	f_await	aqu-sz	%util
0.969	3.876	0.000	0.000	0.122	4.000	2103.6	246103	127.1	6.152	0.496	116.3	0.400	7.017	0.000	0.000	0.675	6.053	108.6	1.545	1.258	29.42		pg182_o2nofp.cx10b_c8r32
1.092	4.369	0.000	0.000	0.168	4.000	2106.7	246478	144.1	6.776	0.470	116.4	0.615	8.615	0.000	0.000	0.328	7.148	108.3	1.546	1.189	29.60		pg182_o2nofp.cx10b_fpw0_c8r32
0.969	3.877	0.000	0.000	0.141	4.000	2118.2	247547	144.0	6.762	0.469	116.2	0.477	8.554	0.000	0.000	0.582	10.14	108.6	1.542	1.253	29.37		pg182_o2nofp.cx10b_wallz4_c8r32
1.169	4.677	0.000	0.000	0.153	4.000	2107.8	246554	145.6	6.893	0.543	116.3	0.400	3.754	0.000	0.000	0.625	3.668	107.1	1.818	1.491	32.85		pg182_o2nofp.cx10b_fpw0_wallz4_c8r32
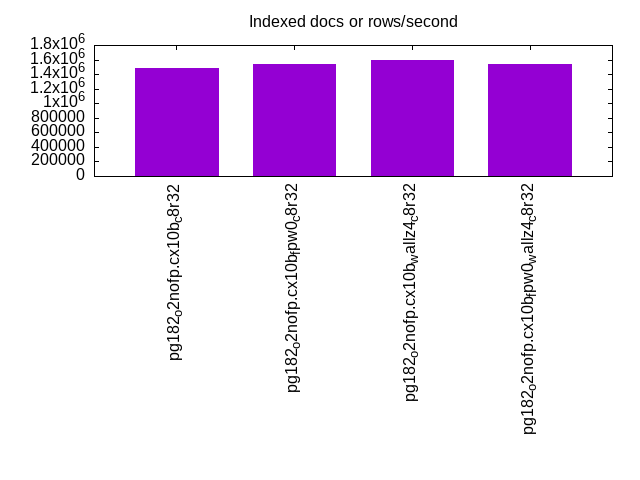
l.x
l.x: create secondary indexes.
Average throughput:
Performance metrics for the DBMS listed above. Some are normalized by throughput, others are not. Legend for results is here.
ips	qps	rps	rmbps	wps	wmbps	rpq	rkbpq	wpi	wkbpi	csps	cpups	cspq	cpupq	dbgb1	dbgb2	rss	maxop	p50	p99	tag
1481485	0	2	0.0	3617.6	444.0	0.000	0.000	0.002	0.307	7608	32.0	0.005	2	7.7	17.7	0.0	0.002	NA	NA	pg182_o2nofp.cx10b_c8r32
1538465	0	2	0.0	3605.4	441.9	0.000	0.000	0.002	0.294	7774	32.5	0.005	2	7.7	17.7	0.0	0.002	NA	NA	pg182_o2nofp.cx10b_fpw0_c8r32
1600004	0	2	0.0	3283.2	403.5	0.000	0.000	0.002	0.258	5186	33.5	0.003	2	7.7	16.3	0.0	0.002	NA	NA	pg182_o2nofp.cx10b_wallz4_c8r32
1538465	0	2	0.0	3131.8	384.3	0.000	0.000	0.002	0.256	5250	33.3	0.003	2	7.7	16.3	0.0	0.002	NA	NA	pg182_o2nofp.cx10b_fpw0_wallz4_c8r32
Average values from iostat.
r/s	rkB/s	rrqm/s	%rrqm	r_await	rareq-s	w/s	wkB/s	wrqm/s	%wrqm	w_await	wareq-s	d/s	dkB/s	drqm/s	%drqm	d_await	dareq-s	f/s	f_await	aqu-sz	%util
2.550	10.20	0.000	0.000	0.237	4.000	3982.2	500959	146.9	3.737	1.058	125.7	4.150	53821.2	0.000	0.000	2.433	7459.5	44.10	1.942	4.488	27.83		pg182_o2nofp.cx10b_c8r32
2.200	8.800	0.000	0.000	0.245	4.000	3973.4	499445	154.4	3.850	0.955	125.6	5.200	53416.4	0.000	0.000	1.487	5492.6	46.35	1.292	3.998	25.14		pg182_o2nofp.cx10b_fpw0_c8r32
2.300	9.200	0.000	0.000	0.223	4.000	4100.3	516393	105.1	2.665	0.890	125.8	4.600	83136.0	0.000	0.000	1.370	13384.0	28.95	1.637	3.625	20.80		pg182_o2nofp.cx10b_wallz4_c8r32
2.400	9.600	0.000	0.000	0.300	4.000	3371.3	424903	102.2	3.280	1.017	125.8	5.050	80867.0	0.000	0.000	1.370	14894.1	29.15	1.732	3.565	19.46		pg182_o2nofp.cx10b_fpw0_wallz4_c8r32
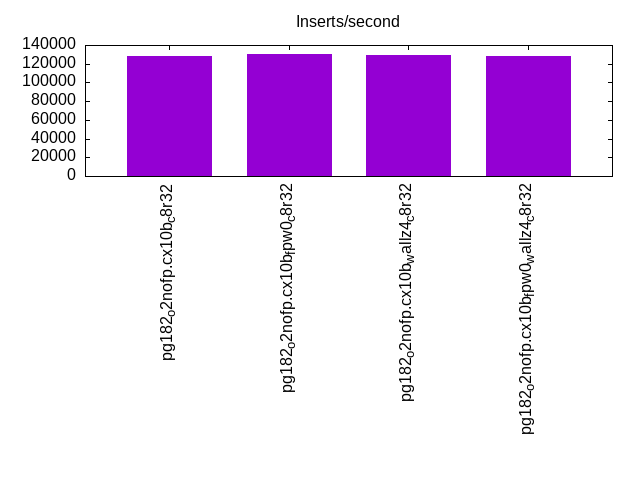
l.i1
l.i1: continue load after secondary indexes created with 50 inserts per transaction. Graphs for performance per 1-second interval are here.
Average throughput:
Insert response time histogram: each cell has the percentage of responses that take <= the time in the header and max is the max response time in seconds. For the max column values in the top 25% of the range have a red background and in the bottom 25% of the range have a green background. The red background is not used when the min value is within 80% of the max value.
| dbms | 256us | 1ms | 4ms | 16ms | 64ms | 256ms | 1s | 4s | 16s | gt | max |
|---|---|---|---|---|---|---|---|---|---|---|---|
| pg182_o2nofp.cx10b_c8r32 | 68.852 | 31.056 | 0.059 | 0.033 | 0.059 | ||||||
| pg182_o2nofp.cx10b_fpw0_c8r32 | 67.983 | 31.954 | 0.062 | 0.001 | 0.043 | ||||||
| pg182_o2nofp.cx10b_wallz4_c8r32 | 68.324 | 31.601 | 0.057 | 0.018 | 0.060 | ||||||
| pg182_o2nofp.cx10b_fpw0_wallz4_c8r32 | 70.488 | 29.468 | 0.043 | 0.001 | 0.042 |
Delete response time histogram: each cell has the percentage of responses that take <= the time in the header and max is the max response time in seconds. For the max column values in the top 25% of the range have a red background and in the bottom 25% of the range have a green background. The red background is not used when the min value is within 80% of the max value.
| dbms | 256us | 1ms | 4ms | 16ms | 64ms | 256ms | 1s | 4s | 16s | gt | max |
|---|---|---|---|---|---|---|---|---|---|---|---|
| pg182_o2nofp.cx10b_c8r32 | 0.006 | 42.328 | 57.285 | 0.342 | 0.040 | nonzero | 0.066 | ||||
| pg182_o2nofp.cx10b_fpw0_c8r32 | 0.004 | 38.406 | 61.461 | 0.128 | 0.001 | 0.024 | |||||
| pg182_o2nofp.cx10b_wallz4_c8r32 | 0.003 | 42.241 | 57.527 | 0.212 | 0.018 | 0.047 | |||||
| pg182_o2nofp.cx10b_fpw0_wallz4_c8r32 | 0.006 | 43.741 | 56.009 | 0.243 | nonzero | 0.040 |
Performance metrics for the DBMS listed above. Some are normalized by throughput, others are not. Legend for results is here.
ips	qps	rps	rmbps	wps	wmbps	rpq	rkbpq	wpi	wkbpi	csps	cpups	cspq	cpupq	dbgb1	dbgb2	rss	maxop	p50	p99	tag
127744	0	1	0.0	1689.5	186.4	0.000	0.000	0.013	1.494	37184	81.7	0.291	51	10.8	50.9	6.3	0.059	29397	6448	pg182_o2nofp.cx10b_c8r32
130879	0	0	0.0	1475.6	162.2	0.000	0.000	0.011	1.269	37720	82.4	0.288	50	10.8	50.8	10.8	0.043	30147	14637	pg182_o2nofp.cx10b_fpw0_c8r32
129032	0	0	0.0	1601.9	176.4	0.000	0.000	0.012	1.400	36979	82.3	0.287	51	10.8	50.9	9.0	0.060	29847	13994	pg182_o2nofp.cx10b_wallz4_c8r32
127744	0	1	0.0	1448.6	160.3	0.000	0.000	0.011	1.285	37425	80.9	0.293	51	10.8	50.7	10.2	0.042	31297	13446	pg182_o2nofp.cx10b_fpw0_wallz4_c8r32
Average values from iostat.
r/s	rkB/s	rrqm/s	%rrqm	r_await	rareq-s	w/s	wkB/s	wrqm/s	%wrqm	w_await	wareq-s	d/s	dkB/s	drqm/s	%drqm	d_await	dareq-s	f/s	f_await	aqu-sz	%util
0.554	2.214	0.000	0.000	0.168	3.152	1687.0	190467	100.7	5.612	0.437	112.0	0.099	179.8	0.000	0.000	0.164	300.6	109.0	1.675	0.939	29.05		pg182_o2nofp.cx10b_c8r32
0.492	1.967	0.000	0.000	0.150	3.583	1470.6	165339	91.87	5.944	0.406	112.1	0.100	89.76	0.000	0.000	0.085	165.3	97.16	1.664	0.766	26.03		pg182_o2nofp.cx10b_fpw0_c8r32
0.443	1.771	0.000	0.000	0.118	3.306	1607.3	181256	104.5	6.303	0.428	111.9	0.135	146.2	0.000	0.000	0.201	30.11	104.2	1.709	0.863	28.78		pg182_o2nofp.cx10b_wallz4_c8r32
0.568	2.271	0.000	0.000	0.176	4.000	1446.1	163756	84.35	5.613	0.371	113.2	0.065	143.6	0.000	0.000	0.112	369.8	88.12	1.621	0.687	22.86		pg182_o2nofp.cx10b_fpw0_wallz4_c8r32
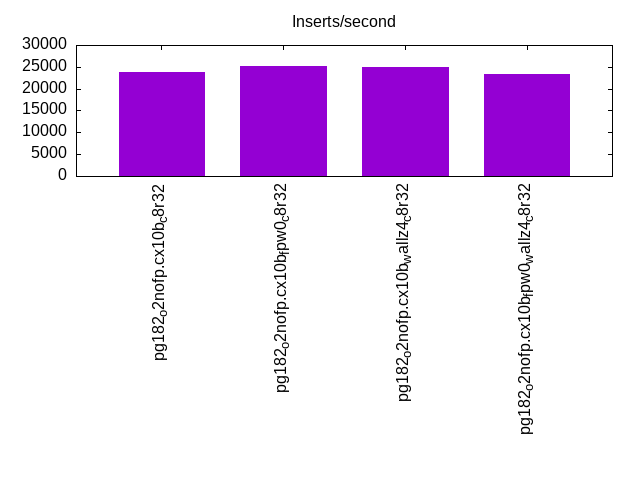
l.i2
l.i2: continue load after secondary indexes created with 5 inserts per transaction. Graphs for performance per 1-second interval are here.
Average throughput:
Insert response time histogram: each cell has the percentage of responses that take <= the time in the header and max is the max response time in seconds. For the max column values in the top 25% of the range have a red background and in the bottom 25% of the range have a green background. The red background is not used when the min value is within 80% of the max value.
| dbms | 256us | 1ms | 4ms | 16ms | 64ms | 256ms | 1s | 4s | 16s | gt | max |
|---|---|---|---|---|---|---|---|---|---|---|---|
| pg182_o2nofp.cx10b_c8r32 | 97.089 | 2.893 | 0.018 | nonzero | 0.017 | ||||||
| pg182_o2nofp.cx10b_fpw0_c8r32 | 97.691 | 2.294 | 0.016 | nonzero | 0.006 | ||||||
| pg182_o2nofp.cx10b_wallz4_c8r32 | 97.537 | 2.446 | 0.017 | nonzero | nonzero | 0.018 | |||||
| pg182_o2nofp.cx10b_fpw0_wallz4_c8r32 | 97.377 | 2.609 | 0.013 | 0.004 |
Delete response time histogram: each cell has the percentage of responses that take <= the time in the header and max is the max response time in seconds. For the max column values in the top 25% of the range have a red background and in the bottom 25% of the range have a green background. The red background is not used when the min value is within 80% of the max value.
| dbms | 256us | 1ms | 4ms | 16ms | 64ms | 256ms | 1s | 4s | 16s | gt | max |
|---|---|---|---|---|---|---|---|---|---|---|---|
| pg182_o2nofp.cx10b_c8r32 | 7.975 | 60.174 | 31.850 | nonzero | nonzero | 0.017 | |||||
| pg182_o2nofp.cx10b_fpw0_c8r32 | 7.206 | 62.992 | 29.801 | nonzero | 0.007 | ||||||
| pg182_o2nofp.cx10b_wallz4_c8r32 | 7.032 | 62.131 | 30.837 | nonzero | nonzero | 0.018 | |||||
| pg182_o2nofp.cx10b_fpw0_wallz4_c8r32 | 7.309 | 66.585 | 26.105 | 0.001 | 0.010 |
Performance metrics for the DBMS listed above. Some are normalized by throughput, others are not. Legend for results is here.
ips	qps	rps	rmbps	wps	wmbps	rpq	rkbpq	wpi	wkbpi	csps	cpups	cspq	cpupq	dbgb1	dbgb2	rss	maxop	p50	p99	tag
23880	0	0	0.0	212.6	22.3	0.000	0.000	0.009	0.955	84123	63.5	3.523	213	10.9	50.9	0.3	0.017	4510	2130	pg182_o2nofp.cx10b_c8r32
25157	0	0	0.0	165.4	18.8	0.000	0.000	0.007	0.766	88387	65.6	3.513	209	10.9	50.9	0.6	0.006	5289	3349	pg182_o2nofp.cx10b_fpw0_c8r32
25039	0	0	0.0	190.8	21.5	0.000	0.000	0.008	0.879	88339	64.8	3.528	207	10.9	50.9	10.6	0.018	4684	3110	pg182_o2nofp.cx10b_wallz4_c8r32
23392	0	0	0.0	155.5	16.8	0.000	0.000	0.007	0.736	83405	61.8	3.566	211	10.9	50.9	0.8	0.004	5100	3220	pg182_o2nofp.cx10b_fpw0_wallz4_c8r32
Average values from iostat.
r/s	rkB/s	rrqm/s	%rrqm	r_await	rareq-s	w/s	wkB/s	wrqm/s	%wrqm	w_await	wareq-s	d/s	dkB/s	drqm/s	%drqm	d_await	dareq-s	f/s	f_await	aqu-sz	%util
0.002	0.006	0.000	0.000	0.000	0.030	212.7	22785.1	12.05	2.758	0.275	108.4	0.110	60.42	0.000	0.000	0.018	27.66	20.82	1.625	0.099	5.125		pg182_o2nofp.cx10b_c8r32
0.003	0.013	0.000	0.000	0.000	0.063	166.0	19324.0	3.386	2.126	0.240	116.3	0.006	0.559	0.000	0.000	0.011	0.952	13.19	1.661	0.060	2.771		pg182_o2nofp.cx10b_fpw0_c8r32
0.002	0.006	0.000	0.000	0.000	0.032	189.6	21851.0	3.332	1.877	0.225	115.0	0.008	21.43	0.000	0.000	0.012	64.54	15.64	1.623	0.067	3.198		pg182_o2nofp.cx10b_wallz4_c8r32
0.003	0.012	0.000	0.000	0.030	0.059	155.0	17150.2	12.20	3.576	0.325	113.4	0.041	32.98	0.000	0.000	0.005	7.652	17.30	1.684	0.088	4.469		pg182_o2nofp.cx10b_fpw0_wallz4_c8r32
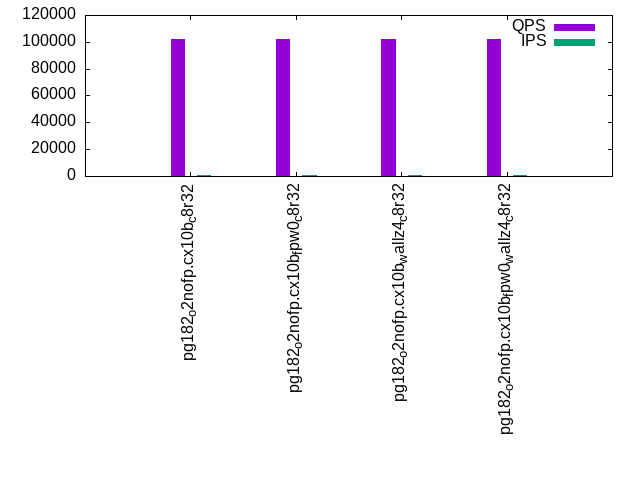
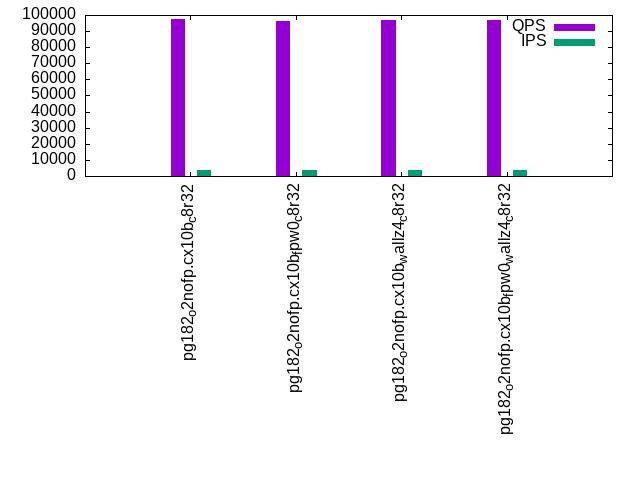
qr100.L1
qr100.L1: range queries with 100 insert/s per client. Graphs for performance per 1-second interval are here.
Average throughput:
Query response time histogram: each cell has the percentage of responses that take <= the time in the header and max is the max response time in seconds. For max values in the top 25% of the range have a red background and in the bottom 25% of the range have a green background. The red background is not used when the min value is within 80% of the max value.
| dbms | 256us | 1ms | 4ms | 16ms | 64ms | 256ms | 1s | 4s | 16s | gt | max |
|---|---|---|---|---|---|---|---|---|---|---|---|
| pg182_o2nofp.cx10b_c8r32 | 99.993 | 0.007 | nonzero | 0.002 | |||||||
| pg182_o2nofp.cx10b_fpw0_c8r32 | 99.994 | 0.006 | 0.001 | ||||||||
| pg182_o2nofp.cx10b_wallz4_c8r32 | 99.994 | 0.006 | nonzero | 0.001 | |||||||
| pg182_o2nofp.cx10b_fpw0_wallz4_c8r32 | 99.993 | 0.007 | nonzero | 0.001 |
Insert response time histogram: each cell has the percentage of responses that take <= the time in the header and max is the max response time in seconds. For max values in the top 25% of the range have a red background and in the bottom 25% of the range have a green background. The red background is not used when the min value is within 80% of the max value.
| dbms | 256us | 1ms | 4ms | 16ms | 64ms | 256ms | 1s | 4s | 16s | gt | max |
|---|---|---|---|---|---|---|---|---|---|---|---|
| pg182_o2nofp.cx10b_c8r32 | 74.299 | 25.674 | 0.028 | 0.004 | |||||||
| pg182_o2nofp.cx10b_fpw0_c8r32 | 87.028 | 12.965 | 0.007 | 0.004 | |||||||
| pg182_o2nofp.cx10b_wallz4_c8r32 | 31.167 | 68.778 | 0.056 | 0.006 | |||||||
| pg182_o2nofp.cx10b_fpw0_wallz4_c8r32 | 85.903 | 14.076 | 0.021 | 0.004 |
Delete response time histogram: each cell has the percentage of responses that take <= the time in the header and max is the max response time in seconds. For max values in the top 25% of the range have a red background and in the bottom 25% of the range have a green background. The red background is not used when the min value is within 80% of the max value.
| dbms | 256us | 1ms | 4ms | 16ms | 64ms | 256ms | 1s | 4s | 16s | gt | max |
|---|---|---|---|---|---|---|---|---|---|---|---|
| pg182_o2nofp.cx10b_c8r32 | 98.493 | 1.507 | 0.002 | ||||||||
| pg182_o2nofp.cx10b_fpw0_c8r32 | 0.028 | 99.104 | 0.868 | 0.002 | |||||||
| pg182_o2nofp.cx10b_wallz4_c8r32 | 97.951 | 2.049 | 0.003 | ||||||||
| pg182_o2nofp.cx10b_fpw0_wallz4_c8r32 | 0.014 | 98.896 | 1.090 | 0.003 |
Performance metrics for the DBMS listed above. Some are normalized by throughput, others are not. Legend for results is here.
ips	qps	rps	rmbps	wps	wmbps	rpq	rkbpq	wpi	wkbpi	csps	cpups	cspq	cpupq	dbgb1	dbgb2	rss	maxop	p50	p99	tag
399	101796	0	0.0	21.7	1.7	0.000	0.000	0.054	4.424	388287	41.4	3.814	33	10.9	50.9	0.2	0.002	25501	24941	pg182_o2nofp.cx10b_c8r32
399	101756	0	0.0	8.7	0.3	0.000	0.000	0.022	0.812	388054	41.4	3.814	33	10.9	50.9	0.2	0.001	25469	24413	pg182_o2nofp.cx10b_fpw0_c8r32
399	102176	0	0.0	17.0	1.2	0.000	0.000	0.042	3.176	389673	41.1	3.814	32	10.9	50.9	0.2	0.001	25549	24989	pg182_o2nofp.cx10b_wallz4_c8r32
399	102235	0	0.0	8.5	0.3	0.000	0.000	0.021	0.804	390103	41.5	3.816	32	10.9	50.9	0.2	0.001	25661	25053	pg182_o2nofp.cx10b_fpw0_wallz4_c8r32
Average values from iostat.
r/s	rkB/s	rrqm/s	%rrqm	r_await	rareq-s	w/s	wkB/s	wrqm/s	%wrqm	w_await	wareq-s	d/s	dkB/s	drqm/s	%drqm	d_await	dareq-s	f/s	f_await	aqu-sz	%util
0.000	0.000	0.000	0.000	0.000	0.000	21.63	1761.0	0.388	2.023	1.725	74.05	0.001	0.002	0.000	0.000	0.003	0.011	4.176	2.220	0.040	1.902		pg182_o2nofp.cx10b_c8r32
0.000	0.000	0.000	0.000	0.000	0.000	8.711	324.7	0.295	3.262	2.047	31.08	0.001	0.002	0.000	0.000	0.000	0.011	3.229	2.266	0.024	1.887		pg182_o2nofp.cx10b_fpw0_c8r32
0.000	0.000	0.000	0.000	0.000	0.000	16.93	1265.1	0.342	2.237	1.867	67.59	0.001	0.002	0.000	0.000	0.003	0.011	3.751	2.229	0.036	1.579		pg182_o2nofp.cx10b_wallz4_c8r32
0.000	0.000	0.000	0.000	0.000	0.000	8.544	321.4	0.295	3.352	2.067	31.49	0.001	0.002	0.000	0.000	0.003	0.011	3.189	2.302	0.023	1.742		pg182_o2nofp.cx10b_fpw0_wallz4_c8r32
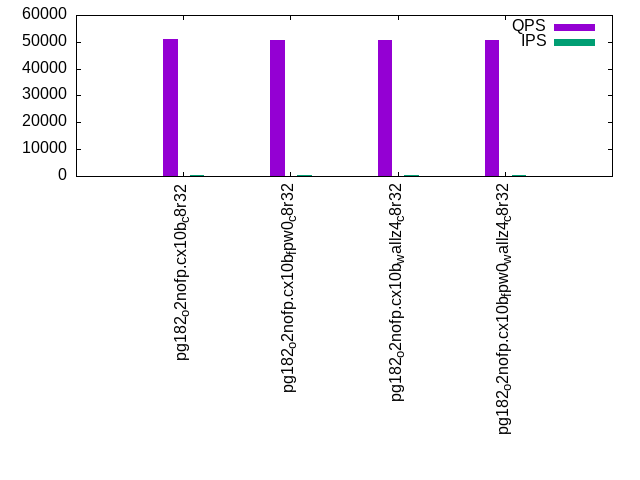
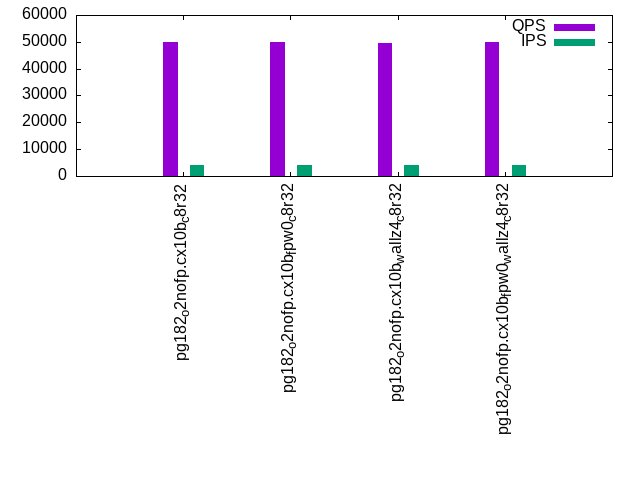
qp100.L2
qp100.L2: point queries with 100 insert/s per client. Graphs for performance per 1-second interval are here.
Average throughput:
Query response time histogram: each cell has the percentage of responses that take <= the time in the header and max is the max response time in seconds. For max values in the top 25% of the range have a red background and in the bottom 25% of the range have a green background. The red background is not used when the min value is within 80% of the max value.
| dbms | 256us | 1ms | 4ms | 16ms | 64ms | 256ms | 1s | 4s | 16s | gt | max |
|---|---|---|---|---|---|---|---|---|---|---|---|
| pg182_o2nofp.cx10b_c8r32 | 99.959 | 0.041 | nonzero | 0.002 | |||||||
| pg182_o2nofp.cx10b_fpw0_c8r32 | 99.964 | 0.036 | nonzero | 0.001 | |||||||
| pg182_o2nofp.cx10b_wallz4_c8r32 | 99.960 | 0.040 | nonzero | 0.003 | |||||||
| pg182_o2nofp.cx10b_fpw0_wallz4_c8r32 | 99.957 | 0.043 | nonzero | 0.001 |
Insert response time histogram: each cell has the percentage of responses that take <= the time in the header and max is the max response time in seconds. For max values in the top 25% of the range have a red background and in the bottom 25% of the range have a green background. The red background is not used when the min value is within 80% of the max value.
| dbms | 256us | 1ms | 4ms | 16ms | 64ms | 256ms | 1s | 4s | 16s | gt | max |
|---|---|---|---|---|---|---|---|---|---|---|---|
| pg182_o2nofp.cx10b_c8r32 | 60.535 | 39.424 | 0.042 | 0.005 | |||||||
| pg182_o2nofp.cx10b_fpw0_c8r32 | 72.181 | 27.806 | 0.014 | 0.005 | |||||||
| pg182_o2nofp.cx10b_wallz4_c8r32 | 21.799 | 78.146 | 0.056 | 0.005 | |||||||
| pg182_o2nofp.cx10b_fpw0_wallz4_c8r32 | 73.417 | 26.556 | 0.028 | 0.004 |
Delete response time histogram: each cell has the percentage of responses that take <= the time in the header and max is the max response time in seconds. For max values in the top 25% of the range have a red background and in the bottom 25% of the range have a green background. The red background is not used when the min value is within 80% of the max value.
| dbms | 256us | 1ms | 4ms | 16ms | 64ms | 256ms | 1s | 4s | 16s | gt | max |
|---|---|---|---|---|---|---|---|---|---|---|---|
| pg182_o2nofp.cx10b_c8r32 | 17.576 | 82.417 | 0.007 | 0.004 | |||||||
| pg182_o2nofp.cx10b_fpw0_c8r32 | 19.764 | 80.229 | 0.007 | 0.004 | |||||||
| pg182_o2nofp.cx10b_wallz4_c8r32 | 16.826 | 83.167 | 0.007 | 0.004 | |||||||
| pg182_o2nofp.cx10b_fpw0_wallz4_c8r32 | 20.319 | 79.674 | 0.007 | 0.004 |
Performance metrics for the DBMS listed above. Some are normalized by throughput, others are not. Legend for results is here.
ips	qps	rps	rmbps	wps	wmbps	rpq	rkbpq	wpi	wkbpi	csps	cpups	cspq	cpupq	dbgb1	dbgb2	rss	maxop	p50	p99	tag
399	50972	0	0.0	56.0	3.6	0.000	0.000	0.140	9.178	196467	45.1	3.854	71	10.9	50.7	0.2	0.002	12815	12735	pg182_o2nofp.cx10b_c8r32
399	50787	0	0.0	44.4	2.3	0.000	0.000	0.111	6.020	195718	44.7	3.854	70	10.9	50.6	0.3	0.001	12751	12687	pg182_o2nofp.cx10b_fpw0_c8r32
399	50522	0	0.0	51.8	3.2	0.000	0.000	0.130	8.149	194742	44.7	3.855	71	10.9	49.3	0.2	0.003	12751	12670	pg182_o2nofp.cx10b_wallz4_c8r32
399	50680	0	0.0	44.4	2.3	0.000	0.000	0.111	6.012	195345	44.5	3.854	70	10.9	50.6	0.2	0.001	12734	12655	pg182_o2nofp.cx10b_fpw0_wallz4_c8r32
Average values from iostat.
r/s	rkB/s	rrqm/s	%rrqm	r_await	rareq-s	w/s	wkB/s	wrqm/s	%wrqm	w_await	wareq-s	d/s	dkB/s	drqm/s	%drqm	d_await	dareq-s	f/s	f_await	aqu-sz	%util
0.000	0.000	0.000	0.000	0.000	0.000	55.72	3633.9	1.299	2.470	0.422	65.48	0.012	118.8	0.000	0.000	0.018	39.67	3.952	1.766	0.024	1.082		pg182_o2nofp.cx10b_c8r32
0.000	0.000	0.000	0.000	0.000	0.000	44.43	2403.2	1.032	3.238	0.457	54.69	0.013	182.7	0.000	0.000	0.004	41.53	3.071	1.886	0.019	0.928		pg182_o2nofp.cx10b_fpw0_c8r32
0.000	0.000	0.000	0.000	0.000	0.000	51.70	3237.6	1.478	2.842	0.436	62.91	0.066	958.5	0.000	0.000	0.005	40.97	3.523	1.845	0.022	1.093		pg182_o2nofp.cx10b_wallz4_c8r32
0.000	0.000	0.000	0.000	0.000	0.000	44.36	2399.8	1.023	3.422	0.439	54.44	0.018	182.7	0.000	0.000	0.019	38.16	3.082	1.822	0.018	1.013		pg182_o2nofp.cx10b_fpw0_wallz4_c8r32
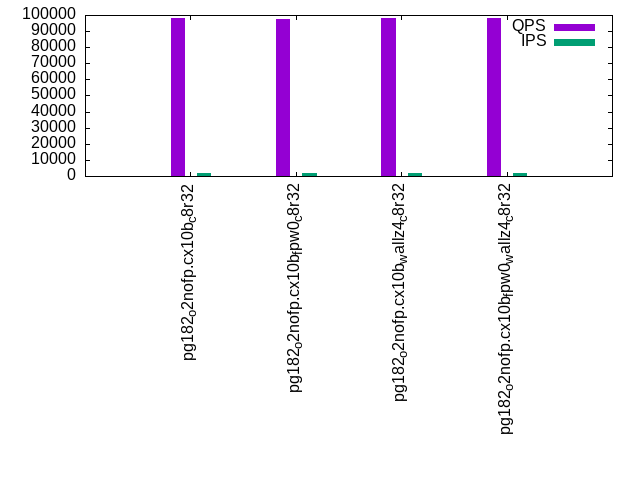
qr500.L3
qr500.L3: range queries with 500 insert/s per client. Graphs for performance per 1-second interval are here.
Average throughput:
Query response time histogram: each cell has the percentage of responses that take <= the time in the header and max is the max response time in seconds. For max values in the top 25% of the range have a red background and in the bottom 25% of the range have a green background. The red background is not used when the min value is within 80% of the max value.
| dbms | 256us | 1ms | 4ms | 16ms | 64ms | 256ms | 1s | 4s | 16s | gt | max |
|---|---|---|---|---|---|---|---|---|---|---|---|
| pg182_o2nofp.cx10b_c8r32 | 99.989 | 0.010 | nonzero | nonzero | 0.012 | ||||||
| pg182_o2nofp.cx10b_fpw0_c8r32 | 99.990 | 0.010 | nonzero | nonzero | 0.005 | ||||||
| pg182_o2nofp.cx10b_wallz4_c8r32 | 99.989 | 0.011 | nonzero | nonzero | 0.010 | ||||||
| pg182_o2nofp.cx10b_fpw0_wallz4_c8r32 | 99.988 | 0.012 | nonzero | 0.003 |
Insert response time histogram: each cell has the percentage of responses that take <= the time in the header and max is the max response time in seconds. For max values in the top 25% of the range have a red background and in the bottom 25% of the range have a green background. The red background is not used when the min value is within 80% of the max value.
| dbms | 256us | 1ms | 4ms | 16ms | 64ms | 256ms | 1s | 4s | 16s | gt | max |
|---|---|---|---|---|---|---|---|---|---|---|---|
| pg182_o2nofp.cx10b_c8r32 | 90.212 | 9.710 | 0.076 | 0.001 | 0.017 | ||||||
| pg182_o2nofp.cx10b_fpw0_c8r32 | 90.939 | 8.982 | 0.079 | 0.007 | |||||||
| pg182_o2nofp.cx10b_wallz4_c8r32 | 78.179 | 21.576 | 0.243 | 0.001 | 0.018 | ||||||
| pg182_o2nofp.cx10b_fpw0_wallz4_c8r32 | 91.497 | 8.471 | 0.032 | 0.008 |
Delete response time histogram: each cell has the percentage of responses that take <= the time in the header and max is the max response time in seconds. For max values in the top 25% of the range have a red background and in the bottom 25% of the range have a green background. The red background is not used when the min value is within 80% of the max value.
| dbms | 256us | 1ms | 4ms | 16ms | 64ms | 256ms | 1s | 4s | 16s | gt | max |
|---|---|---|---|---|---|---|---|---|---|---|---|
| pg182_o2nofp.cx10b_c8r32 | 0.264 | 71.756 | 27.831 | 0.150 | 0.014 | ||||||
| pg182_o2nofp.cx10b_fpw0_c8r32 | 0.172 | 66.119 | 33.443 | 0.265 | 0.008 | ||||||
| pg182_o2nofp.cx10b_wallz4_c8r32 | 0.094 | 63.346 | 36.367 | 0.193 | 0.013 | ||||||
| pg182_o2nofp.cx10b_fpw0_wallz4_c8r32 | 0.231 | 69.482 | 30.221 | 0.067 | 0.006 |
Performance metrics for the DBMS listed above. Some are normalized by throughput, others are not. Legend for results is here.
ips	qps	rps	rmbps	wps	wmbps	rpq	rkbpq	wpi	wkbpi	csps	cpups	cspq	cpupq	dbgb1	dbgb2	rss	maxop	p50	p99	tag
1996	98009	0	0.0	90.3	5.1	0.000	0.000	0.045	2.601	373232	42.8	3.808	35	11.0	48.3	0.2	0.012	24525	22797	pg182_o2nofp.cx10b_c8r32
1996	97470	0	0.0	70.3	2.9	0.000	0.000	0.035	1.486	371358	42.7	3.810	35	11.0	50.4	0.2	0.005	24494	23165	pg182_o2nofp.cx10b_fpw0_c8r32
1996	98191	0	0.0	83.3	4.2	0.000	0.000	0.042	2.180	373367	42.4	3.802	35	11.0	47.6	0.2	0.010	24861	23373	pg182_o2nofp.cx10b_wallz4_c8r32
1996	98271	0	0.0	69.9	2.9	0.000	0.000	0.035	1.483	374214	42.8	3.808	35	11.0	50.4	0.2	0.003	24669	23406	pg182_o2nofp.cx10b_fpw0_wallz4_c8r32
Average values from iostat.
r/s	rkB/s	rrqm/s	%rrqm	r_await	rareq-s	w/s	wkB/s	wrqm/s	%wrqm	w_await	wareq-s	d/s	dkB/s	drqm/s	%drqm	d_await	dareq-s	f/s	f_await	aqu-sz	%util
0.001	0.002	0.000	0.000	0.006	0.011	90.02	5151.5	2.262	2.286	0.577	56.09	0.096	1460.5	0.000	0.000	0.018	43.52	4.938	1.741	0.050	1.567		pg182_o2nofp.cx10b_c8r32
0.000	0.000	0.000	0.000	0.000	0.000	70.36	2966.4	1.636	2.830	0.594	51.45	0.015	191.8	0.000	0.000	0.002	36.89	3.042	1.768	0.038	1.132		pg182_o2nofp.cx10b_fpw0_c8r32
0.000	0.000	0.000	0.000	0.000	0.000	83.20	4328.4	2.030	2.403	0.577	54.06	0.074	1040.7	0.000	0.000	0.016	42.05	4.522	1.746	0.045	1.433		pg182_o2nofp.cx10b_wallz4_c8r32
0.000	0.000	0.000	0.000	0.000	0.000	69.99	2960.5	1.607	2.847	0.611	51.47	0.019	191.8	0.000	0.000	0.026	40.03	3.001	1.831	0.039	1.124		pg182_o2nofp.cx10b_fpw0_wallz4_c8r32
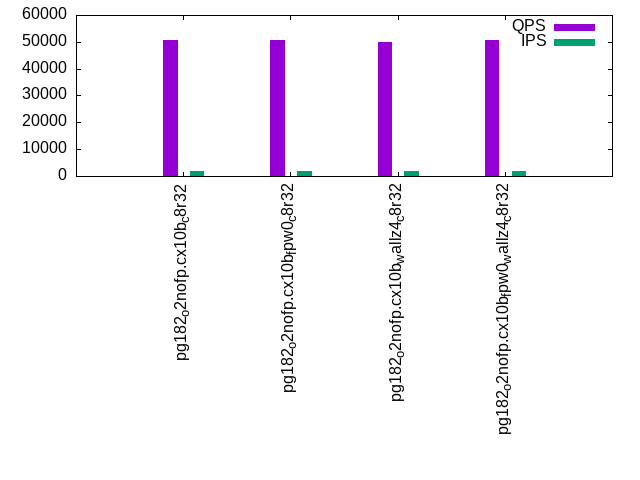
qp500.L4
qp500.L4: point queries with 500 insert/s per client. Graphs for performance per 1-second interval are here.
Average throughput:
Query response time histogram: each cell has the percentage of responses that take <= the time in the header and max is the max response time in seconds. For max values in the top 25% of the range have a red background and in the bottom 25% of the range have a green background. The red background is not used when the min value is within 80% of the max value.
| dbms | 256us | 1ms | 4ms | 16ms | 64ms | 256ms | 1s | 4s | 16s | gt | max |
|---|---|---|---|---|---|---|---|---|---|---|---|
| pg182_o2nofp.cx10b_c8r32 | 99.955 | 0.045 | nonzero | nonzero | 0.004 | ||||||
| pg182_o2nofp.cx10b_fpw0_c8r32 | 99.958 | 0.042 | nonzero | nonzero | 0.027 | ||||||
| pg182_o2nofp.cx10b_wallz4_c8r32 | 99.952 | 0.047 | nonzero | nonzero | 0.004 | ||||||
| pg182_o2nofp.cx10b_fpw0_wallz4_c8r32 | 99.952 | 0.048 | nonzero | nonzero | 0.004 |
Insert response time histogram: each cell has the percentage of responses that take <= the time in the header and max is the max response time in seconds. For max values in the top 25% of the range have a red background and in the bottom 25% of the range have a green background. The red background is not used when the min value is within 80% of the max value.
| dbms | 256us | 1ms | 4ms | 16ms | 64ms | 256ms | 1s | 4s | 16s | gt | max |
|---|---|---|---|---|---|---|---|---|---|---|---|
| pg182_o2nofp.cx10b_c8r32 | 88.731 | 11.153 | 0.117 | 0.010 | |||||||
| pg182_o2nofp.cx10b_fpw0_c8r32 | 89.496 | 10.463 | 0.042 | 0.008 | |||||||
| pg182_o2nofp.cx10b_wallz4_c8r32 | 79.676 | 20.143 | 0.181 | 0.009 | |||||||
| pg182_o2nofp.cx10b_fpw0_wallz4_c8r32 | 90.008 | 9.954 | 0.037 | 0.006 |
Delete response time histogram: each cell has the percentage of responses that take <= the time in the header and max is the max response time in seconds. For max values in the top 25% of the range have a red background and in the bottom 25% of the range have a green background. The red background is not used when the min value is within 80% of the max value.
| dbms | 256us | 1ms | 4ms | 16ms | 64ms | 256ms | 1s | 4s | 16s | gt | max |
|---|---|---|---|---|---|---|---|---|---|---|---|
| pg182_o2nofp.cx10b_c8r32 | 0.221 | 59.799 | 39.842 | 0.139 | 0.008 | ||||||
| pg182_o2nofp.cx10b_fpw0_c8r32 | 0.143 | 59.519 | 40.289 | 0.049 | 0.008 | ||||||
| pg182_o2nofp.cx10b_wallz4_c8r32 | 0.106 | 58.464 | 41.264 | 0.167 | 0.010 | ||||||
| pg182_o2nofp.cx10b_fpw0_wallz4_c8r32 | 0.175 | 61.301 | 38.458 | 0.065 | 0.007 |
Performance metrics for the DBMS listed above. Some are normalized by throughput, others are not. Legend for results is here.
ips	qps	rps	rmbps	wps	wmbps	rpq	rkbpq	wpi	wkbpi	csps	cpups	cspq	cpupq	dbgb1	dbgb2	rss	maxop	p50	p99	tag
1997	50723	0	0.0	59.3	5.5	0.000	0.000	0.030	2.814	195160	46.3	3.848	73	11.0	44.7	0.3	0.004	12719	12255	pg182_o2nofp.cx10b_c8r32
1997	50580	0	0.0	44.2	3.9	0.000	0.000	0.022	2.003	194369	46.0	3.843	73	10.9	48.7	10.7	0.027	12686	12511	pg182_o2nofp.cx10b_fpw0_c8r32
1997	50070	0	0.0	54.5	4.9	0.000	0.000	0.027	2.526	192490	45.5	3.844	73	11.0	44.1	0.3	0.004	12591	12223	pg182_o2nofp.cx10b_wallz4_c8r32
1997	50544	0	0.0	44.3	3.9	0.000	0.000	0.022	2.004	194355	45.8	3.845	72	11.0	48.7	0.3	0.004	12671	12447	pg182_o2nofp.cx10b_fpw0_wallz4_c8r32
Average values from iostat.
r/s	rkB/s	rrqm/s	%rrqm	r_await	rareq-s	w/s	wkB/s	wrqm/s	%wrqm	w_await	wareq-s	d/s	dkB/s	drqm/s	%drqm	d_await	dareq-s	f/s	f_await	aqu-sz	%util
0.000	0.000	0.000	0.000	0.000	0.000	58.95	5578.0	2.364	2.389	0.448	93.89	0.138	2117.7	0.000	0.000	0.004	43.05	5.002	1.836	0.030	1.371		pg182_o2nofp.cx10b_c8r32
0.000	0.000	0.000	0.000	0.000	0.000	44.22	3999.2	1.555	2.804	0.414	93.11	0.065	1007.0	0.000	0.000	0.010	108.6	3.544	1.879	0.020	1.094		pg182_o2nofp.cx10b_fpw0_c8r32
0.000	0.000	0.000	0.000	0.000	0.000	54.32	5026.4	2.334	2.960	0.418	92.72	0.132	2044.7	0.000	0.000	0.007	86.59	4.776	1.821	0.026	1.329		pg182_o2nofp.cx10b_wallz4_c8r32
0.000	0.000	0.000	0.000	0.000	0.000	44.31	4001.7	1.594	2.896	0.429	93.21	0.065	985.9	0.000	0.000	0.005	42.51	3.572	1.922	0.020	1.071		pg182_o2nofp.cx10b_fpw0_wallz4_c8r32
qr1000.L5
qr1000.L5: range queries with 1000 insert/s per client. Graphs for performance per 1-second interval are here.
Average throughput:
Query response time histogram: each cell has the percentage of responses that take <= the time in the header and max is the max response time in seconds. For max values in the top 25% of the range have a red background and in the bottom 25% of the range have a green background. The red background is not used when the min value is within 80% of the max value.
| dbms | 256us | 1ms | 4ms | 16ms | 64ms | 256ms | 1s | 4s | 16s | gt | max |
|---|---|---|---|---|---|---|---|---|---|---|---|
| pg182_o2nofp.cx10b_c8r32 | 99.984 | 0.015 | nonzero | nonzero | nonzero | 0.023 | |||||
| pg182_o2nofp.cx10b_fpw0_c8r32 | 99.985 | 0.015 | nonzero | nonzero | nonzero | 0.023 | |||||
| pg182_o2nofp.cx10b_wallz4_c8r32 | 99.983 | 0.017 | nonzero | nonzero | 0.004 | ||||||
| pg182_o2nofp.cx10b_fpw0_wallz4_c8r32 | 99.983 | 0.016 | nonzero | nonzero | nonzero | 0.023 |
Insert response time histogram: each cell has the percentage of responses that take <= the time in the header and max is the max response time in seconds. For max values in the top 25% of the range have a red background and in the bottom 25% of the range have a green background. The red background is not used when the min value is within 80% of the max value.
| dbms | 256us | 1ms | 4ms | 16ms | 64ms | 256ms | 1s | 4s | 16s | gt | max |
|---|---|---|---|---|---|---|---|---|---|---|---|
| pg182_o2nofp.cx10b_c8r32 | 88.835 | 10.969 | 0.197 | 0.013 | |||||||
| pg182_o2nofp.cx10b_fpw0_c8r32 | 90.018 | 9.881 | 0.101 | 0.008 | |||||||
| pg182_o2nofp.cx10b_wallz4_c8r32 | 83.618 | 16.162 | 0.219 | 0.009 | |||||||
| pg182_o2nofp.cx10b_fpw0_wallz4_c8r32 | 89.721 | 10.172 | 0.107 | 0.007 |
Delete response time histogram: each cell has the percentage of responses that take <= the time in the header and max is the max response time in seconds. For max values in the top 25% of the range have a red background and in the bottom 25% of the range have a green background. The red background is not used when the min value is within 80% of the max value.
| dbms | 256us | 1ms | 4ms | 16ms | 64ms | 256ms | 1s | 4s | 16s | gt | max |
|---|---|---|---|---|---|---|---|---|---|---|---|
| pg182_o2nofp.cx10b_c8r32 | 0.134 | 70.971 | 28.495 | 0.400 | 0.016 | ||||||
| pg182_o2nofp.cx10b_fpw0_c8r32 | 0.065 | 68.130 | 31.595 | 0.210 | 0.009 | ||||||
| pg182_o2nofp.cx10b_wallz4_c8r32 | 0.039 | 62.701 | 36.975 | 0.285 | 0.012 | ||||||
| pg182_o2nofp.cx10b_fpw0_wallz4_c8r32 | 0.103 | 67.460 | 32.255 | 0.182 | 0.008 |
Performance metrics for the DBMS listed above. Some are normalized by throughput, others are not. Legend for results is here.
ips	qps	rps	rmbps	wps	wmbps	rpq	rkbpq	wpi	wkbpi	csps	cpups	cspq	cpupq	dbgb1	dbgb2	rss	maxop	p50	p99	tag
3993	97230	0	0.0	72.4	7.0	0.000	0.000	0.018	1.805	369189	44.4	3.797	37	11.0	42.3	0.4	0.023	24382	21086	pg182_o2nofp.cx10b_c8r32
3993	96304	0	0.0	50.6	4.8	0.000	0.000	0.013	1.233	365898	44.3	3.799	37	11.0	46.9	0.4	0.023	24349	21342	pg182_o2nofp.cx10b_fpw0_c8r32
3993	96979	0	0.0	64.6	6.2	0.000	0.000	0.016	1.585	368271	44.0	3.797	36	11.0	40.7	0.3	0.004	24397	20764	pg182_o2nofp.cx10b_wallz4_c8r32
3993	96786	0	0.0	50.8	4.8	0.000	0.000	0.013	1.234	367744	44.3	3.800	37	11.0	47.0	7.0	0.023	24317	21150	pg182_o2nofp.cx10b_fpw0_wallz4_c8r32
Average values from iostat.
r/s	rkB/s	rrqm/s	%rrqm	r_await	rareq-s	w/s	wkB/s	wrqm/s	%wrqm	w_await	wareq-s	d/s	dkB/s	drqm/s	%drqm	d_await	dareq-s	f/s	f_await	aqu-sz	%util
0.000	0.000	0.000	0.000	0.000	0.000	72.06	7168.2	2.480	2.454	0.380	100.2	0.095	1428.8	0.000	0.000	0.008	153.8	6.486	1.751	0.037	1.625		pg182_o2nofp.cx10b_c8r32
0.000	0.000	0.000	0.000	0.000	0.000	50.63	4927.3	1.850	2.928	0.391	101.5	0.071	1041.2	0.000	0.000	0.010	131.5	3.948	1.787	0.023	1.081		pg182_o2nofp.cx10b_fpw0_c8r32
0.000	0.000	0.000	0.000	0.000	0.000	64.45	6308.6	2.424	2.673	0.370	99.96	0.133	1990.0	0.000	0.000	0.005	84.01	5.807	1.755	0.032	1.469		pg182_o2nofp.cx10b_wallz4_c8r32
0.000	0.000	0.000	0.000	0.000	0.000	50.78	4928.6	1.904	3.025	0.381	101.7	0.067	1043.2	0.000	0.000	0.007	101.8	3.932	1.764	0.022	1.064		pg182_o2nofp.cx10b_fpw0_wallz4_c8r32
qp1000.L6
qp1000.L6: point queries with 1000 insert/s per client. Graphs for performance per 1-second interval are here.
Average throughput:
Query response time histogram: each cell has the percentage of responses that take <= the time in the header and max is the max response time in seconds. For max values in the top 25% of the range have a red background and in the bottom 25% of the range have a green background. The red background is not used when the min value is within 80% of the max value.
| dbms | 256us | 1ms | 4ms | 16ms | 64ms | 256ms | 1s | 4s | 16s | gt | max |
|---|---|---|---|---|---|---|---|---|---|---|---|
| pg182_o2nofp.cx10b_c8r32 | 99.947 | 0.053 | 0.001 | nonzero | nonzero | 0.030 | |||||
| pg182_o2nofp.cx10b_fpw0_c8r32 | 99.947 | 0.052 | nonzero | nonzero | nonzero | 0.023 | |||||
| pg182_o2nofp.cx10b_wallz4_c8r32 | 99.941 | 0.058 | 0.001 | nonzero | nonzero | 0.019 | |||||
| pg182_o2nofp.cx10b_fpw0_wallz4_c8r32 | 99.941 | 0.059 | 0.001 | nonzero | nonzero | 0.023 |
Insert response time histogram: each cell has the percentage of responses that take <= the time in the header and max is the max response time in seconds. For max values in the top 25% of the range have a red background and in the bottom 25% of the range have a green background. The red background is not used when the min value is within 80% of the max value.
| dbms | 256us | 1ms | 4ms | 16ms | 64ms | 256ms | 1s | 4s | 16s | gt | max |
|---|---|---|---|---|---|---|---|---|---|---|---|
| pg182_o2nofp.cx10b_c8r32 | 85.986 | 13.894 | 0.119 | 0.001 | 0.022 | ||||||
| pg182_o2nofp.cx10b_fpw0_c8r32 | 86.851 | 13.106 | 0.043 | 0.010 | |||||||
| pg182_o2nofp.cx10b_wallz4_c8r32 | 84.118 | 15.736 | 0.144 | 0.001 | 0.016 | ||||||
| pg182_o2nofp.cx10b_fpw0_wallz4_c8r32 | 84.319 | 15.626 | 0.055 | 0.007 |
Delete response time histogram: each cell has the percentage of responses that take <= the time in the header and max is the max response time in seconds. For max values in the top 25% of the range have a red background and in the bottom 25% of the range have a green background. The red background is not used when the min value is within 80% of the max value.
| dbms | 256us | 1ms | 4ms | 16ms | 64ms | 256ms | 1s | 4s | 16s | gt | max |
|---|---|---|---|---|---|---|---|---|---|---|---|
| pg182_o2nofp.cx10b_c8r32 | 0.112 | 53.117 | 46.541 | 0.228 | 0.001 | 0.018 | |||||
| pg182_o2nofp.cx10b_fpw0_c8r32 | 0.079 | 58.020 | 41.859 | 0.042 | 0.007 | ||||||
| pg182_o2nofp.cx10b_wallz4_c8r32 | 0.049 | 55.682 | 44.109 | 0.160 | 0.001 | 0.016 | |||||
| pg182_o2nofp.cx10b_fpw0_wallz4_c8r32 | 0.086 | 56.312 | 43.528 | 0.073 | 0.007 |
Performance metrics for the DBMS listed above. Some are normalized by throughput, others are not. Legend for results is here.
ips	qps	rps	rmbps	wps	wmbps	rpq	rkbpq	wpi	wkbpi	csps	cpups	cspq	cpupq	dbgb1	dbgb2	rss	maxop	p50	p99	tag
3993	50086	0	0.0	71.3	7.1	0.000	0.000	0.018	1.827	192360	47.4	3.841	76	11.0	40.6	0.4	0.030	12575	11791	pg182_o2nofp.cx10b_c8r32
3991	49960	0	0.0	51.9	5.1	0.000	0.000	0.013	1.315	192022	47.0	3.844	75	11.0	43.5	6.8	0.023	12591	11759	pg182_o2nofp.cx10b_fpw0_c8r32
3991	49518	0	0.0	65.5	6.5	0.000	0.000	0.016	1.666	190324	46.9	3.844	76	11.0	38.9	8.8	0.019	12463	11391	pg182_o2nofp.cx10b_wallz4_c8r32
3991	49957	0	0.0	52.0	5.1	0.000	0.000	0.013	1.319	191806	46.9	3.839	75	11.0	43.5	0.9	0.023	12575	11743	pg182_o2nofp.cx10b_fpw0_wallz4_c8r32
Average values from iostat.
r/s	rkB/s	rrqm/s	%rrqm	r_await	rareq-s	w/s	wkB/s	wrqm/s	%wrqm	w_await	wareq-s	d/s	dkB/s	drqm/s	%drqm	d_await	dareq-s	f/s	f_await	aqu-sz	%util
0.000	0.000	0.000	0.000	0.000	0.000	71.23	7288.1	2.618	2.462	0.397	101.3	0.068	1034.8	0.000	0.000	0.007	122.3	6.149	1.769	0.037	1.605		pg182_o2nofp.cx10b_c8r32
0.000	0.000	0.000	0.000	0.000	0.000	51.96	5251.0	2.313	2.786	0.401	102.9	0.135	2030.1	0.000	0.000	0.008	151.3	4.177	1.804	0.024	1.192		pg182_o2nofp.cx10b_fpw0_c8r32
0.000	0.000	0.000	0.000	0.000	0.000	65.51	6652.2	2.506	2.601	0.384	101.2	0.076	1090.9	0.000	0.000	0.006	78.13	5.806	1.769	0.033	1.543		pg182_o2nofp.cx10b_wallz4_c8r32
0.000	0.000	0.000	0.000	0.000	0.000	51.99	5267.6	2.439	3.080	0.397	103.4	0.133	2036.7	0.000	0.000	0.004	146.7	4.110	1.771	0.023	1.110		pg182_o2nofp.cx10b_fpw0_wallz4_c8r32
l.i0
l.i0: load without secondary indexes
Performance metrics for all DBMS, not just the ones listed above. Some are normalized by throughput, others are not. Legend for results is here.
ips	qps	rps	rmbps	wps	wmbps	rpq	rkbpq	wpi	wkbpi	csps	cpups	cspq	cpupq	dbgb1	dbgb2	rss	maxop	p50	p99	tag
563380	0	1	0.0	1995.3	227.8	0.000	0.000	0.004	0.414	52176	59.2	0.093	8	3.8	10.4	0.3	0.006	168283	151585	pg182_o2nofp.cx10b_c8r32
563380	0	1	0.0	1998.8	228.2	0.000	0.000	0.004	0.415	51834	59.1	0.092	8	3.8	10.4	0.3	0.005	171085	153672	pg182_o2nofp.cx10b_fpw0_c8r32
571428	0	1	0.0	2009.4	229.2	0.000	0.000	0.004	0.411	51870	59.2	0.091	8	3.8	10.4	0.3	0.005	170784	142772	pg182_o2nofp.cx10b_wallz4_c8r32
571428	0	1	0.0	1999.3	228.3	0.000	0.000	0.003	0.409	51764	59.3	0.091	8	3.8	10.4	0.3	0.005	168682	153584	pg182_o2nofp.cx10b_fpw0_wallz4_c8r32
l.x
l.x: create secondary indexes
Performance metrics for all DBMS, not just the ones listed above. Some are normalized by throughput, others are not. Legend for results is here.
ips	qps	rps	rmbps	wps	wmbps	rpq	rkbpq	wpi	wkbpi	csps	cpups	cspq	cpupq	dbgb1	dbgb2	rss	maxop	p50	p99	tag
1481485	0	2	0.0	3617.6	444.0	0.000	0.000	0.002	0.307	7608	32.0	0.005	2	7.7	17.7	0.0	0.002	NA	NA	pg182_o2nofp.cx10b_c8r32
1538465	0	2	0.0	3605.4	441.9	0.000	0.000	0.002	0.294	7774	32.5	0.005	2	7.7	17.7	0.0	0.002	NA	NA	pg182_o2nofp.cx10b_fpw0_c8r32
1600004	0	2	0.0	3283.2	403.5	0.000	0.000	0.002	0.258	5186	33.5	0.003	2	7.7	16.3	0.0	0.002	NA	NA	pg182_o2nofp.cx10b_wallz4_c8r32
1538465	0	2	0.0	3131.8	384.3	0.000	0.000	0.002	0.256	5250	33.3	0.003	2	7.7	16.3	0.0	0.002	NA	NA	pg182_o2nofp.cx10b_fpw0_wallz4_c8r32
l.i1
l.i1: continue load after secondary indexes created with 50 inserts per transaction
Performance metrics for all DBMS, not just the ones listed above. Some are normalized by throughput, others are not. Legend for results is here.
ips	qps	rps	rmbps	wps	wmbps	rpq	rkbpq	wpi	wkbpi	csps	cpups	cspq	cpupq	dbgb1	dbgb2	rss	maxop	p50	p99	tag
127744	0	1	0.0	1689.5	186.4	0.000	0.000	0.013	1.494	37184	81.7	0.291	51	10.8	50.9	6.3	0.059	29397	6448	pg182_o2nofp.cx10b_c8r32
130879	0	0	0.0	1475.6	162.2	0.000	0.000	0.011	1.269	37720	82.4	0.288	50	10.8	50.8	10.8	0.043	30147	14637	pg182_o2nofp.cx10b_fpw0_c8r32
129032	0	0	0.0	1601.9	176.4	0.000	0.000	0.012	1.400	36979	82.3	0.287	51	10.8	50.9	9.0	0.060	29847	13994	pg182_o2nofp.cx10b_wallz4_c8r32
127744	0	1	0.0	1448.6	160.3	0.000	0.000	0.011	1.285	37425	80.9	0.293	51	10.8	50.7	10.2	0.042	31297	13446	pg182_o2nofp.cx10b_fpw0_wallz4_c8r32
l.i2
l.i2: continue load after secondary indexes created with 5 inserts per transaction
Performance metrics for all DBMS, not just the ones listed above. Some are normalized by throughput, others are not. Legend for results is here.
ips	qps	rps	rmbps	wps	wmbps	rpq	rkbpq	wpi	wkbpi	csps	cpups	cspq	cpupq	dbgb1	dbgb2	rss	maxop	p50	p99	tag
23880	0	0	0.0	212.6	22.3	0.000	0.000	0.009	0.955	84123	63.5	3.523	213	10.9	50.9	0.3	0.017	4510	2130	pg182_o2nofp.cx10b_c8r32
25157	0	0	0.0	165.4	18.8	0.000	0.000	0.007	0.766	88387	65.6	3.513	209	10.9	50.9	0.6	0.006	5289	3349	pg182_o2nofp.cx10b_fpw0_c8r32
25039	0	0	0.0	190.8	21.5	0.000	0.000	0.008	0.879	88339	64.8	3.528	207	10.9	50.9	10.6	0.018	4684	3110	pg182_o2nofp.cx10b_wallz4_c8r32
23392	0	0	0.0	155.5	16.8	0.000	0.000	0.007	0.736	83405	61.8	3.566	211	10.9	50.9	0.8	0.004	5100	3220	pg182_o2nofp.cx10b_fpw0_wallz4_c8r32
qr100.L1
qr100.L1: range queries with 100 insert/s per client
Performance metrics for all DBMS, not just the ones listed above. Some are normalized by throughput, others are not. Legend for results is here.
ips	qps	rps	rmbps	wps	wmbps	rpq	rkbpq	wpi	wkbpi	csps	cpups	cspq	cpupq	dbgb1	dbgb2	rss	maxop	p50	p99	tag
399	101796	0	0.0	21.7	1.7	0.000	0.000	0.054	4.424	388287	41.4	3.814	33	10.9	50.9	0.2	0.002	25501	24941	pg182_o2nofp.cx10b_c8r32
399	101756	0	0.0	8.7	0.3	0.000	0.000	0.022	0.812	388054	41.4	3.814	33	10.9	50.9	0.2	0.001	25469	24413	pg182_o2nofp.cx10b_fpw0_c8r32
399	102176	0	0.0	17.0	1.2	0.000	0.000	0.042	3.176	389673	41.1	3.814	32	10.9	50.9	0.2	0.001	25549	24989	pg182_o2nofp.cx10b_wallz4_c8r32
399	102235	0	0.0	8.5	0.3	0.000	0.000	0.021	0.804	390103	41.5	3.816	32	10.9	50.9	0.2	0.001	25661	25053	pg182_o2nofp.cx10b_fpw0_wallz4_c8r32
qp100.L2
qp100.L2: point queries with 100 insert/s per client
Performance metrics for all DBMS, not just the ones listed above. Some are normalized by throughput, others are not. Legend for results is here.
ips	qps	rps	rmbps	wps	wmbps	rpq	rkbpq	wpi	wkbpi	csps	cpups	cspq	cpupq	dbgb1	dbgb2	rss	maxop	p50	p99	tag
399	50972	0	0.0	56.0	3.6	0.000	0.000	0.140	9.178	196467	45.1	3.854	71	10.9	50.7	0.2	0.002	12815	12735	pg182_o2nofp.cx10b_c8r32
399	50787	0	0.0	44.4	2.3	0.000	0.000	0.111	6.020	195718	44.7	3.854	70	10.9	50.6	0.3	0.001	12751	12687	pg182_o2nofp.cx10b_fpw0_c8r32
399	50522	0	0.0	51.8	3.2	0.000	0.000	0.130	8.149	194742	44.7	3.855	71	10.9	49.3	0.2	0.003	12751	12670	pg182_o2nofp.cx10b_wallz4_c8r32
399	50680	0	0.0	44.4	2.3	0.000	0.000	0.111	6.012	195345	44.5	3.854	70	10.9	50.6	0.2	0.001	12734	12655	pg182_o2nofp.cx10b_fpw0_wallz4_c8r32
qr500.L3
qr500.L3: range queries with 500 insert/s per client
Performance metrics for all DBMS, not just the ones listed above. Some are normalized by throughput, others are not. Legend for results is here.
ips	qps	rps	rmbps	wps	wmbps	rpq	rkbpq	wpi	wkbpi	csps	cpups	cspq	cpupq	dbgb1	dbgb2	rss	maxop	p50	p99	tag
1996	98009	0	0.0	90.3	5.1	0.000	0.000	0.045	2.601	373232	42.8	3.808	35	11.0	48.3	0.2	0.012	24525	22797	pg182_o2nofp.cx10b_c8r32
1996	97470	0	0.0	70.3	2.9	0.000	0.000	0.035	1.486	371358	42.7	3.810	35	11.0	50.4	0.2	0.005	24494	23165	pg182_o2nofp.cx10b_fpw0_c8r32
1996	98191	0	0.0	83.3	4.2	0.000	0.000	0.042	2.180	373367	42.4	3.802	35	11.0	47.6	0.2	0.010	24861	23373	pg182_o2nofp.cx10b_wallz4_c8r32
1996	98271	0	0.0	69.9	2.9	0.000	0.000	0.035	1.483	374214	42.8	3.808	35	11.0	50.4	0.2	0.003	24669	23406	pg182_o2nofp.cx10b_fpw0_wallz4_c8r32
qp500.L4
qp500.L4: point queries with 500 insert/s per client
Performance metrics for all DBMS, not just the ones listed above. Some are normalized by throughput, others are not. Legend for results is here.
ips	qps	rps	rmbps	wps	wmbps	rpq	rkbpq	wpi	wkbpi	csps	cpups	cspq	cpupq	dbgb1	dbgb2	rss	maxop	p50	p99	tag
1997	50723	0	0.0	59.3	5.5	0.000	0.000	0.030	2.814	195160	46.3	3.848	73	11.0	44.7	0.3	0.004	12719	12255	pg182_o2nofp.cx10b_c8r32
1997	50580	0	0.0	44.2	3.9	0.000	0.000	0.022	2.003	194369	46.0	3.843	73	10.9	48.7	10.7	0.027	12686	12511	pg182_o2nofp.cx10b_fpw0_c8r32
1997	50070	0	0.0	54.5	4.9	0.000	0.000	0.027	2.526	192490	45.5	3.844	73	11.0	44.1	0.3	0.004	12591	12223	pg182_o2nofp.cx10b_wallz4_c8r32
1997	50544	0	0.0	44.3	3.9	0.000	0.000	0.022	2.004	194355	45.8	3.845	72	11.0	48.7	0.3	0.004	12671	12447	pg182_o2nofp.cx10b_fpw0_wallz4_c8r32
qr1000.L5
qr1000.L5: range queries with 1000 insert/s per client
Performance metrics for all DBMS, not just the ones listed above. Some are normalized by throughput, others are not. Legend for results is here.
ips	qps	rps	rmbps	wps	wmbps	rpq	rkbpq	wpi	wkbpi	csps	cpups	cspq	cpupq	dbgb1	dbgb2	rss	maxop	p50	p99	tag
3993	97230	0	0.0	72.4	7.0	0.000	0.000	0.018	1.805	369189	44.4	3.797	37	11.0	42.3	0.4	0.023	24382	21086	pg182_o2nofp.cx10b_c8r32
3993	96304	0	0.0	50.6	4.8	0.000	0.000	0.013	1.233	365898	44.3	3.799	37	11.0	46.9	0.4	0.023	24349	21342	pg182_o2nofp.cx10b_fpw0_c8r32
3993	96979	0	0.0	64.6	6.2	0.000	0.000	0.016	1.585	368271	44.0	3.797	36	11.0	40.7	0.3	0.004	24397	20764	pg182_o2nofp.cx10b_wallz4_c8r32
3993	96786	0	0.0	50.8	4.8	0.000	0.000	0.013	1.234	367744	44.3	3.800	37	11.0	47.0	7.0	0.023	24317	21150	pg182_o2nofp.cx10b_fpw0_wallz4_c8r32
qp1000.L6
qp1000.L6: point queries with 1000 insert/s per client
Performance metrics for all DBMS, not just the ones listed above. Some are normalized by throughput, others are not. Legend for results is here.
ips	qps	rps	rmbps	wps	wmbps	rpq	rkbpq	wpi	wkbpi	csps	cpups	cspq	cpupq	dbgb1	dbgb2	rss	maxop	p50	p99	tag
3993	50086	0	0.0	71.3	7.1	0.000	0.000	0.018	1.827	192360	47.4	3.841	76	11.0	40.6	0.4	0.030	12575	11791	pg182_o2nofp.cx10b_c8r32
3991	49960	0	0.0	51.9	5.1	0.000	0.000	0.013	1.315	192022	47.0	3.844	75	11.0	43.5	6.8	0.023	12591	11759	pg182_o2nofp.cx10b_fpw0_c8r32
3991	49518	0	0.0	65.5	6.5	0.000	0.000	0.016	1.666	190324	46.9	3.844	76	11.0	38.9	8.8	0.019	12463	11391	pg182_o2nofp.cx10b_wallz4_c8r32
3991	49957	0	0.0	52.0	5.1	0.000	0.000	0.013	1.319	191806	46.9	3.839	75	11.0	43.5	0.9	0.023	12575	11743	pg182_o2nofp.cx10b_fpw0_wallz4_c8r32
l.i0
- l.i0: load without secondary indexes
- Legend for results is here.
- Each entry lists the percentage of responses that fit in that bucket (slower than max time for previous bucket, faster than min time for next bucket).
Insert response time histogram
256us	1ms	4ms	16ms	64ms	256ms	1s	4s	16s	gt	max	tag
0.000	97.462	2.535	0.003	0.000	0.000	0.000	0.000	0.000	0.000	0.006	pg182_o2nofp.cx10b_c8r32
0.000	97.617	2.382	0.001	0.000	0.000	0.000	0.000	0.000	0.000	0.005	pg182_o2nofp.cx10b_fpw0_c8r32
0.000	97.564	2.434	0.002	0.000	0.000	0.000	0.000	0.000	0.000	0.005	pg182_o2nofp.cx10b_wallz4_c8r32
0.000	97.586	2.412	0.003	0.000	0.000	0.000	0.000	0.000	0.000	0.005	pg182_o2nofp.cx10b_fpw0_wallz4_c8r32
l.x
- l.x: create secondary indexes
- Legend for results is here.
- Each entry lists the percentage of responses that fit in that bucket (slower than max time for previous bucket, faster than min time for next bucket).
TODO - determine whether there is data for create index response time
l.i1
- l.i1: continue load after secondary indexes created with 50 inserts per transaction
- Legend for results is here.
- Each entry lists the percentage of responses that fit in that bucket (slower than max time for previous bucket, faster than min time for next bucket).
Insert response time histogram
256us	1ms	4ms	16ms	64ms	256ms	1s	4s	16s	gt	max	tag
0.000	68.852	31.056	0.059	0.033	0.000	0.000	0.000	0.000	0.000	0.059	pg182_o2nofp.cx10b_c8r32
0.000	67.983	31.954	0.062	0.001	0.000	0.000	0.000	0.000	0.000	0.043	pg182_o2nofp.cx10b_fpw0_c8r32
0.000	68.324	31.601	0.057	0.018	0.000	0.000	0.000	0.000	0.000	0.060	pg182_o2nofp.cx10b_wallz4_c8r32
0.000	70.488	29.468	0.043	0.001	0.000	0.000	0.000	0.000	0.000	0.042	pg182_o2nofp.cx10b_fpw0_wallz4_c8r32
Delete response time histogram
256us	1ms	4ms	16ms	64ms	256ms	1s	4s	16s	gt	max	tag
0.006	42.328	57.285	0.342	0.040	nonzero	0.000	0.000	0.000	0.000	0.066	pg182_o2nofp.cx10b_c8r32
0.004	38.406	61.461	0.128	0.001	0.000	0.000	0.000	0.000	0.000	0.024	pg182_o2nofp.cx10b_fpw0_c8r32
0.003	42.241	57.527	0.212	0.018	0.000	0.000	0.000	0.000	0.000	0.047	pg182_o2nofp.cx10b_wallz4_c8r32
0.006	43.741	56.009	0.243	nonzero	0.000	0.000	0.000	0.000	0.000	0.040	pg182_o2nofp.cx10b_fpw0_wallz4_c8r32
l.i2
- l.i2: continue load after secondary indexes created with 5 inserts per transaction
- Legend for results is here.
- Each entry lists the percentage of responses that fit in that bucket (slower than max time for previous bucket, faster than min time for next bucket).
Insert response time histogram
256us	1ms	4ms	16ms	64ms	256ms	1s	4s	16s	gt	max	tag
97.089	2.893	0.018	0.000	nonzero	0.000	0.000	0.000	0.000	0.000	0.017	pg182_o2nofp.cx10b_c8r32
97.691	2.294	0.016	nonzero	0.000	0.000	0.000	0.000	0.000	0.000	0.006	pg182_o2nofp.cx10b_fpw0_c8r32
97.537	2.446	0.017	nonzero	nonzero	0.000	0.000	0.000	0.000	0.000	0.018	pg182_o2nofp.cx10b_wallz4_c8r32
97.377	2.609	0.013	0.000	0.000	0.000	0.000	0.000	0.000	0.000	0.004	pg182_o2nofp.cx10b_fpw0_wallz4_c8r32
Delete response time histogram
256us	1ms	4ms	16ms	64ms	256ms	1s	4s	16s	gt	max	tag
7.975	60.174	31.850	nonzero	nonzero	0.000	0.000	0.000	0.000	0.000	0.017	pg182_o2nofp.cx10b_c8r32
7.206	62.992	29.801	nonzero	0.000	0.000	0.000	0.000	0.000	0.000	0.007	pg182_o2nofp.cx10b_fpw0_c8r32
7.032	62.131	30.837	nonzero	nonzero	0.000	0.000	0.000	0.000	0.000	0.018	pg182_o2nofp.cx10b_wallz4_c8r32
7.309	66.585	26.105	0.001	0.000	0.000	0.000	0.000	0.000	0.000	0.010	pg182_o2nofp.cx10b_fpw0_wallz4_c8r32
qr100.L1
- qr100.L1: range queries with 100 insert/s per client
- Legend for results is here.
- Each entry lists the percentage of responses that fit in that bucket (slower than max time for previous bucket, faster than min time for next bucket).
Query response time histogram
256us	1ms	4ms	16ms	64ms	256ms	1s	4s	16s	gt	max	tag
99.993	0.007	nonzero	0.000	0.000	0.000	0.000	0.000	0.000	0.000	0.002	pg182_o2nofp.cx10b_c8r32
99.994	0.006	0.000	0.000	0.000	0.000	0.000	0.000	0.000	0.000	0.001	pg182_o2nofp.cx10b_fpw0_c8r32
99.994	0.006	nonzero	0.000	0.000	0.000	0.000	0.000	0.000	0.000	0.001	pg182_o2nofp.cx10b_wallz4_c8r32
99.993	0.007	nonzero	0.000	0.000	0.000	0.000	0.000	0.000	0.000	0.001	pg182_o2nofp.cx10b_fpw0_wallz4_c8r32
Insert response time histogram
256us	1ms	4ms	16ms	64ms	256ms	1s	4s	16s	gt	max	tag
0.000	74.299	25.674	0.028	0.000	0.000	0.000	0.000	0.000	0.000	0.004	pg182_o2nofp.cx10b_c8r32
0.000	87.028	12.965	0.007	0.000	0.000	0.000	0.000	0.000	0.000	0.004	pg182_o2nofp.cx10b_fpw0_c8r32
0.000	31.167	68.778	0.056	0.000	0.000	0.000	0.000	0.000	0.000	0.006	pg182_o2nofp.cx10b_wallz4_c8r32
0.000	85.903	14.076	0.021	0.000	0.000	0.000	0.000	0.000	0.000	0.004	pg182_o2nofp.cx10b_fpw0_wallz4_c8r32
Delete response time histogram
256us	1ms	4ms	16ms	64ms	256ms	1s	4s	16s	gt	max	tag
0.000	98.493	1.507	0.000	0.000	0.000	0.000	0.000	0.000	0.000	0.002	pg182_o2nofp.cx10b_c8r32
0.028	99.104	0.868	0.000	0.000	0.000	0.000	0.000	0.000	0.000	0.002	pg182_o2nofp.cx10b_fpw0_c8r32
0.000	97.951	2.049	0.000	0.000	0.000	0.000	0.000	0.000	0.000	0.003	pg182_o2nofp.cx10b_wallz4_c8r32
0.014	98.896	1.090	0.000	0.000	0.000	0.000	0.000	0.000	0.000	0.003	pg182_o2nofp.cx10b_fpw0_wallz4_c8r32
qp100.L2
- qp100.L2: point queries with 100 insert/s per client
- Legend for results is here.
- Each entry lists the percentage of responses that fit in that bucket (slower than max time for previous bucket, faster than min time for next bucket).
Query response time histogram
256us	1ms	4ms	16ms	64ms	256ms	1s	4s	16s	gt	max	tag
99.959	0.041	nonzero	0.000	0.000	0.000	0.000	0.000	0.000	0.000	0.002	pg182_o2nofp.cx10b_c8r32
99.964	0.036	nonzero	0.000	0.000	0.000	0.000	0.000	0.000	0.000	0.001	pg182_o2nofp.cx10b_fpw0_c8r32
99.960	0.040	nonzero	0.000	0.000	0.000	0.000	0.000	0.000	0.000	0.003	pg182_o2nofp.cx10b_wallz4_c8r32
99.957	0.043	nonzero	0.000	0.000	0.000	0.000	0.000	0.000	0.000	0.001	pg182_o2nofp.cx10b_fpw0_wallz4_c8r32
Insert response time histogram
256us	1ms	4ms	16ms	64ms	256ms	1s	4s	16s	gt	max	tag
0.000	60.535	39.424	0.042	0.000	0.000	0.000	0.000	0.000	0.000	0.005	pg182_o2nofp.cx10b_c8r32
0.000	72.181	27.806	0.014	0.000	0.000	0.000	0.000	0.000	0.000	0.005	pg182_o2nofp.cx10b_fpw0_c8r32
0.000	21.799	78.146	0.056	0.000	0.000	0.000	0.000	0.000	0.000	0.005	pg182_o2nofp.cx10b_wallz4_c8r32
0.000	73.417	26.556	0.028	0.000	0.000	0.000	0.000	0.000	0.000	0.004	pg182_o2nofp.cx10b_fpw0_wallz4_c8r32
Delete response time histogram
256us	1ms	4ms	16ms	64ms	256ms	1s	4s	16s	gt	max	tag
0.000	17.576	82.417	0.007	0.000	0.000	0.000	0.000	0.000	0.000	0.004	pg182_o2nofp.cx10b_c8r32
0.000	19.764	80.229	0.007	0.000	0.000	0.000	0.000	0.000	0.000	0.004	pg182_o2nofp.cx10b_fpw0_c8r32
0.000	16.826	83.167	0.007	0.000	0.000	0.000	0.000	0.000	0.000	0.004	pg182_o2nofp.cx10b_wallz4_c8r32
0.000	20.319	79.674	0.007	0.000	0.000	0.000	0.000	0.000	0.000	0.004	pg182_o2nofp.cx10b_fpw0_wallz4_c8r32
qr500.L3
- qr500.L3: range queries with 500 insert/s per client
- Legend for results is here.
- Each entry lists the percentage of responses that fit in that bucket (slower than max time for previous bucket, faster than min time for next bucket).
Query response time histogram
256us	1ms	4ms	16ms	64ms	256ms	1s	4s	16s	gt	max	tag
99.989	0.010	nonzero	nonzero	0.000	0.000	0.000	0.000	0.000	0.000	0.012	pg182_o2nofp.cx10b_c8r32
99.990	0.010	nonzero	nonzero	0.000	0.000	0.000	0.000	0.000	0.000	0.005	pg182_o2nofp.cx10b_fpw0_c8r32
99.989	0.011	nonzero	nonzero	0.000	0.000	0.000	0.000	0.000	0.000	0.010	pg182_o2nofp.cx10b_wallz4_c8r32
99.988	0.012	nonzero	0.000	0.000	0.000	0.000	0.000	0.000	0.000	0.003	pg182_o2nofp.cx10b_fpw0_wallz4_c8r32
Insert response time histogram
256us	1ms	4ms	16ms	64ms	256ms	1s	4s	16s	gt	max	tag
0.000	90.212	9.710	0.076	0.001	0.000	0.000	0.000	0.000	0.000	0.017	pg182_o2nofp.cx10b_c8r32
0.000	90.939	8.982	0.079	0.000	0.000	0.000	0.000	0.000	0.000	0.007	pg182_o2nofp.cx10b_fpw0_c8r32
0.000	78.179	21.576	0.243	0.001	0.000	0.000	0.000	0.000	0.000	0.018	pg182_o2nofp.cx10b_wallz4_c8r32
0.000	91.497	8.471	0.032	0.000	0.000	0.000	0.000	0.000	0.000	0.008	pg182_o2nofp.cx10b_fpw0_wallz4_c8r32
Delete response time histogram
256us	1ms	4ms	16ms	64ms	256ms	1s	4s	16s	gt	max	tag
0.264	71.756	27.831	0.150	0.000	0.000	0.000	0.000	0.000	0.000	0.014	pg182_o2nofp.cx10b_c8r32
0.172	66.119	33.443	0.265	0.000	0.000	0.000	0.000	0.000	0.000	0.008	pg182_o2nofp.cx10b_fpw0_c8r32
0.094	63.346	36.367	0.193	0.000	0.000	0.000	0.000	0.000	0.000	0.013	pg182_o2nofp.cx10b_wallz4_c8r32
0.231	69.482	30.221	0.067	0.000	0.000	0.000	0.000	0.000	0.000	0.006	pg182_o2nofp.cx10b_fpw0_wallz4_c8r32
qp500.L4
- qp500.L4: point queries with 500 insert/s per client
- Legend for results is here.
- Each entry lists the percentage of responses that fit in that bucket (slower than max time for previous bucket, faster than min time for next bucket).
Query response time histogram
256us	1ms	4ms	16ms	64ms	256ms	1s	4s	16s	gt	max	tag
99.955	0.045	nonzero	nonzero	0.000	0.000	0.000	0.000	0.000	0.000	0.004	pg182_o2nofp.cx10b_c8r32
99.958	0.042	nonzero	0.000	nonzero	0.000	0.000	0.000	0.000	0.000	0.027	pg182_o2nofp.cx10b_fpw0_c8r32
99.952	0.047	nonzero	nonzero	0.000	0.000	0.000	0.000	0.000	0.000	0.004	pg182_o2nofp.cx10b_wallz4_c8r32
99.952	0.048	nonzero	nonzero	0.000	0.000	0.000	0.000	0.000	0.000	0.004	pg182_o2nofp.cx10b_fpw0_wallz4_c8r32
Insert response time histogram
256us	1ms	4ms	16ms	64ms	256ms	1s	4s	16s	gt	max	tag
0.000	88.731	11.153	0.117	0.000	0.000	0.000	0.000	0.000	0.000	0.010	pg182_o2nofp.cx10b_c8r32
0.000	89.496	10.463	0.042	0.000	0.000	0.000	0.000	0.000	0.000	0.008	pg182_o2nofp.cx10b_fpw0_c8r32
0.000	79.676	20.143	0.181	0.000	0.000	0.000	0.000	0.000	0.000	0.009	pg182_o2nofp.cx10b_wallz4_c8r32
0.000	90.008	9.954	0.037	0.000	0.000	0.000	0.000	0.000	0.000	0.006	pg182_o2nofp.cx10b_fpw0_wallz4_c8r32
Delete response time histogram
256us	1ms	4ms	16ms	64ms	256ms	1s	4s	16s	gt	max	tag
0.221	59.799	39.842	0.139	0.000	0.000	0.000	0.000	0.000	0.000	0.008	pg182_o2nofp.cx10b_c8r32
0.143	59.519	40.289	0.049	0.000	0.000	0.000	0.000	0.000	0.000	0.008	pg182_o2nofp.cx10b_fpw0_c8r32
0.106	58.464	41.264	0.167	0.000	0.000	0.000	0.000	0.000	0.000	0.010	pg182_o2nofp.cx10b_wallz4_c8r32
0.175	61.301	38.458	0.065	0.000	0.000	0.000	0.000	0.000	0.000	0.007	pg182_o2nofp.cx10b_fpw0_wallz4_c8r32
qr1000.L5
- qr1000.L5: range queries with 1000 insert/s per client
- Legend for results is here.
- Each entry lists the percentage of responses that fit in that bucket (slower than max time for previous bucket, faster than min time for next bucket).
Query response time histogram
256us	1ms	4ms	16ms	64ms	256ms	1s	4s	16s	gt	max	tag
99.984	0.015	nonzero	nonzero	nonzero	0.000	0.000	0.000	0.000	0.000	0.023	pg182_o2nofp.cx10b_c8r32
99.985	0.015	nonzero	nonzero	nonzero	0.000	0.000	0.000	0.000	0.000	0.023	pg182_o2nofp.cx10b_fpw0_c8r32
99.983	0.017	nonzero	nonzero	0.000	0.000	0.000	0.000	0.000	0.000	0.004	pg182_o2nofp.cx10b_wallz4_c8r32
99.983	0.016	nonzero	nonzero	nonzero	0.000	0.000	0.000	0.000	0.000	0.023	pg182_o2nofp.cx10b_fpw0_wallz4_c8r32
Insert response time histogram
256us	1ms	4ms	16ms	64ms	256ms	1s	4s	16s	gt	max	tag
0.000	88.835	10.969	0.197	0.000	0.000	0.000	0.000	0.000	0.000	0.013	pg182_o2nofp.cx10b_c8r32
0.000	90.018	9.881	0.101	0.000	0.000	0.000	0.000	0.000	0.000	0.008	pg182_o2nofp.cx10b_fpw0_c8r32
0.000	83.618	16.162	0.219	0.000	0.000	0.000	0.000	0.000	0.000	0.009	pg182_o2nofp.cx10b_wallz4_c8r32
0.000	89.721	10.172	0.107	0.000	0.000	0.000	0.000	0.000	0.000	0.007	pg182_o2nofp.cx10b_fpw0_wallz4_c8r32
Delete response time histogram
256us	1ms	4ms	16ms	64ms	256ms	1s	4s	16s	gt	max	tag
0.134	70.971	28.495	0.400	0.000	0.000	0.000	0.000	0.000	0.000	0.016	pg182_o2nofp.cx10b_c8r32
0.065	68.130	31.595	0.210	0.000	0.000	0.000	0.000	0.000	0.000	0.009	pg182_o2nofp.cx10b_fpw0_c8r32
0.039	62.701	36.975	0.285	0.000	0.000	0.000	0.000	0.000	0.000	0.012	pg182_o2nofp.cx10b_wallz4_c8r32
0.103	67.460	32.255	0.182	0.000	0.000	0.000	0.000	0.000	0.000	0.008	pg182_o2nofp.cx10b_fpw0_wallz4_c8r32
qp1000.L6
- qp1000.L6: point queries with 1000 insert/s per client
- Legend for results is here.
- Each entry lists the percentage of responses that fit in that bucket (slower than max time for previous bucket, faster than min time for next bucket).
Query response time histogram
256us	1ms	4ms	16ms	64ms	256ms	1s	4s	16s	gt	max	tag
99.947	0.053	0.001	nonzero	nonzero	0.000	0.000	0.000	0.000	0.000	0.030	pg182_o2nofp.cx10b_c8r32
99.947	0.052	nonzero	nonzero	nonzero	0.000	0.000	0.000	0.000	0.000	0.023	pg182_o2nofp.cx10b_fpw0_c8r32
99.941	0.058	0.001	nonzero	nonzero	0.000	0.000	0.000	0.000	0.000	0.019	pg182_o2nofp.cx10b_wallz4_c8r32
99.941	0.059	0.001	nonzero	nonzero	0.000	0.000	0.000	0.000	0.000	0.023	pg182_o2nofp.cx10b_fpw0_wallz4_c8r32
Insert response time histogram
256us	1ms	4ms	16ms	64ms	256ms	1s	4s	16s	gt	max	tag
0.000	85.986	13.894	0.119	0.001	0.000	0.000	0.000	0.000	0.000	0.022	pg182_o2nofp.cx10b_c8r32
0.000	86.851	13.106	0.043	0.000	0.000	0.000	0.000	0.000	0.000	0.010	pg182_o2nofp.cx10b_fpw0_c8r32
0.000	84.118	15.736	0.144	0.001	0.000	0.000	0.000	0.000	0.000	0.016	pg182_o2nofp.cx10b_wallz4_c8r32
0.000	84.319	15.626	0.055	0.000	0.000	0.000	0.000	0.000	0.000	0.007	pg182_o2nofp.cx10b_fpw0_wallz4_c8r32
Delete response time histogram
256us	1ms	4ms	16ms	64ms	256ms	1s	4s	16s	gt	max	tag
0.112	53.117	46.541	0.228	0.001	0.000	0.000	0.000	0.000	0.000	0.018	pg182_o2nofp.cx10b_c8r32
0.079	58.020	41.859	0.042	0.000	0.000	0.000	0.000	0.000	0.000	0.007	pg182_o2nofp.cx10b_fpw0_c8r32
0.049	55.682	44.109	0.160	0.001	0.000	0.000	0.000	0.000	0.000	0.016	pg182_o2nofp.cx10b_wallz4_c8r32
0.086	56.312	43.528	0.073	0.000	0.000	0.000	0.000	0.000	0.000	0.007	pg182_o2nofp.cx10b_fpw0_wallz4_c8r32