Introduction
This is a report for the insert benchmark with 800M docs and 1 client(s). It is generated by scripts (bash, awk, sed) and Tufte might not be impressed. An overview of the insert benchmark is here and a short update is here. Below, by DBMS, I mean DBMS+version.config. An example is my8020.c10b40 where my means MySQL, 8020 is version 8.0.20 and c10b40 is the name for the configuration file.
The test server has 8 AMD cores, 32G RAM and an NVMe device for the database. The benchmark was run with 1 client and there were 1 or 3 connections per client (1 for queries or inserts without rate limits, 1+1 for rate limited inserts+deletes). It uses 1 table with a table per client. It loads 800M rows per table without secondary indexes, creates 3 secondary indexes per table, then inserts 4m+1m rows per table with a delete per insert to avoid growing the table. It then does 6 read+write tests for 1800s each that do queries as fast as possible with 100,100,500,500,1000,1000 inserts/s and the same for deletes/s per client concurrent with the queries. The database is IO-bound for most benchmark steps. Clients and the DBMS share one server.
The tested DBMS are:
- pg1222_o2nofp.cx10a_c8r32 - Postgres 12.22 with my standard config (x10a)
- pg1323_o2nofp.cx10a_c8r32 - Postgres 13.23 with my standard config (x10a)
- pg1422_o2nofp.cx10a_c8r32 - Postgres 14.22 with my standard config (x10a)
- pg1517_o2nofp.cx10a_c8r32 - Postgres 15.17 with my standard config (x10a)
- pg1613_o2nofp.cx10a_c8r32 - Postgres 16.13 with my standard config (x10a)
- pg179_o2nofp.cx10a_c8r32 - Postgres 17.9 with my standard config (x10a)
- pg183_o2nofp.cx10b_c8r32 - Postgres 18.3 with my standard config (x10b)
Contents
- Summary
- l.i0: load without secondary indexes
- l.x: create secondary indexes
- l.i1: continue load after secondary indexes created with 50 inserts per transaction
- l.i2: continue load after secondary indexes created with 5 inserts per transaction
- qr100.L1: range queries with 100 insert/s per client
- qp100.L2: point queries with 100 insert/s per client
- qr500.L3: range queries with 500 insert/s per client
- qp500.L4: point queries with 500 insert/s per client
- qr1000.L5: range queries with 1000 insert/s per client
- qp1000.L6: point queries with 1000 insert/s per client
Summary
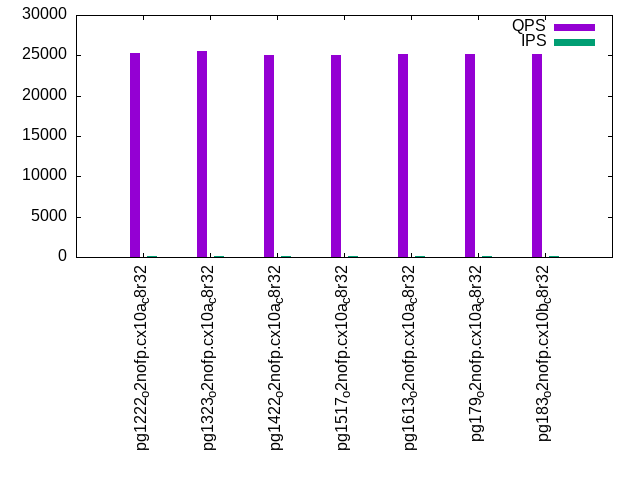
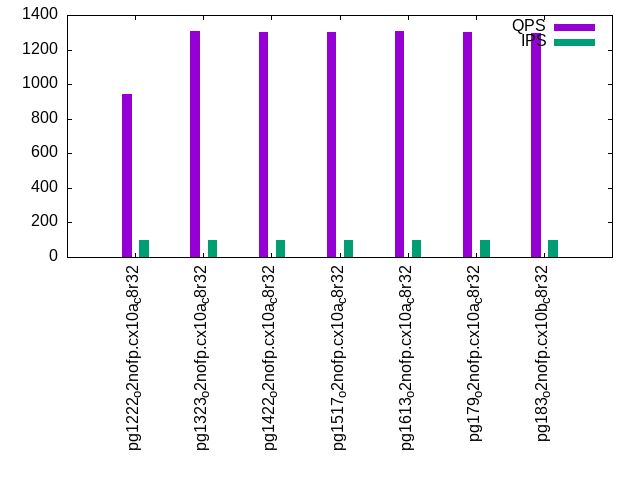
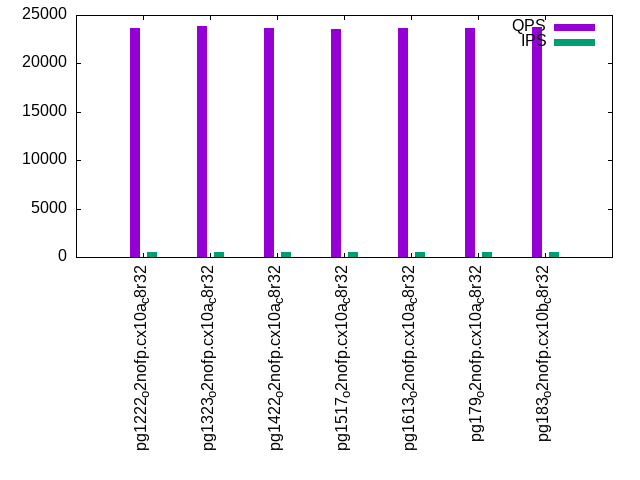
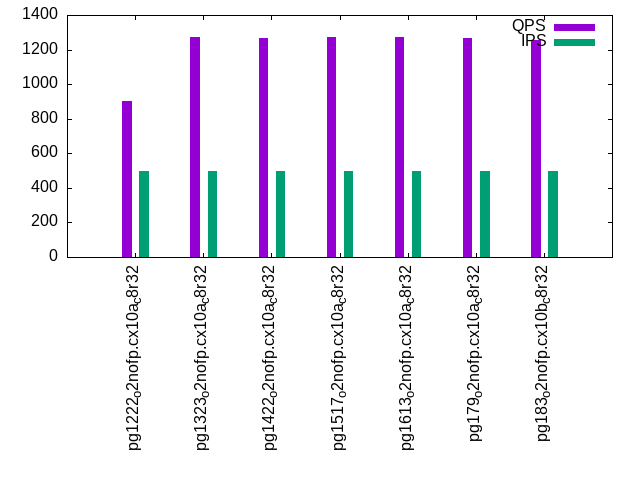
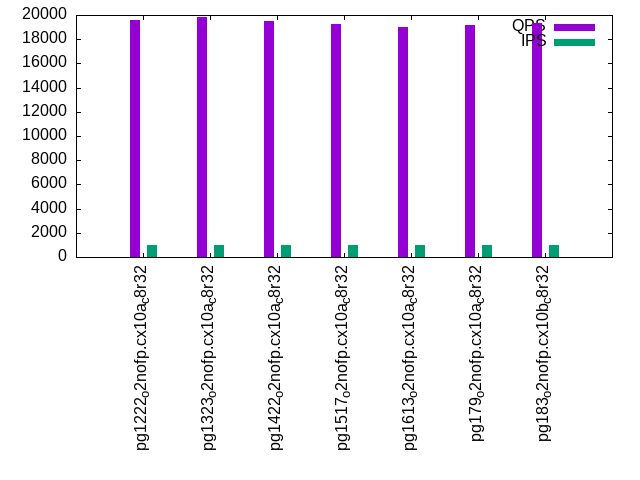
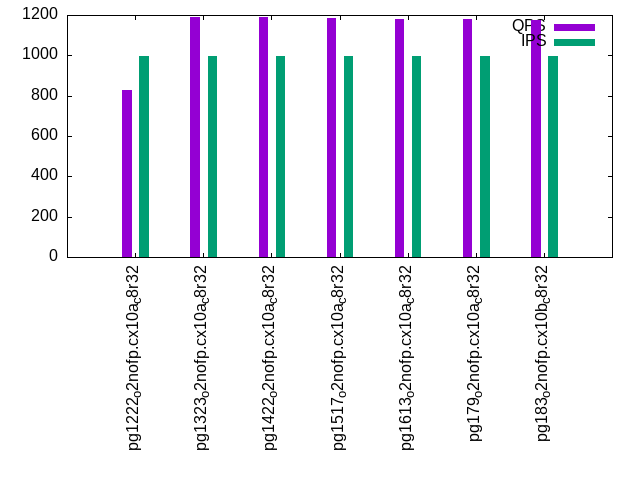
The numbers are inserts/s for l.i0, l.i1 and l.i2, indexed docs (or rows) /s for l.x and queries/s for qr100, qp100 thru qr1000, qp1000" The values are the average rate over the entire test for inserts (IPS) and queries (QPS). The range of values for IPS and QPS is split into 3 parts: bottom 25%, middle 50%, top 25%. Values in the bottom 25% have a red background, values in the top 25% have a green background and values in the middle have no color. A gray background is used for values that can be ignored because the DBMS did not sustain the target insert rate. Red backgrounds are not used when the minimum value is within 80% of the max value.
| dbms | l.i0 | l.x | l.i1 | l.i2 | qr100 | qp100 | qr500 | qp500 | qr1000 | qp1000 |
|---|---|---|---|---|---|---|---|---|---|---|
| pg1222_o2nofp.cx10a_c8r32 | 201613 | 371402 | 4102 | 201 | 25254 | 942 | 23621 | 905 | 19578 | 829 |
| pg1323_o2nofp.cx10a_c8r32 | 208388 | 375234 | 3980 | 195 | 25489 | 1307 | 23906 | 1271 | 19823 | 1192 |
| pg1422_o2nofp.cx10a_c8r32 | 200501 | 372440 | 3918 | 196 | 25098 | 1304 | 23621 | 1267 | 19500 | 1188 |
| pg1517_o2nofp.cx10a_c8r32 | 206665 | 392157 | 3872 | 183 | 25078 | 1304 | 23505 | 1272 | 19235 | 1185 |
| pg1613_o2nofp.cx10a_c8r32 | 209096 | 402414 | 3781 | 169 | 25139 | 1308 | 23648 | 1273 | 19037 | 1181 |
| pg179_o2nofp.cx10a_c8r32 | 211977 | 400601 | 3597 | 166 | 25204 | 1301 | 23672 | 1265 | 19186 | 1182 |
| pg183_o2nofp.cx10b_c8r32 | 211977 | 404858 | 3697 | 179 | 25187 | 1297 | 23787 | 1257 | 19338 | 1176 |
This table has relative throughput, throughput for the DBMS relative to the DBMS in the first line, using the absolute throughput from the previous table. Values less than 0.95 have a yellow background. Values greater than 1.05 have a blue background.
| dbms | l.i0 | l.x | l.i1 | l.i2 | qr100 | qp100 | qr500 | qp500 | qr1000 | qp1000 |
|---|---|---|---|---|---|---|---|---|---|---|
| pg1222_o2nofp.cx10a_c8r32 | 1.00 | 1.00 | 1.00 | 1.00 | 1.00 | 1.00 | 1.00 | 1.00 | 1.00 | 1.00 |
| pg1323_o2nofp.cx10a_c8r32 | 1.03 | 1.01 | 0.97 | 0.97 | 1.01 | 1.39 | 1.01 | 1.40 | 1.01 | 1.44 |
| pg1422_o2nofp.cx10a_c8r32 | 0.99 | 1.00 | 0.96 | 0.98 | 0.99 | 1.38 | 1.00 | 1.40 | 1.00 | 1.43 |
| pg1517_o2nofp.cx10a_c8r32 | 1.03 | 1.06 | 0.94 | 0.91 | 0.99 | 1.38 | 1.00 | 1.41 | 0.98 | 1.43 |
| pg1613_o2nofp.cx10a_c8r32 | 1.04 | 1.08 | 0.92 | 0.84 | 1.00 | 1.39 | 1.00 | 1.41 | 0.97 | 1.42 |
| pg179_o2nofp.cx10a_c8r32 | 1.05 | 1.08 | 0.88 | 0.83 | 1.00 | 1.38 | 1.00 | 1.40 | 0.98 | 1.43 |
| pg183_o2nofp.cx10b_c8r32 | 1.05 | 1.09 | 0.90 | 0.89 | 1.00 | 1.38 | 1.01 | 1.39 | 0.99 | 1.42 |
This lists the average rate of inserts/s for the tests that do inserts concurrent with queries. For such tests the query rate is listed in the table above. The read+write tests are setup so that the insert rate should match the target rate every second. Cells that are not at least 95% of the target have a red background to indicate a failure to satisfy the target.
| dbms | qr100.L1 | qp100.L2 | qr500.L3 | qp500.L4 | qr1000.L5 | qp1000.L6 |
|---|---|---|---|---|---|---|
| pg1222_o2nofp.cx10a_c8r32 | 100 | 100 | 499 | 499 | 999 | 999 |
| pg1323_o2nofp.cx10a_c8r32 | 100 | 100 | 500 | 500 | 999 | 999 |
| pg1422_o2nofp.cx10a_c8r32 | 100 | 100 | 500 | 500 | 999 | 999 |
| pg1517_o2nofp.cx10a_c8r32 | 100 | 100 | 499 | 499 | 999 | 999 |
| pg1613_o2nofp.cx10a_c8r32 | 100 | 100 | 499 | 500 | 999 | 999 |
| pg179_o2nofp.cx10a_c8r32 | 100 | 100 | 499 | 500 | 999 | 999 |
| pg183_o2nofp.cx10b_c8r32 | 100 | 100 | 500 | 500 | 999 | 999 |
| target | 100 | 100 | 500 | 500 | 1000 | 1000 |
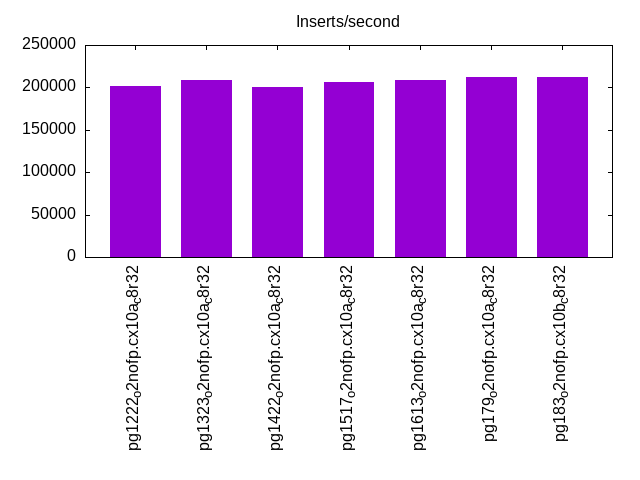
l.i0
l.i0: load without secondary indexes. Graphs for performance per 1-second interval are here.
Average throughput:
Insert response time histogram: each cell has the percentage of responses that take <= the time in the header and max is the max response time in seconds. For the max column values in the top 25% of the range have a red background and in the bottom 25% of the range have a green background. The red background is not used when the min value is within 80% of the max value.
| dbms | 256us | 1ms | 4ms | 16ms | 64ms | 256ms | 1s | 4s | 16s | gt | max |
|---|---|---|---|---|---|---|---|---|---|---|---|
| pg1222_o2nofp.cx10a_c8r32 | 99.964 | 0.035 | nonzero | nonzero | 0.031 | ||||||
| pg1323_o2nofp.cx10a_c8r32 | 99.966 | 0.031 | 0.002 | nonzero | 0.035 | ||||||
| pg1422_o2nofp.cx10a_c8r32 | 99.956 | 0.036 | 0.007 | 0.001 | 0.032 | ||||||
| pg1517_o2nofp.cx10a_c8r32 | 99.972 | 0.025 | 0.003 | nonzero | 0.038 | ||||||
| pg1613_o2nofp.cx10a_c8r32 | 99.973 | 0.024 | 0.003 | nonzero | 0.038 | ||||||
| pg179_o2nofp.cx10a_c8r32 | 99.975 | 0.022 | 0.003 | 0.001 | 0.045 | ||||||
| pg183_o2nofp.cx10b_c8r32 | 99.974 | 0.022 | 0.005 | nonzero | 0.027 |
Performance metrics for the DBMS listed above. Some are normalized by throughput, others are not. Legend for results is here.
ips	qps	rps	rmbps	wps	wmbps	rpq	rkbpq	wpi	wkbpi	csps	cpups	cspq	cpupq	dbgb1	dbgb2	rss	maxop	p50	p99	tag
201613	0	37	0.3	814.7	82.7	0.000	0.001	0.004	0.420	24024	20.3	0.119	8	76.5	116.6	19.2	0.031	202575	196785	pg1222_o2nofp.cx10a_c8r32
208388	0	34	0.3	779.9	85.8	0.000	0.001	0.004	0.422	24767	20.7	0.119	8	76.5	116.6	18.4	0.035	209676	203077	pg1323_o2nofp.cx10a_c8r32
200501	0	37	0.3	752.1	82.8	0.000	0.001	0.004	0.423	23279	20.0	0.116	8	76.5	116.6	2.3	0.032	201674	192279	pg1422_o2nofp.cx10a_c8r32
206665	0	35	0.3	771.4	85.1	0.000	0.001	0.004	0.422	24027	19.8	0.116	8	76.5	116.6	18.7	0.038	208073	200677	pg1517_o2nofp.cx10a_c8r32
209096	0	35	0.3	781.4	86.0	0.000	0.001	0.004	0.421	24291	20.0	0.116	8	76.5	116.6	18.9	0.038	210385	203169	pg1613_o2nofp.cx10a_c8r32
211977	0	40	0.3	790.9	87.2	0.000	0.002	0.004	0.421	21046	20.2	0.099	8	76.5	116.6	18.7	0.045	213369	206172	pg179_o2nofp.cx10a_c8r32
211977	0	36	0.3	798.7	87.8	0.000	0.001	0.004	0.424	21043	20.3	0.099	8	76.5	116.6	18.5	0.027	213363	206161	pg183_o2nofp.cx10b_c8r32
Average values from iostat.
r/s	rkB/s	rrqm/s	%rrqm	r_await	rareq-s	w/s	wkB/s	wrqm/s	%wrqm	w_await	wareq-s	d/s	dkB/s	drqm/s	%drqm	d_await	dareq-s	f/s	f_await	aqu-sz	%util
37.20	300.6	0.043	0.522	0.087	2.932	815.0	84724.9	36.98	3.592	0.301	107.9	2.249	30.38	0.000	0.000	0.690	8.903	42.50	1.513	0.327	11.22		pg1222_o2nofp.cx10a_c8r32
34.31	276.5	0.000	0.000	0.099	2.906	780.2	87885.6	37.96	3.686	0.318	112.5	2.287	20.68	0.000	0.000	0.690	6.179	43.04	1.591	0.328	11.58		pg1323_o2nofp.cx10a_c8r32
37.41	299.0	0.003	0.090	0.158	2.837	752.4	84837.7	35.88	3.853	0.444	112.2	2.296	19.61	0.000	0.000	0.962	5.705	41.47	2.245	0.453	14.19		pg1422_o2nofp.cx10a_c8r32
34.74	277.4	0.028	0.310	0.096	2.709	771.7	87141.1	34.45	3.331	0.310	112.9	0.262	38.56	0.000	0.000	0.165	21.71	42.79	1.513	0.320	11.08		pg1517_o2nofp.cx10a_c8r32
35.49	283.4	0.002	0.079	0.088	2.763	781.7	88096.2	35.17	3.294	0.305	112.8	0.223	51.26	0.000	0.000	0.166	22.13	43.26	1.509	0.322	11.17		pg1613_o2nofp.cx10a_c8r32
40.28	323.5	0.059	0.756	0.092	2.872	791.2	89306.2	32.49	3.227	0.300	112.7	0.125	8.609	0.000	0.000	0.166	5.002	43.78	1.513	0.316	11.01		pg179_o2nofp.cx10a_c8r32
36.59	293.9	0.079	0.962	0.104	2.906	799.0	89940.4	31.32	3.148	0.307	112.5	0.130	13.85	0.000	0.000	0.161	11.42	43.81	1.517	0.324	11.11		pg183_o2nofp.cx10b_c8r32
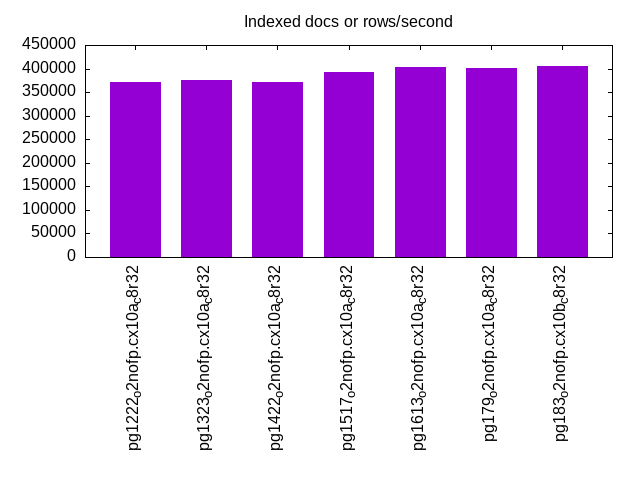
l.x
l.x: create secondary indexes.
Average throughput:
Performance metrics for the DBMS listed above. Some are normalized by throughput, others are not. Legend for results is here.
ips	qps	rps	rmbps	wps	wmbps	rpq	rkbpq	wpi	wkbpi	csps	cpups	cspq	cpupq	dbgb1	dbgb2	rss	maxop	p50	p99	tag
371402	0	1031	124.5	1827.4	187.1	0.003	0.343	0.005	0.516	1201	13.5	0.003	3	153.8	193.8	23.4	0.003	NA	NA	pg1222_o2nofp.cx10a_c8r32
375234	0	1530	139.5	1144.8	137.2	0.004	0.381	0.003	0.374	1470	12.5	0.004	3	153.6	193.7	23.4	0.003	NA	NA	pg1323_o2nofp.cx10a_c8r32
372440	0	1526	138.7	1131.9	136.0	0.004	0.381	0.003	0.374	1436	12.5	0.004	3	153.6	193.7	23.4	0.005	NA	NA	pg1422_o2nofp.cx10a_c8r32
392157	0	1670	160.7	1202.5	146.5	0.004	0.420	0.003	0.383	1607	12.7	0.004	3	153.6	193.7	23.4	0.004	NA	NA	pg1517_o2nofp.cx10a_c8r32
402414	0	1197	140.3	1234.8	150.6	0.003	0.357	0.003	0.383	1026	12.8	0.003	3	153.6	193.7	23.5	0.003	NA	NA	pg1613_o2nofp.cx10a_c8r32
400601	0	1216	140.8	1229.2	149.8	0.003	0.360	0.003	0.383	1030	12.8	0.003	3	153.6	193.7	23.4	0.002	NA	NA	pg179_o2nofp.cx10a_c8r32
404858	0	1264	143.9	1240.9	151.0	0.003	0.364	0.003	0.382	1082	12.8	0.003	3	153.6	193.7	23.4	0.007	NA	NA	pg183_o2nofp.cx10b_c8r32
Average values from iostat.
r/s	rkB/s	rrqm/s	%rrqm	r_await	rareq-s	w/s	wkB/s	wrqm/s	%wrqm	w_await	wareq-s	d/s	dkB/s	drqm/s	%drqm	d_await	dareq-s	f/s	f_await	aqu-sz	%util
1031.2	127482	0.243	0.022	0.113	108.7	1830.3	191834	39.78	6.631	0.311	107.1	2.801	20859.9	0.000	0.000	0.740	374.6	15.68	1.698	0.673	18.68		pg1222_o2nofp.cx10a_c8r32
1531.8	142839	0.000	0.000	0.113	90.97	1147.4	140843	27.27	1.605	0.330	123.4	2.953	24423.5	0.000	0.000	0.753	1620.8	9.967	1.698	0.541	17.80		pg1323_o2nofp.cx10a_c8r32
1526.9	142036	0.000	0.000	0.108	91.14	1134.3	139607	26.59	1.609	0.296	123.5	3.011	20510.6	0.000	0.000	0.730	423.9	9.868	1.732	0.501	17.53		pg1422_o2nofp.cx10a_c8r32
1671.5	164606	0.000	0.000	0.093	96.19	1205.2	150379	23.46	1.166	0.200	125.3	1.005	21661.5	0.000	0.000	0.312	424.6	9.463	1.980	0.514	18.64		pg1517_o2nofp.cx10a_c8r32
1197.3	143680	0.002	0.000	0.106	105.6	1237.6	154589	26.04	1.078	0.201	125.9	1.039	22465.6	0.000	0.000	0.293	463.2	10.21	1.972	0.495	16.96		pg1613_o2nofp.cx10a_c8r32
1215.7	144218	0.000	0.000	0.120	105.4	1231.4	153724	25.56	1.065	0.200	125.6	0.802	25810.2	0.000	0.000	0.285	5666.3	10.07	1.963	0.516	16.80		pg179_o2nofp.cx10a_c8r32
1263.9	147399	0.000	0.000	0.128	104.6	1243.7	154967	26.05	1.079	0.202	125.4	0.895	28091.0	0.000	0.000	0.311	6458.3	10.20	1.803	0.530	17.38		pg183_o2nofp.cx10b_c8r32
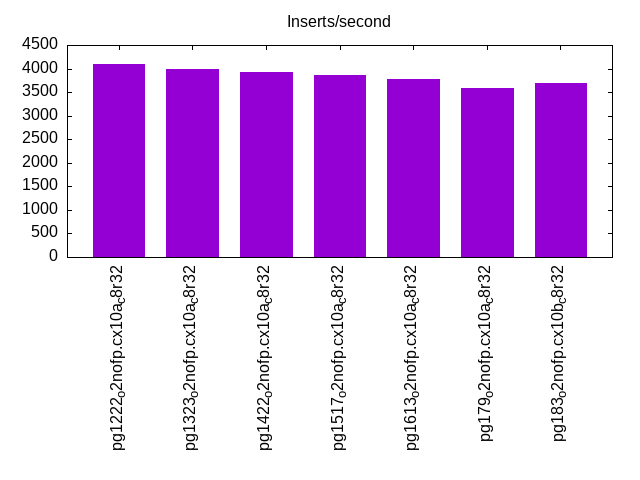
l.i1
l.i1: continue load after secondary indexes created with 50 inserts per transaction. Graphs for performance per 1-second interval are here.
Average throughput:
Insert response time histogram: each cell has the percentage of responses that take <= the time in the header and max is the max response time in seconds. For the max column values in the top 25% of the range have a red background and in the bottom 25% of the range have a green background. The red background is not used when the min value is within 80% of the max value.
| dbms | 256us | 1ms | 4ms | 16ms | 64ms | 256ms | 1s | 4s | 16s | gt | max |
|---|---|---|---|---|---|---|---|---|---|---|---|
| pg1222_o2nofp.cx10a_c8r32 | 3.033 | 96.707 | 0.260 | 0.051 | |||||||
| pg1323_o2nofp.cx10a_c8r32 | 0.060 | 99.849 | 0.091 | 0.037 | |||||||
| pg1422_o2nofp.cx10a_c8r32 | 0.007 | 99.771 | 0.217 | 0.004 | 0.137 | ||||||
| pg1517_o2nofp.cx10a_c8r32 | 0.028 | 99.880 | 0.092 | 0.048 | |||||||
| pg1613_o2nofp.cx10a_c8r32 | 0.013 | 99.922 | 0.065 | 0.027 | |||||||
| pg179_o2nofp.cx10a_c8r32 | 0.014 | 99.956 | 0.030 | 0.042 | |||||||
| pg183_o2nofp.cx10b_c8r32 | 0.009 | 99.961 | 0.030 | 0.035 |
Delete response time histogram: each cell has the percentage of responses that take <= the time in the header and max is the max response time in seconds. For the max column values in the top 25% of the range have a red background and in the bottom 25% of the range have a green background. The red background is not used when the min value is within 80% of the max value.
| dbms | 256us | 1ms | 4ms | 16ms | 64ms | 256ms | 1s | 4s | 16s | gt | max |
|---|---|---|---|---|---|---|---|---|---|---|---|
| pg1222_o2nofp.cx10a_c8r32 | 1.460 | 19.736 | 51.344 | 27.460 | 0.030 | ||||||
| pg1323_o2nofp.cx10a_c8r32 | 1.060 | 18.164 | 48.874 | 31.902 | 0.030 | ||||||
| pg1422_o2nofp.cx10a_c8r32 | 0.004 | 1.159 | 18.918 | 47.649 | 32.269 | 0.003 | 0.068 | ||||
| pg1517_o2nofp.cx10a_c8r32 | 1.664 | 17.649 | 47.499 | 33.189 | 0.031 | ||||||
| pg1613_o2nofp.cx10a_c8r32 | 0.005 | 1.836 | 17.056 | 46.109 | 34.994 | 0.029 | |||||
| pg179_o2nofp.cx10a_c8r32 | 1.731 | 17.095 | 41.546 | 39.627 | 0.034 | ||||||
| pg183_o2nofp.cx10b_c8r32 | 1.404 | 17.872 | 42.771 | 37.953 | 0.031 |
Performance metrics for the DBMS listed above. Some are normalized by throughput, others are not. Legend for results is here.
ips	qps	rps	rmbps	wps	wmbps	rpq	rkbpq	wpi	wkbpi	csps	cpups	cspq	cpupq	dbgb1	dbgb2	rss	maxop	p50	p99	tag
4102	0	5222	41.2	4796.1	85.9	1.273	10.280	1.169	21.452	12679	16.1	3.091	314	154.4	194.5	23.3	0.051	3350	2100	pg1222_o2nofp.cx10a_c8r32
3980	0	5741	45.2	4686.9	80.4	1.442	11.637	1.178	20.694	13608	16.2	3.419	326	154.3	194.3	22.9	0.037	3149	2150	pg1323_o2nofp.cx10a_c8r32
3918	0	5634	44.4	4757.6	87.0	1.438	11.607	1.214	22.741	12958	16.0	3.308	327	154.3	194.3	23.1	0.137	3198	2050	pg1422_o2nofp.cx10a_c8r32
3872	0	5594	44.1	4574.8	78.5	1.445	11.656	1.181	20.746	12716	15.8	3.284	326	154.3	194.3	22.9	0.048	3049	2050	pg1517_o2nofp.cx10a_c8r32
3781	0	5440	42.9	4491.9	77.3	1.439	11.609	1.188	20.929	12382	15.6	3.275	330	154.3	194.3	21.7	0.027	2900	1949	pg1613_o2nofp.cx10a_c8r32
3597	0	5163	40.7	4234.3	72.9	1.435	11.581	1.177	20.765	11599	15.4	3.224	343	154.3	194.3	22.7	0.042	2748	1899	pg179_o2nofp.cx10a_c8r32
3697	0	5313	41.9	4387.0	75.2	1.437	11.596	1.187	20.828	11925	15.5	3.226	335	154.3	194.3	22.8	0.035	2850	2000	pg183_o2nofp.cx10b_c8r32
Average values from iostat.
r/s	rkB/s	rrqm/s	%rrqm	r_await	rareq-s	w/s	wkB/s	wrqm/s	%wrqm	w_await	wareq-s	d/s	dkB/s	drqm/s	%drqm	d_await	dareq-s	f/s	f_await	aqu-sz	%util
5205.2	42034.1	0.000	0.000	0.043	8.078	4817.8	88250.9	26.57	1.309	0.135	39.67	2.009	9.940	0.000	0.000	0.539	4.907	43.72	1.533	0.738	33.31		pg1222_o2nofp.cx10a_c8r32
5701.1	45996.8	0.000	0.000	0.043	8.072	4707.3	82429.3	21.42	1.087	0.144	40.21	2.020	9.784	0.000	0.000	0.532	4.834	42.25	1.565	0.869	34.34		pg1323_o2nofp.cx10a_c8r32
5592.5	45138.6	0.000	0.000	0.044	8.075	4777.9	89179.7	31.03	1.789	0.179	41.75	2.035	107.1	0.000	0.000	0.561	28.09	46.02	1.594	1.039	35.98		pg1422_o2nofp.cx10a_c8r32
5553.6	44809.8	0.000	0.000	0.043	8.072	4594.1	80383.4	18.13	0.892	0.149	40.33	0.037	0.222	0.000	0.000	0.110	0.748	41.20	1.601	0.862	34.07		pg1517_o2nofp.cx10a_c8r32
5397.2	43548.2	0.000	0.000	0.043	8.072	4510.2	79153.2	23.30	0.863	0.140	38.65	0.009	0.130	0.000	0.000	0.036	0.419	40.33	1.585	0.907	33.27		pg1613_o2nofp.cx10a_c8r32
5122.8	41335.5	0.000	0.000	0.042	8.073	4250.5	74705.4	14.31	0.594	0.127	38.06	0.033	0.206	0.000	0.000	0.152	0.796	37.77	1.566	0.786	31.02		pg179_o2nofp.cx10a_c8r32
5273.1	42545.7	0.000	0.000	0.042	8.073	4404.5	77027.3	15.48	0.803	0.136	38.94	0.011	0.119	0.000	0.000	0.026	0.353	38.72	1.581	0.785	31.89		pg183_o2nofp.cx10b_c8r32
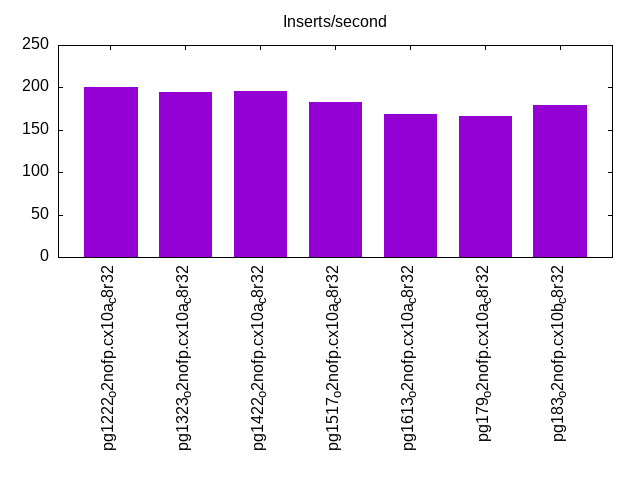
l.i2
l.i2: continue load after secondary indexes created with 5 inserts per transaction. Graphs for performance per 1-second interval are here.
Average throughput:
Insert response time histogram: each cell has the percentage of responses that take <= the time in the header and max is the max response time in seconds. For the max column values in the top 25% of the range have a red background and in the bottom 25% of the range have a green background. The red background is not used when the min value is within 80% of the max value.
| dbms | 256us | 1ms | 4ms | 16ms | 64ms | 256ms | 1s | 4s | 16s | gt | max |
|---|---|---|---|---|---|---|---|---|---|---|---|
| pg1222_o2nofp.cx10a_c8r32 | 40.400 | 59.458 | 0.142 | 0.013 | |||||||
| pg1323_o2nofp.cx10a_c8r32 | 42.023 | 57.824 | 0.153 | 0.001 | 0.016 | ||||||
| pg1422_o2nofp.cx10a_c8r32 | 43.394 | 56.400 | 0.206 | 0.001 | 0.017 | ||||||
| pg1517_o2nofp.cx10a_c8r32 | 39.364 | 60.453 | 0.182 | 0.015 | |||||||
| pg1613_o2nofp.cx10a_c8r32 | 37.726 | 62.098 | 0.176 | 0.001 | 0.020 | ||||||
| pg179_o2nofp.cx10a_c8r32 | 44.556 | 55.355 | 0.088 | 0.016 | |||||||
| pg183_o2nofp.cx10b_c8r32 | 48.296 | 51.641 | 0.063 | 0.011 |
Delete response time histogram: each cell has the percentage of responses that take <= the time in the header and max is the max response time in seconds. For the max column values in the top 25% of the range have a red background and in the bottom 25% of the range have a green background. The red background is not used when the min value is within 80% of the max value.
| dbms | 256us | 1ms | 4ms | 16ms | 64ms | 256ms | 1s | 4s | 16s | gt | max |
|---|---|---|---|---|---|---|---|---|---|---|---|
| pg1222_o2nofp.cx10a_c8r32 | 99.999 | 0.001 | 0.081 | ||||||||
| pg1323_o2nofp.cx10a_c8r32 | 99.999 | 0.001 | 0.083 | ||||||||
| pg1422_o2nofp.cx10a_c8r32 | 99.999 | 0.001 | 0.083 | ||||||||
| pg1517_o2nofp.cx10a_c8r32 | 99.999 | 0.001 | 0.082 | ||||||||
| pg1613_o2nofp.cx10a_c8r32 | 99.999 | 0.001 | 0.081 | ||||||||
| pg179_o2nofp.cx10a_c8r32 | 99.999 | 0.001 | 0.078 | ||||||||
| pg183_o2nofp.cx10b_c8r32 | 99.999 | 0.001 | 0.079 |
Performance metrics for the DBMS listed above. Some are normalized by throughput, others are not. Legend for results is here.
ips	qps	rps	rmbps	wps	wmbps	rpq	rkbpq	wpi	wkbpi	csps	cpups	cspq	cpupq	dbgb1	dbgb2	rss	maxop	p50	p99	tag
201	0	215	1.7	487.7	6.8	1.072	8.606	2.431	34.821	1858	13.4	9.264	5344	154.6	194.6	23.3	0.013	200	180	pg1222_o2nofp.cx10a_c8r32
195	0	209	1.7	565.0	7.6	1.073	8.687	2.896	40.095	1804	13.4	9.245	5495	154.4	194.5	23.0	0.016	195	175	pg1323_o2nofp.cx10a_c8r32
196	0	210	1.7	561.1	7.9	1.072	8.685	2.861	41.245	1503	13.2	7.665	5385	154.4	194.5	23.3	0.017	195	175	pg1422_o2nofp.cx10a_c8r32
183	0	196	1.5	529.2	7.3	1.071	8.679	2.896	40.733	1353	13.0	7.408	5692	154.4	194.5	22.9	0.015	180	165	pg1517_o2nofp.cx10a_c8r32
169	0	181	1.4	489.2	6.8	1.070	8.671	2.898	41.358	1260	12.9	7.465	6114	154.4	194.5	22.9	0.020	165	150	pg1613_o2nofp.cx10a_c8r32
166	0	178	1.4	499.3	6.8	1.069	8.661	2.999	41.815	1078	12.7	6.477	6102	154.4	194.5	22.8	0.016	165	150	pg179_o2nofp.cx10a_c8r32
179	0	191	1.5	513.6	7.1	1.071	8.674	2.874	40.889	1179	12.8	6.597	5730	154.4	194.5	22.8	0.011	175	160	pg183_o2nofp.cx10b_c8r32
Average values from iostat.
r/s	rkB/s	rrqm/s	%rrqm	r_await	rareq-s	w/s	wkB/s	wrqm/s	%wrqm	w_await	wareq-s	d/s	dkB/s	drqm/s	%drqm	d_await	dareq-s	f/s	f_await	aqu-sz	%util
214.9	1726.1	0.000	0.000	0.075	8.032	487.5	6984.0	9.535	2.489	0.064	16.93	2.007	9.767	0.000	0.000	0.427	4.827	6.018	1.566	0.051	3.023		pg1222_o2nofp.cx10a_c8r32
209.2	1694.6	0.000	0.000	0.074	8.100	565.5	7827.4	7.433	2.381	0.084	19.46	2.008	9.838	0.000	0.000	0.435	4.840	6.476	1.564	0.055	3.148		pg1323_o2nofp.cx10a_c8r32
210.2	1702.9	0.000	0.000	0.077	8.103	561.4	8090.2	6.506	1.812	0.068	17.90	2.008	10.17	0.000	0.000	0.436	5.022	5.975	1.573	0.054	3.247		pg1422_o2nofp.cx10a_c8r32
195.7	1585.5	0.000	0.000	0.076	8.102	529.6	7446.2	5.347	1.662	0.087	19.93	0.019	0.293	0.000	0.000	0.037	0.321	6.430	1.578	0.053	3.128		pg1517_o2nofp.cx10a_c8r32
180.6	1463.4	0.000	0.000	0.078	8.102	489.6	6985.5	6.505	2.026	0.082	19.27	0.008	0.189	0.000	0.000	0.005	0.096	6.191	1.563	0.051	2.931		pg1613_o2nofp.cx10a_c8r32
178.0	1441.9	0.000	0.000	0.056	8.101	499.4	6964.1	4.325	1.120	0.078	17.39	0.006	0.107	0.000	0.000	0.021	0.400	6.202	1.583	0.049	2.812		pg179_o2nofp.cx10a_c8r32
191.3	1549.8	0.000	0.000	0.055	8.101	514.0	7311.7	5.826	1.730	0.086	19.74	0.002	0.157	0.000	0.000	0.003	0.324	6.286	1.587	0.049	2.783		pg183_o2nofp.cx10b_c8r32
qr100.L1
qr100.L1: range queries with 100 insert/s per client. Graphs for performance per 1-second interval are here.
Average throughput:
Query response time histogram: each cell has the percentage of responses that take <= the time in the header and max is the max response time in seconds. For max values in the top 25% of the range have a red background and in the bottom 25% of the range have a green background. The red background is not used when the min value is within 80% of the max value.
| dbms | 256us | 1ms | 4ms | 16ms | 64ms | 256ms | 1s | 4s | 16s | gt | max |
|---|---|---|---|---|---|---|---|---|---|---|---|
| pg1222_o2nofp.cx10a_c8r32 | 99.994 | 0.006 | nonzero | nonzero | 0.005 | ||||||
| pg1323_o2nofp.cx10a_c8r32 | 99.993 | 0.007 | nonzero | nonzero | 0.005 | ||||||
| pg1422_o2nofp.cx10a_c8r32 | 99.993 | 0.007 | nonzero | nonzero | 0.004 | ||||||
| pg1517_o2nofp.cx10a_c8r32 | 99.992 | 0.008 | nonzero | nonzero | 0.011 | ||||||
| pg1613_o2nofp.cx10a_c8r32 | 99.992 | 0.008 | nonzero | nonzero | 0.010 | ||||||
| pg179_o2nofp.cx10a_c8r32 | 99.992 | 0.008 | nonzero | nonzero | 0.009 | ||||||
| pg183_o2nofp.cx10b_c8r32 | 99.992 | 0.008 | nonzero | nonzero | 0.010 |
Insert response time histogram: each cell has the percentage of responses that take <= the time in the header and max is the max response time in seconds. For max values in the top 25% of the range have a red background and in the bottom 25% of the range have a green background. The red background is not used when the min value is within 80% of the max value.
| dbms | 256us | 1ms | 4ms | 16ms | 64ms | 256ms | 1s | 4s | 16s | gt | max |
|---|---|---|---|---|---|---|---|---|---|---|---|
| pg1222_o2nofp.cx10a_c8r32 | 99.750 | 0.250 | 0.019 | ||||||||
| pg1323_o2nofp.cx10a_c8r32 | 8.806 | 91.167 | 0.028 | 0.016 | |||||||
| pg1422_o2nofp.cx10a_c8r32 | 9.083 | 90.889 | 0.028 | 0.018 | |||||||
| pg1517_o2nofp.cx10a_c8r32 | 9.000 | 90.972 | 0.028 | 0.021 | |||||||
| pg1613_o2nofp.cx10a_c8r32 | 9.861 | 90.111 | 0.028 | 0.022 | |||||||
| pg179_o2nofp.cx10a_c8r32 | 11.500 | 88.472 | 0.028 | 0.020 | |||||||
| pg183_o2nofp.cx10b_c8r32 | 15.778 | 84.194 | 0.028 | 0.020 |
Delete response time histogram: each cell has the percentage of responses that take <= the time in the header and max is the max response time in seconds. For max values in the top 25% of the range have a red background and in the bottom 25% of the range have a green background. The red background is not used when the min value is within 80% of the max value.
| dbms | 256us | 1ms | 4ms | 16ms | 64ms | 256ms | 1s | 4s | 16s | gt | max |
|---|---|---|---|---|---|---|---|---|---|---|---|
| pg1222_o2nofp.cx10a_c8r32 | 62.083 | 37.917 | 0.003 | ||||||||
| pg1323_o2nofp.cx10a_c8r32 | 59.472 | 40.528 | 0.003 | ||||||||
| pg1422_o2nofp.cx10a_c8r32 | 60.167 | 39.833 | 0.004 | ||||||||
| pg1517_o2nofp.cx10a_c8r32 | 58.667 | 41.333 | 0.003 | ||||||||
| pg1613_o2nofp.cx10a_c8r32 | 59.083 | 40.917 | 0.003 | ||||||||
| pg179_o2nofp.cx10a_c8r32 | 0.028 | 59.306 | 40.667 | 0.003 | |||||||
| pg183_o2nofp.cx10b_c8r32 | 0.028 | 58.861 | 41.111 | 0.003 |
Performance metrics for the DBMS listed above. Some are normalized by throughput, others are not. Legend for results is here.
ips	qps	rps	rmbps	wps	wmbps	rpq	rkbpq	wpi	wkbpi	csps	cpups	cspq	cpupq	dbgb1	dbgb2	rss	maxop	p50	p99	tag
100	25254	112	0.9	24.4	1.5	0.004	0.036	0.245	15.682	96694	8.6	3.829	27	154.6	194.7	23.4	0.005	25180	24796	pg1222_o2nofp.cx10a_c8r32
100	25489	112	0.9	58.3	1.8	0.004	0.036	0.585	18.632	97647	8.6	3.831	27	154.4	192.0	23.4	0.005	25641	24924	pg1323_o2nofp.cx10a_c8r32
100	25098	111	0.9	63.6	1.9	0.004	0.036	0.637	19.072	96087	8.6	3.828	27	154.5	192.4	23.3	0.004	25003	24667	pg1422_o2nofp.cx10a_c8r32
100	25078	111	0.9	61.6	1.8	0.004	0.037	0.617	18.883	95970	8.8	3.827	28	154.4	191.9	23.3	0.011	25067	24727	pg1517_o2nofp.cx10a_c8r32
100	25139	112	0.9	61.4	1.8	0.004	0.037	0.615	18.885	96209	8.6	3.827	27	154.4	192.1	23.3	0.010	25099	24877	pg1613_o2nofp.cx10a_c8r32
100	25204	113	0.9	67.5	1.9	0.004	0.037	0.677	19.522	96444	8.6	3.827	27	154.4	192.8	23.4	0.009	25132	24829	pg179_o2nofp.cx10a_c8r32
100	25187	111	0.9	68.6	1.9	0.004	0.036	0.687	19.605	96380	8.9	3.827	28	154.4	192.3	23.4	0.010	25084	24697	pg183_o2nofp.cx10b_c8r32
Average values from iostat.
r/s	rkB/s	rrqm/s	%rrqm	r_await	rareq-s	w/s	wkB/s	wrqm/s	%wrqm	w_await	wareq-s	d/s	dkB/s	drqm/s	%drqm	d_await	dareq-s	f/s	f_await	aqu-sz	%util
109.1	878.4	0.000	0.000	0.101	8.048	24.45	1566.4	5.115	17.30	0.696	65.97	2.000	9.597	0.000	0.000	0.948	4.799	3.638	2.023	0.037	2.143		pg1222_o2nofp.cx10a_c8r32
108.4	884.0	0.000	0.000	0.077	8.159	58.43	1860.0	4.094	12.15	0.750	56.79	1.997	9.586	0.000	0.000	0.890	4.808	3.696	1.837	0.067	1.963		pg1323_o2nofp.cx10a_c8r32
107.9	881.1	0.000	0.000	0.077	8.164	63.69	1904.1	4.113	11.60	0.769	54.89	2.001	10.01	0.000	0.000	0.764	5.001	3.650	1.746	0.076	1.912		pg1422_o2nofp.cx10a_c8r32
108.1	895.2	0.000	0.000	0.077	8.281	61.71	1885.1	1.789	5.871	0.874	59.57	0.001	0.002	0.000	0.000	0.003	0.011	3.583	1.848	0.081	1.851		pg1517_o2nofp.cx10a_c8r32
108.6	896.3	0.000	0.000	0.076	8.255	61.47	1885.4	2.095	6.563	0.828	59.81	0.001	0.002	0.000	0.000	0.003	0.011	3.577	1.786	0.076	1.790		pg1613_o2nofp.cx10a_c8r32
109.5	897.5	0.000	0.000	0.057	8.192	67.67	1949.2	1.521	4.898	0.853	60.06	0.001	0.002	0.000	0.000	0.003	0.011	2.617	1.738	0.083	1.695		pg179_o2nofp.cx10a_c8r32
107.7	880.6	0.000	0.000	0.058	8.176	68.72	1957.5	1.876	5.562	0.881	58.40	0.001	0.002	0.000	0.000	0.000	0.011	2.679	1.792	0.084	1.737		pg183_o2nofp.cx10b_c8r32
qp100.L2
qp100.L2: point queries with 100 insert/s per client. Graphs for performance per 1-second interval are here.
Average throughput:
Query response time histogram: each cell has the percentage of responses that take <= the time in the header and max is the max response time in seconds. For max values in the top 25% of the range have a red background and in the bottom 25% of the range have a green background. The red background is not used when the min value is within 80% of the max value.
| dbms | 256us | 1ms | 4ms | 16ms | 64ms | 256ms | 1s | 4s | 16s | gt | max |
|---|---|---|---|---|---|---|---|---|---|---|---|
| pg1222_o2nofp.cx10a_c8r32 | nonzero | 44.205 | 55.757 | 0.038 | nonzero | 0.028 | |||||
| pg1323_o2nofp.cx10a_c8r32 | 0.002 | 95.029 | 4.954 | 0.015 | 0.015 | ||||||
| pg1422_o2nofp.cx10a_c8r32 | 0.002 | 94.905 | 5.080 | 0.013 | 0.013 | ||||||
| pg1517_o2nofp.cx10a_c8r32 | 0.002 | 95.079 | 4.903 | 0.017 | 0.015 | ||||||
| pg1613_o2nofp.cx10a_c8r32 | 0.003 | 95.152 | 4.835 | 0.011 | 0.013 | ||||||
| pg179_o2nofp.cx10a_c8r32 | 0.002 | 94.949 | 5.039 | 0.010 | 0.012 | ||||||
| pg183_o2nofp.cx10b_c8r32 | 0.002 | 94.792 | 5.194 | 0.012 | 0.014 |
Insert response time histogram: each cell has the percentage of responses that take <= the time in the header and max is the max response time in seconds. For max values in the top 25% of the range have a red background and in the bottom 25% of the range have a green background. The red background is not used when the min value is within 80% of the max value.
| dbms | 256us | 1ms | 4ms | 16ms | 64ms | 256ms | 1s | 4s | 16s | gt | max |
|---|---|---|---|---|---|---|---|---|---|---|---|
| pg1222_o2nofp.cx10a_c8r32 | 99.750 | 0.250 | 0.024 | ||||||||
| pg1323_o2nofp.cx10a_c8r32 | 99.833 | 0.167 | 0.021 | ||||||||
| pg1422_o2nofp.cx10a_c8r32 | 99.806 | 0.194 | 0.021 | ||||||||
| pg1517_o2nofp.cx10a_c8r32 | 99.750 | 0.250 | 0.021 | ||||||||
| pg1613_o2nofp.cx10a_c8r32 | 99.833 | 0.167 | 0.018 | ||||||||
| pg179_o2nofp.cx10a_c8r32 | 100.000 | 0.012 | |||||||||
| pg183_o2nofp.cx10b_c8r32 | 100.000 | 0.015 |
Delete response time histogram: each cell has the percentage of responses that take <= the time in the header and max is the max response time in seconds. For max values in the top 25% of the range have a red background and in the bottom 25% of the range have a green background. The red background is not used when the min value is within 80% of the max value.
| dbms | 256us | 1ms | 4ms | 16ms | 64ms | 256ms | 1s | 4s | 16s | gt | max |
|---|---|---|---|---|---|---|---|---|---|---|---|
| pg1222_o2nofp.cx10a_c8r32 | 19.139 | 80.806 | 0.056 | 0.007 | |||||||
| pg1323_o2nofp.cx10a_c8r32 | 6.806 | 93.056 | 0.139 | 0.007 | |||||||
| pg1422_o2nofp.cx10a_c8r32 | 6.611 | 93.250 | 0.139 | 0.008 | |||||||
| pg1517_o2nofp.cx10a_c8r32 | 7.889 | 91.917 | 0.194 | 0.008 | |||||||
| pg1613_o2nofp.cx10a_c8r32 | 7.528 | 92.444 | 0.028 | 0.007 | |||||||
| pg179_o2nofp.cx10a_c8r32 | 5.778 | 94.194 | 0.028 | 0.007 | |||||||
| pg183_o2nofp.cx10b_c8r32 | 5.139 | 94.833 | 0.028 | 0.008 |
Performance metrics for the DBMS listed above. Some are normalized by throughput, others are not. Legend for results is here.
ips	qps	rps	rmbps	wps	wmbps	rpq	rkbpq	wpi	wkbpi	csps	cpups	cspq	cpupq	dbgb1	dbgb2	rss	maxop	p50	p99	tag
100	942	11839	92.7	405.8	4.5	12.563	100.683	4.062	46.377	26534	3.0	28.155	255	154.6	193.6	23.4	0.028	976	576	pg1222_o2nofp.cx10a_c8r32
100	1307	16162	126.3	374.9	4.3	12.368	99.005	3.753	43.833	36147	3.4	27.661	208	154.5	192.0	23.4	0.015	1344	815	pg1323_o2nofp.cx10a_c8r32
100	1304	16145	126.2	369.5	4.2	12.379	99.099	3.702	43.437	36009	3.7	27.610	227	154.5	192.4	23.3	0.013	1344	784	pg1422_o2nofp.cx10a_c8r32
100	1304	16147	126.2	367.3	4.2	12.379	99.102	3.680	43.228	35963	3.2	27.571	196	154.5	191.9	23.3	0.015	1344	816	pg1517_o2nofp.cx10a_c8r32
100	1308	16189	126.6	367.7	4.2	12.376	99.076	3.684	43.314	36058	3.2	27.565	196	154.5	192.1	23.3	0.013	1344	800	pg1613_o2nofp.cx10a_c8r32
100	1301	16100	125.9	358.8	4.2	12.379	99.096	3.596	42.606	35845	3.3	27.561	203	154.5	192.8	23.4	0.012	1328	800	pg179_o2nofp.cx10a_c8r32
100	1297	16052	125.5	358.4	4.2	12.378	99.080	3.591	42.633	35740	3.5	27.560	216	154.5	192.3	23.4	0.014	1328	784	pg183_o2nofp.cx10b_c8r32
Average values from iostat.
r/s	rkB/s	rrqm/s	%rrqm	r_await	rareq-s	w/s	wkB/s	wrqm/s	%wrqm	w_await	wareq-s	d/s	dkB/s	drqm/s	%drqm	d_await	dareq-s	f/s	f_await	aqu-sz	%util
11840.5	94896.7	0.000	0.000	0.060	8.014	404.5	4622.8	9.131	3.726	0.067	14.06	2.042	648.5	0.000	0.000	0.622	65.15	4.171	1.624	0.778	79.10		pg1222_o2nofp.cx10a_c8r32
16165.5	129405	0.000	0.000	0.040	8.005	373.5	4367.9	5.710	2.257	0.065	13.73	2.001	9.600	0.000	0.000	0.482	4.799	4.310	1.662	0.695	73.49		pg1323_o2nofp.cx10a_c8r32
16148.5	129271	0.000	0.000	0.040	8.005	368.2	4324.9	5.410	2.161	0.066	13.73	2.001	10.01	0.000	0.000	0.468	5.003	4.307	1.750	0.698	73.32		pg1422_o2nofp.cx10a_c8r32
16150.4	129295	0.000	0.000	0.040	8.006	366.0	4303.7	3.122	1.275	0.072	13.79	0.002	9.130	0.000	0.000	0.001	22.83	4.321	1.789	0.696	73.94		pg1517_o2nofp.cx10a_c8r32
16192.3	129629	0.000	0.000	0.040	8.006	366.3	4312.3	4.350	1.760	0.072	13.82	0.001	0.002	0.000	0.000	0.000	0.011	4.312	1.739	0.696	73.52		pg1613_o2nofp.cx10a_c8r32
16101.7	128899	0.000	0.000	0.040	8.005	357.6	4242.8	2.619	1.053	0.060	13.84	0.001	0.007	0.000	0.000	0.006	0.033	3.712	1.750	0.689	73.98		pg179_o2nofp.cx10a_c8r32
16054.7	128509	0.000	0.000	0.040	8.004	357.2	4245.2	4.404	1.803	0.066	13.92	0.001	0.002	0.000	0.000	0.000	0.011	3.725	1.760	0.686	73.42		pg183_o2nofp.cx10b_c8r32
qr500.L3
qr500.L3: range queries with 500 insert/s per client. Graphs for performance per 1-second interval are here.
Average throughput:
Query response time histogram: each cell has the percentage of responses that take <= the time in the header and max is the max response time in seconds. For max values in the top 25% of the range have a red background and in the bottom 25% of the range have a green background. The red background is not used when the min value is within 80% of the max value.
| dbms | 256us | 1ms | 4ms | 16ms | 64ms | 256ms | 1s | 4s | 16s | gt | max |
|---|---|---|---|---|---|---|---|---|---|---|---|
| pg1222_o2nofp.cx10a_c8r32 | 99.987 | 0.012 | 0.001 | nonzero | 0.005 | ||||||
| pg1323_o2nofp.cx10a_c8r32 | 99.987 | 0.012 | nonzero | nonzero | nonzero | 0.026 | |||||
| pg1422_o2nofp.cx10a_c8r32 | 99.988 | 0.012 | nonzero | nonzero | nonzero | 0.022 | |||||
| pg1517_o2nofp.cx10a_c8r32 | 99.985 | 0.014 | nonzero | nonzero | nonzero | 0.025 | |||||
| pg1613_o2nofp.cx10a_c8r32 | 99.986 | 0.013 | nonzero | nonzero | nonzero | 0.024 | |||||
| pg179_o2nofp.cx10a_c8r32 | 99.986 | 0.013 | 0.001 | nonzero | nonzero | 0.022 | |||||
| pg183_o2nofp.cx10b_c8r32 | 99.987 | 0.012 | nonzero | nonzero | nonzero | 0.022 |
Insert response time histogram: each cell has the percentage of responses that take <= the time in the header and max is the max response time in seconds. For max values in the top 25% of the range have a red background and in the bottom 25% of the range have a green background. The red background is not used when the min value is within 80% of the max value.
| dbms | 256us | 1ms | 4ms | 16ms | 64ms | 256ms | 1s | 4s | 16s | gt | max |
|---|---|---|---|---|---|---|---|---|---|---|---|
| pg1222_o2nofp.cx10a_c8r32 | 99.861 | 0.139 | 0.032 | ||||||||
| pg1323_o2nofp.cx10a_c8r32 | 99.939 | 0.061 | 0.018 | ||||||||
| pg1422_o2nofp.cx10a_c8r32 | 99.883 | 0.117 | 0.029 | ||||||||
| pg1517_o2nofp.cx10a_c8r32 | 99.967 | 0.033 | 0.017 | ||||||||
| pg1613_o2nofp.cx10a_c8r32 | 99.939 | 0.061 | 0.017 | ||||||||
| pg179_o2nofp.cx10a_c8r32 | 99.961 | 0.039 | 0.018 | ||||||||
| pg183_o2nofp.cx10b_c8r32 | 99.967 | 0.033 | 0.021 |
Delete response time histogram: each cell has the percentage of responses that take <= the time in the header and max is the max response time in seconds. For max values in the top 25% of the range have a red background and in the bottom 25% of the range have a green background. The red background is not used when the min value is within 80% of the max value.
| dbms | 256us | 1ms | 4ms | 16ms | 64ms | 256ms | 1s | 4s | 16s | gt | max |
|---|---|---|---|---|---|---|---|---|---|---|---|
| pg1222_o2nofp.cx10a_c8r32 | 59.078 | 40.922 | 0.013 | ||||||||
| pg1323_o2nofp.cx10a_c8r32 | 52.594 | 47.406 | 0.012 | ||||||||
| pg1422_o2nofp.cx10a_c8r32 | 50.978 | 49.022 | 0.013 | ||||||||
| pg1517_o2nofp.cx10a_c8r32 | 49.178 | 50.822 | 0.012 | ||||||||
| pg1613_o2nofp.cx10a_c8r32 | 50.672 | 49.328 | 0.012 | ||||||||
| pg179_o2nofp.cx10a_c8r32 | 50.667 | 49.333 | 0.012 | ||||||||
| pg183_o2nofp.cx10b_c8r32 | 51.389 | 48.611 | 0.012 |
Performance metrics for the DBMS listed above. Some are normalized by throughput, others are not. Legend for results is here.
ips	qps	rps	rmbps	wps	wmbps	rpq	rkbpq	wpi	wkbpi	csps	cpups	cspq	cpupq	dbgb1	dbgb2	rss	maxop	p50	p99	tag
499	23621	872	6.9	193.0	7.6	0.037	0.299	0.386	15.622	92190	9.8	3.903	33	154.7	191.1	23.4	0.005	23674	22349	pg1222_o2nofp.cx10a_c8r32
500	23906	877	7.0	303.1	8.9	0.037	0.298	0.607	18.199	93225	9.9	3.900	33	154.5	190.3	23.4	0.026	23933	22876	pg1323_o2nofp.cx10a_c8r32
500	23621	878	7.0	320.2	9.1	0.037	0.302	0.641	18.580	92037	9.8	3.896	33	154.5	190.3	23.3	0.022	23688	22669	pg1422_o2nofp.cx10a_c8r32
499	23505	878	7.0	319.1	9.1	0.037	0.304	0.639	18.583	91604	9.9	3.897	34	154.5	190.3	23.3	0.025	23613	22254	pg1517_o2nofp.cx10a_c8r32
499	23648	878	7.0	316.6	9.0	0.037	0.302	0.634	18.537	92150	9.8	3.897	33	154.5	190.3	23.3	0.024	23741	22653	pg1613_o2nofp.cx10a_c8r32
499	23672	878	7.0	342.4	9.3	0.037	0.302	0.686	19.081	92209	9.9	3.895	33	154.5	190.5	23.4	0.022	23772	22698	pg179_o2nofp.cx10a_c8r32
500	23787	878	7.0	344.4	9.3	0.037	0.300	0.689	19.113	92593	10.0	3.893	34	154.5	190.1	23.4	0.022	23821	22813	pg183_o2nofp.cx10b_c8r32
Average values from iostat.
r/s	rkB/s	rrqm/s	%rrqm	r_await	rareq-s	w/s	wkB/s	wrqm/s	%wrqm	w_await	wareq-s	d/s	dkB/s	drqm/s	%drqm	d_await	dareq-s	f/s	f_await	aqu-sz	%util
863.8	6969.4	0.000	0.000	0.071	8.069	193.1	7798.2	7.538	5.746	0.309	70.34	2.100	1479.3	0.000	0.000	0.879	43.67	7.940	1.578	0.109	7.360		pg1222_o2nofp.cx10a_c8r32
867.2	7024.3	0.000	0.000	0.052	8.101	303.4	9094.0	5.786	4.993	0.299	72.35	2.071	1059.4	0.000	0.000	0.743	72.67	8.077	1.559	0.097	5.705		pg1323_o2nofp.cx10a_c8r32
867.4	7025.3	0.000	0.000	0.052	8.101	320.6	9285.4	5.285	4.235	0.305	70.85	2.085	1315.4	0.000	0.000	0.760	43.12	8.066	1.620	0.099	5.816		pg1422_o2nofp.cx10a_c8r32
867.1	7024.3	0.000	0.000	0.052	8.102	319.7	9282.4	2.924	2.162	0.303	72.44	0.068	985.9	0.000	0.000	0.007	41.10	8.104	1.564	0.095	5.606		pg1517_o2nofp.cx10a_c8r32
867.1	7026.2	0.000	0.000	0.052	8.103	317.1	9259.5	3.741	2.696	0.307	72.82	0.077	1113.7	0.000	0.000	0.005	40.97	8.072	1.591	0.095	5.633		pg1613_o2nofp.cx10a_c8r32
867.3	7025.9	0.000	0.000	0.051	8.102	342.9	9531.5	2.881	1.964	0.277	66.23	0.097	1424.0	0.000	0.000	0.005	40.93	7.478	1.610	0.094	5.528		pg179_o2nofp.cx10a_c8r32
867.4	7026.9	0.000	0.000	0.050	8.102	345.0	9553.5	3.671	2.426	0.276	65.22	0.094	1387.5	0.000	0.000	0.007	41.56	7.484	1.609	0.094	5.524		pg183_o2nofp.cx10b_c8r32
qp500.L4
qp500.L4: point queries with 500 insert/s per client. Graphs for performance per 1-second interval are here.
Average throughput:
Query response time histogram: each cell has the percentage of responses that take <= the time in the header and max is the max response time in seconds. For max values in the top 25% of the range have a red background and in the bottom 25% of the range have a green background. The red background is not used when the min value is within 80% of the max value.
| dbms | 256us | 1ms | 4ms | 16ms | 64ms | 256ms | 1s | 4s | 16s | gt | max |
|---|---|---|---|---|---|---|---|---|---|---|---|
| pg1222_o2nofp.cx10a_c8r32 | nonzero | 35.858 | 64.049 | 0.093 | nonzero | 0.025 | |||||
| pg1323_o2nofp.cx10a_c8r32 | 0.001 | 94.694 | 5.284 | 0.021 | nonzero | 0.017 | |||||
| pg1422_o2nofp.cx10a_c8r32 | 0.001 | 94.494 | 5.476 | 0.029 | nonzero | 0.017 | |||||
| pg1517_o2nofp.cx10a_c8r32 | 0.002 | 94.790 | 5.192 | 0.017 | 0.016 | ||||||
| pg1613_o2nofp.cx10a_c8r32 | 0.001 | 94.881 | 5.091 | 0.027 | nonzero | 0.021 | |||||
| pg179_o2nofp.cx10a_c8r32 | 0.001 | 94.487 | 5.489 | 0.023 | nonzero | 0.018 | |||||
| pg183_o2nofp.cx10b_c8r32 | 0.002 | 94.036 | 5.929 | 0.033 | nonzero | 0.017 |
Insert response time histogram: each cell has the percentage of responses that take <= the time in the header and max is the max response time in seconds. For max values in the top 25% of the range have a red background and in the bottom 25% of the range have a green background. The red background is not used when the min value is within 80% of the max value.
| dbms | 256us | 1ms | 4ms | 16ms | 64ms | 256ms | 1s | 4s | 16s | gt | max |
|---|---|---|---|---|---|---|---|---|---|---|---|
| pg1222_o2nofp.cx10a_c8r32 | 99.739 | 0.261 | 0.064 | ||||||||
| pg1323_o2nofp.cx10a_c8r32 | 99.922 | 0.078 | 0.024 | ||||||||
| pg1422_o2nofp.cx10a_c8r32 | 99.911 | 0.089 | 0.026 | ||||||||
| pg1517_o2nofp.cx10a_c8r32 | 99.967 | 0.033 | 0.021 | ||||||||
| pg1613_o2nofp.cx10a_c8r32 | 99.900 | 0.100 | 0.028 | ||||||||
| pg179_o2nofp.cx10a_c8r32 | 99.972 | 0.028 | 0.025 | ||||||||
| pg183_o2nofp.cx10b_c8r32 | 99.911 | 0.089 | 0.023 |
Delete response time histogram: each cell has the percentage of responses that take <= the time in the header and max is the max response time in seconds. For max values in the top 25% of the range have a red background and in the bottom 25% of the range have a green background. The red background is not used when the min value is within 80% of the max value.
| dbms | 256us | 1ms | 4ms | 16ms | 64ms | 256ms | 1s | 4s | 16s | gt | max |
|---|---|---|---|---|---|---|---|---|---|---|---|
| pg1222_o2nofp.cx10a_c8r32 | 99.989 | 0.011 | 0.036 | ||||||||
| pg1323_o2nofp.cx10a_c8r32 | 99.978 | 0.022 | 0.035 | ||||||||
| pg1422_o2nofp.cx10a_c8r32 | 99.972 | 0.028 | 0.036 | ||||||||
| pg1517_o2nofp.cx10a_c8r32 | 99.944 | 0.056 | 0.035 | ||||||||
| pg1613_o2nofp.cx10a_c8r32 | 99.956 | 0.044 | 0.035 | ||||||||
| pg179_o2nofp.cx10a_c8r32 | 98.506 | 1.494 | 0.033 | ||||||||
| pg183_o2nofp.cx10b_c8r32 | 99.711 | 0.289 | 0.034 |
Performance metrics for the DBMS listed above. Some are normalized by throughput, others are not. Legend for results is here.
ips	qps	rps	rmbps	wps	wmbps	rpq	rkbpq	wpi	wkbpi	csps	cpups	cspq	cpupq	dbgb1	dbgb2	rss	maxop	p50	p99	tag
499	905	12368	96.8	1771.0	20.0	13.664	109.461	3.546	40.957	27579	4.7	30.471	415	154.8	189.2	23.4	0.025	928	656	pg1222_o2nofp.cx10a_c8r32
500	1271	16729	130.9	1667.4	19.2	13.163	105.460	3.337	39.325	37316	5.6	29.362	352	154.6	188.8	23.4	0.017	1296	960	pg1323_o2nofp.cx10a_c8r32
500	1267	16684	130.6	1649.2	19.0	13.168	105.514	3.300	39.037	37055	5.3	29.246	335	154.6	188.7	23.3	0.017	1296	960	pg1422_o2nofp.cx10a_c8r32
499	1272	16748	131.0	1647.1	19.0	13.166	105.457	3.298	39.015	37146	5.2	29.203	327	154.6	188.7	23.3	0.016	1296	960	pg1517_o2nofp.cx10a_c8r32
500	1273	16753	131.0	1648.1	19.0	13.157	105.377	3.298	39.027	37163	5.3	29.187	333	154.6	188.7	23.3	0.021	1296	960	pg1613_o2nofp.cx10a_c8r32
500	1265	16654	130.3	1625.6	18.9	13.165	105.449	3.253	38.636	36903	5.3	29.172	335	154.6	188.7	23.4	0.018	1295	960	pg179_o2nofp.cx10a_c8r32
500	1257	16536	129.5	1624.5	18.9	13.153	105.513	3.251	38.636	36649	5.2	29.151	331	154.6	188.3	23.4	0.017	1280	960	pg183_o2nofp.cx10b_c8r32
Average values from iostat.
r/s	rkB/s	rrqm/s	%rrqm	r_await	rareq-s	w/s	wkB/s	wrqm/s	%wrqm	w_await	wareq-s	d/s	dkB/s	drqm/s	%drqm	d_await	dareq-s	f/s	f_await	aqu-sz	%util
12372.0	99108.4	0.000	0.000	0.061	8.011	1754.8	20320.4	11.12	0.902	0.051	13.21	2.081	1214.4	0.000	0.000	0.622	47.76	9.346	1.572	0.887	79.21		pg1222_o2nofp.cx10a_c8r32
16733.2	134062	0.000	0.000	0.040	8.011	1649.5	19507.6	7.958	0.652	0.048	13.37	2.058	929.6	0.000	0.000	0.466	43.87	9.306	1.586	0.792	74.59		pg1323_o2nofp.cx10a_c8r32
16688.2	133721	0.000	0.000	0.040	8.012	1632.9	19377.3	7.303	0.587	0.056	13.37	2.062	977.5	0.000	0.000	0.456	44.31	9.289	1.647	0.801	74.28		pg1422_o2nofp.cx10a_c8r32
16751.4	134171	0.000	0.000	0.040	8.010	1630.9	19355.0	5.137	0.398	0.046	13.38	0.062	965.6	0.000	0.000	0.001	43.99	9.276	1.647	0.788	75.10		pg1517_o2nofp.cx10a_c8r32
16759.0	134226	0.000	0.000	0.040	8.010	1632.9	19380.3	6.526	0.533	0.045	13.39	0.065	983.8	0.000	0.000	0.004	65.67	9.253	1.634	0.789	74.59		pg1613_o2nofp.cx10a_c8r32
16656.9	133419	0.000	0.000	0.040	8.010	1612.0	19199.4	4.549	0.348	0.055	13.39	0.075	1086.2	0.000	0.000	0.002	63.63	9.768	1.659	0.796	74.78		pg179_o2nofp.cx10a_c8r32
16538.0	132671	0.000	0.000	0.040	8.022	1611.6	19204.9	7.219	0.603	0.049	13.39	0.070	1067.9	0.000	0.000	0.005	42.73	9.840	1.644	0.787	74.47		pg183_o2nofp.cx10b_c8r32
qr1000.L5
qr1000.L5: range queries with 1000 insert/s per client. Graphs for performance per 1-second interval are here.
Average throughput:
Query response time histogram: each cell has the percentage of responses that take <= the time in the header and max is the max response time in seconds. For max values in the top 25% of the range have a red background and in the bottom 25% of the range have a green background. The red background is not used when the min value is within 80% of the max value.
| dbms | 256us | 1ms | 4ms | 16ms | 64ms | 256ms | 1s | 4s | 16s | gt | max |
|---|---|---|---|---|---|---|---|---|---|---|---|
| pg1222_o2nofp.cx10a_c8r32 | 99.969 | 0.028 | 0.002 | nonzero | 0.015 | ||||||
| pg1323_o2nofp.cx10a_c8r32 | 99.970 | 0.028 | 0.002 | nonzero | nonzero | nonzero | 0.083 | ||||
| pg1422_o2nofp.cx10a_c8r32 | 99.973 | 0.025 | 0.002 | nonzero | nonzero | nonzero | 0.092 | ||||
| pg1517_o2nofp.cx10a_c8r32 | 99.963 | 0.034 | 0.003 | nonzero | nonzero | nonzero | 0.074 | ||||
| pg1613_o2nofp.cx10a_c8r32 | 99.964 | 0.033 | 0.002 | nonzero | nonzero | nonzero | 0.092 | ||||
| pg179_o2nofp.cx10a_c8r32 | 99.972 | 0.026 | 0.002 | nonzero | nonzero | nonzero | 0.092 | ||||
| pg183_o2nofp.cx10b_c8r32 | 99.969 | 0.029 | 0.002 | nonzero | nonzero | nonzero | 0.090 |
Insert response time histogram: each cell has the percentage of responses that take <= the time in the header and max is the max response time in seconds. For max values in the top 25% of the range have a red background and in the bottom 25% of the range have a green background. The red background is not used when the min value is within 80% of the max value.
| dbms | 256us | 1ms | 4ms | 16ms | 64ms | 256ms | 1s | 4s | 16s | gt | max |
|---|---|---|---|---|---|---|---|---|---|---|---|
| pg1222_o2nofp.cx10a_c8r32 | 0.011 | 99.947 | 0.042 | 0.021 | |||||||
| pg1323_o2nofp.cx10a_c8r32 | 0.447 | 99.536 | 0.017 | 0.024 | |||||||
| pg1422_o2nofp.cx10a_c8r32 | 0.414 | 99.531 | 0.056 | 0.024 | |||||||
| pg1517_o2nofp.cx10a_c8r32 | 0.264 | 99.689 | 0.047 | 0.043 | |||||||
| pg1613_o2nofp.cx10a_c8r32 | 0.217 | 99.733 | 0.050 | 0.030 | |||||||
| pg179_o2nofp.cx10a_c8r32 | 0.394 | 99.581 | 0.025 | 0.021 | |||||||
| pg183_o2nofp.cx10b_c8r32 | 0.408 | 99.578 | 0.014 | 0.021 |
Delete response time histogram: each cell has the percentage of responses that take <= the time in the header and max is the max response time in seconds. For max values in the top 25% of the range have a red background and in the bottom 25% of the range have a green background. The red background is not used when the min value is within 80% of the max value.
| dbms | 256us | 1ms | 4ms | 16ms | 64ms | 256ms | 1s | 4s | 16s | gt | max |
|---|---|---|---|---|---|---|---|---|---|---|---|
| pg1222_o2nofp.cx10a_c8r32 | 30.700 | 69.300 | 0.054 | ||||||||
| pg1323_o2nofp.cx10a_c8r32 | 22.964 | 77.036 | 0.052 | ||||||||
| pg1422_o2nofp.cx10a_c8r32 | 24.647 | 75.353 | 0.053 | ||||||||
| pg1517_o2nofp.cx10a_c8r32 | 22.431 | 77.569 | 0.052 | ||||||||
| pg1613_o2nofp.cx10a_c8r32 | 18.225 | 81.775 | 0.051 | ||||||||
| pg179_o2nofp.cx10a_c8r32 | 11.950 | 88.050 | 0.049 | ||||||||
| pg183_o2nofp.cx10b_c8r32 | 17.703 | 82.297 | 0.050 |
Performance metrics for the DBMS listed above. Some are normalized by throughput, others are not. Legend for results is here.
ips	qps	rps	rmbps	wps	wmbps	rpq	rkbpq	wpi	wkbpi	csps	cpups	cspq	cpupq	dbgb1	dbgb2	rss	maxop	p50	p99	tag
999	19578	1498	11.9	761.9	16.8	0.077	0.622	0.763	17.218	78326	15.3	4.001	63	154.9	188.3	23.4	0.015	19582	18089	pg1222_o2nofp.cx10a_c8r32
999	19823	1510	12.1	894.1	18.6	0.076	0.623	0.895	19.091	79253	15.6	3.998	63	154.8	187.9	23.4	0.083	19821	18317	pg1323_o2nofp.cx10a_c8r32
999	19500	1510	12.1	909.2	18.8	0.077	0.634	0.910	19.293	77806	15.5	3.990	64	154.8	187.8	23.3	0.092	19486	18010	pg1422_o2nofp.cx10a_c8r32
999	19235	1509	12.0	907.6	18.8	0.078	0.641	0.908	19.283	76745	15.6	3.990	65	154.8	187.8	23.3	0.074	19213	17626	pg1517_o2nofp.cx10a_c8r32
999	19037	1510	12.1	907.3	18.8	0.079	0.649	0.908	19.281	75996	15.8	3.992	66	154.8	187.8	23.3	0.092	19033	17437	pg1613_o2nofp.cx10a_c8r32
999	19186	1510	12.1	913.9	18.9	0.079	0.644	0.914	19.413	76494	16.1	3.987	67	154.8	187.8	23.4	0.092	19197	17613	pg179_o2nofp.cx10a_c8r32
999	19338	1508	12.1	912.2	18.9	0.078	0.638	0.913	19.410	77066	15.9	3.985	66	154.8	187.5	23.4	0.090	19384	17675	pg183_o2nofp.cx10b_c8r32
Average values from iostat.
r/s	rkB/s	rrqm/s	%rrqm	r_await	rareq-s	w/s	wkB/s	wrqm/s	%wrqm	w_await	wareq-s	d/s	dkB/s	drqm/s	%drqm	d_await	dareq-s	f/s	f_await	aqu-sz	%util
1490.5	12033.2	0.000	0.000	0.060	8.075	761.8	17175.7	11.01	1.998	0.153	34.95	2.042	612.2	0.000	0.000	0.611	66.41	13.08	1.562	0.205	11.31		pg1222_o2nofp.cx10a_c8r32
1498.9	12166.2	0.000	0.000	0.050	8.120	895.0	19071.8	8.418	1.645	0.167	38.13	2.042	621.3	0.000	0.000	0.721	66.02	13.26	1.551	0.198	9.774		pg1323_o2nofp.cx10a_c8r32
1498.7	12169.2	0.000	0.000	0.050	8.124	910.1	19272.2	7.699	1.462	0.168	37.94	2.042	612.5	0.000	0.000	0.783	40.43	13.34	1.620	0.199	10.05		pg1422_o2nofp.cx10a_c8r32
1497.8	12155.6	0.000	0.000	0.050	8.119	908.5	19265.5	5.713	0.987	0.167	38.26	0.040	602.5	0.000	0.000	0.006	43.05	13.42	1.569	0.201	9.905		pg1517_o2nofp.cx10a_c8r32
1498.8	12164.4	0.000	0.000	0.050	8.119	908.1	19258.8	7.015	1.296	0.159	37.73	0.040	602.5	0.000	0.000	0.005	42.44	13.40	1.596	0.194	9.952		pg1613_o2nofp.cx10a_c8r32
1498.8	12164.5	0.000	0.000	0.050	8.120	914.7	19391.7	4.916	0.847	0.151	38.30	0.043	602.5	0.000	0.000	0.006	39.14	13.43	1.585	0.186	9.811		pg179_o2nofp.cx10a_c8r32
1497.2	12152.0	0.000	0.000	0.050	8.120	912.8	19389.7	6.438	1.180	0.158	37.21	0.041	574.0	0.000	0.000	0.004	39.40	13.43	1.613	0.188	9.832		pg183_o2nofp.cx10b_c8r32
qp1000.L6
qp1000.L6: point queries with 1000 insert/s per client. Graphs for performance per 1-second interval are here.
Average throughput:
Query response time histogram: each cell has the percentage of responses that take <= the time in the header and max is the max response time in seconds. For max values in the top 25% of the range have a red background and in the bottom 25% of the range have a green background. The red background is not used when the min value is within 80% of the max value.
| dbms | 256us | 1ms | 4ms | 16ms | 64ms | 256ms | 1s | 4s | 16s | gt | max |
|---|---|---|---|---|---|---|---|---|---|---|---|
| pg1222_o2nofp.cx10a_c8r32 | 21.559 | 78.307 | 0.134 | nonzero | 0.018 | ||||||
| pg1323_o2nofp.cx10a_c8r32 | nonzero | 89.608 | 10.355 | 0.037 | nonzero | 0.030 | |||||
| pg1422_o2nofp.cx10a_c8r32 | 0.001 | 89.320 | 10.631 | 0.048 | nonzero | 0.021 | |||||
| pg1517_o2nofp.cx10a_c8r32 | 0.001 | 89.327 | 10.611 | 0.061 | nonzero | 0.023 | |||||
| pg1613_o2nofp.cx10a_c8r32 | 0.001 | 88.994 | 10.972 | 0.034 | nonzero | 0.020 | |||||
| pg179_o2nofp.cx10a_c8r32 | 0.001 | 88.972 | 10.997 | 0.031 | nonzero | 0.017 | |||||
| pg183_o2nofp.cx10b_c8r32 | nonzero | 88.521 | 11.440 | 0.039 | 0.014 |
Insert response time histogram: each cell has the percentage of responses that take <= the time in the header and max is the max response time in seconds. For max values in the top 25% of the range have a red background and in the bottom 25% of the range have a green background. The red background is not used when the min value is within 80% of the max value.
| dbms | 256us | 1ms | 4ms | 16ms | 64ms | 256ms | 1s | 4s | 16s | gt | max |
|---|---|---|---|---|---|---|---|---|---|---|---|
| pg1222_o2nofp.cx10a_c8r32 | 99.939 | 0.061 | 0.026 | ||||||||
| pg1323_o2nofp.cx10a_c8r32 | 99.958 | 0.042 | 0.020 | ||||||||
| pg1422_o2nofp.cx10a_c8r32 | 0.003 | 99.906 | 0.092 | 0.033 | |||||||
| pg1517_o2nofp.cx10a_c8r32 | 99.900 | 0.100 | 0.021 | ||||||||
| pg1613_o2nofp.cx10a_c8r32 | 0.003 | 99.939 | 0.058 | 0.040 | |||||||
| pg179_o2nofp.cx10a_c8r32 | 99.972 | 0.028 | 0.021 | ||||||||
| pg183_o2nofp.cx10b_c8r32 | 99.964 | 0.036 | 0.023 |
Delete response time histogram: each cell has the percentage of responses that take <= the time in the header and max is the max response time in seconds. For max values in the top 25% of the range have a red background and in the bottom 25% of the range have a green background. The red background is not used when the min value is within 80% of the max value.
| dbms | 256us | 1ms | 4ms | 16ms | 64ms | 256ms | 1s | 4s | 16s | gt | max |
|---|---|---|---|---|---|---|---|---|---|---|---|
| pg1222_o2nofp.cx10a_c8r32 | 99.997 | 0.003 | 0.084 | ||||||||
| pg1323_o2nofp.cx10a_c8r32 | 99.997 | 0.003 | 0.084 | ||||||||
| pg1422_o2nofp.cx10a_c8r32 | 99.997 | 0.003 | 0.086 | ||||||||
| pg1517_o2nofp.cx10a_c8r32 | 99.997 | 0.003 | 0.083 | ||||||||
| pg1613_o2nofp.cx10a_c8r32 | 99.997 | 0.003 | 0.084 | ||||||||
| pg179_o2nofp.cx10a_c8r32 | 99.997 | 0.003 | 0.080 | ||||||||
| pg183_o2nofp.cx10b_c8r32 | 99.997 | 0.003 | 0.081 |
Performance metrics for the DBMS listed above. Some are normalized by throughput, others are not. Legend for results is here.
ips	qps	rps	rmbps	wps	wmbps	rpq	rkbpq	wpi	wkbpi	csps	cpups	cspq	cpupq	dbgb1	dbgb2	rss	maxop	p50	p99	tag
999	829	12769	99.9	3023.7	37.3	15.401	123.332	3.027	38.235	28482	12.0	34.353	1158	155.2	193.6	23.4	0.018	848	560	pg1222_o2nofp.cx10a_c8r32
999	1192	17151	134.2	2906.7	35.7	14.390	115.330	2.908	36.586	38275	13.0	32.113	873	155.0	191.8	23.4	0.030	1216	768	pg1323_o2nofp.cx10a_c8r32
999	1188	17107	133.9	2891.3	35.4	14.402	115.473	2.893	36.307	37880	12.9	31.891	869	155.0	191.4	23.3	0.021	1216	768	pg1422_o2nofp.cx10a_c8r32
999	1185	17060	133.5	2889.3	35.4	14.401	115.374	2.891	36.282	37726	12.8	31.847	864	155.0	191.4	23.3	0.023	1216	752	pg1517_o2nofp.cx10a_c8r32
999	1181	17028	133.2	2886.3	35.4	14.420	115.512	2.890	36.283	37659	13.1	31.893	888	155.0	191.4	23.3	0.020	1215	768	pg1613_o2nofp.cx10a_c8r32
999	1182	17022	133.2	2888.5	35.0	14.406	115.409	2.890	35.847	37530	13.5	31.762	914	155.0	190.6	23.4	0.017	1215	768	pg179_o2nofp.cx10a_c8r32
999	1176	16931	132.5	2891.2	35.1	14.394	115.362	2.893	36.008	37332	13.1	31.739	891	155.0	190.5	23.4	0.014	1200	768	pg183_o2nofp.cx10b_c8r32
Average values from iostat.
r/s	rkB/s	rrqm/s	%rrqm	r_await	rareq-s	w/s	wkB/s	wrqm/s	%wrqm	w_await	wareq-s	d/s	dkB/s	drqm/s	%drqm	d_await	dareq-s	f/s	f_await	aqu-sz	%util
12773.5	102292	0.000	0.000	0.061	8.008	2989.5	37907.2	20.24	0.854	0.051	14.00	2.003	18.90	0.000	0.000	0.555	9.009	14.21	1.532	0.975	77.62		pg1222_o2nofp.cx10a_c8r32
17157.5	137510	0.000	0.000	0.040	8.015	2874.9	36315.9	13.17	0.564	0.050	13.75	2.002	9.720	0.000	0.000	0.450	4.847	13.99	1.549	0.893	72.82		pg1323_o2nofp.cx10a_c8r32
17111.2	137194	0.000	0.000	0.040	8.017	2862.1	36057.7	12.15	0.533	0.055	13.70	1.999	10.09	0.000	0.000	0.478	5.360	13.96	1.562	0.899	72.91		pg1422_o2nofp.cx10a_c8r32
17065.1	136714	0.000	0.000	0.040	8.012	2860.1	36033.0	9.751	0.437	0.055	13.71	0.004	0.181	0.000	0.000	0.015	0.635	14.01	1.558	0.898	72.72		pg1517_o2nofp.cx10a_c8r32
17033.9	136447	0.000	0.000	0.040	8.011	2857.1	36012.0	11.83	0.504	0.049	13.71	0.002	0.109	0.000	0.000	0.001	0.279	13.92	1.548	0.880	72.54		pg1613_o2nofp.cx10a_c8r32
17028.5	136419	0.000	0.000	0.040	8.011	2863.5	35633.1	7.810	0.335	0.049	13.53	0.002	0.096	0.000	0.000	0.004	0.245	13.90	1.549	0.882	72.40		pg179_o2nofp.cx10a_c8r32
16936.0	135732	0.000	0.000	0.040	8.015	2866.9	35800.7	10.21	0.436	0.048	13.60	0.002	0.091	0.000	0.000	0.003	0.234	13.96	1.555	0.880	72.34		pg183_o2nofp.cx10b_c8r32
l.i0
l.i0: load without secondary indexes
Performance metrics for all DBMS, not just the ones listed above. Some are normalized by throughput, others are not. Legend for results is here.
ips	qps	rps	rmbps	wps	wmbps	rpq	rkbpq	wpi	wkbpi	csps	cpups	cspq	cpupq	dbgb1	dbgb2	rss	maxop	p50	p99	tag
201613	0	37	0.3	814.7	82.7	0.000	0.001	0.004	0.420	24024	20.3	0.119	8	76.5	116.6	19.2	0.031	202575	196785	pg1222_o2nofp.cx10a_c8r32
208388	0	34	0.3	779.9	85.8	0.000	0.001	0.004	0.422	24767	20.7	0.119	8	76.5	116.6	18.4	0.035	209676	203077	pg1323_o2nofp.cx10a_c8r32
200501	0	37	0.3	752.1	82.8	0.000	0.001	0.004	0.423	23279	20.0	0.116	8	76.5	116.6	2.3	0.032	201674	192279	pg1422_o2nofp.cx10a_c8r32
206665	0	35	0.3	771.4	85.1	0.000	0.001	0.004	0.422	24027	19.8	0.116	8	76.5	116.6	18.7	0.038	208073	200677	pg1517_o2nofp.cx10a_c8r32
209096	0	35	0.3	781.4	86.0	0.000	0.001	0.004	0.421	24291	20.0	0.116	8	76.5	116.6	18.9	0.038	210385	203169	pg1613_o2nofp.cx10a_c8r32
211977	0	40	0.3	790.9	87.2	0.000	0.002	0.004	0.421	21046	20.2	0.099	8	76.5	116.6	18.7	0.045	213369	206172	pg179_o2nofp.cx10a_c8r32
211977	0	36	0.3	798.7	87.8	0.000	0.001	0.004	0.424	21043	20.3	0.099	8	76.5	116.6	18.5	0.027	213363	206161	pg183_o2nofp.cx10b_c8r32
l.x
l.x: create secondary indexes
Performance metrics for all DBMS, not just the ones listed above. Some are normalized by throughput, others are not. Legend for results is here.
ips	qps	rps	rmbps	wps	wmbps	rpq	rkbpq	wpi	wkbpi	csps	cpups	cspq	cpupq	dbgb1	dbgb2	rss	maxop	p50	p99	tag
371402	0	1031	124.5	1827.4	187.1	0.003	0.343	0.005	0.516	1201	13.5	0.003	3	153.8	193.8	23.4	0.003	NA	NA	pg1222_o2nofp.cx10a_c8r32
375234	0	1530	139.5	1144.8	137.2	0.004	0.381	0.003	0.374	1470	12.5	0.004	3	153.6	193.7	23.4	0.003	NA	NA	pg1323_o2nofp.cx10a_c8r32
372440	0	1526	138.7	1131.9	136.0	0.004	0.381	0.003	0.374	1436	12.5	0.004	3	153.6	193.7	23.4	0.005	NA	NA	pg1422_o2nofp.cx10a_c8r32
392157	0	1670	160.7	1202.5	146.5	0.004	0.420	0.003	0.383	1607	12.7	0.004	3	153.6	193.7	23.4	0.004	NA	NA	pg1517_o2nofp.cx10a_c8r32
402414	0	1197	140.3	1234.8	150.6	0.003	0.357	0.003	0.383	1026	12.8	0.003	3	153.6	193.7	23.5	0.003	NA	NA	pg1613_o2nofp.cx10a_c8r32
400601	0	1216	140.8	1229.2	149.8	0.003	0.360	0.003	0.383	1030	12.8	0.003	3	153.6	193.7	23.4	0.002	NA	NA	pg179_o2nofp.cx10a_c8r32
404858	0	1264	143.9	1240.9	151.0	0.003	0.364	0.003	0.382	1082	12.8	0.003	3	153.6	193.7	23.4	0.007	NA	NA	pg183_o2nofp.cx10b_c8r32
l.i1
l.i1: continue load after secondary indexes created with 50 inserts per transaction
Performance metrics for all DBMS, not just the ones listed above. Some are normalized by throughput, others are not. Legend for results is here.
ips	qps	rps	rmbps	wps	wmbps	rpq	rkbpq	wpi	wkbpi	csps	cpups	cspq	cpupq	dbgb1	dbgb2	rss	maxop	p50	p99	tag
4102	0	5222	41.2	4796.1	85.9	1.273	10.280	1.169	21.452	12679	16.1	3.091	314	154.4	194.5	23.3	0.051	3350	2100	pg1222_o2nofp.cx10a_c8r32
3980	0	5741	45.2	4686.9	80.4	1.442	11.637	1.178	20.694	13608	16.2	3.419	326	154.3	194.3	22.9	0.037	3149	2150	pg1323_o2nofp.cx10a_c8r32
3918	0	5634	44.4	4757.6	87.0	1.438	11.607	1.214	22.741	12958	16.0	3.308	327	154.3	194.3	23.1	0.137	3198	2050	pg1422_o2nofp.cx10a_c8r32
3872	0	5594	44.1	4574.8	78.5	1.445	11.656	1.181	20.746	12716	15.8	3.284	326	154.3	194.3	22.9	0.048	3049	2050	pg1517_o2nofp.cx10a_c8r32
3781	0	5440	42.9	4491.9	77.3	1.439	11.609	1.188	20.929	12382	15.6	3.275	330	154.3	194.3	21.7	0.027	2900	1949	pg1613_o2nofp.cx10a_c8r32
3597	0	5163	40.7	4234.3	72.9	1.435	11.581	1.177	20.765	11599	15.4	3.224	343	154.3	194.3	22.7	0.042	2748	1899	pg179_o2nofp.cx10a_c8r32
3697	0	5313	41.9	4387.0	75.2	1.437	11.596	1.187	20.828	11925	15.5	3.226	335	154.3	194.3	22.8	0.035	2850	2000	pg183_o2nofp.cx10b_c8r32
l.i2
l.i2: continue load after secondary indexes created with 5 inserts per transaction
Performance metrics for all DBMS, not just the ones listed above. Some are normalized by throughput, others are not. Legend for results is here.
ips	qps	rps	rmbps	wps	wmbps	rpq	rkbpq	wpi	wkbpi	csps	cpups	cspq	cpupq	dbgb1	dbgb2	rss	maxop	p50	p99	tag
201	0	215	1.7	487.7	6.8	1.072	8.606	2.431	34.821	1858	13.4	9.264	5344	154.6	194.6	23.3	0.013	200	180	pg1222_o2nofp.cx10a_c8r32
195	0	209	1.7	565.0	7.6	1.073	8.687	2.896	40.095	1804	13.4	9.245	5495	154.4	194.5	23.0	0.016	195	175	pg1323_o2nofp.cx10a_c8r32
196	0	210	1.7	561.1	7.9	1.072	8.685	2.861	41.245	1503	13.2	7.665	5385	154.4	194.5	23.3	0.017	195	175	pg1422_o2nofp.cx10a_c8r32
183	0	196	1.5	529.2	7.3	1.071	8.679	2.896	40.733	1353	13.0	7.408	5692	154.4	194.5	22.9	0.015	180	165	pg1517_o2nofp.cx10a_c8r32
169	0	181	1.4	489.2	6.8	1.070	8.671	2.898	41.358	1260	12.9	7.465	6114	154.4	194.5	22.9	0.020	165	150	pg1613_o2nofp.cx10a_c8r32
166	0	178	1.4	499.3	6.8	1.069	8.661	2.999	41.815	1078	12.7	6.477	6102	154.4	194.5	22.8	0.016	165	150	pg179_o2nofp.cx10a_c8r32
179	0	191	1.5	513.6	7.1	1.071	8.674	2.874	40.889	1179	12.8	6.597	5730	154.4	194.5	22.8	0.011	175	160	pg183_o2nofp.cx10b_c8r32
qr100.L1
qr100.L1: range queries with 100 insert/s per client
Performance metrics for all DBMS, not just the ones listed above. Some are normalized by throughput, others are not. Legend for results is here.
ips	qps	rps	rmbps	wps	wmbps	rpq	rkbpq	wpi	wkbpi	csps	cpups	cspq	cpupq	dbgb1	dbgb2	rss	maxop	p50	p99	tag
100	25254	112	0.9	24.4	1.5	0.004	0.036	0.245	15.682	96694	8.6	3.829	27	154.6	194.7	23.4	0.005	25180	24796	pg1222_o2nofp.cx10a_c8r32
100	25489	112	0.9	58.3	1.8	0.004	0.036	0.585	18.632	97647	8.6	3.831	27	154.4	192.0	23.4	0.005	25641	24924	pg1323_o2nofp.cx10a_c8r32
100	25098	111	0.9	63.6	1.9	0.004	0.036	0.637	19.072	96087	8.6	3.828	27	154.5	192.4	23.3	0.004	25003	24667	pg1422_o2nofp.cx10a_c8r32
100	25078	111	0.9	61.6	1.8	0.004	0.037	0.617	18.883	95970	8.8	3.827	28	154.4	191.9	23.3	0.011	25067	24727	pg1517_o2nofp.cx10a_c8r32
100	25139	112	0.9	61.4	1.8	0.004	0.037	0.615	18.885	96209	8.6	3.827	27	154.4	192.1	23.3	0.010	25099	24877	pg1613_o2nofp.cx10a_c8r32
100	25204	113	0.9	67.5	1.9	0.004	0.037	0.677	19.522	96444	8.6	3.827	27	154.4	192.8	23.4	0.009	25132	24829	pg179_o2nofp.cx10a_c8r32
100	25187	111	0.9	68.6	1.9	0.004	0.036	0.687	19.605	96380	8.9	3.827	28	154.4	192.3	23.4	0.010	25084	24697	pg183_o2nofp.cx10b_c8r32
qp100.L2
qp100.L2: point queries with 100 insert/s per client
Performance metrics for all DBMS, not just the ones listed above. Some are normalized by throughput, others are not. Legend for results is here.
ips	qps	rps	rmbps	wps	wmbps	rpq	rkbpq	wpi	wkbpi	csps	cpups	cspq	cpupq	dbgb1	dbgb2	rss	maxop	p50	p99	tag
100	942	11839	92.7	405.8	4.5	12.563	100.683	4.062	46.377	26534	3.0	28.155	255	154.6	193.6	23.4	0.028	976	576	pg1222_o2nofp.cx10a_c8r32
100	1307	16162	126.3	374.9	4.3	12.368	99.005	3.753	43.833	36147	3.4	27.661	208	154.5	192.0	23.4	0.015	1344	815	pg1323_o2nofp.cx10a_c8r32
100	1304	16145	126.2	369.5	4.2	12.379	99.099	3.702	43.437	36009	3.7	27.610	227	154.5	192.4	23.3	0.013	1344	784	pg1422_o2nofp.cx10a_c8r32
100	1304	16147	126.2	367.3	4.2	12.379	99.102	3.680	43.228	35963	3.2	27.571	196	154.5	191.9	23.3	0.015	1344	816	pg1517_o2nofp.cx10a_c8r32
100	1308	16189	126.6	367.7	4.2	12.376	99.076	3.684	43.314	36058	3.2	27.565	196	154.5	192.1	23.3	0.013	1344	800	pg1613_o2nofp.cx10a_c8r32
100	1301	16100	125.9	358.8	4.2	12.379	99.096	3.596	42.606	35845	3.3	27.561	203	154.5	192.8	23.4	0.012	1328	800	pg179_o2nofp.cx10a_c8r32
100	1297	16052	125.5	358.4	4.2	12.378	99.080	3.591	42.633	35740	3.5	27.560	216	154.5	192.3	23.4	0.014	1328	784	pg183_o2nofp.cx10b_c8r32
qr500.L3
qr500.L3: range queries with 500 insert/s per client
Performance metrics for all DBMS, not just the ones listed above. Some are normalized by throughput, others are not. Legend for results is here.
ips	qps	rps	rmbps	wps	wmbps	rpq	rkbpq	wpi	wkbpi	csps	cpups	cspq	cpupq	dbgb1	dbgb2	rss	maxop	p50	p99	tag
499	23621	872	6.9	193.0	7.6	0.037	0.299	0.386	15.622	92190	9.8	3.903	33	154.7	191.1	23.4	0.005	23674	22349	pg1222_o2nofp.cx10a_c8r32
500	23906	877	7.0	303.1	8.9	0.037	0.298	0.607	18.199	93225	9.9	3.900	33	154.5	190.3	23.4	0.026	23933	22876	pg1323_o2nofp.cx10a_c8r32
500	23621	878	7.0	320.2	9.1	0.037	0.302	0.641	18.580	92037	9.8	3.896	33	154.5	190.3	23.3	0.022	23688	22669	pg1422_o2nofp.cx10a_c8r32
499	23505	878	7.0	319.1	9.1	0.037	0.304	0.639	18.583	91604	9.9	3.897	34	154.5	190.3	23.3	0.025	23613	22254	pg1517_o2nofp.cx10a_c8r32
499	23648	878	7.0	316.6	9.0	0.037	0.302	0.634	18.537	92150	9.8	3.897	33	154.5	190.3	23.3	0.024	23741	22653	pg1613_o2nofp.cx10a_c8r32
499	23672	878	7.0	342.4	9.3	0.037	0.302	0.686	19.081	92209	9.9	3.895	33	154.5	190.5	23.4	0.022	23772	22698	pg179_o2nofp.cx10a_c8r32
500	23787	878	7.0	344.4	9.3	0.037	0.300	0.689	19.113	92593	10.0	3.893	34	154.5	190.1	23.4	0.022	23821	22813	pg183_o2nofp.cx10b_c8r32
qp500.L4
qp500.L4: point queries with 500 insert/s per client
Performance metrics for all DBMS, not just the ones listed above. Some are normalized by throughput, others are not. Legend for results is here.
ips	qps	rps	rmbps	wps	wmbps	rpq	rkbpq	wpi	wkbpi	csps	cpups	cspq	cpupq	dbgb1	dbgb2	rss	maxop	p50	p99	tag
499	905	12368	96.8	1771.0	20.0	13.664	109.461	3.546	40.957	27579	4.7	30.471	415	154.8	189.2	23.4	0.025	928	656	pg1222_o2nofp.cx10a_c8r32
500	1271	16729	130.9	1667.4	19.2	13.163	105.460	3.337	39.325	37316	5.6	29.362	352	154.6	188.8	23.4	0.017	1296	960	pg1323_o2nofp.cx10a_c8r32
500	1267	16684	130.6	1649.2	19.0	13.168	105.514	3.300	39.037	37055	5.3	29.246	335	154.6	188.7	23.3	0.017	1296	960	pg1422_o2nofp.cx10a_c8r32
499	1272	16748	131.0	1647.1	19.0	13.166	105.457	3.298	39.015	37146	5.2	29.203	327	154.6	188.7	23.3	0.016	1296	960	pg1517_o2nofp.cx10a_c8r32
500	1273	16753	131.0	1648.1	19.0	13.157	105.377	3.298	39.027	37163	5.3	29.187	333	154.6	188.7	23.3	0.021	1296	960	pg1613_o2nofp.cx10a_c8r32
500	1265	16654	130.3	1625.6	18.9	13.165	105.449	3.253	38.636	36903	5.3	29.172	335	154.6	188.7	23.4	0.018	1295	960	pg179_o2nofp.cx10a_c8r32
500	1257	16536	129.5	1624.5	18.9	13.153	105.513	3.251	38.636	36649	5.2	29.151	331	154.6	188.3	23.4	0.017	1280	960	pg183_o2nofp.cx10b_c8r32
qr1000.L5
qr1000.L5: range queries with 1000 insert/s per client
Performance metrics for all DBMS, not just the ones listed above. Some are normalized by throughput, others are not. Legend for results is here.
ips	qps	rps	rmbps	wps	wmbps	rpq	rkbpq	wpi	wkbpi	csps	cpups	cspq	cpupq	dbgb1	dbgb2	rss	maxop	p50	p99	tag
999	19578	1498	11.9	761.9	16.8	0.077	0.622	0.763	17.218	78326	15.3	4.001	63	154.9	188.3	23.4	0.015	19582	18089	pg1222_o2nofp.cx10a_c8r32
999	19823	1510	12.1	894.1	18.6	0.076	0.623	0.895	19.091	79253	15.6	3.998	63	154.8	187.9	23.4	0.083	19821	18317	pg1323_o2nofp.cx10a_c8r32
999	19500	1510	12.1	909.2	18.8	0.077	0.634	0.910	19.293	77806	15.5	3.990	64	154.8	187.8	23.3	0.092	19486	18010	pg1422_o2nofp.cx10a_c8r32
999	19235	1509	12.0	907.6	18.8	0.078	0.641	0.908	19.283	76745	15.6	3.990	65	154.8	187.8	23.3	0.074	19213	17626	pg1517_o2nofp.cx10a_c8r32
999	19037	1510	12.1	907.3	18.8	0.079	0.649	0.908	19.281	75996	15.8	3.992	66	154.8	187.8	23.3	0.092	19033	17437	pg1613_o2nofp.cx10a_c8r32
999	19186	1510	12.1	913.9	18.9	0.079	0.644	0.914	19.413	76494	16.1	3.987	67	154.8	187.8	23.4	0.092	19197	17613	pg179_o2nofp.cx10a_c8r32
999	19338	1508	12.1	912.2	18.9	0.078	0.638	0.913	19.410	77066	15.9	3.985	66	154.8	187.5	23.4	0.090	19384	17675	pg183_o2nofp.cx10b_c8r32
qp1000.L6
qp1000.L6: point queries with 1000 insert/s per client
Performance metrics for all DBMS, not just the ones listed above. Some are normalized by throughput, others are not. Legend for results is here.
ips	qps	rps	rmbps	wps	wmbps	rpq	rkbpq	wpi	wkbpi	csps	cpups	cspq	cpupq	dbgb1	dbgb2	rss	maxop	p50	p99	tag
999	829	12769	99.9	3023.7	37.3	15.401	123.332	3.027	38.235	28482	12.0	34.353	1158	155.2	193.6	23.4	0.018	848	560	pg1222_o2nofp.cx10a_c8r32
999	1192	17151	134.2	2906.7	35.7	14.390	115.330	2.908	36.586	38275	13.0	32.113	873	155.0	191.8	23.4	0.030	1216	768	pg1323_o2nofp.cx10a_c8r32
999	1188	17107	133.9	2891.3	35.4	14.402	115.473	2.893	36.307	37880	12.9	31.891	869	155.0	191.4	23.3	0.021	1216	768	pg1422_o2nofp.cx10a_c8r32
999	1185	17060	133.5	2889.3	35.4	14.401	115.374	2.891	36.282	37726	12.8	31.847	864	155.0	191.4	23.3	0.023	1216	752	pg1517_o2nofp.cx10a_c8r32
999	1181	17028	133.2	2886.3	35.4	14.420	115.512	2.890	36.283	37659	13.1	31.893	888	155.0	191.4	23.3	0.020	1215	768	pg1613_o2nofp.cx10a_c8r32
999	1182	17022	133.2	2888.5	35.0	14.406	115.409	2.890	35.847	37530	13.5	31.762	914	155.0	190.6	23.4	0.017	1215	768	pg179_o2nofp.cx10a_c8r32
999	1176	16931	132.5	2891.2	35.1	14.394	115.362	2.893	36.008	37332	13.1	31.739	891	155.0	190.5	23.4	0.014	1200	768	pg183_o2nofp.cx10b_c8r32
l.i0
- l.i0: load without secondary indexes
- Legend for results is here.
- Each entry lists the percentage of responses that fit in that bucket (slower than max time for previous bucket, faster than min time for next bucket).
Insert response time histogram
256us	1ms	4ms	16ms	64ms	256ms	1s	4s	16s	gt	max	tag
0.000	99.964	0.035	nonzero	nonzero	0.000	0.000	0.000	0.000	0.000	0.031	pg1222_o2nofp.cx10a_c8r32
0.000	99.966	0.031	0.002	nonzero	0.000	0.000	0.000	0.000	0.000	0.035	pg1323_o2nofp.cx10a_c8r32
0.000	99.956	0.036	0.007	0.001	0.000	0.000	0.000	0.000	0.000	0.032	pg1422_o2nofp.cx10a_c8r32
0.000	99.972	0.025	0.003	nonzero	0.000	0.000	0.000	0.000	0.000	0.038	pg1517_o2nofp.cx10a_c8r32
0.000	99.973	0.024	0.003	nonzero	0.000	0.000	0.000	0.000	0.000	0.038	pg1613_o2nofp.cx10a_c8r32
0.000	99.975	0.022	0.003	0.001	0.000	0.000	0.000	0.000	0.000	0.045	pg179_o2nofp.cx10a_c8r32
0.000	99.974	0.022	0.005	nonzero	0.000	0.000	0.000	0.000	0.000	0.027	pg183_o2nofp.cx10b_c8r32
l.x
- l.x: create secondary indexes
- Legend for results is here.
- Each entry lists the percentage of responses that fit in that bucket (slower than max time for previous bucket, faster than min time for next bucket).
TODO - determine whether there is data for create index response time
l.i1
- l.i1: continue load after secondary indexes created with 50 inserts per transaction
- Legend for results is here.
- Each entry lists the percentage of responses that fit in that bucket (slower than max time for previous bucket, faster than min time for next bucket).
Insert response time histogram
256us	1ms	4ms	16ms	64ms	256ms	1s	4s	16s	gt	max	tag
0.000	0.000	3.033	96.707	0.260	0.000	0.000	0.000	0.000	0.000	0.051	pg1222_o2nofp.cx10a_c8r32
0.000	0.000	0.060	99.849	0.091	0.000	0.000	0.000	0.000	0.000	0.037	pg1323_o2nofp.cx10a_c8r32
0.000	0.000	0.007	99.771	0.217	0.004	0.000	0.000	0.000	0.000	0.137	pg1422_o2nofp.cx10a_c8r32
0.000	0.000	0.028	99.880	0.092	0.000	0.000	0.000	0.000	0.000	0.048	pg1517_o2nofp.cx10a_c8r32
0.000	0.000	0.013	99.922	0.065	0.000	0.000	0.000	0.000	0.000	0.027	pg1613_o2nofp.cx10a_c8r32
0.000	0.000	0.014	99.956	0.030	0.000	0.000	0.000	0.000	0.000	0.042	pg179_o2nofp.cx10a_c8r32
0.000	0.000	0.009	99.961	0.030	0.000	0.000	0.000	0.000	0.000	0.035	pg183_o2nofp.cx10b_c8r32
Delete response time histogram
256us	1ms	4ms	16ms	64ms	256ms	1s	4s	16s	gt	max	tag
0.000	1.460	19.736	51.344	27.460	0.000	0.000	0.000	0.000	0.000	0.030	pg1222_o2nofp.cx10a_c8r32
0.000	1.060	18.164	48.874	31.902	0.000	0.000	0.000	0.000	0.000	0.030	pg1323_o2nofp.cx10a_c8r32
0.004	1.159	18.918	47.649	32.269	0.003	0.000	0.000	0.000	0.000	0.068	pg1422_o2nofp.cx10a_c8r32
0.000	1.664	17.649	47.499	33.189	0.000	0.000	0.000	0.000	0.000	0.031	pg1517_o2nofp.cx10a_c8r32
0.005	1.836	17.056	46.109	34.994	0.000	0.000	0.000	0.000	0.000	0.029	pg1613_o2nofp.cx10a_c8r32
0.000	1.731	17.095	41.546	39.627	0.000	0.000	0.000	0.000	0.000	0.034	pg179_o2nofp.cx10a_c8r32
0.000	1.404	17.872	42.771	37.953	0.000	0.000	0.000	0.000	0.000	0.031	pg183_o2nofp.cx10b_c8r32
l.i2
- l.i2: continue load after secondary indexes created with 5 inserts per transaction
- Legend for results is here.
- Each entry lists the percentage of responses that fit in that bucket (slower than max time for previous bucket, faster than min time for next bucket).
Insert response time histogram
256us	1ms	4ms	16ms	64ms	256ms	1s	4s	16s	gt	max	tag
0.000	40.400	59.458	0.142	0.000	0.000	0.000	0.000	0.000	0.000	0.013	pg1222_o2nofp.cx10a_c8r32
0.000	42.023	57.824	0.153	0.001	0.000	0.000	0.000	0.000	0.000	0.016	pg1323_o2nofp.cx10a_c8r32
0.000	43.394	56.400	0.206	0.001	0.000	0.000	0.000	0.000	0.000	0.017	pg1422_o2nofp.cx10a_c8r32
0.000	39.364	60.453	0.182	0.000	0.000	0.000	0.000	0.000	0.000	0.015	pg1517_o2nofp.cx10a_c8r32
0.000	37.726	62.098	0.176	0.001	0.000	0.000	0.000	0.000	0.000	0.020	pg1613_o2nofp.cx10a_c8r32
0.000	44.556	55.355	0.088	0.000	0.000	0.000	0.000	0.000	0.000	0.016	pg179_o2nofp.cx10a_c8r32
0.000	48.296	51.641	0.063	0.000	0.000	0.000	0.000	0.000	0.000	0.011	pg183_o2nofp.cx10b_c8r32
Delete response time histogram
256us	1ms	4ms	16ms	64ms	256ms	1s	4s	16s	gt	max	tag
0.000	0.000	0.000	0.000	99.999	0.001	0.000	0.000	0.000	0.000	0.081	pg1222_o2nofp.cx10a_c8r32
0.000	0.000	0.000	0.000	99.999	0.001	0.000	0.000	0.000	0.000	0.083	pg1323_o2nofp.cx10a_c8r32
0.000	0.000	0.000	0.000	99.999	0.001	0.000	0.000	0.000	0.000	0.083	pg1422_o2nofp.cx10a_c8r32
0.000	0.000	0.000	0.000	99.999	0.001	0.000	0.000	0.000	0.000	0.082	pg1517_o2nofp.cx10a_c8r32
0.000	0.000	0.000	0.000	99.999	0.001	0.000	0.000	0.000	0.000	0.081	pg1613_o2nofp.cx10a_c8r32
0.000	0.000	0.000	0.000	99.999	0.001	0.000	0.000	0.000	0.000	0.078	pg179_o2nofp.cx10a_c8r32
0.000	0.000	0.000	0.000	99.999	0.001	0.000	0.000	0.000	0.000	0.079	pg183_o2nofp.cx10b_c8r32
qr100.L1
- qr100.L1: range queries with 100 insert/s per client
- Legend for results is here.
- Each entry lists the percentage of responses that fit in that bucket (slower than max time for previous bucket, faster than min time for next bucket).
Query response time histogram
256us	1ms	4ms	16ms	64ms	256ms	1s	4s	16s	gt	max	tag
99.994	0.006	nonzero	nonzero	0.000	0.000	0.000	0.000	0.000	0.000	0.005	pg1222_o2nofp.cx10a_c8r32
99.993	0.007	nonzero	nonzero	0.000	0.000	0.000	0.000	0.000	0.000	0.005	pg1323_o2nofp.cx10a_c8r32
99.993	0.007	nonzero	nonzero	0.000	0.000	0.000	0.000	0.000	0.000	0.004	pg1422_o2nofp.cx10a_c8r32
99.992	0.008	nonzero	nonzero	0.000	0.000	0.000	0.000	0.000	0.000	0.011	pg1517_o2nofp.cx10a_c8r32
99.992	0.008	nonzero	nonzero	0.000	0.000	0.000	0.000	0.000	0.000	0.010	pg1613_o2nofp.cx10a_c8r32
99.992	0.008	nonzero	nonzero	0.000	0.000	0.000	0.000	0.000	0.000	0.009	pg179_o2nofp.cx10a_c8r32
99.992	0.008	nonzero	nonzero	0.000	0.000	0.000	0.000	0.000	0.000	0.010	pg183_o2nofp.cx10b_c8r32
Insert response time histogram
256us	1ms	4ms	16ms	64ms	256ms	1s	4s	16s	gt	max	tag
0.000	0.000	0.000	99.750	0.250	0.000	0.000	0.000	0.000	0.000	0.019	pg1222_o2nofp.cx10a_c8r32
0.000	0.000	8.806	91.167	0.028	0.000	0.000	0.000	0.000	0.000	0.016	pg1323_o2nofp.cx10a_c8r32
0.000	0.000	9.083	90.889	0.028	0.000	0.000	0.000	0.000	0.000	0.018	pg1422_o2nofp.cx10a_c8r32
0.000	0.000	9.000	90.972	0.028	0.000	0.000	0.000	0.000	0.000	0.021	pg1517_o2nofp.cx10a_c8r32
0.000	0.000	9.861	90.111	0.028	0.000	0.000	0.000	0.000	0.000	0.022	pg1613_o2nofp.cx10a_c8r32
0.000	0.000	11.500	88.472	0.028	0.000	0.000	0.000	0.000	0.000	0.020	pg179_o2nofp.cx10a_c8r32
0.000	0.000	15.778	84.194	0.028	0.000	0.000	0.000	0.000	0.000	0.020	pg183_o2nofp.cx10b_c8r32
Delete response time histogram
256us	1ms	4ms	16ms	64ms	256ms	1s	4s	16s	gt	max	tag
0.000	62.083	37.917	0.000	0.000	0.000	0.000	0.000	0.000	0.000	0.003	pg1222_o2nofp.cx10a_c8r32
0.000	59.472	40.528	0.000	0.000	0.000	0.000	0.000	0.000	0.000	0.003	pg1323_o2nofp.cx10a_c8r32
0.000	60.167	39.833	0.000	0.000	0.000	0.000	0.000	0.000	0.000	0.004	pg1422_o2nofp.cx10a_c8r32
0.000	58.667	41.333	0.000	0.000	0.000	0.000	0.000	0.000	0.000	0.003	pg1517_o2nofp.cx10a_c8r32
0.000	59.083	40.917	0.000	0.000	0.000	0.000	0.000	0.000	0.000	0.003	pg1613_o2nofp.cx10a_c8r32
0.028	59.306	40.667	0.000	0.000	0.000	0.000	0.000	0.000	0.000	0.003	pg179_o2nofp.cx10a_c8r32
0.028	58.861	41.111	0.000	0.000	0.000	0.000	0.000	0.000	0.000	0.003	pg183_o2nofp.cx10b_c8r32
qp100.L2
- qp100.L2: point queries with 100 insert/s per client
- Legend for results is here.
- Each entry lists the percentage of responses that fit in that bucket (slower than max time for previous bucket, faster than min time for next bucket).
Query response time histogram
256us	1ms	4ms	16ms	64ms	256ms	1s	4s	16s	gt	max	tag
nonzero	44.205	55.757	0.038	nonzero	0.000	0.000	0.000	0.000	0.000	0.028	pg1222_o2nofp.cx10a_c8r32
0.002	95.029	4.954	0.015	0.000	0.000	0.000	0.000	0.000	0.000	0.015	pg1323_o2nofp.cx10a_c8r32
0.002	94.905	5.080	0.013	0.000	0.000	0.000	0.000	0.000	0.000	0.013	pg1422_o2nofp.cx10a_c8r32
0.002	95.079	4.903	0.017	0.000	0.000	0.000	0.000	0.000	0.000	0.015	pg1517_o2nofp.cx10a_c8r32
0.003	95.152	4.835	0.011	0.000	0.000	0.000	0.000	0.000	0.000	0.013	pg1613_o2nofp.cx10a_c8r32
0.002	94.949	5.039	0.010	0.000	0.000	0.000	0.000	0.000	0.000	0.012	pg179_o2nofp.cx10a_c8r32
0.002	94.792	5.194	0.012	0.000	0.000	0.000	0.000	0.000	0.000	0.014	pg183_o2nofp.cx10b_c8r32
Insert response time histogram
256us	1ms	4ms	16ms	64ms	256ms	1s	4s	16s	gt	max	tag
0.000	0.000	0.000	99.750	0.250	0.000	0.000	0.000	0.000	0.000	0.024	pg1222_o2nofp.cx10a_c8r32
0.000	0.000	0.000	99.833	0.167	0.000	0.000	0.000	0.000	0.000	0.021	pg1323_o2nofp.cx10a_c8r32
0.000	0.000	0.000	99.806	0.194	0.000	0.000	0.000	0.000	0.000	0.021	pg1422_o2nofp.cx10a_c8r32
0.000	0.000	0.000	99.750	0.250	0.000	0.000	0.000	0.000	0.000	0.021	pg1517_o2nofp.cx10a_c8r32
0.000	0.000	0.000	99.833	0.167	0.000	0.000	0.000	0.000	0.000	0.018	pg1613_o2nofp.cx10a_c8r32
0.000	0.000	0.000	100.000	0.000	0.000	0.000	0.000	0.000	0.000	0.012	pg179_o2nofp.cx10a_c8r32
0.000	0.000	0.000	100.000	0.000	0.000	0.000	0.000	0.000	0.000	0.015	pg183_o2nofp.cx10b_c8r32
Delete response time histogram
256us	1ms	4ms	16ms	64ms	256ms	1s	4s	16s	gt	max	tag
0.000	19.139	80.806	0.056	0.000	0.000	0.000	0.000	0.000	0.000	0.007	pg1222_o2nofp.cx10a_c8r32
0.000	6.806	93.056	0.139	0.000	0.000	0.000	0.000	0.000	0.000	0.007	pg1323_o2nofp.cx10a_c8r32
0.000	6.611	93.250	0.139	0.000	0.000	0.000	0.000	0.000	0.000	0.008	pg1422_o2nofp.cx10a_c8r32
0.000	7.889	91.917	0.194	0.000	0.000	0.000	0.000	0.000	0.000	0.008	pg1517_o2nofp.cx10a_c8r32
0.000	7.528	92.444	0.028	0.000	0.000	0.000	0.000	0.000	0.000	0.007	pg1613_o2nofp.cx10a_c8r32
0.000	5.778	94.194	0.028	0.000	0.000	0.000	0.000	0.000	0.000	0.007	pg179_o2nofp.cx10a_c8r32
0.000	5.139	94.833	0.028	0.000	0.000	0.000	0.000	0.000	0.000	0.008	pg183_o2nofp.cx10b_c8r32
qr500.L3
- qr500.L3: range queries with 500 insert/s per client
- Legend for results is here.
- Each entry lists the percentage of responses that fit in that bucket (slower than max time for previous bucket, faster than min time for next bucket).
Query response time histogram
256us	1ms	4ms	16ms	64ms	256ms	1s	4s	16s	gt	max	tag
99.987	0.012	0.001	nonzero	0.000	0.000	0.000	0.000	0.000	0.000	0.005	pg1222_o2nofp.cx10a_c8r32
99.987	0.012	nonzero	nonzero	nonzero	0.000	0.000	0.000	0.000	0.000	0.026	pg1323_o2nofp.cx10a_c8r32
99.988	0.012	nonzero	nonzero	nonzero	0.000	0.000	0.000	0.000	0.000	0.022	pg1422_o2nofp.cx10a_c8r32
99.985	0.014	nonzero	nonzero	nonzero	0.000	0.000	0.000	0.000	0.000	0.025	pg1517_o2nofp.cx10a_c8r32
99.986	0.013	nonzero	nonzero	nonzero	0.000	0.000	0.000	0.000	0.000	0.024	pg1613_o2nofp.cx10a_c8r32
99.986	0.013	0.001	nonzero	nonzero	0.000	0.000	0.000	0.000	0.000	0.022	pg179_o2nofp.cx10a_c8r32
99.987	0.012	nonzero	nonzero	nonzero	0.000	0.000	0.000	0.000	0.000	0.022	pg183_o2nofp.cx10b_c8r32
Insert response time histogram
256us	1ms	4ms	16ms	64ms	256ms	1s	4s	16s	gt	max	tag
0.000	0.000	0.000	99.861	0.139	0.000	0.000	0.000	0.000	0.000	0.032	pg1222_o2nofp.cx10a_c8r32
0.000	0.000	0.000	99.939	0.061	0.000	0.000	0.000	0.000	0.000	0.018	pg1323_o2nofp.cx10a_c8r32
0.000	0.000	0.000	99.883	0.117	0.000	0.000	0.000	0.000	0.000	0.029	pg1422_o2nofp.cx10a_c8r32
0.000	0.000	0.000	99.967	0.033	0.000	0.000	0.000	0.000	0.000	0.017	pg1517_o2nofp.cx10a_c8r32
0.000	0.000	0.000	99.939	0.061	0.000	0.000	0.000	0.000	0.000	0.017	pg1613_o2nofp.cx10a_c8r32
0.000	0.000	0.000	99.961	0.039	0.000	0.000	0.000	0.000	0.000	0.018	pg179_o2nofp.cx10a_c8r32
0.000	0.000	0.000	99.967	0.033	0.000	0.000	0.000	0.000	0.000	0.021	pg183_o2nofp.cx10b_c8r32
Delete response time histogram
256us	1ms	4ms	16ms	64ms	256ms	1s	4s	16s	gt	max	tag
0.000	0.000	59.078	40.922	0.000	0.000	0.000	0.000	0.000	0.000	0.013	pg1222_o2nofp.cx10a_c8r32
0.000	0.000	52.594	47.406	0.000	0.000	0.000	0.000	0.000	0.000	0.012	pg1323_o2nofp.cx10a_c8r32
0.000	0.000	50.978	49.022	0.000	0.000	0.000	0.000	0.000	0.000	0.013	pg1422_o2nofp.cx10a_c8r32
0.000	0.000	49.178	50.822	0.000	0.000	0.000	0.000	0.000	0.000	0.012	pg1517_o2nofp.cx10a_c8r32
0.000	0.000	50.672	49.328	0.000	0.000	0.000	0.000	0.000	0.000	0.012	pg1613_o2nofp.cx10a_c8r32
0.000	0.000	50.667	49.333	0.000	0.000	0.000	0.000	0.000	0.000	0.012	pg179_o2nofp.cx10a_c8r32
0.000	0.000	51.389	48.611	0.000	0.000	0.000	0.000	0.000	0.000	0.012	pg183_o2nofp.cx10b_c8r32
qp500.L4
- qp500.L4: point queries with 500 insert/s per client
- Legend for results is here.
- Each entry lists the percentage of responses that fit in that bucket (slower than max time for previous bucket, faster than min time for next bucket).
Query response time histogram
256us	1ms	4ms	16ms	64ms	256ms	1s	4s	16s	gt	max	tag
nonzero	35.858	64.049	0.093	nonzero	0.000	0.000	0.000	0.000	0.000	0.025	pg1222_o2nofp.cx10a_c8r32
0.001	94.694	5.284	0.021	nonzero	0.000	0.000	0.000	0.000	0.000	0.017	pg1323_o2nofp.cx10a_c8r32
0.001	94.494	5.476	0.029	nonzero	0.000	0.000	0.000	0.000	0.000	0.017	pg1422_o2nofp.cx10a_c8r32
0.002	94.790	5.192	0.017	0.000	0.000	0.000	0.000	0.000	0.000	0.016	pg1517_o2nofp.cx10a_c8r32
0.001	94.881	5.091	0.027	nonzero	0.000	0.000	0.000	0.000	0.000	0.021	pg1613_o2nofp.cx10a_c8r32
0.001	94.487	5.489	0.023	nonzero	0.000	0.000	0.000	0.000	0.000	0.018	pg179_o2nofp.cx10a_c8r32
0.002	94.036	5.929	0.033	nonzero	0.000	0.000	0.000	0.000	0.000	0.017	pg183_o2nofp.cx10b_c8r32
Insert response time histogram
256us	1ms	4ms	16ms	64ms	256ms	1s	4s	16s	gt	max	tag
0.000	0.000	0.000	99.739	0.261	0.000	0.000	0.000	0.000	0.000	0.064	pg1222_o2nofp.cx10a_c8r32
0.000	0.000	0.000	99.922	0.078	0.000	0.000	0.000	0.000	0.000	0.024	pg1323_o2nofp.cx10a_c8r32
0.000	0.000	0.000	99.911	0.089	0.000	0.000	0.000	0.000	0.000	0.026	pg1422_o2nofp.cx10a_c8r32
0.000	0.000	0.000	99.967	0.033	0.000	0.000	0.000	0.000	0.000	0.021	pg1517_o2nofp.cx10a_c8r32
0.000	0.000	0.000	99.900	0.100	0.000	0.000	0.000	0.000	0.000	0.028	pg1613_o2nofp.cx10a_c8r32
0.000	0.000	0.000	99.972	0.028	0.000	0.000	0.000	0.000	0.000	0.025	pg179_o2nofp.cx10a_c8r32
0.000	0.000	0.000	99.911	0.089	0.000	0.000	0.000	0.000	0.000	0.023	pg183_o2nofp.cx10b_c8r32
Delete response time histogram
256us	1ms	4ms	16ms	64ms	256ms	1s	4s	16s	gt	max	tag
0.000	0.000	0.000	99.989	0.011	0.000	0.000	0.000	0.000	0.000	0.036	pg1222_o2nofp.cx10a_c8r32
0.000	0.000	0.000	99.978	0.022	0.000	0.000	0.000	0.000	0.000	0.035	pg1323_o2nofp.cx10a_c8r32
0.000	0.000	0.000	99.972	0.028	0.000	0.000	0.000	0.000	0.000	0.036	pg1422_o2nofp.cx10a_c8r32
0.000	0.000	0.000	99.944	0.056	0.000	0.000	0.000	0.000	0.000	0.035	pg1517_o2nofp.cx10a_c8r32
0.000	0.000	0.000	99.956	0.044	0.000	0.000	0.000	0.000	0.000	0.035	pg1613_o2nofp.cx10a_c8r32
0.000	0.000	0.000	98.506	1.494	0.000	0.000	0.000	0.000	0.000	0.033	pg179_o2nofp.cx10a_c8r32
0.000	0.000	0.000	99.711	0.289	0.000	0.000	0.000	0.000	0.000	0.034	pg183_o2nofp.cx10b_c8r32
qr1000.L5
- qr1000.L5: range queries with 1000 insert/s per client
- Legend for results is here.
- Each entry lists the percentage of responses that fit in that bucket (slower than max time for previous bucket, faster than min time for next bucket).
Query response time histogram
256us	1ms	4ms	16ms	64ms	256ms	1s	4s	16s	gt	max	tag
99.969	0.028	0.002	nonzero	0.000	0.000	0.000	0.000	0.000	0.000	0.015	pg1222_o2nofp.cx10a_c8r32
99.970	0.028	0.002	nonzero	nonzero	nonzero	0.000	0.000	0.000	0.000	0.083	pg1323_o2nofp.cx10a_c8r32
99.973	0.025	0.002	nonzero	nonzero	nonzero	0.000	0.000	0.000	0.000	0.092	pg1422_o2nofp.cx10a_c8r32
99.963	0.034	0.003	nonzero	nonzero	nonzero	0.000	0.000	0.000	0.000	0.074	pg1517_o2nofp.cx10a_c8r32
99.964	0.033	0.002	nonzero	nonzero	nonzero	0.000	0.000	0.000	0.000	0.092	pg1613_o2nofp.cx10a_c8r32
99.972	0.026	0.002	nonzero	nonzero	nonzero	0.000	0.000	0.000	0.000	0.092	pg179_o2nofp.cx10a_c8r32
99.969	0.029	0.002	nonzero	nonzero	nonzero	0.000	0.000	0.000	0.000	0.090	pg183_o2nofp.cx10b_c8r32
Insert response time histogram
256us	1ms	4ms	16ms	64ms	256ms	1s	4s	16s	gt	max	tag
0.000	0.000	0.011	99.947	0.042	0.000	0.000	0.000	0.000	0.000	0.021	pg1222_o2nofp.cx10a_c8r32
0.000	0.000	0.447	99.536	0.017	0.000	0.000	0.000	0.000	0.000	0.024	pg1323_o2nofp.cx10a_c8r32
0.000	0.000	0.414	99.531	0.056	0.000	0.000	0.000	0.000	0.000	0.024	pg1422_o2nofp.cx10a_c8r32
0.000	0.000	0.264	99.689	0.047	0.000	0.000	0.000	0.000	0.000	0.043	pg1517_o2nofp.cx10a_c8r32
0.000	0.000	0.217	99.733	0.050	0.000	0.000	0.000	0.000	0.000	0.030	pg1613_o2nofp.cx10a_c8r32
0.000	0.000	0.394	99.581	0.025	0.000	0.000	0.000	0.000	0.000	0.021	pg179_o2nofp.cx10a_c8r32
0.000	0.000	0.408	99.578	0.014	0.000	0.000	0.000	0.000	0.000	0.021	pg183_o2nofp.cx10b_c8r32
Delete response time histogram
256us	1ms	4ms	16ms	64ms	256ms	1s	4s	16s	gt	max	tag
0.000	0.000	0.000	30.700	69.300	0.000	0.000	0.000	0.000	0.000	0.054	pg1222_o2nofp.cx10a_c8r32
0.000	0.000	0.000	22.964	77.036	0.000	0.000	0.000	0.000	0.000	0.052	pg1323_o2nofp.cx10a_c8r32
0.000	0.000	0.000	24.647	75.353	0.000	0.000	0.000	0.000	0.000	0.053	pg1422_o2nofp.cx10a_c8r32
0.000	0.000	0.000	22.431	77.569	0.000	0.000	0.000	0.000	0.000	0.052	pg1517_o2nofp.cx10a_c8r32
0.000	0.000	0.000	18.225	81.775	0.000	0.000	0.000	0.000	0.000	0.051	pg1613_o2nofp.cx10a_c8r32
0.000	0.000	0.000	11.950	88.050	0.000	0.000	0.000	0.000	0.000	0.049	pg179_o2nofp.cx10a_c8r32
0.000	0.000	0.000	17.703	82.297	0.000	0.000	0.000	0.000	0.000	0.050	pg183_o2nofp.cx10b_c8r32
qp1000.L6
- qp1000.L6: point queries with 1000 insert/s per client
- Legend for results is here.
- Each entry lists the percentage of responses that fit in that bucket (slower than max time for previous bucket, faster than min time for next bucket).
Query response time histogram
256us	1ms	4ms	16ms	64ms	256ms	1s	4s	16s	gt	max	tag
0.000	21.559	78.307	0.134	nonzero	0.000	0.000	0.000	0.000	0.000	0.018	pg1222_o2nofp.cx10a_c8r32
nonzero	89.608	10.355	0.037	nonzero	0.000	0.000	0.000	0.000	0.000	0.030	pg1323_o2nofp.cx10a_c8r32
0.001	89.320	10.631	0.048	nonzero	0.000	0.000	0.000	0.000	0.000	0.021	pg1422_o2nofp.cx10a_c8r32
0.001	89.327	10.611	0.061	nonzero	0.000	0.000	0.000	0.000	0.000	0.023	pg1517_o2nofp.cx10a_c8r32
0.001	88.994	10.972	0.034	nonzero	0.000	0.000	0.000	0.000	0.000	0.020	pg1613_o2nofp.cx10a_c8r32
0.001	88.972	10.997	0.031	nonzero	0.000	0.000	0.000	0.000	0.000	0.017	pg179_o2nofp.cx10a_c8r32
nonzero	88.521	11.440	0.039	0.000	0.000	0.000	0.000	0.000	0.000	0.014	pg183_o2nofp.cx10b_c8r32
Insert response time histogram
256us	1ms	4ms	16ms	64ms	256ms	1s	4s	16s	gt	max	tag
0.000	0.000	0.000	99.939	0.061	0.000	0.000	0.000	0.000	0.000	0.026	pg1222_o2nofp.cx10a_c8r32
0.000	0.000	0.000	99.958	0.042	0.000	0.000	0.000	0.000	0.000	0.020	pg1323_o2nofp.cx10a_c8r32
0.000	0.000	0.003	99.906	0.092	0.000	0.000	0.000	0.000	0.000	0.033	pg1422_o2nofp.cx10a_c8r32
0.000	0.000	0.000	99.900	0.100	0.000	0.000	0.000	0.000	0.000	0.021	pg1517_o2nofp.cx10a_c8r32
0.000	0.000	0.003	99.939	0.058	0.000	0.000	0.000	0.000	0.000	0.040	pg1613_o2nofp.cx10a_c8r32
0.000	0.000	0.000	99.972	0.028	0.000	0.000	0.000	0.000	0.000	0.021	pg179_o2nofp.cx10a_c8r32
0.000	0.000	0.000	99.964	0.036	0.000	0.000	0.000	0.000	0.000	0.023	pg183_o2nofp.cx10b_c8r32
Delete response time histogram
256us	1ms	4ms	16ms	64ms	256ms	1s	4s	16s	gt	max	tag
0.000	0.000	0.000	0.000	99.997	0.003	0.000	0.000	0.000	0.000	0.084	pg1222_o2nofp.cx10a_c8r32
0.000	0.000	0.000	0.000	99.997	0.003	0.000	0.000	0.000	0.000	0.084	pg1323_o2nofp.cx10a_c8r32
0.000	0.000	0.000	0.000	99.997	0.003	0.000	0.000	0.000	0.000	0.086	pg1422_o2nofp.cx10a_c8r32
0.000	0.000	0.000	0.000	99.997	0.003	0.000	0.000	0.000	0.000	0.083	pg1517_o2nofp.cx10a_c8r32
0.000	0.000	0.000	0.000	99.997	0.003	0.000	0.000	0.000	0.000	0.084	pg1613_o2nofp.cx10a_c8r32
0.000	0.000	0.000	0.000	99.997	0.003	0.000	0.000	0.000	0.000	0.080	pg179_o2nofp.cx10a_c8r32
0.000	0.000	0.000	0.000	99.997	0.003	0.000	0.000	0.000	0.000	0.081	pg183_o2nofp.cx10b_c8r32