Introduction
This is a report for the insert benchmark with 800M docs and 1 client(s). It is generated by scripts (bash, awk, sed) and Tufte might not be impressed. An overview of the insert benchmark is here and a short update is here. Below, by DBMS, I mean DBMS+version.config. An example is my8020.c10b40 where my means MySQL, 8020 is version 8.0.20 and c10b40 is the name for the configuration file.
The test server has 8 AMD cores, 32G RAM and an NVMe device for the database. The benchmark was run with 1 client and there were 1 or 3 connections per client (1 for queries or inserts without rate limits, 1+1 for rate limited inserts+deletes). It uses 1 table with a table per client. It loads 800M rows per table without secondary indexes, creates 3 secondary indexes per table, then inserts 4m+1m rows per table with a delete per insert to avoid growing the table. It then does 6 read+write tests for 1800s each that do queries as fast as possible with 100,100,500,500,1000,1000 inserts/s and the same for deletes/s per client concurrent with the queries. The database is IO-bound for most benchmark steps. Clients and the DBMS share one server.
The tested DBMS are:
- pg182_o2nofp.cx10b_c8r32 - Postgres 18.2 with my standard config (x10b)
- pg182_o2nofp.cx10b_fpw0_c8r32 - Postgres 18.2 with my standard config except full_page_writes=off
- pg182_o2nofp.cx10b_wallz4_c8r32 - Postgres 18.2 with my standard config except wal_compression=lz4
- pg182_o2nofp.cx10b_fpw0_wallz4_c8r32 - Postgres 18.2 with my standard config except full_page_writes=off and wal_compression=lz4
Contents
- Summary
- l.i0: load without secondary indexes
- l.x: create secondary indexes
- l.i1: continue load after secondary indexes created with 50 inserts per transaction
- l.i2: continue load after secondary indexes created with 5 inserts per transaction
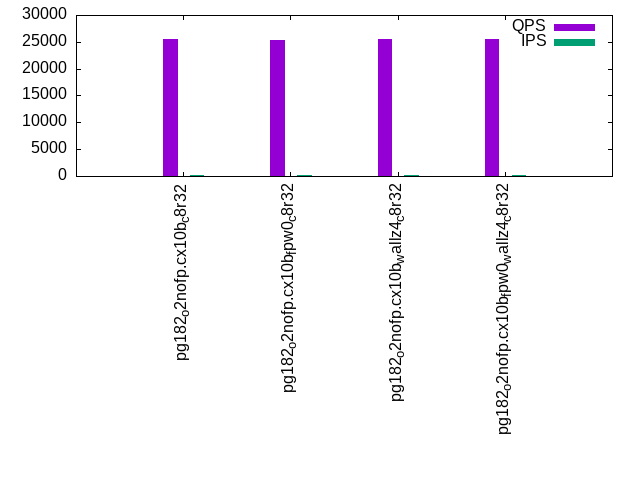
- qr100.L1: range queries with 100 insert/s per client
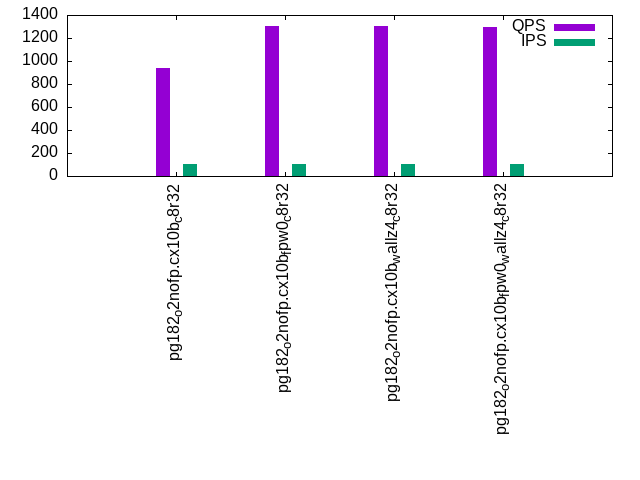
- qp100.L2: point queries with 100 insert/s per client
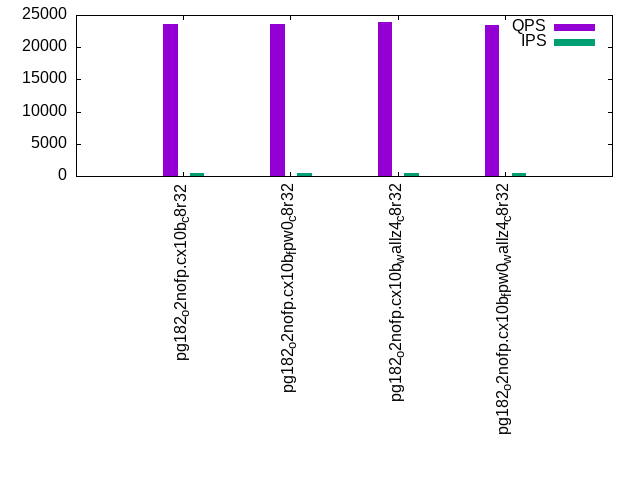
- qr500.L3: range queries with 500 insert/s per client
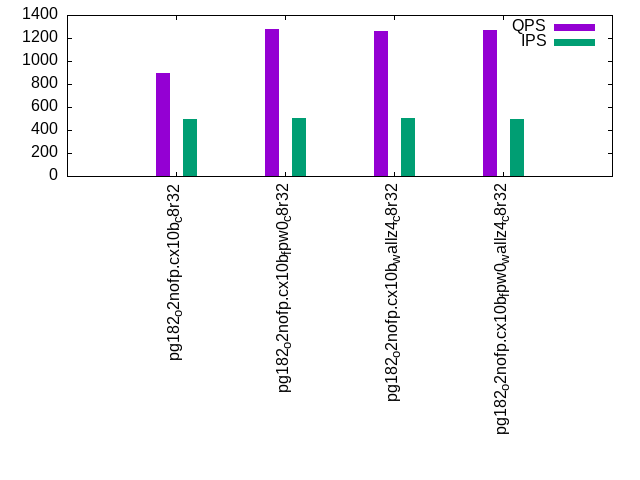
- qp500.L4: point queries with 500 insert/s per client
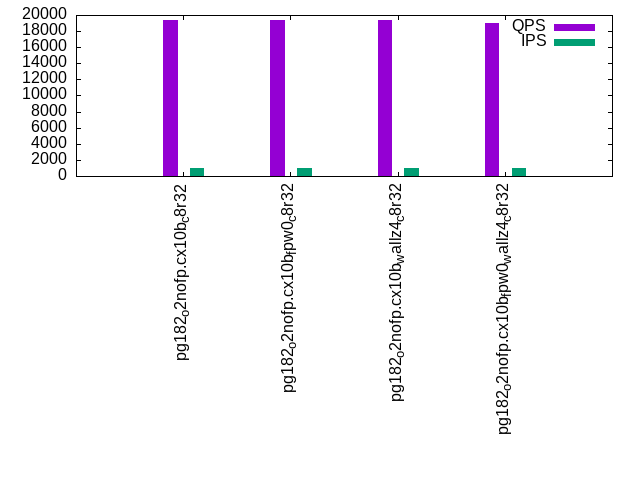
- qr1000.L5: range queries with 1000 insert/s per client
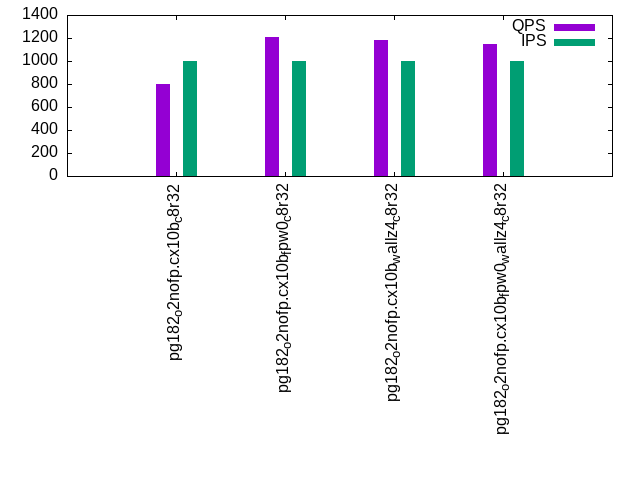
- qp1000.L6: point queries with 1000 insert/s per client
Summary
The numbers are inserts/s for l.i0, l.i1 and l.i2, indexed docs (or rows) /s for l.x and queries/s for qr100, qp100 thru qr1000, qp1000" The values are the average rate over the entire test for inserts (IPS) and queries (QPS). The range of values for IPS and QPS is split into 3 parts: bottom 25%, middle 50%, top 25%. Values in the bottom 25% have a red background, values in the top 25% have a green background and values in the middle have no color. A gray background is used for values that can be ignored because the DBMS did not sustain the target insert rate. Red backgrounds are not used when the minimum value is within 80% of the max value.
| dbms | l.i0 | l.x | l.i1 | l.i2 | qr100 | qp100 | qr500 | qp500 | qr1000 | qp1000 |
|---|---|---|---|---|---|---|---|---|---|---|
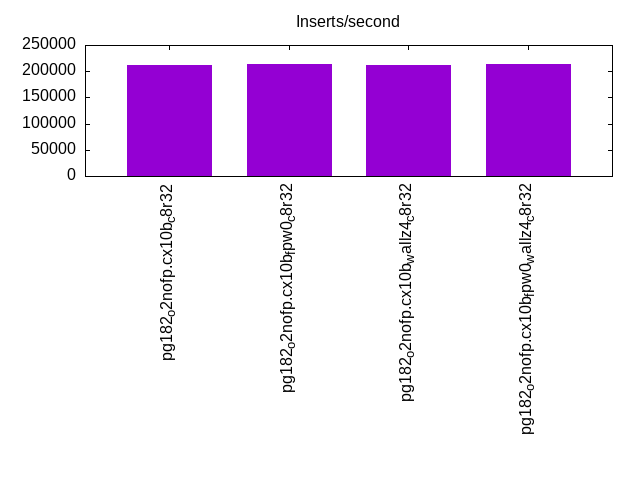
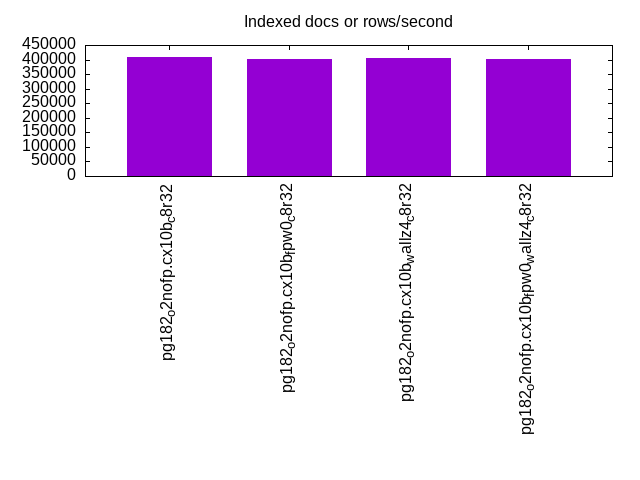
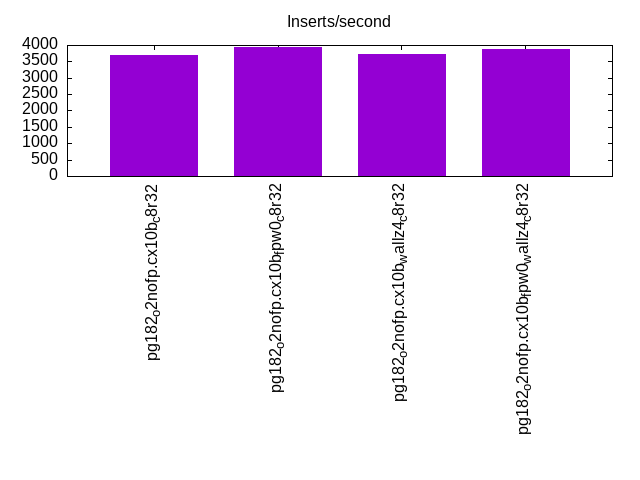
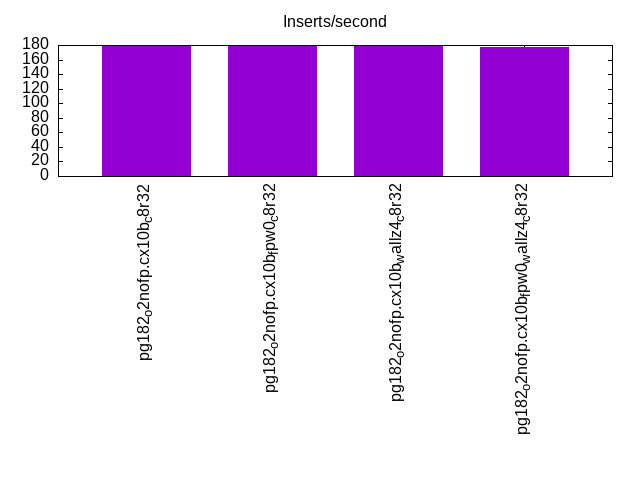
| pg182_o2nofp.cx10b_c8r32 | 211977 | 407540 | 3707 | 178 | 25508 | 939 | 23669 | 894 | 19335 | 800 |
| pg182_o2nofp.cx10b_fpw0_c8r32 | 212879 | 402212 | 3929 | 178 | 25255 | 1304 | 23623 | 1280 | 19435 | 1206 |
| pg182_o2nofp.cx10b_wallz4_c8r32 | 212596 | 405268 | 3717 | 178 | 25555 | 1300 | 23839 | 1263 | 19372 | 1180 |
| pg182_o2nofp.cx10b_fpw0_wallz4_c8r32 | 213106 | 401002 | 3887 | 177 | 25472 | 1299 | 23510 | 1268 | 19057 | 1145 |
This table has relative throughput, throughput for the DBMS relative to the DBMS in the first line, using the absolute throughput from the previous table. Values less than 0.95 have a yellow background. Values greater than 1.05 have a blue background.
| dbms | l.i0 | l.x | l.i1 | l.i2 | qr100 | qp100 | qr500 | qp500 | qr1000 | qp1000 |
|---|---|---|---|---|---|---|---|---|---|---|
| pg182_o2nofp.cx10b_c8r32 | 1.00 | 1.00 | 1.00 | 1.00 | 1.00 | 1.00 | 1.00 | 1.00 | 1.00 | 1.00 |
| pg182_o2nofp.cx10b_fpw0_c8r32 | 1.00 | 0.99 | 1.06 | 1.00 | 0.99 | 1.39 | 1.00 | 1.43 | 1.01 | 1.51 |
| pg182_o2nofp.cx10b_wallz4_c8r32 | 1.00 | 0.99 | 1.00 | 1.00 | 1.00 | 1.38 | 1.01 | 1.41 | 1.00 | 1.48 |
| pg182_o2nofp.cx10b_fpw0_wallz4_c8r32 | 1.01 | 0.98 | 1.05 | 0.99 | 1.00 | 1.38 | 0.99 | 1.42 | 0.99 | 1.43 |
This lists the average rate of inserts/s for the tests that do inserts concurrent with queries. For such tests the query rate is listed in the table above. The read+write tests are setup so that the insert rate should match the target rate every second. Cells that are not at least 95% of the target have a red background to indicate a failure to satisfy the target.
| dbms | qr100.L1 | qp100.L2 | qr500.L3 | qp500.L4 | qr1000.L5 | qp1000.L6 |
|---|---|---|---|---|---|---|
| pg182_o2nofp.cx10b_c8r32 | 100 | 100 | 499 | 499 | 999 | 999 |
| pg182_o2nofp.cx10b_fpw0_c8r32 | 100 | 100 | 499 | 500 | 999 | 999 |
| pg182_o2nofp.cx10b_wallz4_c8r32 | 100 | 100 | 499 | 500 | 999 | 999 |
| pg182_o2nofp.cx10b_fpw0_wallz4_c8r32 | 100 | 100 | 500 | 499 | 999 | 999 |
| target | 100 | 100 | 500 | 500 | 1000 | 1000 |
l.i0
l.i0: load without secondary indexes. Graphs for performance per 1-second interval are here.
Average throughput:
Insert response time histogram: each cell has the percentage of responses that take <= the time in the header and max is the max response time in seconds. For the max column values in the top 25% of the range have a red background and in the bottom 25% of the range have a green background. The red background is not used when the min value is within 80% of the max value.
| dbms | 256us | 1ms | 4ms | 16ms | 64ms | 256ms | 1s | 4s | 16s | gt | max |
|---|---|---|---|---|---|---|---|---|---|---|---|
| pg182_o2nofp.cx10b_c8r32 | 99.971 | 0.025 | 0.004 | nonzero | 0.044 | ||||||
| pg182_o2nofp.cx10b_fpw0_c8r32 | 99.976 | 0.024 | nonzero | nonzero | 0.027 | ||||||
| pg182_o2nofp.cx10b_wallz4_c8r32 | 99.967 | 0.032 | 0.001 | nonzero | 0.027 | ||||||
| pg182_o2nofp.cx10b_fpw0_wallz4_c8r32 | 99.979 | 0.021 | nonzero | nonzero | 0.028 |
Performance metrics for the DBMS listed above. Some are normalized by throughput, others are not. Legend for results is here.
ips	qps	rps	rmbps	wps	wmbps	rpq	rkbpq	wpi	wkbpi	csps	cpups	cspq	cpupq	dbgb1	dbgb2	rss	maxop	p50	p99	tag
211977	0	36	0.3	796.6	87.8	0.000	0.001	0.004	0.424	20999	20.5	0.099	8	76.5	116.6	18.5	0.044	213378	205669	pg182_o2nofp.cx10b_c8r32
212879	0	36	0.3	776.7	85.8	0.000	0.001	0.004	0.413	21101	20.4	0.099	8	76.5	116.6	19.7	0.027	214076	207172	pg182_o2nofp.cx10b_fpw0_c8r32
212596	0	37	0.3	786.5	86.5	0.000	0.001	0.004	0.416	21115	20.4	0.099	8	76.5	116.6	1.0	0.027	213971	206376	pg182_o2nofp.cx10b_wallz4_c8r32
213106	0	37	0.3	778.2	85.9	0.000	0.001	0.004	0.413	21134	20.4	0.099	8	76.5	116.6	1.0	0.028	214363	207665	pg182_o2nofp.cx10b_fpw0_wallz4_c8r32
Average values from iostat.
r/s	rkB/s	rrqm/s	%rrqm	r_await	rareq-s	w/s	wkB/s	wrqm/s	%wrqm	w_await	wareq-s	d/s	dkB/s	drqm/s	%drqm	d_await	dareq-s	f/s	f_await	aqu-sz	%util
36.30	292.6	0.039	0.483	0.019	0.631	796.9	89937.5	30.51	3.012	0.338	112.9	0.095	8.175	0.000	0.000	0.135	4.890	43.78	1.642	0.362	11.75		pg182_o2nofp.cx10b_c8r32
36.46	294.2	0.007	0.206	0.010	0.666	777.0	87868.0	31.22	3.262	0.341	112.9	0.100	2.944	0.000	0.000	0.164	2.705	43.67	1.708	0.356	12.01		pg182_o2nofp.cx10b_fpw0_c8r32
36.83	296.3	0.094	0.741	0.133	3.014	786.7	88554.5	31.70	3.224	0.320	112.5	0.166	9.633	0.000	0.000	0.190	7.589	44.15	1.658	0.342	11.81		pg182_o2nofp.cx10b_wallz4_c8r32
36.87	296.5	0.000	0.000	0.116	2.861	778.5	88040.4	31.08	3.187	0.333	113.0	0.151	3.610	0.000	0.000	0.220	3.798	43.74	1.655	0.345	11.65		pg182_o2nofp.cx10b_fpw0_wallz4_c8r32
l.x
l.x: create secondary indexes.
Average throughput:
Performance metrics for the DBMS listed above. Some are normalized by throughput, others are not. Legend for results is here.
ips	qps	rps	rmbps	wps	wmbps	rpq	rkbpq	wpi	wkbpi	csps	cpups	cspq	cpupq	dbgb1	dbgb2	rss	maxop	p50	p99	tag
407540	0	1515	149.7	1255.6	151.4	0.004	0.376	0.003	0.380	1128	12.7	0.003	2	153.6	193.7	23.4	0.003	NA	NA	pg182_o2nofp.cx10b_c8r32
402212	0	1637	161.2	1245.0	150.8	0.004	0.410	0.003	0.384	1505	12.6	0.004	3	153.6	193.7	23.4	0.003	NA	NA	pg182_o2nofp.cx10b_fpw0_c8r32
405268	0	1102	136.5	1112.3	136.1	0.003	0.345	0.003	0.344	848	12.8	0.002	3	153.6	193.7	23.4	0.003	NA	NA	pg182_o2nofp.cx10b_wallz4_c8r32
401002	0	1223	141.2	1109.0	135.0	0.003	0.361	0.003	0.345	950	12.8	0.002	3	153.6	193.7	23.4	0.003	NA	NA	pg182_o2nofp.cx10b_fpw0_wallz4_c8r32
Average values from iostat.
r/s	rkB/s	rrqm/s	%rrqm	r_await	rareq-s	w/s	wkB/s	wrqm/s	%wrqm	w_await	wareq-s	d/s	dkB/s	drqm/s	%drqm	d_await	dareq-s	f/s	f_await	aqu-sz	%util
1516.4	153308	0.000	0.000	0.085	94.02	1257.8	155303	25.85	1.111	0.271	124.4	1.018	22448.5	0.000	0.000	0.327	546.8	10.13	2.065	0.678	17.98		pg182_o2nofp.cx10b_c8r32
1638.1	165142	0.000	0.000	0.098	97.47	1246.8	154636	23.66	1.089	0.247	124.6	0.902	25891.6	0.000	0.000	0.345	5105.6	9.619	1.972	0.609	18.83		pg182_o2nofp.cx10b_fpw0_c8r32
1102.4	139734	0.000	0.000	0.114	108.7	1114.9	139667	19.28	0.974	0.224	125.9	1.097	22331.6	0.000	0.000	0.312	391.2	7.256	2.002	0.452	15.31		pg182_o2nofp.cx10b_wallz4_c8r32
1223.6	144625	0.000	0.000	0.104	105.2	1110.4	138448	17.99	0.963	0.225	125.0	0.949	26450.7	0.000	0.000	0.312	5360.0	7.017	1.996	0.448	15.79		pg182_o2nofp.cx10b_fpw0_wallz4_c8r32
l.i1
l.i1: continue load after secondary indexes created with 50 inserts per transaction. Graphs for performance per 1-second interval are here.
Average throughput:
Insert response time histogram: each cell has the percentage of responses that take <= the time in the header and max is the max response time in seconds. For the max column values in the top 25% of the range have a red background and in the bottom 25% of the range have a green background. The red background is not used when the min value is within 80% of the max value.
| dbms | 256us | 1ms | 4ms | 16ms | 64ms | 256ms | 1s | 4s | 16s | gt | max |
|---|---|---|---|---|---|---|---|---|---|---|---|
| pg182_o2nofp.cx10b_c8r32 | 0.005 | 99.905 | 0.090 | 0.035 | |||||||
| pg182_o2nofp.cx10b_fpw0_c8r32 | 0.054 | 99.934 | 0.013 | 0.027 | |||||||
| pg182_o2nofp.cx10b_wallz4_c8r32 | 99.969 | 0.031 | 0.028 | ||||||||
| pg182_o2nofp.cx10b_fpw0_wallz4_c8r32 | 0.009 | 99.980 | 0.011 | 0.028 |
Delete response time histogram: each cell has the percentage of responses that take <= the time in the header and max is the max response time in seconds. For the max column values in the top 25% of the range have a red background and in the bottom 25% of the range have a green background. The red background is not used when the min value is within 80% of the max value.
| dbms | 256us | 1ms | 4ms | 16ms | 64ms | 256ms | 1s | 4s | 16s | gt | max |
|---|---|---|---|---|---|---|---|---|---|---|---|
| pg182_o2nofp.cx10b_c8r32 | 1.427 | 17.850 | 43.315 | 37.407 | 0.031 | ||||||
| pg182_o2nofp.cx10b_fpw0_c8r32 | 0.557 | 19.290 | 46.100 | 34.053 | 0.032 | ||||||
| pg182_o2nofp.cx10b_wallz4_c8r32 | 0.685 | 18.474 | 45.270 | 35.571 | 0.030 | ||||||
| pg182_o2nofp.cx10b_fpw0_wallz4_c8r32 | 0.003 | 0.369 | 19.734 | 44.879 | 35.016 | 0.033 |
Performance metrics for the DBMS listed above. Some are normalized by throughput, others are not. Legend for results is here.
ips	qps	rps	rmbps	wps	wmbps	rpq	rkbpq	wpi	wkbpi	csps	cpups	cspq	cpupq	dbgb1	dbgb2	rss	maxop	p50	p99	tag
3707	0	5351	44.2	4402.0	75.3	1.443	12.222	1.187	20.814	11930	15.4	3.218	332	154.3	194.3	22.9	0.035	2850	1999	pg182_o2nofp.cx10b_c8r32
3929	0	5651	44.5	4127.7	34.5	1.438	11.604	1.051	9.001	12417	15.0	3.160	305	154.3	194.3	20.9	0.027	2949	2000	pg182_o2nofp.cx10b_fpw0_c8r32
3717	0	5344	42.1	4255.5	59.2	1.438	11.600	1.145	16.302	11871	15.5	3.193	334	154.3	194.3	22.3	0.028	2850	2000	pg182_o2nofp.cx10b_wallz4_c8r32
3887	0	5595	44.1	4109.1	37.1	1.439	11.618	1.057	9.761	12305	14.9	3.165	307	154.3	194.3	20.8	0.028	2949	1950	pg182_o2nofp.cx10b_fpw0_wallz4_c8r32
Average values from iostat.
r/s	rkB/s	rrqm/s	%rrqm	r_await	rareq-s	w/s	wkB/s	wrqm/s	%wrqm	w_await	wareq-s	d/s	dkB/s	drqm/s	%drqm	d_await	dareq-s	f/s	f_await	aqu-sz	%util
5311.0	44996.6	0.000	0.000	0.043	8.438	4419.7	77190.7	14.80	0.743	0.153	39.43	0.011	0.116	0.000	0.000	0.026	0.249	39.04	1.724	0.868	32.84		pg182_o2nofp.cx10b_c8r32
5600.6	45188.3	0.000	0.000	0.040	8.073	4148.0	35528.1	2.605	2.275	0.143	25.84	0.004	0.028	0.000	0.000	0.010	0.109	5.249	1.764	0.348	27.40		pg182_o2nofp.cx10b_fpw0_c8r32
5307.4	42825.1	0.000	0.000	0.042	8.073	4273.5	60675.6	4.771	0.464	0.110	32.05	0.008	0.034	0.000	0.000	0.051	0.150	23.95	1.719	0.609	29.55		pg182_o2nofp.cx10b_wallz4_c8r32
5544.6	44751.4	0.000	0.000	0.040	8.076	4129.1	38112.6	1.925	1.818	0.145	28.02	0.005	0.020	0.000	0.000	0.015	0.078	5.269	1.729	0.346	27.07		pg182_o2nofp.cx10b_fpw0_wallz4_c8r32
l.i2
l.i2: continue load after secondary indexes created with 5 inserts per transaction. Graphs for performance per 1-second interval are here.
Average throughput:
Insert response time histogram: each cell has the percentage of responses that take <= the time in the header and max is the max response time in seconds. For the max column values in the top 25% of the range have a red background and in the bottom 25% of the range have a green background. The red background is not used when the min value is within 80% of the max value.
| dbms | 256us | 1ms | 4ms | 16ms | 64ms | 256ms | 1s | 4s | 16s | gt | max |
|---|---|---|---|---|---|---|---|---|---|---|---|
| pg182_o2nofp.cx10b_c8r32 | 45.443 | 54.471 | 0.086 | 0.013 | |||||||
| pg182_o2nofp.cx10b_fpw0_c8r32 | 52.560 | 47.366 | 0.073 | 0.001 | 0.023 | ||||||
| pg182_o2nofp.cx10b_wallz4_c8r32 | 16.588 | 83.272 | 0.140 | 0.012 | |||||||
| pg182_o2nofp.cx10b_fpw0_wallz4_c8r32 | 49.331 | 50.610 | 0.059 | 0.013 |
Delete response time histogram: each cell has the percentage of responses that take <= the time in the header and max is the max response time in seconds. For the max column values in the top 25% of the range have a red background and in the bottom 25% of the range have a green background. The red background is not used when the min value is within 80% of the max value.
| dbms | 256us | 1ms | 4ms | 16ms | 64ms | 256ms | 1s | 4s | 16s | gt | max |
|---|---|---|---|---|---|---|---|---|---|---|---|
| pg182_o2nofp.cx10b_c8r32 | 99.999 | 0.001 | 0.084 | ||||||||
| pg182_o2nofp.cx10b_fpw0_c8r32 | 99.999 | 0.001 | 0.082 | ||||||||
| pg182_o2nofp.cx10b_wallz4_c8r32 | 99.999 | 0.001 | 0.082 | ||||||||
| pg182_o2nofp.cx10b_fpw0_wallz4_c8r32 | 99.999 | 0.001 | 0.082 |
Performance metrics for the DBMS listed above. Some are normalized by throughput, others are not. Legend for results is here.
ips	qps	rps	rmbps	wps	wmbps	rpq	rkbpq	wpi	wkbpi	csps	cpups	cspq	cpupq	dbgb1	dbgb2	rss	maxop	p50	p99	tag
178	0	191	1.6	512.6	7.1	1.072	9.004	2.878	40.937	1143	12.8	6.416	5750	154.4	194.5	22.9	0.013	180	155	pg182_o2nofp.cx10b_c8r32
178	0	191	1.5	510.3	5.1	1.071	8.677	2.861	29.559	1138	12.7	6.381	5695	154.4	194.3	23.4	0.023	175	160	pg182_o2nofp.cx10b_fpw0_c8r32
178	0	191	1.5	511.2	6.3	1.072	8.683	2.867	36.228	1152	12.8	6.459	5743	154.4	193.1	23.4	0.012	180	160	pg182_o2nofp.cx10b_wallz4_c8r32
177	0	189	1.5	506.0	5.1	1.071	8.682	2.862	29.551	1128	12.7	6.381	5747	154.4	194.3	23.4	0.013	175	155	pg182_o2nofp.cx10b_fpw0_wallz4_c8r32
Average values from iostat.
r/s	rkB/s	rrqm/s	%rrqm	r_await	rareq-s	w/s	wkB/s	wrqm/s	%wrqm	w_await	wareq-s	d/s	dkB/s	drqm/s	%drqm	d_await	dareq-s	f/s	f_await	aqu-sz	%util
191.0	1603.3	0.000	0.000	0.055	8.393	513.1	7295.6	4.581	1.316	0.091	20.09	0.002	0.156	0.000	0.000	0.005	0.384	6.288	1.706	0.052	2.888		pg182_o2nofp.cx10b_c8r32
191.0	1547.8	0.000	0.000	0.055	8.102	510.8	5277.2	2.883	1.560	0.118	10.45	0.004	29.46	0.000	0.000	0.004	11.44	5.483	1.740	0.047	2.620		pg182_o2nofp.cx10b_fpw0_c8r32
191.1	1548.0	0.000	0.000	0.057	8.102	511.6	6463.6	3.984	1.256	0.090	16.53	0.020	260.6	0.000	0.000	0.004	12.83	6.051	1.696	0.050	2.877		pg182_o2nofp.cx10b_wallz4_c8r32
189.4	1534.8	0.000	0.000	0.055	8.103	506.4	5229.2	1.741	1.191	0.113	10.47	0.004	26.30	0.000	0.000	0.005	11.04	5.272	1.731	0.046	2.579		pg182_o2nofp.cx10b_fpw0_wallz4_c8r32
qr100.L1
qr100.L1: range queries with 100 insert/s per client. Graphs for performance per 1-second interval are here.
Average throughput:
Query response time histogram: each cell has the percentage of responses that take <= the time in the header and max is the max response time in seconds. For max values in the top 25% of the range have a red background and in the bottom 25% of the range have a green background. The red background is not used when the min value is within 80% of the max value.
| dbms | 256us | 1ms | 4ms | 16ms | 64ms | 256ms | 1s | 4s | 16s | gt | max |
|---|---|---|---|---|---|---|---|---|---|---|---|
| pg182_o2nofp.cx10b_c8r32 | 99.991 | 0.009 | nonzero | nonzero | 0.009 | ||||||
| pg182_o2nofp.cx10b_fpw0_c8r32 | 99.991 | 0.009 | nonzero | nonzero | 0.010 | ||||||
| pg182_o2nofp.cx10b_wallz4_c8r32 | 99.992 | 0.008 | nonzero | nonzero | 0.010 | ||||||
| pg182_o2nofp.cx10b_fpw0_wallz4_c8r32 | 99.990 | 0.010 | nonzero | nonzero | 0.011 |
Insert response time histogram: each cell has the percentage of responses that take <= the time in the header and max is the max response time in seconds. For max values in the top 25% of the range have a red background and in the bottom 25% of the range have a green background. The red background is not used when the min value is within 80% of the max value.
| dbms | 256us | 1ms | 4ms | 16ms | 64ms | 256ms | 1s | 4s | 16s | gt | max |
|---|---|---|---|---|---|---|---|---|---|---|---|
| pg182_o2nofp.cx10b_c8r32 | 0.028 | 99.917 | 0.056 | 0.023 | |||||||
| pg182_o2nofp.cx10b_fpw0_c8r32 | 25.111 | 74.861 | 0.028 | 0.022 | |||||||
| pg182_o2nofp.cx10b_wallz4_c8r32 | 99.972 | 0.028 | 0.024 | ||||||||
| pg182_o2nofp.cx10b_fpw0_wallz4_c8r32 | 23.389 | 76.583 | 0.028 | 0.022 |
Delete response time histogram: each cell has the percentage of responses that take <= the time in the header and max is the max response time in seconds. For max values in the top 25% of the range have a red background and in the bottom 25% of the range have a green background. The red background is not used when the min value is within 80% of the max value.
| dbms | 256us | 1ms | 4ms | 16ms | 64ms | 256ms | 1s | 4s | 16s | gt | max |
|---|---|---|---|---|---|---|---|---|---|---|---|
| pg182_o2nofp.cx10b_c8r32 | 58.500 | 41.500 | 0.003 | ||||||||
| pg182_o2nofp.cx10b_fpw0_c8r32 | 58.000 | 42.000 | 0.003 | ||||||||
| pg182_o2nofp.cx10b_wallz4_c8r32 | 57.778 | 42.222 | 0.003 | ||||||||
| pg182_o2nofp.cx10b_fpw0_wallz4_c8r32 | 58.417 | 41.583 | 0.003 |
Performance metrics for the DBMS listed above. Some are normalized by throughput, others are not. Legend for results is here.
ips	qps	rps	rmbps	wps	wmbps	rpq	rkbpq	wpi	wkbpi	csps	cpups	cspq	cpupq	dbgb1	dbgb2	rss	maxop	p50	p99	tag
100	25508	111	0.9	66.6	1.9	0.004	0.036	0.667	19.422	97550	8.6	3.824	27	154.4	192.6	23.4	0.009	25493	25208	pg182_o2nofp.cx10b_c8r32
100	25255	110	0.9	58.1	0.5	0.004	0.036	0.582	5.239	96634	8.8	3.826	28	154.4	193.8	23.4	0.010	25293	24919	pg182_o2nofp.cx10b_fpw0_c8r32
100	25555	111	0.9	61.8	1.4	0.004	0.036	0.619	14.445	97782	8.6	3.826	27	154.4	190.3	23.4	0.010	25643	24983	pg182_o2nofp.cx10b_wallz4_c8r32
100	25472	111	0.9	57.7	0.5	0.004	0.036	0.578	5.205	97415	8.7	3.824	27	154.4	193.8	23.4	0.011	25581	24901	pg182_o2nofp.cx10b_fpw0_wallz4_c8r32
Average values from iostat.
r/s	rkB/s	rrqm/s	%rrqm	r_await	rareq-s	w/s	wkB/s	wrqm/s	%wrqm	w_await	wareq-s	d/s	dkB/s	drqm/s	%drqm	d_await	dareq-s	f/s	f_await	aqu-sz	%util
107.3	880.1	0.000	0.000	0.081	8.199	66.74	1941.1	1.672	5.507	0.922	61.13	0.001	0.002	0.000	0.000	0.003	0.011	2.606	2.198	0.086	1.992		pg182_o2nofp.cx10b_c8r32
107.1	873.9	0.000	0.000	0.057	8.163	58.21	524.2	1.899	13.28	1.506	11.73	0.001	9.130	0.000	0.000	0.003	45.65	2.300	2.211	0.081	1.645		pg182_o2nofp.cx10b_fpw0_c8r32
107.8	881.5	0.000	0.000	0.058	8.176	61.96	1442.6	1.562	6.664	1.153	54.54	0.001	0.002	0.000	0.000	0.000	0.011	2.452	2.077	0.079	1.701		pg182_o2nofp.cx10b_wallz4_c8r32
107.9	881.8	0.000	0.000	0.057	8.174	57.87	521.3	1.807	13.82	1.451	11.65	0.001	9.130	0.000	0.000	0.003	45.65	2.309	2.175	0.080	1.662		pg182_o2nofp.cx10b_fpw0_wallz4_c8r32
qp100.L2
qp100.L2: point queries with 100 insert/s per client. Graphs for performance per 1-second interval are here.
Average throughput:
Query response time histogram: each cell has the percentage of responses that take <= the time in the header and max is the max response time in seconds. For max values in the top 25% of the range have a red background and in the bottom 25% of the range have a green background. The red background is not used when the min value is within 80% of the max value.
| dbms | 256us | 1ms | 4ms | 16ms | 64ms | 256ms | 1s | 4s | 16s | gt | max |
|---|---|---|---|---|---|---|---|---|---|---|---|
| pg182_o2nofp.cx10b_c8r32 | nonzero | 42.618 | 57.340 | 0.041 | nonzero | 0.019 | |||||
| pg182_o2nofp.cx10b_fpw0_c8r32 | 0.002 | 95.015 | 4.969 | 0.013 | 0.013 | ||||||
| pg182_o2nofp.cx10b_wallz4_c8r32 | 0.002 | 94.965 | 5.016 | 0.016 | 0.012 | ||||||
| pg182_o2nofp.cx10b_fpw0_wallz4_c8r32 | 0.002 | 94.871 | 5.111 | 0.015 | 0.016 |
Insert response time histogram: each cell has the percentage of responses that take <= the time in the header and max is the max response time in seconds. For max values in the top 25% of the range have a red background and in the bottom 25% of the range have a green background. The red background is not used when the min value is within 80% of the max value.
| dbms | 256us | 1ms | 4ms | 16ms | 64ms | 256ms | 1s | 4s | 16s | gt | max |
|---|---|---|---|---|---|---|---|---|---|---|---|
| pg182_o2nofp.cx10b_c8r32 | 99.944 | 0.056 | 0.024 | ||||||||
| pg182_o2nofp.cx10b_fpw0_c8r32 | 99.944 | 0.056 | 0.039 | ||||||||
| pg182_o2nofp.cx10b_wallz4_c8r32 | 99.972 | 0.028 | 0.017 | ||||||||
| pg182_o2nofp.cx10b_fpw0_wallz4_c8r32 | 99.972 | 0.028 | 0.022 |
Delete response time histogram: each cell has the percentage of responses that take <= the time in the header and max is the max response time in seconds. For max values in the top 25% of the range have a red background and in the bottom 25% of the range have a green background. The red background is not used when the min value is within 80% of the max value.
| dbms | 256us | 1ms | 4ms | 16ms | 64ms | 256ms | 1s | 4s | 16s | gt | max |
|---|---|---|---|---|---|---|---|---|---|---|---|
| pg182_o2nofp.cx10b_c8r32 | 5.583 | 94.389 | 0.028 | 0.008 | |||||||
| pg182_o2nofp.cx10b_fpw0_c8r32 | 6.889 | 93.083 | 0.028 | 0.007 | |||||||
| pg182_o2nofp.cx10b_wallz4_c8r32 | 6.306 | 93.667 | 0.028 | 0.008 | |||||||
| pg182_o2nofp.cx10b_fpw0_wallz4_c8r32 | 6.444 | 93.528 | 0.028 | 0.007 |
Performance metrics for the DBMS listed above. Some are normalized by throughput, others are not. Legend for results is here.
ips	qps	rps	rmbps	wps	wmbps	rpq	rkbpq	wpi	wkbpi	csps	cpups	cspq	cpupq	dbgb1	dbgb2	rss	maxop	p50	p99	tag
100	939	11824	92.5	355.0	4.1	12.598	100.912	3.557	42.323	26294	2.8	28.014	239	154.5	192.6	23.4	0.019	976	576	pg182_o2nofp.cx10b_c8r32
100	1304	16081	126.1	344.5	2.7	12.332	99.013	3.451	28.126	35822	3.9	27.471	239	154.5	193.7	23.4	0.013	1343	784	pg182_o2nofp.cx10b_fpw0_c8r32
100	1300	16112	126.0	355.7	3.7	12.390	99.192	3.564	37.757	35870	3.6	27.584	221	154.5	190.3	23.4	0.012	1328	816	pg182_o2nofp.cx10b_wallz4_c8r32
100	1299	16069	125.6	345.1	2.7	12.370	99.017	3.454	28.117	35775	3.6	27.540	222	154.5	193.7	23.4	0.016	1328	800	pg182_o2nofp.cx10b_fpw0_wallz4_c8r32
Average values from iostat.
r/s	rkB/s	rrqm/s	%rrqm	r_await	rareq-s	w/s	wkB/s	wrqm/s	%wrqm	w_await	wareq-s	d/s	dkB/s	drqm/s	%drqm	d_await	dareq-s	f/s	f_await	aqu-sz	%util
11826.0	94728.8	0.000	0.000	0.060	8.010	354.2	4217.9	2.598	1.121	0.071	14.37	0.001	0.002	0.000	0.000	0.003	0.011	3.643	1.891	0.771	79.27		pg182_o2nofp.cx10b_c8r32
16084.0	129138	0.000	0.000	0.040	8.029	343.3	2797.6	2.534	1.150	0.067	8.214	0.002	27.38	0.000	0.000	0.004	45.65	3.080	1.992	0.686	71.47		pg182_o2nofp.cx10b_fpw0_c8r32
16115.0	129013	0.000	0.000	0.040	8.006	354.4	3758.5	2.346	0.978	0.071	11.96	0.001	0.002	0.000	0.000	0.006	0.011	3.488	1.953	0.689	73.41		pg182_o2nofp.cx10b_wallz4_c8r32
16072.2	128647	0.000	0.000	0.040	8.003	343.9	2799.3	1.712	0.807	0.072	8.206	0.003	36.51	0.000	0.000	0.005	45.65	3.059	2.006	0.686	73.05		pg182_o2nofp.cx10b_fpw0_wallz4_c8r32
qr500.L3
qr500.L3: range queries with 500 insert/s per client. Graphs for performance per 1-second interval are here.
Average throughput:
Query response time histogram: each cell has the percentage of responses that take <= the time in the header and max is the max response time in seconds. For max values in the top 25% of the range have a red background and in the bottom 25% of the range have a green background. The red background is not used when the min value is within 80% of the max value.
| dbms | 256us | 1ms | 4ms | 16ms | 64ms | 256ms | 1s | 4s | 16s | gt | max |
|---|---|---|---|---|---|---|---|---|---|---|---|
| pg182_o2nofp.cx10b_c8r32 | 99.985 | 0.015 | nonzero | nonzero | nonzero | 0.023 | |||||
| pg182_o2nofp.cx10b_fpw0_c8r32 | 99.986 | 0.014 | nonzero | nonzero | nonzero | 0.025 | |||||
| pg182_o2nofp.cx10b_wallz4_c8r32 | 99.985 | 0.014 | nonzero | nonzero | 0.011 | ||||||
| pg182_o2nofp.cx10b_fpw0_wallz4_c8r32 | 99.985 | 0.015 | nonzero | nonzero | nonzero | 0.021 |
Insert response time histogram: each cell has the percentage of responses that take <= the time in the header and max is the max response time in seconds. For max values in the top 25% of the range have a red background and in the bottom 25% of the range have a green background. The red background is not used when the min value is within 80% of the max value.
| dbms | 256us | 1ms | 4ms | 16ms | 64ms | 256ms | 1s | 4s | 16s | gt | max |
|---|---|---|---|---|---|---|---|---|---|---|---|
| pg182_o2nofp.cx10b_c8r32 | 99.889 | 0.111 | 0.019 | ||||||||
| pg182_o2nofp.cx10b_fpw0_c8r32 | 100.000 | 0.015 | |||||||||
| pg182_o2nofp.cx10b_wallz4_c8r32 | 99.933 | 0.067 | 0.023 | ||||||||
| pg182_o2nofp.cx10b_fpw0_wallz4_c8r32 | 100.000 | 0.015 |
Delete response time histogram: each cell has the percentage of responses that take <= the time in the header and max is the max response time in seconds. For max values in the top 25% of the range have a red background and in the bottom 25% of the range have a green background. The red background is not used when the min value is within 80% of the max value.
| dbms | 256us | 1ms | 4ms | 16ms | 64ms | 256ms | 1s | 4s | 16s | gt | max |
|---|---|---|---|---|---|---|---|---|---|---|---|
| pg182_o2nofp.cx10b_c8r32 | 53.522 | 46.478 | 0.013 | ||||||||
| pg182_o2nofp.cx10b_fpw0_c8r32 | 53.983 | 46.017 | 0.012 | ||||||||
| pg182_o2nofp.cx10b_wallz4_c8r32 | 52.650 | 47.350 | 0.012 | ||||||||
| pg182_o2nofp.cx10b_fpw0_wallz4_c8r32 | 52.933 | 47.067 | 0.012 |
Performance metrics for the DBMS listed above. Some are normalized by throughput, others are not. Legend for results is here.
ips	qps	rps	rmbps	wps	wmbps	rpq	rkbpq	wpi	wkbpi	csps	cpups	cspq	cpupq	dbgb1	dbgb2	rss	maxop	p50	p99	tag
499	23669	872	6.9	342.8	9.3	0.037	0.301	0.686	19.078	92180	9.8	3.895	33	154.5	190.2	23.4	0.023	23752	22637	pg182_o2nofp.cx10b_c8r32
499	23623	878	7.0	288.8	2.8	0.037	0.302	0.578	5.780	91986	9.7	3.894	33	154.5	193.7	23.4	0.025	23661	22318	pg182_o2nofp.cx10b_fpw0_c8r32
499	23839	877	7.0	318.2	7.0	0.037	0.299	0.637	14.399	92831	9.8	3.894	33	154.5	188.7	23.4	0.011	23883	22574	pg182_o2nofp.cx10b_wallz4_c8r32
500	23510	878	7.0	287.7	2.8	0.037	0.304	0.576	5.760	91504	9.8	3.892	33	154.5	193.7	23.4	0.021	23527	22365	pg182_o2nofp.cx10b_fpw0_wallz4_c8r32
Average values from iostat.
r/s	rkB/s	rrqm/s	%rrqm	r_await	rareq-s	w/s	wkB/s	wrqm/s	%wrqm	w_await	wareq-s	d/s	dkB/s	drqm/s	%drqm	d_await	dareq-s	f/s	f_await	aqu-sz	%util
862.5	7011.7	0.000	0.000	0.070	8.131	343.3	9529.7	3.077	2.115	0.278	65.23	0.097	1460.5	0.000	0.000	0.004	42.48	7.430	1.714	0.113	7.231		pg182_o2nofp.cx10b_c8r32
868.0	7040.5	0.000	0.000	0.040	8.112	289.4	2893.0	1.736	7.188	0.686	24.41	0.006	54.87	0.000	0.000	0.005	74.25	2.573	1.971	0.064	4.693		pg182_o2nofp.cx10b_fpw0_c8r32
867.4	7038.2	0.000	0.000	0.050	8.113	318.8	7196.2	2.440	2.464	0.377	63.05	0.068	976.8	0.000	0.000	0.008	40.73	5.728	1.759	0.088	5.345		pg182_o2nofp.cx10b_wallz4_c8r32
867.6	7028.8	0.000	0.000	0.040	8.102	288.3	2883.8	1.352	6.727	0.681	23.91	0.005	36.63	0.000	0.000	0.001	22.90	2.569	1.967	0.064	4.692		pg182_o2nofp.cx10b_fpw0_wallz4_c8r32
qp500.L4
qp500.L4: point queries with 500 insert/s per client. Graphs for performance per 1-second interval are here.
Average throughput:
Query response time histogram: each cell has the percentage of responses that take <= the time in the header and max is the max response time in seconds. For max values in the top 25% of the range have a red background and in the bottom 25% of the range have a green background. The red background is not used when the min value is within 80% of the max value.
| dbms | 256us | 1ms | 4ms | 16ms | 64ms | 256ms | 1s | 4s | 16s | gt | max |
|---|---|---|---|---|---|---|---|---|---|---|---|
| pg182_o2nofp.cx10b_c8r32 | nonzero | 33.346 | 66.541 | 0.112 | nonzero | 0.021 | |||||
| pg182_o2nofp.cx10b_fpw0_c8r32 | 0.001 | 95.128 | 4.856 | 0.014 | 0.014 | ||||||
| pg182_o2nofp.cx10b_wallz4_c8r32 | 0.002 | 94.418 | 5.558 | 0.023 | 0.013 | ||||||
| pg182_o2nofp.cx10b_fpw0_wallz4_c8r32 | 0.002 | 94.667 | 5.312 | 0.020 | nonzero | 0.020 |
Insert response time histogram: each cell has the percentage of responses that take <= the time in the header and max is the max response time in seconds. For max values in the top 25% of the range have a red background and in the bottom 25% of the range have a green background. The red background is not used when the min value is within 80% of the max value.
| dbms | 256us | 1ms | 4ms | 16ms | 64ms | 256ms | 1s | 4s | 16s | gt | max |
|---|---|---|---|---|---|---|---|---|---|---|---|
| pg182_o2nofp.cx10b_c8r32 | 99.783 | 0.217 | 0.064 | ||||||||
| pg182_o2nofp.cx10b_fpw0_c8r32 | 100.000 | 0.012 | |||||||||
| pg182_o2nofp.cx10b_wallz4_c8r32 | 99.978 | 0.022 | 0.020 | ||||||||
| pg182_o2nofp.cx10b_fpw0_wallz4_c8r32 | 100.000 | 0.015 |
Delete response time histogram: each cell has the percentage of responses that take <= the time in the header and max is the max response time in seconds. For max values in the top 25% of the range have a red background and in the bottom 25% of the range have a green background. The red background is not used when the min value is within 80% of the max value.
| dbms | 256us | 1ms | 4ms | 16ms | 64ms | 256ms | 1s | 4s | 16s | gt | max |
|---|---|---|---|---|---|---|---|---|---|---|---|
| pg182_o2nofp.cx10b_c8r32 | 99.911 | 0.089 | 0.036 | ||||||||
| pg182_o2nofp.cx10b_fpw0_c8r32 | 99.922 | 0.078 | 0.035 | ||||||||
| pg182_o2nofp.cx10b_wallz4_c8r32 | 99.900 | 0.100 | 0.035 | ||||||||
| pg182_o2nofp.cx10b_fpw0_wallz4_c8r32 | 99.939 | 0.061 | 0.036 |
Performance metrics for the DBMS listed above. Some are normalized by throughput, others are not. Legend for results is here.
ips	qps	rps	rmbps	wps	wmbps	rpq	rkbpq	wpi	wkbpi	csps	cpups	cspq	cpupq	dbgb1	dbgb2	rss	maxop	p50	p99	tag
499	894	12260	96.2	1597.4	18.6	13.708	110.144	3.199	38.175	27092	4.8	30.290	429	154.6	188.4	23.4	0.021	928	656	pg182_o2nofp.cx10b_c8r32
500	1280	16720	131.0	1565.0	12.6	13.064	104.784	3.132	25.768	37048	5.0	28.948	313	154.6	193.5	23.4	0.014	1296	991	pg182_o2nofp.cx10b_fpw0_c8r32
500	1263	16644	130.2	1608.8	16.7	13.182	105.584	3.220	34.232	36864	5.3	29.197	336	154.6	185.6	23.4	0.013	1280	960	pg182_o2nofp.cx10b_wallz4_c8r32
499	1268	16708	130.7	1564.2	12.6	13.172	105.513	3.132	25.768	36986	4.9	29.160	309	154.6	193.5	23.4	0.020	1296	976	pg182_o2nofp.cx10b_fpw0_wallz4_c8r32
Average values from iostat.
r/s	rkB/s	rrqm/s	%rrqm	r_await	rareq-s	w/s	wkB/s	wrqm/s	%wrqm	w_await	wareq-s	d/s	dkB/s	drqm/s	%drqm	d_await	dareq-s	f/s	f_await	aqu-sz	%util
12264.5	98546.0	0.000	0.000	0.060	8.035	1588.7	18995.8	4.462	0.364	0.058	13.35	0.071	1113.6	0.000	0.000	0.005	89.83	9.866	1.779	0.884	79.21		pg182_o2nofp.cx10b_c8r32
16723.3	134133	0.000	0.000	0.040	8.021	1553.1	12781.0	2.732	0.248	0.039	8.319	0.011	155.2	0.000	0.000	0.005	43.11	4.726	1.890	0.754	73.57		pg182_o2nofp.cx10b_fpw0_c8r32
16647.1	133334	0.000	0.000	0.040	8.010	1594.8	16994.5	4.048	0.320	0.045	11.68	0.124	1889.4	0.000	0.000	0.007	88.19	7.599	1.828	0.776	73.46		pg182_o2nofp.cx10b_wallz4_c8r32
16710.8	133857	0.000	0.000	0.040	8.010	1552.0	12770.7	1.858	0.169	0.037	8.318	0.012	173.4	0.000	0.000	0.008	86.72	4.731	1.962	0.752	74.77		pg182_o2nofp.cx10b_fpw0_wallz4_c8r32
qr1000.L5
qr1000.L5: range queries with 1000 insert/s per client. Graphs for performance per 1-second interval are here.
Average throughput:
Query response time histogram: each cell has the percentage of responses that take <= the time in the header and max is the max response time in seconds. For max values in the top 25% of the range have a red background and in the bottom 25% of the range have a green background. The red background is not used when the min value is within 80% of the max value.
| dbms | 256us | 1ms | 4ms | 16ms | 64ms | 256ms | 1s | 4s | 16s | gt | max |
|---|---|---|---|---|---|---|---|---|---|---|---|
| pg182_o2nofp.cx10b_c8r32 | 99.960 | 0.037 | 0.002 | nonzero | nonzero | nonzero | 0.084 | ||||
| pg182_o2nofp.cx10b_fpw0_c8r32 | 99.966 | 0.032 | 0.002 | nonzero | nonzero | nonzero | 0.077 | ||||
| pg182_o2nofp.cx10b_wallz4_c8r32 | 99.961 | 0.036 | 0.002 | nonzero | nonzero | nonzero | 0.078 | ||||
| pg182_o2nofp.cx10b_fpw0_wallz4_c8r32 | 99.960 | 0.038 | 0.002 | nonzero | nonzero | nonzero | 0.081 |
Insert response time histogram: each cell has the percentage of responses that take <= the time in the header and max is the max response time in seconds. For max values in the top 25% of the range have a red background and in the bottom 25% of the range have a green background. The red background is not used when the min value is within 80% of the max value.
| dbms | 256us | 1ms | 4ms | 16ms | 64ms | 256ms | 1s | 4s | 16s | gt | max |
|---|---|---|---|---|---|---|---|---|---|---|---|
| pg182_o2nofp.cx10b_c8r32 | 0.017 | 99.958 | 0.025 | 0.020 | |||||||
| pg182_o2nofp.cx10b_fpw0_c8r32 | 1.533 | 98.464 | 0.003 | 0.016 | |||||||
| pg182_o2nofp.cx10b_wallz4_c8r32 | 99.975 | 0.025 | 0.023 | ||||||||
| pg182_o2nofp.cx10b_fpw0_wallz4_c8r32 | 1.328 | 98.669 | 0.003 | 0.018 |
Delete response time histogram: each cell has the percentage of responses that take <= the time in the header and max is the max response time in seconds. For max values in the top 25% of the range have a red background and in the bottom 25% of the range have a green background. The red background is not used when the min value is within 80% of the max value.
| dbms | 256us | 1ms | 4ms | 16ms | 64ms | 256ms | 1s | 4s | 16s | gt | max |
|---|---|---|---|---|---|---|---|---|---|---|---|
| pg182_o2nofp.cx10b_c8r32 | 17.914 | 82.086 | 0.054 | ||||||||
| pg182_o2nofp.cx10b_fpw0_c8r32 | 18.575 | 81.425 | 0.052 | ||||||||
| pg182_o2nofp.cx10b_wallz4_c8r32 | 18.292 | 81.708 | 0.053 | ||||||||
| pg182_o2nofp.cx10b_fpw0_wallz4_c8r32 | 20.522 | 79.478 | 0.053 |
Performance metrics for the DBMS listed above. Some are normalized by throughput, others are not. Legend for results is here.
ips	qps	rps	rmbps	wps	wmbps	rpq	rkbpq	wpi	wkbpi	csps	cpups	cspq	cpupq	dbgb1	dbgb2	rss	maxop	p50	p99	tag
999	19335	1499	12.0	925.4	19.0	0.078	0.638	0.927	19.520	77075	15.8	3.986	65	154.8	187.5	23.4	0.084	19356	17725	pg182_o2nofp.cx10b_c8r32
999	19435	1509	12.1	784.3	7.1	0.078	0.635	0.785	7.307	77372	15.5	3.981	64	154.8	193.3	23.4	0.077	19468	17913	pg182_o2nofp.cx10b_fpw0_c8r32
999	19372	1509	12.1	859.9	14.8	0.078	0.637	0.860	15.123	77179	15.9	3.984	66	154.8	184.2	23.4	0.078	19402	17612	pg182_o2nofp.cx10b_wallz4_c8r32
999	19057	1510	12.1	786.8	7.1	0.079	0.648	0.788	7.330	75975	15.4	3.987	65	154.8	193.3	23.4	0.081	19084	17310	pg182_o2nofp.cx10b_fpw0_wallz4_c8r32
Average values from iostat.
r/s	rkB/s	rrqm/s	%rrqm	r_await	rareq-s	w/s	wkB/s	wrqm/s	%wrqm	w_await	wareq-s	d/s	dkB/s	drqm/s	%drqm	d_await	dareq-s	f/s	f_await	aqu-sz	%util
1487.9	12138.7	0.000	0.000	0.060	8.162	925.8	19482.2	5.225	0.826	0.145	34.47	0.043	593.4	0.000	0.000	0.004	39.05	13.48	1.695	0.211	11.47		pg182_o2nofp.cx10b_c8r32
1498.1	12166.2	0.000	0.000	0.040	8.124	785.3	7312.7	2.481	1.828	0.156	12.70	0.018	246.6	0.000	0.000	0.004	38.53	4.252	1.914	0.115	7.991		pg182_o2nofp.cx10b_fpw0_c8r32
1498.3	12162.7	0.000	0.000	0.050	8.121	860.8	15116.1	4.041	0.911	0.145	33.20	0.062	885.5	0.000	0.000	0.005	40.26	9.935	1.762	0.160	9.209		pg182_o2nofp.cx10b_wallz4_c8r32
1499.2	12166.5	0.000	0.000	0.040	8.119	787.6	7330.1	1.630	1.744	0.207	14.97	0.018	237.4	0.000	0.000	0.001	38.31	4.239	1.877	0.111	7.976		pg182_o2nofp.cx10b_fpw0_wallz4_c8r32
qp1000.L6
qp1000.L6: point queries with 1000 insert/s per client. Graphs for performance per 1-second interval are here.
Average throughput:
Query response time histogram: each cell has the percentage of responses that take <= the time in the header and max is the max response time in seconds. For max values in the top 25% of the range have a red background and in the bottom 25% of the range have a green background. The red background is not used when the min value is within 80% of the max value.
| dbms | 256us | 1ms | 4ms | 16ms | 64ms | 256ms | 1s | 4s | 16s | gt | max |
|---|---|---|---|---|---|---|---|---|---|---|---|
| pg182_o2nofp.cx10b_c8r32 | nonzero | 16.926 | 82.868 | 0.206 | nonzero | 0.016 | |||||
| pg182_o2nofp.cx10b_fpw0_c8r32 | 0.001 | 90.385 | 9.599 | 0.015 | 0.013 | ||||||
| pg182_o2nofp.cx10b_wallz4_c8r32 | 0.001 | 88.821 | 11.149 | 0.030 | 0.014 | ||||||
| pg182_o2nofp.cx10b_fpw0_wallz4_c8r32 | 0.001 | 85.801 | 14.124 | 0.074 | nonzero | nonzero | 0.379 |
Insert response time histogram: each cell has the percentage of responses that take <= the time in the header and max is the max response time in seconds. For max values in the top 25% of the range have a red background and in the bottom 25% of the range have a green background. The red background is not used when the min value is within 80% of the max value.
| dbms | 256us | 1ms | 4ms | 16ms | 64ms | 256ms | 1s | 4s | 16s | gt | max |
|---|---|---|---|---|---|---|---|---|---|---|---|
| pg182_o2nofp.cx10b_c8r32 | 99.900 | 0.100 | 0.024 | ||||||||
| pg182_o2nofp.cx10b_fpw0_c8r32 | 0.003 | 99.994 | 0.003 | 0.016 | |||||||
| pg182_o2nofp.cx10b_wallz4_c8r32 | 99.972 | 0.028 | 0.024 | ||||||||
| pg182_o2nofp.cx10b_fpw0_wallz4_c8r32 | 0.008 | 97.614 | 2.378 | 0.050 |
Delete response time histogram: each cell has the percentage of responses that take <= the time in the header and max is the max response time in seconds. For max values in the top 25% of the range have a red background and in the bottom 25% of the range have a green background. The red background is not used when the min value is within 80% of the max value.
| dbms | 256us | 1ms | 4ms | 16ms | 64ms | 256ms | 1s | 4s | 16s | gt | max |
|---|---|---|---|---|---|---|---|---|---|---|---|
| pg182_o2nofp.cx10b_c8r32 | 99.997 | 0.003 | 0.085 | ||||||||
| pg182_o2nofp.cx10b_fpw0_c8r32 | 99.997 | 0.003 | 0.084 | ||||||||
| pg182_o2nofp.cx10b_wallz4_c8r32 | 99.997 | 0.003 | 0.085 | ||||||||
| pg182_o2nofp.cx10b_fpw0_wallz4_c8r32 | 99.997 | 0.003 | 0.084 |
Performance metrics for the DBMS listed above. Some are normalized by throughput, others are not. Legend for results is here.
ips	qps	rps	rmbps	wps	wmbps	rpq	rkbpq	wpi	wkbpi	csps	cpups	cspq	cpupq	dbgb1	dbgb2	rss	maxop	p50	p99	tag
999	800	12405	97.5	2820.0	34.6	15.510	124.895	2.823	35.467	27262	12.7	34.085	1270	155.0	190.7	23.4	0.016	816	544	pg182_o2nofp.cx10b_c8r32
999	1206	17214	134.8	2806.7	22.6	14.276	114.494	2.808	23.204	37907	12.9	31.437	856	155.0	192.8	23.4	0.013	1232	800	pg182_o2nofp.cx10b_fpw0_c8r32
999	1180	17026	133.2	2857.3	29.8	14.425	115.549	2.859	30.491	37492	13.4	31.765	908	155.0	183.9	23.4	0.014	1200	768	pg182_o2nofp.cx10b_wallz4_c8r32
999	1145	16597	129.9	2759.0	22.3	14.492	116.147	2.762	22.827	37256	13.4	32.530	936	155.0	192.9	23.4	0.379	1216	416	pg182_o2nofp.cx10b_fpw0_wallz4_c8r32
Average values from iostat.
r/s	rkB/s	rrqm/s	%rrqm	r_await	rareq-s	w/s	wkB/s	wrqm/s	%wrqm	w_await	wareq-s	d/s	dkB/s	drqm/s	%drqm	d_await	dareq-s	f/s	f_await	aqu-sz	%util
12408.9	99921.9	0.000	0.000	0.061	8.052	2800.5	35275.9	8.378	0.374	0.060	13.68	0.002	0.096	0.000	0.000	0.006	0.245	13.99	1.665	0.959	75.35		pg182_o2nofp.cx10b_c8r32
17220.2	138110	0.000	0.000	0.040	8.020	2781.3	22987.0	2.738	0.127	0.028	8.334	0.026	383.4	0.000	0.000	0.008	85.41	5.252	1.767	0.801	72.26		pg182_o2nofp.cx10b_fpw0_c8r32
17032.1	136435	0.000	0.000	0.040	8.011	2829.8	30255.2	4.707	0.198	0.041	11.36	0.022	310.4	0.000	0.000	0.004	40.86	10.33	1.716	0.849	72.31		pg182_o2nofp.cx10b_wallz4_c8r32
16601.8	133059	0.115	0.001	0.040	8.016	2733.1	22592.5	1.956	0.095	0.028	8.344	0.032	383.5	0.000	0.000	0.019	39.22	5.259	1.749	0.775	69.92		pg182_o2nofp.cx10b_fpw0_wallz4_c8r32
l.i0
l.i0: load without secondary indexes
Performance metrics for all DBMS, not just the ones listed above. Some are normalized by throughput, others are not. Legend for results is here.
ips	qps	rps	rmbps	wps	wmbps	rpq	rkbpq	wpi	wkbpi	csps	cpups	cspq	cpupq	dbgb1	dbgb2	rss	maxop	p50	p99	tag
211977	0	36	0.3	796.6	87.8	0.000	0.001	0.004	0.424	20999	20.5	0.099	8	76.5	116.6	18.5	0.044	213378	205669	pg182_o2nofp.cx10b_c8r32
212879	0	36	0.3	776.7	85.8	0.000	0.001	0.004	0.413	21101	20.4	0.099	8	76.5	116.6	19.7	0.027	214076	207172	pg182_o2nofp.cx10b_fpw0_c8r32
212596	0	37	0.3	786.5	86.5	0.000	0.001	0.004	0.416	21115	20.4	0.099	8	76.5	116.6	1.0	0.027	213971	206376	pg182_o2nofp.cx10b_wallz4_c8r32
213106	0	37	0.3	778.2	85.9	0.000	0.001	0.004	0.413	21134	20.4	0.099	8	76.5	116.6	1.0	0.028	214363	207665	pg182_o2nofp.cx10b_fpw0_wallz4_c8r32
l.x
l.x: create secondary indexes
Performance metrics for all DBMS, not just the ones listed above. Some are normalized by throughput, others are not. Legend for results is here.
ips	qps	rps	rmbps	wps	wmbps	rpq	rkbpq	wpi	wkbpi	csps	cpups	cspq	cpupq	dbgb1	dbgb2	rss	maxop	p50	p99	tag
407540	0	1515	149.7	1255.6	151.4	0.004	0.376	0.003	0.380	1128	12.7	0.003	2	153.6	193.7	23.4	0.003	NA	NA	pg182_o2nofp.cx10b_c8r32
402212	0	1637	161.2	1245.0	150.8	0.004	0.410	0.003	0.384	1505	12.6	0.004	3	153.6	193.7	23.4	0.003	NA	NA	pg182_o2nofp.cx10b_fpw0_c8r32
405268	0	1102	136.5	1112.3	136.1	0.003	0.345	0.003	0.344	848	12.8	0.002	3	153.6	193.7	23.4	0.003	NA	NA	pg182_o2nofp.cx10b_wallz4_c8r32
401002	0	1223	141.2	1109.0	135.0	0.003	0.361	0.003	0.345	950	12.8	0.002	3	153.6	193.7	23.4	0.003	NA	NA	pg182_o2nofp.cx10b_fpw0_wallz4_c8r32
l.i1
l.i1: continue load after secondary indexes created with 50 inserts per transaction
Performance metrics for all DBMS, not just the ones listed above. Some are normalized by throughput, others are not. Legend for results is here.
ips	qps	rps	rmbps	wps	wmbps	rpq	rkbpq	wpi	wkbpi	csps	cpups	cspq	cpupq	dbgb1	dbgb2	rss	maxop	p50	p99	tag
3707	0	5351	44.2	4402.0	75.3	1.443	12.222	1.187	20.814	11930	15.4	3.218	332	154.3	194.3	22.9	0.035	2850	1999	pg182_o2nofp.cx10b_c8r32
3929	0	5651	44.5	4127.7	34.5	1.438	11.604	1.051	9.001	12417	15.0	3.160	305	154.3	194.3	20.9	0.027	2949	2000	pg182_o2nofp.cx10b_fpw0_c8r32
3717	0	5344	42.1	4255.5	59.2	1.438	11.600	1.145	16.302	11871	15.5	3.193	334	154.3	194.3	22.3	0.028	2850	2000	pg182_o2nofp.cx10b_wallz4_c8r32
3887	0	5595	44.1	4109.1	37.1	1.439	11.618	1.057	9.761	12305	14.9	3.165	307	154.3	194.3	20.8	0.028	2949	1950	pg182_o2nofp.cx10b_fpw0_wallz4_c8r32
l.i2
l.i2: continue load after secondary indexes created with 5 inserts per transaction
Performance metrics for all DBMS, not just the ones listed above. Some are normalized by throughput, others are not. Legend for results is here.
ips	qps	rps	rmbps	wps	wmbps	rpq	rkbpq	wpi	wkbpi	csps	cpups	cspq	cpupq	dbgb1	dbgb2	rss	maxop	p50	p99	tag
178	0	191	1.6	512.6	7.1	1.072	9.004	2.878	40.937	1143	12.8	6.416	5750	154.4	194.5	22.9	0.013	180	155	pg182_o2nofp.cx10b_c8r32
178	0	191	1.5	510.3	5.1	1.071	8.677	2.861	29.559	1138	12.7	6.381	5695	154.4	194.3	23.4	0.023	175	160	pg182_o2nofp.cx10b_fpw0_c8r32
178	0	191	1.5	511.2	6.3	1.072	8.683	2.867	36.228	1152	12.8	6.459	5743	154.4	193.1	23.4	0.012	180	160	pg182_o2nofp.cx10b_wallz4_c8r32
177	0	189	1.5	506.0	5.1	1.071	8.682	2.862	29.551	1128	12.7	6.381	5747	154.4	194.3	23.4	0.013	175	155	pg182_o2nofp.cx10b_fpw0_wallz4_c8r32
qr100.L1
qr100.L1: range queries with 100 insert/s per client
Performance metrics for all DBMS, not just the ones listed above. Some are normalized by throughput, others are not. Legend for results is here.
ips	qps	rps	rmbps	wps	wmbps	rpq	rkbpq	wpi	wkbpi	csps	cpups	cspq	cpupq	dbgb1	dbgb2	rss	maxop	p50	p99	tag
100	25508	111	0.9	66.6	1.9	0.004	0.036	0.667	19.422	97550	8.6	3.824	27	154.4	192.6	23.4	0.009	25493	25208	pg182_o2nofp.cx10b_c8r32
100	25255	110	0.9	58.1	0.5	0.004	0.036	0.582	5.239	96634	8.8	3.826	28	154.4	193.8	23.4	0.010	25293	24919	pg182_o2nofp.cx10b_fpw0_c8r32
100	25555	111	0.9	61.8	1.4	0.004	0.036	0.619	14.445	97782	8.6	3.826	27	154.4	190.3	23.4	0.010	25643	24983	pg182_o2nofp.cx10b_wallz4_c8r32
100	25472	111	0.9	57.7	0.5	0.004	0.036	0.578	5.205	97415	8.7	3.824	27	154.4	193.8	23.4	0.011	25581	24901	pg182_o2nofp.cx10b_fpw0_wallz4_c8r32
qp100.L2
qp100.L2: point queries with 100 insert/s per client
Performance metrics for all DBMS, not just the ones listed above. Some are normalized by throughput, others are not. Legend for results is here.
ips	qps	rps	rmbps	wps	wmbps	rpq	rkbpq	wpi	wkbpi	csps	cpups	cspq	cpupq	dbgb1	dbgb2	rss	maxop	p50	p99	tag
100	939	11824	92.5	355.0	4.1	12.598	100.912	3.557	42.323	26294	2.8	28.014	239	154.5	192.6	23.4	0.019	976	576	pg182_o2nofp.cx10b_c8r32
100	1304	16081	126.1	344.5	2.7	12.332	99.013	3.451	28.126	35822	3.9	27.471	239	154.5	193.7	23.4	0.013	1343	784	pg182_o2nofp.cx10b_fpw0_c8r32
100	1300	16112	126.0	355.7	3.7	12.390	99.192	3.564	37.757	35870	3.6	27.584	221	154.5	190.3	23.4	0.012	1328	816	pg182_o2nofp.cx10b_wallz4_c8r32
100	1299	16069	125.6	345.1	2.7	12.370	99.017	3.454	28.117	35775	3.6	27.540	222	154.5	193.7	23.4	0.016	1328	800	pg182_o2nofp.cx10b_fpw0_wallz4_c8r32
qr500.L3
qr500.L3: range queries with 500 insert/s per client
Performance metrics for all DBMS, not just the ones listed above. Some are normalized by throughput, others are not. Legend for results is here.
ips	qps	rps	rmbps	wps	wmbps	rpq	rkbpq	wpi	wkbpi	csps	cpups	cspq	cpupq	dbgb1	dbgb2	rss	maxop	p50	p99	tag
499	23669	872	6.9	342.8	9.3	0.037	0.301	0.686	19.078	92180	9.8	3.895	33	154.5	190.2	23.4	0.023	23752	22637	pg182_o2nofp.cx10b_c8r32
499	23623	878	7.0	288.8	2.8	0.037	0.302	0.578	5.780	91986	9.7	3.894	33	154.5	193.7	23.4	0.025	23661	22318	pg182_o2nofp.cx10b_fpw0_c8r32
499	23839	877	7.0	318.2	7.0	0.037	0.299	0.637	14.399	92831	9.8	3.894	33	154.5	188.7	23.4	0.011	23883	22574	pg182_o2nofp.cx10b_wallz4_c8r32
500	23510	878	7.0	287.7	2.8	0.037	0.304	0.576	5.760	91504	9.8	3.892	33	154.5	193.7	23.4	0.021	23527	22365	pg182_o2nofp.cx10b_fpw0_wallz4_c8r32
qp500.L4
qp500.L4: point queries with 500 insert/s per client
Performance metrics for all DBMS, not just the ones listed above. Some are normalized by throughput, others are not. Legend for results is here.
ips	qps	rps	rmbps	wps	wmbps	rpq	rkbpq	wpi	wkbpi	csps	cpups	cspq	cpupq	dbgb1	dbgb2	rss	maxop	p50	p99	tag
499	894	12260	96.2	1597.4	18.6	13.708	110.144	3.199	38.175	27092	4.8	30.290	429	154.6	188.4	23.4	0.021	928	656	pg182_o2nofp.cx10b_c8r32
500	1280	16720	131.0	1565.0	12.6	13.064	104.784	3.132	25.768	37048	5.0	28.948	313	154.6	193.5	23.4	0.014	1296	991	pg182_o2nofp.cx10b_fpw0_c8r32
500	1263	16644	130.2	1608.8	16.7	13.182	105.584	3.220	34.232	36864	5.3	29.197	336	154.6	185.6	23.4	0.013	1280	960	pg182_o2nofp.cx10b_wallz4_c8r32
499	1268	16708	130.7	1564.2	12.6	13.172	105.513	3.132	25.768	36986	4.9	29.160	309	154.6	193.5	23.4	0.020	1296	976	pg182_o2nofp.cx10b_fpw0_wallz4_c8r32
qr1000.L5
qr1000.L5: range queries with 1000 insert/s per client
Performance metrics for all DBMS, not just the ones listed above. Some are normalized by throughput, others are not. Legend for results is here.
ips	qps	rps	rmbps	wps	wmbps	rpq	rkbpq	wpi	wkbpi	csps	cpups	cspq	cpupq	dbgb1	dbgb2	rss	maxop	p50	p99	tag
999	19335	1499	12.0	925.4	19.0	0.078	0.638	0.927	19.520	77075	15.8	3.986	65	154.8	187.5	23.4	0.084	19356	17725	pg182_o2nofp.cx10b_c8r32
999	19435	1509	12.1	784.3	7.1	0.078	0.635	0.785	7.307	77372	15.5	3.981	64	154.8	193.3	23.4	0.077	19468	17913	pg182_o2nofp.cx10b_fpw0_c8r32
999	19372	1509	12.1	859.9	14.8	0.078	0.637	0.860	15.123	77179	15.9	3.984	66	154.8	184.2	23.4	0.078	19402	17612	pg182_o2nofp.cx10b_wallz4_c8r32
999	19057	1510	12.1	786.8	7.1	0.079	0.648	0.788	7.330	75975	15.4	3.987	65	154.8	193.3	23.4	0.081	19084	17310	pg182_o2nofp.cx10b_fpw0_wallz4_c8r32
qp1000.L6
qp1000.L6: point queries with 1000 insert/s per client
Performance metrics for all DBMS, not just the ones listed above. Some are normalized by throughput, others are not. Legend for results is here.
ips	qps	rps	rmbps	wps	wmbps	rpq	rkbpq	wpi	wkbpi	csps	cpups	cspq	cpupq	dbgb1	dbgb2	rss	maxop	p50	p99	tag
999	800	12405	97.5	2820.0	34.6	15.510	124.895	2.823	35.467	27262	12.7	34.085	1270	155.0	190.7	23.4	0.016	816	544	pg182_o2nofp.cx10b_c8r32
999	1206	17214	134.8	2806.7	22.6	14.276	114.494	2.808	23.204	37907	12.9	31.437	856	155.0	192.8	23.4	0.013	1232	800	pg182_o2nofp.cx10b_fpw0_c8r32
999	1180	17026	133.2	2857.3	29.8	14.425	115.549	2.859	30.491	37492	13.4	31.765	908	155.0	183.9	23.4	0.014	1200	768	pg182_o2nofp.cx10b_wallz4_c8r32
999	1145	16597	129.9	2759.0	22.3	14.492	116.147	2.762	22.827	37256	13.4	32.530	936	155.0	192.9	23.4	0.379	1216	416	pg182_o2nofp.cx10b_fpw0_wallz4_c8r32
l.i0
- l.i0: load without secondary indexes
- Legend for results is here.
- Each entry lists the percentage of responses that fit in that bucket (slower than max time for previous bucket, faster than min time for next bucket).
Insert response time histogram
256us	1ms	4ms	16ms	64ms	256ms	1s	4s	16s	gt	max	tag
0.000	99.971	0.025	0.004	nonzero	0.000	0.000	0.000	0.000	0.000	0.044	pg182_o2nofp.cx10b_c8r32
0.000	99.976	0.024	nonzero	nonzero	0.000	0.000	0.000	0.000	0.000	0.027	pg182_o2nofp.cx10b_fpw0_c8r32
0.000	99.967	0.032	0.001	nonzero	0.000	0.000	0.000	0.000	0.000	0.027	pg182_o2nofp.cx10b_wallz4_c8r32
0.000	99.979	0.021	nonzero	nonzero	0.000	0.000	0.000	0.000	0.000	0.028	pg182_o2nofp.cx10b_fpw0_wallz4_c8r32
l.x
- l.x: create secondary indexes
- Legend for results is here.
- Each entry lists the percentage of responses that fit in that bucket (slower than max time for previous bucket, faster than min time for next bucket).
TODO - determine whether there is data for create index response time
l.i1
- l.i1: continue load after secondary indexes created with 50 inserts per transaction
- Legend for results is here.
- Each entry lists the percentage of responses that fit in that bucket (slower than max time for previous bucket, faster than min time for next bucket).
Insert response time histogram
256us	1ms	4ms	16ms	64ms	256ms	1s	4s	16s	gt	max	tag
0.000	0.000	0.005	99.905	0.090	0.000	0.000	0.000	0.000	0.000	0.035	pg182_o2nofp.cx10b_c8r32
0.000	0.000	0.054	99.934	0.013	0.000	0.000	0.000	0.000	0.000	0.027	pg182_o2nofp.cx10b_fpw0_c8r32
0.000	0.000	0.000	99.969	0.031	0.000	0.000	0.000	0.000	0.000	0.028	pg182_o2nofp.cx10b_wallz4_c8r32
0.000	0.000	0.009	99.980	0.011	0.000	0.000	0.000	0.000	0.000	0.028	pg182_o2nofp.cx10b_fpw0_wallz4_c8r32
Delete response time histogram
256us	1ms	4ms	16ms	64ms	256ms	1s	4s	16s	gt	max	tag
0.000	1.427	17.850	43.315	37.407	0.000	0.000	0.000	0.000	0.000	0.031	pg182_o2nofp.cx10b_c8r32
0.000	0.557	19.290	46.100	34.053	0.000	0.000	0.000	0.000	0.000	0.032	pg182_o2nofp.cx10b_fpw0_c8r32
0.000	0.685	18.474	45.270	35.571	0.000	0.000	0.000	0.000	0.000	0.030	pg182_o2nofp.cx10b_wallz4_c8r32
0.003	0.369	19.734	44.879	35.016	0.000	0.000	0.000	0.000	0.000	0.033	pg182_o2nofp.cx10b_fpw0_wallz4_c8r32
l.i2
- l.i2: continue load after secondary indexes created with 5 inserts per transaction
- Legend for results is here.
- Each entry lists the percentage of responses that fit in that bucket (slower than max time for previous bucket, faster than min time for next bucket).
Insert response time histogram
256us	1ms	4ms	16ms	64ms	256ms	1s	4s	16s	gt	max	tag
0.000	45.443	54.471	0.086	0.000	0.000	0.000	0.000	0.000	0.000	0.013	pg182_o2nofp.cx10b_c8r32
0.000	52.560	47.366	0.073	0.001	0.000	0.000	0.000	0.000	0.000	0.023	pg182_o2nofp.cx10b_fpw0_c8r32
0.000	16.588	83.272	0.140	0.000	0.000	0.000	0.000	0.000	0.000	0.012	pg182_o2nofp.cx10b_wallz4_c8r32
0.000	49.331	50.610	0.059	0.000	0.000	0.000	0.000	0.000	0.000	0.013	pg182_o2nofp.cx10b_fpw0_wallz4_c8r32
Delete response time histogram
256us	1ms	4ms	16ms	64ms	256ms	1s	4s	16s	gt	max	tag
0.000	0.000	0.000	0.000	99.999	0.001	0.000	0.000	0.000	0.000	0.084	pg182_o2nofp.cx10b_c8r32
0.000	0.000	0.000	0.000	99.999	0.001	0.000	0.000	0.000	0.000	0.082	pg182_o2nofp.cx10b_fpw0_c8r32
0.000	0.000	0.000	0.000	99.999	0.001	0.000	0.000	0.000	0.000	0.082	pg182_o2nofp.cx10b_wallz4_c8r32
0.000	0.000	0.000	0.000	99.999	0.001	0.000	0.000	0.000	0.000	0.082	pg182_o2nofp.cx10b_fpw0_wallz4_c8r32
qr100.L1
- qr100.L1: range queries with 100 insert/s per client
- Legend for results is here.
- Each entry lists the percentage of responses that fit in that bucket (slower than max time for previous bucket, faster than min time for next bucket).
Query response time histogram
256us	1ms	4ms	16ms	64ms	256ms	1s	4s	16s	gt	max	tag
99.991	0.009	nonzero	nonzero	0.000	0.000	0.000	0.000	0.000	0.000	0.009	pg182_o2nofp.cx10b_c8r32
99.991	0.009	nonzero	nonzero	0.000	0.000	0.000	0.000	0.000	0.000	0.010	pg182_o2nofp.cx10b_fpw0_c8r32
99.992	0.008	nonzero	nonzero	0.000	0.000	0.000	0.000	0.000	0.000	0.010	pg182_o2nofp.cx10b_wallz4_c8r32
99.990	0.010	nonzero	nonzero	0.000	0.000	0.000	0.000	0.000	0.000	0.011	pg182_o2nofp.cx10b_fpw0_wallz4_c8r32
Insert response time histogram
256us	1ms	4ms	16ms	64ms	256ms	1s	4s	16s	gt	max	tag
0.000	0.000	0.028	99.917	0.056	0.000	0.000	0.000	0.000	0.000	0.023	pg182_o2nofp.cx10b_c8r32
0.000	0.000	25.111	74.861	0.028	0.000	0.000	0.000	0.000	0.000	0.022	pg182_o2nofp.cx10b_fpw0_c8r32
0.000	0.000	0.000	99.972	0.028	0.000	0.000	0.000	0.000	0.000	0.024	pg182_o2nofp.cx10b_wallz4_c8r32
0.000	0.000	23.389	76.583	0.028	0.000	0.000	0.000	0.000	0.000	0.022	pg182_o2nofp.cx10b_fpw0_wallz4_c8r32
Delete response time histogram
256us	1ms	4ms	16ms	64ms	256ms	1s	4s	16s	gt	max	tag
0.000	58.500	41.500	0.000	0.000	0.000	0.000	0.000	0.000	0.000	0.003	pg182_o2nofp.cx10b_c8r32
0.000	58.000	42.000	0.000	0.000	0.000	0.000	0.000	0.000	0.000	0.003	pg182_o2nofp.cx10b_fpw0_c8r32
0.000	57.778	42.222	0.000	0.000	0.000	0.000	0.000	0.000	0.000	0.003	pg182_o2nofp.cx10b_wallz4_c8r32
0.000	58.417	41.583	0.000	0.000	0.000	0.000	0.000	0.000	0.000	0.003	pg182_o2nofp.cx10b_fpw0_wallz4_c8r32
qp100.L2
- qp100.L2: point queries with 100 insert/s per client
- Legend for results is here.
- Each entry lists the percentage of responses that fit in that bucket (slower than max time for previous bucket, faster than min time for next bucket).
Query response time histogram
256us	1ms	4ms	16ms	64ms	256ms	1s	4s	16s	gt	max	tag
nonzero	42.618	57.340	0.041	nonzero	0.000	0.000	0.000	0.000	0.000	0.019	pg182_o2nofp.cx10b_c8r32
0.002	95.015	4.969	0.013	0.000	0.000	0.000	0.000	0.000	0.000	0.013	pg182_o2nofp.cx10b_fpw0_c8r32
0.002	94.965	5.016	0.016	0.000	0.000	0.000	0.000	0.000	0.000	0.012	pg182_o2nofp.cx10b_wallz4_c8r32
0.002	94.871	5.111	0.015	0.000	0.000	0.000	0.000	0.000	0.000	0.016	pg182_o2nofp.cx10b_fpw0_wallz4_c8r32
Insert response time histogram
256us	1ms	4ms	16ms	64ms	256ms	1s	4s	16s	gt	max	tag
0.000	0.000	0.000	99.944	0.056	0.000	0.000	0.000	0.000	0.000	0.024	pg182_o2nofp.cx10b_c8r32
0.000	0.000	0.000	99.944	0.056	0.000	0.000	0.000	0.000	0.000	0.039	pg182_o2nofp.cx10b_fpw0_c8r32
0.000	0.000	0.000	99.972	0.028	0.000	0.000	0.000	0.000	0.000	0.017	pg182_o2nofp.cx10b_wallz4_c8r32
0.000	0.000	0.000	99.972	0.028	0.000	0.000	0.000	0.000	0.000	0.022	pg182_o2nofp.cx10b_fpw0_wallz4_c8r32
Delete response time histogram
256us	1ms	4ms	16ms	64ms	256ms	1s	4s	16s	gt	max	tag
0.000	5.583	94.389	0.028	0.000	0.000	0.000	0.000	0.000	0.000	0.008	pg182_o2nofp.cx10b_c8r32
0.000	6.889	93.083	0.028	0.000	0.000	0.000	0.000	0.000	0.000	0.007	pg182_o2nofp.cx10b_fpw0_c8r32
0.000	6.306	93.667	0.028	0.000	0.000	0.000	0.000	0.000	0.000	0.008	pg182_o2nofp.cx10b_wallz4_c8r32
0.000	6.444	93.528	0.028	0.000	0.000	0.000	0.000	0.000	0.000	0.007	pg182_o2nofp.cx10b_fpw0_wallz4_c8r32
qr500.L3
- qr500.L3: range queries with 500 insert/s per client
- Legend for results is here.
- Each entry lists the percentage of responses that fit in that bucket (slower than max time for previous bucket, faster than min time for next bucket).
Query response time histogram
256us	1ms	4ms	16ms	64ms	256ms	1s	4s	16s	gt	max	tag
99.985	0.015	nonzero	nonzero	nonzero	0.000	0.000	0.000	0.000	0.000	0.023	pg182_o2nofp.cx10b_c8r32
99.986	0.014	nonzero	nonzero	nonzero	0.000	0.000	0.000	0.000	0.000	0.025	pg182_o2nofp.cx10b_fpw0_c8r32
99.985	0.014	nonzero	nonzero	0.000	0.000	0.000	0.000	0.000	0.000	0.011	pg182_o2nofp.cx10b_wallz4_c8r32
99.985	0.015	nonzero	nonzero	nonzero	0.000	0.000	0.000	0.000	0.000	0.021	pg182_o2nofp.cx10b_fpw0_wallz4_c8r32
Insert response time histogram
256us	1ms	4ms	16ms	64ms	256ms	1s	4s	16s	gt	max	tag
0.000	0.000	0.000	99.889	0.111	0.000	0.000	0.000	0.000	0.000	0.019	pg182_o2nofp.cx10b_c8r32
0.000	0.000	0.000	100.000	0.000	0.000	0.000	0.000	0.000	0.000	0.015	pg182_o2nofp.cx10b_fpw0_c8r32
0.000	0.000	0.000	99.933	0.067	0.000	0.000	0.000	0.000	0.000	0.023	pg182_o2nofp.cx10b_wallz4_c8r32
0.000	0.000	0.000	100.000	0.000	0.000	0.000	0.000	0.000	0.000	0.015	pg182_o2nofp.cx10b_fpw0_wallz4_c8r32
Delete response time histogram
256us	1ms	4ms	16ms	64ms	256ms	1s	4s	16s	gt	max	tag
0.000	0.000	53.522	46.478	0.000	0.000	0.000	0.000	0.000	0.000	0.013	pg182_o2nofp.cx10b_c8r32
0.000	0.000	53.983	46.017	0.000	0.000	0.000	0.000	0.000	0.000	0.012	pg182_o2nofp.cx10b_fpw0_c8r32
0.000	0.000	52.650	47.350	0.000	0.000	0.000	0.000	0.000	0.000	0.012	pg182_o2nofp.cx10b_wallz4_c8r32
0.000	0.000	52.933	47.067	0.000	0.000	0.000	0.000	0.000	0.000	0.012	pg182_o2nofp.cx10b_fpw0_wallz4_c8r32
qp500.L4
- qp500.L4: point queries with 500 insert/s per client
- Legend for results is here.
- Each entry lists the percentage of responses that fit in that bucket (slower than max time for previous bucket, faster than min time for next bucket).
Query response time histogram
256us	1ms	4ms	16ms	64ms	256ms	1s	4s	16s	gt	max	tag
nonzero	33.346	66.541	0.112	nonzero	0.000	0.000	0.000	0.000	0.000	0.021	pg182_o2nofp.cx10b_c8r32
0.001	95.128	4.856	0.014	0.000	0.000	0.000	0.000	0.000	0.000	0.014	pg182_o2nofp.cx10b_fpw0_c8r32
0.002	94.418	5.558	0.023	0.000	0.000	0.000	0.000	0.000	0.000	0.013	pg182_o2nofp.cx10b_wallz4_c8r32
0.002	94.667	5.312	0.020	nonzero	0.000	0.000	0.000	0.000	0.000	0.020	pg182_o2nofp.cx10b_fpw0_wallz4_c8r32
Insert response time histogram
256us	1ms	4ms	16ms	64ms	256ms	1s	4s	16s	gt	max	tag
0.000	0.000	0.000	99.783	0.217	0.000	0.000	0.000	0.000	0.000	0.064	pg182_o2nofp.cx10b_c8r32
0.000	0.000	0.000	100.000	0.000	0.000	0.000	0.000	0.000	0.000	0.012	pg182_o2nofp.cx10b_fpw0_c8r32
0.000	0.000	0.000	99.978	0.022	0.000	0.000	0.000	0.000	0.000	0.020	pg182_o2nofp.cx10b_wallz4_c8r32
0.000	0.000	0.000	100.000	0.000	0.000	0.000	0.000	0.000	0.000	0.015	pg182_o2nofp.cx10b_fpw0_wallz4_c8r32
Delete response time histogram
256us	1ms	4ms	16ms	64ms	256ms	1s	4s	16s	gt	max	tag
0.000	0.000	0.000	99.911	0.089	0.000	0.000	0.000	0.000	0.000	0.036	pg182_o2nofp.cx10b_c8r32
0.000	0.000	0.000	99.922	0.078	0.000	0.000	0.000	0.000	0.000	0.035	pg182_o2nofp.cx10b_fpw0_c8r32
0.000	0.000	0.000	99.900	0.100	0.000	0.000	0.000	0.000	0.000	0.035	pg182_o2nofp.cx10b_wallz4_c8r32
0.000	0.000	0.000	99.939	0.061	0.000	0.000	0.000	0.000	0.000	0.036	pg182_o2nofp.cx10b_fpw0_wallz4_c8r32
qr1000.L5
- qr1000.L5: range queries with 1000 insert/s per client
- Legend for results is here.
- Each entry lists the percentage of responses that fit in that bucket (slower than max time for previous bucket, faster than min time for next bucket).
Query response time histogram
256us	1ms	4ms	16ms	64ms	256ms	1s	4s	16s	gt	max	tag
99.960	0.037	0.002	nonzero	nonzero	nonzero	0.000	0.000	0.000	0.000	0.084	pg182_o2nofp.cx10b_c8r32
99.966	0.032	0.002	nonzero	nonzero	nonzero	0.000	0.000	0.000	0.000	0.077	pg182_o2nofp.cx10b_fpw0_c8r32
99.961	0.036	0.002	nonzero	nonzero	nonzero	0.000	0.000	0.000	0.000	0.078	pg182_o2nofp.cx10b_wallz4_c8r32
99.960	0.038	0.002	nonzero	nonzero	nonzero	0.000	0.000	0.000	0.000	0.081	pg182_o2nofp.cx10b_fpw0_wallz4_c8r32
Insert response time histogram
256us	1ms	4ms	16ms	64ms	256ms	1s	4s	16s	gt	max	tag
0.000	0.000	0.017	99.958	0.025	0.000	0.000	0.000	0.000	0.000	0.020	pg182_o2nofp.cx10b_c8r32
0.000	0.000	1.533	98.464	0.003	0.000	0.000	0.000	0.000	0.000	0.016	pg182_o2nofp.cx10b_fpw0_c8r32
0.000	0.000	0.000	99.975	0.025	0.000	0.000	0.000	0.000	0.000	0.023	pg182_o2nofp.cx10b_wallz4_c8r32
0.000	0.000	1.328	98.669	0.003	0.000	0.000	0.000	0.000	0.000	0.018	pg182_o2nofp.cx10b_fpw0_wallz4_c8r32
Delete response time histogram
256us	1ms	4ms	16ms	64ms	256ms	1s	4s	16s	gt	max	tag
0.000	0.000	0.000	17.914	82.086	0.000	0.000	0.000	0.000	0.000	0.054	pg182_o2nofp.cx10b_c8r32
0.000	0.000	0.000	18.575	81.425	0.000	0.000	0.000	0.000	0.000	0.052	pg182_o2nofp.cx10b_fpw0_c8r32
0.000	0.000	0.000	18.292	81.708	0.000	0.000	0.000	0.000	0.000	0.053	pg182_o2nofp.cx10b_wallz4_c8r32
0.000	0.000	0.000	20.522	79.478	0.000	0.000	0.000	0.000	0.000	0.053	pg182_o2nofp.cx10b_fpw0_wallz4_c8r32
qp1000.L6
- qp1000.L6: point queries with 1000 insert/s per client
- Legend for results is here.
- Each entry lists the percentage of responses that fit in that bucket (slower than max time for previous bucket, faster than min time for next bucket).
Query response time histogram
256us	1ms	4ms	16ms	64ms	256ms	1s	4s	16s	gt	max	tag
nonzero	16.926	82.868	0.206	nonzero	0.000	0.000	0.000	0.000	0.000	0.016	pg182_o2nofp.cx10b_c8r32
0.001	90.385	9.599	0.015	0.000	0.000	0.000	0.000	0.000	0.000	0.013	pg182_o2nofp.cx10b_fpw0_c8r32
0.001	88.821	11.149	0.030	0.000	0.000	0.000	0.000	0.000	0.000	0.014	pg182_o2nofp.cx10b_wallz4_c8r32
0.001	85.801	14.124	0.074	nonzero	0.000	nonzero	0.000	0.000	0.000	0.379	pg182_o2nofp.cx10b_fpw0_wallz4_c8r32
Insert response time histogram
256us	1ms	4ms	16ms	64ms	256ms	1s	4s	16s	gt	max	tag
0.000	0.000	0.000	99.900	0.100	0.000	0.000	0.000	0.000	0.000	0.024	pg182_o2nofp.cx10b_c8r32
0.000	0.000	0.003	99.994	0.003	0.000	0.000	0.000	0.000	0.000	0.016	pg182_o2nofp.cx10b_fpw0_c8r32
0.000	0.000	0.000	99.972	0.028	0.000	0.000	0.000	0.000	0.000	0.024	pg182_o2nofp.cx10b_wallz4_c8r32
0.000	0.000	0.008	97.614	2.378	0.000	0.000	0.000	0.000	0.000	0.050	pg182_o2nofp.cx10b_fpw0_wallz4_c8r32
Delete response time histogram
256us	1ms	4ms	16ms	64ms	256ms	1s	4s	16s	gt	max	tag
0.000	0.000	0.000	0.000	99.997	0.003	0.000	0.000	0.000	0.000	0.085	pg182_o2nofp.cx10b_c8r32
0.000	0.000	0.000	0.000	99.997	0.003	0.000	0.000	0.000	0.000	0.084	pg182_o2nofp.cx10b_fpw0_c8r32
0.000	0.000	0.000	0.000	99.997	0.003	0.000	0.000	0.000	0.000	0.085	pg182_o2nofp.cx10b_wallz4_c8r32
0.000	0.000	0.000	0.000	99.997	0.003	0.000	0.000	0.000	0.000	0.084	pg182_o2nofp.cx10b_fpw0_wallz4_c8r32