Introduction
This is a report for the insert benchmark with 800M docs and 4 client(s). It is generated by scripts (bash, awk, sed) and Tufte might not be impressed. An overview of the insert benchmark is here and a short update is here. Below, by DBMS, I mean DBMS+version.config. An example is my8020.c10b40 where my means MySQL, 8020 is version 8.0.20 and c10b40 is the name for the configuration file.
The test server has 8 AMD cores, 32G RAM and an NVMe device for the database. The benchmark was run with 4 clients and there were 1 or 3 connections per client (1 for queries or inserts without rate limits, 1+1 for rate limited inserts+deletes). It uses 4 tables with a table per client. It loads 200M rows per table without secondary indexes, creates 3 secondary indexes per table, then inserts 4m+1m rows per table with a delete per insert to avoid growing the table. It then does 6 read+write tests for 1800s each that do queries as fast as possible with 100,100,500,500,1000,1000 inserts/s and the same for deletes/s per client concurrent with the queries. The database is IO-bound for most benchmark steps. Clients and the DBMS share one server.
The tested DBMS are:
- pg1222_o2nofp.cx10a_c8r32 - Postgres 12.22 with my standard config (x10a)
- pg1323_o2nofp.cx10a_c8r32 - Postgres 13.23 with my standard config (x10a)
- pg1422_o2nofp.cx10a_c8r32 - Postgres 14.22 with my standard config (x10a)
- pg1517_o2nofp.cx10a_c8r32 - Postgres 15.17 with my standard config (x10a)
- pg1613_o2nofp.cx10a_c8r32 - Postgres 16.13 with my standard config (x10a)
- pg179_o2nofp.cx10a_c8r32 - Postgres 17.9 with my standard config (x10a)
- pg183_o2nofp.cx10b_c8r32 - Postgres 18.3 with my standard config (x10b)
Contents
- Summary
- l.i0: load without secondary indexes
- l.x: create secondary indexes
- l.i1: continue load after secondary indexes created with 50 inserts per transaction
- l.i2: continue load after secondary indexes created with 5 inserts per transaction
- qr100.L1: range queries with 100 insert/s per client
- qp100.L2: point queries with 100 insert/s per client
- qr500.L3: range queries with 500 insert/s per client
- qp500.L4: point queries with 500 insert/s per client
- qr1000.L5: range queries with 1000 insert/s per client
- qp1000.L6: point queries with 1000 insert/s per client
Summary
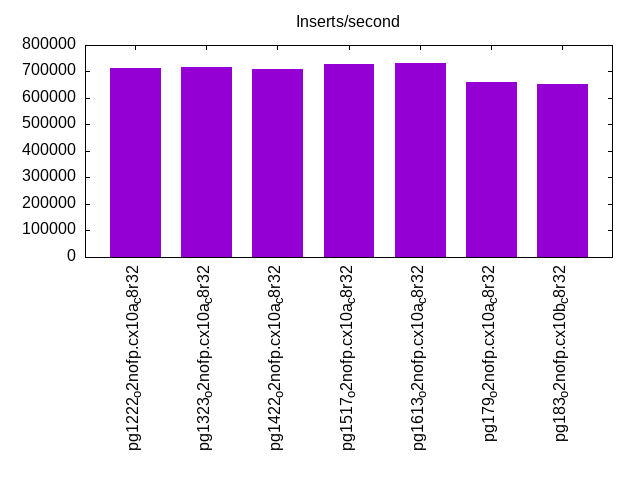
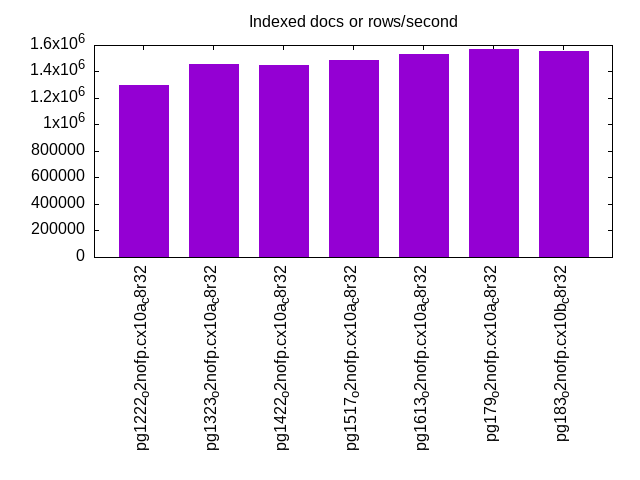
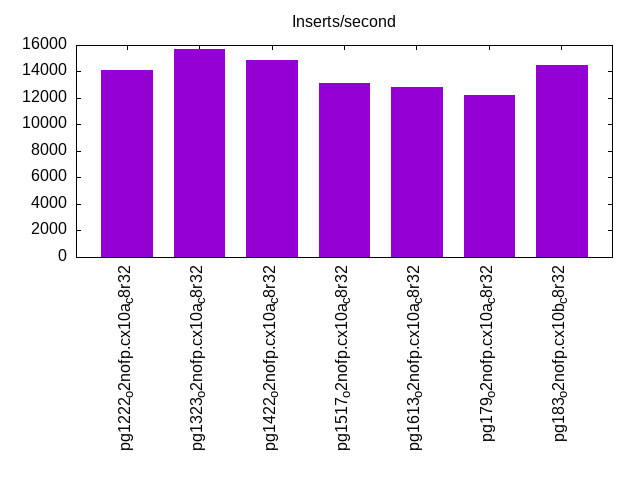
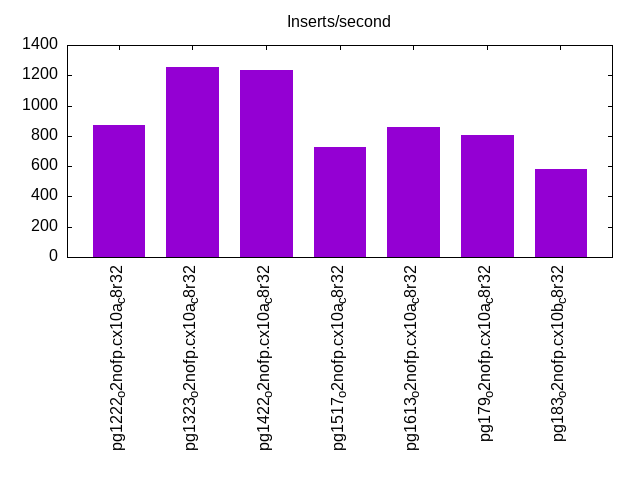
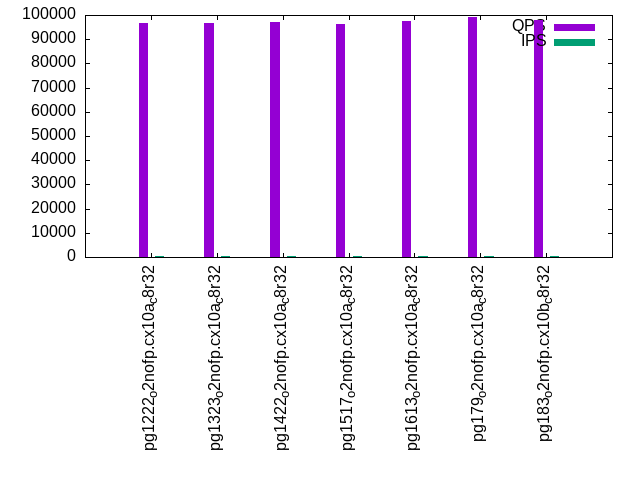
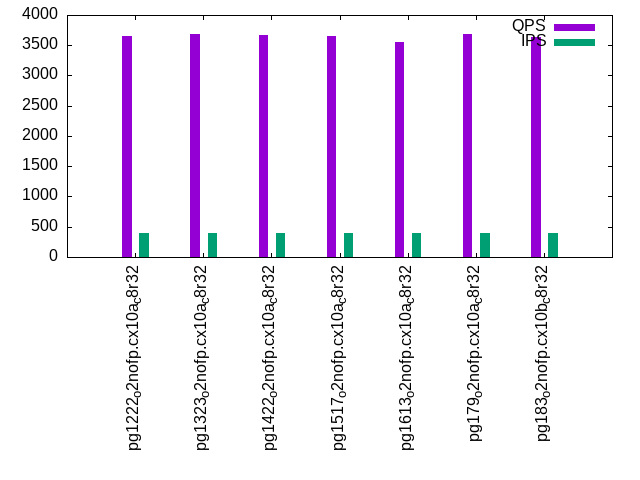
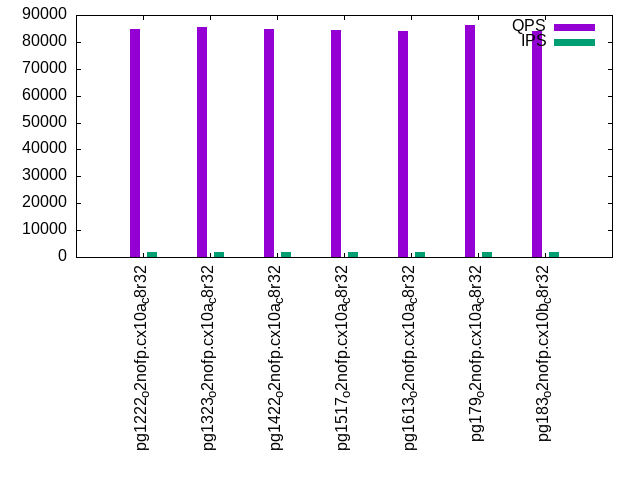
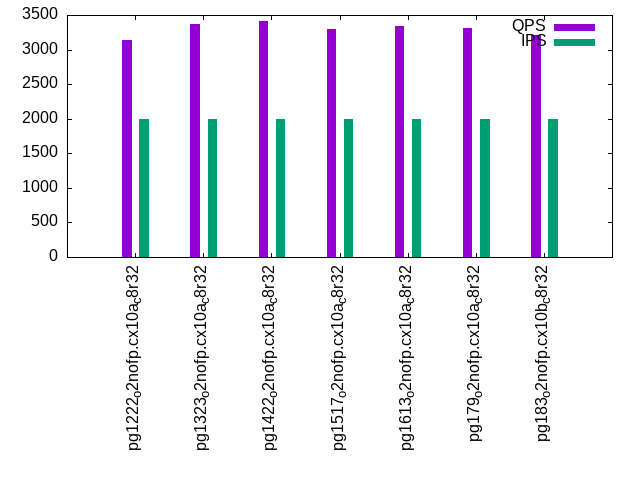
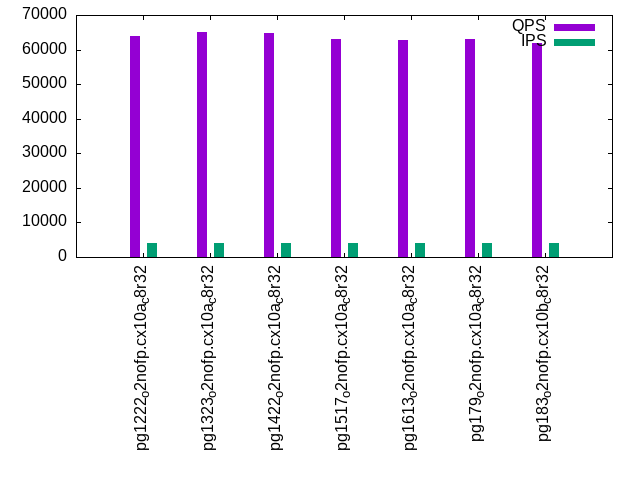
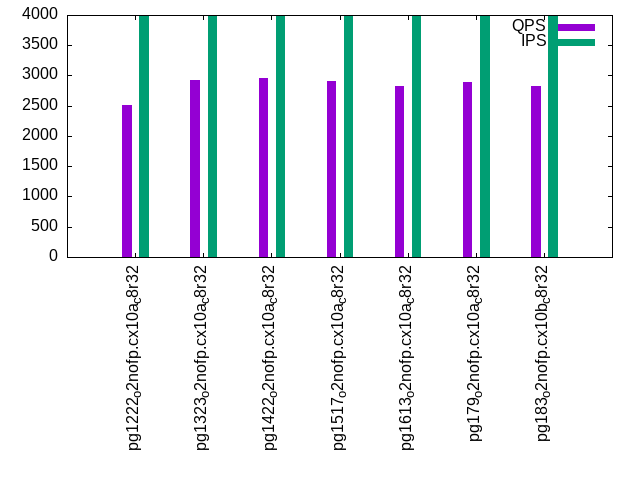
The numbers are inserts/s for l.i0, l.i1 and l.i2, indexed docs (or rows) /s for l.x and queries/s for qr100, qp100 thru qr1000, qp1000" The values are the average rate over the entire test for inserts (IPS) and queries (QPS). The range of values for IPS and QPS is split into 3 parts: bottom 25%, middle 50%, top 25%. Values in the bottom 25% have a red background, values in the top 25% have a green background and values in the middle have no color. A gray background is used for values that can be ignored because the DBMS did not sustain the target insert rate. Red backgrounds are not used when the minimum value is within 80% of the max value.
| dbms | l.i0 | l.x | l.i1 | l.i2 | qr100 | qp100 | qr500 | qp500 | qr1000 | qp1000 |
|---|---|---|---|---|---|---|---|---|---|---|
| pg1222_o2nofp.cx10a_c8r32 | 712378 | 1300813 | 14147 | 872 | 96865 | 3661 | 84738 | 3140 | 63998 | 2512 |
| pg1323_o2nofp.cx10a_c8r32 | 718778 | 1457195 | 15686 | 1254 | 96893 | 3686 | 85543 | 3371 | 64987 | 2922 |
| pg1422_o2nofp.cx10a_c8r32 | 709220 | 1451906 | 14884 | 1238 | 96906 | 3675 | 84923 | 3409 | 64790 | 2954 |
| pg1517_o2nofp.cx10a_c8r32 | 729262 | 1484230 | 13169 | 726 | 96420 | 3660 | 84561 | 3304 | 63115 | 2904 |
| pg1613_o2nofp.cx10a_c8r32 | 733272 | 1529637 | 12810 | 856 | 97333 | 3548 | 83939 | 3343 | 62755 | 2823 |
| pg179_o2nofp.cx10a_c8r32 | 661157 | 1568628 | 12204 | 803 | 99169 | 3693 | 86227 | 3314 | 63175 | 2894 |
| pg183_o2nofp.cx10b_c8r32 | 653595 | 1556420 | 14506 | 582 | 97740 | 3633 | 84106 | 3206 | 62009 | 2819 |
This table has relative throughput, throughput for the DBMS relative to the DBMS in the first line, using the absolute throughput from the previous table. Values less than 0.95 have a yellow background. Values greater than 1.05 have a blue background.
| dbms | l.i0 | l.x | l.i1 | l.i2 | qr100 | qp100 | qr500 | qp500 | qr1000 | qp1000 |
|---|---|---|---|---|---|---|---|---|---|---|
| pg1222_o2nofp.cx10a_c8r32 | 1.00 | 1.00 | 1.00 | 1.00 | 1.00 | 1.00 | 1.00 | 1.00 | 1.00 | 1.00 |
| pg1323_o2nofp.cx10a_c8r32 | 1.01 | 1.12 | 1.11 | 1.44 | 1.00 | 1.01 | 1.01 | 1.07 | 1.02 | 1.16 |
| pg1422_o2nofp.cx10a_c8r32 | 1.00 | 1.12 | 1.05 | 1.42 | 1.00 | 1.00 | 1.00 | 1.09 | 1.01 | 1.18 |
| pg1517_o2nofp.cx10a_c8r32 | 1.02 | 1.14 | 0.93 | 0.83 | 1.00 | 1.00 | 1.00 | 1.05 | 0.99 | 1.16 |
| pg1613_o2nofp.cx10a_c8r32 | 1.03 | 1.18 | 0.91 | 0.98 | 1.00 | 0.97 | 0.99 | 1.06 | 0.98 | 1.12 |
| pg179_o2nofp.cx10a_c8r32 | 0.93 | 1.21 | 0.86 | 0.92 | 1.02 | 1.01 | 1.02 | 1.06 | 0.99 | 1.15 |
| pg183_o2nofp.cx10b_c8r32 | 0.92 | 1.20 | 1.03 | 0.67 | 1.01 | 0.99 | 0.99 | 1.02 | 0.97 | 1.12 |
This lists the average rate of inserts/s for the tests that do inserts concurrent with queries. For such tests the query rate is listed in the table above. The read+write tests are setup so that the insert rate should match the target rate every second. Cells that are not at least 95% of the target have a red background to indicate a failure to satisfy the target.
| dbms | qr100.L1 | qp100.L2 | qr500.L3 | qp500.L4 | qr1000.L5 | qp1000.L6 |
|---|---|---|---|---|---|---|
| pg1222_o2nofp.cx10a_c8r32 | 399 | 399 | 1996 | 1996 | 3993 | 3991 |
| pg1323_o2nofp.cx10a_c8r32 | 399 | 399 | 1996 | 1997 | 3989 | 3991 |
| pg1422_o2nofp.cx10a_c8r32 | 399 | 399 | 1997 | 1996 | 3991 | 3993 |
| pg1517_o2nofp.cx10a_c8r32 | 399 | 399 | 1996 | 1996 | 3993 | 3993 |
| pg1613_o2nofp.cx10a_c8r32 | 399 | 398 | 1996 | 1997 | 3989 | 3991 |
| pg179_o2nofp.cx10a_c8r32 | 399 | 399 | 1997 | 1996 | 3989 | 3993 |
| pg183_o2nofp.cx10b_c8r32 | 399 | 399 | 1996 | 1997 | 3991 | 3991 |
| target | 400 | 400 | 2000 | 2000 | 4000 | 4000 |
l.i0
l.i0: load without secondary indexes. Graphs for performance per 1-second interval are here.
Average throughput:
Insert response time histogram: each cell has the percentage of responses that take <= the time in the header and max is the max response time in seconds. For the max column values in the top 25% of the range have a red background and in the bottom 25% of the range have a green background. The red background is not used when the min value is within 80% of the max value.
| dbms | 256us | 1ms | 4ms | 16ms | 64ms | 256ms | 1s | 4s | 16s | gt | max |
|---|---|---|---|---|---|---|---|---|---|---|---|
| pg1222_o2nofp.cx10a_c8r32 | 99.112 | 0.879 | 0.008 | 0.001 | nonzero | 0.075 | |||||
| pg1323_o2nofp.cx10a_c8r32 | 98.939 | 1.042 | 0.018 | 0.001 | nonzero | 0.081 | |||||
| pg1422_o2nofp.cx10a_c8r32 | 99.204 | 0.777 | 0.016 | 0.002 | nonzero | 0.081 | |||||
| pg1517_o2nofp.cx10a_c8r32 | 99.191 | 0.790 | 0.017 | 0.002 | nonzero | 0.077 | |||||
| pg1613_o2nofp.cx10a_c8r32 | 99.215 | 0.769 | 0.015 | 0.001 | nonzero | 0.079 | |||||
| pg179_o2nofp.cx10a_c8r32 | 96.971 | 2.953 | 0.073 | 0.003 | nonzero | 0.077 | |||||
| pg183_o2nofp.cx10b_c8r32 | 96.912 | 2.920 | 0.167 | 0.001 | nonzero | 0.135 |
Performance metrics for the DBMS listed above. Some are normalized by throughput, others are not. Legend for results is here.
ips	qps	rps	rmbps	wps	wmbps	rpq	rkbpq	wpi	wkbpi	csps	cpups	cspq	cpupq	dbgb1	dbgb2	rss	maxop	p50	p99	tag
712378	0	492	4.0	3344.8	299.8	0.001	0.006	0.005	0.431	55612	78.4	0.078	9	76.5	116.6	0.2	0.075	182005	166482	pg1222_o2nofp.cx10a_c8r32
718778	0	480	3.9	2803.7	298.3	0.001	0.006	0.004	0.425	55550	79.3	0.077	9	76.5	116.6	4.0	0.081	184153	146280	pg1323_o2nofp.cx10a_c8r32
709220	0	481	3.8	2760.5	293.9	0.001	0.005	0.004	0.424	54644	78.4	0.077	9	76.5	116.6	3.4	0.081	180179	149349	pg1422_o2nofp.cx10a_c8r32
729262	0	486	3.8	2832.4	303.6	0.001	0.005	0.004	0.426	54401	79.0	0.075	9	76.5	116.6	23.3	0.077	185349	147784	pg1517_o2nofp.cx10a_c8r32
733272	0	504	3.9	2829.2	302.3	0.001	0.006	0.004	0.422	54543	79.0	0.074	9	76.5	116.6	23.3	0.079	187070	160983	pg1613_o2nofp.cx10a_c8r32
661157	0	442	3.5	2560.5	273.9	0.001	0.005	0.004	0.424	56355	70.6	0.085	9	76.5	116.6	23.3	0.077	169277	140381	pg179_o2nofp.cx10a_c8r32
653595	0	427	3.4	2568.6	270.8	0.001	0.005	0.004	0.424	56352	70.3	0.086	9	76.5	116.6	23.2	0.135	169044	43695	pg183_o2nofp.cx10b_c8r32
Average values from iostat.
r/s	rkB/s	rrqm/s	%rrqm	r_await	rareq-s	w/s	wkB/s	wrqm/s	%wrqm	w_await	wareq-s	d/s	dkB/s	drqm/s	%drqm	d_await	dareq-s	f/s	f_await	aqu-sz	%util
494.0	4114.1	0.030	0.229	0.222	10.57	3357.2	308062	242.1	6.614	0.474	95.82	3.125	2647.6	0.000	0.000	1.053	107.5	145.0	1.628	1.819	39.04		pg1222_o2nofp.cx10a_c8r32
482.3	3980.3	0.121	0.786	0.325	5.508	2813.7	306528	224.5	7.190	0.505	109.4	3.490	1697.2	0.000	0.000	1.038	83.14	140.5	1.671	1.614	38.87		pg1323_o2nofp.cx10a_c8r32
483.1	3871.1	0.172	0.353	0.264	8.906	2770.3	301970	238.3	7.235	0.443	109.6	3.212	893.6	0.000	0.000	0.957	50.83	140.0	1.539	1.452	35.21		pg1422_o2nofp.cx10a_c8r32
488.1	3914.8	0.023	0.201	0.317	8.329	2842.9	312015	222.0	6.807	0.468	110.2	0.758	1214.0	0.000	0.000	0.820	102.6	143.4	1.599	1.554	36.84		pg1517_o2nofp.cx10a_c8r32
505.8	4061.2	0.003	0.001	0.299	9.801	2839.6	310717	227.8	6.886	0.468	109.9	0.935	979.6	0.000	0.000	0.974	78.13	143.7	1.623	1.569	37.11		pg1613_o2nofp.cx10a_c8r32
444.0	3647.0	0.160	0.746	0.496	12.92	2568.8	281401	191.7	7.175	0.847	109.7	0.518	4974.2	0.000	0.000	0.717	747.9	130.3	2.572	2.386	45.58		pg179_o2nofp.cx10a_c8r32
428.7	3510.3	0.336	2.377	0.307	5.120	2576.9	278143	186.5	6.370	0.486	109.0	0.452	1051.4	0.000	0.000	0.883	217.4	129.7	1.692	1.474	34.55		pg183_o2nofp.cx10b_c8r32
l.x
l.x: create secondary indexes.
Average throughput:
Performance metrics for the DBMS listed above. Some are normalized by throughput, others are not. Legend for results is here.
ips	qps	rps	rmbps	wps	wmbps	rpq	rkbpq	wpi	wkbpi	csps	cpups	cspq	cpupq	dbgb1	dbgb2	rss	maxop	p50	p99	tag
1300813	0	4955	420.6	6104.1	543.1	0.004	0.331	0.005	0.427	13945	43.9	0.011	3	153.8	193.8	19.4	0.004	NA	NA	pg1222_o2nofp.cx10a_c8r32
1457195	0	5151	463.2	3552.1	426.1	0.004	0.326	0.002	0.299	9761	45.9	0.007	3	153.7	193.7	23.2	0.004	NA	NA	pg1323_o2nofp.cx10a_c8r32
1451906	0	5111	460.5	3532.3	422.6	0.004	0.325	0.002	0.298	9999	45.7	0.007	3	153.7	193.7	23.3	0.004	NA	NA	pg1422_o2nofp.cx10a_c8r32
1484230	0	5501	516.8	3997.7	479.7	0.004	0.357	0.003	0.331	10848	46.0	0.007	2	153.7	193.7	1.6	0.002	NA	NA	pg1517_o2nofp.cx10a_c8r32
1529637	0	4706	440.8	3730.3	445.4	0.003	0.295	0.002	0.298	9992	46.0	0.007	2	153.7	193.7	23.3	0.002	NA	NA	pg1613_o2nofp.cx10a_c8r32
1568628	0	4770	454.7	3846.7	463.9	0.003	0.297	0.002	0.303	10245	46.1	0.007	2	153.7	193.7	22.4	0.002	NA	NA	pg179_o2nofp.cx10a_c8r32
1556420	0	4478	441.0	3771.0	453.2	0.003	0.290	0.002	0.298	9936	46.2	0.006	2	153.7	193.7	23.1	0.005	NA	NA	pg183_o2nofp.cx10b_c8r32
Average values from iostat.
r/s	rkB/s	rrqm/s	%rrqm	r_await	rareq-s	w/s	wkB/s	wrqm/s	%wrqm	w_await	wareq-s	d/s	dkB/s	drqm/s	%drqm	d_await	dareq-s	f/s	f_await	aqu-sz	%util
4975.8	431638	0.639	0.013	0.141	88.80	6124.8	559633	194.8	3.322	1.390	110.4	8.307	134991	0.000	0.000	1.008	1417.0	53.52	2.064	7.529	58.39		pg1222_o2nofp.cx10a_c8r32
5175.3	475823	0.041	0.001	0.134	88.68	3575.4	439206	141.3	3.003	0.406	123.5	5.683	104971	0.000	0.000	0.771	2867.1	38.57	1.701	2.313	48.66		pg1323_o2nofp.cx10a_c8r32
5134.9	472982	0.000	0.000	0.119	88.37	3560.5	436191	148.4	2.778	0.398	123.5	6.226	117394	0.000	0.000	0.823	1625.0	40.02	1.728	2.397	48.02		pg1422_o2nofp.cx10a_c8r32
5488.2	530676	0.411	0.013	0.121	92.53	4026.4	494766	143.5	2.577	0.402	123.5	3.734	87409.0	0.000	0.000	0.516	1744.1	40.53	1.933	2.580	49.16		pg1517_o2nofp.cx10a_c8r32
4724.3	452311	0.680	0.022	0.128	88.82	3755.8	459172	142.2	2.724	0.425	123.1	4.051	105247	0.000	0.000	0.528	2204.6	40.79	1.926	2.444	46.76		pg1613_o2nofp.cx10a_c8r32
4787.6	466728	0.044	0.001	0.128	90.88	3878.2	478930	135.0	2.929	0.442	123.7	5.697	136670	0.000	0.000	0.503	1778.7	39.97	1.838	2.560	49.97		pg179_o2nofp.cx10a_c8r32
4495.6	452641	0.000	0.000	0.139	93.20	3799.0	467528	126.3	2.557	0.494	123.7	3.842	93577.6	0.000	0.000	0.479	1138.9	40.51	1.975	2.826	49.12		pg183_o2nofp.cx10b_c8r32
l.i1
l.i1: continue load after secondary indexes created with 50 inserts per transaction. Graphs for performance per 1-second interval are here.
Average throughput:
Insert response time histogram: each cell has the percentage of responses that take <= the time in the header and max is the max response time in seconds. For the max column values in the top 25% of the range have a red background and in the bottom 25% of the range have a green background. The red background is not used when the min value is within 80% of the max value.
| dbms | 256us | 1ms | 4ms | 16ms | 64ms | 256ms | 1s | 4s | 16s | gt | max |
|---|---|---|---|---|---|---|---|---|---|---|---|
| pg1222_o2nofp.cx10a_c8r32 | 0.005 | 74.536 | 25.458 | 0.001 | 0.082 | ||||||
| pg1323_o2nofp.cx10a_c8r32 | 1.452 | 90.656 | 7.890 | 0.002 | 0.077 | ||||||
| pg1422_o2nofp.cx10a_c8r32 | 3.034 | 90.138 | 6.825 | 0.003 | 0.086 | ||||||
| pg1517_o2nofp.cx10a_c8r32 | 0.393 | 91.034 | 8.569 | 0.004 | 0.081 | ||||||
| pg1613_o2nofp.cx10a_c8r32 | 1.038 | 91.955 | 7.006 | 0.001 | 0.081 | ||||||
| pg179_o2nofp.cx10a_c8r32 | 2.340 | 89.968 | 7.692 | 0.001 | 0.066 | ||||||
| pg183_o2nofp.cx10b_c8r32 | 0.667 | 86.353 | 12.974 | 0.005 | 0.077 |
Delete response time histogram: each cell has the percentage of responses that take <= the time in the header and max is the max response time in seconds. For the max column values in the top 25% of the range have a red background and in the bottom 25% of the range have a green background. The red background is not used when the min value is within 80% of the max value.
| dbms | 256us | 1ms | 4ms | 16ms | 64ms | 256ms | 1s | 4s | 16s | gt | max |
|---|---|---|---|---|---|---|---|---|---|---|---|
| pg1222_o2nofp.cx10a_c8r32 | 0.002 | 2.716 | 11.277 | 85.818 | 0.188 | 0.033 | |||||
| pg1323_o2nofp.cx10a_c8r32 | 0.002 | 2.574 | 10.704 | 82.759 | 3.961 | 0.030 | |||||
| pg1422_o2nofp.cx10a_c8r32 | 0.001 | 2.573 | 10.871 | 76.458 | 10.097 | 0.031 | |||||
| pg1517_o2nofp.cx10a_c8r32 | 0.002 | 2.493 | 10.417 | 70.303 | 16.785 | 0.033 | |||||
| pg1613_o2nofp.cx10a_c8r32 | 0.002 | 2.578 | 10.275 | 74.561 | 12.584 | 0.037 | |||||
| pg179_o2nofp.cx10a_c8r32 | 0.002 | 2.427 | 9.534 | 70.906 | 17.131 | 0.034 | |||||
| pg183_o2nofp.cx10b_c8r32 | 0.002 | 2.420 | 9.877 | 80.480 | 7.222 | 0.037 |
Performance metrics for the DBMS listed above. Some are normalized by throughput, others are not. Legend for results is here.
ips	qps	rps	rmbps	wps	wmbps	rpq	rkbpq	wpi	wkbpi	csps	cpups	cspq	cpupq	dbgb1	dbgb2	rss	maxop	p50	p99	tag
14147	0	16023	128.4	18303.1	315.9	1.133	9.297	1.294	22.864	38085	47.7	2.692	270	156.4	196.4	23.4	0.082	3649	2200	pg1222_o2nofp.cx10a_c8r32
15686	0	18284	152.1	19389.7	345.3	1.166	9.930	1.236	22.542	41751	55.7	2.662	284	156.3	196.3	23.4	0.077	4300	2399	pg1323_o2nofp.cx10a_c8r32
14884	0	17122	137.8	18926.6	329.5	1.150	9.483	1.272	22.669	39303	55.0	2.641	296	156.3	196.3	23.3	0.086	3650	2000	pg1422_o2nofp.cx10a_c8r32
13169	0	15287	121.8	16944.8	294.0	1.161	9.469	1.287	22.862	35272	52.9	2.678	321	156.3	196.3	23.3	0.081	2400	1850	pg1517_o2nofp.cx10a_c8r32
12810	0	14820	118.1	16267.5	283.1	1.157	9.442	1.270	22.629	33842	50.1	2.642	313	156.3	196.3	23.3	0.081	4049	2550	pg1613_o2nofp.cx10a_c8r32
12204	0	13994	111.5	15532.9	270.4	1.147	9.356	1.273	22.686	31734	48.6	2.600	319	156.3	196.3	23.3	0.066	3550	2600	pg179_o2nofp.cx10a_c8r32
14506	0	17037	136.3	18885.4	327.8	1.174	9.623	1.302	23.141	38458	55.6	2.651	307	156.3	196.3	23.3	0.077	3750	1649	pg183_o2nofp.cx10b_c8r32
Average values from iostat.
r/s	rkB/s	rrqm/s	%rrqm	r_await	rareq-s	w/s	wkB/s	wrqm/s	%wrqm	w_await	wareq-s	d/s	dkB/s	drqm/s	%drqm	d_await	dareq-s	f/s	f_await	aqu-sz	%util
16026.9	131569	0.000	0.000	0.210	8.222	18380.2	324515	277.9	1.977	1.064	24.06	2.339	4394.8	0.000	0.000	1.540	345.0	146.8	3.470	23.42	98.25		pg1222_o2nofp.cx10a_c8r32
18265.5	155661	0.000	0.000	0.122	8.627	19478.8	354700	351.6	2.142	0.567	22.44	2.312	4143.6	0.000	0.000	1.113	371.8	163.0	2.334	13.36	86.27		pg1323_o2nofp.cx10a_c8r32
17073.8	140761	0.002	0.000	0.113	8.270	19008.0	338187	269.2	1.698	0.522	21.15	2.236	2262.0	0.000	0.000	1.018	269.8	160.3	2.228	11.95	84.03		pg1422_o2nofp.cx10a_c8r32
15235.9	124283	0.002	0.000	0.122	8.142	17008.8	301604	298.3	2.030	0.565	20.23	0.218	2815.6	0.000	0.000	0.141	421.6	137.3	2.615	11.97	79.95		pg1517_o2nofp.cx10a_c8r32
14753.4	120425	0.000	0.000	0.107	8.148	16325.9	290242	278.9	1.721	0.484	20.63	0.167	2022.4	0.000	0.000	0.125	413.7	132.5	2.488	10.56	73.75		pg1613_o2nofp.cx10a_c8r32
13929.0	113666	0.002	0.000	0.112	8.147	15584.2	276976	230.3	1.707	0.517	20.34	0.169	2285.8	0.000	0.000	0.068	422.6	125.2	2.650	10.61	73.64		pg179_o2nofp.cx10a_c8r32
16988.2	139203	0.000	0.000	0.146	8.204	18964.8	336434	219.3	1.522	0.720	21.48	0.245	3337.7	0.000	0.000	0.065	424.9	151.5	2.732	16.15	89.07		pg183_o2nofp.cx10b_c8r32
l.i2
l.i2: continue load after secondary indexes created with 5 inserts per transaction. Graphs for performance per 1-second interval are here.
Average throughput:
Insert response time histogram: each cell has the percentage of responses that take <= the time in the header and max is the max response time in seconds. For the max column values in the top 25% of the range have a red background and in the bottom 25% of the range have a green background. The red background is not used when the min value is within 80% of the max value.
| dbms | 256us | 1ms | 4ms | 16ms | 64ms | 256ms | 1s | 4s | 16s | gt | max |
|---|---|---|---|---|---|---|---|---|---|---|---|
| pg1222_o2nofp.cx10a_c8r32 | 0.001 | 60.941 | 37.156 | 1.900 | 0.002 | 0.022 | |||||
| pg1323_o2nofp.cx10a_c8r32 | 0.002 | 64.933 | 33.816 | 1.248 | 0.002 | 0.023 | |||||
| pg1422_o2nofp.cx10a_c8r32 | 0.001 | 54.775 | 43.900 | 1.323 | 0.002 | 0.020 | |||||
| pg1517_o2nofp.cx10a_c8r32 | 36.309 | 62.342 | 1.348 | 0.001 | 0.022 | ||||||
| pg1613_o2nofp.cx10a_c8r32 | 0.049 | 38.636 | 57.776 | 3.488 | 0.052 | 0.043 | |||||
| pg179_o2nofp.cx10a_c8r32 | 0.001 | 42.850 | 56.171 | 0.978 | 0.001 | 0.022 | |||||
| pg183_o2nofp.cx10b_c8r32 | 31.583 | 67.636 | 0.780 | 0.001 | 0.024 |
Delete response time histogram: each cell has the percentage of responses that take <= the time in the header and max is the max response time in seconds. For the max column values in the top 25% of the range have a red background and in the bottom 25% of the range have a green background. The red background is not used when the min value is within 80% of the max value.
| dbms | 256us | 1ms | 4ms | 16ms | 64ms | 256ms | 1s | 4s | 16s | gt | max |
|---|---|---|---|---|---|---|---|---|---|---|---|
| pg1222_o2nofp.cx10a_c8r32 | 63.155 | 36.845 | 0.001 | 0.075 | |||||||
| pg1323_o2nofp.cx10a_c8r32 | 54.549 | 45.451 | 0.001 | 0.075 | |||||||
| pg1422_o2nofp.cx10a_c8r32 | 49.758 | 50.241 | 0.001 | 0.076 | |||||||
| pg1517_o2nofp.cx10a_c8r32 | 23.806 | 76.194 | 0.001 | 0.087 | |||||||
| pg1613_o2nofp.cx10a_c8r32 | 0.805 | 6.863 | 8.617 | 12.178 | 71.536 | 0.001 | 0.089 | ||||
| pg179_o2nofp.cx10a_c8r32 | 0.052 | 99.948 | 0.001 | 0.072 | |||||||
| pg183_o2nofp.cx10b_c8r32 | 3.096 | 96.904 | 0.001 | 0.091 |
Performance metrics for the DBMS listed above. Some are normalized by throughput, others are not. Legend for results is here.
ips	qps	rps	rmbps	wps	wmbps	rpq	rkbpq	wpi	wkbpi	csps	cpups	cspq	cpupq	dbgb1	dbgb2	rss	maxop	p50	p99	tag
872	0	963	8.2	1498.5	22.0	1.104	9.617	1.718	25.780	6544	39.0	7.503	3577	157.0	197.1	23.4	0.022	180	155	pg1222_o2nofp.cx10a_c8r32
1254	0	1370	11.0	2000.5	30.3	1.092	8.971	1.595	24.718	9314	51.4	7.426	3278	157.0	197.0	23.4	0.023	310	280	pg1323_o2nofp.cx10a_c8r32
1238	0	1359	10.8	1978.3	29.7	1.097	8.903	1.598	24.599	8640	51.4	6.978	3321	157.0	197.0	23.3	0.020	310	280	pg1422_o2nofp.cx10a_c8r32
726	0	788	6.3	1209.5	18.4	1.085	8.914	1.667	26.013	5029	39.8	6.928	4387	157.0	197.0	23.3	0.022	165	150	pg1517_o2nofp.cx10a_c8r32
856	0	1117	18.2	1697.2	28.0	1.305	21.733	1.983	33.540	6072	38.3	7.094	3580	156.9	197.0	19.8	0.043	295	270	pg1613_o2nofp.cx10a_c8r32
803	0	892	7.1	1328.8	19.8	1.110	9.050	1.654	25.234	4997	41.5	6.221	4133	157.0	197.0	23.3	0.022	155	125	pg179_o2nofp.cx10a_c8r32
582	0	624	4.9	951.8	14.8	1.072	8.705	1.635	26.080	3622	43.8	6.223	6020	157.0	197.0	23.3	0.024	145	135	pg183_o2nofp.cx10b_c8r32
Average values from iostat.
r/s	rkB/s	rrqm/s	%rrqm	r_await	rareq-s	w/s	wkB/s	wrqm/s	%wrqm	w_await	wareq-s	d/s	dkB/s	drqm/s	%drqm	d_await	dareq-s	f/s	f_await	aqu-sz	%util
963.1	8386.9	0.000	0.000	0.106	8.637	1485.1	22369.9	20.22	1.963	0.147	15.91	2.038	186.6	0.000	0.000	0.620	14.83	13.45	3.130	0.338	12.68		pg1222_o2nofp.cx10a_c8r32
1370.3	11255.0	0.077	0.005	0.087	8.201	2001.1	31013.3	25.82	1.167	0.144	15.56	2.037	294.8	0.000	0.000	0.626	20.60	17.17	3.083	0.461	16.76		pg1323_o2nofp.cx10a_c8r32
1359.3	11028.2	0.000	0.000	0.088	8.113	1979.4	30476.3	21.85	1.034	0.139	15.47	2.029	199.3	0.000	0.000	0.607	19.31	16.82	3.049	0.449	16.81		pg1422_o2nofp.cx10a_c8r32
787.7	6470.3	0.000	0.000	0.093	8.233	1209.9	18885.8	19.36	1.463	0.114	15.64	0.027	105.1	0.000	0.000	0.008	11.24	11.06	3.107	0.246	11.33		pg1517_o2nofp.cx10a_c8r32
1117.1	18612.2	0.001	0.000	0.109	10.60	1697.7	28713.5	21.14	1.316	0.191	16.12	0.036	117.1	0.000	0.000	0.016	10.19	23.51	3.138	0.843	17.37		pg1613_o2nofp.cx10a_c8r32
891.5	7269.1	0.000	0.000	0.086	8.145	1328.9	20269.8	16.52	1.400	0.130	15.27	0.002	0.197	0.000	0.000	0.005	0.339	12.08	3.152	0.286	12.12		pg179_o2nofp.cx10a_c8r32
623.8	5066.4	0.000	0.000	0.085	8.120	951.7	15181.3	10.88	1.199	0.117	17.11	0.007	62.21	0.000	0.000	0.004	9.959	8.801	3.176	0.188	9.225		pg183_o2nofp.cx10b_c8r32
qr100.L1
qr100.L1: range queries with 100 insert/s per client. Graphs for performance per 1-second interval are here.
Average throughput:
Query response time histogram: each cell has the percentage of responses that take <= the time in the header and max is the max response time in seconds. For max values in the top 25% of the range have a red background and in the bottom 25% of the range have a green background. The red background is not used when the min value is within 80% of the max value.
| dbms | 256us | 1ms | 4ms | 16ms | 64ms | 256ms | 1s | 4s | 16s | gt | max |
|---|---|---|---|---|---|---|---|---|---|---|---|
| pg1222_o2nofp.cx10a_c8r32 | 99.991 | 0.008 | nonzero | nonzero | 0.006 | ||||||
| pg1323_o2nofp.cx10a_c8r32 | 99.990 | 0.010 | nonzero | 0.004 | |||||||
| pg1422_o2nofp.cx10a_c8r32 | 99.989 | 0.011 | nonzero | nonzero | 0.010 | ||||||
| pg1517_o2nofp.cx10a_c8r32 | 99.989 | 0.011 | nonzero | nonzero | nonzero | nonzero | 0.454 | ||||
| pg1613_o2nofp.cx10a_c8r32 | 99.988 | 0.012 | nonzero | nonzero | 0.009 | ||||||
| pg179_o2nofp.cx10a_c8r32 | 99.984 | 0.014 | 0.001 | nonzero | 0.010 | ||||||
| pg183_o2nofp.cx10b_c8r32 | 99.989 | 0.011 | nonzero | nonzero | 0.010 |
Insert response time histogram: each cell has the percentage of responses that take <= the time in the header and max is the max response time in seconds. For max values in the top 25% of the range have a red background and in the bottom 25% of the range have a green background. The red background is not used when the min value is within 80% of the max value.
| dbms | 256us | 1ms | 4ms | 16ms | 64ms | 256ms | 1s | 4s | 16s | gt | max |
|---|---|---|---|---|---|---|---|---|---|---|---|
| pg1222_o2nofp.cx10a_c8r32 | 98.514 | 1.486 | 0.049 | ||||||||
| pg1323_o2nofp.cx10a_c8r32 | 99.875 | 0.125 | 0.023 | ||||||||
| pg1422_o2nofp.cx10a_c8r32 | 99.569 | 0.431 | 0.029 | ||||||||
| pg1517_o2nofp.cx10a_c8r32 | 99.396 | 0.604 | 0.035 | ||||||||
| pg1613_o2nofp.cx10a_c8r32 | 0.007 | 99.083 | 0.910 | 0.026 | |||||||
| pg179_o2nofp.cx10a_c8r32 | 98.743 | 1.257 | 0.041 | ||||||||
| pg183_o2nofp.cx10b_c8r32 | 99.340 | 0.660 | 0.031 |
Delete response time histogram: each cell has the percentage of responses that take <= the time in the header and max is the max response time in seconds. For max values in the top 25% of the range have a red background and in the bottom 25% of the range have a green background. The red background is not used when the min value is within 80% of the max value.
| dbms | 256us | 1ms | 4ms | 16ms | 64ms | 256ms | 1s | 4s | 16s | gt | max |
|---|---|---|---|---|---|---|---|---|---|---|---|
| pg1222_o2nofp.cx10a_c8r32 | 0.021 | 72.451 | 27.271 | 0.257 | 0.007 | ||||||
| pg1323_o2nofp.cx10a_c8r32 | 0.007 | 67.521 | 32.444 | 0.028 | 0.005 | ||||||
| pg1422_o2nofp.cx10a_c8r32 | 0.090 | 74.222 | 25.674 | 0.014 | 0.005 | ||||||
| pg1517_o2nofp.cx10a_c8r32 | 0.028 | 71.368 | 28.549 | 0.049 | 0.007 | 0.020 | |||||
| pg1613_o2nofp.cx10a_c8r32 | 0.076 | 73.833 | 26.062 | 0.028 | 0.005 | ||||||
| pg179_o2nofp.cx10a_c8r32 | 0.090 | 67.833 | 32.062 | 0.014 | 0.005 | ||||||
| pg183_o2nofp.cx10b_c8r32 | 0.007 | 66.042 | 33.951 | 0.004 |
Performance metrics for the DBMS listed above. Some are normalized by throughput, others are not. Legend for results is here.
ips	qps	rps	rmbps	wps	wmbps	rpq	rkbpq	wpi	wkbpi	csps	cpups	cspq	cpupq	dbgb1	dbgb2	rss	maxop	p50	p99	tag
399	96865	467	3.8	113.0	5.9	0.005	0.041	0.283	15.151	370484	42.7	3.825	35	157.1	197.1	23.4	0.006	24222	23836	pg1222_o2nofp.cx10a_c8r32
399	96893	463	3.7	236.3	7.2	0.005	0.039	0.592	18.536	370739	42.1	3.826	35	157.0	197.1	23.4	0.004	24653	23949	pg1323_o2nofp.cx10a_c8r32
399	96906	468	3.8	243.6	7.3	0.005	0.040	0.610	18.646	370414	41.5	3.822	34	157.0	197.0	23.3	0.010	24222	23805	pg1422_o2nofp.cx10a_c8r32
399	96420	465	3.7	239.7	7.2	0.005	0.040	0.600	18.565	368480	42.1	3.822	35	157.0	197.0	23.3	0.454	24237	21997	pg1517_o2nofp.cx10a_c8r32
399	97333	461	3.7	242.8	7.3	0.005	0.039	0.608	18.623	372292	41.7	3.825	34	156.9	197.0	23.3	0.009	24237	23853	pg1613_o2nofp.cx10a_c8r32
399	99169	485	3.9	264.2	7.5	0.005	0.040	0.662	19.198	379026	41.8	3.822	34	157.0	197.1	23.3	0.010	24925	24430	pg179_o2nofp.cx10a_c8r32
399	97740	457	3.7	256.7	7.4	0.005	0.038	0.643	19.000	373524	41.6	3.822	34	157.0	197.0	23.3	0.010	24509	22941	pg183_o2nofp.cx10b_c8r32
Average values from iostat.
r/s	rkB/s	rrqm/s	%rrqm	r_await	rareq-s	w/s	wkB/s	wrqm/s	%wrqm	w_await	wareq-s	d/s	dkB/s	drqm/s	%drqm	d_await	dareq-s	f/s	f_await	aqu-sz	%util
455.1	3833.3	0.000	0.000	0.128	8.417	113.1	6050.3	10.31	8.911	0.426	57.93	2.000	9.994	0.000	0.000	0.711	4.997	6.741	2.200	0.119	3.766		pg1222_o2nofp.cx10a_c8r32
451.5	3689.3	0.000	0.000	0.095	8.171	236.9	7405.7	10.98	7.936	0.294	52.51	2.000	9.994	0.000	0.000	0.725	4.997	6.622	1.782	0.095	3.938		pg1323_o2nofp.cx10a_c8r32
455.5	3720.9	0.000	0.000	0.114	8.169	244.1	7453.4	8.837	6.391	0.306	51.60	1.999	10.39	0.000	0.000	0.809	5.197	7.170	1.719	0.106	3.554		pg1422_o2nofp.cx10a_c8r32
453.7	3737.8	0.000	0.000	0.105	8.238	240.3	7421.2	8.869	6.430	0.311	52.78	0.001	0.002	0.000	0.000	0.003	0.011	7.084	1.867	0.101	3.784		pg1517_o2nofp.cx10a_c8r32
448.8	3666.0	0.000	0.000	0.105	8.168	243.3	7440.3	7.226	5.386	0.345	52.70	0.001	0.002	0.000	0.000	0.000	0.011	6.935	1.983	0.104	4.063		pg1613_o2nofp.cx10a_c8r32
475.0	3893.4	0.000	0.000	0.100	8.196	264.8	7674.6	8.307	5.762	0.321	50.88	0.001	0.002	0.000	0.000	0.003	0.011	6.170	1.933	0.104	3.820		pg179_o2nofp.cx10a_c8r32
445.0	3663.5	0.000	0.000	0.104	8.232	257.3	7595.5	5.555	4.160	0.324	52.35	0.001	9.130	0.000	0.000	0.003	45.65	5.989	2.008	0.100	3.591		pg183_o2nofp.cx10b_c8r32
qp100.L2
qp100.L2: point queries with 100 insert/s per client. Graphs for performance per 1-second interval are here.
Average throughput:
Query response time histogram: each cell has the percentage of responses that take <= the time in the header and max is the max response time in seconds. For max values in the top 25% of the range have a red background and in the bottom 25% of the range have a green background. The red background is not used when the min value is within 80% of the max value.
| dbms | 256us | 1ms | 4ms | 16ms | 64ms | 256ms | 1s | 4s | 16s | gt | max |
|---|---|---|---|---|---|---|---|---|---|---|---|
| pg1222_o2nofp.cx10a_c8r32 | nonzero | 36.633 | 63.250 | 0.117 | nonzero | 0.019 | |||||
| pg1323_o2nofp.cx10a_c8r32 | nonzero | 37.506 | 62.402 | 0.092 | nonzero | 0.025 | |||||
| pg1422_o2nofp.cx10a_c8r32 | nonzero | 38.590 | 61.274 | 0.134 | 0.001 | nonzero | 0.244 | ||||
| pg1517_o2nofp.cx10a_c8r32 | nonzero | 36.299 | 63.625 | 0.075 | nonzero | 0.024 | |||||
| pg1613_o2nofp.cx10a_c8r32 | nonzero | 34.896 | 64.867 | 0.191 | 0.046 | nonzero | nonzero | 0.851 | |||
| pg179_o2nofp.cx10a_c8r32 | nonzero | 37.891 | 62.029 | 0.080 | nonzero | 0.026 | |||||
| pg183_o2nofp.cx10b_c8r32 | nonzero | 36.222 | 63.655 | 0.122 | nonzero | nonzero | nonzero | 0.448 |
Insert response time histogram: each cell has the percentage of responses that take <= the time in the header and max is the max response time in seconds. For max values in the top 25% of the range have a red background and in the bottom 25% of the range have a green background. The red background is not used when the min value is within 80% of the max value.
| dbms | 256us | 1ms | 4ms | 16ms | 64ms | 256ms | 1s | 4s | 16s | gt | max |
|---|---|---|---|---|---|---|---|---|---|---|---|
| pg1222_o2nofp.cx10a_c8r32 | 97.097 | 2.903 | 0.029 | ||||||||
| pg1323_o2nofp.cx10a_c8r32 | 96.833 | 3.167 | 0.031 | ||||||||
| pg1422_o2nofp.cx10a_c8r32 | 96.521 | 3.444 | 0.035 | 0.203 | |||||||
| pg1517_o2nofp.cx10a_c8r32 | 98.153 | 1.847 | 0.028 | ||||||||
| pg1613_o2nofp.cx10a_c8r32 | 96.708 | 1.812 | 1.458 | 0.021 | 0.684 | ||||||
| pg179_o2nofp.cx10a_c8r32 | 97.069 | 2.903 | 0.028 | 0.087 | |||||||
| pg183_o2nofp.cx10b_c8r32 | 95.292 | 4.708 | 0.039 |
Delete response time histogram: each cell has the percentage of responses that take <= the time in the header and max is the max response time in seconds. For max values in the top 25% of the range have a red background and in the bottom 25% of the range have a green background. The red background is not used when the min value is within 80% of the max value.
| dbms | 256us | 1ms | 4ms | 16ms | 64ms | 256ms | 1s | 4s | 16s | gt | max |
|---|---|---|---|---|---|---|---|---|---|---|---|
| pg1222_o2nofp.cx10a_c8r32 | 11.514 | 86.528 | 1.958 | 0.009 | |||||||
| pg1323_o2nofp.cx10a_c8r32 | 5.278 | 93.236 | 1.486 | 0.010 | |||||||
| pg1422_o2nofp.cx10a_c8r32 | 7.590 | 91.910 | 0.444 | 0.056 | 0.054 | ||||||
| pg1517_o2nofp.cx10a_c8r32 | 3.382 | 95.083 | 1.535 | 0.014 | |||||||
| pg1613_o2nofp.cx10a_c8r32 | 7.118 | 91.993 | 0.819 | 0.035 | 0.021 | 0.014 | 0.668 | ||||
| pg179_o2nofp.cx10a_c8r32 | 4.576 | 94.104 | 1.319 | 0.015 | |||||||
| pg183_o2nofp.cx10b_c8r32 | 7.194 | 92.132 | 0.646 | 0.028 | 0.321 |
Performance metrics for the DBMS listed above. Some are normalized by throughput, others are not. Legend for results is here.
ips	qps	rps	rmbps	wps	wmbps	rpq	rkbpq	wpi	wkbpi	csps	cpups	cspq	cpupq	dbgb1	dbgb2	rss	maxop	p50	p99	tag
399	3661	45055	354.9	1537.2	17.0	12.308	99.285	3.850	43.683	100371	11.1	27.419	243	157.2	197.2	23.4	0.019	944	576	pg1222_o2nofp.cx10a_c8r32
399	3686	45504	355.8	1403.4	16.0	12.347	98.868	3.515	41.090	101407	10.9	27.515	237	157.1	197.1	23.4	0.025	928	592	pg1323_o2nofp.cx10a_c8r32
399	3675	45096	352.8	1396.7	15.9	12.271	98.302	3.500	40.923	101166	11.0	27.528	239	157.0	197.1	23.3	0.244	944	528	pg1422_o2nofp.cx10a_c8r32
399	3660	45062	352.4	1394.9	16.0	12.314	98.595	3.493	40.906	100263	11.8	27.398	258	157.1	196.5	23.3	0.024	928	592	pg1517_o2nofp.cx10a_c8r32
398	3548	43829	342.8	1387.1	15.9	12.351	98.935	3.482	40.752	98076	11.5	27.639	259	156.9	196.8	23.3	0.851	912	80	pg1613_o2nofp.cx10a_c8r32
399	3693	45368	354.8	1373.5	15.8	12.284	98.372	3.441	40.484	100926	10.9	27.328	236	157.1	197.1	23.3	0.026	928	624	pg179_o2nofp.cx10a_c8r32
399	3633	44709	349.7	1377.6	15.8	12.306	98.565	3.452	40.509	99975	11.8	27.518	260	157.0	197.1	23.3	0.448	944	560	pg183_o2nofp.cx10b_c8r32
Average values from iostat.
r/s	rkB/s	rrqm/s	%rrqm	r_await	rareq-s	w/s	wkB/s	wrqm/s	%wrqm	w_await	wareq-s	d/s	dkB/s	drqm/s	%drqm	d_await	dareq-s	f/s	f_await	aqu-sz	%util
45098.1	363800	0.000	0.000	0.070	8.066	1521.0	17315.0	13.66	1.392	0.053	13.31	2.000	10.10	0.000	0.000	0.532	4.938	7.112	1.917	3.110	99.66		pg1222_o2nofp.cx10a_c8r32
45547.3	364723	0.000	0.000	0.070	8.010	1390.9	16310.9	14.07	1.432	0.051	13.40	2.001	10.01	0.000	0.000	0.587	5.002	7.407	1.701	3.109	99.68		pg1323_o2nofp.cx10a_c8r32
45137.5	361597	0.213	0.001	0.070	8.011	1384.4	16238.2	12.70	1.306	0.045	13.43	2.001	10.41	0.000	0.000	0.596	5.203	7.647	1.645	3.066	99.27		pg1422_o2nofp.cx10a_c8r32
45105.1	361150	0.000	0.000	0.070	8.008	1383.2	16244.3	12.71	1.297	0.047	13.40	0.025	365.1	0.000	0.000	0.004	42.46	7.325	1.714	3.063	99.62		pg1517_o2nofp.cx10a_c8r32
43866.6	351375	0.117	0.000	0.070	8.012	1374.3	16137.7	11.31	1.185	0.049	13.58	0.006	81.94	0.000	0.000	0.004	45.62	7.478	1.676	2.995	97.88		pg1613_o2nofp.cx10a_c8r32
45409.6	363642	0.000	0.000	0.070	8.010	1361.3	16064.2	11.42	1.164	0.048	13.43	0.001	0.002	0.000	0.000	0.003	0.011	7.525	1.780	3.102	99.67		pg179_o2nofp.cx10a_c8r32
44748.1	358403	0.277	0.001	0.070	8.010	1365.9	16077.5	8.214	0.838	0.053	13.42	0.001	0.002	0.000	0.000	0.003	0.011	7.685	1.829	3.054	99.36		pg183_o2nofp.cx10b_c8r32
qr500.L3
qr500.L3: range queries with 500 insert/s per client. Graphs for performance per 1-second interval are here.
Average throughput:
Query response time histogram: each cell has the percentage of responses that take <= the time in the header and max is the max response time in seconds. For max values in the top 25% of the range have a red background and in the bottom 25% of the range have a green background. The red background is not used when the min value is within 80% of the max value.
| dbms | 256us | 1ms | 4ms | 16ms | 64ms | 256ms | 1s | 4s | 16s | gt | max |
|---|---|---|---|---|---|---|---|---|---|---|---|
| pg1222_o2nofp.cx10a_c8r32 | 99.956 | 0.041 | 0.003 | nonzero | nonzero | 0.040 | |||||
| pg1323_o2nofp.cx10a_c8r32 | 99.958 | 0.039 | 0.002 | nonzero | nonzero | 0.037 | |||||
| pg1422_o2nofp.cx10a_c8r32 | 99.963 | 0.036 | 0.002 | nonzero | nonzero | 0.026 | |||||
| pg1517_o2nofp.cx10a_c8r32 | 99.954 | 0.043 | 0.003 | nonzero | nonzero | 0.032 | |||||
| pg1613_o2nofp.cx10a_c8r32 | 99.959 | 0.039 | 0.001 | nonzero | nonzero | 0.033 | |||||
| pg179_o2nofp.cx10a_c8r32 | 99.960 | 0.038 | 0.002 | nonzero | nonzero | 0.034 | |||||
| pg183_o2nofp.cx10b_c8r32 | 99.960 | 0.037 | 0.002 | nonzero | nonzero | 0.031 |
Insert response time histogram: each cell has the percentage of responses that take <= the time in the header and max is the max response time in seconds. For max values in the top 25% of the range have a red background and in the bottom 25% of the range have a green background. The red background is not used when the min value is within 80% of the max value.
| dbms | 256us | 1ms | 4ms | 16ms | 64ms | 256ms | 1s | 4s | 16s | gt | max |
|---|---|---|---|---|---|---|---|---|---|---|---|
| pg1222_o2nofp.cx10a_c8r32 | 0.004 | 87.969 | 12.025 | 0.001 | 0.065 | ||||||
| pg1323_o2nofp.cx10a_c8r32 | 0.003 | 97.540 | 2.457 | 0.038 | |||||||
| pg1422_o2nofp.cx10a_c8r32 | 0.010 | 99.204 | 0.786 | 0.028 | |||||||
| pg1517_o2nofp.cx10a_c8r32 | 0.001 | 96.825 | 3.172 | 0.001 | 0.065 | ||||||
| pg1613_o2nofp.cx10a_c8r32 | 0.004 | 99.231 | 0.765 | 0.041 | |||||||
| pg179_o2nofp.cx10a_c8r32 | 0.003 | 97.340 | 2.657 | 0.040 | |||||||
| pg183_o2nofp.cx10b_c8r32 | 0.003 | 98.521 | 1.476 | 0.042 |
Delete response time histogram: each cell has the percentage of responses that take <= the time in the header and max is the max response time in seconds. For max values in the top 25% of the range have a red background and in the bottom 25% of the range have a green background. The red background is not used when the min value is within 80% of the max value.
| dbms | 256us | 1ms | 4ms | 16ms | 64ms | 256ms | 1s | 4s | 16s | gt | max |
|---|---|---|---|---|---|---|---|---|---|---|---|
| pg1222_o2nofp.cx10a_c8r32 | 31.910 | 68.061 | 0.029 | 0.035 | |||||||
| pg1323_o2nofp.cx10a_c8r32 | 25.906 | 74.047 | 0.047 | 0.038 | |||||||
| pg1422_o2nofp.cx10a_c8r32 | 34.462 | 65.535 | 0.003 | 0.026 | |||||||
| pg1517_o2nofp.cx10a_c8r32 | 23.582 | 76.353 | 0.065 | 0.037 | |||||||
| pg1613_o2nofp.cx10a_c8r32 | 28.814 | 71.183 | 0.003 | 0.019 | |||||||
| pg179_o2nofp.cx10a_c8r32 | 23.562 | 76.340 | 0.097 | 0.038 | |||||||
| pg183_o2nofp.cx10b_c8r32 | 29.811 | 70.174 | 0.015 | 0.022 |
Performance metrics for the DBMS listed above. Some are normalized by throughput, others are not. Legend for results is here.
ips	qps	rps	rmbps	wps	wmbps	rpq	rkbpq	wpi	wkbpi	csps	cpups	cspq	cpupq	dbgb1	dbgb2	rss	maxop	p50	p99	tag
1996	84738	2639	21.9	2432.8	40.9	0.031	0.265	1.219	20.993	323455	48.9	3.817	46	157.5	197.5	23.4	0.040	21390	18702	pg1222_o2nofp.cx10a_c8r32
1996	85543	2609	20.9	2415.3	41.2	0.030	0.250	1.210	21.142	325119	48.5	3.801	45	157.4	197.4	23.4	0.037	21500	19806	pg1323_o2nofp.cx10a_c8r32
1997	84923	2631	21.1	2406.2	40.4	0.031	0.255	1.205	20.718	324376	48.2	3.820	45	157.2	197.3	18.7	0.026	21182	19902	pg1422_o2nofp.cx10a_c8r32
1996	84561	2623	21.5	2417.7	41.7	0.031	0.260	1.212	21.393	320868	48.7	3.794	46	157.3	197.3	23.3	0.032	21261	19806	pg1517_o2nofp.cx10a_c8r32
1996	83939	2633	21.2	2409.2	41.3	0.031	0.259	1.207	21.171	321375	48.7	3.829	46	157.0	197.1	19.5	0.033	20878	19630	pg1613_o2nofp.cx10a_c8r32
1997	86227	2634	21.2	2402.4	40.7	0.031	0.252	1.203	20.871	327089	48.8	3.793	45	157.4	197.4	23.3	0.034	21598	19566	pg179_o2nofp.cx10a_c8r32
1996	84106	2632	21.1	2396.2	39.9	0.031	0.257	1.201	20.478	320774	48.7	3.814	46	157.2	197.3	20.1	0.031	21102	19822	pg183_o2nofp.cx10b_c8r32
Average values from iostat.
r/s	rkB/s	rrqm/s	%rrqm	r_await	rareq-s	w/s	wkB/s	wrqm/s	%wrqm	w_await	wareq-s	d/s	dkB/s	drqm/s	%drqm	d_await	dareq-s	f/s	f_await	aqu-sz	%util
2609.9	22091.1	0.071	0.003	0.093	8.444	2437.6	41929.3	15.42	1.131	0.209	28.81	2.000	10.01	0.000	0.000	0.657	5.005	21.97	1.849	0.728	15.01		pg1222_o2nofp.cx10a_c8r32
2580.1	21085.3	0.000	0.000	0.087	8.182	2420.0	42231.6	23.89	1.424	0.191	28.92	2.067	968.6	0.000	0.000	0.854	47.76	23.35	1.660	0.685	15.20		pg1323_o2nofp.cx10a_c8r32
2602.4	21277.3	0.010	0.000	0.079	8.184	2410.9	41403.7	17.95	1.163	0.163	28.58	2.025	302.7	0.000	0.000	0.697	34.42	23.71	1.586	0.577	16.60		pg1422_o2nofp.cx10a_c8r32
2594.4	21632.7	0.000	0.000	0.088	8.368	2422.4	42734.9	24.43	1.393	0.197	29.06	0.085	1177.6	0.000	0.000	0.011	94.82	23.29	1.681	0.701	15.31		pg1517_o2nofp.cx10a_c8r32
2604.7	21402.1	0.079	0.003	0.077	8.225	2414.1	42289.8	20.68	1.153	0.140	29.19	0.086	1195.9	0.000	0.000	0.006	63.01	23.50	1.666	0.524	17.60		pg1613_o2nofp.cx10a_c8r32
2605.4	21376.9	0.050	0.002	0.088	8.216	2407.1	41711.7	20.25	1.260	0.193	28.79	0.054	757.8	0.000	0.000	0.005	40.00	23.13	1.720	0.690	15.87		pg179_o2nofp.cx10a_c8r32
2603.3	21287.3	0.007	0.000	0.080	8.184	2400.9	40904.0	13.56	0.859	0.166	28.45	0.002	0.172	0.000	0.000	0.006	0.501	23.15	1.753	0.593	17.20		pg183_o2nofp.cx10b_c8r32
qp500.L4
qp500.L4: point queries with 500 insert/s per client. Graphs for performance per 1-second interval are here.
Average throughput:
Query response time histogram: each cell has the percentage of responses that take <= the time in the header and max is the max response time in seconds. For max values in the top 25% of the range have a red background and in the bottom 25% of the range have a green background. The red background is not used when the min value is within 80% of the max value.
| dbms | 256us | 1ms | 4ms | 16ms | 64ms | 256ms | 1s | 4s | 16s | gt | max |
|---|---|---|---|---|---|---|---|---|---|---|---|
| pg1222_o2nofp.cx10a_c8r32 | nonzero | 25.075 | 73.197 | 1.725 | 0.003 | nonzero | nonzero | 0.931 | |||
| pg1323_o2nofp.cx10a_c8r32 | nonzero | 28.385 | 71.057 | 0.557 | 0.001 | 0.026 | |||||
| pg1422_o2nofp.cx10a_c8r32 | nonzero | 30.086 | 69.445 | 0.469 | 0.001 | 0.035 | |||||
| pg1517_o2nofp.cx10a_c8r32 | nonzero | 26.985 | 72.385 | 0.629 | 0.001 | nonzero | nonzero | 0.941 | |||
| pg1613_o2nofp.cx10a_c8r32 | nonzero | 27.900 | 71.498 | 0.602 | nonzero | 0.023 | |||||
| pg179_o2nofp.cx10a_c8r32 | nonzero | 25.406 | 74.030 | 0.563 | 0.001 | 0.026 | |||||
| pg183_o2nofp.cx10b_c8r32 | nonzero | 25.665 | 73.429 | 0.844 | 0.062 | nonzero | nonzero | 0.428 |
Insert response time histogram: each cell has the percentage of responses that take <= the time in the header and max is the max response time in seconds. For max values in the top 25% of the range have a red background and in the bottom 25% of the range have a green background. The red background is not used when the min value is within 80% of the max value.
| dbms | 256us | 1ms | 4ms | 16ms | 64ms | 256ms | 1s | 4s | 16s | gt | max |
|---|---|---|---|---|---|---|---|---|---|---|---|
| pg1222_o2nofp.cx10a_c8r32 | 86.119 | 13.878 | 0.001 | 0.001 | 0.264 | ||||||
| pg1323_o2nofp.cx10a_c8r32 | 93.958 | 6.042 | 0.050 | ||||||||
| pg1422_o2nofp.cx10a_c8r32 | 95.410 | 4.585 | 0.006 | 0.104 | |||||||
| pg1517_o2nofp.cx10a_c8r32 | 91.588 | 8.400 | 0.007 | 0.006 | 0.312 | ||||||
| pg1613_o2nofp.cx10a_c8r32 | 92.031 | 7.969 | 0.050 | ||||||||
| pg179_o2nofp.cx10a_c8r32 | 96.422 | 3.578 | 0.060 | ||||||||
| pg183_o2nofp.cx10b_c8r32 | 88.997 | 9.881 | 1.122 | 0.201 |
Delete response time histogram: each cell has the percentage of responses that take <= the time in the header and max is the max response time in seconds. For max values in the top 25% of the range have a red background and in the bottom 25% of the range have a green background. The red background is not used when the min value is within 80% of the max value.
| dbms | 256us | 1ms | 4ms | 16ms | 64ms | 256ms | 1s | 4s | 16s | gt | max |
|---|---|---|---|---|---|---|---|---|---|---|---|
| pg1222_o2nofp.cx10a_c8r32 | 99.567 | 0.428 | 0.001 | 0.004 | 0.432 | ||||||
| pg1323_o2nofp.cx10a_c8r32 | 98.228 | 1.772 | 0.038 | ||||||||
| pg1422_o2nofp.cx10a_c8r32 | 98.758 | 1.242 | 0.039 | ||||||||
| pg1517_o2nofp.cx10a_c8r32 | 97.737 | 2.246 | 0.010 | 0.007 | 0.486 | ||||||
| pg1613_o2nofp.cx10a_c8r32 | 87.876 | 12.124 | 0.039 | ||||||||
| pg179_o2nofp.cx10a_c8r32 | 80.017 | 19.983 | 0.037 | ||||||||
| pg183_o2nofp.cx10b_c8r32 | 95.725 | 4.271 | 0.004 | 0.090 |
Performance metrics for the DBMS listed above. Some are normalized by throughput, others are not. Legend for results is here.
ips	qps	rps	rmbps	wps	wmbps	rpq	rkbpq	wpi	wkbpi	csps	cpups	cspq	cpupq	dbgb1	dbgb2	rss	maxop	p50	p99	tag
1996	3140	43295	340.9	5081.2	61.7	13.786	111.162	2.546	31.663	97481	19.2	31.040	489	157.8	197.8	15.7	0.931	816	304	pg1222_o2nofp.cx10a_c8r32
1997	3371	46184	361.7	5124.6	62.1	13.702	109.877	2.567	31.857	100293	19.4	29.755	460	157.7	197.8	23.4	0.026	864	528	pg1323_o2nofp.cx10a_c8r32
1996	3409	46303	362.9	5124.4	62.0	13.582	108.995	2.568	31.840	100599	19.4	29.509	455	157.4	197.5	22.6	0.035	880	544	pg1422_o2nofp.cx10a_c8r32
1996	3304	45235	358.4	5114.4	62.0	13.691	111.082	2.563	31.812	98493	20.7	29.809	501	157.6	197.6	19.2	0.941	848	448	pg1517_o2nofp.cx10a_c8r32
1997	3343	45461	356.5	5114.6	61.9	13.598	109.184	2.562	31.759	98094	20.9	29.340	500	157.1	197.2	22.3	0.023	848	528	pg1613_o2nofp.cx10a_c8r32
1996	3314	45526	356.5	5109.2	62.0	13.737	110.155	2.560	31.817	99163	21.0	29.923	507	157.7	197.8	23.3	0.026	848	416	pg179_o2nofp.cx10a_c8r32
1997	3206	44023	345.0	5098.2	61.8	13.733	110.189	2.553	31.719	95876	20.8	29.908	519	157.4	197.5	23.1	0.428	848	64	pg183_o2nofp.cx10b_c8r32
Average values from iostat.
r/s	rkB/s	rrqm/s	%rrqm	r_await	rareq-s	w/s	wkB/s	wrqm/s	%wrqm	w_await	wareq-s	d/s	dkB/s	drqm/s	%drqm	d_await	dareq-s	f/s	f_await	aqu-sz	%util
43334.8	349425	0.251	0.001	0.076	8.061	5056.2	63006.6	34.54	0.586	0.133	13.10	2.017	10.17	0.000	0.000	0.651	5.045	25.35	2.756	3.971	98.92		pg1222_o2nofp.cx10a_c8r32
46229.9	370716	0.000	0.000	0.071	8.020	5097.8	63430.3	24.34	0.572	0.074	12.92	2.019	19.37	0.000	0.000	0.528	8.867	24.25	1.687	3.645	99.64		pg1323_o2nofp.cx10a_c8r32
46349.7	371947	0.000	0.000	0.071	8.025	5097.3	63359.8	23.78	0.558	0.067	12.90	2.009	19.61	0.000	0.000	0.518	8.622	24.86	1.628	3.599	99.65		pg1422_o2nofp.cx10a_c8r32
45278.8	367387	0.182	0.000	0.071	8.113	5088.2	63310.6	24.85	0.586	0.090	12.95	0.015	9.235	0.000	0.000	0.063	15.48	25.09	1.709	3.648	99.27		pg1517_o2nofp.cx10a_c8r32
45505.0	365392	0.000	0.000	0.071	8.031	5088.6	63241.0	23.77	0.577	0.083	12.90	0.005	18.39	0.000	0.000	0.009	26.84	24.85	1.700	3.633	99.60		pg1613_o2nofp.cx10a_c8r32
45571.4	365421	0.000	0.000	0.071	8.020	5082.5	63268.4	23.37	0.580	0.071	12.90	0.017	9.308	0.000	0.000	0.065	23.32	24.96	1.742	3.587	99.62		pg179_o2nofp.cx10a_c8r32
44062.1	353550	0.249	0.001	0.071	8.024	5072.1	63161.0	19.14	0.475	0.079	13.23	0.011	0.167	0.000	0.000	0.046	0.691	25.08	1.763	3.514	97.78		pg183_o2nofp.cx10b_c8r32
qr1000.L5
qr1000.L5: range queries with 1000 insert/s per client. Graphs for performance per 1-second interval are here.
Average throughput:
Query response time histogram: each cell has the percentage of responses that take <= the time in the header and max is the max response time in seconds. For max values in the top 25% of the range have a red background and in the bottom 25% of the range have a green background. The red background is not used when the min value is within 80% of the max value.
| dbms | 256us | 1ms | 4ms | 16ms | 64ms | 256ms | 1s | 4s | 16s | gt | max |
|---|---|---|---|---|---|---|---|---|---|---|---|
| pg1222_o2nofp.cx10a_c8r32 | 99.826 | 0.161 | 0.012 | 0.001 | nonzero | nonzero | 0.226 | ||||
| pg1323_o2nofp.cx10a_c8r32 | 99.723 | 0.252 | 0.023 | 0.002 | nonzero | nonzero | nonzero | 0.369 | |||
| pg1422_o2nofp.cx10a_c8r32 | 99.770 | 0.213 | 0.016 | 0.001 | nonzero | nonzero | 0.193 | ||||
| pg1517_o2nofp.cx10a_c8r32 | 99.778 | 0.210 | 0.012 | nonzero | nonzero | nonzero | 0.187 | ||||
| pg1613_o2nofp.cx10a_c8r32 | 99.746 | 0.238 | 0.015 | 0.001 | nonzero | nonzero | 0.171 | ||||
| pg179_o2nofp.cx10a_c8r32 | 99.762 | 0.219 | 0.018 | 0.001 | nonzero | nonzero | 0.196 | ||||
| pg183_o2nofp.cx10b_c8r32 | 99.781 | 0.204 | 0.014 | 0.001 | nonzero | nonzero | 0.185 |
Insert response time histogram: each cell has the percentage of responses that take <= the time in the header and max is the max response time in seconds. For max values in the top 25% of the range have a red background and in the bottom 25% of the range have a green background. The red background is not used when the min value is within 80% of the max value.
| dbms | 256us | 1ms | 4ms | 16ms | 64ms | 256ms | 1s | 4s | 16s | gt | max |
|---|---|---|---|---|---|---|---|---|---|---|---|
| pg1222_o2nofp.cx10a_c8r32 | 90.694 | 9.301 | 0.004 | 0.086 | |||||||
| pg1323_o2nofp.cx10a_c8r32 | 0.056 | 92.467 | 7.476 | 0.057 | |||||||
| pg1422_o2nofp.cx10a_c8r32 | 0.076 | 94.138 | 5.785 | 0.058 | |||||||
| pg1517_o2nofp.cx10a_c8r32 | 0.031 | 96.049 | 3.921 | 0.052 | |||||||
| pg1613_o2nofp.cx10a_c8r32 | 0.028 | 92.968 | 7.003 | 0.001 | 0.064 | ||||||
| pg179_o2nofp.cx10a_c8r32 | 0.013 | 91.523 | 8.464 | 0.055 | |||||||
| pg183_o2nofp.cx10b_c8r32 | 0.098 | 95.185 | 4.714 | 0.003 | 0.080 |
Delete response time histogram: each cell has the percentage of responses that take <= the time in the header and max is the max response time in seconds. For max values in the top 25% of the range have a red background and in the bottom 25% of the range have a green background. The red background is not used when the min value is within 80% of the max value.
| dbms | 256us | 1ms | 4ms | 16ms | 64ms | 256ms | 1s | 4s | 16s | gt | max |
|---|---|---|---|---|---|---|---|---|---|---|---|
| pg1222_o2nofp.cx10a_c8r32 | 97.406 | 2.594 | 0.061 | ||||||||
| pg1323_o2nofp.cx10a_c8r32 | 83.319 | 16.681 | 0.056 | ||||||||
| pg1422_o2nofp.cx10a_c8r32 | 91.874 | 8.126 | 0.056 | ||||||||
| pg1517_o2nofp.cx10a_c8r32 | 96.224 | 3.776 | 0.055 | ||||||||
| pg1613_o2nofp.cx10a_c8r32 | 90.708 | 9.292 | 0.058 | ||||||||
| pg179_o2nofp.cx10a_c8r32 | 80.895 | 19.105 | 0.057 | ||||||||
| pg183_o2nofp.cx10b_c8r32 | 92.310 | 7.690 | 0.001 | 0.081 |
Performance metrics for the DBMS listed above. Some are normalized by throughput, others are not. Legend for results is here.
ips	qps	rps	rmbps	wps	wmbps	rpq	rkbpq	wpi	wkbpi	csps	cpups	cspq	cpupq	dbgb1	dbgb2	rss	maxop	p50	p99	tag
3993	63998	4884	39.3	5876.3	90.9	0.076	0.628	1.472	23.306	230504	62.1	3.602	78	158.4	198.5	23.2	0.226	16126	14232	pg1222_o2nofp.cx10a_c8r32
3989	64987	4883	40.6	5859.1	90.8	0.075	0.640	1.469	23.303	233087	61.9	3.587	76	158.4	198.4	23.4	0.369	16494	14238	pg1323_o2nofp.cx10a_c8r32
3991	64790	4888	39.3	5859.5	90.7	0.075	0.621	1.468	23.278	232035	62.0	3.581	77	158.1	198.1	23.3	0.193	16174	14254	pg1422_o2nofp.cx10a_c8r32
3993	63115	4884	39.4	5860.3	90.7	0.077	0.639	1.468	23.257	226385	62.4	3.587	79	158.2	198.2	23.2	0.187	15966	14126	pg1517_o2nofp.cx10a_c8r32
3989	62755	4914	40.1	5861.3	90.7	0.078	0.654	1.469	23.275	224653	62.9	3.580	80	157.6	197.7	23.2	0.171	15694	13630	pg1613_o2nofp.cx10a_c8r32
3989	63175	4864	39.6	5858.7	90.7	0.077	0.641	1.469	23.288	223703	63.5	3.541	80	158.4	198.4	23.3	0.196	15742	13775	pg179_o2nofp.cx10a_c8r32
3991	62009	4880	39.2	5853.7	90.6	0.079	0.648	1.467	23.258	221139	63.3	3.566	82	158.1	198.1	23.0	0.185	15742	13871	pg183_o2nofp.cx10b_c8r32
Average values from iostat.
r/s	rkB/s	rrqm/s	%rrqm	r_await	rareq-s	w/s	wkB/s	wrqm/s	%wrqm	w_await	wareq-s	d/s	dkB/s	drqm/s	%drqm	d_await	dareq-s	f/s	f_await	aqu-sz	%util
4851.5	39586.6	0.004	0.000	0.094	8.161	5885.5	93143.1	45.45	0.859	0.239	17.00	2.007	19.50	0.000	0.000	0.799	8.651	46.18	1.901	1.831	33.07		pg1222_o2nofp.cx10a_c8r32
4853.7	40992.0	0.000	0.000	0.082	8.464	5867.7	93027.5	42.74	0.677	0.197	16.99	2.006	37.74	0.000	0.000	0.665	15.45	42.82	1.657	1.613	25.84		pg1323_o2nofp.cx10a_c8r32
4853.6	39598.3	0.000	0.000	0.077	8.162	5869.5	92989.1	36.70	0.585	0.186	16.97	2.010	38.16	0.000	0.000	0.709	15.60	43.50	1.611	1.528	26.94		pg1422_o2nofp.cx10a_c8r32
4848.9	39645.7	0.000	0.000	0.075	8.179	5869.6	92950.1	40.69	0.632	0.181	16.97	0.006	9.502	0.000	0.000	0.008	16.19	43.70	1.696	1.479	28.67		pg1517_o2nofp.cx10a_c8r32
4878.9	40350.1	0.000	0.000	0.077	8.279	5869.6	92911.3	40.10	0.625	0.184	16.99	0.008	9.504	0.000	0.000	0.024	16.07	43.59	1.667	1.525	27.66		pg1613_o2nofp.cx10a_c8r32
4829.5	39861.9	0.000	0.000	0.084	8.263	5868.9	92979.3	39.19	0.614	0.189	17.18	0.006	18.62	0.000	0.000	0.024	23.96	43.21	1.724	1.576	28.56		pg179_o2nofp.cx10a_c8r32
4845.0	39514.1	0.000	0.000	0.074	8.157	5863.9	92909.0	28.93	0.467	0.191	17.12	0.007	27.74	0.000	0.000	0.025	53.99	43.70	1.738	1.545	28.78		pg183_o2nofp.cx10b_c8r32
qp1000.L6
qp1000.L6: point queries with 1000 insert/s per client. Graphs for performance per 1-second interval are here.
Average throughput:
Query response time histogram: each cell has the percentage of responses that take <= the time in the header and max is the max response time in seconds. For max values in the top 25% of the range have a red background and in the bottom 25% of the range have a green background. The red background is not used when the min value is within 80% of the max value.
| dbms | 256us | 1ms | 4ms | 16ms | 64ms | 256ms | 1s | 4s | 16s | gt | max |
|---|---|---|---|---|---|---|---|---|---|---|---|
| pg1222_o2nofp.cx10a_c8r32 | nonzero | 14.702 | 78.866 | 6.413 | 0.019 | nonzero | 0.065 | ||||
| pg1323_o2nofp.cx10a_c8r32 | nonzero | 18.011 | 80.158 | 1.827 | 0.004 | nonzero | nonzero | 0.276 | |||
| pg1422_o2nofp.cx10a_c8r32 | nonzero | 18.437 | 79.928 | 1.632 | 0.002 | 0.030 | |||||
| pg1517_o2nofp.cx10a_c8r32 | nonzero | 17.269 | 80.901 | 1.827 | 0.002 | 0.038 | |||||
| pg1613_o2nofp.cx10a_c8r32 | nonzero | 15.156 | 82.639 | 2.202 | 0.003 | 0.045 | |||||
| pg179_o2nofp.cx10a_c8r32 | nonzero | 16.202 | 81.937 | 1.859 | 0.002 | nonzero | 0.251 | ||||
| pg183_o2nofp.cx10b_c8r32 | 15.642 | 81.768 | 2.586 | 0.003 | 0.036 |
Insert response time histogram: each cell has the percentage of responses that take <= the time in the header and max is the max response time in seconds. For max values in the top 25% of the range have a red background and in the bottom 25% of the range have a green background. The red background is not used when the min value is within 80% of the max value.
| dbms | 256us | 1ms | 4ms | 16ms | 64ms | 256ms | 1s | 4s | 16s | gt | max |
|---|---|---|---|---|---|---|---|---|---|---|---|
| pg1222_o2nofp.cx10a_c8r32 | 35.686 | 64.302 | 0.012 | 0.091 | |||||||
| pg1323_o2nofp.cx10a_c8r32 | 89.703 | 10.297 | 0.057 | ||||||||
| pg1422_o2nofp.cx10a_c8r32 | 90.391 | 9.609 | 0.061 | ||||||||
| pg1517_o2nofp.cx10a_c8r32 | 88.727 | 11.270 | 0.003 | 0.077 | |||||||
| pg1613_o2nofp.cx10a_c8r32 | 85.249 | 14.749 | 0.002 | 0.087 | |||||||
| pg179_o2nofp.cx10a_c8r32 | 87.237 | 12.762 | 0.064 | ||||||||
| pg183_o2nofp.cx10b_c8r32 | 81.613 | 18.386 | 0.001 | 0.064 |
Delete response time histogram: each cell has the percentage of responses that take <= the time in the header and max is the max response time in seconds. For max values in the top 25% of the range have a red background and in the bottom 25% of the range have a green background. The red background is not used when the min value is within 80% of the max value.
| dbms | 256us | 1ms | 4ms | 16ms | 64ms | 256ms | 1s | 4s | 16s | gt | max |
|---|---|---|---|---|---|---|---|---|---|---|---|
| pg1222_o2nofp.cx10a_c8r32 | 25.256 | 74.741 | 0.003 | 0.079 | |||||||
| pg1323_o2nofp.cx10a_c8r32 | 10.712 | 89.285 | 0.003 | 0.081 | |||||||
| pg1422_o2nofp.cx10a_c8r32 | 9.164 | 90.833 | 0.003 | 0.077 | |||||||
| pg1517_o2nofp.cx10a_c8r32 | 8.211 | 91.786 | 0.003 | 0.077 | |||||||
| pg1613_o2nofp.cx10a_c8r32 | 2.793 | 97.204 | 0.003 | 0.078 | |||||||
| pg179_o2nofp.cx10a_c8r32 | 0.028 | 99.969 | 0.003 | 0.072 | |||||||
| pg183_o2nofp.cx10b_c8r32 | 0.917 | 99.080 | 0.003 | 0.076 |
Performance metrics for the DBMS listed above. Some are normalized by throughput, others are not. Legend for results is here.
ips	qps	rps	rmbps	wps	wmbps	rpq	rkbpq	wpi	wkbpi	csps	cpups	cspq	cpupq	dbgb1	dbgb2	rss	maxop	p50	p99	tag
3991	2512	40752	319.4	8934.0	116.0	16.222	130.211	2.238	29.757	85629	33.9	34.087	1080	159.3	199.3	23.2	0.065	640	288	pg1222_o2nofp.cx10a_c8r32
3991	2922	45779	359.3	9127.7	117.7	15.666	125.920	2.287	30.201	96154	35.7	32.905	977	159.2	199.3	23.4	0.276	752	368	pg1323_o2nofp.cx10a_c8r32
3993	2954	46043	361.1	9136.1	117.7	15.585	125.179	2.288	30.193	96168	35.9	32.552	972	159.0	199.0	23.3	0.030	768	368	pg1422_o2nofp.cx10a_c8r32
3993	2904	45514	357.0	9114.7	117.6	15.675	125.911	2.283	30.154	94864	36.4	32.671	1003	159.0	199.1	23.2	0.038	736	368	pg1517_o2nofp.cx10a_c8r32
3991	2823	44517	349.1	9060.4	117.1	15.771	126.653	2.270	30.051	92338	37.7	32.713	1068	158.5	198.5	23.2	0.045	720	352	pg1613_o2nofp.cx10a_c8r32
3993	2894	45455	364.2	9107.5	117.5	15.707	128.882	2.281	30.132	93867	38.3	32.436	1059	159.2	199.3	23.3	0.251	736	352	pg179_o2nofp.cx10a_c8r32
3991	2819	44558	349.1	9059.6	117.1	15.805	126.808	2.270	30.038	91916	37.7	32.604	1070	158.9	199.0	23.1	0.036	736	352	pg183_o2nofp.cx10b_c8r32
Average values from iostat.
r/s	rkB/s	rrqm/s	%rrqm	r_await	rareq-s	w/s	wkB/s	wrqm/s	%wrqm	w_await	wareq-s	d/s	dkB/s	drqm/s	%drqm	d_await	dareq-s	f/s	f_await	aqu-sz	%util
40782.0	327341	0.000	0.000	0.100	8.027	8917.2	118697	57.70	0.877	0.356	13.55	2.008	19.40	0.000	0.000	0.883	8.613	51.17	3.378	7.052	99.64		pg1222_o2nofp.cx10a_c8r32
45822.9	368316	0.097	0.000	0.077	8.038	9111.8	120482	63.23	0.868	0.136	13.43	2.008	37.59	0.000	0.000	0.652	15.09	50.49	1.745	4.702	99.50		pg1323_o2nofp.cx10a_c8r32
46087.6	370175	0.000	0.000	0.076	8.033	9120.2	120517	54.32	0.733	0.128	13.42	2.013	28.89	0.000	0.000	0.628	12.29	49.86	1.700	4.617	99.51		pg1422_o2nofp.cx10a_c8r32
45556.4	365937	0.000	0.000	0.076	8.033	9099.0	120359	60.11	0.793	0.140	13.43	0.014	45.86	0.000	0.000	0.047	65.06	50.50	1.748	4.717	99.46		pg1517_o2nofp.cx10a_c8r32
44557.4	357828	0.128	0.000	0.078	8.031	9044.5	119882	59.42	0.806	0.140	13.46	0.021	36.77	0.000	0.000	0.067	53.87	50.40	1.842	4.682	99.39		pg1613_o2nofp.cx10a_c8r32
45498.0	373337	0.054	0.000	0.077	8.207	9091.8	120273	48.66	0.647	0.125	13.44	0.007	18.45	0.000	0.000	0.012	30.89	48.65	1.755	4.619	99.44		pg179_o2nofp.cx10a_c8r32
44597.2	357813	0.000	0.000	0.078	8.024	9043.5	119828	39.66	0.535	0.166	13.46	0.014	64.10	0.000	0.000	0.039	95.47	48.61	2.048	4.973	99.41		pg183_o2nofp.cx10b_c8r32
l.i0
l.i0: load without secondary indexes
Performance metrics for all DBMS, not just the ones listed above. Some are normalized by throughput, others are not. Legend for results is here.
ips	qps	rps	rmbps	wps	wmbps	rpq	rkbpq	wpi	wkbpi	csps	cpups	cspq	cpupq	dbgb1	dbgb2	rss	maxop	p50	p99	tag
712378	0	492	4.0	3344.8	299.8	0.001	0.006	0.005	0.431	55612	78.4	0.078	9	76.5	116.6	0.2	0.075	182005	166482	pg1222_o2nofp.cx10a_c8r32
718778	0	480	3.9	2803.7	298.3	0.001	0.006	0.004	0.425	55550	79.3	0.077	9	76.5	116.6	4.0	0.081	184153	146280	pg1323_o2nofp.cx10a_c8r32
709220	0	481	3.8	2760.5	293.9	0.001	0.005	0.004	0.424	54644	78.4	0.077	9	76.5	116.6	3.4	0.081	180179	149349	pg1422_o2nofp.cx10a_c8r32
729262	0	486	3.8	2832.4	303.6	0.001	0.005	0.004	0.426	54401	79.0	0.075	9	76.5	116.6	23.3	0.077	185349	147784	pg1517_o2nofp.cx10a_c8r32
733272	0	504	3.9	2829.2	302.3	0.001	0.006	0.004	0.422	54543	79.0	0.074	9	76.5	116.6	23.3	0.079	187070	160983	pg1613_o2nofp.cx10a_c8r32
661157	0	442	3.5	2560.5	273.9	0.001	0.005	0.004	0.424	56355	70.6	0.085	9	76.5	116.6	23.3	0.077	169277	140381	pg179_o2nofp.cx10a_c8r32
653595	0	427	3.4	2568.6	270.8	0.001	0.005	0.004	0.424	56352	70.3	0.086	9	76.5	116.6	23.2	0.135	169044	43695	pg183_o2nofp.cx10b_c8r32
l.x
l.x: create secondary indexes
Performance metrics for all DBMS, not just the ones listed above. Some are normalized by throughput, others are not. Legend for results is here.
ips	qps	rps	rmbps	wps	wmbps	rpq	rkbpq	wpi	wkbpi	csps	cpups	cspq	cpupq	dbgb1	dbgb2	rss	maxop	p50	p99	tag
1300813	0	4955	420.6	6104.1	543.1	0.004	0.331	0.005	0.427	13945	43.9	0.011	3	153.8	193.8	19.4	0.004	NA	NA	pg1222_o2nofp.cx10a_c8r32
1457195	0	5151	463.2	3552.1	426.1	0.004	0.326	0.002	0.299	9761	45.9	0.007	3	153.7	193.7	23.2	0.004	NA	NA	pg1323_o2nofp.cx10a_c8r32
1451906	0	5111	460.5	3532.3	422.6	0.004	0.325	0.002	0.298	9999	45.7	0.007	3	153.7	193.7	23.3	0.004	NA	NA	pg1422_o2nofp.cx10a_c8r32
1484230	0	5501	516.8	3997.7	479.7	0.004	0.357	0.003	0.331	10848	46.0	0.007	2	153.7	193.7	1.6	0.002	NA	NA	pg1517_o2nofp.cx10a_c8r32
1529637	0	4706	440.8	3730.3	445.4	0.003	0.295	0.002	0.298	9992	46.0	0.007	2	153.7	193.7	23.3	0.002	NA	NA	pg1613_o2nofp.cx10a_c8r32
1568628	0	4770	454.7	3846.7	463.9	0.003	0.297	0.002	0.303	10245	46.1	0.007	2	153.7	193.7	22.4	0.002	NA	NA	pg179_o2nofp.cx10a_c8r32
1556420	0	4478	441.0	3771.0	453.2	0.003	0.290	0.002	0.298	9936	46.2	0.006	2	153.7	193.7	23.1	0.005	NA	NA	pg183_o2nofp.cx10b_c8r32
l.i1
l.i1: continue load after secondary indexes created with 50 inserts per transaction
Performance metrics for all DBMS, not just the ones listed above. Some are normalized by throughput, others are not. Legend for results is here.
ips	qps	rps	rmbps	wps	wmbps	rpq	rkbpq	wpi	wkbpi	csps	cpups	cspq	cpupq	dbgb1	dbgb2	rss	maxop	p50	p99	tag
14147	0	16023	128.4	18303.1	315.9	1.133	9.297	1.294	22.864	38085	47.7	2.692	270	156.4	196.4	23.4	0.082	3649	2200	pg1222_o2nofp.cx10a_c8r32
15686	0	18284	152.1	19389.7	345.3	1.166	9.930	1.236	22.542	41751	55.7	2.662	284	156.3	196.3	23.4	0.077	4300	2399	pg1323_o2nofp.cx10a_c8r32
14884	0	17122	137.8	18926.6	329.5	1.150	9.483	1.272	22.669	39303	55.0	2.641	296	156.3	196.3	23.3	0.086	3650	2000	pg1422_o2nofp.cx10a_c8r32
13169	0	15287	121.8	16944.8	294.0	1.161	9.469	1.287	22.862	35272	52.9	2.678	321	156.3	196.3	23.3	0.081	2400	1850	pg1517_o2nofp.cx10a_c8r32
12810	0	14820	118.1	16267.5	283.1	1.157	9.442	1.270	22.629	33842	50.1	2.642	313	156.3	196.3	23.3	0.081	4049	2550	pg1613_o2nofp.cx10a_c8r32
12204	0	13994	111.5	15532.9	270.4	1.147	9.356	1.273	22.686	31734	48.6	2.600	319	156.3	196.3	23.3	0.066	3550	2600	pg179_o2nofp.cx10a_c8r32
14506	0	17037	136.3	18885.4	327.8	1.174	9.623	1.302	23.141	38458	55.6	2.651	307	156.3	196.3	23.3	0.077	3750	1649	pg183_o2nofp.cx10b_c8r32
l.i2
l.i2: continue load after secondary indexes created with 5 inserts per transaction
Performance metrics for all DBMS, not just the ones listed above. Some are normalized by throughput, others are not. Legend for results is here.
ips	qps	rps	rmbps	wps	wmbps	rpq	rkbpq	wpi	wkbpi	csps	cpups	cspq	cpupq	dbgb1	dbgb2	rss	maxop	p50	p99	tag
872	0	963	8.2	1498.5	22.0	1.104	9.617	1.718	25.780	6544	39.0	7.503	3577	157.0	197.1	23.4	0.022	180	155	pg1222_o2nofp.cx10a_c8r32
1254	0	1370	11.0	2000.5	30.3	1.092	8.971	1.595	24.718	9314	51.4	7.426	3278	157.0	197.0	23.4	0.023	310	280	pg1323_o2nofp.cx10a_c8r32
1238	0	1359	10.8	1978.3	29.7	1.097	8.903	1.598	24.599	8640	51.4	6.978	3321	157.0	197.0	23.3	0.020	310	280	pg1422_o2nofp.cx10a_c8r32
726	0	788	6.3	1209.5	18.4	1.085	8.914	1.667	26.013	5029	39.8	6.928	4387	157.0	197.0	23.3	0.022	165	150	pg1517_o2nofp.cx10a_c8r32
856	0	1117	18.2	1697.2	28.0	1.305	21.733	1.983	33.540	6072	38.3	7.094	3580	156.9	197.0	19.8	0.043	295	270	pg1613_o2nofp.cx10a_c8r32
803	0	892	7.1	1328.8	19.8	1.110	9.050	1.654	25.234	4997	41.5	6.221	4133	157.0	197.0	23.3	0.022	155	125	pg179_o2nofp.cx10a_c8r32
582	0	624	4.9	951.8	14.8	1.072	8.705	1.635	26.080	3622	43.8	6.223	6020	157.0	197.0	23.3	0.024	145	135	pg183_o2nofp.cx10b_c8r32
qr100.L1
qr100.L1: range queries with 100 insert/s per client
Performance metrics for all DBMS, not just the ones listed above. Some are normalized by throughput, others are not. Legend for results is here.
ips	qps	rps	rmbps	wps	wmbps	rpq	rkbpq	wpi	wkbpi	csps	cpups	cspq	cpupq	dbgb1	dbgb2	rss	maxop	p50	p99	tag
399	96865	467	3.8	113.0	5.9	0.005	0.041	0.283	15.151	370484	42.7	3.825	35	157.1	197.1	23.4	0.006	24222	23836	pg1222_o2nofp.cx10a_c8r32
399	96893	463	3.7	236.3	7.2	0.005	0.039	0.592	18.536	370739	42.1	3.826	35	157.0	197.1	23.4	0.004	24653	23949	pg1323_o2nofp.cx10a_c8r32
399	96906	468	3.8	243.6	7.3	0.005	0.040	0.610	18.646	370414	41.5	3.822	34	157.0	197.0	23.3	0.010	24222	23805	pg1422_o2nofp.cx10a_c8r32
399	96420	465	3.7	239.7	7.2	0.005	0.040	0.600	18.565	368480	42.1	3.822	35	157.0	197.0	23.3	0.454	24237	21997	pg1517_o2nofp.cx10a_c8r32
399	97333	461	3.7	242.8	7.3	0.005	0.039	0.608	18.623	372292	41.7	3.825	34	156.9	197.0	23.3	0.009	24237	23853	pg1613_o2nofp.cx10a_c8r32
399	99169	485	3.9	264.2	7.5	0.005	0.040	0.662	19.198	379026	41.8	3.822	34	157.0	197.1	23.3	0.010	24925	24430	pg179_o2nofp.cx10a_c8r32
399	97740	457	3.7	256.7	7.4	0.005	0.038	0.643	19.000	373524	41.6	3.822	34	157.0	197.0	23.3	0.010	24509	22941	pg183_o2nofp.cx10b_c8r32
qp100.L2
qp100.L2: point queries with 100 insert/s per client
Performance metrics for all DBMS, not just the ones listed above. Some are normalized by throughput, others are not. Legend for results is here.
ips	qps	rps	rmbps	wps	wmbps	rpq	rkbpq	wpi	wkbpi	csps	cpups	cspq	cpupq	dbgb1	dbgb2	rss	maxop	p50	p99	tag
399	3661	45055	354.9	1537.2	17.0	12.308	99.285	3.850	43.683	100371	11.1	27.419	243	157.2	197.2	23.4	0.019	944	576	pg1222_o2nofp.cx10a_c8r32
399	3686	45504	355.8	1403.4	16.0	12.347	98.868	3.515	41.090	101407	10.9	27.515	237	157.1	197.1	23.4	0.025	928	592	pg1323_o2nofp.cx10a_c8r32
399	3675	45096	352.8	1396.7	15.9	12.271	98.302	3.500	40.923	101166	11.0	27.528	239	157.0	197.1	23.3	0.244	944	528	pg1422_o2nofp.cx10a_c8r32
399	3660	45062	352.4	1394.9	16.0	12.314	98.595	3.493	40.906	100263	11.8	27.398	258	157.1	196.5	23.3	0.024	928	592	pg1517_o2nofp.cx10a_c8r32
398	3548	43829	342.8	1387.1	15.9	12.351	98.935	3.482	40.752	98076	11.5	27.639	259	156.9	196.8	23.3	0.851	912	80	pg1613_o2nofp.cx10a_c8r32
399	3693	45368	354.8	1373.5	15.8	12.284	98.372	3.441	40.484	100926	10.9	27.328	236	157.1	197.1	23.3	0.026	928	624	pg179_o2nofp.cx10a_c8r32
399	3633	44709	349.7	1377.6	15.8	12.306	98.565	3.452	40.509	99975	11.8	27.518	260	157.0	197.1	23.3	0.448	944	560	pg183_o2nofp.cx10b_c8r32
qr500.L3
qr500.L3: range queries with 500 insert/s per client
Performance metrics for all DBMS, not just the ones listed above. Some are normalized by throughput, others are not. Legend for results is here.
ips	qps	rps	rmbps	wps	wmbps	rpq	rkbpq	wpi	wkbpi	csps	cpups	cspq	cpupq	dbgb1	dbgb2	rss	maxop	p50	p99	tag
1996	84738	2639	21.9	2432.8	40.9	0.031	0.265	1.219	20.993	323455	48.9	3.817	46	157.5	197.5	23.4	0.040	21390	18702	pg1222_o2nofp.cx10a_c8r32
1996	85543	2609	20.9	2415.3	41.2	0.030	0.250	1.210	21.142	325119	48.5	3.801	45	157.4	197.4	23.4	0.037	21500	19806	pg1323_o2nofp.cx10a_c8r32
1997	84923	2631	21.1	2406.2	40.4	0.031	0.255	1.205	20.718	324376	48.2	3.820	45	157.2	197.3	18.7	0.026	21182	19902	pg1422_o2nofp.cx10a_c8r32
1996	84561	2623	21.5	2417.7	41.7	0.031	0.260	1.212	21.393	320868	48.7	3.794	46	157.3	197.3	23.3	0.032	21261	19806	pg1517_o2nofp.cx10a_c8r32
1996	83939	2633	21.2	2409.2	41.3	0.031	0.259	1.207	21.171	321375	48.7	3.829	46	157.0	197.1	19.5	0.033	20878	19630	pg1613_o2nofp.cx10a_c8r32
1997	86227	2634	21.2	2402.4	40.7	0.031	0.252	1.203	20.871	327089	48.8	3.793	45	157.4	197.4	23.3	0.034	21598	19566	pg179_o2nofp.cx10a_c8r32
1996	84106	2632	21.1	2396.2	39.9	0.031	0.257	1.201	20.478	320774	48.7	3.814	46	157.2	197.3	20.1	0.031	21102	19822	pg183_o2nofp.cx10b_c8r32
qp500.L4
qp500.L4: point queries with 500 insert/s per client
Performance metrics for all DBMS, not just the ones listed above. Some are normalized by throughput, others are not. Legend for results is here.
ips	qps	rps	rmbps	wps	wmbps	rpq	rkbpq	wpi	wkbpi	csps	cpups	cspq	cpupq	dbgb1	dbgb2	rss	maxop	p50	p99	tag
1996	3140	43295	340.9	5081.2	61.7	13.786	111.162	2.546	31.663	97481	19.2	31.040	489	157.8	197.8	15.7	0.931	816	304	pg1222_o2nofp.cx10a_c8r32
1997	3371	46184	361.7	5124.6	62.1	13.702	109.877	2.567	31.857	100293	19.4	29.755	460	157.7	197.8	23.4	0.026	864	528	pg1323_o2nofp.cx10a_c8r32
1996	3409	46303	362.9	5124.4	62.0	13.582	108.995	2.568	31.840	100599	19.4	29.509	455	157.4	197.5	22.6	0.035	880	544	pg1422_o2nofp.cx10a_c8r32
1996	3304	45235	358.4	5114.4	62.0	13.691	111.082	2.563	31.812	98493	20.7	29.809	501	157.6	197.6	19.2	0.941	848	448	pg1517_o2nofp.cx10a_c8r32
1997	3343	45461	356.5	5114.6	61.9	13.598	109.184	2.562	31.759	98094	20.9	29.340	500	157.1	197.2	22.3	0.023	848	528	pg1613_o2nofp.cx10a_c8r32
1996	3314	45526	356.5	5109.2	62.0	13.737	110.155	2.560	31.817	99163	21.0	29.923	507	157.7	197.8	23.3	0.026	848	416	pg179_o2nofp.cx10a_c8r32
1997	3206	44023	345.0	5098.2	61.8	13.733	110.189	2.553	31.719	95876	20.8	29.908	519	157.4	197.5	23.1	0.428	848	64	pg183_o2nofp.cx10b_c8r32
qr1000.L5
qr1000.L5: range queries with 1000 insert/s per client
Performance metrics for all DBMS, not just the ones listed above. Some are normalized by throughput, others are not. Legend for results is here.
ips	qps	rps	rmbps	wps	wmbps	rpq	rkbpq	wpi	wkbpi	csps	cpups	cspq	cpupq	dbgb1	dbgb2	rss	maxop	p50	p99	tag
3993	63998	4884	39.3	5876.3	90.9	0.076	0.628	1.472	23.306	230504	62.1	3.602	78	158.4	198.5	23.2	0.226	16126	14232	pg1222_o2nofp.cx10a_c8r32
3989	64987	4883	40.6	5859.1	90.8	0.075	0.640	1.469	23.303	233087	61.9	3.587	76	158.4	198.4	23.4	0.369	16494	14238	pg1323_o2nofp.cx10a_c8r32
3991	64790	4888	39.3	5859.5	90.7	0.075	0.621	1.468	23.278	232035	62.0	3.581	77	158.1	198.1	23.3	0.193	16174	14254	pg1422_o2nofp.cx10a_c8r32
3993	63115	4884	39.4	5860.3	90.7	0.077	0.639	1.468	23.257	226385	62.4	3.587	79	158.2	198.2	23.2	0.187	15966	14126	pg1517_o2nofp.cx10a_c8r32
3989	62755	4914	40.1	5861.3	90.7	0.078	0.654	1.469	23.275	224653	62.9	3.580	80	157.6	197.7	23.2	0.171	15694	13630	pg1613_o2nofp.cx10a_c8r32
3989	63175	4864	39.6	5858.7	90.7	0.077	0.641	1.469	23.288	223703	63.5	3.541	80	158.4	198.4	23.3	0.196	15742	13775	pg179_o2nofp.cx10a_c8r32
3991	62009	4880	39.2	5853.7	90.6	0.079	0.648	1.467	23.258	221139	63.3	3.566	82	158.1	198.1	23.0	0.185	15742	13871	pg183_o2nofp.cx10b_c8r32
qp1000.L6
qp1000.L6: point queries with 1000 insert/s per client
Performance metrics for all DBMS, not just the ones listed above. Some are normalized by throughput, others are not. Legend for results is here.
ips	qps	rps	rmbps	wps	wmbps	rpq	rkbpq	wpi	wkbpi	csps	cpups	cspq	cpupq	dbgb1	dbgb2	rss	maxop	p50	p99	tag
3991	2512	40752	319.4	8934.0	116.0	16.222	130.211	2.238	29.757	85629	33.9	34.087	1080	159.3	199.3	23.2	0.065	640	288	pg1222_o2nofp.cx10a_c8r32
3991	2922	45779	359.3	9127.7	117.7	15.666	125.920	2.287	30.201	96154	35.7	32.905	977	159.2	199.3	23.4	0.276	752	368	pg1323_o2nofp.cx10a_c8r32
3993	2954	46043	361.1	9136.1	117.7	15.585	125.179	2.288	30.193	96168	35.9	32.552	972	159.0	199.0	23.3	0.030	768	368	pg1422_o2nofp.cx10a_c8r32
3993	2904	45514	357.0	9114.7	117.6	15.675	125.911	2.283	30.154	94864	36.4	32.671	1003	159.0	199.1	23.2	0.038	736	368	pg1517_o2nofp.cx10a_c8r32
3991	2823	44517	349.1	9060.4	117.1	15.771	126.653	2.270	30.051	92338	37.7	32.713	1068	158.5	198.5	23.2	0.045	720	352	pg1613_o2nofp.cx10a_c8r32
3993	2894	45455	364.2	9107.5	117.5	15.707	128.882	2.281	30.132	93867	38.3	32.436	1059	159.2	199.3	23.3	0.251	736	352	pg179_o2nofp.cx10a_c8r32
3991	2819	44558	349.1	9059.6	117.1	15.805	126.808	2.270	30.038	91916	37.7	32.604	1070	158.9	199.0	23.1	0.036	736	352	pg183_o2nofp.cx10b_c8r32
l.i0
- l.i0: load without secondary indexes
- Legend for results is here.
- Each entry lists the percentage of responses that fit in that bucket (slower than max time for previous bucket, faster than min time for next bucket).
Insert response time histogram
256us	1ms	4ms	16ms	64ms	256ms	1s	4s	16s	gt	max	tag
0.000	99.112	0.879	0.008	0.001	nonzero	0.000	0.000	0.000	0.000	0.075	pg1222_o2nofp.cx10a_c8r32
0.000	98.939	1.042	0.018	0.001	nonzero	0.000	0.000	0.000	0.000	0.081	pg1323_o2nofp.cx10a_c8r32
0.000	99.204	0.777	0.016	0.002	nonzero	0.000	0.000	0.000	0.000	0.081	pg1422_o2nofp.cx10a_c8r32
0.000	99.191	0.790	0.017	0.002	nonzero	0.000	0.000	0.000	0.000	0.077	pg1517_o2nofp.cx10a_c8r32
0.000	99.215	0.769	0.015	0.001	nonzero	0.000	0.000	0.000	0.000	0.079	pg1613_o2nofp.cx10a_c8r32
0.000	96.971	2.953	0.073	0.003	nonzero	0.000	0.000	0.000	0.000	0.077	pg179_o2nofp.cx10a_c8r32
0.000	96.912	2.920	0.167	0.001	nonzero	0.000	0.000	0.000	0.000	0.135	pg183_o2nofp.cx10b_c8r32
l.x
- l.x: create secondary indexes
- Legend for results is here.
- Each entry lists the percentage of responses that fit in that bucket (slower than max time for previous bucket, faster than min time for next bucket).
TODO - determine whether there is data for create index response time
l.i1
- l.i1: continue load after secondary indexes created with 50 inserts per transaction
- Legend for results is here.
- Each entry lists the percentage of responses that fit in that bucket (slower than max time for previous bucket, faster than min time for next bucket).
Insert response time histogram
256us	1ms	4ms	16ms	64ms	256ms	1s	4s	16s	gt	max	tag
0.000	0.000	0.005	74.536	25.458	0.001	0.000	0.000	0.000	0.000	0.082	pg1222_o2nofp.cx10a_c8r32
0.000	0.000	1.452	90.656	7.890	0.002	0.000	0.000	0.000	0.000	0.077	pg1323_o2nofp.cx10a_c8r32
0.000	0.000	3.034	90.138	6.825	0.003	0.000	0.000	0.000	0.000	0.086	pg1422_o2nofp.cx10a_c8r32
0.000	0.000	0.393	91.034	8.569	0.004	0.000	0.000	0.000	0.000	0.081	pg1517_o2nofp.cx10a_c8r32
0.000	0.000	1.038	91.955	7.006	0.001	0.000	0.000	0.000	0.000	0.081	pg1613_o2nofp.cx10a_c8r32
0.000	0.000	2.340	89.968	7.692	0.001	0.000	0.000	0.000	0.000	0.066	pg179_o2nofp.cx10a_c8r32
0.000	0.000	0.667	86.353	12.974	0.005	0.000	0.000	0.000	0.000	0.077	pg183_o2nofp.cx10b_c8r32
Delete response time histogram
256us	1ms	4ms	16ms	64ms	256ms	1s	4s	16s	gt	max	tag
0.002	2.716	11.277	85.818	0.188	0.000	0.000	0.000	0.000	0.000	0.033	pg1222_o2nofp.cx10a_c8r32
0.002	2.574	10.704	82.759	3.961	0.000	0.000	0.000	0.000	0.000	0.030	pg1323_o2nofp.cx10a_c8r32
0.001	2.573	10.871	76.458	10.097	0.000	0.000	0.000	0.000	0.000	0.031	pg1422_o2nofp.cx10a_c8r32
0.002	2.493	10.417	70.303	16.785	0.000	0.000	0.000	0.000	0.000	0.033	pg1517_o2nofp.cx10a_c8r32
0.002	2.578	10.275	74.561	12.584	0.000	0.000	0.000	0.000	0.000	0.037	pg1613_o2nofp.cx10a_c8r32
0.002	2.427	9.534	70.906	17.131	0.000	0.000	0.000	0.000	0.000	0.034	pg179_o2nofp.cx10a_c8r32
0.002	2.420	9.877	80.480	7.222	0.000	0.000	0.000	0.000	0.000	0.037	pg183_o2nofp.cx10b_c8r32
l.i2
- l.i2: continue load after secondary indexes created with 5 inserts per transaction
- Legend for results is here.
- Each entry lists the percentage of responses that fit in that bucket (slower than max time for previous bucket, faster than min time for next bucket).
Insert response time histogram
256us	1ms	4ms	16ms	64ms	256ms	1s	4s	16s	gt	max	tag
0.001	60.941	37.156	1.900	0.002	0.000	0.000	0.000	0.000	0.000	0.022	pg1222_o2nofp.cx10a_c8r32
0.002	64.933	33.816	1.248	0.002	0.000	0.000	0.000	0.000	0.000	0.023	pg1323_o2nofp.cx10a_c8r32
0.001	54.775	43.900	1.323	0.002	0.000	0.000	0.000	0.000	0.000	0.020	pg1422_o2nofp.cx10a_c8r32
0.000	36.309	62.342	1.348	0.001	0.000	0.000	0.000	0.000	0.000	0.022	pg1517_o2nofp.cx10a_c8r32
0.049	38.636	57.776	3.488	0.052	0.000	0.000	0.000	0.000	0.000	0.043	pg1613_o2nofp.cx10a_c8r32
0.001	42.850	56.171	0.978	0.001	0.000	0.000	0.000	0.000	0.000	0.022	pg179_o2nofp.cx10a_c8r32
0.000	31.583	67.636	0.780	0.001	0.000	0.000	0.000	0.000	0.000	0.024	pg183_o2nofp.cx10b_c8r32
Delete response time histogram
256us	1ms	4ms	16ms	64ms	256ms	1s	4s	16s	gt	max	tag
0.000	0.000	0.000	63.155	36.845	0.001	0.000	0.000	0.000	0.000	0.075	pg1222_o2nofp.cx10a_c8r32
0.000	0.000	0.000	54.549	45.451	0.001	0.000	0.000	0.000	0.000	0.075	pg1323_o2nofp.cx10a_c8r32
0.000	0.000	0.000	49.758	50.241	0.001	0.000	0.000	0.000	0.000	0.076	pg1422_o2nofp.cx10a_c8r32
0.000	0.000	0.000	23.806	76.194	0.001	0.000	0.000	0.000	0.000	0.087	pg1517_o2nofp.cx10a_c8r32
0.805	6.863	8.617	12.178	71.536	0.001	0.000	0.000	0.000	0.000	0.089	pg1613_o2nofp.cx10a_c8r32
0.000	0.000	0.000	0.052	99.948	0.001	0.000	0.000	0.000	0.000	0.072	pg179_o2nofp.cx10a_c8r32
0.000	0.000	0.000	3.096	96.904	0.001	0.000	0.000	0.000	0.000	0.091	pg183_o2nofp.cx10b_c8r32
qr100.L1
- qr100.L1: range queries with 100 insert/s per client
- Legend for results is here.
- Each entry lists the percentage of responses that fit in that bucket (slower than max time for previous bucket, faster than min time for next bucket).
Query response time histogram
256us	1ms	4ms	16ms	64ms	256ms	1s	4s	16s	gt	max	tag
99.991	0.008	nonzero	nonzero	0.000	0.000	0.000	0.000	0.000	0.000	0.006	pg1222_o2nofp.cx10a_c8r32
99.990	0.010	nonzero	0.000	0.000	0.000	0.000	0.000	0.000	0.000	0.004	pg1323_o2nofp.cx10a_c8r32
99.989	0.011	nonzero	nonzero	0.000	0.000	0.000	0.000	0.000	0.000	0.010	pg1422_o2nofp.cx10a_c8r32
99.989	0.011	nonzero	nonzero	0.000	nonzero	nonzero	0.000	0.000	0.000	0.454	pg1517_o2nofp.cx10a_c8r32
99.988	0.012	nonzero	nonzero	0.000	0.000	0.000	0.000	0.000	0.000	0.009	pg1613_o2nofp.cx10a_c8r32
99.984	0.014	0.001	nonzero	0.000	0.000	0.000	0.000	0.000	0.000	0.010	pg179_o2nofp.cx10a_c8r32
99.989	0.011	nonzero	nonzero	0.000	0.000	0.000	0.000	0.000	0.000	0.010	pg183_o2nofp.cx10b_c8r32
Insert response time histogram
256us	1ms	4ms	16ms	64ms	256ms	1s	4s	16s	gt	max	tag
0.000	0.000	0.000	98.514	1.486	0.000	0.000	0.000	0.000	0.000	0.049	pg1222_o2nofp.cx10a_c8r32
0.000	0.000	0.000	99.875	0.125	0.000	0.000	0.000	0.000	0.000	0.023	pg1323_o2nofp.cx10a_c8r32
0.000	0.000	0.000	99.569	0.431	0.000	0.000	0.000	0.000	0.000	0.029	pg1422_o2nofp.cx10a_c8r32
0.000	0.000	0.000	99.396	0.604	0.000	0.000	0.000	0.000	0.000	0.035	pg1517_o2nofp.cx10a_c8r32
0.000	0.000	0.007	99.083	0.910	0.000	0.000	0.000	0.000	0.000	0.026	pg1613_o2nofp.cx10a_c8r32
0.000	0.000	0.000	98.743	1.257	0.000	0.000	0.000	0.000	0.000	0.041	pg179_o2nofp.cx10a_c8r32
0.000	0.000	0.000	99.340	0.660	0.000	0.000	0.000	0.000	0.000	0.031	pg183_o2nofp.cx10b_c8r32
Delete response time histogram
256us	1ms	4ms	16ms	64ms	256ms	1s	4s	16s	gt	max	tag
0.021	72.451	27.271	0.257	0.000	0.000	0.000	0.000	0.000	0.000	0.007	pg1222_o2nofp.cx10a_c8r32
0.007	67.521	32.444	0.028	0.000	0.000	0.000	0.000	0.000	0.000	0.005	pg1323_o2nofp.cx10a_c8r32
0.090	74.222	25.674	0.014	0.000	0.000	0.000	0.000	0.000	0.000	0.005	pg1422_o2nofp.cx10a_c8r32
0.028	71.368	28.549	0.049	0.007	0.000	0.000	0.000	0.000	0.000	0.020	pg1517_o2nofp.cx10a_c8r32
0.076	73.833	26.062	0.028	0.000	0.000	0.000	0.000	0.000	0.000	0.005	pg1613_o2nofp.cx10a_c8r32
0.090	67.833	32.062	0.014	0.000	0.000	0.000	0.000	0.000	0.000	0.005	pg179_o2nofp.cx10a_c8r32
0.007	66.042	33.951	0.000	0.000	0.000	0.000	0.000	0.000	0.000	0.004	pg183_o2nofp.cx10b_c8r32
qp100.L2
- qp100.L2: point queries with 100 insert/s per client
- Legend for results is here.
- Each entry lists the percentage of responses that fit in that bucket (slower than max time for previous bucket, faster than min time for next bucket).
Query response time histogram
256us	1ms	4ms	16ms	64ms	256ms	1s	4s	16s	gt	max	tag
nonzero	36.633	63.250	0.117	nonzero	0.000	0.000	0.000	0.000	0.000	0.019	pg1222_o2nofp.cx10a_c8r32
nonzero	37.506	62.402	0.092	nonzero	0.000	0.000	0.000	0.000	0.000	0.025	pg1323_o2nofp.cx10a_c8r32
nonzero	38.590	61.274	0.134	0.001	nonzero	0.000	0.000	0.000	0.000	0.244	pg1422_o2nofp.cx10a_c8r32
nonzero	36.299	63.625	0.075	nonzero	0.000	0.000	0.000	0.000	0.000	0.024	pg1517_o2nofp.cx10a_c8r32
nonzero	34.896	64.867	0.191	0.046	nonzero	nonzero	0.000	0.000	0.000	0.851	pg1613_o2nofp.cx10a_c8r32
nonzero	37.891	62.029	0.080	nonzero	0.000	0.000	0.000	0.000	0.000	0.026	pg179_o2nofp.cx10a_c8r32
nonzero	36.222	63.655	0.122	nonzero	nonzero	nonzero	0.000	0.000	0.000	0.448	pg183_o2nofp.cx10b_c8r32
Insert response time histogram
256us	1ms	4ms	16ms	64ms	256ms	1s	4s	16s	gt	max	tag
0.000	0.000	0.000	97.097	2.903	0.000	0.000	0.000	0.000	0.000	0.029	pg1222_o2nofp.cx10a_c8r32
0.000	0.000	0.000	96.833	3.167	0.000	0.000	0.000	0.000	0.000	0.031	pg1323_o2nofp.cx10a_c8r32
0.000	0.000	0.000	96.521	3.444	0.035	0.000	0.000	0.000	0.000	0.203	pg1422_o2nofp.cx10a_c8r32
0.000	0.000	0.000	98.153	1.847	0.000	0.000	0.000	0.000	0.000	0.028	pg1517_o2nofp.cx10a_c8r32
0.000	0.000	0.000	96.708	1.812	1.458	0.021	0.000	0.000	0.000	0.684	pg1613_o2nofp.cx10a_c8r32
0.000	0.000	0.000	97.069	2.903	0.028	0.000	0.000	0.000	0.000	0.087	pg179_o2nofp.cx10a_c8r32
0.000	0.000	0.000	95.292	4.708	0.000	0.000	0.000	0.000	0.000	0.039	pg183_o2nofp.cx10b_c8r32
Delete response time histogram
256us	1ms	4ms	16ms	64ms	256ms	1s	4s	16s	gt	max	tag
0.000	11.514	86.528	1.958	0.000	0.000	0.000	0.000	0.000	0.000	0.009	pg1222_o2nofp.cx10a_c8r32
0.000	5.278	93.236	1.486	0.000	0.000	0.000	0.000	0.000	0.000	0.010	pg1323_o2nofp.cx10a_c8r32
0.000	7.590	91.910	0.444	0.056	0.000	0.000	0.000	0.000	0.000	0.054	pg1422_o2nofp.cx10a_c8r32
0.000	3.382	95.083	1.535	0.000	0.000	0.000	0.000	0.000	0.000	0.014	pg1517_o2nofp.cx10a_c8r32
0.000	7.118	91.993	0.819	0.035	0.021	0.014	0.000	0.000	0.000	0.668	pg1613_o2nofp.cx10a_c8r32
0.000	4.576	94.104	1.319	0.000	0.000	0.000	0.000	0.000	0.000	0.015	pg179_o2nofp.cx10a_c8r32
0.000	7.194	92.132	0.646	0.000	0.000	0.028	0.000	0.000	0.000	0.321	pg183_o2nofp.cx10b_c8r32
qr500.L3
- qr500.L3: range queries with 500 insert/s per client
- Legend for results is here.
- Each entry lists the percentage of responses that fit in that bucket (slower than max time for previous bucket, faster than min time for next bucket).
Query response time histogram
256us	1ms	4ms	16ms	64ms	256ms	1s	4s	16s	gt	max	tag
99.956	0.041	0.003	nonzero	nonzero	0.000	0.000	0.000	0.000	0.000	0.040	pg1222_o2nofp.cx10a_c8r32
99.958	0.039	0.002	nonzero	nonzero	0.000	0.000	0.000	0.000	0.000	0.037	pg1323_o2nofp.cx10a_c8r32
99.963	0.036	0.002	nonzero	nonzero	0.000	0.000	0.000	0.000	0.000	0.026	pg1422_o2nofp.cx10a_c8r32
99.954	0.043	0.003	nonzero	nonzero	0.000	0.000	0.000	0.000	0.000	0.032	pg1517_o2nofp.cx10a_c8r32
99.959	0.039	0.001	nonzero	nonzero	0.000	0.000	0.000	0.000	0.000	0.033	pg1613_o2nofp.cx10a_c8r32
99.960	0.038	0.002	nonzero	nonzero	0.000	0.000	0.000	0.000	0.000	0.034	pg179_o2nofp.cx10a_c8r32
99.960	0.037	0.002	nonzero	nonzero	0.000	0.000	0.000	0.000	0.000	0.031	pg183_o2nofp.cx10b_c8r32
Insert response time histogram
256us	1ms	4ms	16ms	64ms	256ms	1s	4s	16s	gt	max	tag
0.000	0.000	0.004	87.969	12.025	0.001	0.000	0.000	0.000	0.000	0.065	pg1222_o2nofp.cx10a_c8r32
0.000	0.000	0.003	97.540	2.457	0.000	0.000	0.000	0.000	0.000	0.038	pg1323_o2nofp.cx10a_c8r32
0.000	0.000	0.010	99.204	0.786	0.000	0.000	0.000	0.000	0.000	0.028	pg1422_o2nofp.cx10a_c8r32
0.000	0.000	0.001	96.825	3.172	0.001	0.000	0.000	0.000	0.000	0.065	pg1517_o2nofp.cx10a_c8r32
0.000	0.000	0.004	99.231	0.765	0.000	0.000	0.000	0.000	0.000	0.041	pg1613_o2nofp.cx10a_c8r32
0.000	0.000	0.003	97.340	2.657	0.000	0.000	0.000	0.000	0.000	0.040	pg179_o2nofp.cx10a_c8r32
0.000	0.000	0.003	98.521	1.476	0.000	0.000	0.000	0.000	0.000	0.042	pg183_o2nofp.cx10b_c8r32
Delete response time histogram
256us	1ms	4ms	16ms	64ms	256ms	1s	4s	16s	gt	max	tag
0.000	0.000	31.910	68.061	0.029	0.000	0.000	0.000	0.000	0.000	0.035	pg1222_o2nofp.cx10a_c8r32
0.000	0.000	25.906	74.047	0.047	0.000	0.000	0.000	0.000	0.000	0.038	pg1323_o2nofp.cx10a_c8r32
0.000	0.000	34.462	65.535	0.003	0.000	0.000	0.000	0.000	0.000	0.026	pg1422_o2nofp.cx10a_c8r32
0.000	0.000	23.582	76.353	0.065	0.000	0.000	0.000	0.000	0.000	0.037	pg1517_o2nofp.cx10a_c8r32
0.000	0.000	28.814	71.183	0.003	0.000	0.000	0.000	0.000	0.000	0.019	pg1613_o2nofp.cx10a_c8r32
0.000	0.000	23.562	76.340	0.097	0.000	0.000	0.000	0.000	0.000	0.038	pg179_o2nofp.cx10a_c8r32
0.000	0.000	29.811	70.174	0.015	0.000	0.000	0.000	0.000	0.000	0.022	pg183_o2nofp.cx10b_c8r32
qp500.L4
- qp500.L4: point queries with 500 insert/s per client
- Legend for results is here.
- Each entry lists the percentage of responses that fit in that bucket (slower than max time for previous bucket, faster than min time for next bucket).
Query response time histogram
256us	1ms	4ms	16ms	64ms	256ms	1s	4s	16s	gt	max	tag
nonzero	25.075	73.197	1.725	0.003	nonzero	nonzero	0.000	0.000	0.000	0.931	pg1222_o2nofp.cx10a_c8r32
nonzero	28.385	71.057	0.557	0.001	0.000	0.000	0.000	0.000	0.000	0.026	pg1323_o2nofp.cx10a_c8r32
nonzero	30.086	69.445	0.469	0.001	0.000	0.000	0.000	0.000	0.000	0.035	pg1422_o2nofp.cx10a_c8r32
nonzero	26.985	72.385	0.629	0.001	nonzero	nonzero	0.000	0.000	0.000	0.941	pg1517_o2nofp.cx10a_c8r32
nonzero	27.900	71.498	0.602	nonzero	0.000	0.000	0.000	0.000	0.000	0.023	pg1613_o2nofp.cx10a_c8r32
nonzero	25.406	74.030	0.563	0.001	0.000	0.000	0.000	0.000	0.000	0.026	pg179_o2nofp.cx10a_c8r32
nonzero	25.665	73.429	0.844	0.062	nonzero	nonzero	0.000	0.000	0.000	0.428	pg183_o2nofp.cx10b_c8r32
Insert response time histogram
256us	1ms	4ms	16ms	64ms	256ms	1s	4s	16s	gt	max	tag
0.000	0.000	0.000	86.119	13.878	0.001	0.001	0.000	0.000	0.000	0.264	pg1222_o2nofp.cx10a_c8r32
0.000	0.000	0.000	93.958	6.042	0.000	0.000	0.000	0.000	0.000	0.050	pg1323_o2nofp.cx10a_c8r32
0.000	0.000	0.000	95.410	4.585	0.006	0.000	0.000	0.000	0.000	0.104	pg1422_o2nofp.cx10a_c8r32
0.000	0.000	0.000	91.588	8.400	0.007	0.006	0.000	0.000	0.000	0.312	pg1517_o2nofp.cx10a_c8r32
0.000	0.000	0.000	92.031	7.969	0.000	0.000	0.000	0.000	0.000	0.050	pg1613_o2nofp.cx10a_c8r32
0.000	0.000	0.000	96.422	3.578	0.000	0.000	0.000	0.000	0.000	0.060	pg179_o2nofp.cx10a_c8r32
0.000	0.000	0.000	88.997	9.881	1.122	0.000	0.000	0.000	0.000	0.201	pg183_o2nofp.cx10b_c8r32
Delete response time histogram
256us	1ms	4ms	16ms	64ms	256ms	1s	4s	16s	gt	max	tag
0.000	0.000	0.000	99.567	0.428	0.001	0.004	0.000	0.000	0.000	0.432	pg1222_o2nofp.cx10a_c8r32
0.000	0.000	0.000	98.228	1.772	0.000	0.000	0.000	0.000	0.000	0.038	pg1323_o2nofp.cx10a_c8r32
0.000	0.000	0.000	98.758	1.242	0.000	0.000	0.000	0.000	0.000	0.039	pg1422_o2nofp.cx10a_c8r32
0.000	0.000	0.000	97.737	2.246	0.010	0.007	0.000	0.000	0.000	0.486	pg1517_o2nofp.cx10a_c8r32
0.000	0.000	0.000	87.876	12.124	0.000	0.000	0.000	0.000	0.000	0.039	pg1613_o2nofp.cx10a_c8r32
0.000	0.000	0.000	80.017	19.983	0.000	0.000	0.000	0.000	0.000	0.037	pg179_o2nofp.cx10a_c8r32
0.000	0.000	0.000	95.725	4.271	0.004	0.000	0.000	0.000	0.000	0.090	pg183_o2nofp.cx10b_c8r32
qr1000.L5
- qr1000.L5: range queries with 1000 insert/s per client
- Legend for results is here.
- Each entry lists the percentage of responses that fit in that bucket (slower than max time for previous bucket, faster than min time for next bucket).
Query response time histogram
256us	1ms	4ms	16ms	64ms	256ms	1s	4s	16s	gt	max	tag
99.826	0.161	0.012	0.001	nonzero	nonzero	0.000	0.000	0.000	0.000	0.226	pg1222_o2nofp.cx10a_c8r32
99.723	0.252	0.023	0.002	nonzero	nonzero	nonzero	0.000	0.000	0.000	0.369	pg1323_o2nofp.cx10a_c8r32
99.770	0.213	0.016	0.001	nonzero	nonzero	0.000	0.000	0.000	0.000	0.193	pg1422_o2nofp.cx10a_c8r32
99.778	0.210	0.012	nonzero	nonzero	nonzero	0.000	0.000	0.000	0.000	0.187	pg1517_o2nofp.cx10a_c8r32
99.746	0.238	0.015	0.001	nonzero	nonzero	0.000	0.000	0.000	0.000	0.171	pg1613_o2nofp.cx10a_c8r32
99.762	0.219	0.018	0.001	nonzero	nonzero	0.000	0.000	0.000	0.000	0.196	pg179_o2nofp.cx10a_c8r32
99.781	0.204	0.014	0.001	nonzero	nonzero	0.000	0.000	0.000	0.000	0.185	pg183_o2nofp.cx10b_c8r32
Insert response time histogram
256us	1ms	4ms	16ms	64ms	256ms	1s	4s	16s	gt	max	tag
0.000	0.000	0.000	90.694	9.301	0.004	0.000	0.000	0.000	0.000	0.086	pg1222_o2nofp.cx10a_c8r32
0.000	0.000	0.056	92.467	7.476	0.000	0.000	0.000	0.000	0.000	0.057	pg1323_o2nofp.cx10a_c8r32
0.000	0.000	0.076	94.138	5.785	0.000	0.000	0.000	0.000	0.000	0.058	pg1422_o2nofp.cx10a_c8r32
0.000	0.000	0.031	96.049	3.921	0.000	0.000	0.000	0.000	0.000	0.052	pg1517_o2nofp.cx10a_c8r32
0.000	0.000	0.028	92.968	7.003	0.001	0.000	0.000	0.000	0.000	0.064	pg1613_o2nofp.cx10a_c8r32
0.000	0.000	0.013	91.523	8.464	0.000	0.000	0.000	0.000	0.000	0.055	pg179_o2nofp.cx10a_c8r32
0.000	0.000	0.098	95.185	4.714	0.003	0.000	0.000	0.000	0.000	0.080	pg183_o2nofp.cx10b_c8r32
Delete response time histogram
256us	1ms	4ms	16ms	64ms	256ms	1s	4s	16s	gt	max	tag
0.000	0.000	0.000	97.406	2.594	0.000	0.000	0.000	0.000	0.000	0.061	pg1222_o2nofp.cx10a_c8r32
0.000	0.000	0.000	83.319	16.681	0.000	0.000	0.000	0.000	0.000	0.056	pg1323_o2nofp.cx10a_c8r32
0.000	0.000	0.000	91.874	8.126	0.000	0.000	0.000	0.000	0.000	0.056	pg1422_o2nofp.cx10a_c8r32
0.000	0.000	0.000	96.224	3.776	0.000	0.000	0.000	0.000	0.000	0.055	pg1517_o2nofp.cx10a_c8r32
0.000	0.000	0.000	90.708	9.292	0.000	0.000	0.000	0.000	0.000	0.058	pg1613_o2nofp.cx10a_c8r32
0.000	0.000	0.000	80.895	19.105	0.000	0.000	0.000	0.000	0.000	0.057	pg179_o2nofp.cx10a_c8r32
0.000	0.000	0.000	92.310	7.690	0.001	0.000	0.000	0.000	0.000	0.081	pg183_o2nofp.cx10b_c8r32
qp1000.L6
- qp1000.L6: point queries with 1000 insert/s per client
- Legend for results is here.
- Each entry lists the percentage of responses that fit in that bucket (slower than max time for previous bucket, faster than min time for next bucket).
Query response time histogram
256us	1ms	4ms	16ms	64ms	256ms	1s	4s	16s	gt	max	tag
nonzero	14.702	78.866	6.413	0.019	nonzero	0.000	0.000	0.000	0.000	0.065	pg1222_o2nofp.cx10a_c8r32
nonzero	18.011	80.158	1.827	0.004	nonzero	nonzero	0.000	0.000	0.000	0.276	pg1323_o2nofp.cx10a_c8r32
nonzero	18.437	79.928	1.632	0.002	0.000	0.000	0.000	0.000	0.000	0.030	pg1422_o2nofp.cx10a_c8r32
nonzero	17.269	80.901	1.827	0.002	0.000	0.000	0.000	0.000	0.000	0.038	pg1517_o2nofp.cx10a_c8r32
nonzero	15.156	82.639	2.202	0.003	0.000	0.000	0.000	0.000	0.000	0.045	pg1613_o2nofp.cx10a_c8r32
nonzero	16.202	81.937	1.859	0.002	nonzero	0.000	0.000	0.000	0.000	0.251	pg179_o2nofp.cx10a_c8r32
0.000	15.642	81.768	2.586	0.003	0.000	0.000	0.000	0.000	0.000	0.036	pg183_o2nofp.cx10b_c8r32
Insert response time histogram
256us	1ms	4ms	16ms	64ms	256ms	1s	4s	16s	gt	max	tag
0.000	0.000	0.000	35.686	64.302	0.012	0.000	0.000	0.000	0.000	0.091	pg1222_o2nofp.cx10a_c8r32
0.000	0.000	0.000	89.703	10.297	0.000	0.000	0.000	0.000	0.000	0.057	pg1323_o2nofp.cx10a_c8r32
0.000	0.000	0.000	90.391	9.609	0.000	0.000	0.000	0.000	0.000	0.061	pg1422_o2nofp.cx10a_c8r32
0.000	0.000	0.000	88.727	11.270	0.003	0.000	0.000	0.000	0.000	0.077	pg1517_o2nofp.cx10a_c8r32
0.000	0.000	0.000	85.249	14.749	0.002	0.000	0.000	0.000	0.000	0.087	pg1613_o2nofp.cx10a_c8r32
0.000	0.000	0.000	87.237	12.762	0.000	0.000	0.000	0.000	0.000	0.064	pg179_o2nofp.cx10a_c8r32
0.000	0.000	0.000	81.613	18.386	0.001	0.000	0.000	0.000	0.000	0.064	pg183_o2nofp.cx10b_c8r32
Delete response time histogram
256us	1ms	4ms	16ms	64ms	256ms	1s	4s	16s	gt	max	tag
0.000	0.000	0.000	25.256	74.741	0.003	0.000	0.000	0.000	0.000	0.079	pg1222_o2nofp.cx10a_c8r32
0.000	0.000	0.000	10.712	89.285	0.003	0.000	0.000	0.000	0.000	0.081	pg1323_o2nofp.cx10a_c8r32
0.000	0.000	0.000	9.164	90.833	0.003	0.000	0.000	0.000	0.000	0.077	pg1422_o2nofp.cx10a_c8r32
0.000	0.000	0.000	8.211	91.786	0.003	0.000	0.000	0.000	0.000	0.077	pg1517_o2nofp.cx10a_c8r32
0.000	0.000	0.000	2.793	97.204	0.003	0.000	0.000	0.000	0.000	0.078	pg1613_o2nofp.cx10a_c8r32
0.000	0.000	0.000	0.028	99.969	0.003	0.000	0.000	0.000	0.000	0.072	pg179_o2nofp.cx10a_c8r32
0.000	0.000	0.000	0.917	99.080	0.003	0.000	0.000	0.000	0.000	0.076	pg183_o2nofp.cx10b_c8r32