Introduction
This is a report for the insert benchmark with 800M docs and 4 client(s). It is generated by scripts (bash, awk, sed) and Tufte might not be impressed. An overview of the insert benchmark is here and a short update is here. Below, by DBMS, I mean DBMS+version.config. An example is my8020.c10b40 where my means MySQL, 8020 is version 8.0.20 and c10b40 is the name for the configuration file.
The test server has 8 AMD cores, 32G RAM and an NVMe device for the database. The benchmark was run with 4 clients and there were 1 or 3 connections per client (1 for queries or inserts without rate limits, 1+1 for rate limited inserts+deletes). It uses 4 tables with a table per client. It loads 200M rows per table without secondary indexes, creates 3 secondary indexes per table, then inserts 4m+1m rows per table with a delete per insert to avoid growing the table. It then does 6 read+write tests for 1800s each that do queries as fast as possible with 100,100,500,500,1000,1000 inserts/s and the same for deletes/s per client concurrent with the queries. The database is IO-bound for most benchmark steps. Clients and the DBMS share one server.
The tested DBMS are:
- pg182_o2nofp.cx10b_c8r32 - Postgres 18.2 with my standard config (x10b)
- pg182_o2nofp.cx10b_fpw0_c8r32 - Postgres 18.2 with my standard config except full_page_writes=off
- pg182_o2nofp.cx10b_wallz4_c8r32 - Postgres 18.2 with my standard config except wal_compression=lz4
- pg182_o2nofp.cx10b_fpw0_wallz4_c8r32 - Postgres 18.2 with my standard config except full_page_writes=off and wal_compression=lz4
Contents
- Summary
- l.i0: load without secondary indexes
- l.x: create secondary indexes
- l.i1: continue load after secondary indexes created with 50 inserts per transaction
- l.i2: continue load after secondary indexes created with 5 inserts per transaction
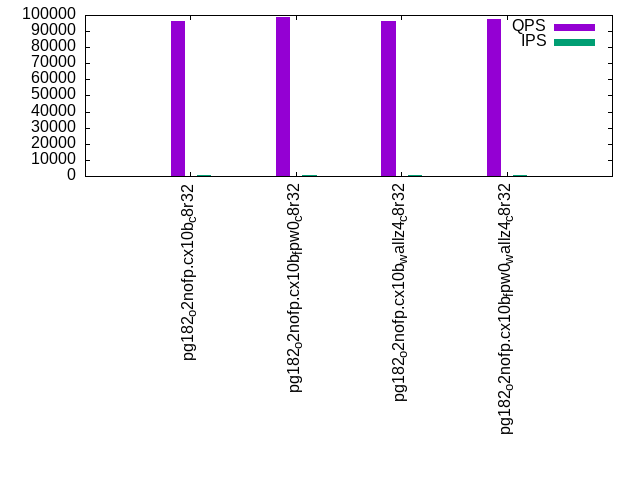
- qr100.L1: range queries with 100 insert/s per client
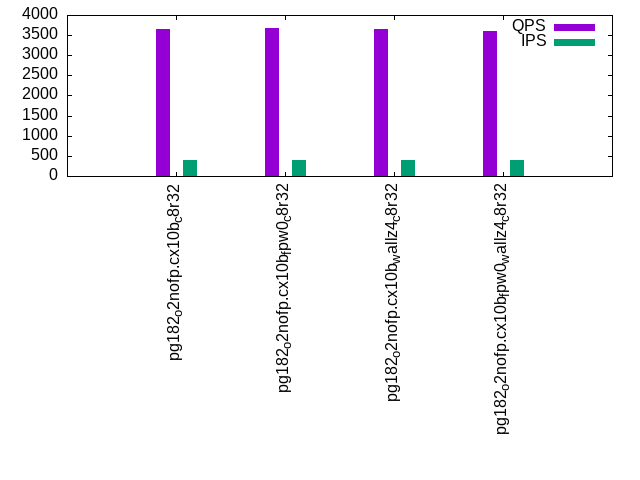
- qp100.L2: point queries with 100 insert/s per client
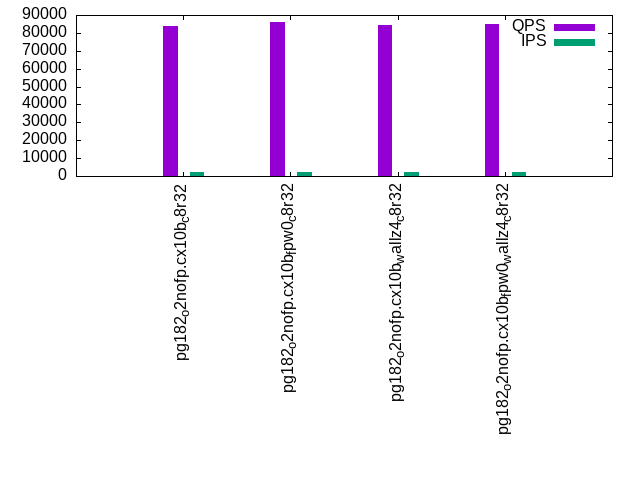
- qr500.L3: range queries with 500 insert/s per client
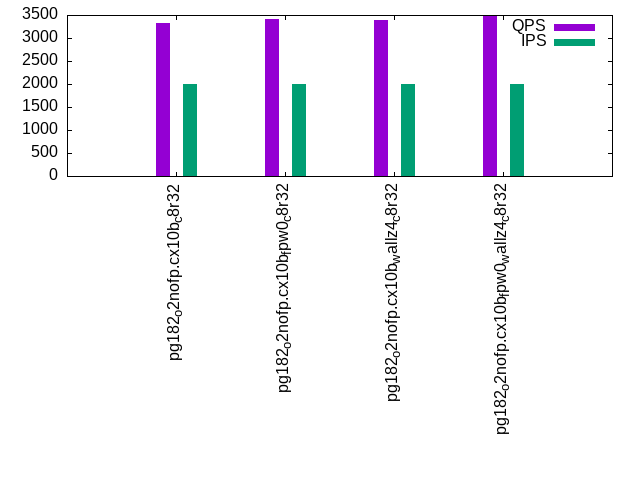
- qp500.L4: point queries with 500 insert/s per client
- qr1000.L5: range queries with 1000 insert/s per client
- qp1000.L6: point queries with 1000 insert/s per client
Summary
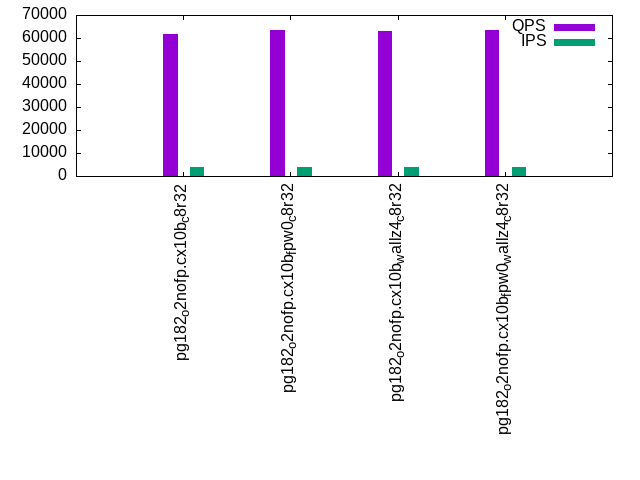
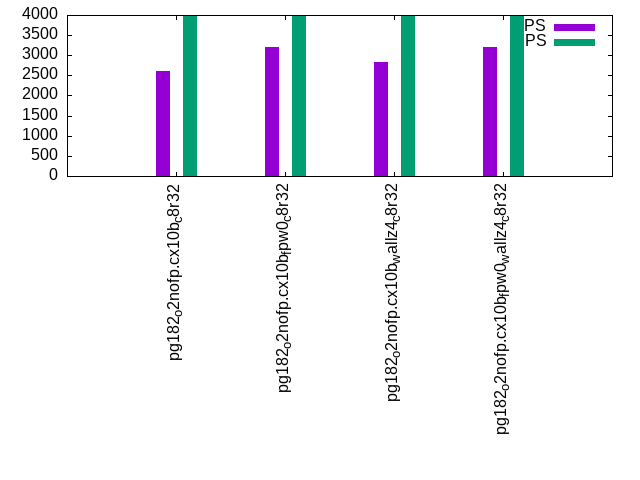
The numbers are inserts/s for l.i0, l.i1 and l.i2, indexed docs (or rows) /s for l.x and queries/s for qr100, qp100 thru qr1000, qp1000" The values are the average rate over the entire test for inserts (IPS) and queries (QPS). The range of values for IPS and QPS is split into 3 parts: bottom 25%, middle 50%, top 25%. Values in the bottom 25% have a red background, values in the top 25% have a green background and values in the middle have no color. A gray background is used for values that can be ignored because the DBMS did not sustain the target insert rate. Red backgrounds are not used when the minimum value is within 80% of the max value.
| dbms | l.i0 | l.x | l.i1 | l.i2 | qr100 | qp100 | qr500 | qp500 | qr1000 | qp1000 |
|---|---|---|---|---|---|---|---|---|---|---|
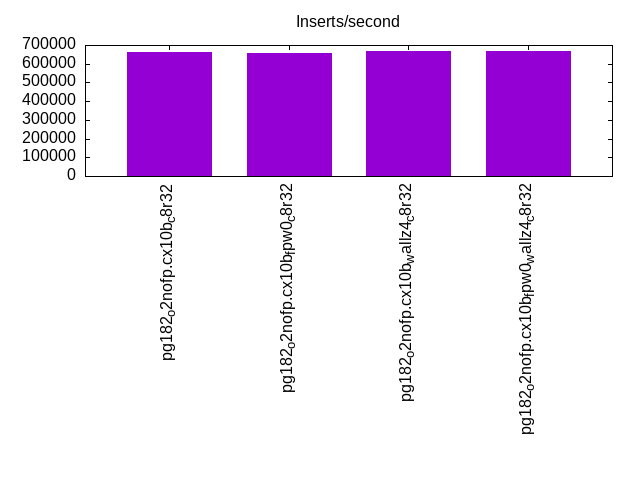
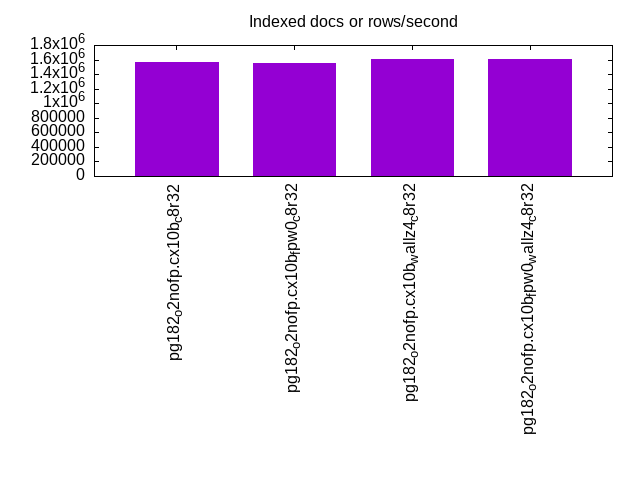
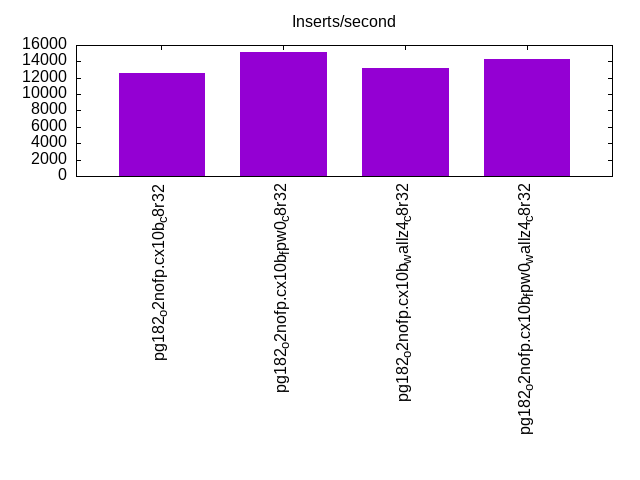
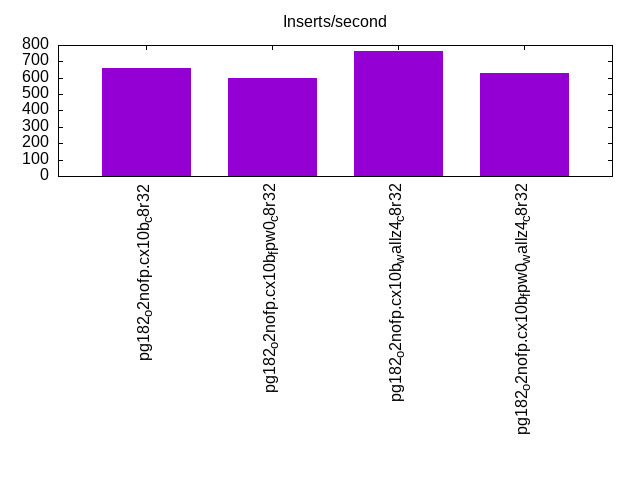
| pg182_o2nofp.cx10b_c8r32 | 660066 | 1571709 | 12618 | 658 | 96102 | 3648 | 83960 | 3317 | 61643 | 2613 |
| pg182_o2nofp.cx10b_fpw0_c8r32 | 656814 | 1559454 | 15152 | 597 | 98649 | 3672 | 86332 | 3404 | 63584 | 3198 |
| pg182_o2nofp.cx10b_wallz4_c8r32 | 665557 | 1603207 | 13169 | 761 | 96560 | 3655 | 84370 | 3394 | 63059 | 2828 |
| pg182_o2nofp.cx10b_fpw0_wallz4_c8r32 | 668338 | 1603207 | 14235 | 626 | 97627 | 3607 | 85022 | 3479 | 63436 | 3200 |
This table has relative throughput, throughput for the DBMS relative to the DBMS in the first line, using the absolute throughput from the previous table. Values less than 0.95 have a yellow background. Values greater than 1.05 have a blue background.
| dbms | l.i0 | l.x | l.i1 | l.i2 | qr100 | qp100 | qr500 | qp500 | qr1000 | qp1000 |
|---|---|---|---|---|---|---|---|---|---|---|
| pg182_o2nofp.cx10b_c8r32 | 1.00 | 1.00 | 1.00 | 1.00 | 1.00 | 1.00 | 1.00 | 1.00 | 1.00 | 1.00 |
| pg182_o2nofp.cx10b_fpw0_c8r32 | 1.00 | 0.99 | 1.20 | 0.91 | 1.03 | 1.01 | 1.03 | 1.03 | 1.03 | 1.22 |
| pg182_o2nofp.cx10b_wallz4_c8r32 | 1.01 | 1.02 | 1.04 | 1.16 | 1.00 | 1.00 | 1.00 | 1.02 | 1.02 | 1.08 |
| pg182_o2nofp.cx10b_fpw0_wallz4_c8r32 | 1.01 | 1.02 | 1.13 | 0.95 | 1.02 | 0.99 | 1.01 | 1.05 | 1.03 | 1.22 |
This lists the average rate of inserts/s for the tests that do inserts concurrent with queries. For such tests the query rate is listed in the table above. The read+write tests are setup so that the insert rate should match the target rate every second. Cells that are not at least 95% of the target have a red background to indicate a failure to satisfy the target.
| dbms | qr100.L1 | qp100.L2 | qr500.L3 | qp500.L4 | qr1000.L5 | qp1000.L6 |
|---|---|---|---|---|---|---|
| pg182_o2nofp.cx10b_c8r32 | 399 | 399 | 1997 | 1996 | 3991 | 3993 |
| pg182_o2nofp.cx10b_fpw0_c8r32 | 399 | 399 | 1997 | 1996 | 3991 | 3991 |
| pg182_o2nofp.cx10b_wallz4_c8r32 | 399 | 399 | 1997 | 1996 | 3991 | 3993 |
| pg182_o2nofp.cx10b_fpw0_wallz4_c8r32 | 399 | 399 | 1997 | 1997 | 3989 | 3993 |
| target | 400 | 400 | 2000 | 2000 | 4000 | 4000 |
l.i0
l.i0: load without secondary indexes. Graphs for performance per 1-second interval are here.
Average throughput:
Insert response time histogram: each cell has the percentage of responses that take <= the time in the header and max is the max response time in seconds. For the max column values in the top 25% of the range have a red background and in the bottom 25% of the range have a green background. The red background is not used when the min value is within 80% of the max value.
| dbms | 256us | 1ms | 4ms | 16ms | 64ms | 256ms | 1s | 4s | 16s | gt | max |
|---|---|---|---|---|---|---|---|---|---|---|---|
| pg182_o2nofp.cx10b_c8r32 | 97.007 | 2.964 | 0.027 | 0.002 | nonzero | 0.076 | |||||
| pg182_o2nofp.cx10b_fpw0_c8r32 | 96.902 | 2.943 | 0.154 | 0.001 | nonzero | 0.100 | |||||
| pg182_o2nofp.cx10b_wallz4_c8r32 | 97.090 | 2.895 | 0.013 | 0.001 | nonzero | 0.078 | |||||
| pg182_o2nofp.cx10b_fpw0_wallz4_c8r32 | 97.035 | 2.950 | 0.015 | nonzero | nonzero | 0.077 |
Performance metrics for the DBMS listed above. Some are normalized by throughput, others are not. Legend for results is here.
ips	qps	rps	rmbps	wps	wmbps	rpq	rkbpq	wpi	wkbpi	csps	cpups	cspq	cpupq	dbgb1	dbgb2	rss	maxop	p50	p99	tag
660066	0	436	3.5	2559.4	273.9	0.001	0.005	0.004	0.425	56324	70.9	0.085	9	76.5	116.6	23.3	0.076	168985	118827	pg182_o2nofp.cx10b_c8r32
656814	0	414	3.3	2535.1	269.3	0.001	0.005	0.004	0.420	56401	70.4	0.086	9	76.5	118.2	23.3	0.100	168882	85991	pg182_o2nofp.cx10b_fpw0_c8r32
665557	0	449	3.6	2583.9	273.0	0.001	0.006	0.004	0.420	56817	70.9	0.085	9	76.5	116.6	23.3	0.078	170079	149485	pg182_o2nofp.cx10b_wallz4_c8r32
668338	0	447	3.6	2591.3	270.8	0.001	0.006	0.004	0.415	56733	71.0	0.085	8	76.5	116.6	23.3	0.077	169681	151683	pg182_o2nofp.cx10b_fpw0_wallz4_c8r32
Average values from iostat.
r/s	rkB/s	rrqm/s	%rrqm	r_await	rareq-s	w/s	wkB/s	wrqm/s	%wrqm	w_await	wareq-s	d/s	dkB/s	drqm/s	%drqm	d_await	dareq-s	f/s	f_await	aqu-sz	%util
437.7	3584.7	0.021	0.111	0.344	4.787	2567.7	281360	165.9	5.656	0.477	109.9	0.333	465.8	0.000	0.000	0.608	158.5	130.8	1.722	1.465	35.02		pg182_o2nofp.cx10b_c8r32
416.1	3411.0	0.216	1.234	0.771	4.913	2543.2	276636	174.2	6.468	0.909	109.2	0.512	4056.5	0.000	0.000	0.909	262.0	125.2	2.772	2.717	45.86		pg182_o2nofp.cx10b_fpw0_c8r32
451.3	3695.1	0.186	0.870	0.330	5.108	2592.2	280462	191.0	6.538	0.521	109.1	0.458	1106.2	0.000	0.000	1.143	235.4	132.9	1.823	1.604	36.99		pg182_o2nofp.cx10b_wallz4_c8r32
449.2	3696.3	0.191	0.386	0.232	13.94	2599.7	278171	203.9	6.779	0.530	108.4	0.427	1569.0	0.000	0.000	0.585	264.5	131.7	1.837	1.650	37.04		pg182_o2nofp.cx10b_fpw0_wallz4_c8r32
l.x
l.x: create secondary indexes.
Average throughput:
Performance metrics for the DBMS listed above. Some are normalized by throughput, others are not. Legend for results is here.
ips	qps	rps	rmbps	wps	wmbps	rpq	rkbpq	wpi	wkbpi	csps	cpups	cspq	cpupq	dbgb1	dbgb2	rss	maxop	p50	p99	tag
1571709	0	5102	451.7	3806.6	453.1	0.003	0.294	0.002	0.295	10351	46.2	0.007	2	153.7	193.7	23.1	0.003	NA	NA	pg182_o2nofp.cx10b_c8r32
1559454	0	4368	436.5	3808.1	458.0	0.003	0.287	0.002	0.301	9759	46.1	0.006	2	153.7	193.7	23.1	0.005	NA	NA	pg182_o2nofp.cx10b_fpw0_c8r32
1603207	0	4807	462.0	3327.6	400.6	0.003	0.295	0.002	0.256	5762	47.7	0.004	2	153.7	193.7	23.1	0.005	NA	NA	pg182_o2nofp.cx10b_wallz4_c8r32
1603207	0	4848	464.9	3333.8	404.6	0.003	0.297	0.002	0.258	5609	48.0	0.003	2	153.7	194.7	23.1	0.004	NA	NA	pg182_o2nofp.cx10b_fpw0_wallz4_c8r32
Average values from iostat.
r/s	rkB/s	rrqm/s	%rrqm	r_await	rareq-s	w/s	wkB/s	wrqm/s	%wrqm	w_await	wareq-s	d/s	dkB/s	drqm/s	%drqm	d_await	dareq-s	f/s	f_await	aqu-sz	%util
5125.5	463679	0.742	0.727	0.118	84.83	3836.5	467658	144.9	2.566	0.497	122.7	3.664	92290.5	0.000	0.000	0.454	1353.9	43.36	2.060	2.917	47.77		pg182_o2nofp.cx10b_c8r32
4383.1	447867	0.362	0.013	0.140	95.02	3838.6	472791	162.0	2.836	0.504	124.1	4.330	110917	0.000	0.000	0.520	1472.0	44.06	1.982	2.986	48.94		pg182_o2nofp.cx10b_fpw0_c8r32
4827.1	474307	0.067	0.001	0.117	90.90	3352.0	413186	83.21	1.810	0.385	124.0	5.214	146345	0.000	0.000	0.504	2028.8	25.80	1.964	2.050	43.75		pg182_o2nofp.cx10b_wallz4_c8r32
4869.5	477260	0.000	0.000	0.130	91.17	3362.6	417846	55.14	1.247	0.360	124.9	3.414	90090.5	0.000	0.000	0.511	1392.0	16.83	2.015	1.872	42.70		pg182_o2nofp.cx10b_fpw0_wallz4_c8r32
l.i1
l.i1: continue load after secondary indexes created with 50 inserts per transaction. Graphs for performance per 1-second interval are here.
Average throughput:
Insert response time histogram: each cell has the percentage of responses that take <= the time in the header and max is the max response time in seconds. For the max column values in the top 25% of the range have a red background and in the bottom 25% of the range have a green background. The red background is not used when the min value is within 80% of the max value.
| dbms | 256us | 1ms | 4ms | 16ms | 64ms | 256ms | 1s | 4s | 16s | gt | max |
|---|---|---|---|---|---|---|---|---|---|---|---|
| pg182_o2nofp.cx10b_c8r32 | 0.397 | 87.639 | 11.962 | 0.002 | 0.092 | ||||||
| pg182_o2nofp.cx10b_fpw0_c8r32 | 9.368 | 90.565 | 0.068 | 0.030 | |||||||
| pg182_o2nofp.cx10b_wallz4_c8r32 | 0.373 | 95.857 | 3.770 | nonzero | 0.066 | ||||||
| pg182_o2nofp.cx10b_fpw0_wallz4_c8r32 | 12.503 | 87.362 | 0.135 | 0.044 |
Delete response time histogram: each cell has the percentage of responses that take <= the time in the header and max is the max response time in seconds. For the max column values in the top 25% of the range have a red background and in the bottom 25% of the range have a green background. The red background is not used when the min value is within 80% of the max value.
| dbms | 256us | 1ms | 4ms | 16ms | 64ms | 256ms | 1s | 4s | 16s | gt | max |
|---|---|---|---|---|---|---|---|---|---|---|---|
| pg182_o2nofp.cx10b_c8r32 | 0.001 | 2.423 | 10.089 | 67.754 | 19.733 | 0.038 | |||||
| pg182_o2nofp.cx10b_fpw0_c8r32 | 0.002 | 2.782 | 9.724 | 78.720 | 8.772 | 0.034 | |||||
| pg182_o2nofp.cx10b_wallz4_c8r32 | 0.001 | 2.529 | 10.063 | 77.374 | 10.032 | 0.031 | |||||
| pg182_o2nofp.cx10b_fpw0_wallz4_c8r32 | 0.001 | 2.809 | 9.750 | 76.260 | 11.180 | 0.034 |
Performance metrics for the DBMS listed above. Some are normalized by throughput, others are not. Legend for results is here.
ips	qps	rps	rmbps	wps	wmbps	rpq	rkbpq	wpi	wkbpi	csps	cpups	cspq	cpupq	dbgb1	dbgb2	rss	maxop	p50	p99	tag
12618	0	14607	116.2	16722.9	280.7	1.158	9.433	1.325	22.783	33159	52.3	2.628	332	156.3	196.3	23.3	0.092	2300	1750	pg182_o2nofp.cx10b_c8r32
15152	0	17566	143.2	16691.8	143.0	1.159	9.679	1.102	9.662	38474	53.9	2.539	285	156.3	196.3	23.4	0.030	4100	1600	pg182_o2nofp.cx10b_fpw0_c8r32
13169	0	15377	128.7	15459.2	213.8	1.168	10.008	1.174	16.629	33938	50.8	2.577	309	156.3	196.3	23.4	0.066	2300	1900	pg182_o2nofp.cx10b_wallz4_c8r32
14235	0	16486	137.6	15593.7	132.2	1.158	9.897	1.095	9.507	36153	51.2	2.540	288	156.3	196.3	23.3	0.044	4149	3144	pg182_o2nofp.cx10b_fpw0_wallz4_c8r32
Average values from iostat.
r/s	rkB/s	rrqm/s	%rrqm	r_await	rareq-s	w/s	wkB/s	wrqm/s	%wrqm	w_await	wareq-s	d/s	dkB/s	drqm/s	%drqm	d_await	dareq-s	f/s	f_await	aqu-sz	%util
14557.6	118638	0.000	0.000	0.140	8.136	16783.5	287974	189.5	1.298	0.704	19.40	0.204	2796.7	0.000	0.000	0.063	362.0	129.1	2.993	14.41	83.26		pg182_o2nofp.cx10b_c8r32
17460.7	145832	0.003	0.000	0.043	8.341	16770.9	147041	9.680	0.229	0.056	11.76	0.007	0.034	0.000	0.000	0.029	0.092	10.69	1.719	1.823	55.50		pg182_o2nofp.cx10b_fpw0_c8r32
15375.9	131820	0.001	0.000	0.089	8.961	15520.0	219646	90.29	0.721	0.366	17.62	0.023	55.28	0.000	0.000	0.050	74.95	85.51	2.689	7.790	69.48		pg182_o2nofp.cx10b_wallz4_c8r32
16459.8	140702	0.004	0.000	0.044	8.648	15662.0	135902	13.01	0.507	0.063	11.60	0.075	955.2	0.000	0.000	0.010	67.33	9.957	1.876	1.638	52.88		pg182_o2nofp.cx10b_fpw0_wallz4_c8r32
l.i2
l.i2: continue load after secondary indexes created with 5 inserts per transaction. Graphs for performance per 1-second interval are here.
Average throughput:
Insert response time histogram: each cell has the percentage of responses that take <= the time in the header and max is the max response time in seconds. For the max column values in the top 25% of the range have a red background and in the bottom 25% of the range have a green background. The red background is not used when the min value is within 80% of the max value.
| dbms | 256us | 1ms | 4ms | 16ms | 64ms | 256ms | 1s | 4s | 16s | gt | max |
|---|---|---|---|---|---|---|---|---|---|---|---|
| pg182_o2nofp.cx10b_c8r32 | 0.051 | 37.574 | 59.858 | 2.479 | 0.039 | 0.030 | |||||
| pg182_o2nofp.cx10b_fpw0_c8r32 | nonzero | 56.836 | 42.657 | 0.506 | nonzero | 0.019 | |||||
| pg182_o2nofp.cx10b_wallz4_c8r32 | 0.001 | 26.071 | 72.583 | 1.344 | 0.002 | 0.021 | |||||
| pg182_o2nofp.cx10b_fpw0_wallz4_c8r32 | 0.047 | 54.837 | 44.150 | 0.965 | 0.001 | 0.021 |
Delete response time histogram: each cell has the percentage of responses that take <= the time in the header and max is the max response time in seconds. For the max column values in the top 25% of the range have a red background and in the bottom 25% of the range have a green background. The red background is not used when the min value is within 80% of the max value.
| dbms | 256us | 1ms | 4ms | 16ms | 64ms | 256ms | 1s | 4s | 16s | gt | max |
|---|---|---|---|---|---|---|---|---|---|---|---|
| pg182_o2nofp.cx10b_c8r32 | 0.296 | 6.493 | 3.345 | 6.763 | 83.102 | 0.001 | 0.084 | ||||
| pg182_o2nofp.cx10b_fpw0_c8r32 | 5.264 | 94.735 | 0.001 | 0.089 | |||||||
| pg182_o2nofp.cx10b_wallz4_c8r32 | 0.311 | 1.627 | 0.004 | 13.896 | 84.163 | 0.001 | 0.083 | ||||
| pg182_o2nofp.cx10b_fpw0_wallz4_c8r32 | 0.371 | 6.183 | 2.294 | 6.117 | 85.035 | 0.001 | 0.090 |
Performance metrics for the DBMS listed above. Some are normalized by throughput, others are not. Legend for results is here.
ips	qps	rps	rmbps	wps	wmbps	rpq	rkbpq	wpi	wkbpi	csps	cpups	cspq	cpupq	dbgb1	dbgb2	rss	maxop	p50	p99	tag
658	0	800	8.9	1247.9	20.0	1.215	13.815	1.896	31.054	4113	32.5	6.250	3951	156.9	197.0	23.3	0.030	155	145	pg182_o2nofp.cx10b_c8r32
597	0	632	5.0	978.9	8.8	1.060	8.601	1.640	15.147	3679	38.8	6.163	5199	157.0	196.5	23.4	0.019	150	140	pg182_o2nofp.cx10b_fpw0_c8r32
761	0	946	10.9	1464.9	19.5	1.243	14.701	1.926	26.222	4720	38.4	6.204	4038	157.0	197.0	23.4	0.021	155	140	pg182_o2nofp.cx10b_wallz4_c8r32
626	0	751	8.6	1137.8	10.9	1.200	14.059	1.819	17.871	3817	32.7	6.101	4182	156.9	195.5	23.3	0.021	280	135	pg182_o2nofp.cx10b_fpw0_wallz4_c8r32
Average values from iostat.
r/s	rkB/s	rrqm/s	%rrqm	r_await	rareq-s	w/s	wkB/s	wrqm/s	%wrqm	w_await	wareq-s	d/s	dkB/s	drqm/s	%drqm	d_await	dareq-s	f/s	f_await	aqu-sz	%util
799.5	9092.2	0.000	0.000	0.102	8.468	1248.0	20437.0	13.17	1.362	0.183	17.98	0.008	89.26	0.000	0.000	0.004	18.01	12.33	3.307	0.699	11.38		pg182_o2nofp.cx10b_c8r32
632.4	5134.0	0.000	0.000	0.068	8.118	978.9	9043.1	8.608	1.235	0.108	9.648	0.007	71.24	0.000	0.000	0.004	10.87	5.798	3.182	0.146	7.438		pg182_o2nofp.cx10b_fpw0_c8r32
946.1	11188.0	0.051	0.002	0.090	9.088	1465.4	19957.3	10.31	0.744	0.117	12.74	0.002	0.274	0.000	0.000	0.005	0.376	9.599	3.225	0.390	11.71		pg182_o2nofp.cx10b_wallz4_c8r32
750.6	8796.2	0.000	0.000	0.074	8.850	1137.8	11181.9	8.348	1.526	0.140	10.08	0.018	246.5	0.000	0.000	0.006	34.65	6.599	3.310	0.262	7.849		pg182_o2nofp.cx10b_fpw0_wallz4_c8r32
qr100.L1
qr100.L1: range queries with 100 insert/s per client. Graphs for performance per 1-second interval are here.
Average throughput:
Query response time histogram: each cell has the percentage of responses that take <= the time in the header and max is the max response time in seconds. For max values in the top 25% of the range have a red background and in the bottom 25% of the range have a green background. The red background is not used when the min value is within 80% of the max value.
| dbms | 256us | 1ms | 4ms | 16ms | 64ms | 256ms | 1s | 4s | 16s | gt | max |
|---|---|---|---|---|---|---|---|---|---|---|---|
| pg182_o2nofp.cx10b_c8r32 | 99.986 | 0.014 | nonzero | nonzero | 0.010 | ||||||
| pg182_o2nofp.cx10b_fpw0_c8r32 | 99.988 | 0.012 | nonzero | nonzero | 0.010 | ||||||
| pg182_o2nofp.cx10b_wallz4_c8r32 | 99.987 | 0.013 | nonzero | nonzero | 0.010 | ||||||
| pg182_o2nofp.cx10b_fpw0_wallz4_c8r32 | 99.986 | 0.014 | nonzero | nonzero | 0.013 |
Insert response time histogram: each cell has the percentage of responses that take <= the time in the header and max is the max response time in seconds. For max values in the top 25% of the range have a red background and in the bottom 25% of the range have a green background. The red background is not used when the min value is within 80% of the max value.
| dbms | 256us | 1ms | 4ms | 16ms | 64ms | 256ms | 1s | 4s | 16s | gt | max |
|---|---|---|---|---|---|---|---|---|---|---|---|
| pg182_o2nofp.cx10b_c8r32 | 0.083 | 99.014 | 0.903 | 0.025 | |||||||
| pg182_o2nofp.cx10b_fpw0_c8r32 | 0.146 | 99.847 | 0.007 | 0.021 | |||||||
| pg182_o2nofp.cx10b_wallz4_c8r32 | 99.896 | 0.104 | 0.023 | ||||||||
| pg182_o2nofp.cx10b_fpw0_wallz4_c8r32 | 1.035 | 98.958 | 0.007 | 0.023 |
Delete response time histogram: each cell has the percentage of responses that take <= the time in the header and max is the max response time in seconds. For max values in the top 25% of the range have a red background and in the bottom 25% of the range have a green background. The red background is not used when the min value is within 80% of the max value.
| dbms | 256us | 1ms | 4ms | 16ms | 64ms | 256ms | 1s | 4s | 16s | gt | max |
|---|---|---|---|---|---|---|---|---|---|---|---|
| pg182_o2nofp.cx10b_c8r32 | 66.271 | 33.701 | 0.028 | 0.004 | |||||||
| pg182_o2nofp.cx10b_fpw0_c8r32 | 0.042 | 78.299 | 21.660 | 0.004 | |||||||
| pg182_o2nofp.cx10b_wallz4_c8r32 | 67.924 | 32.076 | 0.003 | ||||||||
| pg182_o2nofp.cx10b_fpw0_wallz4_c8r32 | 0.028 | 74.868 | 25.097 | 0.007 | 0.009 |
Performance metrics for the DBMS listed above. Some are normalized by throughput, others are not. Legend for results is here.
ips	qps	rps	rmbps	wps	wmbps	rpq	rkbpq	wpi	wkbpi	csps	cpups	cspq	cpupq	dbgb1	dbgb2	rss	maxop	p50	p99	tag
399	96102	457	3.7	265.8	7.5	0.005	0.039	0.666	19.168	367250	42.4	3.821	35	156.9	197.0	23.3	0.010	24253	23518	pg182_o2nofp.cx10b_c8r32
399	98649	454	3.6	222.9	2.1	0.005	0.038	0.558	5.484	376916	41.5	3.821	34	157.0	195.7	23.4	0.010	24734	24046	pg182_o2nofp.cx10b_fpw0_c8r32
399	96560	455	3.7	248.0	5.7	0.005	0.039	0.621	14.495	369078	42.3	3.822	35	157.0	197.0	23.4	0.010	23997	23597	pg182_o2nofp.cx10b_wallz4_c8r32
399	97627	453	3.8	221.4	2.1	0.005	0.040	0.555	5.420	372970	42.2	3.820	35	157.0	194.9	23.3	0.013	24526	23886	pg182_o2nofp.cx10b_fpw0_wallz4_c8r32
Average values from iostat.
r/s	rkB/s	rrqm/s	%rrqm	r_await	rareq-s	w/s	wkB/s	wrqm/s	%wrqm	w_await	wareq-s	d/s	dkB/s	drqm/s	%drqm	d_await	dareq-s	f/s	f_await	aqu-sz	%util
444.9	3676.7	0.000	0.000	0.114	8.265	266.4	7662.6	4.685	3.402	0.307	50.90	0.001	0.002	0.000	0.000	0.003	0.011	6.379	2.001	0.106	3.543		pg182_o2nofp.cx10b_c8r32
441.1	3614.7	0.000	0.000	0.067	8.193	223.5	2195.4	6.035	9.764	0.477	13.00	0.002	9.132	0.000	0.000	0.008	45.66	2.534	2.296	0.063	2.745		pg182_o2nofp.cx10b_fpw0_c8r32
442.9	3646.4	0.000	0.000	0.081	8.234	248.6	5796.0	3.649	3.219	0.346	44.47	0.001	0.002	0.000	0.000	0.003	0.011	5.092	1.932	0.085	6.789		pg182_o2nofp.cx10b_wallz4_c8r32
440.3	3742.6	0.000	0.000	0.068	8.498	222.0	2170.0	5.222	8.100	0.438	12.91	0.001	9.130	0.000	0.000	0.006	45.65	2.522	1.992	0.062	2.483		pg182_o2nofp.cx10b_fpw0_wallz4_c8r32
qp100.L2
qp100.L2: point queries with 100 insert/s per client. Graphs for performance per 1-second interval are here.
Average throughput:
Query response time histogram: each cell has the percentage of responses that take <= the time in the header and max is the max response time in seconds. For max values in the top 25% of the range have a red background and in the bottom 25% of the range have a green background. The red background is not used when the min value is within 80% of the max value.
| dbms | 256us | 1ms | 4ms | 16ms | 64ms | 256ms | 1s | 4s | 16s | gt | max |
|---|---|---|---|---|---|---|---|---|---|---|---|
| pg182_o2nofp.cx10b_c8r32 | nonzero | 36.430 | 63.454 | 0.116 | nonzero | 0.026 | |||||
| pg182_o2nofp.cx10b_fpw0_c8r32 | nonzero | 35.877 | 64.074 | 0.049 | nonzero | 0.023 | |||||
| pg182_o2nofp.cx10b_wallz4_c8r32 | nonzero | 36.077 | 63.833 | 0.089 | nonzero | 0.026 | |||||
| pg182_o2nofp.cx10b_fpw0_wallz4_c8r32 | nonzero | 34.906 | 64.983 | 0.111 | nonzero | nonzero | nonzero | 0.445 |
Insert response time histogram: each cell has the percentage of responses that take <= the time in the header and max is the max response time in seconds. For max values in the top 25% of the range have a red background and in the bottom 25% of the range have a green background. The red background is not used when the min value is within 80% of the max value.
| dbms | 256us | 1ms | 4ms | 16ms | 64ms | 256ms | 1s | 4s | 16s | gt | max |
|---|---|---|---|---|---|---|---|---|---|---|---|
| pg182_o2nofp.cx10b_c8r32 | 95.958 | 4.035 | 0.007 | 0.075 | |||||||
| pg182_o2nofp.cx10b_fpw0_c8r32 | 99.889 | 0.111 | 0.063 | ||||||||
| pg182_o2nofp.cx10b_wallz4_c8r32 | 97.688 | 2.312 | 0.034 | ||||||||
| pg182_o2nofp.cx10b_fpw0_wallz4_c8r32 | 98.014 | 1.986 | 0.040 |
Delete response time histogram: each cell has the percentage of responses that take <= the time in the header and max is the max response time in seconds. For max values in the top 25% of the range have a red background and in the bottom 25% of the range have a green background. The red background is not used when the min value is within 80% of the max value.
| dbms | 256us | 1ms | 4ms | 16ms | 64ms | 256ms | 1s | 4s | 16s | gt | max |
|---|---|---|---|---|---|---|---|---|---|---|---|
| pg182_o2nofp.cx10b_c8r32 | 3.778 | 94.792 | 1.431 | 0.010 | |||||||
| pg182_o2nofp.cx10b_fpw0_c8r32 | 2.722 | 97.111 | 0.167 | 0.008 | |||||||
| pg182_o2nofp.cx10b_wallz4_c8r32 | 3.104 | 96.840 | 0.056 | 0.009 | |||||||
| pg182_o2nofp.cx10b_fpw0_wallz4_c8r32 | 3.139 | 96.729 | 0.118 | 0.014 | 0.031 |
Performance metrics for the DBMS listed above. Some are normalized by throughput, others are not. Legend for results is here.
ips	qps	rps	rmbps	wps	wmbps	rpq	rkbpq	wpi	wkbpi	csps	cpups	cspq	cpupq	dbgb1	dbgb2	rss	maxop	p50	p99	tag
399	3648	44813	356.4	1372.1	15.7	12.284	100.033	3.438	40.378	99553	11.8	27.289	259	157.0	197.0	23.3	0.026	944	624	pg182_o2nofp.cx10b_c8r32
399	3672	45314	354.3	1321.2	10.6	12.339	98.787	3.310	27.124	100708	11.3	27.424	246	157.0	195.5	23.4	0.023	928	624	pg182_o2nofp.cx10b_fpw0_c8r32
399	3655	44859	350.8	1355.8	14.0	12.274	98.293	3.397	35.897	99773	11.7	27.300	256	157.0	197.0	23.4	0.026	927	608	pg182_o2nofp.cx10b_wallz4_c8r32
399	3607	44399	347.6	1319.9	10.5	12.310	98.694	3.307	27.057	99678	11.5	27.635	255	157.0	194.7	23.3	0.445	943	480	pg182_o2nofp.cx10b_fpw0_wallz4_c8r32
Average values from iostat.
r/s	rkB/s	rrqm/s	%rrqm	r_await	rareq-s	w/s	wkB/s	wrqm/s	%wrqm	w_await	wareq-s	d/s	dkB/s	drqm/s	%drqm	d_await	dareq-s	f/s	f_await	aqu-sz	%util
44853.4	365272	0.000	0.000	0.070	8.143	1360.4	16025.6	8.257	0.847	0.064	13.36	0.001	0.002	0.000	0.000	0.006	0.011	7.816	1.892	3.090	99.61		pg182_o2nofp.cx10b_c8r32
45355.8	363109	0.000	0.000	0.070	8.007	1309.7	10732.0	8.235	0.908	0.032	8.261	0.008	109.5	0.000	0.000	0.005	39.13	3.978	1.862	3.030	99.63		pg182_o2nofp.cx10b_fpw0_c8r32
44900.8	359564	0.000	0.000	0.070	8.010	1344.3	14237.1	6.340	0.670	0.044	11.70	0.001	0.002	0.000	0.000	0.003	0.011	6.302	1.871	3.059	99.62		pg182_o2nofp.cx10b_wallz4_c8r32
44437.6	356282	0.212	0.001	0.069	8.018	1308.2	10704.6	7.441	0.838	0.031	8.245	0.007	100.4	0.000	0.000	0.006	45.65	3.970	1.878	2.951	99.04		pg182_o2nofp.cx10b_fpw0_wallz4_c8r32
qr500.L3
qr500.L3: range queries with 500 insert/s per client. Graphs for performance per 1-second interval are here.
Average throughput:
Query response time histogram: each cell has the percentage of responses that take <= the time in the header and max is the max response time in seconds. For max values in the top 25% of the range have a red background and in the bottom 25% of the range have a green background. The red background is not used when the min value is within 80% of the max value.
| dbms | 256us | 1ms | 4ms | 16ms | 64ms | 256ms | 1s | 4s | 16s | gt | max |
|---|---|---|---|---|---|---|---|---|---|---|---|
| pg182_o2nofp.cx10b_c8r32 | 99.951 | 0.046 | 0.003 | nonzero | nonzero | 0.047 | |||||
| pg182_o2nofp.cx10b_fpw0_c8r32 | 99.964 | 0.035 | 0.001 | nonzero | nonzero | 0.025 | |||||
| pg182_o2nofp.cx10b_wallz4_c8r32 | 99.954 | 0.044 | 0.002 | nonzero | nonzero | 0.029 | |||||
| pg182_o2nofp.cx10b_fpw0_wallz4_c8r32 | 99.960 | 0.039 | 0.001 | nonzero | nonzero | 0.026 |
Insert response time histogram: each cell has the percentage of responses that take <= the time in the header and max is the max response time in seconds. For max values in the top 25% of the range have a red background and in the bottom 25% of the range have a green background. The red background is not used when the min value is within 80% of the max value.
| dbms | 256us | 1ms | 4ms | 16ms | 64ms | 256ms | 1s | 4s | 16s | gt | max |
|---|---|---|---|---|---|---|---|---|---|---|---|
| pg182_o2nofp.cx10b_c8r32 | 0.003 | 97.667 | 2.331 | 0.057 | |||||||
| pg182_o2nofp.cx10b_fpw0_c8r32 | 0.018 | 99.819 | 0.163 | 0.032 | |||||||
| pg182_o2nofp.cx10b_wallz4_c8r32 | 98.276 | 1.724 | 0.034 | ||||||||
| pg182_o2nofp.cx10b_fpw0_wallz4_c8r32 | 0.011 | 99.853 | 0.136 | 0.038 |
Delete response time histogram: each cell has the percentage of responses that take <= the time in the header and max is the max response time in seconds. For max values in the top 25% of the range have a red background and in the bottom 25% of the range have a green background. The red background is not used when the min value is within 80% of the max value.
| dbms | 256us | 1ms | 4ms | 16ms | 64ms | 256ms | 1s | 4s | 16s | gt | max |
|---|---|---|---|---|---|---|---|---|---|---|---|
| pg182_o2nofp.cx10b_c8r32 | 26.536 | 73.382 | 0.082 | 0.037 | |||||||
| pg182_o2nofp.cx10b_fpw0_c8r32 | 26.667 | 73.276 | 0.057 | 0.031 | |||||||
| pg182_o2nofp.cx10b_wallz4_c8r32 | 25.743 | 74.192 | 0.065 | 0.039 | |||||||
| pg182_o2nofp.cx10b_fpw0_wallz4_c8r32 | 29.565 | 70.396 | 0.039 | 0.030 |
Performance metrics for the DBMS listed above. Some are normalized by throughput, others are not. Legend for results is here.
ips	qps	rps	rmbps	wps	wmbps	rpq	rkbpq	wpi	wkbpi	csps	cpups	cspq	cpupq	dbgb1	dbgb2	rss	maxop	p50	p99	tag
1997	83960	2642	22.1	2402.5	41.0	0.031	0.270	1.203	21.016	318925	48.5	3.799	46	157.1	197.2	23.3	0.047	21070	19662	pg182_o2nofp.cx10b_c8r32
1997	86332	2617	21.1	2204.4	18.6	0.030	0.251	1.104	9.540	327821	48.3	3.797	45	157.2	195.4	23.4	0.025	21646	20206	pg182_o2nofp.cx10b_fpw0_c8r32
1997	84370	2622	21.1	2353.0	32.4	0.031	0.256	1.178	16.631	319515	49.2	3.787	47	157.1	194.8	23.4	0.029	21118	19566	pg182_o2nofp.cx10b_wallz4_c8r32
1997	85022	2629	21.2	2205.4	18.5	0.031	0.256	1.105	9.506	323518	48.5	3.805	46	157.0	194.4	16.5	0.026	21406	20222	pg182_o2nofp.cx10b_fpw0_wallz4_c8r32
Average values from iostat.
r/s	rkB/s	rrqm/s	%rrqm	r_await	rareq-s	w/s	wkB/s	wrqm/s	%wrqm	w_await	wareq-s	d/s	dkB/s	drqm/s	%drqm	d_await	dareq-s	f/s	f_await	aqu-sz	%util
2613.2	22315.7	0.015	0.001	0.088	8.520	2407.2	42001.3	15.45	0.920	0.208	28.95	0.072	1050.0	0.000	0.000	0.011	130.4	23.07	1.820	0.724	15.48		pg182_o2nofp.cx10b_c8r32
2587.9	21289.5	0.000	0.000	0.058	8.244	2209.1	19087.8	6.560	2.168	0.093	12.89	0.015	191.8	0.000	0.000	0.007	38.39	3.389	1.837	0.235	11.50		pg182_o2nofp.cx10b_fpw0_c8r32
2593.4	21289.9	0.000	0.000	0.076	8.216	2357.8	33249.0	7.485	0.632	0.159	25.16	0.092	1378.4	0.000	0.000	0.005	87.40	15.58	1.796	0.536	14.31		pg182_o2nofp.cx10b_wallz4_c8r32
2600.9	21404.9	0.154	0.005	0.057	8.237	2210.4	19021.4	6.091	1.843	0.097	12.73	0.016	200.9	0.000	0.000	0.002	35.89	3.500	1.885	0.238	12.68		pg182_o2nofp.cx10b_fpw0_wallz4_c8r32
qp500.L4
qp500.L4: point queries with 500 insert/s per client. Graphs for performance per 1-second interval are here.
Average throughput:
Query response time histogram: each cell has the percentage of responses that take <= the time in the header and max is the max response time in seconds. For max values in the top 25% of the range have a red background and in the bottom 25% of the range have a green background. The red background is not used when the min value is within 80% of the max value.
| dbms | 256us | 1ms | 4ms | 16ms | 64ms | 256ms | 1s | 4s | 16s | gt | max |
|---|---|---|---|---|---|---|---|---|---|---|---|
| pg182_o2nofp.cx10b_c8r32 | nonzero | 26.979 | 72.331 | 0.688 | 0.001 | nonzero | nonzero | 0.358 | |||
| pg182_o2nofp.cx10b_fpw0_c8r32 | nonzero | 26.112 | 73.750 | 0.137 | 0.001 | nonzero | nonzero | 0.463 | |||
| pg182_o2nofp.cx10b_wallz4_c8r32 | nonzero | 27.296 | 72.335 | 0.369 | nonzero | 0.026 | |||||
| pg182_o2nofp.cx10b_fpw0_wallz4_c8r32 | nonzero | 27.798 | 72.129 | 0.073 | 0.015 |
Insert response time histogram: each cell has the percentage of responses that take <= the time in the header and max is the max response time in seconds. For max values in the top 25% of the range have a red background and in the bottom 25% of the range have a green background. The red background is not used when the min value is within 80% of the max value.
| dbms | 256us | 1ms | 4ms | 16ms | 64ms | 256ms | 1s | 4s | 16s | gt | max |
|---|---|---|---|---|---|---|---|---|---|---|---|
| pg182_o2nofp.cx10b_c8r32 | 93.015 | 6.975 | 0.006 | 0.004 | 0.427 | ||||||
| pg182_o2nofp.cx10b_fpw0_c8r32 | 98.946 | 1.047 | 0.007 | 0.251 | |||||||
| pg182_o2nofp.cx10b_wallz4_c8r32 | 97.665 | 2.335 | 0.037 | ||||||||
| pg182_o2nofp.cx10b_fpw0_wallz4_c8r32 | 99.885 | 0.115 | 0.023 |
Delete response time histogram: each cell has the percentage of responses that take <= the time in the header and max is the max response time in seconds. For max values in the top 25% of the range have a red background and in the bottom 25% of the range have a green background. The red background is not used when the min value is within 80% of the max value.
| dbms | 256us | 1ms | 4ms | 16ms | 64ms | 256ms | 1s | 4s | 16s | gt | max |
|---|---|---|---|---|---|---|---|---|---|---|---|
| pg182_o2nofp.cx10b_c8r32 | 95.161 | 4.835 | 0.004 | 0.068 | |||||||
| pg182_o2nofp.cx10b_fpw0_c8r32 | 94.419 | 5.576 | 0.004 | 0.238 | |||||||
| pg182_o2nofp.cx10b_wallz4_c8r32 | 95.750 | 4.250 | 0.041 | ||||||||
| pg182_o2nofp.cx10b_fpw0_wallz4_c8r32 | 96.451 | 3.549 | 0.041 |
Performance metrics for the DBMS listed above. Some are normalized by throughput, others are not. Legend for results is here.
ips	qps	rps	rmbps	wps	wmbps	rpq	rkbpq	wpi	wkbpi	csps	cpups	cspq	cpupq	dbgb1	dbgb2	rss	maxop	p50	p99	tag
1996	3317	45234	358.7	5108.0	61.8	13.637	110.730	2.560	31.715	97797	20.6	29.483	497	157.4	197.4	23.3	0.358	864	512	pg182_o2nofp.cx10b_c8r32
1996	3404	46326	363.3	4947.4	40.0	13.611	109.291	2.479	20.503	100669	20.9	29.578	491	157.5	194.6	23.4	0.463	880	496	pg182_o2nofp.cx10b_fpw0_c8r32
1996	3394	46196	361.9	5033.6	51.5	13.613	109.191	2.522	26.411	99752	20.2	29.395	476	157.4	194.8	23.4	0.026	848	560	pg182_o2nofp.cx10b_wallz4_c8r32
1997	3479	47196	370.0	4953.7	39.9	13.567	108.920	2.481	20.469	101770	20.1	29.254	462	157.1	193.4	20.7	0.015	880	608	pg182_o2nofp.cx10b_fpw0_wallz4_c8r32
Average values from iostat.
r/s	rkB/s	rrqm/s	%rrqm	r_await	rareq-s	w/s	wkB/s	wrqm/s	%wrqm	w_await	wareq-s	d/s	dkB/s	drqm/s	%drqm	d_await	dareq-s	f/s	f_await	aqu-sz	%util
45277.4	367659	0.169	0.000	0.071	8.122	5080.4	63058.6	19.13	0.472	0.099	12.87	0.012	9.571	0.000	0.000	0.070	24.64	24.72	1.836	3.698	99.51		pg182_o2nofp.cx10b_c8r32
46370.8	372329	0.283	0.001	0.060	8.031	4919.8	40694.0	10.21	0.234	0.027	8.295	0.052	620.8	0.000	0.000	0.045	74.25	5.071	1.741	3.153	99.19		pg182_o2nofp.cx10b_fpw0_c8r32
46241.9	370907	0.000	0.000	0.070	8.020	5006.5	52502.4	11.08	0.259	0.054	10.77	0.010	127.9	0.000	0.000	0.004	37.61	16.11	1.775	3.442	99.60		pg182_o2nofp.cx10b_wallz4_c8r32
47243.1	379291	0.000	0.000	0.060	8.030	4926.7	40654.2	8.517	0.195	0.027	8.277	0.044	620.7	0.000	0.000	0.004	39.80	5.056	1.761	3.195	99.58		pg182_o2nofp.cx10b_fpw0_wallz4_c8r32
qr1000.L5
qr1000.L5: range queries with 1000 insert/s per client. Graphs for performance per 1-second interval are here.
Average throughput:
Query response time histogram: each cell has the percentage of responses that take <= the time in the header and max is the max response time in seconds. For max values in the top 25% of the range have a red background and in the bottom 25% of the range have a green background. The red background is not used when the min value is within 80% of the max value.
| dbms | 256us | 1ms | 4ms | 16ms | 64ms | 256ms | 1s | 4s | 16s | gt | max |
|---|---|---|---|---|---|---|---|---|---|---|---|
| pg182_o2nofp.cx10b_c8r32 | 99.789 | 0.196 | 0.014 | 0.001 | nonzero | nonzero | 0.183 | ||||
| pg182_o2nofp.cx10b_fpw0_c8r32 | 99.814 | 0.179 | 0.007 | nonzero | nonzero | nonzero | 0.138 | ||||
| pg182_o2nofp.cx10b_wallz4_c8r32 | 99.672 | 0.307 | 0.019 | 0.001 | nonzero | nonzero | 0.164 | ||||
| pg182_o2nofp.cx10b_fpw0_wallz4_c8r32 | 99.785 | 0.204 | 0.010 | 0.001 | nonzero | nonzero | 0.160 |
Insert response time histogram: each cell has the percentage of responses that take <= the time in the header and max is the max response time in seconds. For max values in the top 25% of the range have a red background and in the bottom 25% of the range have a green background. The red background is not used when the min value is within 80% of the max value.
| dbms | 256us | 1ms | 4ms | 16ms | 64ms | 256ms | 1s | 4s | 16s | gt | max |
|---|---|---|---|---|---|---|---|---|---|---|---|
| pg182_o2nofp.cx10b_c8r32 | 0.009 | 90.088 | 9.903 | 0.053 | |||||||
| pg182_o2nofp.cx10b_fpw0_c8r32 | 0.233 | 99.246 | 0.522 | 0.054 | |||||||
| pg182_o2nofp.cx10b_wallz4_c8r32 | 0.003 | 91.361 | 8.634 | 0.001 | 0.066 | ||||||
| pg182_o2nofp.cx10b_fpw0_wallz4_c8r32 | 0.263 | 98.953 | 0.785 | 0.053 |
Delete response time histogram: each cell has the percentage of responses that take <= the time in the header and max is the max response time in seconds. For max values in the top 25% of the range have a red background and in the bottom 25% of the range have a green background. The red background is not used when the min value is within 80% of the max value.
| dbms | 256us | 1ms | 4ms | 16ms | 64ms | 256ms | 1s | 4s | 16s | gt | max |
|---|---|---|---|---|---|---|---|---|---|---|---|
| pg182_o2nofp.cx10b_c8r32 | 94.919 | 5.081 | 0.056 | ||||||||
| pg182_o2nofp.cx10b_fpw0_c8r32 | 97.402 | 2.598 | 0.050 | ||||||||
| pg182_o2nofp.cx10b_wallz4_c8r32 | 81.726 | 18.273 | 0.001 | 0.074 | |||||||
| pg182_o2nofp.cx10b_fpw0_wallz4_c8r32 | 92.723 | 7.277 | 0.064 |
Performance metrics for the DBMS listed above. Some are normalized by throughput, others are not. Legend for results is here.
ips	qps	rps	rmbps	wps	wmbps	rpq	rkbpq	wpi	wkbpi	csps	cpups	cspq	cpupq	dbgb1	dbgb2	rss	maxop	p50	p99	tag
3991	61643	4920	40.8	5855.0	90.6	0.080	0.677	1.467	23.254	220592	63.2	3.579	82	158.0	198.0	23.3	0.183	15614	13838	pg182_o2nofp.cx10b_c8r32
3991	63584	4873	39.2	5330.3	44.2	0.077	0.631	1.336	11.340	227598	62.2	3.580	78	158.1	193.6	18.4	0.138	16014	14095	pg182_o2nofp.cx10b_fpw0_c8r32
3991	63059	4884	39.7	5596.7	70.1	0.077	0.645	1.402	17.981	224202	62.7	3.555	80	157.9	198.0	23.4	0.164	15915	13599	pg182_o2nofp.cx10b_wallz4_c8r32
3989	63436	4887	39.3	5329.4	44.1	0.077	0.635	1.336	11.328	226979	62.2	3.578	78	157.6	192.3	21.8	0.160	15782	13950	pg182_o2nofp.cx10b_fpw0_wallz4_c8r32
Average values from iostat.
r/s	rkB/s	rrqm/s	%rrqm	r_await	rareq-s	w/s	wkB/s	wrqm/s	%wrqm	w_await	wareq-s	d/s	dkB/s	drqm/s	%drqm	d_await	dareq-s	f/s	f_await	aqu-sz	%util
4887.1	41106.4	0.000	0.000	0.096	8.430	5865.0	92892.4	28.15	0.456	0.247	17.25	0.011	18.62	0.000	0.000	0.040	31.22	44.05	2.051	1.944	33.33		pg182_o2nofp.cx10b_c8r32
4836.0	39438.8	0.000	0.000	0.046	8.159	5338.2	45324.7	8.257	0.284	0.037	8.888	0.071	967.6	0.000	0.000	0.030	41.19	4.991	1.814	0.404	21.17		pg182_o2nofp.cx10b_fpw0_c8r32
4849.2	40006.2	0.000	0.000	0.068	8.259	5604.8	71835.9	22.95	0.498	0.138	14.37	0.009	9.333	0.000	0.000	0.033	15.71	27.90	1.778	1.121	24.23		pg182_o2nofp.cx10b_wallz4_c8r32
4852.9	39645.5	0.018	0.000	0.046	8.170	5337.2	45253.8	7.856	0.266	0.036	8.815	0.065	958.5	0.000	0.000	0.005	41.68	4.894	1.884	0.398	20.22		pg182_o2nofp.cx10b_fpw0_wallz4_c8r32
qp1000.L6
qp1000.L6: point queries with 1000 insert/s per client. Graphs for performance per 1-second interval are here.
Average throughput:
Query response time histogram: each cell has the percentage of responses that take <= the time in the header and max is the max response time in seconds. For max values in the top 25% of the range have a red background and in the bottom 25% of the range have a green background. The red background is not used when the min value is within 80% of the max value.
| dbms | 256us | 1ms | 4ms | 16ms | 64ms | 256ms | 1s | 4s | 16s | gt | max |
|---|---|---|---|---|---|---|---|---|---|---|---|
| pg182_o2nofp.cx10b_c8r32 | nonzero | 13.110 | 82.385 | 4.484 | 0.020 | nonzero | 0.150 | ||||
| pg182_o2nofp.cx10b_fpw0_c8r32 | 17.117 | 82.723 | 0.159 | nonzero | 0.023 | ||||||
| pg182_o2nofp.cx10b_wallz4_c8r32 | nonzero | 13.821 | 84.056 | 2.120 | 0.002 | nonzero | nonzero | 0.845 | |||
| pg182_o2nofp.cx10b_fpw0_wallz4_c8r32 | nonzero | 17.245 | 82.587 | 0.168 | nonzero | 0.025 |
Insert response time histogram: each cell has the percentage of responses that take <= the time in the header and max is the max response time in seconds. For max values in the top 25% of the range have a red background and in the bottom 25% of the range have a green background. The red background is not used when the min value is within 80% of the max value.
| dbms | 256us | 1ms | 4ms | 16ms | 64ms | 256ms | 1s | 4s | 16s | gt | max |
|---|---|---|---|---|---|---|---|---|---|---|---|
| pg182_o2nofp.cx10b_c8r32 | 59.935 | 40.060 | 0.006 | 0.222 | |||||||
| pg182_o2nofp.cx10b_fpw0_c8r32 | 99.777 | 0.223 | 0.033 | ||||||||
| pg182_o2nofp.cx10b_wallz4_c8r32 | 85.864 | 14.129 | 0.003 | 0.004 | 0.717 | ||||||
| pg182_o2nofp.cx10b_fpw0_wallz4_c8r32 | 99.763 | 0.237 | 0.038 |
Delete response time histogram: each cell has the percentage of responses that take <= the time in the header and max is the max response time in seconds. For max values in the top 25% of the range have a red background and in the bottom 25% of the range have a green background. The red background is not used when the min value is within 80% of the max value.
| dbms | 256us | 1ms | 4ms | 16ms | 64ms | 256ms | 1s | 4s | 16s | gt | max |
|---|---|---|---|---|---|---|---|---|---|---|---|
| pg182_o2nofp.cx10b_c8r32 | 0.958 | 99.038 | 0.003 | 0.177 | |||||||
| pg182_o2nofp.cx10b_fpw0_c8r32 | 1.619 | 98.378 | 0.003 | 0.077 | |||||||
| pg182_o2nofp.cx10b_wallz4_c8r32 | 0.822 | 99.174 | 0.003 | 0.001 | 0.659 | ||||||
| pg182_o2nofp.cx10b_fpw0_wallz4_c8r32 | 1.507 | 98.490 | 0.003 | 0.075 |
Performance metrics for the DBMS listed above. Some are normalized by throughput, others are not. Legend for results is here.
ips	qps	rps	rmbps	wps	wmbps	rpq	rkbpq	wpi	wkbpi	csps	cpups	cspq	cpupq	dbgb1	dbgb2	rss	maxop	p50	p99	tag
3993	2613	41891	329.2	8976.3	116.3	16.032	129.024	2.248	29.833	86286	37.2	33.023	1139	158.8	198.9	23.3	0.150	656	272	pg182_o2nofp.cx10b_c8r32
3991	3198	49101	385.1	8919.4	72.3	15.354	123.298	2.235	18.560	101611	37.6	31.773	941	159.0	191.9	19.0	0.023	816	576	pg182_o2nofp.cx10b_fpw0_c8r32
3993	2828	44599	349.7	8955.8	95.1	15.773	126.628	2.243	24.393	92597	38.8	32.748	1098	158.8	198.8	23.4	0.845	736	368	pg182_o2nofp.cx10b_wallz4_c8r32
3993	3200	49106	384.9	8919.5	72.3	15.347	123.169	2.234	18.550	101652	37.7	31.769	943	158.5	190.6	21.8	0.025	816	592	pg182_o2nofp.cx10b_fpw0_wallz4_c8r32
Average values from iostat.
r/s	rkB/s	rrqm/s	%rrqm	r_await	rareq-s	w/s	wkB/s	wrqm/s	%wrqm	w_await	wareq-s	d/s	dkB/s	drqm/s	%drqm	d_await	dareq-s	f/s	f_await	aqu-sz	%util
41925.2	337400	0.072	0.000	0.090	8.048	8960.1	119075	41.75	0.598	0.270	13.51	0.012	27.58	0.000	0.000	0.055	49.86	48.95	2.728	6.030	99.44		pg182_o2nofp.cx10b_c8r32
49150.9	394706	0.000	0.000	0.060	8.031	8903.6	73953.4	11.42	0.134	0.027	8.314	0.099	1497.1	0.000	0.000	0.002	42.30	5.406	1.736	3.362	99.41		pg182_o2nofp.cx10b_fpw0_c8r32
44638.3	358370	0.240	0.001	0.074	8.031	8939.5	97318.2	22.98	0.323	0.126	11.02	0.006	9.379	0.000	0.000	0.028	15.85	29.34	2.261	4.398	98.85		pg182_o2nofp.cx10b_wallz4_c8r32
49155.0	394499	0.002	0.000	0.060	8.027	8903.1	73947.3	10.81	0.129	0.027	8.314	0.108	1497.1	0.000	0.000	0.039	42.97	5.401	1.775	3.355	99.38		pg182_o2nofp.cx10b_fpw0_wallz4_c8r32
l.i0
l.i0: load without secondary indexes
Performance metrics for all DBMS, not just the ones listed above. Some are normalized by throughput, others are not. Legend for results is here.
ips	qps	rps	rmbps	wps	wmbps	rpq	rkbpq	wpi	wkbpi	csps	cpups	cspq	cpupq	dbgb1	dbgb2	rss	maxop	p50	p99	tag
660066	0	436	3.5	2559.4	273.9	0.001	0.005	0.004	0.425	56324	70.9	0.085	9	76.5	116.6	23.3	0.076	168985	118827	pg182_o2nofp.cx10b_c8r32
656814	0	414	3.3	2535.1	269.3	0.001	0.005	0.004	0.420	56401	70.4	0.086	9	76.5	118.2	23.3	0.100	168882	85991	pg182_o2nofp.cx10b_fpw0_c8r32
665557	0	449	3.6	2583.9	273.0	0.001	0.006	0.004	0.420	56817	70.9	0.085	9	76.5	116.6	23.3	0.078	170079	149485	pg182_o2nofp.cx10b_wallz4_c8r32
668338	0	447	3.6	2591.3	270.8	0.001	0.006	0.004	0.415	56733	71.0	0.085	8	76.5	116.6	23.3	0.077	169681	151683	pg182_o2nofp.cx10b_fpw0_wallz4_c8r32
l.x
l.x: create secondary indexes
Performance metrics for all DBMS, not just the ones listed above. Some are normalized by throughput, others are not. Legend for results is here.
ips	qps	rps	rmbps	wps	wmbps	rpq	rkbpq	wpi	wkbpi	csps	cpups	cspq	cpupq	dbgb1	dbgb2	rss	maxop	p50	p99	tag
1571709	0	5102	451.7	3806.6	453.1	0.003	0.294	0.002	0.295	10351	46.2	0.007	2	153.7	193.7	23.1	0.003	NA	NA	pg182_o2nofp.cx10b_c8r32
1559454	0	4368	436.5	3808.1	458.0	0.003	0.287	0.002	0.301	9759	46.1	0.006	2	153.7	193.7	23.1	0.005	NA	NA	pg182_o2nofp.cx10b_fpw0_c8r32
1603207	0	4807	462.0	3327.6	400.6	0.003	0.295	0.002	0.256	5762	47.7	0.004	2	153.7	193.7	23.1	0.005	NA	NA	pg182_o2nofp.cx10b_wallz4_c8r32
1603207	0	4848	464.9	3333.8	404.6	0.003	0.297	0.002	0.258	5609	48.0	0.003	2	153.7	194.7	23.1	0.004	NA	NA	pg182_o2nofp.cx10b_fpw0_wallz4_c8r32
l.i1
l.i1: continue load after secondary indexes created with 50 inserts per transaction
Performance metrics for all DBMS, not just the ones listed above. Some are normalized by throughput, others are not. Legend for results is here.
ips	qps	rps	rmbps	wps	wmbps	rpq	rkbpq	wpi	wkbpi	csps	cpups	cspq	cpupq	dbgb1	dbgb2	rss	maxop	p50	p99	tag
12618	0	14607	116.2	16722.9	280.7	1.158	9.433	1.325	22.783	33159	52.3	2.628	332	156.3	196.3	23.3	0.092	2300	1750	pg182_o2nofp.cx10b_c8r32
15152	0	17566	143.2	16691.8	143.0	1.159	9.679	1.102	9.662	38474	53.9	2.539	285	156.3	196.3	23.4	0.030	4100	1600	pg182_o2nofp.cx10b_fpw0_c8r32
13169	0	15377	128.7	15459.2	213.8	1.168	10.008	1.174	16.629	33938	50.8	2.577	309	156.3	196.3	23.4	0.066	2300	1900	pg182_o2nofp.cx10b_wallz4_c8r32
14235	0	16486	137.6	15593.7	132.2	1.158	9.897	1.095	9.507	36153	51.2	2.540	288	156.3	196.3	23.3	0.044	4149	3144	pg182_o2nofp.cx10b_fpw0_wallz4_c8r32
l.i2
l.i2: continue load after secondary indexes created with 5 inserts per transaction
Performance metrics for all DBMS, not just the ones listed above. Some are normalized by throughput, others are not. Legend for results is here.
ips	qps	rps	rmbps	wps	wmbps	rpq	rkbpq	wpi	wkbpi	csps	cpups	cspq	cpupq	dbgb1	dbgb2	rss	maxop	p50	p99	tag
658	0	800	8.9	1247.9	20.0	1.215	13.815	1.896	31.054	4113	32.5	6.250	3951	156.9	197.0	23.3	0.030	155	145	pg182_o2nofp.cx10b_c8r32
597	0	632	5.0	978.9	8.8	1.060	8.601	1.640	15.147	3679	38.8	6.163	5199	157.0	196.5	23.4	0.019	150	140	pg182_o2nofp.cx10b_fpw0_c8r32
761	0	946	10.9	1464.9	19.5	1.243	14.701	1.926	26.222	4720	38.4	6.204	4038	157.0	197.0	23.4	0.021	155	140	pg182_o2nofp.cx10b_wallz4_c8r32
626	0	751	8.6	1137.8	10.9	1.200	14.059	1.819	17.871	3817	32.7	6.101	4182	156.9	195.5	23.3	0.021	280	135	pg182_o2nofp.cx10b_fpw0_wallz4_c8r32
qr100.L1
qr100.L1: range queries with 100 insert/s per client
Performance metrics for all DBMS, not just the ones listed above. Some are normalized by throughput, others are not. Legend for results is here.
ips	qps	rps	rmbps	wps	wmbps	rpq	rkbpq	wpi	wkbpi	csps	cpups	cspq	cpupq	dbgb1	dbgb2	rss	maxop	p50	p99	tag
399	96102	457	3.7	265.8	7.5	0.005	0.039	0.666	19.168	367250	42.4	3.821	35	156.9	197.0	23.3	0.010	24253	23518	pg182_o2nofp.cx10b_c8r32
399	98649	454	3.6	222.9	2.1	0.005	0.038	0.558	5.484	376916	41.5	3.821	34	157.0	195.7	23.4	0.010	24734	24046	pg182_o2nofp.cx10b_fpw0_c8r32
399	96560	455	3.7	248.0	5.7	0.005	0.039	0.621	14.495	369078	42.3	3.822	35	157.0	197.0	23.4	0.010	23997	23597	pg182_o2nofp.cx10b_wallz4_c8r32
399	97627	453	3.8	221.4	2.1	0.005	0.040	0.555	5.420	372970	42.2	3.820	35	157.0	194.9	23.3	0.013	24526	23886	pg182_o2nofp.cx10b_fpw0_wallz4_c8r32
qp100.L2
qp100.L2: point queries with 100 insert/s per client
Performance metrics for all DBMS, not just the ones listed above. Some are normalized by throughput, others are not. Legend for results is here.
ips	qps	rps	rmbps	wps	wmbps	rpq	rkbpq	wpi	wkbpi	csps	cpups	cspq	cpupq	dbgb1	dbgb2	rss	maxop	p50	p99	tag
399	3648	44813	356.4	1372.1	15.7	12.284	100.033	3.438	40.378	99553	11.8	27.289	259	157.0	197.0	23.3	0.026	944	624	pg182_o2nofp.cx10b_c8r32
399	3672	45314	354.3	1321.2	10.6	12.339	98.787	3.310	27.124	100708	11.3	27.424	246	157.0	195.5	23.4	0.023	928	624	pg182_o2nofp.cx10b_fpw0_c8r32
399	3655	44859	350.8	1355.8	14.0	12.274	98.293	3.397	35.897	99773	11.7	27.300	256	157.0	197.0	23.4	0.026	927	608	pg182_o2nofp.cx10b_wallz4_c8r32
399	3607	44399	347.6	1319.9	10.5	12.310	98.694	3.307	27.057	99678	11.5	27.635	255	157.0	194.7	23.3	0.445	943	480	pg182_o2nofp.cx10b_fpw0_wallz4_c8r32
qr500.L3
qr500.L3: range queries with 500 insert/s per client
Performance metrics for all DBMS, not just the ones listed above. Some are normalized by throughput, others are not. Legend for results is here.
ips	qps	rps	rmbps	wps	wmbps	rpq	rkbpq	wpi	wkbpi	csps	cpups	cspq	cpupq	dbgb1	dbgb2	rss	maxop	p50	p99	tag
1997	83960	2642	22.1	2402.5	41.0	0.031	0.270	1.203	21.016	318925	48.5	3.799	46	157.1	197.2	23.3	0.047	21070	19662	pg182_o2nofp.cx10b_c8r32
1997	86332	2617	21.1	2204.4	18.6	0.030	0.251	1.104	9.540	327821	48.3	3.797	45	157.2	195.4	23.4	0.025	21646	20206	pg182_o2nofp.cx10b_fpw0_c8r32
1997	84370	2622	21.1	2353.0	32.4	0.031	0.256	1.178	16.631	319515	49.2	3.787	47	157.1	194.8	23.4	0.029	21118	19566	pg182_o2nofp.cx10b_wallz4_c8r32
1997	85022	2629	21.2	2205.4	18.5	0.031	0.256	1.105	9.506	323518	48.5	3.805	46	157.0	194.4	16.5	0.026	21406	20222	pg182_o2nofp.cx10b_fpw0_wallz4_c8r32
qp500.L4
qp500.L4: point queries with 500 insert/s per client
Performance metrics for all DBMS, not just the ones listed above. Some are normalized by throughput, others are not. Legend for results is here.
ips	qps	rps	rmbps	wps	wmbps	rpq	rkbpq	wpi	wkbpi	csps	cpups	cspq	cpupq	dbgb1	dbgb2	rss	maxop	p50	p99	tag
1996	3317	45234	358.7	5108.0	61.8	13.637	110.730	2.560	31.715	97797	20.6	29.483	497	157.4	197.4	23.3	0.358	864	512	pg182_o2nofp.cx10b_c8r32
1996	3404	46326	363.3	4947.4	40.0	13.611	109.291	2.479	20.503	100669	20.9	29.578	491	157.5	194.6	23.4	0.463	880	496	pg182_o2nofp.cx10b_fpw0_c8r32
1996	3394	46196	361.9	5033.6	51.5	13.613	109.191	2.522	26.411	99752	20.2	29.395	476	157.4	194.8	23.4	0.026	848	560	pg182_o2nofp.cx10b_wallz4_c8r32
1997	3479	47196	370.0	4953.7	39.9	13.567	108.920	2.481	20.469	101770	20.1	29.254	462	157.1	193.4	20.7	0.015	880	608	pg182_o2nofp.cx10b_fpw0_wallz4_c8r32
qr1000.L5
qr1000.L5: range queries with 1000 insert/s per client
Performance metrics for all DBMS, not just the ones listed above. Some are normalized by throughput, others are not. Legend for results is here.
ips	qps	rps	rmbps	wps	wmbps	rpq	rkbpq	wpi	wkbpi	csps	cpups	cspq	cpupq	dbgb1	dbgb2	rss	maxop	p50	p99	tag
3991	61643	4920	40.8	5855.0	90.6	0.080	0.677	1.467	23.254	220592	63.2	3.579	82	158.0	198.0	23.3	0.183	15614	13838	pg182_o2nofp.cx10b_c8r32
3991	63584	4873	39.2	5330.3	44.2	0.077	0.631	1.336	11.340	227598	62.2	3.580	78	158.1	193.6	18.4	0.138	16014	14095	pg182_o2nofp.cx10b_fpw0_c8r32
3991	63059	4884	39.7	5596.7	70.1	0.077	0.645	1.402	17.981	224202	62.7	3.555	80	157.9	198.0	23.4	0.164	15915	13599	pg182_o2nofp.cx10b_wallz4_c8r32
3989	63436	4887	39.3	5329.4	44.1	0.077	0.635	1.336	11.328	226979	62.2	3.578	78	157.6	192.3	21.8	0.160	15782	13950	pg182_o2nofp.cx10b_fpw0_wallz4_c8r32
qp1000.L6
qp1000.L6: point queries with 1000 insert/s per client
Performance metrics for all DBMS, not just the ones listed above. Some are normalized by throughput, others are not. Legend for results is here.
ips	qps	rps	rmbps	wps	wmbps	rpq	rkbpq	wpi	wkbpi	csps	cpups	cspq	cpupq	dbgb1	dbgb2	rss	maxop	p50	p99	tag
3993	2613	41891	329.2	8976.3	116.3	16.032	129.024	2.248	29.833	86286	37.2	33.023	1139	158.8	198.9	23.3	0.150	656	272	pg182_o2nofp.cx10b_c8r32
3991	3198	49101	385.1	8919.4	72.3	15.354	123.298	2.235	18.560	101611	37.6	31.773	941	159.0	191.9	19.0	0.023	816	576	pg182_o2nofp.cx10b_fpw0_c8r32
3993	2828	44599	349.7	8955.8	95.1	15.773	126.628	2.243	24.393	92597	38.8	32.748	1098	158.8	198.8	23.4	0.845	736	368	pg182_o2nofp.cx10b_wallz4_c8r32
3993	3200	49106	384.9	8919.5	72.3	15.347	123.169	2.234	18.550	101652	37.7	31.769	943	158.5	190.6	21.8	0.025	816	592	pg182_o2nofp.cx10b_fpw0_wallz4_c8r32
l.i0
- l.i0: load without secondary indexes
- Legend for results is here.
- Each entry lists the percentage of responses that fit in that bucket (slower than max time for previous bucket, faster than min time for next bucket).
Insert response time histogram
256us	1ms	4ms	16ms	64ms	256ms	1s	4s	16s	gt	max	tag
0.000	97.007	2.964	0.027	0.002	nonzero	0.000	0.000	0.000	0.000	0.076	pg182_o2nofp.cx10b_c8r32
0.000	96.902	2.943	0.154	0.001	nonzero	0.000	0.000	0.000	0.000	0.100	pg182_o2nofp.cx10b_fpw0_c8r32
0.000	97.090	2.895	0.013	0.001	nonzero	0.000	0.000	0.000	0.000	0.078	pg182_o2nofp.cx10b_wallz4_c8r32
0.000	97.035	2.950	0.015	nonzero	nonzero	0.000	0.000	0.000	0.000	0.077	pg182_o2nofp.cx10b_fpw0_wallz4_c8r32
l.x
- l.x: create secondary indexes
- Legend for results is here.
- Each entry lists the percentage of responses that fit in that bucket (slower than max time for previous bucket, faster than min time for next bucket).
TODO - determine whether there is data for create index response time
l.i1
- l.i1: continue load after secondary indexes created with 50 inserts per transaction
- Legend for results is here.
- Each entry lists the percentage of responses that fit in that bucket (slower than max time for previous bucket, faster than min time for next bucket).
Insert response time histogram
256us	1ms	4ms	16ms	64ms	256ms	1s	4s	16s	gt	max	tag
0.000	0.000	0.397	87.639	11.962	0.002	0.000	0.000	0.000	0.000	0.092	pg182_o2nofp.cx10b_c8r32
0.000	0.000	9.368	90.565	0.068	0.000	0.000	0.000	0.000	0.000	0.030	pg182_o2nofp.cx10b_fpw0_c8r32
0.000	0.000	0.373	95.857	3.770	nonzero	0.000	0.000	0.000	0.000	0.066	pg182_o2nofp.cx10b_wallz4_c8r32
0.000	0.000	12.503	87.362	0.135	0.000	0.000	0.000	0.000	0.000	0.044	pg182_o2nofp.cx10b_fpw0_wallz4_c8r32
Delete response time histogram
256us	1ms	4ms	16ms	64ms	256ms	1s	4s	16s	gt	max	tag
0.001	2.423	10.089	67.754	19.733	0.000	0.000	0.000	0.000	0.000	0.038	pg182_o2nofp.cx10b_c8r32
0.002	2.782	9.724	78.720	8.772	0.000	0.000	0.000	0.000	0.000	0.034	pg182_o2nofp.cx10b_fpw0_c8r32
0.001	2.529	10.063	77.374	10.032	0.000	0.000	0.000	0.000	0.000	0.031	pg182_o2nofp.cx10b_wallz4_c8r32
0.001	2.809	9.750	76.260	11.180	0.000	0.000	0.000	0.000	0.000	0.034	pg182_o2nofp.cx10b_fpw0_wallz4_c8r32
l.i2
- l.i2: continue load after secondary indexes created with 5 inserts per transaction
- Legend for results is here.
- Each entry lists the percentage of responses that fit in that bucket (slower than max time for previous bucket, faster than min time for next bucket).
Insert response time histogram
256us	1ms	4ms	16ms	64ms	256ms	1s	4s	16s	gt	max	tag
0.051	37.574	59.858	2.479	0.039	0.000	0.000	0.000	0.000	0.000	0.030	pg182_o2nofp.cx10b_c8r32
nonzero	56.836	42.657	0.506	nonzero	0.000	0.000	0.000	0.000	0.000	0.019	pg182_o2nofp.cx10b_fpw0_c8r32
0.001	26.071	72.583	1.344	0.002	0.000	0.000	0.000	0.000	0.000	0.021	pg182_o2nofp.cx10b_wallz4_c8r32
0.047	54.837	44.150	0.965	0.001	0.000	0.000	0.000	0.000	0.000	0.021	pg182_o2nofp.cx10b_fpw0_wallz4_c8r32
Delete response time histogram
256us	1ms	4ms	16ms	64ms	256ms	1s	4s	16s	gt	max	tag
0.296	6.493	3.345	6.763	83.102	0.001	0.000	0.000	0.000	0.000	0.084	pg182_o2nofp.cx10b_c8r32
0.000	0.000	0.000	5.264	94.735	0.001	0.000	0.000	0.000	0.000	0.089	pg182_o2nofp.cx10b_fpw0_c8r32
0.311	1.627	0.004	13.896	84.163	0.001	0.000	0.000	0.000	0.000	0.083	pg182_o2nofp.cx10b_wallz4_c8r32
0.371	6.183	2.294	6.117	85.035	0.001	0.000	0.000	0.000	0.000	0.090	pg182_o2nofp.cx10b_fpw0_wallz4_c8r32
qr100.L1
- qr100.L1: range queries with 100 insert/s per client
- Legend for results is here.
- Each entry lists the percentage of responses that fit in that bucket (slower than max time for previous bucket, faster than min time for next bucket).
Query response time histogram
256us	1ms	4ms	16ms	64ms	256ms	1s	4s	16s	gt	max	tag
99.986	0.014	nonzero	nonzero	0.000	0.000	0.000	0.000	0.000	0.000	0.010	pg182_o2nofp.cx10b_c8r32
99.988	0.012	nonzero	nonzero	0.000	0.000	0.000	0.000	0.000	0.000	0.010	pg182_o2nofp.cx10b_fpw0_c8r32
99.987	0.013	nonzero	nonzero	0.000	0.000	0.000	0.000	0.000	0.000	0.010	pg182_o2nofp.cx10b_wallz4_c8r32
99.986	0.014	nonzero	nonzero	0.000	0.000	0.000	0.000	0.000	0.000	0.013	pg182_o2nofp.cx10b_fpw0_wallz4_c8r32
Insert response time histogram
256us	1ms	4ms	16ms	64ms	256ms	1s	4s	16s	gt	max	tag
0.000	0.000	0.083	99.014	0.903	0.000	0.000	0.000	0.000	0.000	0.025	pg182_o2nofp.cx10b_c8r32
0.000	0.000	0.146	99.847	0.007	0.000	0.000	0.000	0.000	0.000	0.021	pg182_o2nofp.cx10b_fpw0_c8r32
0.000	0.000	0.000	99.896	0.104	0.000	0.000	0.000	0.000	0.000	0.023	pg182_o2nofp.cx10b_wallz4_c8r32
0.000	0.000	1.035	98.958	0.007	0.000	0.000	0.000	0.000	0.000	0.023	pg182_o2nofp.cx10b_fpw0_wallz4_c8r32
Delete response time histogram
256us	1ms	4ms	16ms	64ms	256ms	1s	4s	16s	gt	max	tag
0.000	66.271	33.701	0.028	0.000	0.000	0.000	0.000	0.000	0.000	0.004	pg182_o2nofp.cx10b_c8r32
0.042	78.299	21.660	0.000	0.000	0.000	0.000	0.000	0.000	0.000	0.004	pg182_o2nofp.cx10b_fpw0_c8r32
0.000	67.924	32.076	0.000	0.000	0.000	0.000	0.000	0.000	0.000	0.003	pg182_o2nofp.cx10b_wallz4_c8r32
0.028	74.868	25.097	0.007	0.000	0.000	0.000	0.000	0.000	0.000	0.009	pg182_o2nofp.cx10b_fpw0_wallz4_c8r32
qp100.L2
- qp100.L2: point queries with 100 insert/s per client
- Legend for results is here.
- Each entry lists the percentage of responses that fit in that bucket (slower than max time for previous bucket, faster than min time for next bucket).
Query response time histogram
256us	1ms	4ms	16ms	64ms	256ms	1s	4s	16s	gt	max	tag
nonzero	36.430	63.454	0.116	nonzero	0.000	0.000	0.000	0.000	0.000	0.026	pg182_o2nofp.cx10b_c8r32
nonzero	35.877	64.074	0.049	nonzero	0.000	0.000	0.000	0.000	0.000	0.023	pg182_o2nofp.cx10b_fpw0_c8r32
nonzero	36.077	63.833	0.089	nonzero	0.000	0.000	0.000	0.000	0.000	0.026	pg182_o2nofp.cx10b_wallz4_c8r32
nonzero	34.906	64.983	0.111	nonzero	nonzero	nonzero	0.000	0.000	0.000	0.445	pg182_o2nofp.cx10b_fpw0_wallz4_c8r32
Insert response time histogram
256us	1ms	4ms	16ms	64ms	256ms	1s	4s	16s	gt	max	tag
0.000	0.000	0.000	95.958	4.035	0.007	0.000	0.000	0.000	0.000	0.075	pg182_o2nofp.cx10b_c8r32
0.000	0.000	0.000	99.889	0.111	0.000	0.000	0.000	0.000	0.000	0.063	pg182_o2nofp.cx10b_fpw0_c8r32
0.000	0.000	0.000	97.688	2.312	0.000	0.000	0.000	0.000	0.000	0.034	pg182_o2nofp.cx10b_wallz4_c8r32
0.000	0.000	0.000	98.014	1.986	0.000	0.000	0.000	0.000	0.000	0.040	pg182_o2nofp.cx10b_fpw0_wallz4_c8r32
Delete response time histogram
256us	1ms	4ms	16ms	64ms	256ms	1s	4s	16s	gt	max	tag
0.000	3.778	94.792	1.431	0.000	0.000	0.000	0.000	0.000	0.000	0.010	pg182_o2nofp.cx10b_c8r32
0.000	2.722	97.111	0.167	0.000	0.000	0.000	0.000	0.000	0.000	0.008	pg182_o2nofp.cx10b_fpw0_c8r32
0.000	3.104	96.840	0.056	0.000	0.000	0.000	0.000	0.000	0.000	0.009	pg182_o2nofp.cx10b_wallz4_c8r32
0.000	3.139	96.729	0.118	0.014	0.000	0.000	0.000	0.000	0.000	0.031	pg182_o2nofp.cx10b_fpw0_wallz4_c8r32
qr500.L3
- qr500.L3: range queries with 500 insert/s per client
- Legend for results is here.
- Each entry lists the percentage of responses that fit in that bucket (slower than max time for previous bucket, faster than min time for next bucket).
Query response time histogram
256us	1ms	4ms	16ms	64ms	256ms	1s	4s	16s	gt	max	tag
99.951	0.046	0.003	nonzero	nonzero	0.000	0.000	0.000	0.000	0.000	0.047	pg182_o2nofp.cx10b_c8r32
99.964	0.035	0.001	nonzero	nonzero	0.000	0.000	0.000	0.000	0.000	0.025	pg182_o2nofp.cx10b_fpw0_c8r32
99.954	0.044	0.002	nonzero	nonzero	0.000	0.000	0.000	0.000	0.000	0.029	pg182_o2nofp.cx10b_wallz4_c8r32
99.960	0.039	0.001	nonzero	nonzero	0.000	0.000	0.000	0.000	0.000	0.026	pg182_o2nofp.cx10b_fpw0_wallz4_c8r32
Insert response time histogram
256us	1ms	4ms	16ms	64ms	256ms	1s	4s	16s	gt	max	tag
0.000	0.000	0.003	97.667	2.331	0.000	0.000	0.000	0.000	0.000	0.057	pg182_o2nofp.cx10b_c8r32
0.000	0.000	0.018	99.819	0.163	0.000	0.000	0.000	0.000	0.000	0.032	pg182_o2nofp.cx10b_fpw0_c8r32
0.000	0.000	0.000	98.276	1.724	0.000	0.000	0.000	0.000	0.000	0.034	pg182_o2nofp.cx10b_wallz4_c8r32
0.000	0.000	0.011	99.853	0.136	0.000	0.000	0.000	0.000	0.000	0.038	pg182_o2nofp.cx10b_fpw0_wallz4_c8r32
Delete response time histogram
256us	1ms	4ms	16ms	64ms	256ms	1s	4s	16s	gt	max	tag
0.000	0.000	26.536	73.382	0.082	0.000	0.000	0.000	0.000	0.000	0.037	pg182_o2nofp.cx10b_c8r32
0.000	0.000	26.667	73.276	0.057	0.000	0.000	0.000	0.000	0.000	0.031	pg182_o2nofp.cx10b_fpw0_c8r32
0.000	0.000	25.743	74.192	0.065	0.000	0.000	0.000	0.000	0.000	0.039	pg182_o2nofp.cx10b_wallz4_c8r32
0.000	0.000	29.565	70.396	0.039	0.000	0.000	0.000	0.000	0.000	0.030	pg182_o2nofp.cx10b_fpw0_wallz4_c8r32
qp500.L4
- qp500.L4: point queries with 500 insert/s per client
- Legend for results is here.
- Each entry lists the percentage of responses that fit in that bucket (slower than max time for previous bucket, faster than min time for next bucket).
Query response time histogram
256us	1ms	4ms	16ms	64ms	256ms	1s	4s	16s	gt	max	tag
nonzero	26.979	72.331	0.688	0.001	nonzero	nonzero	0.000	0.000	0.000	0.358	pg182_o2nofp.cx10b_c8r32
nonzero	26.112	73.750	0.137	0.001	nonzero	nonzero	0.000	0.000	0.000	0.463	pg182_o2nofp.cx10b_fpw0_c8r32
nonzero	27.296	72.335	0.369	nonzero	0.000	0.000	0.000	0.000	0.000	0.026	pg182_o2nofp.cx10b_wallz4_c8r32
nonzero	27.798	72.129	0.073	0.000	0.000	0.000	0.000	0.000	0.000	0.015	pg182_o2nofp.cx10b_fpw0_wallz4_c8r32
Insert response time histogram
256us	1ms	4ms	16ms	64ms	256ms	1s	4s	16s	gt	max	tag
0.000	0.000	0.000	93.015	6.975	0.006	0.004	0.000	0.000	0.000	0.427	pg182_o2nofp.cx10b_c8r32
0.000	0.000	0.000	98.946	1.047	0.007	0.000	0.000	0.000	0.000	0.251	pg182_o2nofp.cx10b_fpw0_c8r32
0.000	0.000	0.000	97.665	2.335	0.000	0.000	0.000	0.000	0.000	0.037	pg182_o2nofp.cx10b_wallz4_c8r32
0.000	0.000	0.000	99.885	0.115	0.000	0.000	0.000	0.000	0.000	0.023	pg182_o2nofp.cx10b_fpw0_wallz4_c8r32
Delete response time histogram
256us	1ms	4ms	16ms	64ms	256ms	1s	4s	16s	gt	max	tag
0.000	0.000	0.000	95.161	4.835	0.004	0.000	0.000	0.000	0.000	0.068	pg182_o2nofp.cx10b_c8r32
0.000	0.000	0.000	94.419	5.576	0.004	0.000	0.000	0.000	0.000	0.238	pg182_o2nofp.cx10b_fpw0_c8r32
0.000	0.000	0.000	95.750	4.250	0.000	0.000	0.000	0.000	0.000	0.041	pg182_o2nofp.cx10b_wallz4_c8r32
0.000	0.000	0.000	96.451	3.549	0.000	0.000	0.000	0.000	0.000	0.041	pg182_o2nofp.cx10b_fpw0_wallz4_c8r32
qr1000.L5
- qr1000.L5: range queries with 1000 insert/s per client
- Legend for results is here.
- Each entry lists the percentage of responses that fit in that bucket (slower than max time for previous bucket, faster than min time for next bucket).
Query response time histogram
256us	1ms	4ms	16ms	64ms	256ms	1s	4s	16s	gt	max	tag
99.789	0.196	0.014	0.001	nonzero	nonzero	0.000	0.000	0.000	0.000	0.183	pg182_o2nofp.cx10b_c8r32
99.814	0.179	0.007	nonzero	nonzero	nonzero	0.000	0.000	0.000	0.000	0.138	pg182_o2nofp.cx10b_fpw0_c8r32
99.672	0.307	0.019	0.001	nonzero	nonzero	0.000	0.000	0.000	0.000	0.164	pg182_o2nofp.cx10b_wallz4_c8r32
99.785	0.204	0.010	0.001	nonzero	nonzero	0.000	0.000	0.000	0.000	0.160	pg182_o2nofp.cx10b_fpw0_wallz4_c8r32
Insert response time histogram
256us	1ms	4ms	16ms	64ms	256ms	1s	4s	16s	gt	max	tag
0.000	0.000	0.009	90.088	9.903	0.000	0.000	0.000	0.000	0.000	0.053	pg182_o2nofp.cx10b_c8r32
0.000	0.000	0.233	99.246	0.522	0.000	0.000	0.000	0.000	0.000	0.054	pg182_o2nofp.cx10b_fpw0_c8r32
0.000	0.000	0.003	91.361	8.634	0.001	0.000	0.000	0.000	0.000	0.066	pg182_o2nofp.cx10b_wallz4_c8r32
0.000	0.000	0.263	98.953	0.785	0.000	0.000	0.000	0.000	0.000	0.053	pg182_o2nofp.cx10b_fpw0_wallz4_c8r32
Delete response time histogram
256us	1ms	4ms	16ms	64ms	256ms	1s	4s	16s	gt	max	tag
0.000	0.000	0.000	94.919	5.081	0.000	0.000	0.000	0.000	0.000	0.056	pg182_o2nofp.cx10b_c8r32
0.000	0.000	0.000	97.402	2.598	0.000	0.000	0.000	0.000	0.000	0.050	pg182_o2nofp.cx10b_fpw0_c8r32
0.000	0.000	0.000	81.726	18.273	0.001	0.000	0.000	0.000	0.000	0.074	pg182_o2nofp.cx10b_wallz4_c8r32
0.000	0.000	0.000	92.723	7.277	0.000	0.000	0.000	0.000	0.000	0.064	pg182_o2nofp.cx10b_fpw0_wallz4_c8r32
qp1000.L6
- qp1000.L6: point queries with 1000 insert/s per client
- Legend for results is here.
- Each entry lists the percentage of responses that fit in that bucket (slower than max time for previous bucket, faster than min time for next bucket).
Query response time histogram
256us	1ms	4ms	16ms	64ms	256ms	1s	4s	16s	gt	max	tag
nonzero	13.110	82.385	4.484	0.020	nonzero	0.000	0.000	0.000	0.000	0.150	pg182_o2nofp.cx10b_c8r32
0.000	17.117	82.723	0.159	nonzero	0.000	0.000	0.000	0.000	0.000	0.023	pg182_o2nofp.cx10b_fpw0_c8r32
nonzero	13.821	84.056	2.120	0.002	nonzero	nonzero	0.000	0.000	0.000	0.845	pg182_o2nofp.cx10b_wallz4_c8r32
nonzero	17.245	82.587	0.168	nonzero	0.000	0.000	0.000	0.000	0.000	0.025	pg182_o2nofp.cx10b_fpw0_wallz4_c8r32
Insert response time histogram
256us	1ms	4ms	16ms	64ms	256ms	1s	4s	16s	gt	max	tag
0.000	0.000	0.000	59.935	40.060	0.006	0.000	0.000	0.000	0.000	0.222	pg182_o2nofp.cx10b_c8r32
0.000	0.000	0.000	99.777	0.223	0.000	0.000	0.000	0.000	0.000	0.033	pg182_o2nofp.cx10b_fpw0_c8r32
0.000	0.000	0.000	85.864	14.129	0.003	0.004	0.000	0.000	0.000	0.717	pg182_o2nofp.cx10b_wallz4_c8r32
0.000	0.000	0.000	99.763	0.237	0.000	0.000	0.000	0.000	0.000	0.038	pg182_o2nofp.cx10b_fpw0_wallz4_c8r32
Delete response time histogram
256us	1ms	4ms	16ms	64ms	256ms	1s	4s	16s	gt	max	tag
0.000	0.000	0.000	0.958	99.038	0.003	0.000	0.000	0.000	0.000	0.177	pg182_o2nofp.cx10b_c8r32
0.000	0.000	0.000	1.619	98.378	0.003	0.000	0.000	0.000	0.000	0.077	pg182_o2nofp.cx10b_fpw0_c8r32
0.000	0.000	0.000	0.822	99.174	0.003	0.001	0.000	0.000	0.000	0.659	pg182_o2nofp.cx10b_wallz4_c8r32
0.000	0.000	0.000	1.507	98.490	0.003	0.000	0.000	0.000	0.000	0.075	pg182_o2nofp.cx10b_fpw0_wallz4_c8r32