Introduction
This is a report for the insert benchmark with 200M docs and 20 client(s). It is generated by scripts (bash, awk, sed) and Tufte might not be impressed. An overview of the insert benchmark is here and a short update is here. Below, by DBMS, I mean DBMS+version.config. An example is my8020.c10b40 where my means MySQL, 8020 is version 8.0.20 and c10b40 is the name for the configuration file.
The test server has 48 cores, 128G RAM and 2 NVMe devices using SW RAID. The benchmark was run with 20 clients and there were 1 or 3 connections per client (1 for queries or inserts without rate limits, 1+1 for rate limited inserts+deletes). It uses 20 tables with a table per client. It loads 10M rows per table without secondary indexes, creates 3 secondary indexes per table, then inserts 40m+10m rows per table with a delete per insert to avoid growing the table. It then does 6 read+write tests for 3600s each that do queries as fast as possible with 100,100,500,500,1000,1000 inserts/s and the same for deletes/s per client concurrent with the queries. The database is cached. Clients and the DBMS share one server.
The tested DBMS are:
- ma120301_rel_withdbg.cz12b_sync_c32r128 - MariaDB 12.3.1 with the cz12b_sync_c32r128 config that is like cz12b_c32r128 but enables sync on commit for the binlog and InnoDB
- ma120301_rel_withdbg.cz12c_sync_c32r128 - MariaDB 12.3.1 with the cz12c_sync_c32r128 config that is like cz12c_c32r128 but enables sync on commit for InnoDB
- ma120301_rel_withdbg.cz12b_sync_dw0_c32r128 - MariaDB 12.3.1 with the cz12b_sync_dw0_c32r128 config that is like cz12b_sync_c32r128 and adds innodb_doublewrite=off
- ma120301_rel_withdbg.cz12c_sync_dw0_c32r128 - MariaDB 12.3.1 with the cz12c_sync_dw0_c32r128 config that is like cz12c_sync_c32r128 and adds innodb_doublewrite=off
Contents
- Summary
- l.i0: load without secondary indexes
- l.x: create secondary indexes
- l.i1: continue load after secondary indexes created with 50 inserts per transaction
- l.i2: continue load after secondary indexes created with 5 inserts per transaction
- qr100.L1: range queries with 100 insert/s per client
- qp100.L2: point queries with 100 insert/s per client
- qr500.L3: range queries with 500 insert/s per client
- qp500.L4: point queries with 500 insert/s per client
- qr1000.L5: range queries with 1000 insert/s per client
- qp1000.L6: point queries with 1000 insert/s per client
Summary
The numbers are inserts/s for l.i0, l.i1 and l.i2, indexed docs (or rows) /s for l.x and queries/s for qr100, qp100 thru qr1000, qp1000" The values are the average rate over the entire test for inserts (IPS) and queries (QPS). The range of values for IPS and QPS is split into 3 parts: bottom 25%, middle 50%, top 25%. Values in the bottom 25% have a red background, values in the top 25% have a green background and values in the middle have no color. A gray background is used for values that can be ignored because the DBMS did not sustain the target insert rate. Red backgrounds are not used when the minimum value is within 80% of the max value.
| dbms | l.i0 | l.x | l.i1 | l.i2 | qr100 | qp100 | qr500 | qp500 | qr1000 | qp1000 |
|---|---|---|---|---|---|---|---|---|---|---|
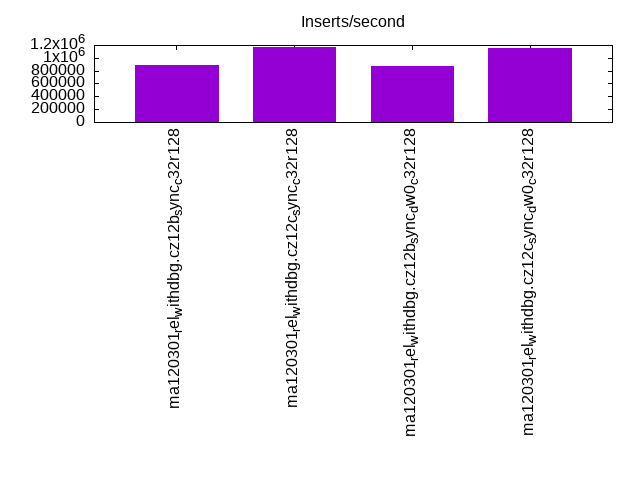
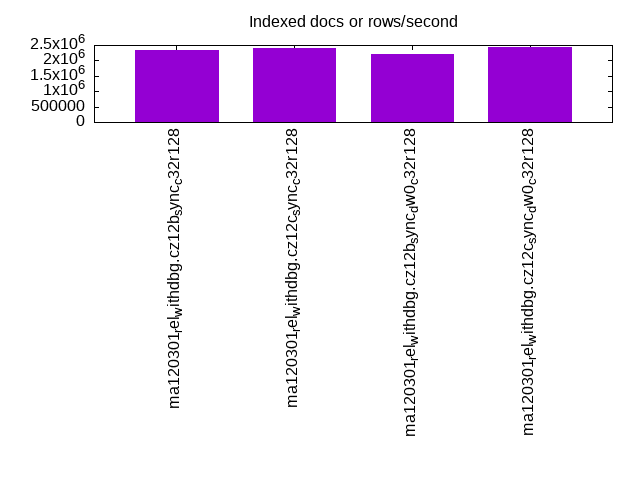
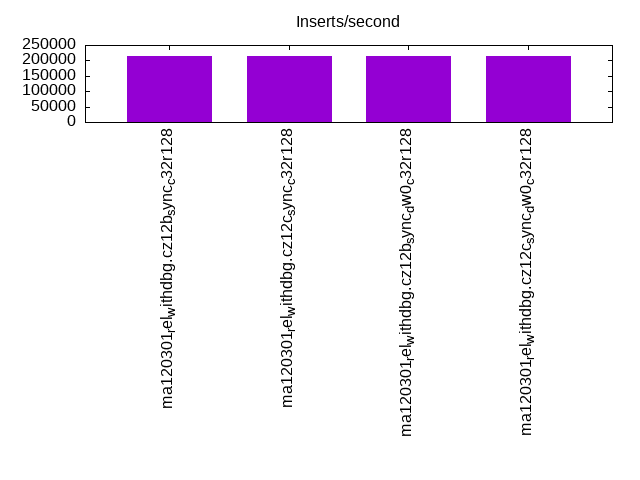
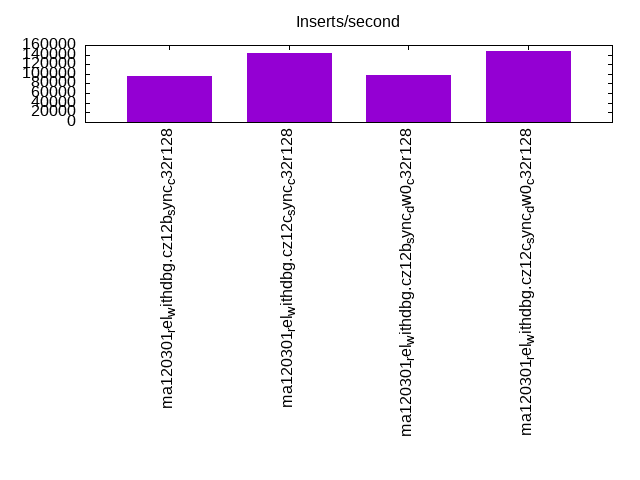
| ma120301_rel_withdbg.cz12b_sync_c32r128 | 881057 | 2352942 | 215169 | 95057 | 228296 | 196579 | 224219 | 193640 | 219830 | 188725 |
| ma120301_rel_withdbg.cz12c_sync_c32r128 | 1162791 | 2409640 | 213675 | 144404 | 230541 | 199994 | 226688 | 196870 | 222669 | 191156 |
| ma120301_rel_withdbg.cz12b_sync_dw0_c32r128 | 877193 | 2222223 | 215343 | 98087 | 234965 | 200836 | 229848 | 196913 | 225836 | 192036 |
| ma120301_rel_withdbg.cz12c_sync_dw0_c32r128 | 1156069 | 2439026 | 215112 | 146951 | 231588 | 200164 | 227753 | 197216 | 223703 | 191583 |
This table has relative throughput, throughput for the DBMS relative to the DBMS in the first line, using the absolute throughput from the previous table. Values less than 0.95 have a yellow background. Values greater than 1.05 have a blue background.
| dbms | l.i0 | l.x | l.i1 | l.i2 | qr100 | qp100 | qr500 | qp500 | qr1000 | qp1000 |
|---|---|---|---|---|---|---|---|---|---|---|
| ma120301_rel_withdbg.cz12b_sync_c32r128 | 1.00 | 1.00 | 1.00 | 1.00 | 1.00 | 1.00 | 1.00 | 1.00 | 1.00 | 1.00 |
| ma120301_rel_withdbg.cz12c_sync_c32r128 | 1.32 | 1.02 | 0.99 | 1.52 | 1.01 | 1.02 | 1.01 | 1.02 | 1.01 | 1.01 |
| ma120301_rel_withdbg.cz12b_sync_dw0_c32r128 | 1.00 | 0.94 | 1.00 | 1.03 | 1.03 | 1.02 | 1.03 | 1.02 | 1.03 | 1.02 |
| ma120301_rel_withdbg.cz12c_sync_dw0_c32r128 | 1.31 | 1.04 | 1.00 | 1.55 | 1.01 | 1.02 | 1.02 | 1.02 | 1.02 | 1.02 |
This lists the average rate of inserts/s for the tests that do inserts concurrent with queries. For such tests the query rate is listed in the table above. The read+write tests are setup so that the insert rate should match the target rate every second. Cells that are not at least 95% of the target have a red background to indicate a failure to satisfy the target.
| dbms | qr100.L1 | qp100.L2 | qr500.L3 | qp500.L4 | qr1000.L5 | qp1000.L6 |
|---|---|---|---|---|---|---|
| ma120301_rel_withdbg.cz12b_sync_c32r128 | 1987 | 1987 | 9934 | 9934 | 19878 | 19873 |
| ma120301_rel_withdbg.cz12c_sync_c32r128 | 1988 | 1988 | 9936 | 9936 | 19873 | 19873 |
| ma120301_rel_withdbg.cz12b_sync_dw0_c32r128 | 1988 | 1988 | 9936 | 9936 | 19873 | 19878 |
| ma120301_rel_withdbg.cz12c_sync_dw0_c32r128 | 1987 | 1987 | 9936 | 9936 | 19873 | 19878 |
| target | 2000 | 2000 | 10000 | 10000 | 20000 | 20000 |
l.i0
l.i0: load without secondary indexes. Graphs for performance per 1-second interval are here.
Average throughput:
Insert response time histogram: each cell has the percentage of responses that take <= the time in the header and max is the max response time in seconds. For the max column values in the top 25% of the range have a red background and in the bottom 25% of the range have a green background. The red background is not used when the min value is within 80% of the max value.
| dbms | 256us | 1ms | 4ms | 16ms | 64ms | 256ms | 1s | 4s | 16s | gt | max |
|---|---|---|---|---|---|---|---|---|---|---|---|
| ma120301_rel_withdbg.cz12b_sync_c32r128 | 0.700 | 99.005 | 0.278 | 0.016 | 0.001 | 0.120 | |||||
| ma120301_rel_withdbg.cz12c_sync_c32r128 | 6.235 | 93.290 | 0.291 | 0.180 | 0.004 | 0.127 | |||||
| ma120301_rel_withdbg.cz12b_sync_dw0_c32r128 | 0.716 | 99.018 | 0.234 | 0.032 | 0.040 | ||||||
| ma120301_rel_withdbg.cz12c_sync_dw0_c32r128 | 6.106 | 93.440 | 0.268 | 0.178 | 0.008 | 0.127 |
Performance metrics for the DBMS listed above. Some are normalized by throughput, others are not. Legend for results is here.
ips	qps	rps	rmbps	wps	wmbps	rpq	rkbpq	wpi	wkbpi	csps	cpups	cspq	cpupq	dbgb1	dbgb2	rss	maxop	p50	p99	tag
881057	0	0	0.0	51689.8	371.1	0.000	0.000	0.059	0.431	281435	26.2	0.319	14	13.3	114.1	14.2	0.120	49347	45951	ma120301_rel_withdbg.cz12b_sync_c32r128
1162791	0	2	0.0	23855.0	476.5	0.000	0.000	0.021	0.420	280028	34.2	0.241	14	13.3	114.6	13.6	0.127	69325	61931	ma120301_rel_withdbg.cz12c_sync_c32r128
877193	0	1	0.0	50781.5	364.8	0.000	0.000	0.058	0.426	277058	25.9	0.316	14	13.3	114.1	14.2	0.040	49147	46350	ma120301_rel_withdbg.cz12b_sync_dw0_c32r128
1156069	0	2	0.0	23932.0	477.2	0.000	0.000	0.021	0.423	282168	34.2	0.244	14	13.3	114.6	13.6	0.127	68924	60457	ma120301_rel_withdbg.cz12c_sync_dw0_c32r128
Average values from iostat.
r/s	rkB/s	rrqm/s	%rrqm	r_await	rareq-s	w/s	wkB/s	wrqm/s	%wrqm	w_await	wareq-s	d/s	dkB/s	drqm/s	%drqm	d_await	dareq-s	f/s	f_await	aqu-sz	%util
0.449	3.289	0.000	0.000	0.067	3.644	51689.8	380015	0.000	0.000	0.041	7.269	0.000	0.000	0.000	0.000	0.000	0.000	0.000	0.000	2.200	99.96		ma120301_rel_withdbg.cz12b_sync_c32r128
1.588	8.259	0.000	0.000	0.056	4.235	23855.0	487935	0.000	0.000	1.292	20.11	0.000	0.000	0.000	0.000	0.000	0.000	0.000	0.000	31.77	99.89		ma120301_rel_withdbg.cz12c_sync_c32r128
1.448	7.478	0.000	0.000	0.225	4.356	50781.5	373543	0.000	0.000	0.058	7.260	0.000	0.000	0.000	0.000	0.000	0.000	0.000	0.000	3.050	99.05		ma120301_rel_withdbg.cz12b_sync_dw0_c32r128
2.529	18.87	0.000	0.000	0.129	4.621	23932.0	488615	0.000	0.000	1.352	20.05	0.000	0.000	0.000	0.000	0.000	0.000	0.000	0.000	33.44	99.91		ma120301_rel_withdbg.cz12c_sync_dw0_c32r128
l.x
l.x: create secondary indexes.
Average throughput:
Performance metrics for the DBMS listed above. Some are normalized by throughput, others are not. Legend for results is here.
ips	qps	rps	rmbps	wps	wmbps	rpq	rkbpq	wpi	wkbpi	csps	cpups	cspq	cpupq	dbgb1	dbgb2	rss	maxop	p50	p99	tag
2352942	0	0	0.0	17469.7	1619.7	0.000	0.000	0.007	0.705	45129	24.1	0.019	5	28.1	129.0	23.5	0.033	NA	NA	ma120301_rel_withdbg.cz12b_sync_c32r128
2409640	0	3	0.0	17692.5	1697.3	0.000	0.000	0.007	0.721	43212	24.9	0.018	5	28.1	129.5	23.3	0.003	NA	NA	ma120301_rel_withdbg.cz12c_sync_c32r128
2222223	0	1	0.0	16412.2	1527.9	0.000	0.000	0.007	0.704	44791	22.6	0.020	5	28.1	129.0	30.4	0.023	NA	NA	ma120301_rel_withdbg.cz12b_sync_dw0_c32r128
2439026	0	3	0.0	17780.4	1705.5	0.000	0.000	0.007	0.716	41850	25.1	0.017	5	28.1	129.5	24.0	0.008	NA	NA	ma120301_rel_withdbg.cz12c_sync_dw0_c32r128
Average values from iostat.
r/s	rkB/s	rrqm/s	%rrqm	r_await	rareq-s	w/s	wkB/s	wrqm/s	%wrqm	w_await	wareq-s	d/s	dkB/s	drqm/s	%drqm	d_await	dareq-s	f/s	f_await	aqu-sz	%util
0.435	1.882	0.000	0.000	0.000	1.882	17469.7	1658591	0.000	0.000	11.17	89.00	0.000	0.000	0.000	0.000	0.000	0.000	0.000	0.000	233.7	90.22		ma120301_rel_withdbg.cz12b_sync_c32r128
2.888	15.35	0.000	0.000	0.650	3.953	17692.5	1738082	0.000	0.000	11.85	93.17	0.000	0.000	0.000	0.000	0.000	0.000	0.000	0.000	253.7	92.34		ma120301_rel_withdbg.cz12c_sync_c32r128
0.722	4.044	0.000	0.000	0.685	4.010	16412.2	1564603	0.000	0.000	13.66	93.11	0.000	0.000	0.000	0.000	0.000	0.000	0.000	0.000	265.1	92.08		ma120301_rel_withdbg.cz12b_sync_dw0_c32r128
3.225	18.75	0.000	0.000	0.766	6.060	17780.4	1746469	0.000	0.000	10.37	96.51	0.000	0.000	0.000	0.000	0.000	0.000	0.000	0.000	232.0	91.64		ma120301_rel_withdbg.cz12c_sync_dw0_c32r128
l.i1
l.i1: continue load after secondary indexes created with 50 inserts per transaction. Graphs for performance per 1-second interval are here.
Average throughput:
Insert response time histogram: each cell has the percentage of responses that take <= the time in the header and max is the max response time in seconds. For the max column values in the top 25% of the range have a red background and in the bottom 25% of the range have a green background. The red background is not used when the min value is within 80% of the max value.
| dbms | 256us | 1ms | 4ms | 16ms | 64ms | 256ms | 1s | 4s | 16s | gt | max |
|---|---|---|---|---|---|---|---|---|---|---|---|
| ma120301_rel_withdbg.cz12b_sync_c32r128 | 64.012 | 35.421 | 0.564 | 0.003 | nonzero | 0.258 | |||||
| ma120301_rel_withdbg.cz12c_sync_c32r128 | 0.003 | 78.682 | 19.909 | 1.394 | 0.012 | nonzero | 0.270 | ||||
| ma120301_rel_withdbg.cz12b_sync_dw0_c32r128 | 65.555 | 33.846 | 0.594 | 0.006 | nonzero | 0.265 | |||||
| ma120301_rel_withdbg.cz12c_sync_dw0_c32r128 | 0.002 | 78.978 | 19.733 | 1.277 | 0.009 | nonzero | 0.269 |
Delete response time histogram: each cell has the percentage of responses that take <= the time in the header and max is the max response time in seconds. For the max column values in the top 25% of the range have a red background and in the bottom 25% of the range have a green background. The red background is not used when the min value is within 80% of the max value.
| dbms | 256us | 1ms | 4ms | 16ms | 64ms | 256ms | 1s | 4s | 16s | gt | max |
|---|---|---|---|---|---|---|---|---|---|---|---|
| ma120301_rel_withdbg.cz12b_sync_c32r128 | nonzero | 45.662 | 53.715 | 0.620 | 0.003 | 0.234 | |||||
| ma120301_rel_withdbg.cz12c_sync_c32r128 | 0.031 | 63.817 | 34.580 | 1.558 | 0.013 | 0.001 | 0.274 | ||||
| ma120301_rel_withdbg.cz12b_sync_dw0_c32r128 | nonzero | 47.266 | 52.081 | 0.647 | 0.006 | nonzero | 0.270 | ||||
| ma120301_rel_withdbg.cz12c_sync_dw0_c32r128 | 0.032 | 63.896 | 34.625 | 1.436 | 0.010 | 0.001 | 0.291 |
Performance metrics for the DBMS listed above. Some are normalized by throughput, others are not. Legend for results is here.
ips	qps	rps	rmbps	wps	wmbps	rpq	rkbpq	wpi	wkbpi	csps	cpups	cspq	cpupq	dbgb1	dbgb2	rss	maxop	p50	p99	tag
215169	0	1	0.0	32662.2	502.5	0.000	0.000	0.152	2.392	291364	58.8	1.354	131	43.9	146.1	46.5	0.258	11088	5244	ma120301_rel_withdbg.cz12b_sync_c32r128
213675	0	1	0.0	13667.3	469.3	0.000	0.000	0.064	2.249	215673	60.4	1.009	136	44.1	146.7	46.5	0.270	10988	5194	ma120301_rel_withdbg.cz12c_sync_c32r128
215343	0	1	0.0	32233.7	426.3	0.000	0.000	0.150	2.027	293482	59.0	1.363	132	44.0	146.1	46.4	0.265	11188	5244	ma120301_rel_withdbg.cz12b_sync_dw0_c32r128
215112	0	1	0.0	12891.1	390.8	0.000	0.000	0.060	1.861	217399	61.0	1.011	136	44.1	146.7	46.5	0.269	11138	5344	ma120301_rel_withdbg.cz12c_sync_dw0_c32r128
Average values from iostat.
r/s	rkB/s	rrqm/s	%rrqm	r_await	rareq-s	w/s	wkB/s	wrqm/s	%wrqm	w_await	wareq-s	d/s	dkB/s	drqm/s	%drqm	d_await	dareq-s	f/s	f_await	aqu-sz	%util
0.786	8.688	0.000	0.000	0.158	6.321	32662.2	514609	0.000	0.000	0.063	15.83	0.000	0.000	0.000	0.000	0.000	0.000	0.000	0.000	2.050	96.49		ma120301_rel_withdbg.cz12b_sync_c32r128
0.908	10.30	0.000	0.000	0.121	3.849	13667.3	480516	0.000	0.000	0.243	34.98	0.000	0.000	0.000	0.000	0.000	0.000	0.000	0.000	3.345	90.67		ma120301_rel_withdbg.cz12c_sync_c32r128
1.216	13.44	0.000	0.000	0.101	6.872	32233.7	436486	0.000	0.000	0.062	13.61	0.000	0.000	0.000	0.000	0.000	0.000	0.000	0.000	2.004	96.29		ma120301_rel_withdbg.cz12b_sync_dw0_c32r128
0.926	9.381	0.000	0.000	0.091	4.962	12891.1	400219	0.000	0.000	0.246	30.85	0.000	0.000	0.000	0.000	0.000	0.000	0.000	0.000	3.189	90.36		ma120301_rel_withdbg.cz12c_sync_dw0_c32r128
l.i2
l.i2: continue load after secondary indexes created with 5 inserts per transaction. Graphs for performance per 1-second interval are here.
Average throughput:
Insert response time histogram: each cell has the percentage of responses that take <= the time in the header and max is the max response time in seconds. For the max column values in the top 25% of the range have a red background and in the bottom 25% of the range have a green background. The red background is not used when the min value is within 80% of the max value.
| dbms | 256us | 1ms | 4ms | 16ms | 64ms | 256ms | 1s | 4s | 16s | gt | max |
|---|---|---|---|---|---|---|---|---|---|---|---|
| ma120301_rel_withdbg.cz12b_sync_c32r128 | 65.603 | 34.308 | 0.085 | 0.004 | 0.033 | ||||||
| ma120301_rel_withdbg.cz12c_sync_c32r128 | 0.064 | 95.025 | 4.814 | 0.091 | 0.007 | 0.031 | |||||
| ma120301_rel_withdbg.cz12b_sync_dw0_c32r128 | 68.825 | 30.974 | 0.182 | 0.019 | 0.048 | ||||||
| ma120301_rel_withdbg.cz12c_sync_dw0_c32r128 | 0.091 | 96.066 | 3.729 | 0.109 | 0.005 | 0.040 |
Delete response time histogram: each cell has the percentage of responses that take <= the time in the header and max is the max response time in seconds. For the max column values in the top 25% of the range have a red background and in the bottom 25% of the range have a green background. The red background is not used when the min value is within 80% of the max value.
| dbms | 256us | 1ms | 4ms | 16ms | 64ms | 256ms | 1s | 4s | 16s | gt | max |
|---|---|---|---|---|---|---|---|---|---|---|---|
| ma120301_rel_withdbg.cz12b_sync_c32r128 | 61.873 | 38.037 | 0.086 | 0.004 | 0.032 | ||||||
| ma120301_rel_withdbg.cz12c_sync_c32r128 | 0.065 | 94.918 | 4.920 | 0.090 | 0.007 | 0.029 | |||||
| ma120301_rel_withdbg.cz12b_sync_dw0_c32r128 | 64.895 | 34.903 | 0.183 | 0.019 | 0.048 | ||||||
| ma120301_rel_withdbg.cz12c_sync_dw0_c32r128 | 0.096 | 96.038 | 3.752 | 0.109 | 0.005 | 0.040 |
Performance metrics for the DBMS listed above. Some are normalized by throughput, others are not. Legend for results is here.
ips	qps	rps	rmbps	wps	wmbps	rpq	rkbpq	wpi	wkbpi	csps	cpups	cspq	cpupq	dbgb1	dbgb2	rss	maxop	p50	p99	tag
95057	0	1	0.0	49848.6	498.3	0.000	0.000	0.524	5.368	797084	36.4	8.385	184	43.9	146.1	44.8	0.033	4805	4495	ma120301_rel_withdbg.cz12b_sync_c32r128
144404	0	0	0.0	18109.2	468.9	0.000	0.000	0.125	3.325	906038	54.5	6.274	181	44.1	146.7	46.5	0.031	7232	6498	ma120301_rel_withdbg.cz12c_sync_c32r128
98087	0	1	0.0	50443.5	397.9	0.000	0.000	0.514	4.154	827338	37.5	8.435	184	44.0	146.1	44.6	0.048	4950	4710	ma120301_rel_withdbg.cz12b_sync_dw0_c32r128
146951	0	1	0.0	17572.9	374.0	0.000	0.000	0.120	2.606	932284	55.4	6.344	181	44.1	146.7	46.5	0.040	7357	6678	ma120301_rel_withdbg.cz12c_sync_dw0_c32r128
Average values from iostat.
r/s	rkB/s	rrqm/s	%rrqm	r_await	rareq-s	w/s	wkB/s	wrqm/s	%wrqm	w_await	wareq-s	d/s	dkB/s	drqm/s	%drqm	d_await	dareq-s	f/s	f_await	aqu-sz	%util
1.073	46.99	0.000	0.000	0.070	6.078	49848.6	510285	0.000	0.000	0.052	10.24	0.000	0.000	0.000	0.000	0.000	0.000	0.000	0.000	2.573	99.87		ma120301_rel_withdbg.cz12b_sync_c32r128
0.474	4.918	0.000	0.000	0.134	2.981	18109.2	480132	0.000	0.000	0.205	26.53	0.000	0.000	0.000	0.000	0.000	0.000	0.000	0.000	3.708	99.86		ma120301_rel_withdbg.cz12c_sync_c32r128
0.794	13.05	0.000	0.000	0.097	7.176	50443.5	407409	0.000	0.000	0.097	8.078	0.000	0.000	0.000	0.000	0.000	0.000	0.000	0.000	4.852	99.92		ma120301_rel_withdbg.cz12b_sync_dw0_c32r128
1.050	15.36	0.000	0.000	0.089	7.480	17572.9	383018	0.000	0.000	0.224	21.81	0.000	0.000	0.000	0.000	0.000	0.000	0.000	0.000	3.922	99.89		ma120301_rel_withdbg.cz12c_sync_dw0_c32r128
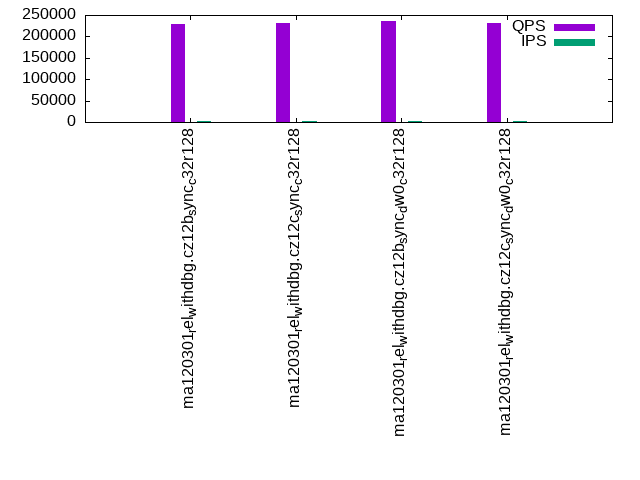
qr100.L1
qr100.L1: range queries with 100 insert/s per client. Graphs for performance per 1-second interval are here.
Average throughput:
Query response time histogram: each cell has the percentage of responses that take <= the time in the header and max is the max response time in seconds. For max values in the top 25% of the range have a red background and in the bottom 25% of the range have a green background. The red background is not used when the min value is within 80% of the max value.
| dbms | 256us | 1ms | 4ms | 16ms | 64ms | 256ms | 1s | 4s | 16s | gt | max |
|---|---|---|---|---|---|---|---|---|---|---|---|
| ma120301_rel_withdbg.cz12b_sync_c32r128 | 99.994 | 0.004 | 0.002 | nonzero | 0.013 | ||||||
| ma120301_rel_withdbg.cz12c_sync_c32r128 | 99.995 | 0.003 | 0.002 | nonzero | 0.012 | ||||||
| ma120301_rel_withdbg.cz12b_sync_dw0_c32r128 | 99.994 | 0.004 | 0.002 | nonzero | 0.012 | ||||||
| ma120301_rel_withdbg.cz12c_sync_dw0_c32r128 | 99.995 | 0.003 | 0.002 | nonzero | 0.011 |
Insert response time histogram: each cell has the percentage of responses that take <= the time in the header and max is the max response time in seconds. For max values in the top 25% of the range have a red background and in the bottom 25% of the range have a green background. The red background is not used when the min value is within 80% of the max value.
| dbms | 256us | 1ms | 4ms | 16ms | 64ms | 256ms | 1s | 4s | 16s | gt | max |
|---|---|---|---|---|---|---|---|---|---|---|---|
| ma120301_rel_withdbg.cz12b_sync_c32r128 | 99.651 | 0.297 | 0.051 | 0.032 | |||||||
| ma120301_rel_withdbg.cz12c_sync_c32r128 | 0.413 | 99.499 | 0.088 | 0.009 | |||||||
| ma120301_rel_withdbg.cz12b_sync_dw0_c32r128 | 98.878 | 1.078 | 0.043 | 0.027 | |||||||
| ma120301_rel_withdbg.cz12c_sync_dw0_c32r128 | 0.444 | 99.533 | 0.023 | 0.006 |
Delete response time histogram: each cell has the percentage of responses that take <= the time in the header and max is the max response time in seconds. For max values in the top 25% of the range have a red background and in the bottom 25% of the range have a green background. The red background is not used when the min value is within 80% of the max value.
| dbms | 256us | 1ms | 4ms | 16ms | 64ms | 256ms | 1s | 4s | 16s | gt | max |
|---|---|---|---|---|---|---|---|---|---|---|---|
| ma120301_rel_withdbg.cz12b_sync_c32r128 | 0.129 | 99.641 | 0.178 | 0.051 | 0.031 | ||||||
| ma120301_rel_withdbg.cz12c_sync_c32r128 | 12.787 | 87.165 | 0.049 | 0.009 | |||||||
| ma120301_rel_withdbg.cz12b_sync_dw0_c32r128 | 0.226 | 99.023 | 0.708 | 0.043 | 0.026 | ||||||
| ma120301_rel_withdbg.cz12c_sync_dw0_c32r128 | 13.194 | 86.795 | 0.010 | 0.006 |
Performance metrics for the DBMS listed above. Some are normalized by throughput, others are not. Legend for results is here.
ips	qps	rps	rmbps	wps	wmbps	rpq	rkbpq	wpi	wkbpi	csps	cpups	cspq	cpupq	dbgb1	dbgb2	rss	maxop	p50	p99	tag
1987	228296	0	0.0	488.5	3.8	0.000	0.000	0.246	1.946	1307553	45.4	5.727	95	43.9	146.1	44.5	0.013	11555	10964	ma120301_rel_withdbg.cz12b_sync_c32r128
1988	230541	0	0.0	95.5	2.7	0.000	0.000	0.048	1.417	1318206	45.5	5.718	95	44.1	146.7	46.2	0.012	11620	11060	ma120301_rel_withdbg.cz12c_sync_c32r128
1988	234965	0	0.0	455.7	3.7	0.000	0.000	0.229	1.886	1344524	44.8	5.722	92	44.0	146.1	44.4	0.012	11891	11348	ma120301_rel_withdbg.cz12b_sync_dw0_c32r128
1987	231588	0	0.0	100.8	2.8	0.000	0.000	0.051	1.439	1323128	45.2	5.713	94	44.1	146.7	46.2	0.011	11683	11076	ma120301_rel_withdbg.cz12c_sync_dw0_c32r128
Average values from iostat.
r/s	rkB/s	rrqm/s	%rrqm	r_await	rareq-s	w/s	wkB/s	wrqm/s	%wrqm	w_await	wareq-s	d/s	dkB/s	drqm/s	%drqm	d_await	dareq-s	f/s	f_await	aqu-sz	%util
0.123	2.463	0.000	0.000	0.003	3.321	488.5	3868.2	0.000	0.000	0.034	7.933	0.000	0.000	0.000	0.000	0.000	0.000	0.000	0.000	0.017	2.322		ma120301_rel_withdbg.cz12b_sync_c32r128
0.023	0.470	0.000	0.000	0.000	0.261	95.50	2815.9	0.000	0.000	0.061	29.56	0.000	0.000	0.000	0.000	0.000	0.000	0.000	0.000	0.005	2.348		ma120301_rel_withdbg.cz12c_sync_c32r128
0.294	3.973	0.000	0.000	0.013	3.108	455.7	3749.7	0.000	0.000	0.036	8.271	0.000	0.000	0.000	0.000	0.000	0.000	0.000	0.000	0.017	2.548		ma120301_rel_withdbg.cz12b_sync_dw0_c32r128
0.233	3.918	0.000	0.000	0.012	1.677	100.8	2858.9	0.000	0.000	0.058	28.77	0.000	0.000	0.000	0.000	0.000	0.000	0.000	0.000	0.006	2.436		ma120301_rel_withdbg.cz12c_sync_dw0_c32r128
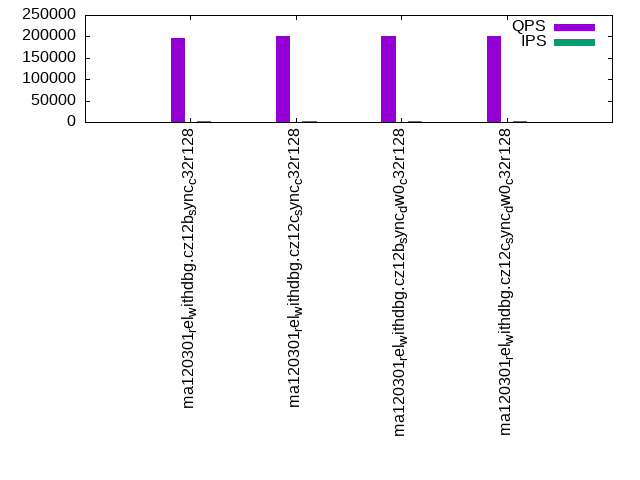
qp100.L2
qp100.L2: point queries with 100 insert/s per client. Graphs for performance per 1-second interval are here.
Average throughput:
Query response time histogram: each cell has the percentage of responses that take <= the time in the header and max is the max response time in seconds. For max values in the top 25% of the range have a red background and in the bottom 25% of the range have a green background. The red background is not used when the min value is within 80% of the max value.
| dbms | 256us | 1ms | 4ms | 16ms | 64ms | 256ms | 1s | 4s | 16s | gt | max |
|---|---|---|---|---|---|---|---|---|---|---|---|
| ma120301_rel_withdbg.cz12b_sync_c32r128 | 99.991 | 0.006 | 0.002 | nonzero | 0.011 | ||||||
| ma120301_rel_withdbg.cz12c_sync_c32r128 | 99.992 | 0.005 | 0.002 | nonzero | 0.012 | ||||||
| ma120301_rel_withdbg.cz12b_sync_dw0_c32r128 | 99.992 | 0.006 | 0.002 | nonzero | 0.011 | ||||||
| ma120301_rel_withdbg.cz12c_sync_dw0_c32r128 | 99.992 | 0.006 | 0.002 | nonzero | 0.012 |
Insert response time histogram: each cell has the percentage of responses that take <= the time in the header and max is the max response time in seconds. For max values in the top 25% of the range have a red background and in the bottom 25% of the range have a green background. The red background is not used when the min value is within 80% of the max value.
| dbms | 256us | 1ms | 4ms | 16ms | 64ms | 256ms | 1s | 4s | 16s | gt | max |
|---|---|---|---|---|---|---|---|---|---|---|---|
| ma120301_rel_withdbg.cz12b_sync_c32r128 | 99.135 | 0.776 | 0.088 | 0.033 | |||||||
| ma120301_rel_withdbg.cz12c_sync_c32r128 | 0.513 | 99.205 | 0.244 | 0.038 | 0.052 | ||||||
| ma120301_rel_withdbg.cz12b_sync_dw0_c32r128 | 98.789 | 1.059 | 0.151 | 0.001 | 0.070 | ||||||
| ma120301_rel_withdbg.cz12c_sync_dw0_c32r128 | 0.465 | 99.251 | 0.271 | 0.013 | 0.027 |
Delete response time histogram: each cell has the percentage of responses that take <= the time in the header and max is the max response time in seconds. For max values in the top 25% of the range have a red background and in the bottom 25% of the range have a green background. The red background is not used when the min value is within 80% of the max value.
| dbms | 256us | 1ms | 4ms | 16ms | 64ms | 256ms | 1s | 4s | 16s | gt | max |
|---|---|---|---|---|---|---|---|---|---|---|---|
| ma120301_rel_withdbg.cz12b_sync_c32r128 | 0.099 | 99.297 | 0.518 | 0.086 | 0.033 | ||||||
| ma120301_rel_withdbg.cz12c_sync_c32r128 | 15.857 | 83.931 | 0.204 | 0.007 | 0.001 | 0.068 | |||||
| ma120301_rel_withdbg.cz12b_sync_dw0_c32r128 | 0.214 | 98.799 | 0.878 | 0.108 | 0.001 | 0.069 | |||||
| ma120301_rel_withdbg.cz12c_sync_dw0_c32r128 | 15.285 | 84.495 | 0.210 | 0.010 | 0.023 |
Performance metrics for the DBMS listed above. Some are normalized by throughput, others are not. Legend for results is here.
ips	qps	rps	rmbps	wps	wmbps	rpq	rkbpq	wpi	wkbpi	csps	cpups	cspq	cpupq	dbgb1	dbgb2	rss	maxop	p50	p99	tag
1987	196579	0	0.0	744.7	11.2	0.000	0.000	0.375	5.768	1140084	44.2	5.800	108	43.9	146.1	44.5	0.011	9893	9478	ma120301_rel_withdbg.cz12b_sync_c32r128
1988	199994	0	0.0	386.4	10.4	0.000	0.000	0.194	5.363	1158552	44.1	5.793	106	44.1	146.7	46.2	0.012	10085	9685	ma120301_rel_withdbg.cz12c_sync_c32r128
1988	200836	0	0.0	775.0	7.8	0.000	0.000	0.390	4.026	1164679	44.5	5.799	106	44.0	146.1	44.5	0.011	10101	9689	ma120301_rel_withdbg.cz12b_sync_dw0_c32r128
1987	200164	1	0.0	354.8	6.8	0.000	0.000	0.179	3.483	1159955	44.1	5.795	106	44.1	146.7	46.2	0.012	10072	9622	ma120301_rel_withdbg.cz12c_sync_dw0_c32r128
Average values from iostat.
r/s	rkB/s	rrqm/s	%rrqm	r_await	rareq-s	w/s	wkB/s	wrqm/s	%wrqm	w_await	wareq-s	d/s	dkB/s	drqm/s	%drqm	d_await	dareq-s	f/s	f_await	aqu-sz	%util
0.022	0.246	0.000	0.000	0.012	0.522	744.7	11463.5	0.000	0.000	0.039	9.944	0.000	0.000	0.000	0.000	0.000	0.000	0.000	0.000	0.033	2.666		ma120301_rel_withdbg.cz12b_sync_c32r128
0.016	0.138	0.000	0.000	0.000	0.165	386.4	10660.9	0.000	0.000	0.074	27.88	0.000	0.000	0.000	0.000	0.000	0.000	0.000	0.000	0.031	3.037		ma120301_rel_withdbg.cz12c_sync_c32r128
0.038	1.098	0.000	0.000	0.001	0.794	775.0	8003.7	0.000	0.000	0.046	8.388	0.000	0.000	0.000	0.000	0.000	0.000	0.000	0.000	0.040	2.897		ma120301_rel_withdbg.cz12b_sync_dw0_c32r128
0.788	27.80	0.000	0.000	0.020	1.398	354.8	6921.1	0.000	0.000	0.066	26.93	0.000	0.000	0.000	0.000	0.000	0.000	0.000	0.000	0.022	3.189		ma120301_rel_withdbg.cz12c_sync_dw0_c32r128
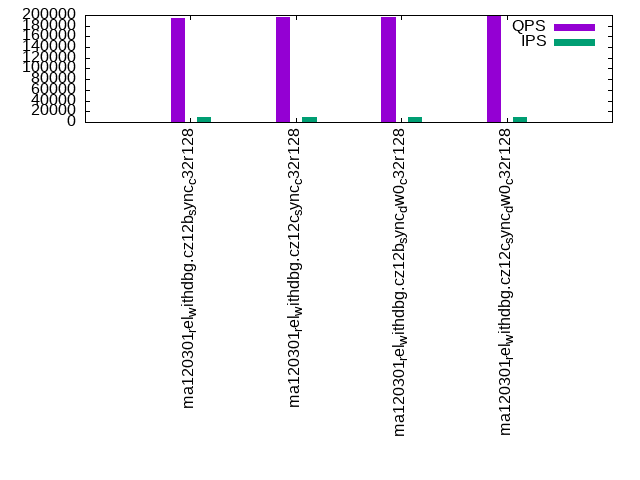
qr500.L3
qr500.L3: range queries with 500 insert/s per client. Graphs for performance per 1-second interval are here.
Average throughput:

Query response time histogram: each cell has the percentage of responses that take <= the time in the header and max is the max response time in seconds. For max values in the top 25% of the range have a red background and in the bottom 25% of the range have a green background. The red background is not used when the min value is within 80% of the max value.
| dbms | 256us | 1ms | 4ms | 16ms | 64ms | 256ms | 1s | 4s | 16s | gt | max |
|---|---|---|---|---|---|---|---|---|---|---|---|
| ma120301_rel_withdbg.cz12b_sync_c32r128 | 99.974 | 0.013 | 0.012 | 0.001 | nonzero | 0.018 | |||||
| ma120301_rel_withdbg.cz12c_sync_c32r128 | 99.979 | 0.011 | 0.010 | 0.001 | nonzero | 0.045 | |||||
| ma120301_rel_withdbg.cz12b_sync_dw0_c32r128 | 99.974 | 0.014 | 0.011 | 0.001 | nonzero | nonzero | 0.069 | ||||
| ma120301_rel_withdbg.cz12c_sync_dw0_c32r128 | 99.980 | 0.011 | 0.009 | 0.001 | nonzero | 0.034 |
Insert response time histogram: each cell has the percentage of responses that take <= the time in the header and max is the max response time in seconds. For max values in the top 25% of the range have a red background and in the bottom 25% of the range have a green background. The red background is not used when the min value is within 80% of the max value.
| dbms | 256us | 1ms | 4ms | 16ms | 64ms | 256ms | 1s | 4s | 16s | gt | max |
|---|---|---|---|---|---|---|---|---|---|---|---|
| ma120301_rel_withdbg.cz12b_sync_c32r128 | 87.792 | 12.156 | 0.053 | 0.046 | |||||||
| ma120301_rel_withdbg.cz12c_sync_c32r128 | 0.464 | 95.140 | 4.348 | 0.048 | 0.056 | ||||||
| ma120301_rel_withdbg.cz12b_sync_dw0_c32r128 | 85.402 | 14.377 | 0.220 | 0.001 | 0.075 | ||||||
| ma120301_rel_withdbg.cz12c_sync_dw0_c32r128 | 0.455 | 95.677 | 3.820 | 0.048 | 0.044 |
Delete response time histogram: each cell has the percentage of responses that take <= the time in the header and max is the max response time in seconds. For max values in the top 25% of the range have a red background and in the bottom 25% of the range have a green background. The red background is not used when the min value is within 80% of the max value.
| dbms | 256us | 1ms | 4ms | 16ms | 64ms | 256ms | 1s | 4s | 16s | gt | max |
|---|---|---|---|---|---|---|---|---|---|---|---|
| ma120301_rel_withdbg.cz12b_sync_c32r128 | 0.150 | 90.465 | 9.341 | 0.045 | 0.043 | ||||||
| ma120301_rel_withdbg.cz12c_sync_c32r128 | 10.797 | 85.818 | 3.360 | 0.026 | 0.050 | ||||||
| ma120301_rel_withdbg.cz12b_sync_dw0_c32r128 | 0.032 | 88.362 | 11.452 | 0.152 | nonzero | 0.072 | |||||
| ma120301_rel_withdbg.cz12c_sync_dw0_c32r128 | 10.917 | 86.146 | 2.903 | 0.033 | 0.046 |
Performance metrics for the DBMS listed above. Some are normalized by throughput, others are not. Legend for results is here.
ips	qps	rps	rmbps	wps	wmbps	rpq	rkbpq	wpi	wkbpi	csps	cpups	cspq	cpupq	dbgb1	dbgb2	rss	maxop	p50	p99	tag
9934	224219	0	0.0	2676.6	40.5	0.000	0.000	0.269	4.170	1289785	46.4	5.752	99	43.9	146.1	44.5	0.018	11275	10517	ma120301_rel_withdbg.cz12b_sync_c32r128
9936	226688	0	0.0	1562.9	44.6	0.000	0.000	0.157	4.595	1300021	46.5	5.735	98	44.1	146.7	46.2	0.045	11444	10744	ma120301_rel_withdbg.cz12c_sync_c32r128
9936	229848	0	0.0	2459.4	28.9	0.000	0.000	0.248	2.977	1320711	46.2	5.746	96	44.0	146.1	44.5	0.069	11619	10772	ma120301_rel_withdbg.cz12b_sync_dw0_c32r128
9936	227753	2	0.1	1449.9	30.0	0.000	0.001	0.146	3.088	1308272	46.5	5.744	98	44.1	146.7	46.2	0.034	11491	10744	ma120301_rel_withdbg.cz12c_sync_dw0_c32r128
Average values from iostat.
r/s	rkB/s	rrqm/s	%rrqm	r_await	rareq-s	w/s	wkB/s	wrqm/s	%wrqm	w_await	wareq-s	d/s	dkB/s	drqm/s	%drqm	d_await	dareq-s	f/s	f_await	aqu-sz	%util
0.076	0.529	0.000	0.000	0.003	0.719	2676.6	41421.9	0.000	0.000	0.047	12.78	0.000	0.000	0.000	0.000	0.000	0.000	0.000	0.000	0.135	7.689		ma120301_rel_withdbg.cz12b_sync_c32r128
0.015	0.060	0.000	0.000	0.005	0.132	1562.9	45653.3	0.000	0.000	0.117	32.67	0.000	0.000	0.000	0.000	0.000	0.000	0.000	0.000	0.149	7.571		ma120301_rel_withdbg.cz12c_sync_c32r128
0.038	0.403	0.000	0.000	0.008	0.743	2459.4	29577.1	0.000	0.000	0.061	11.41	0.000	0.000	0.000	0.000	0.000	0.000	0.000	0.000	0.146	7.196		ma120301_rel_withdbg.cz12b_sync_dw0_c32r128
2.112	134.5	0.000	0.000	0.004	1.239	1449.9	30688.1	0.000	0.000	0.102	28.92	0.000	0.000	0.000	0.000	0.000	0.000	0.000	0.000	0.122	7.466		ma120301_rel_withdbg.cz12c_sync_dw0_c32r128
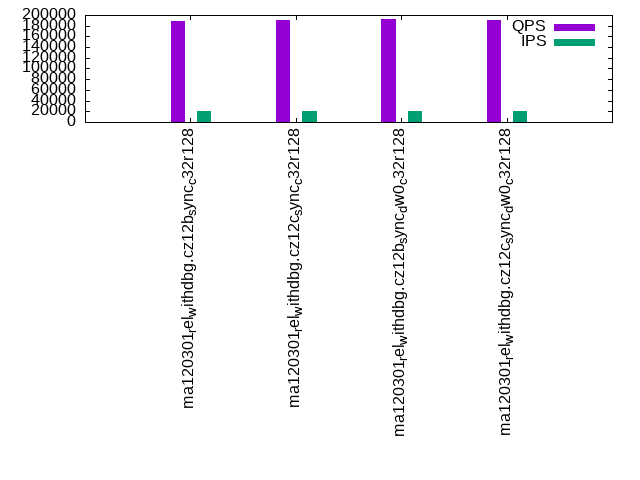
qp500.L4
qp500.L4: point queries with 500 insert/s per client. Graphs for performance per 1-second interval are here.
Average throughput:
Query response time histogram: each cell has the percentage of responses that take <= the time in the header and max is the max response time in seconds. For max values in the top 25% of the range have a red background and in the bottom 25% of the range have a green background. The red background is not used when the min value is within 80% of the max value.
| dbms | 256us | 1ms | 4ms | 16ms | 64ms | 256ms | 1s | 4s | 16s | gt | max |
|---|---|---|---|---|---|---|---|---|---|---|---|
| ma120301_rel_withdbg.cz12b_sync_c32r128 | 99.959 | 0.029 | 0.012 | nonzero | 0.014 | ||||||
| ma120301_rel_withdbg.cz12c_sync_c32r128 | 99.968 | 0.021 | 0.010 | nonzero | nonzero | 0.024 | |||||
| ma120301_rel_withdbg.cz12b_sync_dw0_c32r128 | 99.957 | 0.031 | 0.012 | nonzero | nonzero | 0.045 | |||||
| ma120301_rel_withdbg.cz12c_sync_dw0_c32r128 | 99.967 | 0.023 | 0.010 | nonzero | nonzero | 0.016 |
Insert response time histogram: each cell has the percentage of responses that take <= the time in the header and max is the max response time in seconds. For max values in the top 25% of the range have a red background and in the bottom 25% of the range have a green background. The red background is not used when the min value is within 80% of the max value.
| dbms | 256us | 1ms | 4ms | 16ms | 64ms | 256ms | 1s | 4s | 16s | gt | max |
|---|---|---|---|---|---|---|---|---|---|---|---|
| ma120301_rel_withdbg.cz12b_sync_c32r128 | 82.278 | 17.690 | 0.032 | 0.045 | |||||||
| ma120301_rel_withdbg.cz12c_sync_c32r128 | 0.370 | 93.760 | 5.827 | 0.043 | 0.046 | ||||||
| ma120301_rel_withdbg.cz12b_sync_dw0_c32r128 | 79.113 | 20.568 | 0.315 | 0.003 | 0.083 | ||||||
| ma120301_rel_withdbg.cz12c_sync_dw0_c32r128 | 0.538 | 93.310 | 6.100 | 0.053 | 0.039 |
Delete response time histogram: each cell has the percentage of responses that take <= the time in the header and max is the max response time in seconds. For max values in the top 25% of the range have a red background and in the bottom 25% of the range have a green background. The red background is not used when the min value is within 80% of the max value.
| dbms | 256us | 1ms | 4ms | 16ms | 64ms | 256ms | 1s | 4s | 16s | gt | max |
|---|---|---|---|---|---|---|---|---|---|---|---|
| ma120301_rel_withdbg.cz12b_sync_c32r128 | 0.091 | 86.090 | 13.793 | 0.027 | 0.045 | ||||||
| ma120301_rel_withdbg.cz12c_sync_c32r128 | 5.974 | 89.519 | 4.475 | 0.032 | 0.046 | ||||||
| ma120301_rel_withdbg.cz12b_sync_dw0_c32r128 | 0.018 | 83.084 | 16.667 | 0.229 | 0.002 | 0.080 | |||||
| ma120301_rel_withdbg.cz12c_sync_dw0_c32r128 | 6.258 | 88.978 | 4.726 | 0.038 | 0.038 |
Performance metrics for the DBMS listed above. Some are normalized by throughput, others are not. Legend for results is here.
ips	qps	rps	rmbps	wps	wmbps	rpq	rkbpq	wpi	wkbpi	csps	cpups	cspq	cpupq	dbgb1	dbgb2	rss	maxop	p50	p99	tag
9934	193640	0	0.0	2629.2	44.8	0.000	0.000	0.265	4.617	1128456	45.2	5.828	112	43.9	146.1	44.5	0.014	9766	9222	ma120301_rel_withdbg.cz12b_sync_c32r128
9936	196870	0	0.0	1554.4	44.4	0.000	0.000	0.156	4.577	1143943	45.3	5.811	110	44.1	146.7	46.2	0.024	9944	9414	ma120301_rel_withdbg.cz12c_sync_c32r128
9936	196913	0	0.0	2482.7	31.0	0.000	0.000	0.250	3.196	1148540	45.5	5.833	111	44.0	146.1	44.5	0.045	9909	9385	ma120301_rel_withdbg.cz12b_sync_dw0_c32r128
9936	197216	0	0.0	1420.7	29.7	0.000	0.000	0.143	3.057	1147828	45.4	5.820	110	44.1	146.7	46.3	0.016	9925	9398	ma120301_rel_withdbg.cz12c_sync_dw0_c32r128
Average values from iostat.
r/s	rkB/s	rrqm/s	%rrqm	r_await	rareq-s	w/s	wkB/s	wrqm/s	%wrqm	w_await	wareq-s	d/s	dkB/s	drqm/s	%drqm	d_await	dareq-s	f/s	f_await	aqu-sz	%util
0.079	1.218	0.000	0.000	0.004	0.492	2629.2	45863.8	0.000	0.000	0.049	15.19	0.000	0.000	0.000	0.000	0.000	0.000	0.000	0.000	0.135	7.028		ma120301_rel_withdbg.cz12b_sync_c32r128
0.028	0.121	0.000	0.000	0.011	0.156	1554.4	45475.9	0.000	0.000	0.094	31.38	0.000	0.000	0.000	0.000	0.000	0.000	0.000	0.000	0.127	7.221		ma120301_rel_withdbg.cz12c_sync_c32r128
0.031	0.324	0.000	0.000	0.001	0.459	2482.7	31755.0	0.000	0.000	0.065	12.31	0.000	0.000	0.000	0.000	0.000	0.000	0.000	0.000	0.151	6.865		ma120301_rel_withdbg.cz12b_sync_dw0_c32r128
0.071	0.799	0.000	0.000	0.004	1.328	1420.7	30372.7	0.000	0.000	0.081	26.67	0.000	0.000	0.000	0.000	0.000	0.000	0.000	0.000	0.090	6.878		ma120301_rel_withdbg.cz12c_sync_dw0_c32r128
qr1000.L5
qr1000.L5: range queries with 1000 insert/s per client. Graphs for performance per 1-second interval are here.
Average throughput:

Query response time histogram: each cell has the percentage of responses that take <= the time in the header and max is the max response time in seconds. For max values in the top 25% of the range have a red background and in the bottom 25% of the range have a green background. The red background is not used when the min value is within 80% of the max value.
| dbms | 256us | 1ms | 4ms | 16ms | 64ms | 256ms | 1s | 4s | 16s | gt | max |
|---|---|---|---|---|---|---|---|---|---|---|---|
| ma120301_rel_withdbg.cz12b_sync_c32r128 | 99.932 | 0.038 | 0.028 | 0.001 | nonzero | 0.022 | |||||
| ma120301_rel_withdbg.cz12c_sync_c32r128 | 99.939 | 0.034 | 0.027 | 0.001 | nonzero | 0.018 | |||||
| ma120301_rel_withdbg.cz12b_sync_dw0_c32r128 | 99.934 | 0.038 | 0.026 | 0.001 | nonzero | 0.062 | |||||
| ma120301_rel_withdbg.cz12c_sync_dw0_c32r128 | 99.939 | 0.035 | 0.025 | 0.001 | nonzero | 0.024 |
Insert response time histogram: each cell has the percentage of responses that take <= the time in the header and max is the max response time in seconds. For max values in the top 25% of the range have a red background and in the bottom 25% of the range have a green background. The red background is not used when the min value is within 80% of the max value.
| dbms | 256us | 1ms | 4ms | 16ms | 64ms | 256ms | 1s | 4s | 16s | gt | max |
|---|---|---|---|---|---|---|---|---|---|---|---|
| ma120301_rel_withdbg.cz12b_sync_c32r128 | 65.079 | 34.832 | 0.089 | 0.040 | |||||||
| ma120301_rel_withdbg.cz12c_sync_c32r128 | 0.869 | 80.818 | 18.283 | 0.030 | 0.030 | ||||||
| ma120301_rel_withdbg.cz12b_sync_dw0_c32r128 | 66.755 | 33.127 | 0.118 | 0.001 | 0.070 | ||||||
| ma120301_rel_withdbg.cz12c_sync_dw0_c32r128 | 0.972 | 80.853 | 18.128 | 0.047 | 0.034 |
Delete response time histogram: each cell has the percentage of responses that take <= the time in the header and max is the max response time in seconds. For max values in the top 25% of the range have a red background and in the bottom 25% of the range have a green background. The red background is not used when the min value is within 80% of the max value.
| dbms | 256us | 1ms | 4ms | 16ms | 64ms | 256ms | 1s | 4s | 16s | gt | max |
|---|---|---|---|---|---|---|---|---|---|---|---|
| ma120301_rel_withdbg.cz12b_sync_c32r128 | 0.003 | 68.302 | 31.623 | 0.072 | 0.039 | ||||||
| ma120301_rel_withdbg.cz12c_sync_c32r128 | 2.485 | 80.779 | 16.713 | 0.023 | 0.028 | ||||||
| ma120301_rel_withdbg.cz12b_sync_dw0_c32r128 | 0.005 | 69.739 | 30.161 | 0.095 | nonzero | 0.065 | |||||
| ma120301_rel_withdbg.cz12c_sync_dw0_c32r128 | 2.843 | 80.402 | 16.716 | 0.039 | 0.033 |
Performance metrics for the DBMS listed above. Some are normalized by throughput, others are not. Legend for results is here.
ips	qps	rps	rmbps	wps	wmbps	rpq	rkbpq	wpi	wkbpi	csps	cpups	cspq	cpupq	dbgb1	dbgb2	rss	maxop	p50	p99	tag
19878	219830	0	0.0	4111.0	78.5	0.000	0.000	0.207	4.041	1267024	47.5	5.764	104	43.9	146.1	44.5	0.022	11092	10376	ma120301_rel_withdbg.cz12b_sync_c32r128
19873	222669	2	0.1	2824.0	87.8	0.000	0.000	0.142	4.525	1279285	47.6	5.745	103	44.1	146.7	46.2	0.018	11188	10580	ma120301_rel_withdbg.cz12c_sync_c32r128
19873	225836	0	0.0	3932.4	55.3	0.000	0.000	0.198	2.852	1301948	47.6	5.765	101	44.0	146.1	44.5	0.062	11428	10629	ma120301_rel_withdbg.cz12b_sync_dw0_c32r128
19873	223703	0	0.0	2576.0	58.3	0.000	0.000	0.130	3.004	1286161	47.5	5.749	102	44.1	146.7	46.3	0.024	11292	10596	ma120301_rel_withdbg.cz12c_sync_dw0_c32r128
Average values from iostat.
r/s	rkB/s	rrqm/s	%rrqm	r_await	rareq-s	w/s	wkB/s	wrqm/s	%wrqm	w_await	wareq-s	d/s	dkB/s	drqm/s	%drqm	d_await	dareq-s	f/s	f_await	aqu-sz	%util
0.082	0.945	0.000	0.000	0.037	0.937	4111.0	80334.6	0.000	0.000	0.052	18.45	0.000	0.000	0.000	0.000	0.000	0.000	0.000	0.000	0.218	11.90		ma120301_rel_withdbg.cz12b_sync_c32r128
1.745	57.11	0.000	0.000	0.009	0.488	2824.0	89930.9	0.000	0.000	0.090	33.67	0.000	0.000	0.000	0.000	0.000	0.000	0.000	0.000	0.227	11.23		ma120301_rel_withdbg.cz12c_sync_c32r128
0.091	1.009	0.000	0.000	0.007	1.011	3932.4	56675.2	0.000	0.000	0.045	14.27	0.000	0.000	0.000	0.000	0.000	0.000	0.000	0.000	0.167	11.72		ma120301_rel_withdbg.cz12b_sync_dw0_c32r128
0.388	23.50	0.000	0.000	0.026	1.890	2576.0	59700.7	0.000	0.000	0.065	26.22	0.000	0.000	0.000	0.000	0.000	0.000	0.000	0.000	0.139	11.11		ma120301_rel_withdbg.cz12c_sync_dw0_c32r128
qp1000.L6
qp1000.L6: point queries with 1000 insert/s per client. Graphs for performance per 1-second interval are here.
Average throughput:
Query response time histogram: each cell has the percentage of responses that take <= the time in the header and max is the max response time in seconds. For max values in the top 25% of the range have a red background and in the bottom 25% of the range have a green background. The red background is not used when the min value is within 80% of the max value.
| dbms | 256us | 1ms | 4ms | 16ms | 64ms | 256ms | 1s | 4s | 16s | gt | max |
|---|---|---|---|---|---|---|---|---|---|---|---|
| ma120301_rel_withdbg.cz12b_sync_c32r128 | 99.863 | 0.113 | 0.024 | nonzero | nonzero | 0.026 | |||||
| ma120301_rel_withdbg.cz12c_sync_c32r128 | 99.853 | 0.125 | 0.022 | nonzero | nonzero | 0.025 | |||||
| ma120301_rel_withdbg.cz12b_sync_dw0_c32r128 | 99.855 | 0.122 | 0.023 | nonzero | nonzero | 0.030 | |||||
| ma120301_rel_withdbg.cz12c_sync_dw0_c32r128 | 99.847 | 0.132 | 0.020 | nonzero | nonzero | 0.025 |
Insert response time histogram: each cell has the percentage of responses that take <= the time in the header and max is the max response time in seconds. For max values in the top 25% of the range have a red background and in the bottom 25% of the range have a green background. The red background is not used when the min value is within 80% of the max value.
| dbms | 256us | 1ms | 4ms | 16ms | 64ms | 256ms | 1s | 4s | 16s | gt | max |
|---|---|---|---|---|---|---|---|---|---|---|---|
| ma120301_rel_withdbg.cz12b_sync_c32r128 | 62.869 | 37.100 | 0.031 | 0.044 | |||||||
| ma120301_rel_withdbg.cz12c_sync_c32r128 | 0.009 | 75.238 | 24.641 | 0.111 | 0.044 | ||||||
| ma120301_rel_withdbg.cz12b_sync_dw0_c32r128 | 61.550 | 38.350 | 0.099 | 0.001 | 0.085 | ||||||
| ma120301_rel_withdbg.cz12c_sync_dw0_c32r128 | 0.012 | 73.529 | 26.339 | 0.121 | 0.051 |
Delete response time histogram: each cell has the percentage of responses that take <= the time in the header and max is the max response time in seconds. For max values in the top 25% of the range have a red background and in the bottom 25% of the range have a green background. The red background is not used when the min value is within 80% of the max value.
| dbms | 256us | 1ms | 4ms | 16ms | 64ms | 256ms | 1s | 4s | 16s | gt | max |
|---|---|---|---|---|---|---|---|---|---|---|---|
| ma120301_rel_withdbg.cz12b_sync_c32r128 | 0.009 | 66.869 | 33.098 | 0.024 | 0.033 | ||||||
| ma120301_rel_withdbg.cz12c_sync_c32r128 | 0.127 | 77.727 | 22.053 | 0.093 | 0.039 | ||||||
| ma120301_rel_withdbg.cz12b_sync_dw0_c32r128 | 0.009 | 65.447 | 34.455 | 0.089 | nonzero | 0.073 | |||||
| ma120301_rel_withdbg.cz12c_sync_dw0_c32r128 | 0.100 | 76.188 | 23.611 | 0.100 | 0.054 |
Performance metrics for the DBMS listed above. Some are normalized by throughput, others are not. Legend for results is here.
ips	qps	rps	rmbps	wps	wmbps	rpq	rkbpq	wpi	wkbpi	csps	cpups	cspq	cpupq	dbgb1	dbgb2	rss	maxop	p50	p99	tag
19873	188725	0	0.0	4482.2	82.2	0.000	0.000	0.226	4.238	1107545	47.4	5.869	121	43.9	146.1	44.5	0.026	9526	8918	ma120301_rel_withdbg.cz12b_sync_c32r128
19873	191156	0	0.0	2843.2	87.5	0.000	0.000	0.143	4.510	1118890	47.5	5.853	119	44.1	146.7	46.2	0.025	9669	9110	ma120301_rel_withdbg.cz12c_sync_c32r128
19878	192036	0	0.0	4228.2	57.3	0.000	0.000	0.213	2.950	1126836	47.4	5.868	118	44.0	146.1	44.5	0.030	9717	9046	ma120301_rel_withdbg.cz12b_sync_dw0_c32r128
19878	191583	0	0.0	2613.0	58.2	0.000	0.000	0.131	3.000	1121755	47.5	5.855	119	44.1	146.7	46.3	0.025	9621	9014	ma120301_rel_withdbg.cz12c_sync_dw0_c32r128
Average values from iostat.
r/s	rkB/s	rrqm/s	%rrqm	r_await	rareq-s	w/s	wkB/s	wrqm/s	%wrqm	w_await	wareq-s	d/s	dkB/s	drqm/s	%drqm	d_await	dareq-s	f/s	f_await	aqu-sz	%util
0.409	3.682	0.000	0.000	0.032	1.613	4482.2	84223.2	0.000	0.000	0.049	18.23	0.000	0.000	0.000	0.000	0.000	0.000	0.000	0.000	0.223	11.92		ma120301_rel_withdbg.cz12b_sync_c32r128
0.062	0.484	0.000	0.000	0.012	0.490	2843.2	89621.8	0.000	0.000	0.073	32.28	0.000	0.000	0.000	0.000	0.000	0.000	0.000	0.000	0.201	10.32		ma120301_rel_withdbg.cz12c_sync_c32r128
0.143	1.385	0.000	0.000	0.028	1.650	4228.2	58645.2	0.000	0.000	0.042	13.76	0.000	0.000	0.000	0.000	0.000	0.000	0.000	0.000	0.178	11.76		ma120301_rel_withdbg.cz12b_sync_dw0_c32r128
0.244	2.520	0.000	0.000	0.021	2.412	2613.0	59638.2	0.000	0.000	0.055	23.99	0.000	0.000	0.000	0.000	0.000	0.000	0.000	0.000	0.127	10.42		ma120301_rel_withdbg.cz12c_sync_dw0_c32r128
l.i0
l.i0: load without secondary indexes
Performance metrics for all DBMS, not just the ones listed above. Some are normalized by throughput, others are not. Legend for results is here.
ips	qps	rps	rmbps	wps	wmbps	rpq	rkbpq	wpi	wkbpi	csps	cpups	cspq	cpupq	dbgb1	dbgb2	rss	maxop	p50	p99	tag
881057	0	0	0.0	51689.8	371.1	0.000	0.000	0.059	0.431	281435	26.2	0.319	14	13.3	114.1	14.2	0.120	49347	45951	ma120301_rel_withdbg.cz12b_sync_c32r128
1162791	0	2	0.0	23855.0	476.5	0.000	0.000	0.021	0.420	280028	34.2	0.241	14	13.3	114.6	13.6	0.127	69325	61931	ma120301_rel_withdbg.cz12c_sync_c32r128
877193	0	1	0.0	50781.5	364.8	0.000	0.000	0.058	0.426	277058	25.9	0.316	14	13.3	114.1	14.2	0.040	49147	46350	ma120301_rel_withdbg.cz12b_sync_dw0_c32r128
1156069	0	2	0.0	23932.0	477.2	0.000	0.000	0.021	0.423	282168	34.2	0.244	14	13.3	114.6	13.6	0.127	68924	60457	ma120301_rel_withdbg.cz12c_sync_dw0_c32r128
l.x
l.x: create secondary indexes
Performance metrics for all DBMS, not just the ones listed above. Some are normalized by throughput, others are not. Legend for results is here.
ips	qps	rps	rmbps	wps	wmbps	rpq	rkbpq	wpi	wkbpi	csps	cpups	cspq	cpupq	dbgb1	dbgb2	rss	maxop	p50	p99	tag
2352942	0	0	0.0	17469.7	1619.7	0.000	0.000	0.007	0.705	45129	24.1	0.019	5	28.1	129.0	23.5	0.033	NA	NA	ma120301_rel_withdbg.cz12b_sync_c32r128
2409640	0	3	0.0	17692.5	1697.3	0.000	0.000	0.007	0.721	43212	24.9	0.018	5	28.1	129.5	23.3	0.003	NA	NA	ma120301_rel_withdbg.cz12c_sync_c32r128
2222223	0	1	0.0	16412.2	1527.9	0.000	0.000	0.007	0.704	44791	22.6	0.020	5	28.1	129.0	30.4	0.023	NA	NA	ma120301_rel_withdbg.cz12b_sync_dw0_c32r128
2439026	0	3	0.0	17780.4	1705.5	0.000	0.000	0.007	0.716	41850	25.1	0.017	5	28.1	129.5	24.0	0.008	NA	NA	ma120301_rel_withdbg.cz12c_sync_dw0_c32r128
l.i1
l.i1: continue load after secondary indexes created with 50 inserts per transaction
Performance metrics for all DBMS, not just the ones listed above. Some are normalized by throughput, others are not. Legend for results is here.
ips	qps	rps	rmbps	wps	wmbps	rpq	rkbpq	wpi	wkbpi	csps	cpups	cspq	cpupq	dbgb1	dbgb2	rss	maxop	p50	p99	tag
215169	0	1	0.0	32662.2	502.5	0.000	0.000	0.152	2.392	291364	58.8	1.354	131	43.9	146.1	46.5	0.258	11088	5244	ma120301_rel_withdbg.cz12b_sync_c32r128
213675	0	1	0.0	13667.3	469.3	0.000	0.000	0.064	2.249	215673	60.4	1.009	136	44.1	146.7	46.5	0.270	10988	5194	ma120301_rel_withdbg.cz12c_sync_c32r128
215343	0	1	0.0	32233.7	426.3	0.000	0.000	0.150	2.027	293482	59.0	1.363	132	44.0	146.1	46.4	0.265	11188	5244	ma120301_rel_withdbg.cz12b_sync_dw0_c32r128
215112	0	1	0.0	12891.1	390.8	0.000	0.000	0.060	1.861	217399	61.0	1.011	136	44.1	146.7	46.5	0.269	11138	5344	ma120301_rel_withdbg.cz12c_sync_dw0_c32r128
l.i2
l.i2: continue load after secondary indexes created with 5 inserts per transaction
Performance metrics for all DBMS, not just the ones listed above. Some are normalized by throughput, others are not. Legend for results is here.
ips	qps	rps	rmbps	wps	wmbps	rpq	rkbpq	wpi	wkbpi	csps	cpups	cspq	cpupq	dbgb1	dbgb2	rss	maxop	p50	p99	tag
95057	0	1	0.0	49848.6	498.3	0.000	0.000	0.524	5.368	797084	36.4	8.385	184	43.9	146.1	44.8	0.033	4805	4495	ma120301_rel_withdbg.cz12b_sync_c32r128
144404	0	0	0.0	18109.2	468.9	0.000	0.000	0.125	3.325	906038	54.5	6.274	181	44.1	146.7	46.5	0.031	7232	6498	ma120301_rel_withdbg.cz12c_sync_c32r128
98087	0	1	0.0	50443.5	397.9	0.000	0.000	0.514	4.154	827338	37.5	8.435	184	44.0	146.1	44.6	0.048	4950	4710	ma120301_rel_withdbg.cz12b_sync_dw0_c32r128
146951	0	1	0.0	17572.9	374.0	0.000	0.000	0.120	2.606	932284	55.4	6.344	181	44.1	146.7	46.5	0.040	7357	6678	ma120301_rel_withdbg.cz12c_sync_dw0_c32r128
qr100.L1
qr100.L1: range queries with 100 insert/s per client
Performance metrics for all DBMS, not just the ones listed above. Some are normalized by throughput, others are not. Legend for results is here.
ips	qps	rps	rmbps	wps	wmbps	rpq	rkbpq	wpi	wkbpi	csps	cpups	cspq	cpupq	dbgb1	dbgb2	rss	maxop	p50	p99	tag
1987	228296	0	0.0	488.5	3.8	0.000	0.000	0.246	1.946	1307553	45.4	5.727	95	43.9	146.1	44.5	0.013	11555	10964	ma120301_rel_withdbg.cz12b_sync_c32r128
1988	230541	0	0.0	95.5	2.7	0.000	0.000	0.048	1.417	1318206	45.5	5.718	95	44.1	146.7	46.2	0.012	11620	11060	ma120301_rel_withdbg.cz12c_sync_c32r128
1988	234965	0	0.0	455.7	3.7	0.000	0.000	0.229	1.886	1344524	44.8	5.722	92	44.0	146.1	44.4	0.012	11891	11348	ma120301_rel_withdbg.cz12b_sync_dw0_c32r128
1987	231588	0	0.0	100.8	2.8	0.000	0.000	0.051	1.439	1323128	45.2	5.713	94	44.1	146.7	46.2	0.011	11683	11076	ma120301_rel_withdbg.cz12c_sync_dw0_c32r128
qp100.L2
qp100.L2: point queries with 100 insert/s per client
Performance metrics for all DBMS, not just the ones listed above. Some are normalized by throughput, others are not. Legend for results is here.
ips	qps	rps	rmbps	wps	wmbps	rpq	rkbpq	wpi	wkbpi	csps	cpups	cspq	cpupq	dbgb1	dbgb2	rss	maxop	p50	p99	tag
1987	196579	0	0.0	744.7	11.2	0.000	0.000	0.375	5.768	1140084	44.2	5.800	108	43.9	146.1	44.5	0.011	9893	9478	ma120301_rel_withdbg.cz12b_sync_c32r128
1988	199994	0	0.0	386.4	10.4	0.000	0.000	0.194	5.363	1158552	44.1	5.793	106	44.1	146.7	46.2	0.012	10085	9685	ma120301_rel_withdbg.cz12c_sync_c32r128
1988	200836	0	0.0	775.0	7.8	0.000	0.000	0.390	4.026	1164679	44.5	5.799	106	44.0	146.1	44.5	0.011	10101	9689	ma120301_rel_withdbg.cz12b_sync_dw0_c32r128
1987	200164	1	0.0	354.8	6.8	0.000	0.000	0.179	3.483	1159955	44.1	5.795	106	44.1	146.7	46.2	0.012	10072	9622	ma120301_rel_withdbg.cz12c_sync_dw0_c32r128
qr500.L3
qr500.L3: range queries with 500 insert/s per client
Performance metrics for all DBMS, not just the ones listed above. Some are normalized by throughput, others are not. Legend for results is here.
ips	qps	rps	rmbps	wps	wmbps	rpq	rkbpq	wpi	wkbpi	csps	cpups	cspq	cpupq	dbgb1	dbgb2	rss	maxop	p50	p99	tag
9934	224219	0	0.0	2676.6	40.5	0.000	0.000	0.269	4.170	1289785	46.4	5.752	99	43.9	146.1	44.5	0.018	11275	10517	ma120301_rel_withdbg.cz12b_sync_c32r128
9936	226688	0	0.0	1562.9	44.6	0.000	0.000	0.157	4.595	1300021	46.5	5.735	98	44.1	146.7	46.2	0.045	11444	10744	ma120301_rel_withdbg.cz12c_sync_c32r128
9936	229848	0	0.0	2459.4	28.9	0.000	0.000	0.248	2.977	1320711	46.2	5.746	96	44.0	146.1	44.5	0.069	11619	10772	ma120301_rel_withdbg.cz12b_sync_dw0_c32r128
9936	227753	2	0.1	1449.9	30.0	0.000	0.001	0.146	3.088	1308272	46.5	5.744	98	44.1	146.7	46.2	0.034	11491	10744	ma120301_rel_withdbg.cz12c_sync_dw0_c32r128
qp500.L4
qp500.L4: point queries with 500 insert/s per client
Performance metrics for all DBMS, not just the ones listed above. Some are normalized by throughput, others are not. Legend for results is here.
ips	qps	rps	rmbps	wps	wmbps	rpq	rkbpq	wpi	wkbpi	csps	cpups	cspq	cpupq	dbgb1	dbgb2	rss	maxop	p50	p99	tag
9934	193640	0	0.0	2629.2	44.8	0.000	0.000	0.265	4.617	1128456	45.2	5.828	112	43.9	146.1	44.5	0.014	9766	9222	ma120301_rel_withdbg.cz12b_sync_c32r128
9936	196870	0	0.0	1554.4	44.4	0.000	0.000	0.156	4.577	1143943	45.3	5.811	110	44.1	146.7	46.2	0.024	9944	9414	ma120301_rel_withdbg.cz12c_sync_c32r128
9936	196913	0	0.0	2482.7	31.0	0.000	0.000	0.250	3.196	1148540	45.5	5.833	111	44.0	146.1	44.5	0.045	9909	9385	ma120301_rel_withdbg.cz12b_sync_dw0_c32r128
9936	197216	0	0.0	1420.7	29.7	0.000	0.000	0.143	3.057	1147828	45.4	5.820	110	44.1	146.7	46.3	0.016	9925	9398	ma120301_rel_withdbg.cz12c_sync_dw0_c32r128
qr1000.L5
qr1000.L5: range queries with 1000 insert/s per client
Performance metrics for all DBMS, not just the ones listed above. Some are normalized by throughput, others are not. Legend for results is here.
ips	qps	rps	rmbps	wps	wmbps	rpq	rkbpq	wpi	wkbpi	csps	cpups	cspq	cpupq	dbgb1	dbgb2	rss	maxop	p50	p99	tag
19878	219830	0	0.0	4111.0	78.5	0.000	0.000	0.207	4.041	1267024	47.5	5.764	104	43.9	146.1	44.5	0.022	11092	10376	ma120301_rel_withdbg.cz12b_sync_c32r128
19873	222669	2	0.1	2824.0	87.8	0.000	0.000	0.142	4.525	1279285	47.6	5.745	103	44.1	146.7	46.2	0.018	11188	10580	ma120301_rel_withdbg.cz12c_sync_c32r128
19873	225836	0	0.0	3932.4	55.3	0.000	0.000	0.198	2.852	1301948	47.6	5.765	101	44.0	146.1	44.5	0.062	11428	10629	ma120301_rel_withdbg.cz12b_sync_dw0_c32r128
19873	223703	0	0.0	2576.0	58.3	0.000	0.000	0.130	3.004	1286161	47.5	5.749	102	44.1	146.7	46.3	0.024	11292	10596	ma120301_rel_withdbg.cz12c_sync_dw0_c32r128
qp1000.L6
qp1000.L6: point queries with 1000 insert/s per client
Performance metrics for all DBMS, not just the ones listed above. Some are normalized by throughput, others are not. Legend for results is here.
ips	qps	rps	rmbps	wps	wmbps	rpq	rkbpq	wpi	wkbpi	csps	cpups	cspq	cpupq	dbgb1	dbgb2	rss	maxop	p50	p99	tag
19873	188725	0	0.0	4482.2	82.2	0.000	0.000	0.226	4.238	1107545	47.4	5.869	121	43.9	146.1	44.5	0.026	9526	8918	ma120301_rel_withdbg.cz12b_sync_c32r128
19873	191156	0	0.0	2843.2	87.5	0.000	0.000	0.143	4.510	1118890	47.5	5.853	119	44.1	146.7	46.2	0.025	9669	9110	ma120301_rel_withdbg.cz12c_sync_c32r128
19878	192036	0	0.0	4228.2	57.3	0.000	0.000	0.213	2.950	1126836	47.4	5.868	118	44.0	146.1	44.5	0.030	9717	9046	ma120301_rel_withdbg.cz12b_sync_dw0_c32r128
19878	191583	0	0.0	2613.0	58.2	0.000	0.000	0.131	3.000	1121755	47.5	5.855	119	44.1	146.7	46.3	0.025	9621	9014	ma120301_rel_withdbg.cz12c_sync_dw0_c32r128
l.i0
- l.i0: load without secondary indexes
- Legend for results is here.
- Each entry lists the percentage of responses that fit in that bucket (slower than max time for previous bucket, faster than min time for next bucket).
Insert response time histogram
256us	1ms	4ms	16ms	64ms	256ms	1s	4s	16s	gt	max	tag
0.000	0.700	99.005	0.278	0.016	0.001	0.000	0.000	0.000	0.000	0.120	ma120301_rel_withdbg.cz12b_sync_c32r128
0.000	6.235	93.290	0.291	0.180	0.004	0.000	0.000	0.000	0.000	0.127	ma120301_rel_withdbg.cz12c_sync_c32r128
0.000	0.716	99.018	0.234	0.032	0.000	0.000	0.000	0.000	0.000	0.040	ma120301_rel_withdbg.cz12b_sync_dw0_c32r128
0.000	6.106	93.440	0.268	0.178	0.008	0.000	0.000	0.000	0.000	0.127	ma120301_rel_withdbg.cz12c_sync_dw0_c32r128
l.x
- l.x: create secondary indexes
- Legend for results is here.
- Each entry lists the percentage of responses that fit in that bucket (slower than max time for previous bucket, faster than min time for next bucket).
TODO - determine whether there is data for create index response time
l.i1
- l.i1: continue load after secondary indexes created with 50 inserts per transaction
- Legend for results is here.
- Each entry lists the percentage of responses that fit in that bucket (slower than max time for previous bucket, faster than min time for next bucket).
Insert response time histogram
256us	1ms	4ms	16ms	64ms	256ms	1s	4s	16s	gt	max	tag
0.000	0.000	64.012	35.421	0.564	0.003	nonzero	0.000	0.000	0.000	0.258	ma120301_rel_withdbg.cz12b_sync_c32r128
0.000	0.003	78.682	19.909	1.394	0.012	nonzero	0.000	0.000	0.000	0.270	ma120301_rel_withdbg.cz12c_sync_c32r128
0.000	0.000	65.555	33.846	0.594	0.006	nonzero	0.000	0.000	0.000	0.265	ma120301_rel_withdbg.cz12b_sync_dw0_c32r128
0.000	0.002	78.978	19.733	1.277	0.009	nonzero	0.000	0.000	0.000	0.269	ma120301_rel_withdbg.cz12c_sync_dw0_c32r128
Delete response time histogram
256us	1ms	4ms	16ms	64ms	256ms	1s	4s	16s	gt	max	tag
0.000	nonzero	45.662	53.715	0.620	0.003	0.000	0.000	0.000	0.000	0.234	ma120301_rel_withdbg.cz12b_sync_c32r128
0.000	0.031	63.817	34.580	1.558	0.013	0.001	0.000	0.000	0.000	0.274	ma120301_rel_withdbg.cz12c_sync_c32r128
0.000	nonzero	47.266	52.081	0.647	0.006	nonzero	0.000	0.000	0.000	0.270	ma120301_rel_withdbg.cz12b_sync_dw0_c32r128
0.000	0.032	63.896	34.625	1.436	0.010	0.001	0.000	0.000	0.000	0.291	ma120301_rel_withdbg.cz12c_sync_dw0_c32r128
l.i2
- l.i2: continue load after secondary indexes created with 5 inserts per transaction
- Legend for results is here.
- Each entry lists the percentage of responses that fit in that bucket (slower than max time for previous bucket, faster than min time for next bucket).
Insert response time histogram
256us	1ms	4ms	16ms	64ms	256ms	1s	4s	16s	gt	max	tag
0.000	65.603	34.308	0.085	0.004	0.000	0.000	0.000	0.000	0.000	0.033	ma120301_rel_withdbg.cz12b_sync_c32r128
0.064	95.025	4.814	0.091	0.007	0.000	0.000	0.000	0.000	0.000	0.031	ma120301_rel_withdbg.cz12c_sync_c32r128
0.000	68.825	30.974	0.182	0.019	0.000	0.000	0.000	0.000	0.000	0.048	ma120301_rel_withdbg.cz12b_sync_dw0_c32r128
0.091	96.066	3.729	0.109	0.005	0.000	0.000	0.000	0.000	0.000	0.040	ma120301_rel_withdbg.cz12c_sync_dw0_c32r128
Delete response time histogram
256us	1ms	4ms	16ms	64ms	256ms	1s	4s	16s	gt	max	tag
0.000	61.873	38.037	0.086	0.004	0.000	0.000	0.000	0.000	0.000	0.032	ma120301_rel_withdbg.cz12b_sync_c32r128
0.065	94.918	4.920	0.090	0.007	0.000	0.000	0.000	0.000	0.000	0.029	ma120301_rel_withdbg.cz12c_sync_c32r128
0.000	64.895	34.903	0.183	0.019	0.000	0.000	0.000	0.000	0.000	0.048	ma120301_rel_withdbg.cz12b_sync_dw0_c32r128
0.096	96.038	3.752	0.109	0.005	0.000	0.000	0.000	0.000	0.000	0.040	ma120301_rel_withdbg.cz12c_sync_dw0_c32r128
qr100.L1
- qr100.L1: range queries with 100 insert/s per client
- Legend for results is here.
- Each entry lists the percentage of responses that fit in that bucket (slower than max time for previous bucket, faster than min time for next bucket).
Query response time histogram
256us	1ms	4ms	16ms	64ms	256ms	1s	4s	16s	gt	max	tag
99.994	0.004	0.002	nonzero	0.000	0.000	0.000	0.000	0.000	0.000	0.013	ma120301_rel_withdbg.cz12b_sync_c32r128
99.995	0.003	0.002	nonzero	0.000	0.000	0.000	0.000	0.000	0.000	0.012	ma120301_rel_withdbg.cz12c_sync_c32r128
99.994	0.004	0.002	nonzero	0.000	0.000	0.000	0.000	0.000	0.000	0.012	ma120301_rel_withdbg.cz12b_sync_dw0_c32r128
99.995	0.003	0.002	nonzero	0.000	0.000	0.000	0.000	0.000	0.000	0.011	ma120301_rel_withdbg.cz12c_sync_dw0_c32r128
Insert response time histogram
256us	1ms	4ms	16ms	64ms	256ms	1s	4s	16s	gt	max	tag
0.000	0.000	99.651	0.297	0.051	0.000	0.000	0.000	0.000	0.000	0.032	ma120301_rel_withdbg.cz12b_sync_c32r128
0.000	0.413	99.499	0.088	0.000	0.000	0.000	0.000	0.000	0.000	0.009	ma120301_rel_withdbg.cz12c_sync_c32r128
0.000	0.000	98.878	1.078	0.043	0.000	0.000	0.000	0.000	0.000	0.027	ma120301_rel_withdbg.cz12b_sync_dw0_c32r128
0.000	0.444	99.533	0.023	0.000	0.000	0.000	0.000	0.000	0.000	0.006	ma120301_rel_withdbg.cz12c_sync_dw0_c32r128
Delete response time histogram
256us	1ms	4ms	16ms	64ms	256ms	1s	4s	16s	gt	max	tag
0.000	0.129	99.641	0.178	0.051	0.000	0.000	0.000	0.000	0.000	0.031	ma120301_rel_withdbg.cz12b_sync_c32r128
0.000	12.787	87.165	0.049	0.000	0.000	0.000	0.000	0.000	0.000	0.009	ma120301_rel_withdbg.cz12c_sync_c32r128
0.000	0.226	99.023	0.708	0.043	0.000	0.000	0.000	0.000	0.000	0.026	ma120301_rel_withdbg.cz12b_sync_dw0_c32r128
0.000	13.194	86.795	0.010	0.000	0.000	0.000	0.000	0.000	0.000	0.006	ma120301_rel_withdbg.cz12c_sync_dw0_c32r128
qp100.L2
- qp100.L2: point queries with 100 insert/s per client
- Legend for results is here.
- Each entry lists the percentage of responses that fit in that bucket (slower than max time for previous bucket, faster than min time for next bucket).
Query response time histogram
256us	1ms	4ms	16ms	64ms	256ms	1s	4s	16s	gt	max	tag
99.991	0.006	0.002	nonzero	0.000	0.000	0.000	0.000	0.000	0.000	0.011	ma120301_rel_withdbg.cz12b_sync_c32r128
99.992	0.005	0.002	nonzero	0.000	0.000	0.000	0.000	0.000	0.000	0.012	ma120301_rel_withdbg.cz12c_sync_c32r128
99.992	0.006	0.002	nonzero	0.000	0.000	0.000	0.000	0.000	0.000	0.011	ma120301_rel_withdbg.cz12b_sync_dw0_c32r128
99.992	0.006	0.002	nonzero	0.000	0.000	0.000	0.000	0.000	0.000	0.012	ma120301_rel_withdbg.cz12c_sync_dw0_c32r128
Insert response time histogram
256us	1ms	4ms	16ms	64ms	256ms	1s	4s	16s	gt	max	tag
0.000	0.000	99.135	0.776	0.088	0.000	0.000	0.000	0.000	0.000	0.033	ma120301_rel_withdbg.cz12b_sync_c32r128
0.000	0.513	99.205	0.244	0.038	0.000	0.000	0.000	0.000	0.000	0.052	ma120301_rel_withdbg.cz12c_sync_c32r128
0.000	0.000	98.789	1.059	0.151	0.001	0.000	0.000	0.000	0.000	0.070	ma120301_rel_withdbg.cz12b_sync_dw0_c32r128
0.000	0.465	99.251	0.271	0.013	0.000	0.000	0.000	0.000	0.000	0.027	ma120301_rel_withdbg.cz12c_sync_dw0_c32r128
Delete response time histogram
256us	1ms	4ms	16ms	64ms	256ms	1s	4s	16s	gt	max	tag
0.000	0.099	99.297	0.518	0.086	0.000	0.000	0.000	0.000	0.000	0.033	ma120301_rel_withdbg.cz12b_sync_c32r128
0.000	15.857	83.931	0.204	0.007	0.001	0.000	0.000	0.000	0.000	0.068	ma120301_rel_withdbg.cz12c_sync_c32r128
0.000	0.214	98.799	0.878	0.108	0.001	0.000	0.000	0.000	0.000	0.069	ma120301_rel_withdbg.cz12b_sync_dw0_c32r128
0.000	15.285	84.495	0.210	0.010	0.000	0.000	0.000	0.000	0.000	0.023	ma120301_rel_withdbg.cz12c_sync_dw0_c32r128
qr500.L3
- qr500.L3: range queries with 500 insert/s per client
- Legend for results is here.
- Each entry lists the percentage of responses that fit in that bucket (slower than max time for previous bucket, faster than min time for next bucket).
Query response time histogram
256us	1ms	4ms	16ms	64ms	256ms	1s	4s	16s	gt	max	tag
99.974	0.013	0.012	0.001	nonzero	0.000	0.000	0.000	0.000	0.000	0.018	ma120301_rel_withdbg.cz12b_sync_c32r128
99.979	0.011	0.010	0.001	nonzero	0.000	0.000	0.000	0.000	0.000	0.045	ma120301_rel_withdbg.cz12c_sync_c32r128
99.974	0.014	0.011	0.001	nonzero	nonzero	0.000	0.000	0.000	0.000	0.069	ma120301_rel_withdbg.cz12b_sync_dw0_c32r128
99.980	0.011	0.009	0.001	nonzero	0.000	0.000	0.000	0.000	0.000	0.034	ma120301_rel_withdbg.cz12c_sync_dw0_c32r128
Insert response time histogram
256us	1ms	4ms	16ms	64ms	256ms	1s	4s	16s	gt	max	tag
0.000	0.000	87.792	12.156	0.053	0.000	0.000	0.000	0.000	0.000	0.046	ma120301_rel_withdbg.cz12b_sync_c32r128
0.000	0.464	95.140	4.348	0.048	0.000	0.000	0.000	0.000	0.000	0.056	ma120301_rel_withdbg.cz12c_sync_c32r128
0.000	0.000	85.402	14.377	0.220	0.001	0.000	0.000	0.000	0.000	0.075	ma120301_rel_withdbg.cz12b_sync_dw0_c32r128
0.000	0.455	95.677	3.820	0.048	0.000	0.000	0.000	0.000	0.000	0.044	ma120301_rel_withdbg.cz12c_sync_dw0_c32r128
Delete response time histogram
256us	1ms	4ms	16ms	64ms	256ms	1s	4s	16s	gt	max	tag
0.000	0.150	90.465	9.341	0.045	0.000	0.000	0.000	0.000	0.000	0.043	ma120301_rel_withdbg.cz12b_sync_c32r128
0.000	10.797	85.818	3.360	0.026	0.000	0.000	0.000	0.000	0.000	0.050	ma120301_rel_withdbg.cz12c_sync_c32r128
0.000	0.032	88.362	11.452	0.152	nonzero	0.000	0.000	0.000	0.000	0.072	ma120301_rel_withdbg.cz12b_sync_dw0_c32r128
0.000	10.917	86.146	2.903	0.033	0.000	0.000	0.000	0.000	0.000	0.046	ma120301_rel_withdbg.cz12c_sync_dw0_c32r128
qp500.L4
- qp500.L4: point queries with 500 insert/s per client
- Legend for results is here.
- Each entry lists the percentage of responses that fit in that bucket (slower than max time for previous bucket, faster than min time for next bucket).
Query response time histogram
256us	1ms	4ms	16ms	64ms	256ms	1s	4s	16s	gt	max	tag
99.959	0.029	0.012	nonzero	0.000	0.000	0.000	0.000	0.000	0.000	0.014	ma120301_rel_withdbg.cz12b_sync_c32r128
99.968	0.021	0.010	nonzero	nonzero	0.000	0.000	0.000	0.000	0.000	0.024	ma120301_rel_withdbg.cz12c_sync_c32r128
99.957	0.031	0.012	nonzero	nonzero	0.000	0.000	0.000	0.000	0.000	0.045	ma120301_rel_withdbg.cz12b_sync_dw0_c32r128
99.967	0.023	0.010	nonzero	nonzero	0.000	0.000	0.000	0.000	0.000	0.016	ma120301_rel_withdbg.cz12c_sync_dw0_c32r128
Insert response time histogram
256us	1ms	4ms	16ms	64ms	256ms	1s	4s	16s	gt	max	tag
0.000	0.000	82.278	17.690	0.032	0.000	0.000	0.000	0.000	0.000	0.045	ma120301_rel_withdbg.cz12b_sync_c32r128
0.000	0.370	93.760	5.827	0.043	0.000	0.000	0.000	0.000	0.000	0.046	ma120301_rel_withdbg.cz12c_sync_c32r128
0.000	0.000	79.113	20.568	0.315	0.003	0.000	0.000	0.000	0.000	0.083	ma120301_rel_withdbg.cz12b_sync_dw0_c32r128
0.000	0.538	93.310	6.100	0.053	0.000	0.000	0.000	0.000	0.000	0.039	ma120301_rel_withdbg.cz12c_sync_dw0_c32r128
Delete response time histogram
256us	1ms	4ms	16ms	64ms	256ms	1s	4s	16s	gt	max	tag
0.000	0.091	86.090	13.793	0.027	0.000	0.000	0.000	0.000	0.000	0.045	ma120301_rel_withdbg.cz12b_sync_c32r128
0.000	5.974	89.519	4.475	0.032	0.000	0.000	0.000	0.000	0.000	0.046	ma120301_rel_withdbg.cz12c_sync_c32r128
0.000	0.018	83.084	16.667	0.229	0.002	0.000	0.000	0.000	0.000	0.080	ma120301_rel_withdbg.cz12b_sync_dw0_c32r128
0.000	6.258	88.978	4.726	0.038	0.000	0.000	0.000	0.000	0.000	0.038	ma120301_rel_withdbg.cz12c_sync_dw0_c32r128
qr1000.L5
- qr1000.L5: range queries with 1000 insert/s per client
- Legend for results is here.
- Each entry lists the percentage of responses that fit in that bucket (slower than max time for previous bucket, faster than min time for next bucket).
Query response time histogram
256us	1ms	4ms	16ms	64ms	256ms	1s	4s	16s	gt	max	tag
99.932	0.038	0.028	0.001	nonzero	0.000	0.000	0.000	0.000	0.000	0.022	ma120301_rel_withdbg.cz12b_sync_c32r128
99.939	0.034	0.027	0.001	nonzero	0.000	0.000	0.000	0.000	0.000	0.018	ma120301_rel_withdbg.cz12c_sync_c32r128
99.934	0.038	0.026	0.001	nonzero	0.000	0.000	0.000	0.000	0.000	0.062	ma120301_rel_withdbg.cz12b_sync_dw0_c32r128
99.939	0.035	0.025	0.001	nonzero	0.000	0.000	0.000	0.000	0.000	0.024	ma120301_rel_withdbg.cz12c_sync_dw0_c32r128
Insert response time histogram
256us	1ms	4ms	16ms	64ms	256ms	1s	4s	16s	gt	max	tag
0.000	0.000	65.079	34.832	0.089	0.000	0.000	0.000	0.000	0.000	0.040	ma120301_rel_withdbg.cz12b_sync_c32r128
0.000	0.869	80.818	18.283	0.030	0.000	0.000	0.000	0.000	0.000	0.030	ma120301_rel_withdbg.cz12c_sync_c32r128
0.000	0.000	66.755	33.127	0.118	0.001	0.000	0.000	0.000	0.000	0.070	ma120301_rel_withdbg.cz12b_sync_dw0_c32r128
0.000	0.972	80.853	18.128	0.047	0.000	0.000	0.000	0.000	0.000	0.034	ma120301_rel_withdbg.cz12c_sync_dw0_c32r128
Delete response time histogram
256us	1ms	4ms	16ms	64ms	256ms	1s	4s	16s	gt	max	tag
0.000	0.003	68.302	31.623	0.072	0.000	0.000	0.000	0.000	0.000	0.039	ma120301_rel_withdbg.cz12b_sync_c32r128
0.000	2.485	80.779	16.713	0.023	0.000	0.000	0.000	0.000	0.000	0.028	ma120301_rel_withdbg.cz12c_sync_c32r128
0.000	0.005	69.739	30.161	0.095	nonzero	0.000	0.000	0.000	0.000	0.065	ma120301_rel_withdbg.cz12b_sync_dw0_c32r128
0.000	2.843	80.402	16.716	0.039	0.000	0.000	0.000	0.000	0.000	0.033	ma120301_rel_withdbg.cz12c_sync_dw0_c32r128
qp1000.L6
- qp1000.L6: point queries with 1000 insert/s per client
- Legend for results is here.
- Each entry lists the percentage of responses that fit in that bucket (slower than max time for previous bucket, faster than min time for next bucket).
Query response time histogram
256us	1ms	4ms	16ms	64ms	256ms	1s	4s	16s	gt	max	tag
99.863	0.113	0.024	nonzero	nonzero	0.000	0.000	0.000	0.000	0.000	0.026	ma120301_rel_withdbg.cz12b_sync_c32r128
99.853	0.125	0.022	nonzero	nonzero	0.000	0.000	0.000	0.000	0.000	0.025	ma120301_rel_withdbg.cz12c_sync_c32r128
99.855	0.122	0.023	nonzero	nonzero	0.000	0.000	0.000	0.000	0.000	0.030	ma120301_rel_withdbg.cz12b_sync_dw0_c32r128
99.847	0.132	0.020	nonzero	nonzero	0.000	0.000	0.000	0.000	0.000	0.025	ma120301_rel_withdbg.cz12c_sync_dw0_c32r128
Insert response time histogram
256us	1ms	4ms	16ms	64ms	256ms	1s	4s	16s	gt	max	tag
0.000	0.000	62.869	37.100	0.031	0.000	0.000	0.000	0.000	0.000	0.044	ma120301_rel_withdbg.cz12b_sync_c32r128
0.000	0.009	75.238	24.641	0.111	0.000	0.000	0.000	0.000	0.000	0.044	ma120301_rel_withdbg.cz12c_sync_c32r128
0.000	0.000	61.550	38.350	0.099	0.001	0.000	0.000	0.000	0.000	0.085	ma120301_rel_withdbg.cz12b_sync_dw0_c32r128
0.000	0.012	73.529	26.339	0.121	0.000	0.000	0.000	0.000	0.000	0.051	ma120301_rel_withdbg.cz12c_sync_dw0_c32r128
Delete response time histogram
256us	1ms	4ms	16ms	64ms	256ms	1s	4s	16s	gt	max	tag
0.000	0.009	66.869	33.098	0.024	0.000	0.000	0.000	0.000	0.000	0.033	ma120301_rel_withdbg.cz12b_sync_c32r128
0.000	0.127	77.727	22.053	0.093	0.000	0.000	0.000	0.000	0.000	0.039	ma120301_rel_withdbg.cz12c_sync_c32r128
0.000	0.009	65.447	34.455	0.089	nonzero	0.000	0.000	0.000	0.000	0.073	ma120301_rel_withdbg.cz12b_sync_dw0_c32r128
0.000	0.100	76.188	23.611	0.100	0.000	0.000	0.000	0.000	0.000	0.054	ma120301_rel_withdbg.cz12c_sync_dw0_c32r128