Introduction
This is a report for the insert benchmark with 120M docs and 12 client(s). It is generated by scripts (bash, awk, sed) and Tufte might not be impressed. An overview of the insert benchmark is here and a short update is here. Below, by DBMS, I mean DBMS+version.config. An example is my8020.c10b40 where my means MySQL, 8020 is version 8.0.20 and c10b40 is the name for the configuration file.
The test server has 32 cores, 128G RAM and 1 NVMe device. The benchmark was run with 12 clients and there were 1 or 3 connections per client (1 for queries or inserts without rate limits, 1+1 for rate limited inserts+deletes). It uses 8 tables with a table per client. It loads 10M rows per table without secondary indexes, creates 3 secondary indexes per table, then inserts 16m+4m rows per table with a delete per insert to avoid growing the table. It then does 6 read+write tests for 1800s each that do queries as fast as possible with 100,100,500,500,1000,1000 inserts/s and the same for deletes/s per client concurrent with the queries. The database is cached. Clients and the DBMS share one server.
The tested DBMS are:
- ma120301_rel_withdbg.cz12b_sync_c32r128 - MariaDB 12.3.1 with the z12b_sync_config that adds sync_binlog=1 and innodb_flush_log_at_trx_commit=1 to z12b
- ma120301_rel_withdbg.cz12c_sync_c32r128 - MariaDB 12.3.1 with the z12c_sync_config that adds innodb_flush_log_at_trx_commit=1 to z12c
- ma120301_rel_withdbg.cz12b_sync_dw0_c32r128 - MariaDB 12.3.1 with the z12b_sync_dw0_config that is like z12b_sync_config and then disables the InnoDB doublwrite buffer
- ma120301_rel_withdbg.cz12c_sync_dw0_c32r128 - MariaDB 12.3.1 with the z12c_sync_dw0_config that is like z12c_sync_config and then disables the InnoDB doublwrite buffer
Contents
- Summary
- l.i0: load without secondary indexes
- l.x: create secondary indexes
- l.i1: continue load after secondary indexes created with 50 inserts per transaction
- l.i2: continue load after secondary indexes created with 5 inserts per transaction
- qr100.L1: range queries with 100 insert/s per client
- qp100.L2: point queries with 100 insert/s per client
- qr500.L3: range queries with 500 insert/s per client
- qp500.L4: point queries with 500 insert/s per client
- qr1000.L5: range queries with 1000 insert/s per client
- qp1000.L6: point queries with 1000 insert/s per client
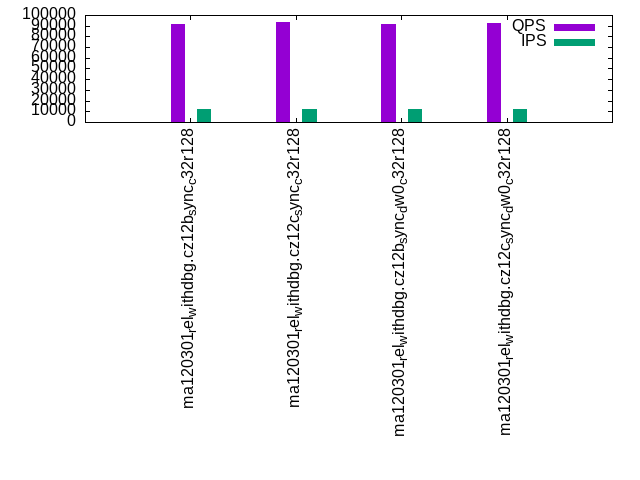
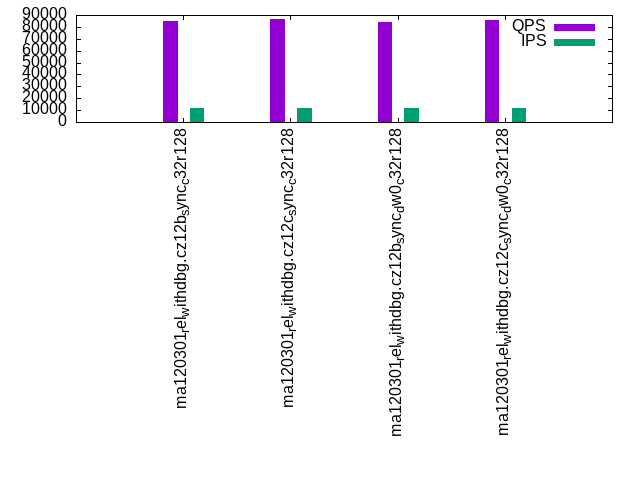
Summary
The numbers are inserts/s for l.i0, l.i1 and l.i2, indexed docs (or rows) /s for l.x and queries/s for qr100, qp100 thru qr1000, qp1000" The values are the average rate over the entire test for inserts (IPS) and queries (QPS). The range of values for IPS and QPS is split into 3 parts: bottom 25%, middle 50%, top 25%. Values in the bottom 25% have a red background, values in the top 25% have a green background and values in the middle have no color. A gray background is used for values that can be ignored because the DBMS did not sustain the target insert rate. Red backgrounds are not used when the minimum value is within 80% of the max value.
| dbms | l.i0 | l.x | l.i1 | l.i2 | qr100 | qp100 | qr500 | qp500 | qr1000 | qp1000 |
|---|---|---|---|---|---|---|---|---|---|---|
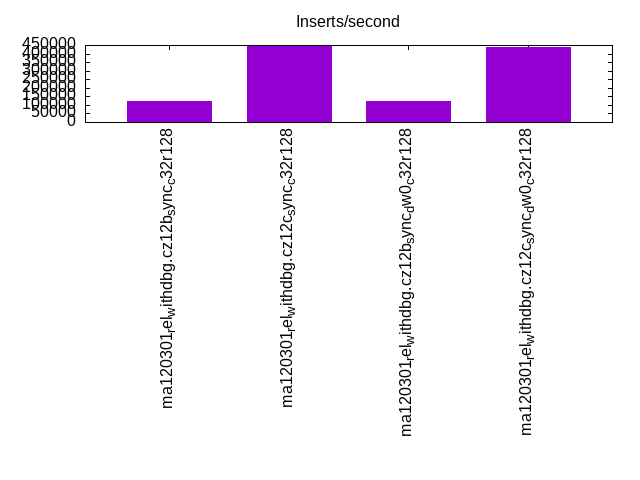
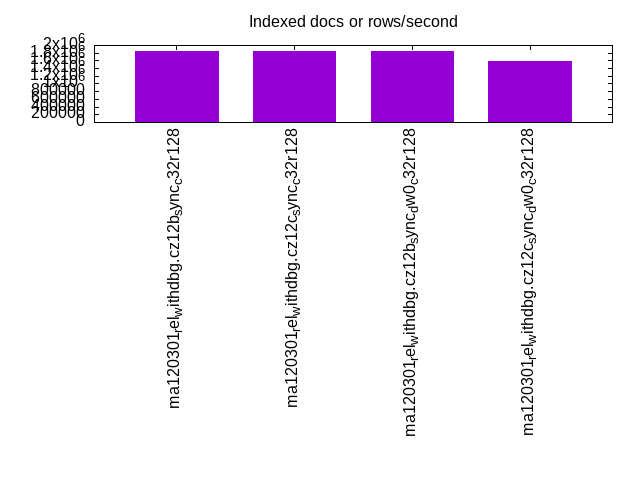
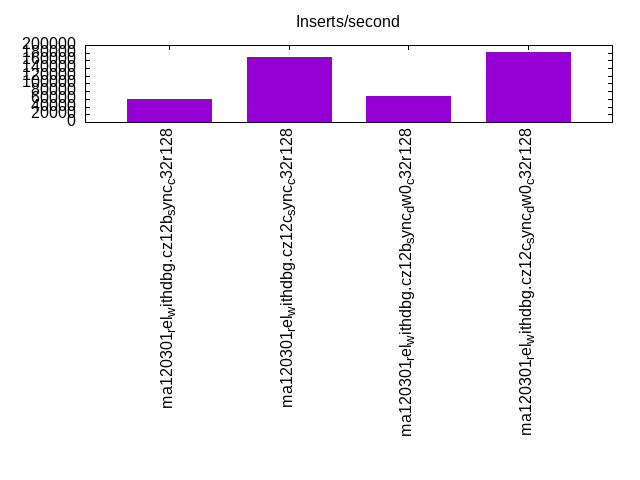
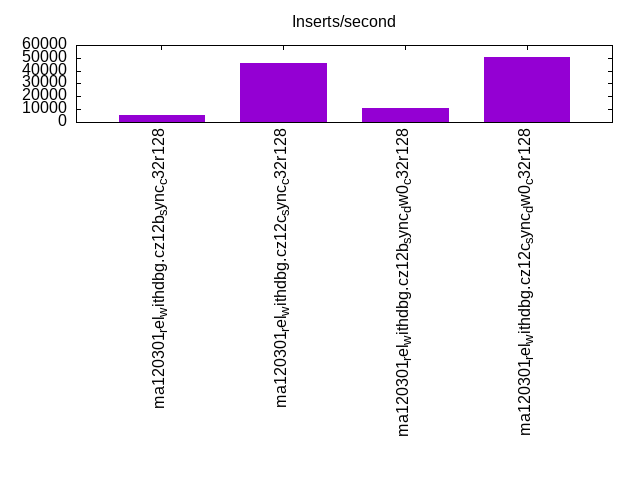
| ma120301_rel_withdbg.cz12b_sync_c32r128 | 122075 | 1846155 | 60302 | 5687 | 93858 | 87164 | 92741 | 86160 | 91479 | 84817 |
| ma120301_rel_withdbg.cz12c_sync_c32r128 | 442804 | 1846155 | 168717 | 46243 | 95224 | 88216 | 94241 | 87328 | 93047 | 86250 |
| ma120301_rel_withdbg.cz12b_sync_dw0_c32r128 | 122449 | 1846155 | 68596 | 10999 | 94346 | 86713 | 93321 | 85776 | 91952 | 84278 |
| ma120301_rel_withdbg.cz12c_sync_dw0_c32r128 | 441176 | 1578949 | 182857 | 50633 | 94480 | 87437 | 93628 | 86545 | 92626 | 85407 |
This table has relative throughput, throughput for the DBMS relative to the DBMS in the first line, using the absolute throughput from the previous table. Values less than 0.95 have a yellow background. Values greater than 1.05 have a blue background.
| dbms | l.i0 | l.x | l.i1 | l.i2 | qr100 | qp100 | qr500 | qp500 | qr1000 | qp1000 |
|---|---|---|---|---|---|---|---|---|---|---|
| ma120301_rel_withdbg.cz12b_sync_c32r128 | 1.00 | 1.00 | 1.00 | 1.00 | 1.00 | 1.00 | 1.00 | 1.00 | 1.00 | 1.00 |
| ma120301_rel_withdbg.cz12c_sync_c32r128 | 3.63 | 1.00 | 2.80 | 8.13 | 1.01 | 1.01 | 1.02 | 1.01 | 1.02 | 1.02 |
| ma120301_rel_withdbg.cz12b_sync_dw0_c32r128 | 1.00 | 1.00 | 1.14 | 1.93 | 1.01 | 0.99 | 1.01 | 1.00 | 1.01 | 0.99 |
| ma120301_rel_withdbg.cz12c_sync_dw0_c32r128 | 3.61 | 0.86 | 3.03 | 8.90 | 1.01 | 1.00 | 1.01 | 1.00 | 1.01 | 1.01 |
This lists the average rate of inserts/s for the tests that do inserts concurrent with queries. For such tests the query rate is listed in the table above. The read+write tests are setup so that the insert rate should match the target rate every second. Cells that are not at least 95% of the target have a red background to indicate a failure to satisfy the target.
| dbms | qr100.L1 | qp100.L2 | qr500.L3 | qp500.L4 | qr1000.L5 | qp1000.L6 |
|---|---|---|---|---|---|---|
| ma120301_rel_withdbg.cz12b_sync_c32r128 | 1192 | 1192 | 5960 | 5964 | 11920 | 11920 |
| ma120301_rel_withdbg.cz12c_sync_c32r128 | 1192 | 1192 | 5960 | 5964 | 11927 | 11927 |
| ma120301_rel_withdbg.cz12b_sync_dw0_c32r128 | 1192 | 1192 | 5960 | 5964 | 11920 | 11920 |
| ma120301_rel_withdbg.cz12c_sync_dw0_c32r128 | 1192 | 1192 | 5960 | 5964 | 11920 | 11920 |
| target | 1200 | 1200 | 6000 | 6000 | 12000 | 12000 |
l.i0
l.i0: load without secondary indexes. Graphs for performance per 1-second interval are here.
Average throughput:
Insert response time histogram: each cell has the percentage of responses that take <= the time in the header and max is the max response time in seconds. For the max column values in the top 25% of the range have a red background and in the bottom 25% of the range have a green background. The red background is not used when the min value is within 80% of the max value.
| dbms | 256us | 1ms | 4ms | 16ms | 64ms | 256ms | 1s | 4s | 16s | gt | max |
|---|---|---|---|---|---|---|---|---|---|---|---|
| ma120301_rel_withdbg.cz12b_sync_c32r128 | 0.289 | 99.662 | 0.048 | 0.001 | 0.201 | ||||||
| ma120301_rel_withdbg.cz12c_sync_c32r128 | 98.474 | 1.521 | 0.003 | 0.002 | 0.220 | ||||||
| ma120301_rel_withdbg.cz12b_sync_dw0_c32r128 | 0.298 | 99.645 | 0.058 | 0.026 | |||||||
| ma120301_rel_withdbg.cz12c_sync_dw0_c32r128 | 98.454 | 1.545 | 0.001 | 0.018 |
Performance metrics for the DBMS listed above. Some are normalized by throughput, others are not. Legend for results is here.
ips	qps	rps	rmbps	wps	wmbps	rpq	rkbpq	wpi	wkbpi	csps	cpups	cspq	cpupq	dbgb1	dbgb2	rss	maxop	p50	p99	tag
122075	0	0	0.0	3198.5	50.3	0.000	0.000	0.026	0.422	41856	6.5	0.343	17	8.0	108.8	9.8	0.201	10599	7299	ma120301_rel_withdbg.cz12b_sync_c32r128
442804	0	0	0.0	4459.8	175.4	0.000	0.000	0.010	0.406	94701	20.8	0.214	15	8.0	109.3	10.0	0.220	39895	37195	ma120301_rel_withdbg.cz12c_sync_c32r128
122449	0	0	0.0	3213.9	50.5	0.000	0.000	0.026	0.422	41973	6.5	0.343	17	8.0	108.8	9.9	0.026	10599	7299	ma120301_rel_withdbg.cz12b_sync_dw0_c32r128
441176	0	0	0.0	4466.2	175.4	0.000	0.000	0.010	0.407	94582	20.9	0.214	15	8.0	109.3	10.0	0.018	39895	37995	ma120301_rel_withdbg.cz12c_sync_dw0_c32r128
Average values from iostat.
r/s	rkB/s	rrqm/s	%rrqm	r_await	rareq-s	w/s	wkB/s	wrqm/s	%wrqm	w_await	wareq-s	d/s	dkB/s	drqm/s	%drqm	d_await	dareq-s	f/s	f_await	aqu-sz	%util
0.029	0.457	0.000	0.000	0.001	0.082	3198.5	51523.3	4187.1	56.74	0.452	16.10	23.37	1222.0	0.000	0.000	0.469	18.31	1040.6	0.445	1.923	96.67		ma120301_rel_withdbg.cz12b_sync_c32r128
0.100	1.600	0.000	0.000	0.002	0.296	4459.8	179591	3237.7	42.88	0.299	40.80	1.400	9.941	0.000	0.000	1.553	6.791	820.0	0.440	1.683	81.93		ma120301_rel_withdbg.cz12c_sync_c32r128
0.029	0.457	0.000	0.000	0.001	0.082	3213.9	51694.1	4190.9	56.63	0.673	16.07	21.29	1188.1	0.000	0.000	0.456	17.45	1043.3	0.444	2.742	96.55		ma120301_rel_withdbg.cz12b_sync_dw0_c32r128
0.100	1.600	0.000	0.000	0.002	0.296	4466.2	179647	3238.4	42.95	0.300	40.77	5.489	33.05	0.000	0.000	1.602	9.271	816.3	0.440	1.685	82.02		ma120301_rel_withdbg.cz12c_sync_dw0_c32r128
l.x
l.x: create secondary indexes.
Average throughput:
Performance metrics for the DBMS listed above. Some are normalized by throughput, others are not. Legend for results is here.
ips	qps	rps	rmbps	wps	wmbps	rpq	rkbpq	wpi	wkbpi	csps	cpups	cspq	cpupq	dbgb1	dbgb2	rss	maxop	p50	p99	tag
1846155	0	0	0.0	13195.5	1269.9	0.000	0.000	0.007	0.704	19338	30.9	0.010	5	16.9	117.7	17.9	0.012	NA	NA	ma120301_rel_withdbg.cz12b_sync_c32r128
1846155	0	0	0.0	12738.4	1262.1	0.000	0.000	0.007	0.700	17436	31.0	0.009	5	16.9	118.2	17.9	0.008	NA	NA	ma120301_rel_withdbg.cz12c_sync_c32r128
1846155	0	0	0.0	13225.8	1269.8	0.000	0.000	0.007	0.704	20094	30.9	0.011	5	16.9	117.7	18.0	0.013	NA	NA	ma120301_rel_withdbg.cz12b_sync_dw0_c32r128
1578949	0	0	0.0	11672.3	1102.9	0.000	0.000	0.007	0.715	18555	27.8	0.012	6	16.9	118.2	17.7	0.007	NA	NA	ma120301_rel_withdbg.cz12c_sync_dw0_c32r128
Average values from iostat.
r/s	rkB/s	rrqm/s	%rrqm	r_await	rareq-s	w/s	wkB/s	wrqm/s	%wrqm	w_await	wareq-s	d/s	dkB/s	drqm/s	%drqm	d_await	dareq-s	f/s	f_await	aqu-sz	%util
0.138	16.00	0.000	0.000	0.009	11.08	13195.5	1300421	407.0	2.832	0.204	89.04	24.34	159209	0.000	0.000	1.245	4139.1	82.48	0.602	3.185	38.77		ma120301_rel_withdbg.cz12b_sync_c32r128
0.046	2.954	0.000	0.000	0.000	8.000	12738.4	1292379	380.9	2.775	0.217	94.55	23.22	152279	0.000	0.000	1.258	4257.5	83.46	0.641	3.307	38.38		ma120301_rel_withdbg.cz12c_sync_c32r128
0.169	18.40	0.000	0.000	0.048	17.08	13225.8	1300292	405.1	2.848	0.237	88.85	24.00	152276	0.000	0.000	1.284	4121.1	82.02	0.631	3.732	38.97		ma120301_rel_withdbg.cz12b_sync_dw0_c32r128
0.013	0.213	0.000	0.000	0.067	1.067	11672.3	1129328	326.6	2.410	0.188	85.10	19.21	131986	0.000	0.000	1.101	3835.5	71.07	0.571	2.763	34.08		ma120301_rel_withdbg.cz12c_sync_dw0_c32r128
l.i1
l.i1: continue load after secondary indexes created with 50 inserts per transaction. Graphs for performance per 1-second interval are here.
Average throughput:
Insert response time histogram: each cell has the percentage of responses that take <= the time in the header and max is the max response time in seconds. For the max column values in the top 25% of the range have a red background and in the bottom 25% of the range have a green background. The red background is not used when the min value is within 80% of the max value.
| dbms | 256us | 1ms | 4ms | 16ms | 64ms | 256ms | 1s | 4s | 16s | gt | max |
|---|---|---|---|---|---|---|---|---|---|---|---|
| ma120301_rel_withdbg.cz12b_sync_c32r128 | 0.013 | 91.794 | 8.163 | 0.028 | 0.002 | 0.907 | |||||
| ma120301_rel_withdbg.cz12c_sync_c32r128 | 84.055 | 15.473 | 0.467 | 0.005 | 0.226 | ||||||
| ma120301_rel_withdbg.cz12b_sync_dw0_c32r128 | 0.020 | 95.291 | 4.684 | 0.004 | nonzero | nonzero | 1.073 | ||||
| ma120301_rel_withdbg.cz12c_sync_dw0_c32r128 | 87.848 | 12.005 | 0.147 | 0.047 |
Delete response time histogram: each cell has the percentage of responses that take <= the time in the header and max is the max response time in seconds. For the max column values in the top 25% of the range have a red background and in the bottom 25% of the range have a green background. The red background is not used when the min value is within 80% of the max value.
| dbms | 256us | 1ms | 4ms | 16ms | 64ms | 256ms | 1s | 4s | 16s | gt | max |
|---|---|---|---|---|---|---|---|---|---|---|---|
| ma120301_rel_withdbg.cz12b_sync_c32r128 | 0.071 | 92.320 | 7.583 | 0.024 | 0.002 | nonzero | 1.084 | ||||
| ma120301_rel_withdbg.cz12c_sync_c32r128 | 87.513 | 12.086 | 0.396 | 0.004 | 0.225 | ||||||
| ma120301_rel_withdbg.cz12b_sync_dw0_c32r128 | 0.097 | 95.549 | 4.350 | 0.003 | 0.001 | nonzero | 1.073 | ||||
| ma120301_rel_withdbg.cz12c_sync_dw0_c32r128 | 90.502 | 9.360 | 0.137 | 0.046 |
Performance metrics for the DBMS listed above. Some are normalized by throughput, others are not. Legend for results is here.
ips	qps	rps	rmbps	wps	wmbps	rpq	rkbpq	wpi	wkbpi	csps	cpups	cspq	cpupq	dbgb1	dbgb2	rss	maxop	p50	p99	tag
60302	0	0	0.0	8633.4	230.6	0.000	0.000	0.143	3.915	76998	16.9	1.277	90	22.2	123.0	23.9	0.907	5599	1650	ma120301_rel_withdbg.cz12b_sync_c32r128
168717	0	0	0.0	12998.5	470.1	0.000	0.000	0.077	2.853	139901	49.9	0.829	95	26.2	128.4	29.0	0.226	15698	5299	ma120301_rel_withdbg.cz12c_sync_c32r128
68596	0	0	0.0	8954.9	203.7	0.000	0.000	0.131	3.041	84942	19.2	1.238	90	22.4	123.2	24.1	1.073	6799	2100	ma120301_rel_withdbg.cz12b_sync_dw0_c32r128
182857	0	0	0.0	12225.6	429.1	0.000	0.000	0.067	2.403	139362	55.6	0.762	97	23.2	124.5	24.9	0.047	16898	5149	ma120301_rel_withdbg.cz12c_sync_dw0_c32r128
Average values from iostat.
r/s	rkB/s	rrqm/s	%rrqm	r_await	rareq-s	w/s	wkB/s	wrqm/s	%wrqm	w_await	wareq-s	d/s	dkB/s	drqm/s	%drqm	d_await	dareq-s	f/s	f_await	aqu-sz	%util
0.001	0.004	0.000	0.000	0.002	0.019	8633.4	236106	2993.8	25.89	0.808	27.24	67.85	2397.3	0.000	0.000	0.978	20.75	1462.4	0.735	6.966	97.22		ma120301_rel_withdbg.cz12b_sync_c32r128
0.000	0.000	0.000	0.000	0.000	0.000	12998.5	481341	706.7	5.148	0.285	37.14	1.395	43.50	0.000	0.000	1.752	27.91	1534.6	0.468	4.388	76.21		ma120301_rel_withdbg.cz12c_sync_c32r128
0.001	0.004	0.000	0.000	0.002	0.021	8954.9	208582	3386.0	27.57	0.943	23.14	63.05	2655.9	0.000	0.000	0.931	17.57	1288.5	0.644	6.836	96.16		ma120301_rel_withdbg.cz12b_sync_dw0_c32r128
0.000	0.000	0.000	0.000	0.000	0.000	12225.6	439431	353.9	2.640	0.198	36.01	1.113	6.369	0.000	0.000	1.577	5.767	1039.8	0.430	2.865	65.20		ma120301_rel_withdbg.cz12c_sync_dw0_c32r128
l.i2
l.i2: continue load after secondary indexes created with 5 inserts per transaction. Graphs for performance per 1-second interval are here.
Average throughput:
Insert response time histogram: each cell has the percentage of responses that take <= the time in the header and max is the max response time in seconds. For the max column values in the top 25% of the range have a red background and in the bottom 25% of the range have a green background. The red background is not used when the min value is within 80% of the max value.
| dbms | 256us | 1ms | 4ms | 16ms | 64ms | 256ms | 1s | 4s | 16s | gt | max |
|---|---|---|---|---|---|---|---|---|---|---|---|
| ma120301_rel_withdbg.cz12b_sync_c32r128 | 0.110 | 74.788 | 25.094 | 0.009 | 0.181 | ||||||
| ma120301_rel_withdbg.cz12c_sync_c32r128 | 0.988 | 98.482 | 0.523 | 0.006 | nonzero | nonzero | nonzero | 1.236 | |||
| ma120301_rel_withdbg.cz12b_sync_dw0_c32r128 | 0.229 | 99.314 | 0.453 | 0.003 | 0.176 | ||||||
| ma120301_rel_withdbg.cz12c_sync_dw0_c32r128 | 2.442 | 97.502 | 0.054 | 0.002 | 0.036 |
Delete response time histogram: each cell has the percentage of responses that take <= the time in the header and max is the max response time in seconds. For the max column values in the top 25% of the range have a red background and in the bottom 25% of the range have a green background. The red background is not used when the min value is within 80% of the max value.
| dbms | 256us | 1ms | 4ms | 16ms | 64ms | 256ms | 1s | 4s | 16s | gt | max |
|---|---|---|---|---|---|---|---|---|---|---|---|
| ma120301_rel_withdbg.cz12b_sync_c32r128 | 0.089 | 74.711 | 25.190 | 0.009 | 0.181 | ||||||
| ma120301_rel_withdbg.cz12c_sync_c32r128 | 1.125 | 98.359 | 0.510 | 0.006 | nonzero | nonzero | nonzero | 1.236 | |||
| ma120301_rel_withdbg.cz12b_sync_dw0_c32r128 | 0.169 | 99.372 | 0.455 | 0.004 | 0.176 | ||||||
| ma120301_rel_withdbg.cz12c_sync_dw0_c32r128 | 1.143 | 98.802 | 0.053 | 0.002 | 0.036 |
Performance metrics for the DBMS listed above. Some are normalized by throughput, others are not. Legend for results is here.
ips	qps	rps	rmbps	wps	wmbps	rpq	rkbpq	wpi	wkbpi	csps	cpups	cspq	cpupq	dbgb1	dbgb2	rss	maxop	p50	p99	tag
5687	0	0	0.0	2583.7	28.2	0.000	0.000	0.454	5.073	46380	4.2	8.155	236	22.2	123.0	24.0	0.181	310	190	ma120301_rel_withdbg.cz12b_sync_c32r128
46243	0	0	0.0	7695.4	182.1	0.000	0.000	0.166	4.033	278406	26.9	6.021	186	26.2	128.4	29.0	1.236	3930	1530	ma120301_rel_withdbg.cz12c_sync_c32r128
10999	0	0	0.0	4739.4	45.1	0.000	0.000	0.431	4.197	89614	7.4	8.147	215	22.4	123.2	24.1	0.176	950	310	ma120301_rel_withdbg.cz12b_sync_dw0_c32r128
50633	0	0	0.0	7711.7	146.7	0.000	0.000	0.152	2.967	304523	29.0	6.014	183	23.2	124.5	25.0	0.036	4344	1980	ma120301_rel_withdbg.cz12c_sync_dw0_c32r128
Average values from iostat.
r/s	rkB/s	rrqm/s	%rrqm	r_await	rareq-s	w/s	wkB/s	wrqm/s	%wrqm	w_await	wareq-s	d/s	dkB/s	drqm/s	%drqm	d_await	dareq-s	f/s	f_await	aqu-sz	%util
0.000	0.000	0.000	0.000	0.001	0.002	2583.7	28848.6	1442.9	36.29	1.212	10.66	0.013	0.801	0.000	0.000	0.143	3.908	971.8	1.303	3.551	98.70		ma120301_rel_withdbg.cz12b_sync_c32r128
0.000	0.000	0.000	0.000	0.000	0.000	7695.4	186498	45.57	0.476	0.343	24.05	0.761	3.486	0.000	0.000	1.772	3.723	1881.3	0.488	3.370	87.80		ma120301_rel_withdbg.cz12c_sync_c32r128
0.000	0.000	0.000	0.000	0.000	0.000	4739.4	46159.3	2720.3	36.53	0.483	9.699	0.019	0.083	0.000	0.000	0.158	0.371	1745.5	0.549	3.163	97.94		ma120301_rel_withdbg.cz12b_sync_dw0_c32r128
0.000	0.000	0.000	0.000	0.000	0.000	7711.7	150218	6.290	0.083	0.270	19.69	0.671	2.866	0.000	0.000	1.471	3.235	1719.5	0.454	2.858	85.23		ma120301_rel_withdbg.cz12c_sync_dw0_c32r128
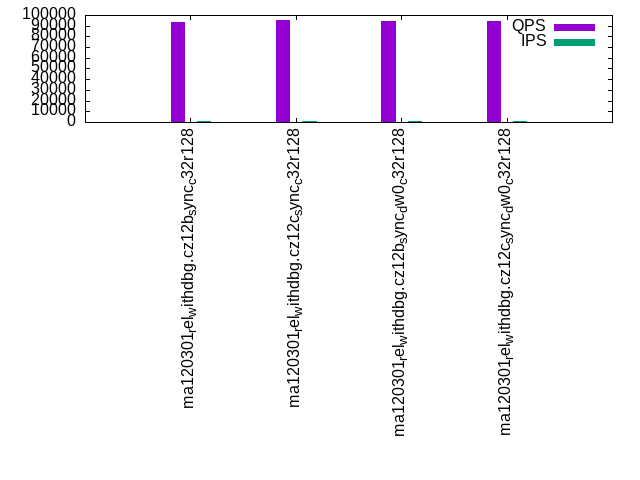
qr100.L1
qr100.L1: range queries with 100 insert/s per client. Graphs for performance per 1-second interval are here.
Average throughput:
Query response time histogram: each cell has the percentage of responses that take <= the time in the header and max is the max response time in seconds. For max values in the top 25% of the range have a red background and in the bottom 25% of the range have a green background. The red background is not used when the min value is within 80% of the max value.
| dbms | 256us | 1ms | 4ms | 16ms | 64ms | 256ms | 1s | 4s | 16s | gt | max |
|---|---|---|---|---|---|---|---|---|---|---|---|
| ma120301_rel_withdbg.cz12b_sync_c32r128 | 99.991 | 0.009 | nonzero | 0.003 | |||||||
| ma120301_rel_withdbg.cz12c_sync_c32r128 | 99.992 | 0.008 | nonzero | 0.002 | |||||||
| ma120301_rel_withdbg.cz12b_sync_dw0_c32r128 | 99.991 | 0.009 | nonzero | 0.004 | |||||||
| ma120301_rel_withdbg.cz12c_sync_dw0_c32r128 | 99.992 | 0.008 | nonzero | 0.002 |
Insert response time histogram: each cell has the percentage of responses that take <= the time in the header and max is the max response time in seconds. For max values in the top 25% of the range have a red background and in the bottom 25% of the range have a green background. The red background is not used when the min value is within 80% of the max value.
| dbms | 256us | 1ms | 4ms | 16ms | 64ms | 256ms | 1s | 4s | 16s | gt | max |
|---|---|---|---|---|---|---|---|---|---|---|---|
| ma120301_rel_withdbg.cz12b_sync_c32r128 | 1.285 | 95.921 | 2.141 | 0.653 | 0.149 | ||||||
| ma120301_rel_withdbg.cz12c_sync_c32r128 | 89.856 | 8.838 | 1.306 | 0.059 | |||||||
| ma120301_rel_withdbg.cz12b_sync_dw0_c32r128 | 0.252 | 93.831 | 4.076 | 1.840 | 0.154 | ||||||
| ma120301_rel_withdbg.cz12c_sync_dw0_c32r128 | 85.771 | 11.579 | 2.639 | 0.012 | 0.072 |
Delete response time histogram: each cell has the percentage of responses that take <= the time in the header and max is the max response time in seconds. For max values in the top 25% of the range have a red background and in the bottom 25% of the range have a green background. The red background is not used when the min value is within 80% of the max value.
| dbms | 256us | 1ms | 4ms | 16ms | 64ms | 256ms | 1s | 4s | 16s | gt | max |
|---|---|---|---|---|---|---|---|---|---|---|---|
| ma120301_rel_withdbg.cz12b_sync_c32r128 | 1.912 | 95.363 | 2.088 | 0.637 | 0.149 | ||||||
| ma120301_rel_withdbg.cz12c_sync_c32r128 | 90.896 | 7.866 | 1.238 | 0.057 | |||||||
| ma120301_rel_withdbg.cz12b_sync_dw0_c32r128 | 0.840 | 93.326 | 4.060 | 1.773 | 0.169 | ||||||
| ma120301_rel_withdbg.cz12c_sync_dw0_c32r128 | 86.396 | 11.021 | 2.574 | 0.009 | 0.069 |
Performance metrics for the DBMS listed above. Some are normalized by throughput, others are not. Legend for results is here.
ips	qps	rps	rmbps	wps	wmbps	rpq	rkbpq	wpi	wkbpi	csps	cpups	cspq	cpupq	dbgb1	dbgb2	rss	maxop	p50	p99	tag
1192	93858	0	0.0	112.9	1.9	0.000	0.000	0.095	1.629	538698	40.2	5.740	137	22.2	123.0	24.0	0.003	7887	7807	ma120301_rel_withdbg.cz12b_sync_c32r128
1192	95224	0	0.0	63.2	1.6	0.000	0.000	0.053	1.382	546036	39.9	5.734	134	26.2	128.4	29.0	0.002	7999	7919	ma120301_rel_withdbg.cz12c_sync_c32r128
1192	94346	0	0.0	110.7	1.9	0.000	0.000	0.093	1.620	541420	40.1	5.739	136	22.4	123.2	24.1	0.004	7903	7839	ma120301_rel_withdbg.cz12b_sync_dw0_c32r128
1192	94480	0	0.0	61.1	1.6	0.000	0.000	0.051	1.407	541740	39.9	5.734	135	23.2	124.5	25.0	0.002	7983	7903	ma120301_rel_withdbg.cz12c_sync_dw0_c32r128
Average values from iostat.
r/s	rkB/s	rrqm/s	%rrqm	r_await	rareq-s	w/s	wkB/s	wrqm/s	%wrqm	w_await	wareq-s	d/s	dkB/s	drqm/s	%drqm	d_await	dareq-s	f/s	f_await	aqu-sz	%util
0.004	0.010	0.000	0.000	0.001	0.006	112.9	1942.3	91.17	44.66	0.580	17.36	0.286	14.21	0.000	0.000	0.031	1.278	47.66	0.602	0.090	3.352		ma120301_rel_withdbg.cz12b_sync_c32r128
0.000	0.000	0.000	0.000	0.000	0.000	63.18	1647.2	3.101	4.927	0.559	27.05	0.001	0.002	0.000	0.000	0.006	0.011	28.19	0.628	0.045	1.947		ma120301_rel_withdbg.cz12c_sync_c32r128
0.000	0.000	0.000	0.000	0.000	0.000	110.7	1931.5	90.18	44.81	0.692	17.68	0.283	3.715	0.000	0.000	0.037	0.422	46.56	0.733	0.101	3.707		ma120301_rel_withdbg.cz12b_sync_dw0_c32r128
0.000	0.000	0.000	0.000	0.000	0.000	61.11	1676.9	3.191	5.244	0.640	28.67	0.001	0.004	0.000	0.000	0.006	0.022	26.84	0.742	0.048	1.914		ma120301_rel_withdbg.cz12c_sync_dw0_c32r128
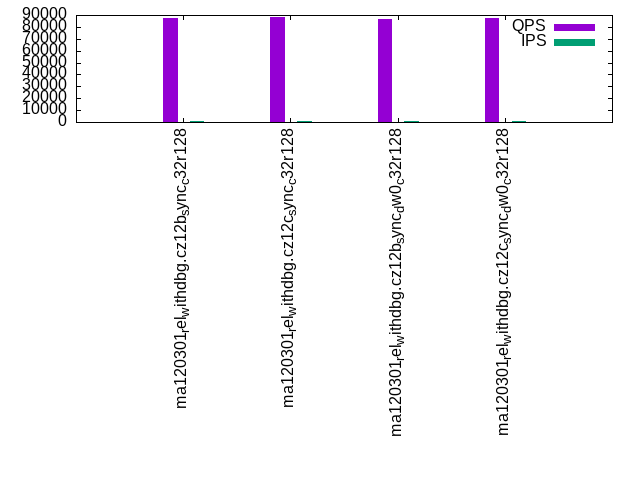
qp100.L2
qp100.L2: point queries with 100 insert/s per client. Graphs for performance per 1-second interval are here.
Average throughput:
Query response time histogram: each cell has the percentage of responses that take <= the time in the header and max is the max response time in seconds. For max values in the top 25% of the range have a red background and in the bottom 25% of the range have a green background. The red background is not used when the min value is within 80% of the max value.
| dbms | 256us | 1ms | 4ms | 16ms | 64ms | 256ms | 1s | 4s | 16s | gt | max |
|---|---|---|---|---|---|---|---|---|---|---|---|
| ma120301_rel_withdbg.cz12b_sync_c32r128 | 99.993 | 0.007 | nonzero | 0.003 | |||||||
| ma120301_rel_withdbg.cz12c_sync_c32r128 | 99.992 | 0.008 | nonzero | 0.003 | |||||||
| ma120301_rel_withdbg.cz12b_sync_dw0_c32r128 | 99.991 | 0.009 | nonzero | 0.002 | |||||||
| ma120301_rel_withdbg.cz12c_sync_dw0_c32r128 | 99.992 | 0.008 | nonzero | 0.003 |
Insert response time histogram: each cell has the percentage of responses that take <= the time in the header and max is the max response time in seconds. For max values in the top 25% of the range have a red background and in the bottom 25% of the range have a green background. The red background is not used when the min value is within 80% of the max value.
| dbms | 256us | 1ms | 4ms | 16ms | 64ms | 256ms | 1s | 4s | 16s | gt | max |
|---|---|---|---|---|---|---|---|---|---|---|---|
| ma120301_rel_withdbg.cz12b_sync_c32r128 | 1.178 | 98.523 | 0.201 | 0.097 | 0.151 | ||||||
| ma120301_rel_withdbg.cz12c_sync_c32r128 | 90.021 | 8.993 | 0.986 | 0.058 | |||||||
| ma120301_rel_withdbg.cz12b_sync_dw0_c32r128 | 0.468 | 99.273 | 0.259 | 0.061 | |||||||
| ma120301_rel_withdbg.cz12c_sync_dw0_c32r128 | 94.977 | 4.653 | 0.370 | 0.061 |
Delete response time histogram: each cell has the percentage of responses that take <= the time in the header and max is the max response time in seconds. For max values in the top 25% of the range have a red background and in the bottom 25% of the range have a green background. The red background is not used when the min value is within 80% of the max value.
| dbms | 256us | 1ms | 4ms | 16ms | 64ms | 256ms | 1s | 4s | 16s | gt | max |
|---|---|---|---|---|---|---|---|---|---|---|---|
| ma120301_rel_withdbg.cz12b_sync_c32r128 | 3.370 | 96.336 | 0.204 | 0.090 | 0.151 | ||||||
| ma120301_rel_withdbg.cz12c_sync_c32r128 | 92.479 | 6.562 | 0.958 | 0.056 | |||||||
| ma120301_rel_withdbg.cz12b_sync_dw0_c32r128 | 1.593 | 98.176 | 0.231 | 0.056 | |||||||
| ma120301_rel_withdbg.cz12c_sync_dw0_c32r128 | 95.252 | 4.394 | 0.354 | 0.058 |
Performance metrics for the DBMS listed above. Some are normalized by throughput, others are not. Legend for results is here.
ips	qps	rps	rmbps	wps	wmbps	rpq	rkbpq	wpi	wkbpi	csps	cpups	cspq	cpupq	dbgb1	dbgb2	rss	maxop	p50	p99	tag
1192	87164	0	0.0	145.7	2.2	0.000	0.000	0.122	1.894	505537	39.9	5.800	146	22.2	123.0	24.0	0.003	7343	7263	ma120301_rel_withdbg.cz12b_sync_c32r128
1192	88216	0	0.0	55.2	1.6	0.000	0.000	0.046	1.372	510973	40.7	5.792	148	26.2	128.4	29.0	0.003	7375	7311	ma120301_rel_withdbg.cz12c_sync_c32r128
1192	86713	0	0.0	120.5	1.9	0.000	0.000	0.101	1.668	502841	39.9	5.799	147	22.4	123.2	24.1	0.002	7263	7183	ma120301_rel_withdbg.cz12b_sync_dw0_c32r128
1192	87437	0	0.0	73.5	1.7	0.000	0.000	0.062	1.435	506570	39.9	5.794	146	23.2	124.5	24.9	0.003	7327	7247	ma120301_rel_withdbg.cz12c_sync_dw0_c32r128
Average values from iostat.
r/s	rkB/s	rrqm/s	%rrqm	r_await	rareq-s	w/s	wkB/s	wrqm/s	%wrqm	w_await	wareq-s	d/s	dkB/s	drqm/s	%drqm	d_await	dareq-s	f/s	f_await	aqu-sz	%util
0.000	0.000	0.000	0.000	0.000	0.000	145.7	2257.4	113.2	44.69	0.485	15.13	0.004	0.020	0.000	0.000	0.039	0.099	59.19	0.511	0.098	3.738		ma120301_rel_withdbg.cz12b_sync_c32r128
0.000	0.000	0.000	0.000	0.000	0.000	55.23	1634.9	4.354	7.350	0.570	30.42	0.699	3.169	0.000	0.000	0.836	3.018	23.90	0.581	0.043	1.666		ma120301_rel_withdbg.cz12c_sync_c32r128
0.000	0.000	0.000	0.000	0.000	0.000	120.5	1987.8	98.08	44.89	0.511	16.73	0.281	3.735	0.000	0.000	0.058	0.393	50.95	0.514	0.088	3.228		ma120301_rel_withdbg.cz12b_sync_dw0_c32r128
0.000	0.000	0.000	0.000	0.000	0.000	73.54	1711.1	4.340	5.615	0.472	23.53	0.103	0.413	0.000	0.000	0.110	0.343	33.39	0.489	0.049	2.097		ma120301_rel_withdbg.cz12c_sync_dw0_c32r128
qr500.L3
qr500.L3: range queries with 500 insert/s per client. Graphs for performance per 1-second interval are here.
Average throughput:
Query response time histogram: each cell has the percentage of responses that take <= the time in the header and max is the max response time in seconds. For max values in the top 25% of the range have a red background and in the bottom 25% of the range have a green background. The red background is not used when the min value is within 80% of the max value.
| dbms | 256us | 1ms | 4ms | 16ms | 64ms | 256ms | 1s | 4s | 16s | gt | max |
|---|---|---|---|---|---|---|---|---|---|---|---|
| ma120301_rel_withdbg.cz12b_sync_c32r128 | 99.971 | 0.028 | nonzero | nonzero | nonzero | 0.023 | |||||
| ma120301_rel_withdbg.cz12c_sync_c32r128 | 99.977 | 0.023 | nonzero | nonzero | nonzero | 0.019 | |||||
| ma120301_rel_withdbg.cz12b_sync_dw0_c32r128 | 99.974 | 0.026 | nonzero | nonzero | 0.006 | ||||||
| ma120301_rel_withdbg.cz12c_sync_dw0_c32r128 | 99.976 | 0.023 | nonzero | nonzero | 0.013 |
Insert response time histogram: each cell has the percentage of responses that take <= the time in the header and max is the max response time in seconds. For max values in the top 25% of the range have a red background and in the bottom 25% of the range have a green background. The red background is not used when the min value is within 80% of the max value.
| dbms | 256us | 1ms | 4ms | 16ms | 64ms | 256ms | 1s | 4s | 16s | gt | max |
|---|---|---|---|---|---|---|---|---|---|---|---|
| ma120301_rel_withdbg.cz12b_sync_c32r128 | 0.383 | 99.456 | 0.161 | 0.054 | |||||||
| ma120301_rel_withdbg.cz12c_sync_c32r128 | 94.888 | 5.100 | 0.012 | 0.036 | |||||||
| ma120301_rel_withdbg.cz12b_sync_dw0_c32r128 | 0.373 | 99.546 | 0.081 | 0.026 | |||||||
| ma120301_rel_withdbg.cz12c_sync_dw0_c32r128 | 95.132 | 4.865 | 0.003 | 0.024 |
Delete response time histogram: each cell has the percentage of responses that take <= the time in the header and max is the max response time in seconds. For max values in the top 25% of the range have a red background and in the bottom 25% of the range have a green background. The red background is not used when the min value is within 80% of the max value.
| dbms | 256us | 1ms | 4ms | 16ms | 64ms | 256ms | 1s | 4s | 16s | gt | max |
|---|---|---|---|---|---|---|---|---|---|---|---|
| ma120301_rel_withdbg.cz12b_sync_c32r128 | 0.353 | 99.528 | 0.119 | 0.054 | |||||||
| ma120301_rel_withdbg.cz12c_sync_c32r128 | 95.187 | 4.809 | 0.004 | 0.030 | |||||||
| ma120301_rel_withdbg.cz12b_sync_dw0_c32r128 | 0.719 | 99.215 | 0.066 | 0.026 | |||||||
| ma120301_rel_withdbg.cz12c_sync_dw0_c32r128 | 95.576 | 4.423 | 0.001 | 0.023 |
Performance metrics for the DBMS listed above. Some are normalized by throughput, others are not. Legend for results is here.
ips	qps	rps	rmbps	wps	wmbps	rpq	rkbpq	wpi	wkbpi	csps	cpups	cspq	cpupq	dbgb1	dbgb2	rss	maxop	p50	p99	tag
5960	92741	0	0.0	706.8	17.4	0.000	0.000	0.119	2.996	535641	42.0	5.776	145	22.2	123.0	24.0	0.023	7743	7615	ma120301_rel_withdbg.cz12b_sync_c32r128
5960	94241	0	0.0	549.6	17.1	0.000	0.000	0.092	2.930	542765	41.2	5.759	140	26.2	128.4	29.0	0.019	7871	7727	ma120301_rel_withdbg.cz12c_sync_c32r128
5960	93321	0	0.0	704.2	13.6	0.000	0.000	0.118	2.344	539184	42.0	5.778	144	22.4	123.2	24.1	0.006	7807	7695	ma120301_rel_withdbg.cz12b_sync_dw0_c32r128
5960	93628	0	0.0	510.7	13.0	0.000	0.000	0.086	2.226	539298	41.1	5.760	140	23.2	124.5	25.0	0.013	7871	7791	ma120301_rel_withdbg.cz12c_sync_dw0_c32r128
Average values from iostat.
r/s	rkB/s	rrqm/s	%rrqm	r_await	rareq-s	w/s	wkB/s	wrqm/s	%wrqm	w_await	wareq-s	d/s	dkB/s	drqm/s	%drqm	d_await	dareq-s	f/s	f_await	aqu-sz	%util
0.000	0.000	0.000	0.000	0.000	0.000	706.8	17857.5	252.7	39.42	0.549	25.11	2.878	362.4	0.000	0.000	0.204	14.31	150.9	0.501	0.362	9.171		ma120301_rel_withdbg.cz12b_sync_c32r128
0.001	0.002	0.000	0.000	0.000	0.011	549.6	17462.2	4.513	2.048	0.507	42.66	0.412	5.783	0.000	0.000	0.595	5.791	85.69	0.436	0.177	4.691		ma120301_rel_withdbg.cz12c_sync_c32r128
0.000	0.000	0.000	0.000	0.000	0.000	704.2	13968.5	306.7	40.93	0.573	22.50	7.359	163.1	0.000	0.000	0.341	4.755	153.2	0.519	0.568	9.908		ma120301_rel_withdbg.cz12b_sync_dw0_c32r128
0.000	0.000	0.000	0.000	0.000	0.000	510.7	13268.7	4.332	2.120	0.489	42.03	0.581	2.327	0.000	0.000	0.871	2.236	71.35	0.439	0.165	4.239		ma120301_rel_withdbg.cz12c_sync_dw0_c32r128
qp500.L4
qp500.L4: point queries with 500 insert/s per client. Graphs for performance per 1-second interval are here.
Average throughput:
Query response time histogram: each cell has the percentage of responses that take <= the time in the header and max is the max response time in seconds. For max values in the top 25% of the range have a red background and in the bottom 25% of the range have a green background. The red background is not used when the min value is within 80% of the max value.
| dbms | 256us | 1ms | 4ms | 16ms | 64ms | 256ms | 1s | 4s | 16s | gt | max |
|---|---|---|---|---|---|---|---|---|---|---|---|
| ma120301_rel_withdbg.cz12b_sync_c32r128 | 99.972 | 0.028 | nonzero | nonzero | 0.014 | ||||||
| ma120301_rel_withdbg.cz12c_sync_c32r128 | 99.976 | 0.024 | nonzero | 0.003 | |||||||
| ma120301_rel_withdbg.cz12b_sync_dw0_c32r128 | 99.972 | 0.028 | nonzero | 0.002 | |||||||
| ma120301_rel_withdbg.cz12c_sync_dw0_c32r128 | 99.978 | 0.022 | nonzero | 0.003 |
Insert response time histogram: each cell has the percentage of responses that take <= the time in the header and max is the max response time in seconds. For max values in the top 25% of the range have a red background and in the bottom 25% of the range have a green background. The red background is not used when the min value is within 80% of the max value.
| dbms | 256us | 1ms | 4ms | 16ms | 64ms | 256ms | 1s | 4s | 16s | gt | max |
|---|---|---|---|---|---|---|---|---|---|---|---|
| ma120301_rel_withdbg.cz12b_sync_c32r128 | 0.293 | 99.012 | 0.694 | 0.002 | 0.089 | ||||||
| ma120301_rel_withdbg.cz12c_sync_c32r128 | 95.908 | 3.790 | 0.287 | 0.015 | 0.080 | ||||||
| ma120301_rel_withdbg.cz12b_sync_dw0_c32r128 | 0.359 | 99.610 | 0.031 | 0.029 | |||||||
| ma120301_rel_withdbg.cz12c_sync_dw0_c32r128 | 97.102 | 2.101 | 0.795 | 0.002 | 0.074 |
Delete response time histogram: each cell has the percentage of responses that take <= the time in the header and max is the max response time in seconds. For max values in the top 25% of the range have a red background and in the bottom 25% of the range have a green background. The red background is not used when the min value is within 80% of the max value.
| dbms | 256us | 1ms | 4ms | 16ms | 64ms | 256ms | 1s | 4s | 16s | gt | max |
|---|---|---|---|---|---|---|---|---|---|---|---|
| ma120301_rel_withdbg.cz12b_sync_c32r128 | 0.550 | 98.817 | 0.630 | 0.002 | 0.089 | ||||||
| ma120301_rel_withdbg.cz12c_sync_c32r128 | 96.363 | 3.352 | 0.272 | 0.013 | 0.077 | ||||||
| ma120301_rel_withdbg.cz12b_sync_dw0_c32r128 | 0.395 | 99.588 | 0.016 | 0.025 | |||||||
| ma120301_rel_withdbg.cz12c_sync_dw0_c32r128 | 97.478 | 1.753 | 0.769 | nonzero | 0.074 |
Performance metrics for the DBMS listed above. Some are normalized by throughput, others are not. Legend for results is here.
ips	qps	rps	rmbps	wps	wmbps	rpq	rkbpq	wpi	wkbpi	csps	cpups	cspq	cpupq	dbgb1	dbgb2	rss	maxop	p50	p99	tag
5964	86160	0	0.0	751.7	17.7	0.000	0.000	0.126	3.047	503773	41.2	5.847	153	22.2	123.0	24.0	0.014	7247	7119	ma120301_rel_withdbg.cz12b_sync_c32r128
5964	87328	0	0.0	568.6	17.2	0.000	0.000	0.095	2.961	508331	41.7	5.821	153	26.2	128.4	29.0	0.003	7327	7231	ma120301_rel_withdbg.cz12c_sync_c32r128
5964	85776	0	0.0	683.0	13.5	0.000	0.000	0.115	2.317	501398	40.9	5.845	153	22.4	123.2	24.1	0.002	7183	7103	ma120301_rel_withdbg.cz12b_sync_dw0_c32r128
5964	86545	0	0.0	620.0	14.4	0.000	0.000	0.104	2.476	504738	41.0	5.832	152	23.2	124.5	24.9	0.003	7231	7151	ma120301_rel_withdbg.cz12c_sync_dw0_c32r128
Average values from iostat.
r/s	rkB/s	rrqm/s	%rrqm	r_await	rareq-s	w/s	wkB/s	wrqm/s	%wrqm	w_await	wareq-s	d/s	dkB/s	drqm/s	%drqm	d_await	dareq-s	f/s	f_await	aqu-sz	%util
0.000	0.000	0.000	0.000	0.000	0.000	751.7	18171.7	294.2	39.55	0.554	23.70	7.998	886.7	0.000	0.000	0.378	26.18	173.5	0.518	0.425	10.81		ma120301_rel_withdbg.cz12b_sync_c32r128
0.000	0.000	0.000	0.000	0.000	0.000	568.6	17656.8	4.562	1.802	0.501	41.09	0.304	1.310	0.000	0.000	0.496	1.436	93.48	0.459	0.189	5.039		ma120301_rel_withdbg.cz12c_sync_c32r128
0.000	0.000	0.000	0.000	0.000	0.000	683.0	13816.4	281.5	39.30	0.531	23.11	3.474	18.19	0.000	0.000	0.197	0.795	143.5	0.508	0.354	9.160		ma120301_rel_withdbg.cz12b_sync_dw0_c32r128
0.000	0.000	0.000	0.000	0.000	0.000	620.0	14765.1	4.032	1.614	0.497	36.45	0.380	1.523	0.000	0.000	0.623	1.569	83.77	0.494	0.211	5.085		ma120301_rel_withdbg.cz12c_sync_dw0_c32r128
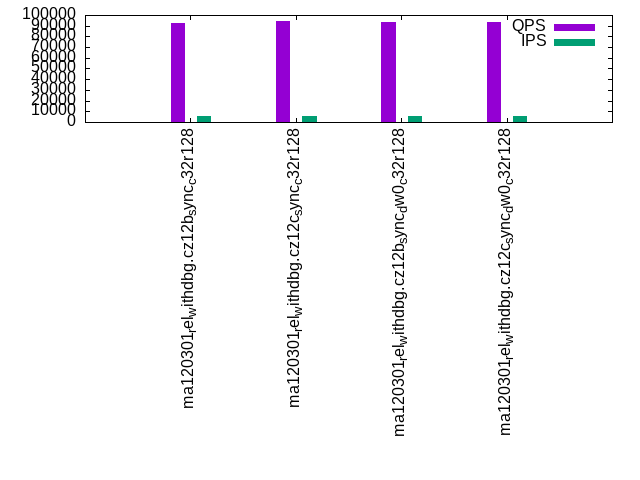
qr1000.L5
qr1000.L5: range queries with 1000 insert/s per client. Graphs for performance per 1-second interval are here.
Average throughput:
Query response time histogram: each cell has the percentage of responses that take <= the time in the header and max is the max response time in seconds. For max values in the top 25% of the range have a red background and in the bottom 25% of the range have a green background. The red background is not used when the min value is within 80% of the max value.
| dbms | 256us | 1ms | 4ms | 16ms | 64ms | 256ms | 1s | 4s | 16s | gt | max |
|---|---|---|---|---|---|---|---|---|---|---|---|
| ma120301_rel_withdbg.cz12b_sync_c32r128 | 99.935 | 0.064 | 0.001 | nonzero | nonzero | 0.046 | |||||
| ma120301_rel_withdbg.cz12c_sync_c32r128 | 99.947 | 0.051 | 0.001 | nonzero | nonzero | nonzero | 0.132 | ||||
| ma120301_rel_withdbg.cz12b_sync_dw0_c32r128 | 99.934 | 0.065 | 0.001 | nonzero | 0.004 | ||||||
| ma120301_rel_withdbg.cz12c_sync_dw0_c32r128 | 99.944 | 0.055 | 0.001 | nonzero | nonzero | 0.027 |
Insert response time histogram: each cell has the percentage of responses that take <= the time in the header and max is the max response time in seconds. For max values in the top 25% of the range have a red background and in the bottom 25% of the range have a green background. The red background is not used when the min value is within 80% of the max value.
| dbms | 256us | 1ms | 4ms | 16ms | 64ms | 256ms | 1s | 4s | 16s | gt | max |
|---|---|---|---|---|---|---|---|---|---|---|---|
| ma120301_rel_withdbg.cz12b_sync_c32r128 | 0.208 | 98.134 | 1.650 | 0.007 | 0.101 | ||||||
| ma120301_rel_withdbg.cz12c_sync_c32r128 | 93.902 | 4.823 | 1.262 | 0.013 | 0.135 | ||||||
| ma120301_rel_withdbg.cz12b_sync_dw0_c32r128 | 0.215 | 99.623 | 0.163 | 0.040 | |||||||
| ma120301_rel_withdbg.cz12c_sync_dw0_c32r128 | 96.326 | 2.344 | 1.321 | 0.009 | 0.087 |
Delete response time histogram: each cell has the percentage of responses that take <= the time in the header and max is the max response time in seconds. For max values in the top 25% of the range have a red background and in the bottom 25% of the range have a green background. The red background is not used when the min value is within 80% of the max value.
| dbms | 256us | 1ms | 4ms | 16ms | 64ms | 256ms | 1s | 4s | 16s | gt | max |
|---|---|---|---|---|---|---|---|---|---|---|---|
| ma120301_rel_withdbg.cz12b_sync_c32r128 | 0.156 | 98.393 | 1.443 | 0.008 | 0.101 | ||||||
| ma120301_rel_withdbg.cz12c_sync_c32r128 | 94.535 | 4.238 | 1.215 | 0.012 | 0.143 | ||||||
| ma120301_rel_withdbg.cz12b_sync_dw0_c32r128 | 0.196 | 99.725 | 0.079 | 0.040 | |||||||
| ma120301_rel_withdbg.cz12c_sync_dw0_c32r128 | 96.555 | 2.145 | 1.291 | 0.008 | 0.087 |
Performance metrics for the DBMS listed above. Some are normalized by throughput, others are not. Legend for results is here.
ips	qps	rps	rmbps	wps	wmbps	rpq	rkbpq	wpi	wkbpi	csps	cpups	cspq	cpupq	dbgb1	dbgb2	rss	maxop	p50	p99	tag
11920	91479	0	0.0	1405.7	35.0	0.000	0.000	0.118	3.008	532174	43.7	5.817	153	22.2	123.0	24.0	0.046	7647	7439	ma120301_rel_withdbg.cz12b_sync_c32r128
11927	93047	0	0.0	1432.1	42.2	0.000	0.000	0.120	3.621	539525	43.0	5.798	148	26.2	128.4	29.0	0.132	7806	7615	ma120301_rel_withdbg.cz12c_sync_c32r128
11920	91952	0	0.0	1325.7	27.0	0.000	0.000	0.111	2.317	534744	43.7	5.815	152	22.4	123.2	24.1	0.004	7711	7599	ma120301_rel_withdbg.cz12b_sync_dw0_c32r128
11920	92626	0	0.0	1216.8	29.1	0.000	0.000	0.102	2.496	536231	43.4	5.789	150	23.2	124.5	25.0	0.027	7791	7695	ma120301_rel_withdbg.cz12c_sync_dw0_c32r128
Average values from iostat.
r/s	rkB/s	rrqm/s	%rrqm	r_await	rareq-s	w/s	wkB/s	wrqm/s	%wrqm	w_await	wareq-s	d/s	dkB/s	drqm/s	%drqm	d_await	dareq-s	f/s	f_await	aqu-sz	%util
0.000	0.000	0.000	0.000	0.000	0.000	1405.7	35856.7	478.7	35.59	0.557	26.09	9.146	428.7	0.000	0.000	0.442	12.98	297.5	0.523	0.739	18.26		ma120301_rel_withdbg.cz12b_sync_c32r128
0.000	0.000	0.000	0.000	0.000	0.000	1432.1	43191.5	6.192	0.910	0.522	37.98	0.524	3.180	0.000	0.000	1.232	3.429	199.9	0.534	0.597	11.30		ma120301_rel_withdbg.cz12c_sync_c32r128
0.001	0.002	0.000	0.000	0.000	0.011	1325.7	27624.4	541.2	37.12	0.592	23.61	17.09	284.7	0.000	0.000	0.560	4.833	263.1	0.526	0.979	17.30		ma120301_rel_withdbg.cz12b_sync_dw0_c32r128
0.000	0.000	0.000	0.000	0.000	0.000	1216.8	29750.6	4.209	0.753	0.543	35.62	0.446	1.797	0.000	0.000	1.033	1.861	140.2	0.545	0.509	8.465		ma120301_rel_withdbg.cz12c_sync_dw0_c32r128
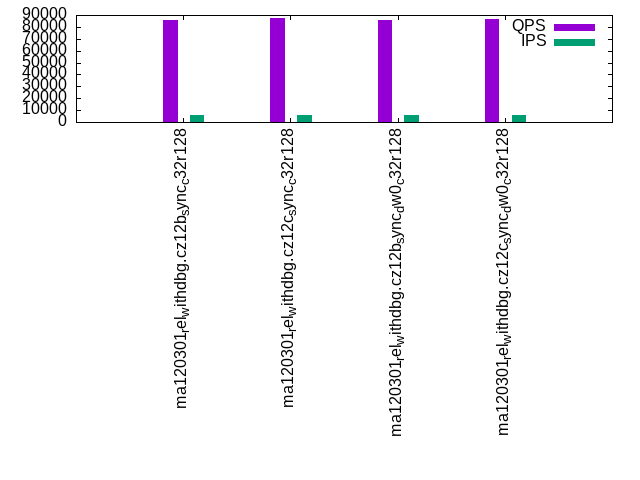
qp1000.L6
qp1000.L6: point queries with 1000 insert/s per client. Graphs for performance per 1-second interval are here.
Average throughput:
Query response time histogram: each cell has the percentage of responses that take <= the time in the header and max is the max response time in seconds. For max values in the top 25% of the range have a red background and in the bottom 25% of the range have a green background. The red background is not used when the min value is within 80% of the max value.
| dbms | 256us | 1ms | 4ms | 16ms | 64ms | 256ms | 1s | 4s | 16s | gt | max |
|---|---|---|---|---|---|---|---|---|---|---|---|
| ma120301_rel_withdbg.cz12b_sync_c32r128 | 99.926 | 0.073 | 0.001 | nonzero | 0.009 | ||||||
| ma120301_rel_withdbg.cz12c_sync_c32r128 | 99.943 | 0.056 | 0.001 | nonzero | 0.012 | ||||||
| ma120301_rel_withdbg.cz12b_sync_dw0_c32r128 | 99.922 | 0.077 | 0.001 | 0.004 | |||||||
| ma120301_rel_withdbg.cz12c_sync_dw0_c32r128 | 99.918 | 0.081 | 0.001 | 0.003 |
Insert response time histogram: each cell has the percentage of responses that take <= the time in the header and max is the max response time in seconds. For max values in the top 25% of the range have a red background and in the bottom 25% of the range have a green background. The red background is not used when the min value is within 80% of the max value.
| dbms | 256us | 1ms | 4ms | 16ms | 64ms | 256ms | 1s | 4s | 16s | gt | max |
|---|---|---|---|---|---|---|---|---|---|---|---|
| ma120301_rel_withdbg.cz12b_sync_c32r128 | 0.238 | 98.779 | 0.978 | 0.005 | 0.083 | ||||||
| ma120301_rel_withdbg.cz12c_sync_c32r128 | 94.312 | 4.629 | 1.050 | 0.009 | 0.132 | ||||||
| ma120301_rel_withdbg.cz12b_sync_dw0_c32r128 | 0.201 | 98.699 | 1.094 | 0.003 | 0.003 | 1.165 | |||||
| ma120301_rel_withdbg.cz12c_sync_dw0_c32r128 | 93.770 | 4.831 | 1.372 | 0.028 | 0.109 |
Delete response time histogram: each cell has the percentage of responses that take <= the time in the header and max is the max response time in seconds. For max values in the top 25% of the range have a red background and in the bottom 25% of the range have a green background. The red background is not used when the min value is within 80% of the max value.
| dbms | 256us | 1ms | 4ms | 16ms | 64ms | 256ms | 1s | 4s | 16s | gt | max |
|---|---|---|---|---|---|---|---|---|---|---|---|
| ma120301_rel_withdbg.cz12b_sync_c32r128 | 0.254 | 98.910 | 0.833 | 0.003 | 0.082 | ||||||
| ma120301_rel_withdbg.cz12c_sync_c32r128 | 94.878 | 4.095 | 1.019 | 0.008 | 0.105 | ||||||
| ma120301_rel_withdbg.cz12b_sync_dw0_c32r128 | 0.181 | 98.833 | 0.980 | 0.003 | 0.003 | 1.165 | |||||
| ma120301_rel_withdbg.cz12c_sync_dw0_c32r128 | 94.215 | 4.417 | 1.341 | 0.026 | 0.107 |
Performance metrics for the DBMS listed above. Some are normalized by throughput, others are not. Legend for results is here.
ips	qps	rps	rmbps	wps	wmbps	rpq	rkbpq	wpi	wkbpi	csps	cpups	cspq	cpupq	dbgb1	dbgb2	rss	maxop	p50	p99	tag
11920	84817	0	0.0	1425.6	35.2	0.000	0.000	0.120	3.025	501048	43.6	5.907	164	22.2	123.0	24.0	0.009	7135	7023	ma120301_rel_withdbg.cz12b_sync_c32r128
11927	86250	0	0.0	1159.4	35.1	0.000	0.000	0.097	3.017	505278	43.1	5.858	160	26.2	128.4	29.1	0.012	7215	7087	ma120301_rel_withdbg.cz12c_sync_c32r128
11920	84278	0	0.0	1317.1	26.9	0.000	0.000	0.110	2.307	497357	43.2	5.901	164	22.4	123.2	24.1	0.004	7039	6943	ma120301_rel_withdbg.cz12b_sync_dw0_c32r128
11920	85407	0	0.0	1064.8	27.3	0.000	0.000	0.089	2.343	499785	43.5	5.852	163	23.2	124.5	25.0	0.003	7151	7039	ma120301_rel_withdbg.cz12c_sync_dw0_c32r128
Average values from iostat.
r/s	rkB/s	rrqm/s	%rrqm	r_await	rareq-s	w/s	wkB/s	wrqm/s	%wrqm	w_await	wareq-s	d/s	dkB/s	drqm/s	%drqm	d_await	dareq-s	f/s	f_await	aqu-sz	%util
0.000	0.000	0.000	0.000	0.000	0.000	1425.6	36053.9	503.1	34.67	0.523	25.68	8.263	317.1	0.000	0.000	0.314	6.191	306.3	0.511	0.721	18.13		ma120301_rel_withdbg.cz12b_sync_c32r128
0.000	0.000	0.000	0.000	0.000	0.000	1159.4	35987.8	5.388	0.813	0.449	37.55	0.362	1.543	0.000	0.000	1.014	1.678	185.7	0.508	0.476	10.43		ma120301_rel_withdbg.cz12c_sync_c32r128
0.000	0.000	0.000	0.000	0.000	0.000	1317.1	27501.2	518.5	35.17	0.834	23.39	12.43	144.2	0.000	0.000	0.479	2.850	257.7	0.545	2.094	17.18		ma120301_rel_withdbg.cz12b_sync_dw0_c32r128
0.000	0.000	0.000	0.000	0.000	0.000	1064.8	27924.2	4.485	0.887	0.609	38.69	0.618	2.475	0.000	0.000	1.466	2.601	114.2	0.547	0.502	7.430		ma120301_rel_withdbg.cz12c_sync_dw0_c32r128
l.i0
l.i0: load without secondary indexes
Performance metrics for all DBMS, not just the ones listed above. Some are normalized by throughput, others are not. Legend for results is here.
ips	qps	rps	rmbps	wps	wmbps	rpq	rkbpq	wpi	wkbpi	csps	cpups	cspq	cpupq	dbgb1	dbgb2	rss	maxop	p50	p99	tag
122075	0	0	0.0	3198.5	50.3	0.000	0.000	0.026	0.422	41856	6.5	0.343	17	8.0	108.8	9.8	0.201	10599	7299	ma120301_rel_withdbg.cz12b_sync_c32r128
442804	0	0	0.0	4459.8	175.4	0.000	0.000	0.010	0.406	94701	20.8	0.214	15	8.0	109.3	10.0	0.220	39895	37195	ma120301_rel_withdbg.cz12c_sync_c32r128
122449	0	0	0.0	3213.9	50.5	0.000	0.000	0.026	0.422	41973	6.5	0.343	17	8.0	108.8	9.9	0.026	10599	7299	ma120301_rel_withdbg.cz12b_sync_dw0_c32r128
441176	0	0	0.0	4466.2	175.4	0.000	0.000	0.010	0.407	94582	20.9	0.214	15	8.0	109.3	10.0	0.018	39895	37995	ma120301_rel_withdbg.cz12c_sync_dw0_c32r128
l.x
l.x: create secondary indexes
Performance metrics for all DBMS, not just the ones listed above. Some are normalized by throughput, others are not. Legend for results is here.
ips	qps	rps	rmbps	wps	wmbps	rpq	rkbpq	wpi	wkbpi	csps	cpups	cspq	cpupq	dbgb1	dbgb2	rss	maxop	p50	p99	tag
1846155	0	0	0.0	13195.5	1269.9	0.000	0.000	0.007	0.704	19338	30.9	0.010	5	16.9	117.7	17.9	0.012	NA	NA	ma120301_rel_withdbg.cz12b_sync_c32r128
1846155	0	0	0.0	12738.4	1262.1	0.000	0.000	0.007	0.700	17436	31.0	0.009	5	16.9	118.2	17.9	0.008	NA	NA	ma120301_rel_withdbg.cz12c_sync_c32r128
1846155	0	0	0.0	13225.8	1269.8	0.000	0.000	0.007	0.704	20094	30.9	0.011	5	16.9	117.7	18.0	0.013	NA	NA	ma120301_rel_withdbg.cz12b_sync_dw0_c32r128
1578949	0	0	0.0	11672.3	1102.9	0.000	0.000	0.007	0.715	18555	27.8	0.012	6	16.9	118.2	17.7	0.007	NA	NA	ma120301_rel_withdbg.cz12c_sync_dw0_c32r128
l.i1
l.i1: continue load after secondary indexes created with 50 inserts per transaction
Performance metrics for all DBMS, not just the ones listed above. Some are normalized by throughput, others are not. Legend for results is here.
ips	qps	rps	rmbps	wps	wmbps	rpq	rkbpq	wpi	wkbpi	csps	cpups	cspq	cpupq	dbgb1	dbgb2	rss	maxop	p50	p99	tag
60302	0	0	0.0	8633.4	230.6	0.000	0.000	0.143	3.915	76998	16.9	1.277	90	22.2	123.0	23.9	0.907	5599	1650	ma120301_rel_withdbg.cz12b_sync_c32r128
168717	0	0	0.0	12998.5	470.1	0.000	0.000	0.077	2.853	139901	49.9	0.829	95	26.2	128.4	29.0	0.226	15698	5299	ma120301_rel_withdbg.cz12c_sync_c32r128
68596	0	0	0.0	8954.9	203.7	0.000	0.000	0.131	3.041	84942	19.2	1.238	90	22.4	123.2	24.1	1.073	6799	2100	ma120301_rel_withdbg.cz12b_sync_dw0_c32r128
182857	0	0	0.0	12225.6	429.1	0.000	0.000	0.067	2.403	139362	55.6	0.762	97	23.2	124.5	24.9	0.047	16898	5149	ma120301_rel_withdbg.cz12c_sync_dw0_c32r128
l.i2
l.i2: continue load after secondary indexes created with 5 inserts per transaction
Performance metrics for all DBMS, not just the ones listed above. Some are normalized by throughput, others are not. Legend for results is here.
ips	qps	rps	rmbps	wps	wmbps	rpq	rkbpq	wpi	wkbpi	csps	cpups	cspq	cpupq	dbgb1	dbgb2	rss	maxop	p50	p99	tag
5687	0	0	0.0	2583.7	28.2	0.000	0.000	0.454	5.073	46380	4.2	8.155	236	22.2	123.0	24.0	0.181	310	190	ma120301_rel_withdbg.cz12b_sync_c32r128
46243	0	0	0.0	7695.4	182.1	0.000	0.000	0.166	4.033	278406	26.9	6.021	186	26.2	128.4	29.0	1.236	3930	1530	ma120301_rel_withdbg.cz12c_sync_c32r128
10999	0	0	0.0	4739.4	45.1	0.000	0.000	0.431	4.197	89614	7.4	8.147	215	22.4	123.2	24.1	0.176	950	310	ma120301_rel_withdbg.cz12b_sync_dw0_c32r128
50633	0	0	0.0	7711.7	146.7	0.000	0.000	0.152	2.967	304523	29.0	6.014	183	23.2	124.5	25.0	0.036	4344	1980	ma120301_rel_withdbg.cz12c_sync_dw0_c32r128
qr100.L1
qr100.L1: range queries with 100 insert/s per client
Performance metrics for all DBMS, not just the ones listed above. Some are normalized by throughput, others are not. Legend for results is here.
ips	qps	rps	rmbps	wps	wmbps	rpq	rkbpq	wpi	wkbpi	csps	cpups	cspq	cpupq	dbgb1	dbgb2	rss	maxop	p50	p99	tag
1192	93858	0	0.0	112.9	1.9	0.000	0.000	0.095	1.629	538698	40.2	5.740	137	22.2	123.0	24.0	0.003	7887	7807	ma120301_rel_withdbg.cz12b_sync_c32r128
1192	95224	0	0.0	63.2	1.6	0.000	0.000	0.053	1.382	546036	39.9	5.734	134	26.2	128.4	29.0	0.002	7999	7919	ma120301_rel_withdbg.cz12c_sync_c32r128
1192	94346	0	0.0	110.7	1.9	0.000	0.000	0.093	1.620	541420	40.1	5.739	136	22.4	123.2	24.1	0.004	7903	7839	ma120301_rel_withdbg.cz12b_sync_dw0_c32r128
1192	94480	0	0.0	61.1	1.6	0.000	0.000	0.051	1.407	541740	39.9	5.734	135	23.2	124.5	25.0	0.002	7983	7903	ma120301_rel_withdbg.cz12c_sync_dw0_c32r128
qp100.L2
qp100.L2: point queries with 100 insert/s per client
Performance metrics for all DBMS, not just the ones listed above. Some are normalized by throughput, others are not. Legend for results is here.
ips	qps	rps	rmbps	wps	wmbps	rpq	rkbpq	wpi	wkbpi	csps	cpups	cspq	cpupq	dbgb1	dbgb2	rss	maxop	p50	p99	tag
1192	87164	0	0.0	145.7	2.2	0.000	0.000	0.122	1.894	505537	39.9	5.800	146	22.2	123.0	24.0	0.003	7343	7263	ma120301_rel_withdbg.cz12b_sync_c32r128
1192	88216	0	0.0	55.2	1.6	0.000	0.000	0.046	1.372	510973	40.7	5.792	148	26.2	128.4	29.0	0.003	7375	7311	ma120301_rel_withdbg.cz12c_sync_c32r128
1192	86713	0	0.0	120.5	1.9	0.000	0.000	0.101	1.668	502841	39.9	5.799	147	22.4	123.2	24.1	0.002	7263	7183	ma120301_rel_withdbg.cz12b_sync_dw0_c32r128
1192	87437	0	0.0	73.5	1.7	0.000	0.000	0.062	1.435	506570	39.9	5.794	146	23.2	124.5	24.9	0.003	7327	7247	ma120301_rel_withdbg.cz12c_sync_dw0_c32r128
qr500.L3
qr500.L3: range queries with 500 insert/s per client
Performance metrics for all DBMS, not just the ones listed above. Some are normalized by throughput, others are not. Legend for results is here.
ips	qps	rps	rmbps	wps	wmbps	rpq	rkbpq	wpi	wkbpi	csps	cpups	cspq	cpupq	dbgb1	dbgb2	rss	maxop	p50	p99	tag
5960	92741	0	0.0	706.8	17.4	0.000	0.000	0.119	2.996	535641	42.0	5.776	145	22.2	123.0	24.0	0.023	7743	7615	ma120301_rel_withdbg.cz12b_sync_c32r128
5960	94241	0	0.0	549.6	17.1	0.000	0.000	0.092	2.930	542765	41.2	5.759	140	26.2	128.4	29.0	0.019	7871	7727	ma120301_rel_withdbg.cz12c_sync_c32r128
5960	93321	0	0.0	704.2	13.6	0.000	0.000	0.118	2.344	539184	42.0	5.778	144	22.4	123.2	24.1	0.006	7807	7695	ma120301_rel_withdbg.cz12b_sync_dw0_c32r128
5960	93628	0	0.0	510.7	13.0	0.000	0.000	0.086	2.226	539298	41.1	5.760	140	23.2	124.5	25.0	0.013	7871	7791	ma120301_rel_withdbg.cz12c_sync_dw0_c32r128
qp500.L4
qp500.L4: point queries with 500 insert/s per client
Performance metrics for all DBMS, not just the ones listed above. Some are normalized by throughput, others are not. Legend for results is here.
ips	qps	rps	rmbps	wps	wmbps	rpq	rkbpq	wpi	wkbpi	csps	cpups	cspq	cpupq	dbgb1	dbgb2	rss	maxop	p50	p99	tag
5964	86160	0	0.0	751.7	17.7	0.000	0.000	0.126	3.047	503773	41.2	5.847	153	22.2	123.0	24.0	0.014	7247	7119	ma120301_rel_withdbg.cz12b_sync_c32r128
5964	87328	0	0.0	568.6	17.2	0.000	0.000	0.095	2.961	508331	41.7	5.821	153	26.2	128.4	29.0	0.003	7327	7231	ma120301_rel_withdbg.cz12c_sync_c32r128
5964	85776	0	0.0	683.0	13.5	0.000	0.000	0.115	2.317	501398	40.9	5.845	153	22.4	123.2	24.1	0.002	7183	7103	ma120301_rel_withdbg.cz12b_sync_dw0_c32r128
5964	86545	0	0.0	620.0	14.4	0.000	0.000	0.104	2.476	504738	41.0	5.832	152	23.2	124.5	24.9	0.003	7231	7151	ma120301_rel_withdbg.cz12c_sync_dw0_c32r128
qr1000.L5
qr1000.L5: range queries with 1000 insert/s per client
Performance metrics for all DBMS, not just the ones listed above. Some are normalized by throughput, others are not. Legend for results is here.
ips	qps	rps	rmbps	wps	wmbps	rpq	rkbpq	wpi	wkbpi	csps	cpups	cspq	cpupq	dbgb1	dbgb2	rss	maxop	p50	p99	tag
11920	91479	0	0.0	1405.7	35.0	0.000	0.000	0.118	3.008	532174	43.7	5.817	153	22.2	123.0	24.0	0.046	7647	7439	ma120301_rel_withdbg.cz12b_sync_c32r128
11927	93047	0	0.0	1432.1	42.2	0.000	0.000	0.120	3.621	539525	43.0	5.798	148	26.2	128.4	29.0	0.132	7806	7615	ma120301_rel_withdbg.cz12c_sync_c32r128
11920	91952	0	0.0	1325.7	27.0	0.000	0.000	0.111	2.317	534744	43.7	5.815	152	22.4	123.2	24.1	0.004	7711	7599	ma120301_rel_withdbg.cz12b_sync_dw0_c32r128
11920	92626	0	0.0	1216.8	29.1	0.000	0.000	0.102	2.496	536231	43.4	5.789	150	23.2	124.5	25.0	0.027	7791	7695	ma120301_rel_withdbg.cz12c_sync_dw0_c32r128
qp1000.L6
qp1000.L6: point queries with 1000 insert/s per client
Performance metrics for all DBMS, not just the ones listed above. Some are normalized by throughput, others are not. Legend for results is here.
ips	qps	rps	rmbps	wps	wmbps	rpq	rkbpq	wpi	wkbpi	csps	cpups	cspq	cpupq	dbgb1	dbgb2	rss	maxop	p50	p99	tag
11920	84817	0	0.0	1425.6	35.2	0.000	0.000	0.120	3.025	501048	43.6	5.907	164	22.2	123.0	24.0	0.009	7135	7023	ma120301_rel_withdbg.cz12b_sync_c32r128
11927	86250	0	0.0	1159.4	35.1	0.000	0.000	0.097	3.017	505278	43.1	5.858	160	26.2	128.4	29.1	0.012	7215	7087	ma120301_rel_withdbg.cz12c_sync_c32r128
11920	84278	0	0.0	1317.1	26.9	0.000	0.000	0.110	2.307	497357	43.2	5.901	164	22.4	123.2	24.1	0.004	7039	6943	ma120301_rel_withdbg.cz12b_sync_dw0_c32r128
11920	85407	0	0.0	1064.8	27.3	0.000	0.000	0.089	2.343	499785	43.5	5.852	163	23.2	124.5	25.0	0.003	7151	7039	ma120301_rel_withdbg.cz12c_sync_dw0_c32r128
l.i0
- l.i0: load without secondary indexes
- Legend for results is here.
- Each entry lists the percentage of responses that fit in that bucket (slower than max time for previous bucket, faster than min time for next bucket).
Insert response time histogram
256us	1ms	4ms	16ms	64ms	256ms	1s	4s	16s	gt	max	tag
0.000	0.000	0.289	99.662	0.048	0.001	0.000	0.000	0.000	0.000	0.201	ma120301_rel_withdbg.cz12b_sync_c32r128
0.000	0.000	98.474	1.521	0.003	0.002	0.000	0.000	0.000	0.000	0.220	ma120301_rel_withdbg.cz12c_sync_c32r128
0.000	0.000	0.298	99.645	0.058	0.000	0.000	0.000	0.000	0.000	0.026	ma120301_rel_withdbg.cz12b_sync_dw0_c32r128
0.000	0.000	98.454	1.545	0.001	0.000	0.000	0.000	0.000	0.000	0.018	ma120301_rel_withdbg.cz12c_sync_dw0_c32r128
l.x
- l.x: create secondary indexes
- Legend for results is here.
- Each entry lists the percentage of responses that fit in that bucket (slower than max time for previous bucket, faster than min time for next bucket).
TODO - determine whether there is data for create index response time
l.i1
- l.i1: continue load after secondary indexes created with 50 inserts per transaction
- Legend for results is here.
- Each entry lists the percentage of responses that fit in that bucket (slower than max time for previous bucket, faster than min time for next bucket).
Insert response time histogram
256us	1ms	4ms	16ms	64ms	256ms	1s	4s	16s	gt	max	tag
0.000	0.000	0.013	91.794	8.163	0.028	0.002	0.000	0.000	0.000	0.907	ma120301_rel_withdbg.cz12b_sync_c32r128
0.000	0.000	84.055	15.473	0.467	0.005	0.000	0.000	0.000	0.000	0.226	ma120301_rel_withdbg.cz12c_sync_c32r128
0.000	0.000	0.020	95.291	4.684	0.004	nonzero	nonzero	0.000	0.000	1.073	ma120301_rel_withdbg.cz12b_sync_dw0_c32r128
0.000	0.000	87.848	12.005	0.147	0.000	0.000	0.000	0.000	0.000	0.047	ma120301_rel_withdbg.cz12c_sync_dw0_c32r128
Delete response time histogram
256us	1ms	4ms	16ms	64ms	256ms	1s	4s	16s	gt	max	tag
0.000	0.000	0.071	92.320	7.583	0.024	0.002	nonzero	0.000	0.000	1.084	ma120301_rel_withdbg.cz12b_sync_c32r128
0.000	0.000	87.513	12.086	0.396	0.004	0.000	0.000	0.000	0.000	0.225	ma120301_rel_withdbg.cz12c_sync_c32r128
0.000	0.000	0.097	95.549	4.350	0.003	0.001	nonzero	0.000	0.000	1.073	ma120301_rel_withdbg.cz12b_sync_dw0_c32r128
0.000	0.000	90.502	9.360	0.137	0.000	0.000	0.000	0.000	0.000	0.046	ma120301_rel_withdbg.cz12c_sync_dw0_c32r128
l.i2
- l.i2: continue load after secondary indexes created with 5 inserts per transaction
- Legend for results is here.
- Each entry lists the percentage of responses that fit in that bucket (slower than max time for previous bucket, faster than min time for next bucket).
Insert response time histogram
256us	1ms	4ms	16ms	64ms	256ms	1s	4s	16s	gt	max	tag
0.000	0.000	0.110	74.788	25.094	0.009	0.000	0.000	0.000	0.000	0.181	ma120301_rel_withdbg.cz12b_sync_c32r128
0.000	0.988	98.482	0.523	0.006	nonzero	nonzero	nonzero	0.000	0.000	1.236	ma120301_rel_withdbg.cz12c_sync_c32r128
0.000	0.000	0.229	99.314	0.453	0.003	0.000	0.000	0.000	0.000	0.176	ma120301_rel_withdbg.cz12b_sync_dw0_c32r128
0.000	2.442	97.502	0.054	0.002	0.000	0.000	0.000	0.000	0.000	0.036	ma120301_rel_withdbg.cz12c_sync_dw0_c32r128
Delete response time histogram
256us	1ms	4ms	16ms	64ms	256ms	1s	4s	16s	gt	max	tag
0.000	0.000	0.089	74.711	25.190	0.009	0.000	0.000	0.000	0.000	0.181	ma120301_rel_withdbg.cz12b_sync_c32r128
0.000	1.125	98.359	0.510	0.006	nonzero	nonzero	nonzero	0.000	0.000	1.236	ma120301_rel_withdbg.cz12c_sync_c32r128
0.000	0.000	0.169	99.372	0.455	0.004	0.000	0.000	0.000	0.000	0.176	ma120301_rel_withdbg.cz12b_sync_dw0_c32r128
0.000	1.143	98.802	0.053	0.002	0.000	0.000	0.000	0.000	0.000	0.036	ma120301_rel_withdbg.cz12c_sync_dw0_c32r128
qr100.L1
- qr100.L1: range queries with 100 insert/s per client
- Legend for results is here.
- Each entry lists the percentage of responses that fit in that bucket (slower than max time for previous bucket, faster than min time for next bucket).
Query response time histogram
256us	1ms	4ms	16ms	64ms	256ms	1s	4s	16s	gt	max	tag
99.991	0.009	nonzero	0.000	0.000	0.000	0.000	0.000	0.000	0.000	0.003	ma120301_rel_withdbg.cz12b_sync_c32r128
99.992	0.008	nonzero	0.000	0.000	0.000	0.000	0.000	0.000	0.000	0.002	ma120301_rel_withdbg.cz12c_sync_c32r128
99.991	0.009	nonzero	0.000	0.000	0.000	0.000	0.000	0.000	0.000	0.004	ma120301_rel_withdbg.cz12b_sync_dw0_c32r128
99.992	0.008	nonzero	0.000	0.000	0.000	0.000	0.000	0.000	0.000	0.002	ma120301_rel_withdbg.cz12c_sync_dw0_c32r128
Insert response time histogram
256us	1ms	4ms	16ms	64ms	256ms	1s	4s	16s	gt	max	tag
0.000	0.000	1.285	95.921	2.141	0.653	0.000	0.000	0.000	0.000	0.149	ma120301_rel_withdbg.cz12b_sync_c32r128
0.000	0.000	89.856	8.838	1.306	0.000	0.000	0.000	0.000	0.000	0.059	ma120301_rel_withdbg.cz12c_sync_c32r128
0.000	0.000	0.252	93.831	4.076	1.840	0.000	0.000	0.000	0.000	0.154	ma120301_rel_withdbg.cz12b_sync_dw0_c32r128
0.000	0.000	85.771	11.579	2.639	0.012	0.000	0.000	0.000	0.000	0.072	ma120301_rel_withdbg.cz12c_sync_dw0_c32r128
Delete response time histogram
256us	1ms	4ms	16ms	64ms	256ms	1s	4s	16s	gt	max	tag
0.000	0.000	1.912	95.363	2.088	0.637	0.000	0.000	0.000	0.000	0.149	ma120301_rel_withdbg.cz12b_sync_c32r128
0.000	0.000	90.896	7.866	1.238	0.000	0.000	0.000	0.000	0.000	0.057	ma120301_rel_withdbg.cz12c_sync_c32r128
0.000	0.000	0.840	93.326	4.060	1.773	0.000	0.000	0.000	0.000	0.169	ma120301_rel_withdbg.cz12b_sync_dw0_c32r128
0.000	0.000	86.396	11.021	2.574	0.009	0.000	0.000	0.000	0.000	0.069	ma120301_rel_withdbg.cz12c_sync_dw0_c32r128
qp100.L2
- qp100.L2: point queries with 100 insert/s per client
- Legend for results is here.
- Each entry lists the percentage of responses that fit in that bucket (slower than max time for previous bucket, faster than min time for next bucket).
Query response time histogram
256us	1ms	4ms	16ms	64ms	256ms	1s	4s	16s	gt	max	tag
99.993	0.007	nonzero	0.000	0.000	0.000	0.000	0.000	0.000	0.000	0.003	ma120301_rel_withdbg.cz12b_sync_c32r128
99.992	0.008	nonzero	0.000	0.000	0.000	0.000	0.000	0.000	0.000	0.003	ma120301_rel_withdbg.cz12c_sync_c32r128
99.991	0.009	nonzero	0.000	0.000	0.000	0.000	0.000	0.000	0.000	0.002	ma120301_rel_withdbg.cz12b_sync_dw0_c32r128
99.992	0.008	nonzero	0.000	0.000	0.000	0.000	0.000	0.000	0.000	0.003	ma120301_rel_withdbg.cz12c_sync_dw0_c32r128
Insert response time histogram
256us	1ms	4ms	16ms	64ms	256ms	1s	4s	16s	gt	max	tag
0.000	0.000	1.178	98.523	0.201	0.097	0.000	0.000	0.000	0.000	0.151	ma120301_rel_withdbg.cz12b_sync_c32r128
0.000	0.000	90.021	8.993	0.986	0.000	0.000	0.000	0.000	0.000	0.058	ma120301_rel_withdbg.cz12c_sync_c32r128
0.000	0.000	0.468	99.273	0.259	0.000	0.000	0.000	0.000	0.000	0.061	ma120301_rel_withdbg.cz12b_sync_dw0_c32r128
0.000	0.000	94.977	4.653	0.370	0.000	0.000	0.000	0.000	0.000	0.061	ma120301_rel_withdbg.cz12c_sync_dw0_c32r128
Delete response time histogram
256us	1ms	4ms	16ms	64ms	256ms	1s	4s	16s	gt	max	tag
0.000	0.000	3.370	96.336	0.204	0.090	0.000	0.000	0.000	0.000	0.151	ma120301_rel_withdbg.cz12b_sync_c32r128
0.000	0.000	92.479	6.562	0.958	0.000	0.000	0.000	0.000	0.000	0.056	ma120301_rel_withdbg.cz12c_sync_c32r128
0.000	0.000	1.593	98.176	0.231	0.000	0.000	0.000	0.000	0.000	0.056	ma120301_rel_withdbg.cz12b_sync_dw0_c32r128
0.000	0.000	95.252	4.394	0.354	0.000	0.000	0.000	0.000	0.000	0.058	ma120301_rel_withdbg.cz12c_sync_dw0_c32r128
qr500.L3
- qr500.L3: range queries with 500 insert/s per client
- Legend for results is here.
- Each entry lists the percentage of responses that fit in that bucket (slower than max time for previous bucket, faster than min time for next bucket).
Query response time histogram
256us	1ms	4ms	16ms	64ms	256ms	1s	4s	16s	gt	max	tag
99.971	0.028	nonzero	nonzero	nonzero	0.000	0.000	0.000	0.000	0.000	0.023	ma120301_rel_withdbg.cz12b_sync_c32r128
99.977	0.023	nonzero	nonzero	nonzero	0.000	0.000	0.000	0.000	0.000	0.019	ma120301_rel_withdbg.cz12c_sync_c32r128
99.974	0.026	nonzero	nonzero	0.000	0.000	0.000	0.000	0.000	0.000	0.006	ma120301_rel_withdbg.cz12b_sync_dw0_c32r128
99.976	0.023	nonzero	nonzero	0.000	0.000	0.000	0.000	0.000	0.000	0.013	ma120301_rel_withdbg.cz12c_sync_dw0_c32r128
Insert response time histogram
256us	1ms	4ms	16ms	64ms	256ms	1s	4s	16s	gt	max	tag
0.000	0.000	0.383	99.456	0.161	0.000	0.000	0.000	0.000	0.000	0.054	ma120301_rel_withdbg.cz12b_sync_c32r128
0.000	0.000	94.888	5.100	0.012	0.000	0.000	0.000	0.000	0.000	0.036	ma120301_rel_withdbg.cz12c_sync_c32r128
0.000	0.000	0.373	99.546	0.081	0.000	0.000	0.000	0.000	0.000	0.026	ma120301_rel_withdbg.cz12b_sync_dw0_c32r128
0.000	0.000	95.132	4.865	0.003	0.000	0.000	0.000	0.000	0.000	0.024	ma120301_rel_withdbg.cz12c_sync_dw0_c32r128
Delete response time histogram
256us	1ms	4ms	16ms	64ms	256ms	1s	4s	16s	gt	max	tag
0.000	0.000	0.353	99.528	0.119	0.000	0.000	0.000	0.000	0.000	0.054	ma120301_rel_withdbg.cz12b_sync_c32r128
0.000	0.000	95.187	4.809	0.004	0.000	0.000	0.000	0.000	0.000	0.030	ma120301_rel_withdbg.cz12c_sync_c32r128
0.000	0.000	0.719	99.215	0.066	0.000	0.000	0.000	0.000	0.000	0.026	ma120301_rel_withdbg.cz12b_sync_dw0_c32r128
0.000	0.000	95.576	4.423	0.001	0.000	0.000	0.000	0.000	0.000	0.023	ma120301_rel_withdbg.cz12c_sync_dw0_c32r128
qp500.L4
- qp500.L4: point queries with 500 insert/s per client
- Legend for results is here.
- Each entry lists the percentage of responses that fit in that bucket (slower than max time for previous bucket, faster than min time for next bucket).
Query response time histogram
256us	1ms	4ms	16ms	64ms	256ms	1s	4s	16s	gt	max	tag
99.972	0.028	nonzero	nonzero	0.000	0.000	0.000	0.000	0.000	0.000	0.014	ma120301_rel_withdbg.cz12b_sync_c32r128
99.976	0.024	nonzero	0.000	0.000	0.000	0.000	0.000	0.000	0.000	0.003	ma120301_rel_withdbg.cz12c_sync_c32r128
99.972	0.028	nonzero	0.000	0.000	0.000	0.000	0.000	0.000	0.000	0.002	ma120301_rel_withdbg.cz12b_sync_dw0_c32r128
99.978	0.022	nonzero	0.000	0.000	0.000	0.000	0.000	0.000	0.000	0.003	ma120301_rel_withdbg.cz12c_sync_dw0_c32r128
Insert response time histogram
256us	1ms	4ms	16ms	64ms	256ms	1s	4s	16s	gt	max	tag
0.000	0.000	0.293	99.012	0.694	0.002	0.000	0.000	0.000	0.000	0.089	ma120301_rel_withdbg.cz12b_sync_c32r128
0.000	0.000	95.908	3.790	0.287	0.015	0.000	0.000	0.000	0.000	0.080	ma120301_rel_withdbg.cz12c_sync_c32r128
0.000	0.000	0.359	99.610	0.031	0.000	0.000	0.000	0.000	0.000	0.029	ma120301_rel_withdbg.cz12b_sync_dw0_c32r128
0.000	0.000	97.102	2.101	0.795	0.002	0.000	0.000	0.000	0.000	0.074	ma120301_rel_withdbg.cz12c_sync_dw0_c32r128
Delete response time histogram
256us	1ms	4ms	16ms	64ms	256ms	1s	4s	16s	gt	max	tag
0.000	0.000	0.550	98.817	0.630	0.002	0.000	0.000	0.000	0.000	0.089	ma120301_rel_withdbg.cz12b_sync_c32r128
0.000	0.000	96.363	3.352	0.272	0.013	0.000	0.000	0.000	0.000	0.077	ma120301_rel_withdbg.cz12c_sync_c32r128
0.000	0.000	0.395	99.588	0.016	0.000	0.000	0.000	0.000	0.000	0.025	ma120301_rel_withdbg.cz12b_sync_dw0_c32r128
0.000	0.000	97.478	1.753	0.769	nonzero	0.000	0.000	0.000	0.000	0.074	ma120301_rel_withdbg.cz12c_sync_dw0_c32r128
qr1000.L5
- qr1000.L5: range queries with 1000 insert/s per client
- Legend for results is here.
- Each entry lists the percentage of responses that fit in that bucket (slower than max time for previous bucket, faster than min time for next bucket).
Query response time histogram
256us	1ms	4ms	16ms	64ms	256ms	1s	4s	16s	gt	max	tag
99.935	0.064	0.001	nonzero	nonzero	0.000	0.000	0.000	0.000	0.000	0.046	ma120301_rel_withdbg.cz12b_sync_c32r128
99.947	0.051	0.001	nonzero	nonzero	nonzero	0.000	0.000	0.000	0.000	0.132	ma120301_rel_withdbg.cz12c_sync_c32r128
99.934	0.065	0.001	nonzero	0.000	0.000	0.000	0.000	0.000	0.000	0.004	ma120301_rel_withdbg.cz12b_sync_dw0_c32r128
99.944	0.055	0.001	nonzero	nonzero	0.000	0.000	0.000	0.000	0.000	0.027	ma120301_rel_withdbg.cz12c_sync_dw0_c32r128
Insert response time histogram
256us	1ms	4ms	16ms	64ms	256ms	1s	4s	16s	gt	max	tag
0.000	0.000	0.208	98.134	1.650	0.007	0.000	0.000	0.000	0.000	0.101	ma120301_rel_withdbg.cz12b_sync_c32r128
0.000	0.000	93.902	4.823	1.262	0.013	0.000	0.000	0.000	0.000	0.135	ma120301_rel_withdbg.cz12c_sync_c32r128
0.000	0.000	0.215	99.623	0.163	0.000	0.000	0.000	0.000	0.000	0.040	ma120301_rel_withdbg.cz12b_sync_dw0_c32r128
0.000	0.000	96.326	2.344	1.321	0.009	0.000	0.000	0.000	0.000	0.087	ma120301_rel_withdbg.cz12c_sync_dw0_c32r128
Delete response time histogram
256us	1ms	4ms	16ms	64ms	256ms	1s	4s	16s	gt	max	tag
0.000	0.000	0.156	98.393	1.443	0.008	0.000	0.000	0.000	0.000	0.101	ma120301_rel_withdbg.cz12b_sync_c32r128
0.000	0.000	94.535	4.238	1.215	0.012	0.000	0.000	0.000	0.000	0.143	ma120301_rel_withdbg.cz12c_sync_c32r128
0.000	0.000	0.196	99.725	0.079	0.000	0.000	0.000	0.000	0.000	0.040	ma120301_rel_withdbg.cz12b_sync_dw0_c32r128
0.000	0.000	96.555	2.145	1.291	0.008	0.000	0.000	0.000	0.000	0.087	ma120301_rel_withdbg.cz12c_sync_dw0_c32r128
qp1000.L6
- qp1000.L6: point queries with 1000 insert/s per client
- Legend for results is here.
- Each entry lists the percentage of responses that fit in that bucket (slower than max time for previous bucket, faster than min time for next bucket).
Query response time histogram
256us	1ms	4ms	16ms	64ms	256ms	1s	4s	16s	gt	max	tag
99.926	0.073	0.001	nonzero	0.000	0.000	0.000	0.000	0.000	0.000	0.009	ma120301_rel_withdbg.cz12b_sync_c32r128
99.943	0.056	0.001	nonzero	0.000	0.000	0.000	0.000	0.000	0.000	0.012	ma120301_rel_withdbg.cz12c_sync_c32r128
99.922	0.077	0.001	0.000	0.000	0.000	0.000	0.000	0.000	0.000	0.004	ma120301_rel_withdbg.cz12b_sync_dw0_c32r128
99.918	0.081	0.001	0.000	0.000	0.000	0.000	0.000	0.000	0.000	0.003	ma120301_rel_withdbg.cz12c_sync_dw0_c32r128
Insert response time histogram
256us	1ms	4ms	16ms	64ms	256ms	1s	4s	16s	gt	max	tag
0.000	0.000	0.238	98.779	0.978	0.005	0.000	0.000	0.000	0.000	0.083	ma120301_rel_withdbg.cz12b_sync_c32r128
0.000	0.000	94.312	4.629	1.050	0.009	0.000	0.000	0.000	0.000	0.132	ma120301_rel_withdbg.cz12c_sync_c32r128
0.000	0.000	0.201	98.699	1.094	0.003	0.000	0.003	0.000	0.000	1.165	ma120301_rel_withdbg.cz12b_sync_dw0_c32r128
0.000	0.000	93.770	4.831	1.372	0.028	0.000	0.000	0.000	0.000	0.109	ma120301_rel_withdbg.cz12c_sync_dw0_c32r128
Delete response time histogram
256us	1ms	4ms	16ms	64ms	256ms	1s	4s	16s	gt	max	tag
0.000	0.000	0.254	98.910	0.833	0.003	0.000	0.000	0.000	0.000	0.082	ma120301_rel_withdbg.cz12b_sync_c32r128
0.000	0.000	94.878	4.095	1.019	0.008	0.000	0.000	0.000	0.000	0.105	ma120301_rel_withdbg.cz12c_sync_c32r128
0.000	0.000	0.181	98.833	0.980	0.003	0.000	0.003	0.000	0.000	1.165	ma120301_rel_withdbg.cz12b_sync_dw0_c32r128
0.000	0.000	94.215	4.417	1.341	0.026	0.000	0.000	0.000	0.000	0.107	ma120301_rel_withdbg.cz12c_sync_dw0_c32r128