Introduction
This is a report for the insert benchmark with 120M docs and 12 client(s). It is generated by scripts (bash, awk, sed) and Tufte might not be impressed. An overview of the insert benchmark is here and a short update is here. Below, by DBMS, I mean DBMS+version.config. An example is my8020.c10b40 where my means MySQL, 8020 is version 8.0.20 and c10b40 is the name for the configuration file.
The test server has 32 cores, 128G RAM and 1 NVMe device. The benchmark was run with 12 clients and there were 1 or 3 connections per client (1 for queries or inserts without rate limits, 1+1 for rate limited inserts+deletes). It uses 8 tables with a table per client. It loads 10M rows per table without secondary indexes, creates 3 secondary indexes per table, then inserts 16m+4m rows per table with a delete per insert to avoid growing the table. It then does 6 read+write tests for 1800s each that do queries as fast as possible with 100,100,500,500,1000,1000 inserts/s and the same for deletes/s per client concurrent with the queries. The database is cached. Clients and the DBMS share one server.
The tested DBMS are:
- ma120301_rel_withdbg.cz12b_c32r128 - MariaDB 12.3.1 with the z12b config, my standard config
- ma120301_rel_withdbg.cz12c_c32r128 - MariaDB 12.3.1 with the z12c config that uses the binlog storage engine
- ma120301_rel_withdbg.cz12b_dw0_c32r128 - MariaDB 12.3.1 with the z12b_dw0_config that is like z12b and then disables the InnoDB doublewrite buffer
- ma120301_rel_withdbg.cz12c_dw0_c32r128 - MariaDB 12.3.1 with the z12c_dw0_config that is like z12c and then disables the InnoDB doublewrite buffer
Contents
- Summary
- l.i0: load without secondary indexes
- l.x: create secondary indexes
- l.i1: continue load after secondary indexes created with 50 inserts per transaction
- l.i2: continue load after secondary indexes created with 5 inserts per transaction
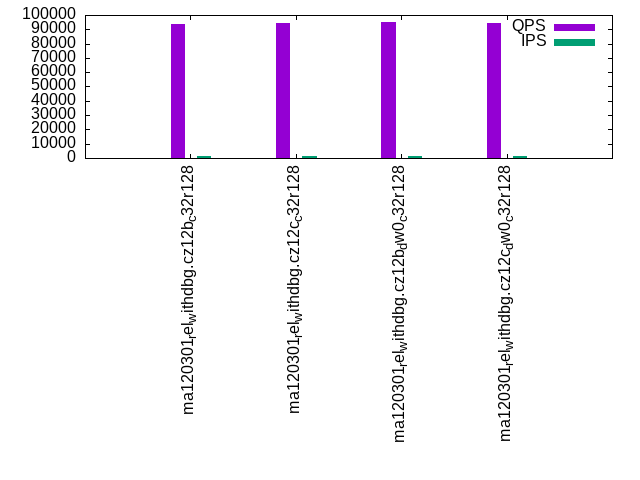
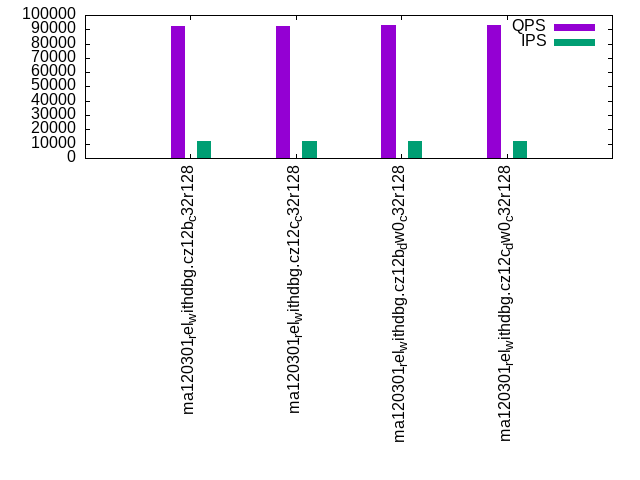
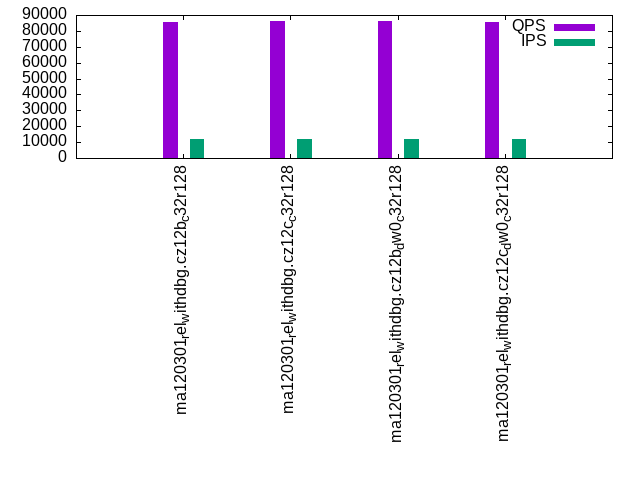
- qr100.L1: range queries with 100 insert/s per client
- qp100.L2: point queries with 100 insert/s per client
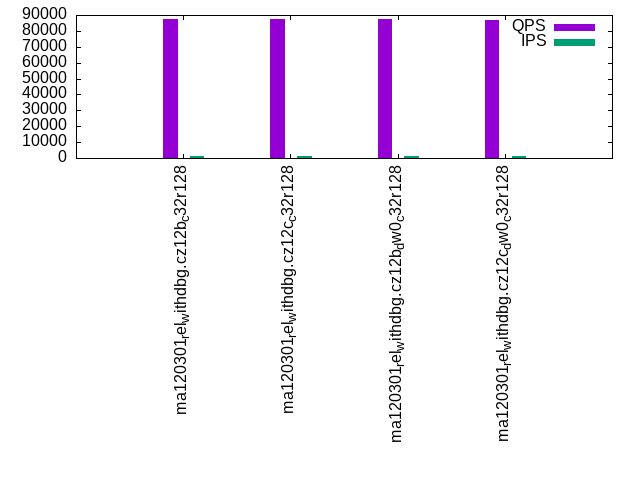
- qr500.L3: range queries with 500 insert/s per client
- qp500.L4: point queries with 500 insert/s per client
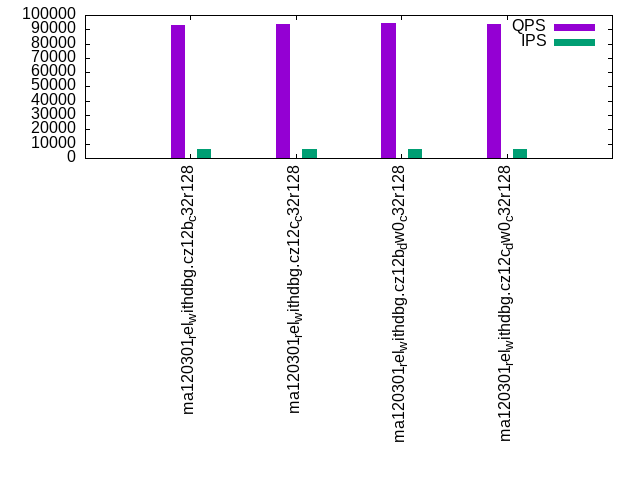
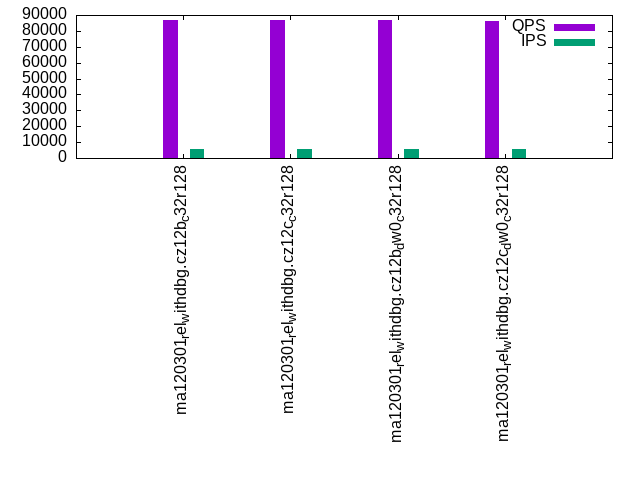
- qr1000.L5: range queries with 1000 insert/s per client
- qp1000.L6: point queries with 1000 insert/s per client
Summary
The numbers are inserts/s for l.i0, l.i1 and l.i2, indexed docs (or rows) /s for l.x and queries/s for qr100, qp100 thru qr1000, qp1000" The values are the average rate over the entire test for inserts (IPS) and queries (QPS). The range of values for IPS and QPS is split into 3 parts: bottom 25%, middle 50%, top 25%. Values in the bottom 25% have a red background, values in the top 25% have a green background and values in the middle have no color. A gray background is used for values that can be ignored because the DBMS did not sustain the target insert rate. Red backgrounds are not used when the minimum value is within 80% of the max value.
| dbms | l.i0 | l.x | l.i1 | l.i2 | qr100 | qp100 | qr500 | qp500 | qr1000 | qp1000 |
|---|---|---|---|---|---|---|---|---|---|---|
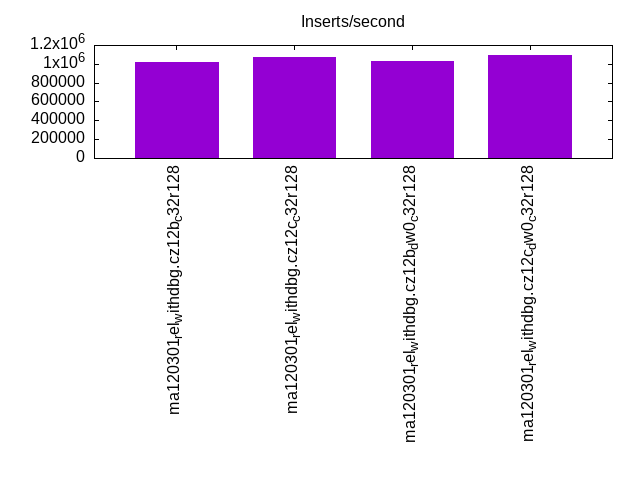
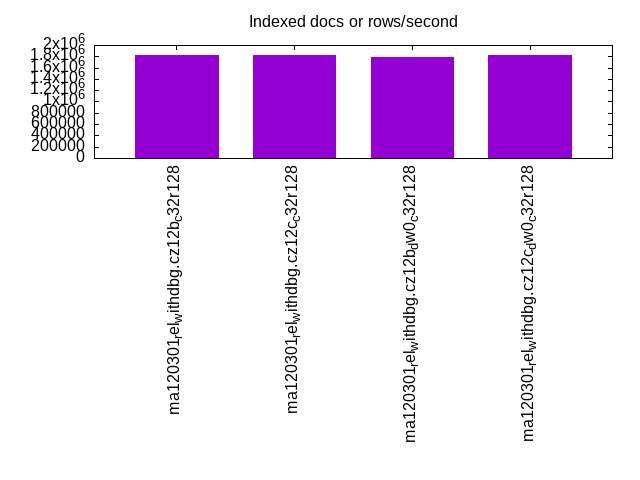
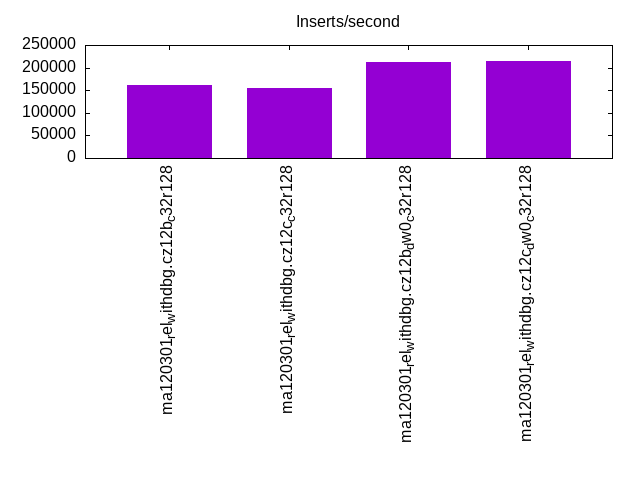
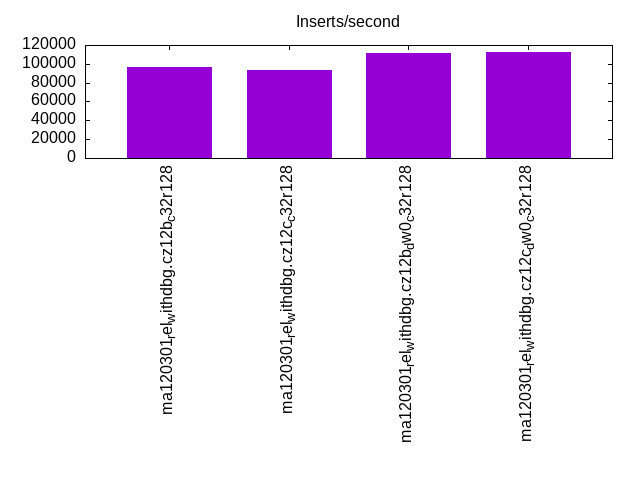
| ma120301_rel_withdbg.cz12b_c32r128 | 1016949 | 1818183 | 161344 | 96579 | 93888 | 87344 | 92881 | 86635 | 91974 | 85680 |
| ma120301_rel_withdbg.cz12c_c32r128 | 1071428 | 1818183 | 155844 | 93567 | 94446 | 87724 | 93611 | 86909 | 92599 | 86018 |
| ma120301_rel_withdbg.cz12b_dw0_c32r128 | 1025641 | 1791046 | 211687 | 111111 | 94920 | 87664 | 94088 | 86954 | 93108 | 86035 |
| ma120301_rel_withdbg.cz12c_dw0_c32r128 | 1090909 | 1818183 | 215247 | 112150 | 94658 | 86896 | 94030 | 86250 | 92738 | 85526 |
This table has relative throughput, throughput for the DBMS relative to the DBMS in the first line, using the absolute throughput from the previous table. Values less than 0.95 have a yellow background. Values greater than 1.05 have a blue background.
| dbms | l.i0 | l.x | l.i1 | l.i2 | qr100 | qp100 | qr500 | qp500 | qr1000 | qp1000 |
|---|---|---|---|---|---|---|---|---|---|---|
| ma120301_rel_withdbg.cz12b_c32r128 | 1.00 | 1.00 | 1.00 | 1.00 | 1.00 | 1.00 | 1.00 | 1.00 | 1.00 | 1.00 |
| ma120301_rel_withdbg.cz12c_c32r128 | 1.05 | 1.00 | 0.97 | 0.97 | 1.01 | 1.00 | 1.01 | 1.00 | 1.01 | 1.00 |
| ma120301_rel_withdbg.cz12b_dw0_c32r128 | 1.01 | 0.99 | 1.31 | 1.15 | 1.01 | 1.00 | 1.01 | 1.00 | 1.01 | 1.00 |
| ma120301_rel_withdbg.cz12c_dw0_c32r128 | 1.07 | 1.00 | 1.33 | 1.16 | 1.01 | 0.99 | 1.01 | 1.00 | 1.01 | 1.00 |
This lists the average rate of inserts/s for the tests that do inserts concurrent with queries. For such tests the query rate is listed in the table above. The read+write tests are setup so that the insert rate should match the target rate every second. Cells that are not at least 95% of the target have a red background to indicate a failure to satisfy the target.
| dbms | qr100.L1 | qp100.L2 | qr500.L3 | qp500.L4 | qr1000.L5 | qp1000.L6 |
|---|---|---|---|---|---|---|
| ma120301_rel_withdbg.cz12b_c32r128 | 1193 | 1193 | 5964 | 5960 | 11927 | 11927 |
| ma120301_rel_withdbg.cz12c_c32r128 | 1193 | 1193 | 5964 | 5960 | 11927 | 11927 |
| ma120301_rel_withdbg.cz12b_dw0_c32r128 | 1193 | 1193 | 5964 | 5960 | 11927 | 11927 |
| ma120301_rel_withdbg.cz12c_dw0_c32r128 | 1193 | 1193 | 5964 | 5960 | 11927 | 11927 |
| target | 1200 | 1200 | 6000 | 6000 | 12000 | 12000 |
l.i0
l.i0: load without secondary indexes. Graphs for performance per 1-second interval are here.
Average throughput:
Insert response time histogram: each cell has the percentage of responses that take <= the time in the header and max is the max response time in seconds. For the max column values in the top 25% of the range have a red background and in the bottom 25% of the range have a green background. The red background is not used when the min value is within 80% of the max value.
| dbms | 256us | 1ms | 4ms | 16ms | 64ms | 256ms | 1s | 4s | 16s | gt | max |
|---|---|---|---|---|---|---|---|---|---|---|---|
| ma120301_rel_withdbg.cz12b_c32r128 | 96.227 | 3.691 | 0.028 | 0.005 | 0.049 | 0.223 | |||||
| ma120301_rel_withdbg.cz12c_c32r128 | 96.936 | 2.985 | 0.068 | 0.006 | 0.003 | 0.255 | |||||
| ma120301_rel_withdbg.cz12b_dw0_c32r128 | 96.246 | 3.671 | 0.030 | 0.005 | 0.048 | 0.124 | |||||
| ma120301_rel_withdbg.cz12c_dw0_c32r128 | 97.457 | 2.468 | 0.064 | 0.010 | 0.001 | 0.090 |
Performance metrics for the DBMS listed above. Some are normalized by throughput, others are not. Legend for results is here.
ips	qps	rps	rmbps	wps	wmbps	rpq	rkbpq	wpi	wkbpi	csps	cpups	cspq	cpupq	dbgb1	dbgb2	rss	maxop	p50	p99	tag
1016949	0	0	0.0	2371.5	215.9	0.000	0.000	0.002	0.217	150276	44.2	0.148	14	8.0	108.8	10.0	0.223	102487	90789	ma120301_rel_withdbg.cz12b_c32r128
1071428	0	0	0.0	5157.9	373.3	0.000	0.000	0.005	0.357	164714	46.5	0.154	14	8.0	109.3	8.3	0.255	110084	97688	ma120301_rel_withdbg.cz12c_c32r128
1025641	0	0	0.0	2367.8	215.9	0.000	0.000	0.002	0.216	151202	44.0	0.147	14	8.0	108.8	10.0	0.124	106086	93789	ma120301_rel_withdbg.cz12b_dw0_c32r128
1090909	0	0	0.0	5233.7	374.8	0.000	0.000	0.005	0.352	165527	46.3	0.152	14	8.0	109.3	8.4	0.090	110287	105087	ma120301_rel_withdbg.cz12c_dw0_c32r128
Average values from iostat.
r/s	rkB/s	rrqm/s	%rrqm	r_await	rareq-s	w/s	wkB/s	wrqm/s	%wrqm	w_await	wareq-s	d/s	dkB/s	drqm/s	%drqm	d_await	dareq-s	f/s	f_await	aqu-sz	%util
0.243	3.896	0.000	0.000	0.005	0.696	2371.5	221113	170.5	9.237	0.299	103.6	3.565	43.10	0.000	0.000	0.995	10.94	55.86	0.394	0.521	12.66		ma120301_rel_withdbg.cz12b_c32r128
0.300	4.800	0.000	0.000	0.005	0.727	5157.9	382309	226.5	5.841	0.326	85.66	2.173	42.29	0.000	0.000	1.505	18.12	67.73	0.388	1.335	18.61		ma120301_rel_withdbg.cz12c_c32r128
0.243	3.896	0.000	0.000	0.005	0.696	2367.8	221045	174.2	9.353	0.283	103.8	2.270	46.89	0.000	0.000	1.030	17.98	55.92	0.383	0.471	12.65		ma120301_rel_withdbg.cz12b_dw0_c32r128
0.245	3.927	0.000	0.000	0.005	0.727	5233.7	383826	224.4	5.766	0.318	85.02	1.700	45.78	0.000	0.000	1.611	20.37	65.65	0.380	1.290	18.66		ma120301_rel_withdbg.cz12c_dw0_c32r128
l.x
l.x: create secondary indexes.
Average throughput:
Performance metrics for the DBMS listed above. Some are normalized by throughput, others are not. Legend for results is here.
ips	qps	rps	rmbps	wps	wmbps	rpq	rkbpq	wpi	wkbpi	csps	cpups	cspq	cpupq	dbgb1	dbgb2	rss	maxop	p50	p99	tag
1818183	0	0	0.0	13561.5	1272.1	0.000	0.000	0.007	0.716	21213	31.5	0.012	6	16.9	117.7	17.8	0.002	NA	NA	ma120301_rel_withdbg.cz12b_c32r128
1818183	0	0	0.0	13497.1	1273.3	0.000	0.000	0.007	0.717	21305	31.1	0.012	5	16.9	118.2	17.9	0.001	NA	NA	ma120301_rel_withdbg.cz12c_c32r128
1791046	0	0	0.0	13345.0	1266.8	0.000	0.000	0.007	0.724	20120	31.5	0.011	6	16.9	117.7	17.5	0.002	NA	NA	ma120301_rel_withdbg.cz12b_dw0_c32r128
1818183	0	0	0.0	13521.9	1273.9	0.000	0.000	0.007	0.717	21102	31.1	0.012	5	16.9	118.2	17.9	0.002	NA	NA	ma120301_rel_withdbg.cz12c_dw0_c32r128
Average values from iostat.
r/s	rkB/s	rrqm/s	%rrqm	r_await	rareq-s	w/s	wkB/s	wrqm/s	%wrqm	w_await	wareq-s	d/s	dkB/s	drqm/s	%drqm	d_await	dareq-s	f/s	f_await	aqu-sz	%util
0.015	0.246	0.000	0.000	0.000	1.231	13561.5	1302640	406.9	2.756	0.229	86.34	23.31	152294	0.000	0.000	1.298	4057.5	80.58	0.624	3.698	39.39		ma120301_rel_withdbg.cz12b_c32r128
0.185	20.31	0.000	0.000	0.100	19.02	13497.1	1303904	401.9	2.696	0.222	92.03	22.45	152280	0.000	0.000	1.232	4288.1	84.05	0.615	3.674	38.79		ma120301_rel_withdbg.cz12c_c32r128
0.015	0.245	0.000	0.000	0.000	1.231	13345.0	1297190	398.2	2.679	0.257	88.39	21.50	138359	0.000	0.000	1.366	4001.8	78.86	0.653	4.054	38.79		ma120301_rel_withdbg.cz12b_dw0_c32r128
0.046	3.385	0.000	0.000	0.038	9.077	13521.9	1304492	389.1	2.721	0.221	91.29	22.80	152286	0.000	0.000	1.222	4222.3	82.12	0.591	3.618	38.27		ma120301_rel_withdbg.cz12c_dw0_c32r128
l.i1
l.i1: continue load after secondary indexes created with 50 inserts per transaction. Graphs for performance per 1-second interval are here.
Average throughput:
Insert response time histogram: each cell has the percentage of responses that take <= the time in the header and max is the max response time in seconds. For the max column values in the top 25% of the range have a red background and in the bottom 25% of the range have a green background. The red background is not used when the min value is within 80% of the max value.
| dbms | 256us | 1ms | 4ms | 16ms | 64ms | 256ms | 1s | 4s | 16s | gt | max |
|---|---|---|---|---|---|---|---|---|---|---|---|
| ma120301_rel_withdbg.cz12b_c32r128 | 0.056 | 95.439 | 2.415 | 1.451 | 0.473 | 0.166 | 0.001 | 3.012 | |||
| ma120301_rel_withdbg.cz12c_c32r128 | 0.339 | 95.041 | 2.391 | 1.485 | 0.530 | 0.213 | 0.001 | 2.735 | |||
| ma120301_rel_withdbg.cz12b_dw0_c32r128 | 0.004 | 96.038 | 2.832 | 0.994 | 0.114 | 0.016 | 0.002 | 2.796 | |||
| ma120301_rel_withdbg.cz12c_dw0_c32r128 | 0.015 | 96.830 | 2.151 | 0.862 | 0.109 | 0.033 | nonzero | 1.984 |
Delete response time histogram: each cell has the percentage of responses that take <= the time in the header and max is the max response time in seconds. For the max column values in the top 25% of the range have a red background and in the bottom 25% of the range have a green background. The red background is not used when the min value is within 80% of the max value.
| dbms | 256us | 1ms | 4ms | 16ms | 64ms | 256ms | 1s | 4s | 16s | gt | max |
|---|---|---|---|---|---|---|---|---|---|---|---|
| ma120301_rel_withdbg.cz12b_c32r128 | 1.595 | 94.238 | 2.148 | 1.404 | 0.459 | 0.155 | 0.001 | 3.012 | |||
| ma120301_rel_withdbg.cz12c_c32r128 | 2.464 | 93.286 | 2.106 | 1.428 | 0.521 | 0.194 | 0.001 | 3.079 | |||
| ma120301_rel_withdbg.cz12b_dw0_c32r128 | 0.141 | 96.155 | 2.601 | 0.972 | 0.113 | 0.015 | 0.002 | 2.798 | |||
| ma120301_rel_withdbg.cz12c_dw0_c32r128 | 0.102 | 96.925 | 1.960 | 0.870 | 0.110 | 0.033 | nonzero | 1.984 |
Performance metrics for the DBMS listed above. Some are normalized by throughput, others are not. Legend for results is here.
ips	qps	rps	rmbps	wps	wmbps	rpq	rkbpq	wpi	wkbpi	csps	cpups	cspq	cpupq	dbgb1	dbgb2	rss	maxop	p50	p99	tag
161344	0	0	0.0	8545.7	285.7	0.000	0.000	0.053	1.813	123631	49.6	0.766	98	27.1	129.2	30.2	3.012	15498	150	ma120301_rel_withdbg.cz12b_c32r128
155844	0	0	0.0	8077.8	294.7	0.000	0.000	0.052	1.936	110791	46.3	0.711	95	27.1	129.7	30.2	2.735	15698	150	ma120301_rel_withdbg.cz12c_c32r128
211687	0	0	0.0	8588.8	279.2	0.000	0.000	0.041	1.351	152630	68.0	0.721	103	27.1	129.3	30.3	2.796	18048	2000	ma120301_rel_withdbg.cz12b_dw0_c32r128
215247	0	0	0.0	7997.1	301.5	0.000	0.000	0.037	1.434	134142	69.2	0.623	103	27.2	129.8	30.4	1.984	18797	2950	ma120301_rel_withdbg.cz12c_dw0_c32r128
Average values from iostat.
r/s	rkB/s	rrqm/s	%rrqm	r_await	rareq-s	w/s	wkB/s	wrqm/s	%wrqm	w_await	wareq-s	d/s	dkB/s	drqm/s	%drqm	d_await	dareq-s	f/s	f_await	aqu-sz	%util
0.001	0.003	0.000	0.000	0.017	0.017	8545.7	292531	462.7	4.781	2.434	33.82	0.686	13.97	0.000	0.000	1.398	11.82	626.2	0.681	9.002	51.72		ma120301_rel_withdbg.cz12b_c32r128
0.000	0.000	0.000	0.000	0.000	0.000	8077.8	301732	393.1	4.341	3.141	36.75	0.780	15.99	0.000	0.000	4.354	19.11	555.1	0.888	12.00	55.32		ma120301_rel_withdbg.cz12c_c32r128
0.001	0.004	0.000	0.000	0.000	0.022	8588.8	285940	433.9	4.447	4.070	33.61	1.039	11.85	0.000	0.000	2.470	7.096	82.79	1.200	18.65	35.91		ma120301_rel_withdbg.cz12b_dw0_c32r128
0.000	0.000	0.000	0.000	0.000	0.000	7997.1	308722	325.1	3.503	10.33	41.07	0.892	12.45	0.000	0.000	5.722	12.45	77.99	2.275	36.72	42.74		ma120301_rel_withdbg.cz12c_dw0_c32r128
l.i2
l.i2: continue load after secondary indexes created with 5 inserts per transaction. Graphs for performance per 1-second interval are here.
Average throughput:
Insert response time histogram: each cell has the percentage of responses that take <= the time in the header and max is the max response time in seconds. For the max column values in the top 25% of the range have a red background and in the bottom 25% of the range have a green background. The red background is not used when the min value is within 80% of the max value.
| dbms | 256us | 1ms | 4ms | 16ms | 64ms | 256ms | 1s | 4s | 16s | gt | max |
|---|---|---|---|---|---|---|---|---|---|---|---|
| ma120301_rel_withdbg.cz12b_c32r128 | 6.734 | 91.345 | 1.298 | 0.248 | 0.354 | 0.020 | 0.001 | 0.550 | |||
| ma120301_rel_withdbg.cz12c_c32r128 | 12.694 | 85.103 | 1.519 | 0.236 | 0.422 | 0.025 | nonzero | 0.310 | |||
| ma120301_rel_withdbg.cz12b_dw0_c32r128 | 1.603 | 96.896 | 1.341 | 0.070 | 0.082 | 0.006 | 0.002 | 0.848 | |||
| ma120301_rel_withdbg.cz12c_dw0_c32r128 | 3.165 | 95.300 | 1.333 | 0.059 | 0.138 | 0.005 | nonzero | 0.872 |
Delete response time histogram: each cell has the percentage of responses that take <= the time in the header and max is the max response time in seconds. For the max column values in the top 25% of the range have a red background and in the bottom 25% of the range have a green background. The red background is not used when the min value is within 80% of the max value.
| dbms | 256us | 1ms | 4ms | 16ms | 64ms | 256ms | 1s | 4s | 16s | gt | max |
|---|---|---|---|---|---|---|---|---|---|---|---|
| ma120301_rel_withdbg.cz12b_c32r128 | 6.481 | 91.627 | 1.291 | 0.233 | 0.350 | 0.017 | 0.001 | 0.550 | |||
| ma120301_rel_withdbg.cz12c_c32r128 | 12.388 | 85.407 | 1.546 | 0.223 | 0.416 | 0.020 | nonzero | 0.312 | |||
| ma120301_rel_withdbg.cz12b_dw0_c32r128 | 1.502 | 96.993 | 1.350 | 0.066 | 0.081 | 0.006 | 0.002 | 0.849 | |||
| ma120301_rel_withdbg.cz12c_dw0_c32r128 | 3.063 | 95.388 | 1.351 | 0.056 | 0.137 | 0.005 | nonzero | 0.872 |
Performance metrics for the DBMS listed above. Some are normalized by throughput, others are not. Legend for results is here.
ips	qps	rps	rmbps	wps	wmbps	rpq	rkbpq	wpi	wkbpi	csps	cpups	cspq	cpupq	dbgb1	dbgb2	rss	maxop	p50	p99	tag
96579	0	0	0.0	8930.0	311.6	0.000	0.000	0.092	3.303	503597	61.4	5.214	203	27.1	129.2	30.2	0.550	9579	1405	ma120301_rel_withdbg.cz12b_c32r128
93567	0	0	0.0	8416.7	312.4	0.000	0.000	0.090	3.419	448985	57.4	4.799	196	27.1	129.7	30.2	0.310	9569	705	ma120301_rel_withdbg.cz12c_c32r128
111111	0	0	0.0	8196.7	252.7	0.000	0.000	0.074	2.328	570406	72.3	5.134	208	27.1	129.3	30.3	0.848	9834	2240	ma120301_rel_withdbg.cz12b_dw0_c32r128
112150	0	0	0.0	6981.0	258.2	0.000	0.000	0.062	2.358	520623	69.8	4.642	199	27.2	129.8	30.5	0.872	10193	1065	ma120301_rel_withdbg.cz12c_dw0_c32r128
Average values from iostat.
r/s	rkB/s	rrqm/s	%rrqm	r_await	rareq-s	w/s	wkB/s	wrqm/s	%wrqm	w_await	wareq-s	d/s	dkB/s	drqm/s	%drqm	d_await	dareq-s	f/s	f_await	aqu-sz	%util
0.000	0.000	0.000	0.000	0.000	0.000	8930.0	319041	35.95	0.390	1.302	35.74	0.675	7.758	0.000	0.000	1.578	4.538	594.3	0.674	8.263	52.66		ma120301_rel_withdbg.cz12b_c32r128
0.000	0.000	0.000	0.000	0.000	0.000	8416.7	319862	13.16	0.154	2.305	38.27	0.631	3.616	0.000	0.000	3.930	4.606	551.9	0.824	13.32	58.40		ma120301_rel_withdbg.cz12c_c32r128
0.000	0.000	0.000	0.000	0.000	0.000	8196.7	258719	8.121	0.102	2.567	32.15	0.463	10.34	0.000	0.000	2.217	10.31	59.80	1.525	16.34	38.43		ma120301_rel_withdbg.cz12b_dw0_c32r128
0.002	0.009	0.000	0.000	0.000	0.047	6981.0	264399	9.798	0.147	8.181	41.28	0.746	6.381	0.000	0.000	5.804	6.707	49.90	2.236	30.65	45.78		ma120301_rel_withdbg.cz12c_dw0_c32r128
qr100.L1
qr100.L1: range queries with 100 insert/s per client. Graphs for performance per 1-second interval are here.
Average throughput:
Query response time histogram: each cell has the percentage of responses that take <= the time in the header and max is the max response time in seconds. For max values in the top 25% of the range have a red background and in the bottom 25% of the range have a green background. The red background is not used when the min value is within 80% of the max value.
| dbms | 256us | 1ms | 4ms | 16ms | 64ms | 256ms | 1s | 4s | 16s | gt | max |
|---|---|---|---|---|---|---|---|---|---|---|---|
| ma120301_rel_withdbg.cz12b_c32r128 | 99.992 | 0.008 | nonzero | 0.002 | |||||||
| ma120301_rel_withdbg.cz12c_c32r128 | 99.993 | 0.007 | nonzero | 0.002 | |||||||
| ma120301_rel_withdbg.cz12b_dw0_c32r128 | 99.993 | 0.007 | nonzero | 0.002 | |||||||
| ma120301_rel_withdbg.cz12c_dw0_c32r128 | 99.992 | 0.008 | nonzero | 0.004 |
Insert response time histogram: each cell has the percentage of responses that take <= the time in the header and max is the max response time in seconds. For max values in the top 25% of the range have a red background and in the bottom 25% of the range have a green background. The red background is not used when the min value is within 80% of the max value.
| dbms | 256us | 1ms | 4ms | 16ms | 64ms | 256ms | 1s | 4s | 16s | gt | max |
|---|---|---|---|---|---|---|---|---|---|---|---|
| ma120301_rel_withdbg.cz12b_c32r128 | 1.403 | 98.273 | 0.324 | 0.012 | |||||||
| ma120301_rel_withdbg.cz12c_c32r128 | 2.148 | 97.852 | 0.002 | ||||||||
| ma120301_rel_withdbg.cz12b_dw0_c32r128 | 1.549 | 98.113 | 0.338 | 0.014 | |||||||
| ma120301_rel_withdbg.cz12c_dw0_c32r128 | 2.387 | 97.613 | 0.002 |
Delete response time histogram: each cell has the percentage of responses that take <= the time in the header and max is the max response time in seconds. For max values in the top 25% of the range have a red background and in the bottom 25% of the range have a green background. The red background is not used when the min value is within 80% of the max value.
| dbms | 256us | 1ms | 4ms | 16ms | 64ms | 256ms | 1s | 4s | 16s | gt | max |
|---|---|---|---|---|---|---|---|---|---|---|---|
| ma120301_rel_withdbg.cz12b_c32r128 | 32.218 | 67.553 | 0.229 | 0.012 | |||||||
| ma120301_rel_withdbg.cz12c_c32r128 | 41.382 | 58.618 | 0.002 | ||||||||
| ma120301_rel_withdbg.cz12b_dw0_c32r128 | 39.678 | 60.104 | 0.218 | 0.013 | |||||||
| ma120301_rel_withdbg.cz12c_dw0_c32r128 | 41.532 | 58.468 | 0.002 |
Performance metrics for the DBMS listed above. Some are normalized by throughput, others are not. Legend for results is here.
ips	qps	rps	rmbps	wps	wmbps	rpq	rkbpq	wpi	wkbpi	csps	cpups	cspq	cpupq	dbgb1	dbgb2	rss	maxop	p50	p99	tag
1193	93888	0	0.0	13.9	1.4	0.000	0.000	0.012	1.229	537974	40.5	5.730	138	27.1	129.2	30.2	0.002	7903	7823	ma120301_rel_withdbg.cz12b_c32r128
1193	94446	0	0.0	18.0	1.6	0.000	0.000	0.015	1.414	541167	40.0	5.730	136	27.1	129.7	30.2	0.002	7935	7855	ma120301_rel_withdbg.cz12c_c32r128
1193	94920	0	0.0	12.6	1.3	0.000	0.000	0.011	1.098	543899	39.9	5.730	135	27.1	129.3	30.3	0.002	7967	7903	ma120301_rel_withdbg.cz12b_dw0_c32r128
1193	94658	0	0.0	16.8	1.5	0.000	0.000	0.014	1.290	542367	39.9	5.730	135	27.2	129.8	30.4	0.004	7935	7855	ma120301_rel_withdbg.cz12c_dw0_c32r128
Average values from iostat.
r/s	rkB/s	rrqm/s	%rrqm	r_await	rareq-s	w/s	wkB/s	wrqm/s	%wrqm	w_await	wareq-s	d/s	dkB/s	drqm/s	%drqm	d_await	dareq-s	f/s	f_await	aqu-sz	%util
0.000	0.000	0.000	0.000	0.000	0.000	13.92	1465.5	0.739	5.230	2.655	104.6	0.015	0.307	0.000	0.000	0.083	1.536	1.199	0.782	0.038	0.511		ma120301_rel_withdbg.cz12b_c32r128
0.000	0.000	0.000	0.000	0.000	0.000	18.01	1686.5	3.064	14.71	2.157	93.20	0.001	0.007	0.000	0.000	0.006	0.033	2.004	0.781	0.039	0.810		ma120301_rel_withdbg.cz12c_c32r128
0.000	0.000	0.000	0.000	0.000	0.000	12.60	1310.0	0.938	7.058	2.542	103.5	0.028	0.172	0.000	0.000	0.123	0.663	1.200	0.624	0.033	0.472		ma120301_rel_withdbg.cz12b_dw0_c32r128
0.000	0.000	0.000	0.000	0.000	0.000	16.83	1538.5	3.038	15.32	2.032	91.31	0.001	0.002	0.000	0.000	0.006	0.011	2.003	0.527	0.034	0.709		ma120301_rel_withdbg.cz12c_dw0_c32r128
qp100.L2
qp100.L2: point queries with 100 insert/s per client. Graphs for performance per 1-second interval are here.
Average throughput:
Query response time histogram: each cell has the percentage of responses that take <= the time in the header and max is the max response time in seconds. For max values in the top 25% of the range have a red background and in the bottom 25% of the range have a green background. The red background is not used when the min value is within 80% of the max value.
| dbms | 256us | 1ms | 4ms | 16ms | 64ms | 256ms | 1s | 4s | 16s | gt | max |
|---|---|---|---|---|---|---|---|---|---|---|---|
| ma120301_rel_withdbg.cz12b_c32r128 | 99.993 | 0.007 | nonzero | 0.002 | |||||||
| ma120301_rel_withdbg.cz12c_c32r128 | 99.993 | 0.007 | nonzero | 0.002 | |||||||
| ma120301_rel_withdbg.cz12b_dw0_c32r128 | 99.992 | 0.008 | nonzero | 0.002 | |||||||
| ma120301_rel_withdbg.cz12c_dw0_c32r128 | 99.992 | 0.008 | nonzero | 0.002 |
Insert response time histogram: each cell has the percentage of responses that take <= the time in the header and max is the max response time in seconds. For max values in the top 25% of the range have a red background and in the bottom 25% of the range have a green background. The red background is not used when the min value is within 80% of the max value.
| dbms | 256us | 1ms | 4ms | 16ms | 64ms | 256ms | 1s | 4s | 16s | gt | max |
|---|---|---|---|---|---|---|---|---|---|---|---|
| ma120301_rel_withdbg.cz12b_c32r128 | 0.729 | 98.958 | 0.312 | 0.011 | |||||||
| ma120301_rel_withdbg.cz12c_c32r128 | 0.755 | 99.245 | 0.002 | ||||||||
| ma120301_rel_withdbg.cz12b_dw0_c32r128 | 0.361 | 98.907 | 0.718 | 0.014 | 0.028 | ||||||
| ma120301_rel_withdbg.cz12c_dw0_c32r128 | 1.167 | 98.833 | 0.003 |
Delete response time histogram: each cell has the percentage of responses that take <= the time in the header and max is the max response time in seconds. For max values in the top 25% of the range have a red background and in the bottom 25% of the range have a green background. The red background is not used when the min value is within 80% of the max value.
| dbms | 256us | 1ms | 4ms | 16ms | 64ms | 256ms | 1s | 4s | 16s | gt | max |
|---|---|---|---|---|---|---|---|---|---|---|---|
| ma120301_rel_withdbg.cz12b_c32r128 | 39.854 | 59.988 | 0.157 | 0.011 | |||||||
| ma120301_rel_withdbg.cz12c_c32r128 | 41.375 | 58.625 | 0.002 | ||||||||
| ma120301_rel_withdbg.cz12b_dw0_c32r128 | 28.581 | 70.931 | 0.477 | 0.012 | 0.028 | ||||||
| ma120301_rel_withdbg.cz12c_dw0_c32r128 | 35.593 | 64.407 | 0.002 |
Performance metrics for the DBMS listed above. Some are normalized by throughput, others are not. Legend for results is here.
ips	qps	rps	rmbps	wps	wmbps	rpq	rkbpq	wpi	wkbpi	csps	cpups	cspq	cpupq	dbgb1	dbgb2	rss	maxop	p50	p99	tag
1193	87344	0	0.0	12.3	1.3	0.000	0.000	0.010	1.077	505592	39.9	5.789	146	27.1	129.2	30.2	0.002	7295	7215	ma120301_rel_withdbg.cz12b_c32r128
1193	87724	0	0.0	16.7	1.5	0.000	0.000	0.014	1.272	507787	40.7	5.788	148	27.1	129.7	30.2	0.002	7295	7215	ma120301_rel_withdbg.cz12c_c32r128
1193	87664	0	0.0	12.5	1.3	0.000	0.000	0.010	1.098	507447	40.7	5.789	149	27.1	129.3	30.3	0.002	7311	7215	ma120301_rel_withdbg.cz12b_dw0_c32r128
1193	86896	0	0.0	16.8	1.5	0.000	0.000	0.014	1.291	502988	39.9	5.788	147	27.2	129.8	30.4	0.002	7263	7167	ma120301_rel_withdbg.cz12c_dw0_c32r128
Average values from iostat.
r/s	rkB/s	rrqm/s	%rrqm	r_await	rareq-s	w/s	wkB/s	wrqm/s	%wrqm	w_await	wareq-s	d/s	dkB/s	drqm/s	%drqm	d_await	dareq-s	f/s	f_await	aqu-sz	%util
0.000	0.000	0.000	0.000	0.000	0.000	12.26	1285.0	0.705	5.497	2.533	104.3	0.019	0.340	0.000	0.000	0.177	1.691	1.199	0.623	0.033	0.477		ma120301_rel_withdbg.cz12b_c32r128
0.000	0.000	0.000	0.000	0.000	0.000	16.69	1517.6	3.146	15.83	1.982	90.91	0.003	0.013	0.000	0.000	0.055	0.066	2.029	0.517	0.033	0.696		ma120301_rel_withdbg.cz12c_c32r128
0.000	0.000	0.000	0.000	0.000	0.000	12.46	1309.0	0.717	5.502	2.591	104.7	0.014	0.166	0.000	0.000	0.097	0.779	1.198	0.640	0.034	0.475		ma120301_rel_withdbg.cz12b_dw0_c32r128
0.000	0.000	0.000	0.000	0.000	0.000	16.82	1539.7	3.062	15.43	2.061	91.41	0.002	0.009	0.000	0.000	0.077	0.044	2.003	0.699	0.034	0.777		ma120301_rel_withdbg.cz12c_dw0_c32r128
qr500.L3
qr500.L3: range queries with 500 insert/s per client. Graphs for performance per 1-second interval are here.
Average throughput:
Query response time histogram: each cell has the percentage of responses that take <= the time in the header and max is the max response time in seconds. For max values in the top 25% of the range have a red background and in the bottom 25% of the range have a green background. The red background is not used when the min value is within 80% of the max value.
| dbms | 256us | 1ms | 4ms | 16ms | 64ms | 256ms | 1s | 4s | 16s | gt | max |
|---|---|---|---|---|---|---|---|---|---|---|---|
| ma120301_rel_withdbg.cz12b_c32r128 | 99.983 | 0.016 | 0.001 | nonzero | nonzero | 0.025 | |||||
| ma120301_rel_withdbg.cz12c_c32r128 | 99.981 | 0.018 | 0.001 | nonzero | nonzero | 0.028 | |||||
| ma120301_rel_withdbg.cz12b_dw0_c32r128 | 99.984 | 0.015 | nonzero | nonzero | 0.011 | ||||||
| ma120301_rel_withdbg.cz12c_dw0_c32r128 | 99.981 | 0.019 | 0.001 | nonzero | 0.013 |
Insert response time histogram: each cell has the percentage of responses that take <= the time in the header and max is the max response time in seconds. For max values in the top 25% of the range have a red background and in the bottom 25% of the range have a green background. The red background is not used when the min value is within 80% of the max value.
| dbms | 256us | 1ms | 4ms | 16ms | 64ms | 256ms | 1s | 4s | 16s | gt | max |
|---|---|---|---|---|---|---|---|---|---|---|---|
| ma120301_rel_withdbg.cz12b_c32r128 | 1.747 | 97.940 | 0.307 | 0.006 | 0.026 | ||||||
| ma120301_rel_withdbg.cz12c_c32r128 | 0.872 | 98.891 | 0.229 | 0.008 | 0.029 | ||||||
| ma120301_rel_withdbg.cz12b_dw0_c32r128 | 1.962 | 97.779 | 0.258 | 0.001 | 0.019 | ||||||
| ma120301_rel_withdbg.cz12c_dw0_c32r128 | 0.968 | 98.890 | 0.131 | 0.012 | 0.057 |
Delete response time histogram: each cell has the percentage of responses that take <= the time in the header and max is the max response time in seconds. For max values in the top 25% of the range have a red background and in the bottom 25% of the range have a green background. The red background is not used when the min value is within 80% of the max value.
| dbms | 256us | 1ms | 4ms | 16ms | 64ms | 256ms | 1s | 4s | 16s | gt | max |
|---|---|---|---|---|---|---|---|---|---|---|---|
| ma120301_rel_withdbg.cz12b_c32r128 | 30.445 | 69.355 | 0.197 | 0.003 | 0.026 | ||||||
| ma120301_rel_withdbg.cz12c_c32r128 | 15.254 | 84.581 | 0.161 | 0.005 | 0.029 | ||||||
| ma120301_rel_withdbg.cz12b_dw0_c32r128 | 32.235 | 67.573 | 0.191 | 0.001 | 0.016 | ||||||
| ma120301_rel_withdbg.cz12c_dw0_c32r128 | 16.926 | 82.960 | 0.102 | 0.012 | 0.057 |
Performance metrics for the DBMS listed above. Some are normalized by throughput, others are not. Legend for results is here.
ips	qps	rps	rmbps	wps	wmbps	rpq	rkbpq	wpi	wkbpi	csps	cpups	cspq	cpupq	dbgb1	dbgb2	rss	maxop	p50	p99	tag
5964	92881	0	0.0	419.7	15.5	0.000	0.000	0.070	2.657	535185	41.5	5.762	143	27.1	129.2	30.2	0.025	7759	7631	ma120301_rel_withdbg.cz12b_c32r128
5964	93611	0	0.0	440.5	16.7	0.000	0.000	0.074	2.869	538871	41.3	5.756	141	27.1	129.7	30.2	0.028	7855	7727	ma120301_rel_withdbg.cz12c_c32r128
5964	94088	0	0.0	371.2	11.3	0.000	0.000	0.062	1.938	542241	41.3	5.763	140	27.1	129.3	30.3	0.011	7887	7791	ma120301_rel_withdbg.cz12b_dw0_c32r128
5964	94030	0	0.0	392.9	12.5	0.000	0.000	0.066	2.139	541349	41.0	5.757	140	27.2	129.8	30.4	0.013	7887	7791	ma120301_rel_withdbg.cz12c_dw0_c32r128
Average values from iostat.
r/s	rkB/s	rrqm/s	%rrqm	r_await	rareq-s	w/s	wkB/s	wrqm/s	%wrqm	w_await	wareq-s	d/s	dkB/s	drqm/s	%drqm	d_await	dareq-s	f/s	f_await	aqu-sz	%util
0.000	0.000	0.000	0.000	0.000	0.000	419.7	15846.9	1.929	1.371	2.392	106.1	0.078	0.864	0.000	0.000	0.161	1.165	15.88	0.523	0.163	1.480		ma120301_rel_withdbg.cz12b_c32r128
0.000	0.000	0.000	0.000	0.000	0.000	440.5	17110.5	3.940	4.946	2.300	103.9	0.379	3.032	0.000	0.000	0.413	3.138	16.60	0.479	0.189	1.784		ma120301_rel_withdbg.cz12c_c32r128
0.000	0.000	0.000	0.000	0.000	0.000	371.2	11554.6	0.884	1.383	2.520	107.4	0.049	2.159	0.000	0.000	0.148	5.976	2.298	0.592	0.153	1.085		ma120301_rel_withdbg.cz12b_dw0_c32r128
0.000	0.000	0.000	0.000	0.000	0.000	392.9	12754.0	3.967	5.107	3.006	105.2	0.453	1.865	0.000	0.000	0.883	1.879	3.209	0.997	0.221	1.772		ma120301_rel_withdbg.cz12c_dw0_c32r128
qp500.L4
qp500.L4: point queries with 500 insert/s per client. Graphs for performance per 1-second interval are here.
Average throughput:
Query response time histogram: each cell has the percentage of responses that take <= the time in the header and max is the max response time in seconds. For max values in the top 25% of the range have a red background and in the bottom 25% of the range have a green background. The red background is not used when the min value is within 80% of the max value.
| dbms | 256us | 1ms | 4ms | 16ms | 64ms | 256ms | 1s | 4s | 16s | gt | max |
|---|---|---|---|---|---|---|---|---|---|---|---|
| ma120301_rel_withdbg.cz12b_c32r128 | 99.984 | 0.015 | 0.001 | 0.003 | |||||||
| ma120301_rel_withdbg.cz12c_c32r128 | 99.984 | 0.016 | nonzero | 0.003 | |||||||
| ma120301_rel_withdbg.cz12b_dw0_c32r128 | 99.981 | 0.019 | nonzero | 0.003 | |||||||
| ma120301_rel_withdbg.cz12c_dw0_c32r128 | 99.983 | 0.016 | nonzero | nonzero | 0.004 |
Insert response time histogram: each cell has the percentage of responses that take <= the time in the header and max is the max response time in seconds. For max values in the top 25% of the range have a red background and in the bottom 25% of the range have a green background. The red background is not used when the min value is within 80% of the max value.
| dbms | 256us | 1ms | 4ms | 16ms | 64ms | 256ms | 1s | 4s | 16s | gt | max |
|---|---|---|---|---|---|---|---|---|---|---|---|
| ma120301_rel_withdbg.cz12b_c32r128 | 0.684 | 98.988 | 0.328 | 0.015 | |||||||
| ma120301_rel_withdbg.cz12c_c32r128 | 0.568 | 99.190 | 0.238 | 0.004 | 0.028 | ||||||
| ma120301_rel_withdbg.cz12b_dw0_c32r128 | 0.113 | 99.594 | 0.290 | 0.003 | 0.017 | ||||||
| ma120301_rel_withdbg.cz12c_dw0_c32r128 | 0.769 | 99.183 | 0.048 | 0.007 |
Delete response time histogram: each cell has the percentage of responses that take <= the time in the header and max is the max response time in seconds. For max values in the top 25% of the range have a red background and in the bottom 25% of the range have a green background. The red background is not used when the min value is within 80% of the max value.
| dbms | 256us | 1ms | 4ms | 16ms | 64ms | 256ms | 1s | 4s | 16s | gt | max |
|---|---|---|---|---|---|---|---|---|---|---|---|
| ma120301_rel_withdbg.cz12b_c32r128 | 20.207 | 79.588 | 0.205 | nonzero | 0.022 | ||||||
| ma120301_rel_withdbg.cz12c_c32r128 | 20.681 | 79.179 | 0.138 | 0.002 | 0.028 | ||||||
| ma120301_rel_withdbg.cz12b_dw0_c32r128 | 5.409 | 94.384 | 0.205 | 0.003 | 0.018 | ||||||
| ma120301_rel_withdbg.cz12c_dw0_c32r128 | 21.804 | 78.155 | 0.042 | 0.007 |
Performance metrics for the DBMS listed above. Some are normalized by throughput, others are not. Legend for results is here.
ips	qps	rps	rmbps	wps	wmbps	rpq	rkbpq	wpi	wkbpi	csps	cpups	cspq	cpupq	dbgb1	dbgb2	rss	maxop	p50	p99	tag
5960	86635	0	0.0	432.6	15.7	0.000	0.000	0.073	2.693	504902	41.1	5.828	152	27.1	129.2	30.2	0.003	7215	7103	ma120301_rel_withdbg.cz12b_c32r128
5960	86909	0	0.0	456.2	16.9	0.000	0.000	0.077	2.908	506419	41.7	5.827	154	27.1	129.7	30.2	0.003	7263	7167	ma120301_rel_withdbg.cz12c_c32r128
5960	86954	0	0.0	384.1	11.5	0.000	0.000	0.064	1.973	506615	41.7	5.826	153	27.1	129.3	30.3	0.003	7263	7167	ma120301_rel_withdbg.cz12b_dw0_c32r128
5960	86250	0	0.0	402.4	12.6	0.000	0.000	0.068	2.164	502772	40.9	5.829	152	27.2	129.8	30.4	0.004	7231	7151	ma120301_rel_withdbg.cz12c_dw0_c32r128
Average values from iostat.
r/s	rkB/s	rrqm/s	%rrqm	r_await	rareq-s	w/s	wkB/s	wrqm/s	%wrqm	w_await	wareq-s	d/s	dkB/s	drqm/s	%drqm	d_await	dareq-s	f/s	f_await	aqu-sz	%util
0.001	0.002	0.000	0.000	0.000	0.011	432.6	16052.5	1.971	1.344	2.157	100.0	0.057	1.545	0.000	0.000	0.154	3.093	18.64	0.527	0.159	1.551		ma120301_rel_withdbg.cz12b_c32r128
0.000	0.000	0.000	0.000	0.000	0.000	456.2	17334.9	3.639	4.095	2.018	97.56	0.176	0.815	0.000	0.000	0.195	0.821	21.49	0.494	0.183	1.902		ma120301_rel_withdbg.cz12c_c32r128
0.000	0.000	0.000	0.000	0.000	0.000	384.1	11762.4	0.951	1.355	2.795	99.56	0.057	2.365	0.000	0.000	0.263	6.074	2.573	0.678	0.195	1.204		ma120301_rel_withdbg.cz12b_dw0_c32r128
0.000	0.000	0.000	0.000	0.000	0.000	402.4	12899.0	4.007	4.698	2.099	97.16	0.448	5.315	0.000	0.000	0.528	5.579	3.579	0.568	0.170	1.470		ma120301_rel_withdbg.cz12c_dw0_c32r128
qr1000.L5
qr1000.L5: range queries with 1000 insert/s per client. Graphs for performance per 1-second interval are here.
Average throughput:
Query response time histogram: each cell has the percentage of responses that take <= the time in the header and max is the max response time in seconds. For max values in the top 25% of the range have a red background and in the bottom 25% of the range have a green background. The red background is not used when the min value is within 80% of the max value.
| dbms | 256us | 1ms | 4ms | 16ms | 64ms | 256ms | 1s | 4s | 16s | gt | max |
|---|---|---|---|---|---|---|---|---|---|---|---|
| ma120301_rel_withdbg.cz12b_c32r128 | 99.961 | 0.038 | 0.001 | nonzero | nonzero | nonzero | 0.066 | ||||
| ma120301_rel_withdbg.cz12c_c32r128 | 99.960 | 0.039 | 0.001 | 0.001 | nonzero | nonzero | 0.150 | ||||
| ma120301_rel_withdbg.cz12b_dw0_c32r128 | 99.962 | 0.037 | nonzero | nonzero | nonzero | 0.046 | |||||
| ma120301_rel_withdbg.cz12c_dw0_c32r128 | 99.958 | 0.041 | 0.001 | nonzero | nonzero | 0.048 |
Insert response time histogram: each cell has the percentage of responses that take <= the time in the header and max is the max response time in seconds. For max values in the top 25% of the range have a red background and in the bottom 25% of the range have a green background. The red background is not used when the min value is within 80% of the max value.
| dbms | 256us | 1ms | 4ms | 16ms | 64ms | 256ms | 1s | 4s | 16s | gt | max |
|---|---|---|---|---|---|---|---|---|---|---|---|
| ma120301_rel_withdbg.cz12b_c32r128 | 0.750 | 98.539 | 0.696 | 0.012 | 0.003 | 0.082 | |||||
| ma120301_rel_withdbg.cz12c_c32r128 | 0.668 | 98.268 | 1.047 | 0.014 | 0.003 | 0.165 | |||||
| ma120301_rel_withdbg.cz12b_dw0_c32r128 | 0.512 | 98.284 | 1.195 | 0.009 | nonzero | 0.070 | |||||
| ma120301_rel_withdbg.cz12c_dw0_c32r128 | 0.678 | 99.002 | 0.315 | 0.003 | 0.002 | 0.076 |
Delete response time histogram: each cell has the percentage of responses that take <= the time in the header and max is the max response time in seconds. For max values in the top 25% of the range have a red background and in the bottom 25% of the range have a green background. The red background is not used when the min value is within 80% of the max value.
| dbms | 256us | 1ms | 4ms | 16ms | 64ms | 256ms | 1s | 4s | 16s | gt | max |
|---|---|---|---|---|---|---|---|---|---|---|---|
| ma120301_rel_withdbg.cz12b_c32r128 | 8.331 | 91.097 | 0.562 | 0.007 | 0.003 | 0.082 | |||||
| ma120301_rel_withdbg.cz12c_c32r128 | 9.365 | 89.859 | 0.762 | 0.012 | 0.002 | 0.157 | |||||
| ma120301_rel_withdbg.cz12b_dw0_c32r128 | 5.737 | 93.154 | 1.101 | 0.007 | 0.047 | ||||||
| ma120301_rel_withdbg.cz12c_dw0_c32r128 | 9.899 | 89.812 | 0.285 | 0.002 | 0.002 | 0.076 |
Performance metrics for the DBMS listed above. Some are normalized by throughput, others are not. Legend for results is here.
ips	qps	rps	rmbps	wps	wmbps	rpq	rkbpq	wpi	wkbpi	csps	cpups	cspq	cpupq	dbgb1	dbgb2	rss	maxop	p50	p99	tag
11927	91974	0	0.0	879.9	31.6	0.000	0.000	0.074	2.710	532257	43.7	5.787	152	27.1	129.2	30.2	0.066	7711	7583	ma120301_rel_withdbg.cz12b_c32r128
11927	92599	0	0.0	1211.3	41.5	0.000	0.000	0.102	3.563	536669	43.6	5.796	151	27.1	129.7	30.2	0.150	7743	7567	ma120301_rel_withdbg.cz12c_c32r128
11927	93108	0	0.0	777.7	23.2	0.000	0.000	0.065	1.992	538657	43.6	5.785	150	27.1	129.3	30.3	0.046	7790	7679	ma120301_rel_withdbg.cz12b_dw0_c32r128
11927	92738	0	0.0	1060.7	29.2	0.000	0.000	0.089	2.511	537351	43.5	5.794	150	27.2	129.8	30.4	0.048	7775	7663	ma120301_rel_withdbg.cz12c_dw0_c32r128
Average values from iostat.
r/s	rkB/s	rrqm/s	%rrqm	r_await	rareq-s	w/s	wkB/s	wrqm/s	%wrqm	w_await	wareq-s	d/s	dkB/s	drqm/s	%drqm	d_await	dareq-s	f/s	f_await	aqu-sz	%util
0.000	0.000	0.000	0.000	0.000	0.000	879.9	32323.9	3.316	0.747	1.632	84.84	0.086	1.918	0.000	0.000	0.218	2.719	39.72	0.511	0.327	2.993		ma120301_rel_withdbg.cz12b_c32r128
0.000	0.000	0.000	0.000	0.000	0.000	1211.3	42501.8	4.162	1.649	1.369	76.51	0.329	7.251	0.000	0.000	0.528	7.970	58.71	0.463	0.421	4.360		ma120301_rel_withdbg.cz12c_c32r128
0.000	0.000	0.000	0.000	0.000	0.000	777.7	23754.9	1.277	0.678	2.248	83.54	0.083	2.857	0.000	0.000	0.236	5.006	4.337	0.618	2.917	2.131		ma120301_rel_withdbg.cz12b_dw0_c32r128
0.000	0.000	0.000	0.000	0.000	0.000	1060.7	29948.3	4.361	1.830	2.189	73.38	0.535	6.411	0.000	0.000	0.747	7.081	7.306	0.607	0.956	2.823		ma120301_rel_withdbg.cz12c_dw0_c32r128
qp1000.L6
qp1000.L6: point queries with 1000 insert/s per client. Graphs for performance per 1-second interval are here.
Average throughput:
Query response time histogram: each cell has the percentage of responses that take <= the time in the header and max is the max response time in seconds. For max values in the top 25% of the range have a red background and in the bottom 25% of the range have a green background. The red background is not used when the min value is within 80% of the max value.
| dbms | 256us | 1ms | 4ms | 16ms | 64ms | 256ms | 1s | 4s | 16s | gt | max |
|---|---|---|---|---|---|---|---|---|---|---|---|
| ma120301_rel_withdbg.cz12b_c32r128 | 99.958 | 0.042 | nonzero | nonzero | 0.011 | ||||||
| ma120301_rel_withdbg.cz12c_c32r128 | 99.959 | 0.040 | nonzero | nonzero | 0.012 | ||||||
| ma120301_rel_withdbg.cz12b_dw0_c32r128 | 99.959 | 0.040 | nonzero | 0.004 | |||||||
| ma120301_rel_withdbg.cz12c_dw0_c32r128 | 99.957 | 0.043 | nonzero | 0.004 |
Insert response time histogram: each cell has the percentage of responses that take <= the time in the header and max is the max response time in seconds. For max values in the top 25% of the range have a red background and in the bottom 25% of the range have a green background. The red background is not used when the min value is within 80% of the max value.
| dbms | 256us | 1ms | 4ms | 16ms | 64ms | 256ms | 1s | 4s | 16s | gt | max |
|---|---|---|---|---|---|---|---|---|---|---|---|
| ma120301_rel_withdbg.cz12b_c32r128 | 0.297 | 98.967 | 0.715 | 0.019 | 0.002 | 0.187 | |||||
| ma120301_rel_withdbg.cz12c_c32r128 | 0.203 | 98.883 | 0.892 | 0.015 | 0.007 | 0.169 | |||||
| ma120301_rel_withdbg.cz12b_dw0_c32r128 | 0.104 | 99.140 | 0.751 | 0.005 | 0.001 | 0.101 | |||||
| ma120301_rel_withdbg.cz12c_dw0_c32r128 | 0.669 | 98.864 | 0.463 | 0.004 | nonzero | 0.137 |
Delete response time histogram: each cell has the percentage of responses that take <= the time in the header and max is the max response time in seconds. For max values in the top 25% of the range have a red background and in the bottom 25% of the range have a green background. The red background is not used when the min value is within 80% of the max value.
| dbms | 256us | 1ms | 4ms | 16ms | 64ms | 256ms | 1s | 4s | 16s | gt | max |
|---|---|---|---|---|---|---|---|---|---|---|---|
| ma120301_rel_withdbg.cz12b_c32r128 | 2.963 | 96.472 | 0.551 | 0.012 | 0.001 | 0.175 | |||||
| ma120301_rel_withdbg.cz12c_c32r128 | 4.671 | 94.648 | 0.669 | 0.009 | 0.003 | 0.192 | |||||
| ma120301_rel_withdbg.cz12b_dw0_c32r128 | 2.124 | 97.194 | 0.677 | 0.004 | nonzero | 0.075 | |||||
| ma120301_rel_withdbg.cz12c_dw0_c32r128 | 5.499 | 94.068 | 0.430 | 0.004 | nonzero | 0.128 |
Performance metrics for the DBMS listed above. Some are normalized by throughput, others are not. Legend for results is here.
ips	qps	rps	rmbps	wps	wmbps	rpq	rkbpq	wpi	wkbpi	csps	cpups	cspq	cpupq	dbgb1	dbgb2	rss	maxop	p50	p99	tag
11927	85680	0	0.0	889.1	31.7	0.000	0.000	0.075	2.722	501429	43.2	5.852	161	27.1	129.2	30.2	0.011	7167	7039	ma120301_rel_withdbg.cz12b_c32r128
11927	86018	0	0.0	950.9	34.8	0.000	0.000	0.080	2.984	503861	42.9	5.858	160	27.1	129.7	30.2	0.012	7231	7103	ma120301_rel_withdbg.cz12c_c32r128
11927	86035	0	0.0	784.0	23.3	0.000	0.000	0.066	2.001	503454	42.9	5.852	160	27.1	129.3	30.3	0.004	7167	7071	ma120301_rel_withdbg.cz12b_dw0_c32r128
11927	85526	0	0.0	839.7	25.8	0.000	0.000	0.070	2.217	500870	42.8	5.856	160	27.2	129.8	30.4	0.004	7167	7071	ma120301_rel_withdbg.cz12c_dw0_c32r128
Average values from iostat.
r/s	rkB/s	rrqm/s	%rrqm	r_await	rareq-s	w/s	wkB/s	wrqm/s	%wrqm	w_await	wareq-s	d/s	dkB/s	drqm/s	%drqm	d_await	dareq-s	f/s	f_await	aqu-sz	%util
0.000	0.000	0.000	0.000	0.000	0.000	889.1	32468.8	3.394	0.728	1.503	77.99	0.113	3.171	0.000	0.000	0.200	3.317	43.28	0.539	0.364	3.478		ma120301_rel_withdbg.cz12b_c32r128
0.000	0.000	0.000	0.000	0.000	0.000	950.9	35585.7	4.551	1.863	1.479	73.80	0.586	4.674	0.000	0.000	1.031	5.097	47.38	0.538	0.454	3.956		ma120301_rel_withdbg.cz12c_c32r128
0.000	0.000	0.000	0.000	0.000	0.000	784.0	23871.6	1.288	0.656	2.485	75.60	0.073	4.510	0.000	0.000	0.214	8.908	4.418	0.607	2.494	2.139		ma120301_rel_withdbg.cz12b_dw0_c32r128
0.000	0.000	0.000	0.000	0.000	0.000	839.7	26440.3	4.068	1.769	2.473	71.33	0.541	2.758	0.000	0.000	0.935	3.159	6.576	0.711	2.220	2.741		ma120301_rel_withdbg.cz12c_dw0_c32r128
l.i0
l.i0: load without secondary indexes
Performance metrics for all DBMS, not just the ones listed above. Some are normalized by throughput, others are not. Legend for results is here.
ips	qps	rps	rmbps	wps	wmbps	rpq	rkbpq	wpi	wkbpi	csps	cpups	cspq	cpupq	dbgb1	dbgb2	rss	maxop	p50	p99	tag
1016949	0	0	0.0	2371.5	215.9	0.000	0.000	0.002	0.217	150276	44.2	0.148	14	8.0	108.8	10.0	0.223	102487	90789	ma120301_rel_withdbg.cz12b_c32r128
1071428	0	0	0.0	5157.9	373.3	0.000	0.000	0.005	0.357	164714	46.5	0.154	14	8.0	109.3	8.3	0.255	110084	97688	ma120301_rel_withdbg.cz12c_c32r128
1025641	0	0	0.0	2367.8	215.9	0.000	0.000	0.002	0.216	151202	44.0	0.147	14	8.0	108.8	10.0	0.124	106086	93789	ma120301_rel_withdbg.cz12b_dw0_c32r128
1090909	0	0	0.0	5233.7	374.8	0.000	0.000	0.005	0.352	165527	46.3	0.152	14	8.0	109.3	8.4	0.090	110287	105087	ma120301_rel_withdbg.cz12c_dw0_c32r128
l.x
l.x: create secondary indexes
Performance metrics for all DBMS, not just the ones listed above. Some are normalized by throughput, others are not. Legend for results is here.
ips	qps	rps	rmbps	wps	wmbps	rpq	rkbpq	wpi	wkbpi	csps	cpups	cspq	cpupq	dbgb1	dbgb2	rss	maxop	p50	p99	tag
1818183	0	0	0.0	13561.5	1272.1	0.000	0.000	0.007	0.716	21213	31.5	0.012	6	16.9	117.7	17.8	0.002	NA	NA	ma120301_rel_withdbg.cz12b_c32r128
1818183	0	0	0.0	13497.1	1273.3	0.000	0.000	0.007	0.717	21305	31.1	0.012	5	16.9	118.2	17.9	0.001	NA	NA	ma120301_rel_withdbg.cz12c_c32r128
1791046	0	0	0.0	13345.0	1266.8	0.000	0.000	0.007	0.724	20120	31.5	0.011	6	16.9	117.7	17.5	0.002	NA	NA	ma120301_rel_withdbg.cz12b_dw0_c32r128
1818183	0	0	0.0	13521.9	1273.9	0.000	0.000	0.007	0.717	21102	31.1	0.012	5	16.9	118.2	17.9	0.002	NA	NA	ma120301_rel_withdbg.cz12c_dw0_c32r128
l.i1
l.i1: continue load after secondary indexes created with 50 inserts per transaction
Performance metrics for all DBMS, not just the ones listed above. Some are normalized by throughput, others are not. Legend for results is here.
ips	qps	rps	rmbps	wps	wmbps	rpq	rkbpq	wpi	wkbpi	csps	cpups	cspq	cpupq	dbgb1	dbgb2	rss	maxop	p50	p99	tag
161344	0	0	0.0	8545.7	285.7	0.000	0.000	0.053	1.813	123631	49.6	0.766	98	27.1	129.2	30.2	3.012	15498	150	ma120301_rel_withdbg.cz12b_c32r128
155844	0	0	0.0	8077.8	294.7	0.000	0.000	0.052	1.936	110791	46.3	0.711	95	27.1	129.7	30.2	2.735	15698	150	ma120301_rel_withdbg.cz12c_c32r128
211687	0	0	0.0	8588.8	279.2	0.000	0.000	0.041	1.351	152630	68.0	0.721	103	27.1	129.3	30.3	2.796	18048	2000	ma120301_rel_withdbg.cz12b_dw0_c32r128
215247	0	0	0.0	7997.1	301.5	0.000	0.000	0.037	1.434	134142	69.2	0.623	103	27.2	129.8	30.4	1.984	18797	2950	ma120301_rel_withdbg.cz12c_dw0_c32r128
l.i2
l.i2: continue load after secondary indexes created with 5 inserts per transaction
Performance metrics for all DBMS, not just the ones listed above. Some are normalized by throughput, others are not. Legend for results is here.
ips	qps	rps	rmbps	wps	wmbps	rpq	rkbpq	wpi	wkbpi	csps	cpups	cspq	cpupq	dbgb1	dbgb2	rss	maxop	p50	p99	tag
96579	0	0	0.0	8930.0	311.6	0.000	0.000	0.092	3.303	503597	61.4	5.214	203	27.1	129.2	30.2	0.550	9579	1405	ma120301_rel_withdbg.cz12b_c32r128
93567	0	0	0.0	8416.7	312.4	0.000	0.000	0.090	3.419	448985	57.4	4.799	196	27.1	129.7	30.2	0.310	9569	705	ma120301_rel_withdbg.cz12c_c32r128
111111	0	0	0.0	8196.7	252.7	0.000	0.000	0.074	2.328	570406	72.3	5.134	208	27.1	129.3	30.3	0.848	9834	2240	ma120301_rel_withdbg.cz12b_dw0_c32r128
112150	0	0	0.0	6981.0	258.2	0.000	0.000	0.062	2.358	520623	69.8	4.642	199	27.2	129.8	30.5	0.872	10193	1065	ma120301_rel_withdbg.cz12c_dw0_c32r128
qr100.L1
qr100.L1: range queries with 100 insert/s per client
Performance metrics for all DBMS, not just the ones listed above. Some are normalized by throughput, others are not. Legend for results is here.
ips	qps	rps	rmbps	wps	wmbps	rpq	rkbpq	wpi	wkbpi	csps	cpups	cspq	cpupq	dbgb1	dbgb2	rss	maxop	p50	p99	tag
1193	93888	0	0.0	13.9	1.4	0.000	0.000	0.012	1.229	537974	40.5	5.730	138	27.1	129.2	30.2	0.002	7903	7823	ma120301_rel_withdbg.cz12b_c32r128
1193	94446	0	0.0	18.0	1.6	0.000	0.000	0.015	1.414	541167	40.0	5.730	136	27.1	129.7	30.2	0.002	7935	7855	ma120301_rel_withdbg.cz12c_c32r128
1193	94920	0	0.0	12.6	1.3	0.000	0.000	0.011	1.098	543899	39.9	5.730	135	27.1	129.3	30.3	0.002	7967	7903	ma120301_rel_withdbg.cz12b_dw0_c32r128
1193	94658	0	0.0	16.8	1.5	0.000	0.000	0.014	1.290	542367	39.9	5.730	135	27.2	129.8	30.4	0.004	7935	7855	ma120301_rel_withdbg.cz12c_dw0_c32r128
qp100.L2
qp100.L2: point queries with 100 insert/s per client
Performance metrics for all DBMS, not just the ones listed above. Some are normalized by throughput, others are not. Legend for results is here.
ips	qps	rps	rmbps	wps	wmbps	rpq	rkbpq	wpi	wkbpi	csps	cpups	cspq	cpupq	dbgb1	dbgb2	rss	maxop	p50	p99	tag
1193	87344	0	0.0	12.3	1.3	0.000	0.000	0.010	1.077	505592	39.9	5.789	146	27.1	129.2	30.2	0.002	7295	7215	ma120301_rel_withdbg.cz12b_c32r128
1193	87724	0	0.0	16.7	1.5	0.000	0.000	0.014	1.272	507787	40.7	5.788	148	27.1	129.7	30.2	0.002	7295	7215	ma120301_rel_withdbg.cz12c_c32r128
1193	87664	0	0.0	12.5	1.3	0.000	0.000	0.010	1.098	507447	40.7	5.789	149	27.1	129.3	30.3	0.002	7311	7215	ma120301_rel_withdbg.cz12b_dw0_c32r128
1193	86896	0	0.0	16.8	1.5	0.000	0.000	0.014	1.291	502988	39.9	5.788	147	27.2	129.8	30.4	0.002	7263	7167	ma120301_rel_withdbg.cz12c_dw0_c32r128
qr500.L3
qr500.L3: range queries with 500 insert/s per client
Performance metrics for all DBMS, not just the ones listed above. Some are normalized by throughput, others are not. Legend for results is here.
ips	qps	rps	rmbps	wps	wmbps	rpq	rkbpq	wpi	wkbpi	csps	cpups	cspq	cpupq	dbgb1	dbgb2	rss	maxop	p50	p99	tag
5964	92881	0	0.0	419.7	15.5	0.000	0.000	0.070	2.657	535185	41.5	5.762	143	27.1	129.2	30.2	0.025	7759	7631	ma120301_rel_withdbg.cz12b_c32r128
5964	93611	0	0.0	440.5	16.7	0.000	0.000	0.074	2.869	538871	41.3	5.756	141	27.1	129.7	30.2	0.028	7855	7727	ma120301_rel_withdbg.cz12c_c32r128
5964	94088	0	0.0	371.2	11.3	0.000	0.000	0.062	1.938	542241	41.3	5.763	140	27.1	129.3	30.3	0.011	7887	7791	ma120301_rel_withdbg.cz12b_dw0_c32r128
5964	94030	0	0.0	392.9	12.5	0.000	0.000	0.066	2.139	541349	41.0	5.757	140	27.2	129.8	30.4	0.013	7887	7791	ma120301_rel_withdbg.cz12c_dw0_c32r128
qp500.L4
qp500.L4: point queries with 500 insert/s per client
Performance metrics for all DBMS, not just the ones listed above. Some are normalized by throughput, others are not. Legend for results is here.
ips	qps	rps	rmbps	wps	wmbps	rpq	rkbpq	wpi	wkbpi	csps	cpups	cspq	cpupq	dbgb1	dbgb2	rss	maxop	p50	p99	tag
5960	86635	0	0.0	432.6	15.7	0.000	0.000	0.073	2.693	504902	41.1	5.828	152	27.1	129.2	30.2	0.003	7215	7103	ma120301_rel_withdbg.cz12b_c32r128
5960	86909	0	0.0	456.2	16.9	0.000	0.000	0.077	2.908	506419	41.7	5.827	154	27.1	129.7	30.2	0.003	7263	7167	ma120301_rel_withdbg.cz12c_c32r128
5960	86954	0	0.0	384.1	11.5	0.000	0.000	0.064	1.973	506615	41.7	5.826	153	27.1	129.3	30.3	0.003	7263	7167	ma120301_rel_withdbg.cz12b_dw0_c32r128
5960	86250	0	0.0	402.4	12.6	0.000	0.000	0.068	2.164	502772	40.9	5.829	152	27.2	129.8	30.4	0.004	7231	7151	ma120301_rel_withdbg.cz12c_dw0_c32r128
qr1000.L5
qr1000.L5: range queries with 1000 insert/s per client
Performance metrics for all DBMS, not just the ones listed above. Some are normalized by throughput, others are not. Legend for results is here.
ips	qps	rps	rmbps	wps	wmbps	rpq	rkbpq	wpi	wkbpi	csps	cpups	cspq	cpupq	dbgb1	dbgb2	rss	maxop	p50	p99	tag
11927	91974	0	0.0	879.9	31.6	0.000	0.000	0.074	2.710	532257	43.7	5.787	152	27.1	129.2	30.2	0.066	7711	7583	ma120301_rel_withdbg.cz12b_c32r128
11927	92599	0	0.0	1211.3	41.5	0.000	0.000	0.102	3.563	536669	43.6	5.796	151	27.1	129.7	30.2	0.150	7743	7567	ma120301_rel_withdbg.cz12c_c32r128
11927	93108	0	0.0	777.7	23.2	0.000	0.000	0.065	1.992	538657	43.6	5.785	150	27.1	129.3	30.3	0.046	7790	7679	ma120301_rel_withdbg.cz12b_dw0_c32r128
11927	92738	0	0.0	1060.7	29.2	0.000	0.000	0.089	2.511	537351	43.5	5.794	150	27.2	129.8	30.4	0.048	7775	7663	ma120301_rel_withdbg.cz12c_dw0_c32r128
qp1000.L6
qp1000.L6: point queries with 1000 insert/s per client
Performance metrics for all DBMS, not just the ones listed above. Some are normalized by throughput, others are not. Legend for results is here.
ips	qps	rps	rmbps	wps	wmbps	rpq	rkbpq	wpi	wkbpi	csps	cpups	cspq	cpupq	dbgb1	dbgb2	rss	maxop	p50	p99	tag
11927	85680	0	0.0	889.1	31.7	0.000	0.000	0.075	2.722	501429	43.2	5.852	161	27.1	129.2	30.2	0.011	7167	7039	ma120301_rel_withdbg.cz12b_c32r128
11927	86018	0	0.0	950.9	34.8	0.000	0.000	0.080	2.984	503861	42.9	5.858	160	27.1	129.7	30.2	0.012	7231	7103	ma120301_rel_withdbg.cz12c_c32r128
11927	86035	0	0.0	784.0	23.3	0.000	0.000	0.066	2.001	503454	42.9	5.852	160	27.1	129.3	30.3	0.004	7167	7071	ma120301_rel_withdbg.cz12b_dw0_c32r128
11927	85526	0	0.0	839.7	25.8	0.000	0.000	0.070	2.217	500870	42.8	5.856	160	27.2	129.8	30.4	0.004	7167	7071	ma120301_rel_withdbg.cz12c_dw0_c32r128
l.i0
- l.i0: load without secondary indexes
- Legend for results is here.
- Each entry lists the percentage of responses that fit in that bucket (slower than max time for previous bucket, faster than min time for next bucket).
Insert response time histogram
256us	1ms	4ms	16ms	64ms	256ms	1s	4s	16s	gt	max	tag
0.000	96.227	3.691	0.028	0.005	0.049	0.000	0.000	0.000	0.000	0.223	ma120301_rel_withdbg.cz12b_c32r128
0.000	96.936	2.985	0.068	0.006	0.003	0.000	0.000	0.000	0.000	0.255	ma120301_rel_withdbg.cz12c_c32r128
0.000	96.246	3.671	0.030	0.005	0.048	0.000	0.000	0.000	0.000	0.124	ma120301_rel_withdbg.cz12b_dw0_c32r128
0.000	97.457	2.468	0.064	0.010	0.001	0.000	0.000	0.000	0.000	0.090	ma120301_rel_withdbg.cz12c_dw0_c32r128
l.x
- l.x: create secondary indexes
- Legend for results is here.
- Each entry lists the percentage of responses that fit in that bucket (slower than max time for previous bucket, faster than min time for next bucket).
TODO - determine whether there is data for create index response time
l.i1
- l.i1: continue load after secondary indexes created with 50 inserts per transaction
- Legend for results is here.
- Each entry lists the percentage of responses that fit in that bucket (slower than max time for previous bucket, faster than min time for next bucket).
Insert response time histogram
256us	1ms	4ms	16ms	64ms	256ms	1s	4s	16s	gt	max	tag
0.000	0.056	95.439	2.415	1.451	0.473	0.166	0.001	0.000	0.000	3.012	ma120301_rel_withdbg.cz12b_c32r128
0.000	0.339	95.041	2.391	1.485	0.530	0.213	0.001	0.000	0.000	2.735	ma120301_rel_withdbg.cz12c_c32r128
0.000	0.004	96.038	2.832	0.994	0.114	0.016	0.002	0.000	0.000	2.796	ma120301_rel_withdbg.cz12b_dw0_c32r128
0.000	0.015	96.830	2.151	0.862	0.109	0.033	nonzero	0.000	0.000	1.984	ma120301_rel_withdbg.cz12c_dw0_c32r128
Delete response time histogram
256us	1ms	4ms	16ms	64ms	256ms	1s	4s	16s	gt	max	tag
0.000	1.595	94.238	2.148	1.404	0.459	0.155	0.001	0.000	0.000	3.012	ma120301_rel_withdbg.cz12b_c32r128
0.000	2.464	93.286	2.106	1.428	0.521	0.194	0.001	0.000	0.000	3.079	ma120301_rel_withdbg.cz12c_c32r128
0.000	0.141	96.155	2.601	0.972	0.113	0.015	0.002	0.000	0.000	2.798	ma120301_rel_withdbg.cz12b_dw0_c32r128
0.000	0.102	96.925	1.960	0.870	0.110	0.033	nonzero	0.000	0.000	1.984	ma120301_rel_withdbg.cz12c_dw0_c32r128
l.i2
- l.i2: continue load after secondary indexes created with 5 inserts per transaction
- Legend for results is here.
- Each entry lists the percentage of responses that fit in that bucket (slower than max time for previous bucket, faster than min time for next bucket).
Insert response time histogram
256us	1ms	4ms	16ms	64ms	256ms	1s	4s	16s	gt	max	tag
6.734	91.345	1.298	0.248	0.354	0.020	0.001	0.000	0.000	0.000	0.550	ma120301_rel_withdbg.cz12b_c32r128
12.694	85.103	1.519	0.236	0.422	0.025	nonzero	0.000	0.000	0.000	0.310	ma120301_rel_withdbg.cz12c_c32r128
1.603	96.896	1.341	0.070	0.082	0.006	0.002	0.000	0.000	0.000	0.848	ma120301_rel_withdbg.cz12b_dw0_c32r128
3.165	95.300	1.333	0.059	0.138	0.005	nonzero	0.000	0.000	0.000	0.872	ma120301_rel_withdbg.cz12c_dw0_c32r128
Delete response time histogram
256us	1ms	4ms	16ms	64ms	256ms	1s	4s	16s	gt	max	tag
6.481	91.627	1.291	0.233	0.350	0.017	0.001	0.000	0.000	0.000	0.550	ma120301_rel_withdbg.cz12b_c32r128
12.388	85.407	1.546	0.223	0.416	0.020	nonzero	0.000	0.000	0.000	0.312	ma120301_rel_withdbg.cz12c_c32r128
1.502	96.993	1.350	0.066	0.081	0.006	0.002	0.000	0.000	0.000	0.849	ma120301_rel_withdbg.cz12b_dw0_c32r128
3.063	95.388	1.351	0.056	0.137	0.005	nonzero	0.000	0.000	0.000	0.872	ma120301_rel_withdbg.cz12c_dw0_c32r128
qr100.L1
- qr100.L1: range queries with 100 insert/s per client
- Legend for results is here.
- Each entry lists the percentage of responses that fit in that bucket (slower than max time for previous bucket, faster than min time for next bucket).
Query response time histogram
256us	1ms	4ms	16ms	64ms	256ms	1s	4s	16s	gt	max	tag
99.992	0.008	nonzero	0.000	0.000	0.000	0.000	0.000	0.000	0.000	0.002	ma120301_rel_withdbg.cz12b_c32r128
99.993	0.007	nonzero	0.000	0.000	0.000	0.000	0.000	0.000	0.000	0.002	ma120301_rel_withdbg.cz12c_c32r128
99.993	0.007	nonzero	0.000	0.000	0.000	0.000	0.000	0.000	0.000	0.002	ma120301_rel_withdbg.cz12b_dw0_c32r128
99.992	0.008	nonzero	0.000	0.000	0.000	0.000	0.000	0.000	0.000	0.004	ma120301_rel_withdbg.cz12c_dw0_c32r128
Insert response time histogram
256us	1ms	4ms	16ms	64ms	256ms	1s	4s	16s	gt	max	tag
0.000	1.403	98.273	0.324	0.000	0.000	0.000	0.000	0.000	0.000	0.012	ma120301_rel_withdbg.cz12b_c32r128
0.000	2.148	97.852	0.000	0.000	0.000	0.000	0.000	0.000	0.000	0.002	ma120301_rel_withdbg.cz12c_c32r128
0.000	1.549	98.113	0.338	0.000	0.000	0.000	0.000	0.000	0.000	0.014	ma120301_rel_withdbg.cz12b_dw0_c32r128
0.000	2.387	97.613	0.000	0.000	0.000	0.000	0.000	0.000	0.000	0.002	ma120301_rel_withdbg.cz12c_dw0_c32r128
Delete response time histogram
256us	1ms	4ms	16ms	64ms	256ms	1s	4s	16s	gt	max	tag
0.000	32.218	67.553	0.229	0.000	0.000	0.000	0.000	0.000	0.000	0.012	ma120301_rel_withdbg.cz12b_c32r128
0.000	41.382	58.618	0.000	0.000	0.000	0.000	0.000	0.000	0.000	0.002	ma120301_rel_withdbg.cz12c_c32r128
0.000	39.678	60.104	0.218	0.000	0.000	0.000	0.000	0.000	0.000	0.013	ma120301_rel_withdbg.cz12b_dw0_c32r128
0.000	41.532	58.468	0.000	0.000	0.000	0.000	0.000	0.000	0.000	0.002	ma120301_rel_withdbg.cz12c_dw0_c32r128
qp100.L2
- qp100.L2: point queries with 100 insert/s per client
- Legend for results is here.
- Each entry lists the percentage of responses that fit in that bucket (slower than max time for previous bucket, faster than min time for next bucket).
Query response time histogram
256us	1ms	4ms	16ms	64ms	256ms	1s	4s	16s	gt	max	tag
99.993	0.007	nonzero	0.000	0.000	0.000	0.000	0.000	0.000	0.000	0.002	ma120301_rel_withdbg.cz12b_c32r128
99.993	0.007	nonzero	0.000	0.000	0.000	0.000	0.000	0.000	0.000	0.002	ma120301_rel_withdbg.cz12c_c32r128
99.992	0.008	nonzero	0.000	0.000	0.000	0.000	0.000	0.000	0.000	0.002	ma120301_rel_withdbg.cz12b_dw0_c32r128
99.992	0.008	nonzero	0.000	0.000	0.000	0.000	0.000	0.000	0.000	0.002	ma120301_rel_withdbg.cz12c_dw0_c32r128
Insert response time histogram
256us	1ms	4ms	16ms	64ms	256ms	1s	4s	16s	gt	max	tag
0.000	0.729	98.958	0.312	0.000	0.000	0.000	0.000	0.000	0.000	0.011	ma120301_rel_withdbg.cz12b_c32r128
0.000	0.755	99.245	0.000	0.000	0.000	0.000	0.000	0.000	0.000	0.002	ma120301_rel_withdbg.cz12c_c32r128
0.000	0.361	98.907	0.718	0.014	0.000	0.000	0.000	0.000	0.000	0.028	ma120301_rel_withdbg.cz12b_dw0_c32r128
0.000	1.167	98.833	0.000	0.000	0.000	0.000	0.000	0.000	0.000	0.003	ma120301_rel_withdbg.cz12c_dw0_c32r128
Delete response time histogram
256us	1ms	4ms	16ms	64ms	256ms	1s	4s	16s	gt	max	tag
0.000	39.854	59.988	0.157	0.000	0.000	0.000	0.000	0.000	0.000	0.011	ma120301_rel_withdbg.cz12b_c32r128
0.000	41.375	58.625	0.000	0.000	0.000	0.000	0.000	0.000	0.000	0.002	ma120301_rel_withdbg.cz12c_c32r128
0.000	28.581	70.931	0.477	0.012	0.000	0.000	0.000	0.000	0.000	0.028	ma120301_rel_withdbg.cz12b_dw0_c32r128
0.000	35.593	64.407	0.000	0.000	0.000	0.000	0.000	0.000	0.000	0.002	ma120301_rel_withdbg.cz12c_dw0_c32r128
qr500.L3
- qr500.L3: range queries with 500 insert/s per client
- Legend for results is here.
- Each entry lists the percentage of responses that fit in that bucket (slower than max time for previous bucket, faster than min time for next bucket).
Query response time histogram
256us	1ms	4ms	16ms	64ms	256ms	1s	4s	16s	gt	max	tag
99.983	0.016	0.001	nonzero	nonzero	0.000	0.000	0.000	0.000	0.000	0.025	ma120301_rel_withdbg.cz12b_c32r128
99.981	0.018	0.001	nonzero	nonzero	0.000	0.000	0.000	0.000	0.000	0.028	ma120301_rel_withdbg.cz12c_c32r128
99.984	0.015	nonzero	nonzero	0.000	0.000	0.000	0.000	0.000	0.000	0.011	ma120301_rel_withdbg.cz12b_dw0_c32r128
99.981	0.019	0.001	nonzero	0.000	0.000	0.000	0.000	0.000	0.000	0.013	ma120301_rel_withdbg.cz12c_dw0_c32r128
Insert response time histogram
256us	1ms	4ms	16ms	64ms	256ms	1s	4s	16s	gt	max	tag
0.000	1.747	97.940	0.307	0.006	0.000	0.000	0.000	0.000	0.000	0.026	ma120301_rel_withdbg.cz12b_c32r128
0.000	0.872	98.891	0.229	0.008	0.000	0.000	0.000	0.000	0.000	0.029	ma120301_rel_withdbg.cz12c_c32r128
0.000	1.962	97.779	0.258	0.001	0.000	0.000	0.000	0.000	0.000	0.019	ma120301_rel_withdbg.cz12b_dw0_c32r128
0.000	0.968	98.890	0.131	0.012	0.000	0.000	0.000	0.000	0.000	0.057	ma120301_rel_withdbg.cz12c_dw0_c32r128
Delete response time histogram
256us	1ms	4ms	16ms	64ms	256ms	1s	4s	16s	gt	max	tag
0.000	30.445	69.355	0.197	0.003	0.000	0.000	0.000	0.000	0.000	0.026	ma120301_rel_withdbg.cz12b_c32r128
0.000	15.254	84.581	0.161	0.005	0.000	0.000	0.000	0.000	0.000	0.029	ma120301_rel_withdbg.cz12c_c32r128
0.000	32.235	67.573	0.191	0.001	0.000	0.000	0.000	0.000	0.000	0.016	ma120301_rel_withdbg.cz12b_dw0_c32r128
0.000	16.926	82.960	0.102	0.012	0.000	0.000	0.000	0.000	0.000	0.057	ma120301_rel_withdbg.cz12c_dw0_c32r128
qp500.L4
- qp500.L4: point queries with 500 insert/s per client
- Legend for results is here.
- Each entry lists the percentage of responses that fit in that bucket (slower than max time for previous bucket, faster than min time for next bucket).
Query response time histogram
256us	1ms	4ms	16ms	64ms	256ms	1s	4s	16s	gt	max	tag
99.984	0.015	0.001	0.000	0.000	0.000	0.000	0.000	0.000	0.000	0.003	ma120301_rel_withdbg.cz12b_c32r128
99.984	0.016	nonzero	0.000	0.000	0.000	0.000	0.000	0.000	0.000	0.003	ma120301_rel_withdbg.cz12c_c32r128
99.981	0.019	nonzero	0.000	0.000	0.000	0.000	0.000	0.000	0.000	0.003	ma120301_rel_withdbg.cz12b_dw0_c32r128
99.983	0.016	nonzero	nonzero	0.000	0.000	0.000	0.000	0.000	0.000	0.004	ma120301_rel_withdbg.cz12c_dw0_c32r128
Insert response time histogram
256us	1ms	4ms	16ms	64ms	256ms	1s	4s	16s	gt	max	tag
0.000	0.684	98.988	0.328	0.000	0.000	0.000	0.000	0.000	0.000	0.015	ma120301_rel_withdbg.cz12b_c32r128
0.000	0.568	99.190	0.238	0.004	0.000	0.000	0.000	0.000	0.000	0.028	ma120301_rel_withdbg.cz12c_c32r128
0.000	0.113	99.594	0.290	0.003	0.000	0.000	0.000	0.000	0.000	0.017	ma120301_rel_withdbg.cz12b_dw0_c32r128
0.000	0.769	99.183	0.048	0.000	0.000	0.000	0.000	0.000	0.000	0.007	ma120301_rel_withdbg.cz12c_dw0_c32r128
Delete response time histogram
256us	1ms	4ms	16ms	64ms	256ms	1s	4s	16s	gt	max	tag
0.000	20.207	79.588	0.205	nonzero	0.000	0.000	0.000	0.000	0.000	0.022	ma120301_rel_withdbg.cz12b_c32r128
0.000	20.681	79.179	0.138	0.002	0.000	0.000	0.000	0.000	0.000	0.028	ma120301_rel_withdbg.cz12c_c32r128
0.000	5.409	94.384	0.205	0.003	0.000	0.000	0.000	0.000	0.000	0.018	ma120301_rel_withdbg.cz12b_dw0_c32r128
0.000	21.804	78.155	0.042	0.000	0.000	0.000	0.000	0.000	0.000	0.007	ma120301_rel_withdbg.cz12c_dw0_c32r128
qr1000.L5
- qr1000.L5: range queries with 1000 insert/s per client
- Legend for results is here.
- Each entry lists the percentage of responses that fit in that bucket (slower than max time for previous bucket, faster than min time for next bucket).
Query response time histogram
256us	1ms	4ms	16ms	64ms	256ms	1s	4s	16s	gt	max	tag
99.961	0.038	0.001	nonzero	nonzero	nonzero	0.000	0.000	0.000	0.000	0.066	ma120301_rel_withdbg.cz12b_c32r128
99.960	0.039	0.001	0.001	nonzero	nonzero	0.000	0.000	0.000	0.000	0.150	ma120301_rel_withdbg.cz12c_c32r128
99.962	0.037	nonzero	nonzero	nonzero	0.000	0.000	0.000	0.000	0.000	0.046	ma120301_rel_withdbg.cz12b_dw0_c32r128
99.958	0.041	0.001	nonzero	nonzero	0.000	0.000	0.000	0.000	0.000	0.048	ma120301_rel_withdbg.cz12c_dw0_c32r128
Insert response time histogram
256us	1ms	4ms	16ms	64ms	256ms	1s	4s	16s	gt	max	tag
0.000	0.750	98.539	0.696	0.012	0.003	0.000	0.000	0.000	0.000	0.082	ma120301_rel_withdbg.cz12b_c32r128
0.000	0.668	98.268	1.047	0.014	0.003	0.000	0.000	0.000	0.000	0.165	ma120301_rel_withdbg.cz12c_c32r128
0.000	0.512	98.284	1.195	0.009	nonzero	0.000	0.000	0.000	0.000	0.070	ma120301_rel_withdbg.cz12b_dw0_c32r128
0.000	0.678	99.002	0.315	0.003	0.002	0.000	0.000	0.000	0.000	0.076	ma120301_rel_withdbg.cz12c_dw0_c32r128
Delete response time histogram
256us	1ms	4ms	16ms	64ms	256ms	1s	4s	16s	gt	max	tag
0.000	8.331	91.097	0.562	0.007	0.003	0.000	0.000	0.000	0.000	0.082	ma120301_rel_withdbg.cz12b_c32r128
0.000	9.365	89.859	0.762	0.012	0.002	0.000	0.000	0.000	0.000	0.157	ma120301_rel_withdbg.cz12c_c32r128
0.000	5.737	93.154	1.101	0.007	0.000	0.000	0.000	0.000	0.000	0.047	ma120301_rel_withdbg.cz12b_dw0_c32r128
0.000	9.899	89.812	0.285	0.002	0.002	0.000	0.000	0.000	0.000	0.076	ma120301_rel_withdbg.cz12c_dw0_c32r128
qp1000.L6
- qp1000.L6: point queries with 1000 insert/s per client
- Legend for results is here.
- Each entry lists the percentage of responses that fit in that bucket (slower than max time for previous bucket, faster than min time for next bucket).
Query response time histogram
256us	1ms	4ms	16ms	64ms	256ms	1s	4s	16s	gt	max	tag
99.958	0.042	nonzero	nonzero	0.000	0.000	0.000	0.000	0.000	0.000	0.011	ma120301_rel_withdbg.cz12b_c32r128
99.959	0.040	nonzero	nonzero	0.000	0.000	0.000	0.000	0.000	0.000	0.012	ma120301_rel_withdbg.cz12c_c32r128
99.959	0.040	nonzero	0.000	0.000	0.000	0.000	0.000	0.000	0.000	0.004	ma120301_rel_withdbg.cz12b_dw0_c32r128
99.957	0.043	nonzero	0.000	0.000	0.000	0.000	0.000	0.000	0.000	0.004	ma120301_rel_withdbg.cz12c_dw0_c32r128
Insert response time histogram
256us	1ms	4ms	16ms	64ms	256ms	1s	4s	16s	gt	max	tag
0.000	0.297	98.967	0.715	0.019	0.002	0.000	0.000	0.000	0.000	0.187	ma120301_rel_withdbg.cz12b_c32r128
0.000	0.203	98.883	0.892	0.015	0.007	0.000	0.000	0.000	0.000	0.169	ma120301_rel_withdbg.cz12c_c32r128
0.000	0.104	99.140	0.751	0.005	0.001	0.000	0.000	0.000	0.000	0.101	ma120301_rel_withdbg.cz12b_dw0_c32r128
0.000	0.669	98.864	0.463	0.004	nonzero	0.000	0.000	0.000	0.000	0.137	ma120301_rel_withdbg.cz12c_dw0_c32r128
Delete response time histogram
256us	1ms	4ms	16ms	64ms	256ms	1s	4s	16s	gt	max	tag
0.000	2.963	96.472	0.551	0.012	0.001	0.000	0.000	0.000	0.000	0.175	ma120301_rel_withdbg.cz12b_c32r128
0.000	4.671	94.648	0.669	0.009	0.003	0.000	0.000	0.000	0.000	0.192	ma120301_rel_withdbg.cz12c_c32r128
0.000	2.124	97.194	0.677	0.004	nonzero	0.000	0.000	0.000	0.000	0.075	ma120301_rel_withdbg.cz12b_dw0_c32r128
0.000	5.499	94.068	0.430	0.004	nonzero	0.000	0.000	0.000	0.000	0.128	ma120301_rel_withdbg.cz12c_dw0_c32r128