Introduction
This is a report for the insert benchmark with 4000M docs and 20 client(s). It is generated by scripts (bash, awk, sed) and Tufte might not be impressed. An overview of the insert benchmark is here and a short update is here. Below, by DBMS, I mean DBMS+version.config. An example is my8020.c10b40 where my means MySQL, 8020 is version 8.0.20 and c10b40 is the name for the configuration file.
The test server has 48 cores, 128G RAM and 2 NVMe devices using SW RAID. The benchmark was run with 20 clients and there were 1 or 3 connections per client (1 for queries or inserts without rate limits, 1+1 for rate limited inserts+deletes). It uses 20 tables with a table per client. It loads 200M rows per table without secondary indexes, creates 3 secondary indexes per table, then inserts 4m+1m rows per table with a delete per insert to avoid growing the table. It then does 6 read+write tests for 3600s each that do queries as fast as possible with 100,100,500,500,1000,1000 inserts/s and the same for deletes/s per client concurrent with the queries. The database is larger than RAM and most tests are IO-bound except for the range query (qr*) tests that frequently have a cached working set. Clients and the DBMS share one server.
The tested DBMS are:
- ma120301_rel_withdbg.cz12b_sync_c32r128 - MariaDB 12.3.1 with the cz12b_sync_c32r128 config that is like cz12b_c32r128 but enables sync on commit for the binlog and InnoDB
- ma120301_rel_withdbg.cz12c_sync_c32r128 - MariaDB 12.3.1 with the cz12c_sync_c32r128 config that is like cz12c_c32r128 but enables sync on commit for InnoDB
- ma120301_rel_withdbg.cz12b_sync_dw0_c32r128 - MariaDB 12.3.1 with the cz12b_sync_dw0_c32r128 config that is like cz12b_sync_c32r128 and adds innodb_doublewrite=off
- ma120301_rel_withdbg.cz12c_sync_dw0_c32r128 - MariaDB 12.3.1 with the cz12c_sync_dw0_c32r128 config that is like cz12c_sync_c32r128 and adds innodb_doublewrite=off
Contents
- Summary
- l.i0: load without secondary indexes
- l.x: create secondary indexes
- l.i1: continue load after secondary indexes created with 50 inserts per transaction
- l.i2: continue load after secondary indexes created with 5 inserts per transaction
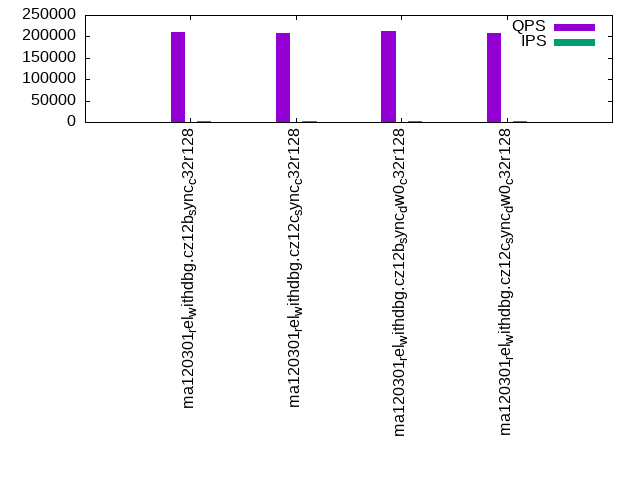
- qr100.L1: range queries with 100 insert/s per client
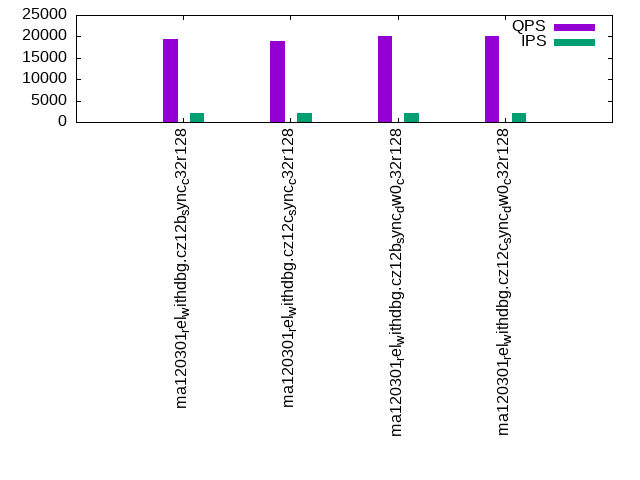
- qp100.L2: point queries with 100 insert/s per client
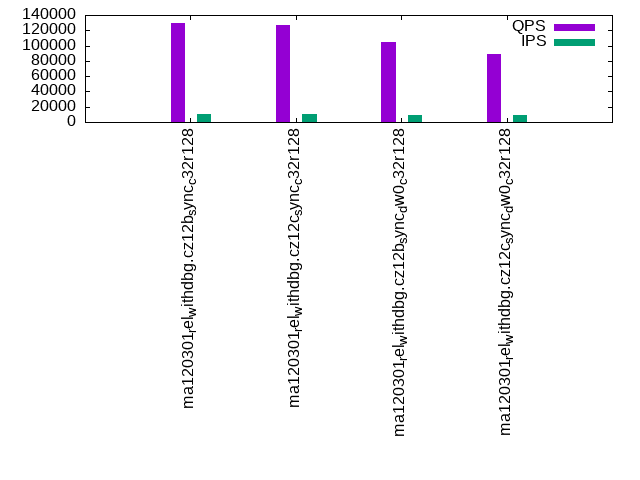
- qr500.L3: range queries with 500 insert/s per client
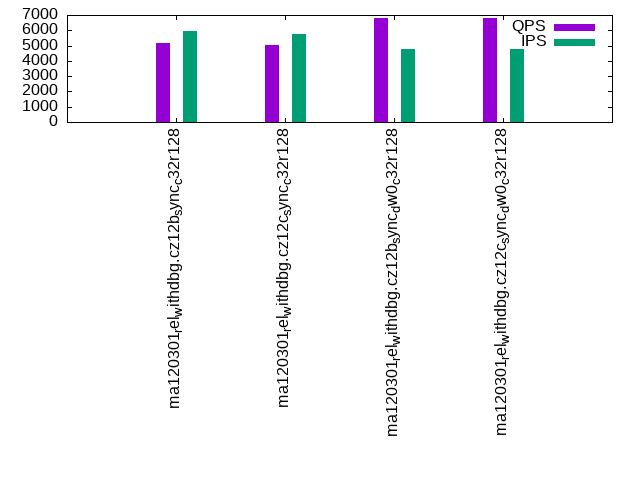
- qp500.L4: point queries with 500 insert/s per client
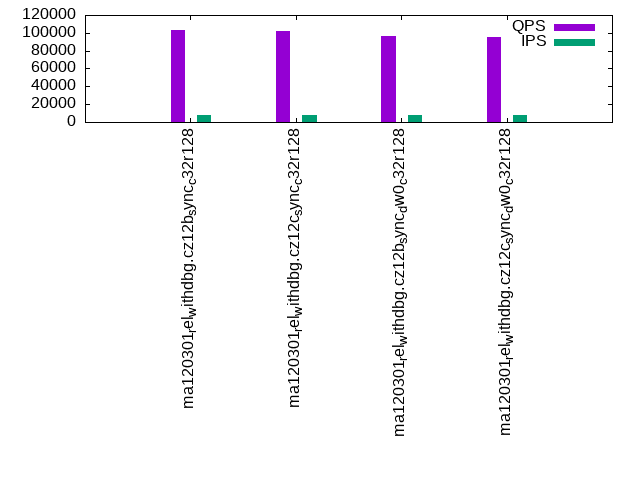
- qr1000.L5: range queries with 1000 insert/s per client
- qp1000.L6: point queries with 1000 insert/s per client
Summary
The numbers are inserts/s for l.i0, l.i1 and l.i2, indexed docs (or rows) /s for l.x and queries/s for qr100, qp100 thru qr1000, qp1000" The values are the average rate over the entire test for inserts (IPS) and queries (QPS). The range of values for IPS and QPS is split into 3 parts: bottom 25%, middle 50%, top 25%. Values in the bottom 25% have a red background, values in the top 25% have a green background and values in the middle have no color. A gray background is used for values that can be ignored because the DBMS did not sustain the target insert rate. Red backgrounds are not used when the minimum value is within 80% of the max value.
| dbms | l.i0 | l.x | l.i1 | l.i2 | qr100 | qp100 | qr500 | qp500 | qr1000 | qp1000 |
|---|---|---|---|---|---|---|---|---|---|---|
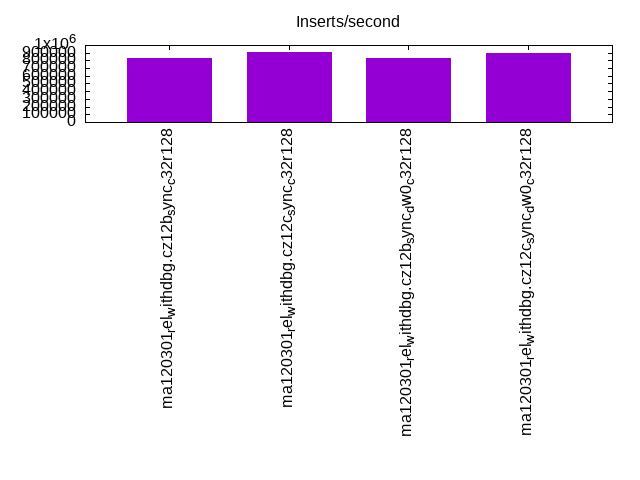
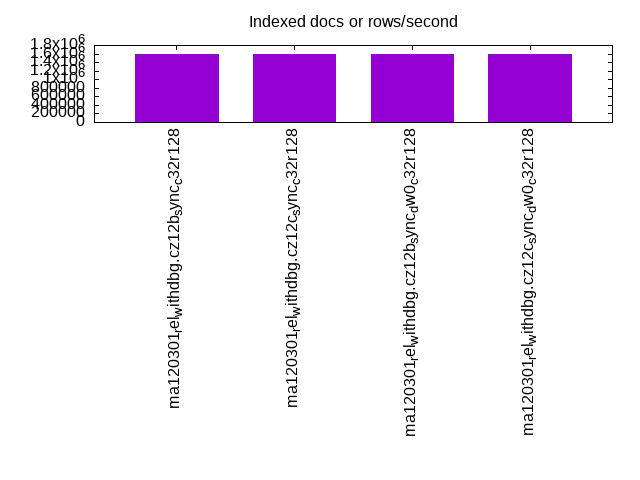
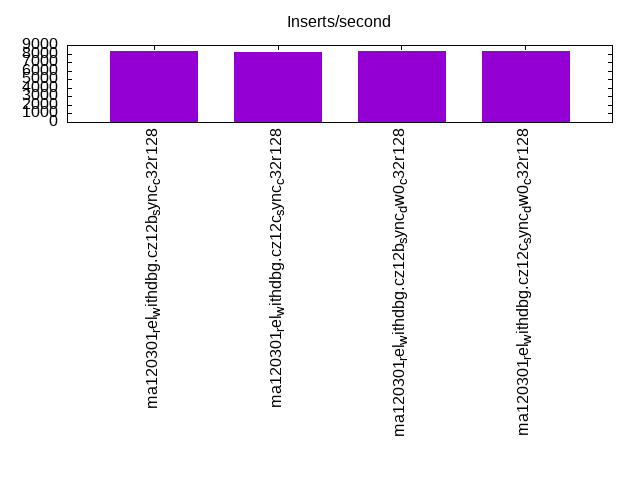
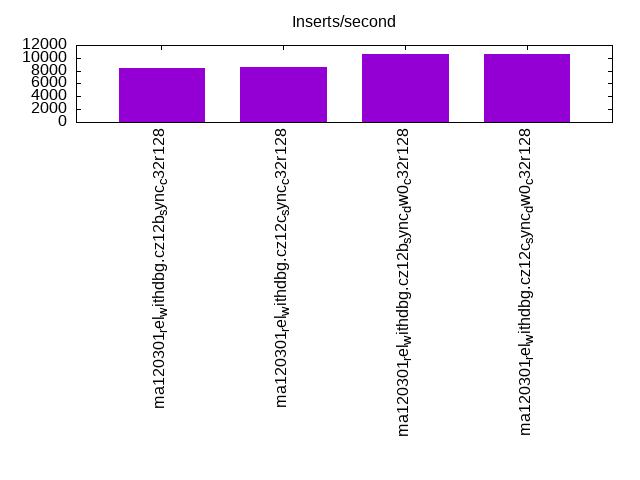
| ma120301_rel_withdbg.cz12b_sync_c32r128 | 829359 | 1581653 | 8284 | 8432 | 209134 | 19298 | 130110 | 5179 | 102737 | 7583 |
| ma120301_rel_withdbg.cz12c_sync_c32r128 | 904977 | 1590457 | 8189 | 8522 | 207878 | 19019 | 126355 | 5046 | 102508 | 7395 |
| ma120301_rel_withdbg.cz12b_sync_dw0_c32r128 | 836645 | 1600640 | 8327 | 10548 | 212192 | 20015 | 104454 | 6804 | 96242 | 6848 |
| ma120301_rel_withdbg.cz12c_sync_dw0_c32r128 | 898674 | 1601281 | 8267 | 10650 | 207584 | 20018 | 88536 | 6808 | 95841 | 6849 |
This table has relative throughput, throughput for the DBMS relative to the DBMS in the first line, using the absolute throughput from the previous table. Values less than 0.95 have a yellow background. Values greater than 1.05 have a blue background.
| dbms | l.i0 | l.x | l.i1 | l.i2 | qr100 | qp100 | qr500 | qp500 | qr1000 | qp1000 |
|---|---|---|---|---|---|---|---|---|---|---|
| ma120301_rel_withdbg.cz12b_sync_c32r128 | 1.00 | 1.00 | 1.00 | 1.00 | 1.00 | 1.00 | 1.00 | 1.00 | 1.00 | 1.00 |
| ma120301_rel_withdbg.cz12c_sync_c32r128 | 1.09 | 1.01 | 0.99 | 1.01 | 0.99 | 0.99 | 0.97 | 0.97 | 1.00 | 0.98 |
| ma120301_rel_withdbg.cz12b_sync_dw0_c32r128 | 1.01 | 1.01 | 1.01 | 1.25 | 1.01 | 1.04 | 0.80 | 1.31 | 0.94 | 0.90 |
| ma120301_rel_withdbg.cz12c_sync_dw0_c32r128 | 1.08 | 1.01 | 1.00 | 1.26 | 0.99 | 1.04 | 0.68 | 1.31 | 0.93 | 0.90 |
This lists the average rate of inserts/s for the tests that do inserts concurrent with queries. For such tests the query rate is listed in the table above. The read+write tests are setup so that the insert rate should match the target rate every second. Cells that are not at least 95% of the target have a red background to indicate a failure to satisfy the target.
| dbms | qr100.L1 | qp100.L2 | qr500.L3 | qp500.L4 | qr1000.L5 | qp1000.L6 |
|---|---|---|---|---|---|---|
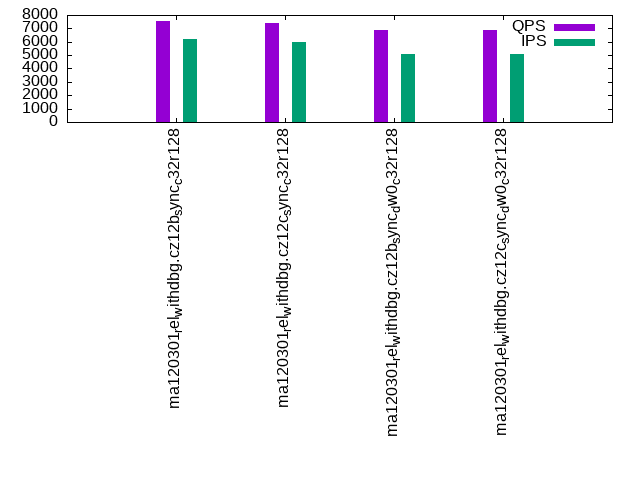
| ma120301_rel_withdbg.cz12b_sync_c32r128 | 1987 | 1987 | 9936 | 5922 | 7652 | 6189 |
| ma120301_rel_withdbg.cz12c_sync_c32r128 | 1987 | 1987 | 9934 | 5743 | 7481 | 6018 |
| ma120301_rel_withdbg.cz12b_sync_dw0_c32r128 | 1987 | 1987 | 9481 | 4768 | 7882 | 5094 |
| ma120301_rel_withdbg.cz12c_sync_dw0_c32r128 | 1987 | 1987 | 8539 | 4743 | 7893 | 5103 |
| target | 2000 | 2000 | 10000 | 10000 | 20000 | 20000 |
l.i0
l.i0: load without secondary indexes. Graphs for performance per 1-second interval are here.
Average throughput:
Insert response time histogram: each cell has the percentage of responses that take <= the time in the header and max is the max response time in seconds. For the max column values in the top 25% of the range have a red background and in the bottom 25% of the range have a green background. The red background is not used when the min value is within 80% of the max value.
| dbms | 256us | 1ms | 4ms | 16ms | 64ms | 256ms | 1s | 4s | 16s | gt | max |
|---|---|---|---|---|---|---|---|---|---|---|---|
| ma120301_rel_withdbg.cz12b_sync_c32r128 | 0.115 | 98.854 | 0.952 | 0.022 | 0.057 | nonzero | 0.410 | ||||
| ma120301_rel_withdbg.cz12c_sync_c32r128 | 6.819 | 91.926 | 1.032 | 0.221 | 0.002 | 0.144 | |||||
| ma120301_rel_withdbg.cz12b_sync_dw0_c32r128 | 0.101 | 99.073 | 0.747 | 0.014 | 0.063 | 0.002 | 0.318 | ||||
| ma120301_rel_withdbg.cz12c_sync_dw0_c32r128 | 6.444 | 92.223 | 1.156 | 0.176 | 0.001 | 0.097 |
Performance metrics for the DBMS listed above. Some are normalized by throughput, others are not. Legend for results is here.
ips	qps	rps	rmbps	wps	wmbps	rpq	rkbpq	wpi	wkbpi	csps	cpups	cspq	cpupq	dbgb1	dbgb2	rss	maxop	p50	p99	tag
829359	0	3	0.0	44219.6	353.8	0.000	0.000	0.053	0.437	573464	34.8	0.691	20	263.2	364.0	101.2	0.410	36361	24574	ma120301_rel_withdbg.cz12b_sync_c32r128
904977	0	5	0.2	12565.6	362.5	0.000	0.000	0.014	0.410	639005	43.8	0.706	23	263.2	364.5	100.2	0.144	35162	27770	ma120301_rel_withdbg.cz12c_sync_c32r128
836645	0	3	0.0	44014.8	353.4	0.000	0.000	0.053	0.433	543751	34.5	0.650	20	263.2	364.0	101.0	0.318	36860	24474	ma120301_rel_withdbg.cz12b_sync_dw0_c32r128
898674	0	4	0.0	12464.0	358.2	0.000	0.000	0.014	0.408	649757	44.0	0.723	24	263.2	364.5	100.2	0.097	34276	27770	ma120301_rel_withdbg.cz12c_sync_dw0_c32r128
Average values from iostat.
r/s	rkB/s	rrqm/s	%rrqm	r_await	rareq-s	w/s	wkB/s	wrqm/s	%wrqm	w_await	wareq-s	d/s	dkB/s	drqm/s	%drqm	d_await	dareq-s	f/s	f_await	aqu-sz	%util
3.199	38.06	0.000	0.000	0.116	7.664	44219.6	362275	0.000	0.000	0.051	8.268	0.000	0.000	0.000	0.000	0.000	0.000	0.000	0.000	2.305	96.00		ma120301_rel_withdbg.cz12b_sync_c32r128
5.443	213.6	0.000	0.000	0.132	7.698	12565.6	371220	0.000	0.000	1.563	29.77	0.000	0.000	0.000	0.000	0.000	0.000	0.000	0.000	21.39	99.96		ma120301_rel_withdbg.cz12c_sync_c32r128
2.820	29.14	0.000	0.000	0.116	7.284	44014.8	361859	0.000	0.000	0.045	8.289	0.000	0.000	0.000	0.000	0.000	0.000	0.000	0.000	2.004	95.22		ma120301_rel_withdbg.cz12b_sync_dw0_c32r128
3.931	39.87	0.000	0.000	0.135	7.173	12464.0	366832	0.000	0.000	1.492	29.58	0.000	0.000	0.000	0.000	0.000	0.000	0.000	0.000	20.37	99.99		ma120301_rel_withdbg.cz12c_sync_dw0_c32r128
l.x
l.x: create secondary indexes.
Average throughput:
Performance metrics for the DBMS listed above. Some are normalized by throughput, others are not. Legend for results is here.
ips	qps	rps	rmbps	wps	wmbps	rpq	rkbpq	wpi	wkbpi	csps	cpups	cspq	cpupq	dbgb1	dbgb2	rss	maxop	p50	p99	tag
1581653	0	17210	1413.6	19849.2	1578.4	0.011	0.915	0.013	1.022	108712	24.0	0.069	7	557.5	658.3	100.6	0.004	NA	NA	ma120301_rel_withdbg.cz12b_sync_c32r128
1590457	0	17318	1422.0	19063.5	1575.2	0.011	0.916	0.012	1.014	105890	23.9	0.067	7	557.5	658.8	100.7	0.003	NA	NA	ma120301_rel_withdbg.cz12c_sync_c32r128
1600640	0	17420	1430.5	20093.6	1597.6	0.011	0.915	0.013	1.022	110296	24.7	0.069	7	557.5	658.3	100.6	0.004	NA	NA	ma120301_rel_withdbg.cz12b_sync_dw0_c32r128
1601281	0	17445	1433.4	19310.3	1589.0	0.011	0.917	0.012	1.016	108298	24.5	0.068	7	557.5	658.8	100.7	0.005	NA	NA	ma120301_rel_withdbg.cz12c_sync_dw0_c32r128
Average values from iostat.
r/s	rkB/s	rrqm/s	%rrqm	r_await	rareq-s	w/s	wkB/s	wrqm/s	%wrqm	w_await	wareq-s	d/s	dkB/s	drqm/s	%drqm	d_await	dareq-s	f/s	f_await	aqu-sz	%util
17209.8	1447539	0.000	0.000	0.572	106.8	19849.2	1616270	0.000	0.000	30.38	93.85	0.000	0.000	0.000	0.000	0.000	0.000	0.000	0.000	347.1	95.29		ma120301_rel_withdbg.cz12b_sync_c32r128
17318.2	1456150	0.000	0.000	0.583	106.8	19063.5	1613007	0.000	0.000	34.27	97.09	0.000	0.000	0.000	0.000	0.000	0.000	0.000	0.000	441.6	97.32		ma120301_rel_withdbg.cz12c_sync_c32r128
17420.3	1464800	0.000	0.000	0.583	106.5	20093.6	1635967	0.000	0.000	18.36	94.04	0.000	0.000	0.000	0.000	0.000	0.000	0.000	0.000	253.7	96.94		ma120301_rel_withdbg.cz12b_sync_dw0_c32r128
17444.6	1467799	0.000	0.000	0.584	107.0	19310.3	1627103	0.000	0.000	24.36	97.59	0.000	0.000	0.000	0.000	0.000	0.000	0.000	0.000	307.8	96.04		ma120301_rel_withdbg.cz12c_sync_dw0_c32r128
l.i1
l.i1: continue load after secondary indexes created with 50 inserts per transaction. Graphs for performance per 1-second interval are here.
Average throughput:
Insert response time histogram: each cell has the percentage of responses that take <= the time in the header and max is the max response time in seconds. For the max column values in the top 25% of the range have a red background and in the bottom 25% of the range have a green background. The red background is not used when the min value is within 80% of the max value.
| dbms | 256us | 1ms | 4ms | 16ms | 64ms | 256ms | 1s | 4s | 16s | gt | max |
|---|---|---|---|---|---|---|---|---|---|---|---|
| ma120301_rel_withdbg.cz12b_sync_c32r128 | 0.187 | 29.096 | 51.854 | 18.862 | 0.873 | ||||||
| ma120301_rel_withdbg.cz12c_sync_c32r128 | 0.225 | 27.566 | 52.860 | 19.349 | nonzero | 1.080 | |||||
| ma120301_rel_withdbg.cz12b_sync_dw0_c32r128 | 0.243 | 17.490 | 67.238 | 15.029 | 0.426 | ||||||
| ma120301_rel_withdbg.cz12c_sync_dw0_c32r128 | 0.272 | 16.446 | 68.097 | 15.185 | 0.500 |
Delete response time histogram: each cell has the percentage of responses that take <= the time in the header and max is the max response time in seconds. For the max column values in the top 25% of the range have a red background and in the bottom 25% of the range have a green background. The red background is not used when the min value is within 80% of the max value.
| dbms | 256us | 1ms | 4ms | 16ms | 64ms | 256ms | 1s | 4s | 16s | gt | max |
|---|---|---|---|---|---|---|---|---|---|---|---|
| ma120301_rel_withdbg.cz12b_sync_c32r128 | 1.935 | 50.243 | 29.137 | 18.685 | 0.865 | ||||||
| ma120301_rel_withdbg.cz12c_sync_c32r128 | 2.159 | 48.836 | 29.848 | 19.157 | nonzero | 1.069 | |||||
| ma120301_rel_withdbg.cz12b_sync_dw0_c32r128 | 2.406 | 44.881 | 37.976 | 14.737 | 0.429 | ||||||
| ma120301_rel_withdbg.cz12c_sync_dw0_c32r128 | 2.829 | 43.398 | 38.866 | 14.908 | 0.491 |
Performance metrics for the DBMS listed above. Some are normalized by throughput, others are not. Legend for results is here.
ips	qps	rps	rmbps	wps	wmbps	rpq	rkbpq	wpi	wkbpi	csps	cpups	cspq	cpupq	dbgb1	dbgb2	rss	maxop	p50	p99	tag
8284	0	49982	780.9	54096.6	1350.1	6.034	96.532	6.530	166.885	1057958	15.3	127.710	887	730.1	832.4	100.4	0.873	450	150	ma120301_rel_withdbg.cz12b_sync_c32r128
8189	0	49373	771.4	50194.9	1325.6	6.029	96.461	6.129	165.756	1040166	15.0	127.018	879	730.2	832.9	100.4	1.080	450	150	ma120301_rel_withdbg.cz12c_sync_c32r128
8327	0	50227	784.8	48778.5	747.1	6.032	96.503	5.858	91.875	1197085	16.2	143.756	934	730.4	832.7	100.3	0.426	450	150	ma120301_rel_withdbg.cz12b_sync_dw0_c32r128
8267	0	49868	779.2	44576.4	729.7	6.032	96.511	5.392	90.384	1189104	16.0	143.837	929	730.2	833.0	100.4	0.500	450	150	ma120301_rel_withdbg.cz12c_sync_dw0_c32r128
Average values from iostat.
r/s	rkB/s	rrqm/s	%rrqm	r_await	rareq-s	w/s	wkB/s	wrqm/s	%wrqm	w_await	wareq-s	d/s	dkB/s	drqm/s	%drqm	d_await	dareq-s	f/s	f_await	aqu-sz	%util
49982.4	799684	0.000	0.000	0.187	16.00	54096.6	1382492	0.000	0.000	0.153	25.67	0.000	0.000	0.000	0.000	0.000	0.000	0.000	0.000	17.94	100.00		ma120301_rel_withdbg.cz12b_sync_c32r128
49372.7	789930	0.000	0.000	0.191	16.00	50194.9	1357395	0.000	0.000	0.177	27.18	0.000	0.000	0.000	0.000	0.000	0.000	0.000	0.000	18.70	100.00		ma120301_rel_withdbg.cz12c_sync_c32r128
50227.3	803598	0.000	0.000	0.125	16.00	48778.5	765058	0.000	0.000	0.159	15.71	0.000	0.000	0.000	0.000	0.000	0.000	0.000	0.000	14.52	100.00		ma120301_rel_withdbg.cz12b_sync_dw0_c32r128
49868.0	797860	0.000	0.000	0.126	16.00	44576.4	747201	0.000	0.000	0.186	16.78	0.000	0.000	0.000	0.000	0.000	0.000	0.000	0.000	15.56	100.00		ma120301_rel_withdbg.cz12c_sync_dw0_c32r128
l.i2
l.i2: continue load after secondary indexes created with 5 inserts per transaction. Graphs for performance per 1-second interval are here.
Average throughput:
Insert response time histogram: each cell has the percentage of responses that take <= the time in the header and max is the max response time in seconds. For the max column values in the top 25% of the range have a red background and in the bottom 25% of the range have a green background. The red background is not used when the min value is within 80% of the max value.
| dbms | 256us | 1ms | 4ms | 16ms | 64ms | 256ms | 1s | 4s | 16s | gt | max |
|---|---|---|---|---|---|---|---|---|---|---|---|
| ma120301_rel_withdbg.cz12b_sync_c32r128 | 0.005 | 37.292 | 37.324 | 25.264 | 0.115 | 0.204 | |||||
| ma120301_rel_withdbg.cz12c_sync_c32r128 | 0.381 | 51.545 | 20.340 | 27.617 | 0.116 | 0.209 | |||||
| ma120301_rel_withdbg.cz12b_sync_dw0_c32r128 | 0.009 | 64.732 | 13.984 | 21.229 | 0.045 | 0.154 | |||||
| ma120301_rel_withdbg.cz12c_sync_dw0_c32r128 | 0.645 | 67.091 | 9.496 | 22.720 | 0.048 | 0.162 |
Delete response time histogram: each cell has the percentage of responses that take <= the time in the header and max is the max response time in seconds. For the max column values in the top 25% of the range have a red background and in the bottom 25% of the range have a green background. The red background is not used when the min value is within 80% of the max value.
| dbms | 256us | 1ms | 4ms | 16ms | 64ms | 256ms | 1s | 4s | 16s | gt | max |
|---|---|---|---|---|---|---|---|---|---|---|---|
| ma120301_rel_withdbg.cz12b_sync_c32r128 | 0.014 | 45.299 | 29.745 | 24.859 | 0.083 | 0.198 | |||||
| ma120301_rel_withdbg.cz12c_sync_c32r128 | 0.891 | 59.147 | 12.542 | 27.331 | 0.089 | 0.253 | |||||
| ma120301_rel_withdbg.cz12b_sync_dw0_c32r128 | 0.024 | 70.430 | 8.545 | 20.973 | 0.028 | 0.141 | |||||
| ma120301_rel_withdbg.cz12c_sync_dw0_c32r128 | 1.523 | 68.810 | 7.235 | 22.405 | 0.026 | 0.144 |
Performance metrics for the DBMS listed above. Some are normalized by throughput, others are not. Legend for results is here.
ips	qps	rps	rmbps	wps	wmbps	rpq	rkbpq	wpi	wkbpi	csps	cpups	cspq	cpupq	dbgb1	dbgb2	rss	maxop	p50	p99	tag
8432	0	57103	892.2	60286.4	1443.0	6.772	108.358	7.150	175.253	740836	14.0	87.863	797	730.1	832.4	100.3	0.204	559	95	ma120301_rel_withdbg.cz12b_sync_c32r128
8522	0	57756	902.4	52644.9	1426.0	6.778	108.442	6.178	171.360	721050	13.8	84.615	777	730.2	832.9	100.3	0.209	569	95	ma120301_rel_withdbg.cz12c_sync_c32r128
10548	0	71003	1109.4	67942.6	972.9	6.731	107.696	6.441	94.447	917607	16.7	86.989	760	730.4	832.7	100.3	0.154	724	105	ma120301_rel_withdbg.cz12b_sync_dw0_c32r128
10650	0	71586	1118.5	58521.2	946.5	6.722	107.551	5.495	91.007	909271	16.3	85.381	735	730.2	833.0	100.3	0.162	725	105	ma120301_rel_withdbg.cz12c_sync_dw0_c32r128
Average values from iostat.
r/s	rkB/s	rrqm/s	%rrqm	r_await	rareq-s	w/s	wkB/s	wrqm/s	%wrqm	w_await	wareq-s	d/s	dkB/s	drqm/s	%drqm	d_await	dareq-s	f/s	f_await	aqu-sz	%util
57102.6	913643	0.000	0.000	0.196	16.00	60286.4	1477678	0.000	0.000	0.110	24.93	0.000	0.000	0.000	0.000	0.000	0.000	0.000	0.000	18.29	100.00		ma120301_rel_withdbg.cz12b_sync_c32r128
57756.0	924085	0.000	0.000	0.192	16.00	52644.9	1460242	0.000	0.000	0.110	27.83	0.000	0.000	0.000	0.000	0.000	0.000	0.000	0.000	17.30	100.00		ma120301_rel_withdbg.cz12c_sync_c32r128
71002.7	1136033	0.000	0.000	0.142	16.00	67942.6	996277	0.000	0.000	0.118	15.00	0.000	0.000	0.000	0.000	0.000	0.000	0.000	0.000	18.85	100.00		ma120301_rel_withdbg.cz12b_sync_dw0_c32r128
71585.9	1145374	0.000	0.000	0.140	16.00	58521.2	969193	0.000	0.000	0.152	16.61	0.000	0.000	0.000	0.000	0.000	0.000	0.000	0.000	20.15	100.00		ma120301_rel_withdbg.cz12c_sync_dw0_c32r128
qr100.L1
qr100.L1: range queries with 100 insert/s per client. Graphs for performance per 1-second interval are here.
Average throughput:
Query response time histogram: each cell has the percentage of responses that take <= the time in the header and max is the max response time in seconds. For max values in the top 25% of the range have a red background and in the bottom 25% of the range have a green background. The red background is not used when the min value is within 80% of the max value.
| dbms | 256us | 1ms | 4ms | 16ms | 64ms | 256ms | 1s | 4s | 16s | gt | max |
|---|---|---|---|---|---|---|---|---|---|---|---|
| ma120301_rel_withdbg.cz12b_sync_c32r128 | 99.605 | 0.371 | 0.024 | 0.001 | nonzero | nonzero | 0.103 | ||||
| ma120301_rel_withdbg.cz12c_sync_c32r128 | 99.598 | 0.376 | 0.025 | 0.001 | nonzero | nonzero | 0.087 | ||||
| ma120301_rel_withdbg.cz12b_sync_dw0_c32r128 | 99.645 | 0.334 | 0.020 | 0.001 | nonzero | nonzero | 0.119 | ||||
| ma120301_rel_withdbg.cz12c_sync_dw0_c32r128 | 99.631 | 0.347 | 0.021 | 0.001 | nonzero | nonzero | 0.074 |
Insert response time histogram: each cell has the percentage of responses that take <= the time in the header and max is the max response time in seconds. For max values in the top 25% of the range have a red background and in the bottom 25% of the range have a green background. The red background is not used when the min value is within 80% of the max value.
| dbms | 256us | 1ms | 4ms | 16ms | 64ms | 256ms | 1s | 4s | 16s | gt | max |
|---|---|---|---|---|---|---|---|---|---|---|---|
| ma120301_rel_withdbg.cz12b_sync_c32r128 | 28.757 | 71.129 | 0.114 | 0.187 | |||||||
| ma120301_rel_withdbg.cz12c_sync_c32r128 | 32.081 | 67.693 | 0.226 | 0.172 | |||||||
| ma120301_rel_withdbg.cz12b_sync_dw0_c32r128 | 26.806 | 72.906 | 0.288 | 0.159 | |||||||
| ma120301_rel_withdbg.cz12c_sync_dw0_c32r128 | 33.060 | 66.417 | 0.523 | 0.139 |
Delete response time histogram: each cell has the percentage of responses that take <= the time in the header and max is the max response time in seconds. For max values in the top 25% of the range have a red background and in the bottom 25% of the range have a green background. The red background is not used when the min value is within 80% of the max value.
| dbms | 256us | 1ms | 4ms | 16ms | 64ms | 256ms | 1s | 4s | 16s | gt | max |
|---|---|---|---|---|---|---|---|---|---|---|---|
| ma120301_rel_withdbg.cz12b_sync_c32r128 | 59.138 | 40.774 | 0.088 | 0.185 | |||||||
| ma120301_rel_withdbg.cz12c_sync_c32r128 | 59.616 | 40.235 | 0.149 | 0.146 | |||||||
| ma120301_rel_withdbg.cz12b_sync_dw0_c32r128 | 69.083 | 30.799 | 0.117 | 0.111 | |||||||
| ma120301_rel_withdbg.cz12c_sync_dw0_c32r128 | 75.233 | 24.557 | 0.210 | 0.119 |
Performance metrics for the DBMS listed above. Some are normalized by throughput, others are not. Legend for results is here.
ips	qps	rps	rmbps	wps	wmbps	rpq	rkbpq	wpi	wkbpi	csps	cpups	cspq	cpupq	dbgb1	dbgb2	rss	maxop	p50	p99	tag
1987	209134	8805	137.6	7749.0	199.7	0.042	0.674	3.900	102.927	1280967	45.8	6.125	105	730.1	832.4	100.3	0.103	10597	9465	ma120301_rel_withdbg.cz12b_sync_c32r128
1987	207878	8805	137.6	7230.5	199.6	0.042	0.678	3.638	102.826	1271581	45.6	6.117	105	730.2	832.9	100.4	0.087	10533	9574	ma120301_rel_withdbg.cz12c_sync_c32r128
1987	212192	8809	137.6	6921.1	107.3	0.042	0.664	3.484	55.282	1302788	45.7	6.140	103	730.4	832.7	100.4	0.119	10756	9622	ma120301_rel_withdbg.cz12b_sync_dw0_c32r128
1987	207584	8800	137.5	6425.8	106.5	0.042	0.678	3.234	54.873	1276625	45.5	6.150	105	730.2	833.0	100.4	0.074	10520	9465	ma120301_rel_withdbg.cz12c_sync_dw0_c32r128
Average values from iostat.
r/s	rkB/s	rrqm/s	%rrqm	r_await	rareq-s	w/s	wkB/s	wrqm/s	%wrqm	w_await	wareq-s	d/s	dkB/s	drqm/s	%drqm	d_await	dareq-s	f/s	f_await	aqu-sz	%util
8804.6	140871	0.000	0.000	0.139	16.00	7749.0	204485	0.000	0.000	0.082	25.81	0.000	0.000	0.000	0.000	0.000	0.000	0.000	0.000	1.816	24.86		ma120301_rel_withdbg.cz12b_sync_c32r128
8805.0	140882	0.000	0.000	0.138	16.00	7230.5	204347	0.000	0.000	0.092	29.13	0.000	0.000	0.000	0.000	0.000	0.000	0.000	0.000	1.775	24.63		ma120301_rel_withdbg.cz12c_sync_c32r128
8809.1	140944	0.000	0.000	0.114	16.00	6921.1	109828	0.000	0.000	0.107	15.82	0.000	0.000	0.000	0.000	0.000	0.000	0.000	0.000	1.626	22.79		ma120301_rel_withdbg.cz12b_sync_dw0_c32r128
8800.3	140794	0.000	0.000	0.114	16.00	6425.8	109016	0.000	0.000	0.085	18.28	0.000	0.000	0.000	0.000	0.000	0.000	0.000	0.000	1.557	22.51		ma120301_rel_withdbg.cz12c_sync_dw0_c32r128
qp100.L2
qp100.L2: point queries with 100 insert/s per client. Graphs for performance per 1-second interval are here.
Average throughput:
Query response time histogram: each cell has the percentage of responses that take <= the time in the header and max is the max response time in seconds. For max values in the top 25% of the range have a red background and in the bottom 25% of the range have a green background. The red background is not used when the min value is within 80% of the max value.
| dbms | 256us | 1ms | 4ms | 16ms | 64ms | 256ms | 1s | 4s | 16s | gt | max |
|---|---|---|---|---|---|---|---|---|---|---|---|
| ma120301_rel_withdbg.cz12b_sync_c32r128 | 0.020 | 63.680 | 36.228 | 0.070 | 0.003 | nonzero | 0.129 | ||||
| ma120301_rel_withdbg.cz12c_sync_c32r128 | 0.019 | 61.638 | 38.255 | 0.083 | 0.005 | nonzero | 0.134 | ||||
| ma120301_rel_withdbg.cz12b_sync_dw0_c32r128 | 0.023 | 66.686 | 33.183 | 0.066 | 0.041 | 0.001 | 0.177 | ||||
| ma120301_rel_withdbg.cz12c_sync_dw0_c32r128 | 0.021 | 66.997 | 32.855 | 0.080 | 0.045 | 0.001 | 0.195 |
Insert response time histogram: each cell has the percentage of responses that take <= the time in the header and max is the max response time in seconds. For max values in the top 25% of the range have a red background and in the bottom 25% of the range have a green background. The red background is not used when the min value is within 80% of the max value.
| dbms | 256us | 1ms | 4ms | 16ms | 64ms | 256ms | 1s | 4s | 16s | gt | max |
|---|---|---|---|---|---|---|---|---|---|---|---|
| ma120301_rel_withdbg.cz12b_sync_c32r128 | 0.074 | 99.075 | 0.851 | 0.241 | |||||||
| ma120301_rel_withdbg.cz12c_sync_c32r128 | 0.074 | 98.415 | 1.511 | 0.228 | |||||||
| ma120301_rel_withdbg.cz12b_sync_dw0_c32r128 | 0.101 | 90.964 | 8.847 | 0.088 | 0.412 | ||||||
| ma120301_rel_withdbg.cz12c_sync_dw0_c32r128 | 0.109 | 90.469 | 9.312 | 0.110 | 0.421 |
Delete response time histogram: each cell has the percentage of responses that take <= the time in the header and max is the max response time in seconds. For max values in the top 25% of the range have a red background and in the bottom 25% of the range have a green background. The red background is not used when the min value is within 80% of the max value.
| dbms | 256us | 1ms | 4ms | 16ms | 64ms | 256ms | 1s | 4s | 16s | gt | max |
|---|---|---|---|---|---|---|---|---|---|---|---|
| ma120301_rel_withdbg.cz12b_sync_c32r128 | 0.112 | 99.280 | 0.608 | 0.198 | |||||||
| ma120301_rel_withdbg.cz12c_sync_c32r128 | 0.119 | 98.717 | 1.165 | 0.225 | |||||||
| ma120301_rel_withdbg.cz12b_sync_dw0_c32r128 | 0.169 | 93.319 | 6.464 | 0.048 | 0.415 | ||||||
| ma120301_rel_withdbg.cz12c_sync_dw0_c32r128 | 0.190 | 92.931 | 6.804 | 0.075 | 0.433 |
Performance metrics for the DBMS listed above. Some are normalized by throughput, others are not. Legend for results is here.
ips	qps	rps	rmbps	wps	wmbps	rpq	rkbpq	wpi	wkbpi	csps	cpups	cspq	cpupq	dbgb1	dbgb2	rss	maxop	p50	p99	tag
1987	19298	139715	2183.0	12147.2	318.5	7.240	115.835	6.112	164.103	574737	15.1	29.782	376	730.1	832.4	100.4	0.129	991	543	ma120301_rel_withdbg.cz12b_sync_c32r128
1987	19019	137695	2151.5	11532.1	315.8	7.240	115.836	5.803	162.702	579736	15.2	30.482	384	730.2	832.9	100.4	0.134	975	543	ma120301_rel_withdbg.cz12c_sync_c32r128
1987	20015	143946	2249.1	10917.3	168.3	7.192	115.069	5.495	86.748	619407	15.4	30.947	369	730.4	832.7	100.4	0.177	1023	687	ma120301_rel_withdbg.cz12b_sync_dw0_c32r128
1987	20018	144063	2251.0	10297.5	166.4	7.197	115.149	5.182	85.750	622004	15.5	31.073	372	730.2	833.0	100.4	0.195	1023	640	ma120301_rel_withdbg.cz12c_sync_dw0_c32r128
Average values from iostat.
r/s	rkB/s	rrqm/s	%rrqm	r_await	rareq-s	w/s	wkB/s	wrqm/s	%wrqm	w_await	wareq-s	d/s	dkB/s	drqm/s	%drqm	d_await	dareq-s	f/s	f_await	aqu-sz	%util
139715	2235434	0.000	0.000	0.109	16.00	12147.2	326122	0.000	0.000	0.096	26.80	0.000	0.000	0.000	0.000	0.000	0.000	0.000	0.000	16.32	100.00		ma120301_rel_withdbg.cz12b_sync_c32r128
137695	2203105	0.000	0.000	0.112	16.00	11532.1	323337	0.000	0.000	0.101	28.08	0.000	0.000	0.000	0.000	0.000	0.000	0.000	0.000	16.37	99.94		ma120301_rel_withdbg.cz12c_sync_c32r128
143946	2303121	0.000	0.000	0.101	16.00	10917.3	172342	0.000	0.000	0.050	15.77	0.000	0.000	0.000	0.000	0.000	0.000	0.000	0.000	15.11	99.94		ma120301_rel_withdbg.cz12b_sync_dw0_c32r128
144063	2304996	0.000	0.000	0.101	16.00	10297.5	170411	0.000	0.000	0.061	16.59	0.000	0.000	0.000	0.000	0.000	0.000	0.000	0.000	16.01	100.00		ma120301_rel_withdbg.cz12c_sync_dw0_c32r128
qr500.L3
qr500.L3: range queries with 500 insert/s per client. Graphs for performance per 1-second interval are here.
Average throughput:
Query response time histogram: each cell has the percentage of responses that take <= the time in the header and max is the max response time in seconds. For max values in the top 25% of the range have a red background and in the bottom 25% of the range have a green background. The red background is not used when the min value is within 80% of the max value.
| dbms | 256us | 1ms | 4ms | 16ms | 64ms | 256ms | 1s | 4s | 16s | gt | max |
|---|---|---|---|---|---|---|---|---|---|---|---|
| ma120301_rel_withdbg.cz12b_sync_c32r128 | 95.391 | 4.016 | 0.411 | 0.154 | 0.027 | 0.001 | 0.253 | ||||
| ma120301_rel_withdbg.cz12c_sync_c32r128 | 95.059 | 4.282 | 0.460 | 0.168 | 0.029 | 0.001 | 0.228 | ||||
| ma120301_rel_withdbg.cz12b_sync_dw0_c32r128 | 93.320 | 5.597 | 0.713 | 0.298 | 0.072 | nonzero | 0.153 | ||||
| ma120301_rel_withdbg.cz12c_sync_dw0_c32r128 | 90.982 | 7.444 | 1.108 | 0.372 | 0.094 | nonzero | 0.146 |
Insert response time histogram: each cell has the percentage of responses that take <= the time in the header and max is the max response time in seconds. For max values in the top 25% of the range have a red background and in the bottom 25% of the range have a green background. The red background is not used when the min value is within 80% of the max value.
| dbms | 256us | 1ms | 4ms | 16ms | 64ms | 256ms | 1s | 4s | 16s | gt | max |
|---|---|---|---|---|---|---|---|---|---|---|---|
| ma120301_rel_withdbg.cz12b_sync_c32r128 | 3.854 | 68.963 | 27.044 | 0.139 | 0.433 | ||||||
| ma120301_rel_withdbg.cz12c_sync_c32r128 | 4.683 | 67.451 | 27.705 | 0.161 | 0.428 | ||||||
| ma120301_rel_withdbg.cz12b_sync_dw0_c32r128 | 7.253 | 35.290 | 55.492 | 1.965 | 0.412 | ||||||
| ma120301_rel_withdbg.cz12c_sync_dw0_c32r128 | 1.123 | 20.763 | 69.304 | 8.810 | 0.388 |
Delete response time histogram: each cell has the percentage of responses that take <= the time in the header and max is the max response time in seconds. For max values in the top 25% of the range have a red background and in the bottom 25% of the range have a green background. The red background is not used when the min value is within 80% of the max value.
| dbms | 256us | 1ms | 4ms | 16ms | 64ms | 256ms | 1s | 4s | 16s | gt | max |
|---|---|---|---|---|---|---|---|---|---|---|---|
| ma120301_rel_withdbg.cz12b_sync_c32r128 | 14.661 | 61.473 | 23.807 | 0.059 | 0.390 | ||||||
| ma120301_rel_withdbg.cz12c_sync_c32r128 | 15.653 | 59.892 | 24.384 | 0.071 | 0.399 | ||||||
| ma120301_rel_withdbg.cz12b_sync_dw0_c32r128 | 16.628 | 36.213 | 45.258 | 1.901 | 0.409 | ||||||
| ma120301_rel_withdbg.cz12c_sync_dw0_c32r128 | 5.102 | 29.880 | 56.372 | 8.646 | 0.404 |
Performance metrics for the DBMS listed above. Some are normalized by throughput, others are not. Legend for results is here.
ips	qps	rps	rmbps	wps	wmbps	rpq	rkbpq	wpi	wkbpi	csps	cpups	cspq	cpupq	dbgb1	dbgb2	rss	maxop	p50	p99	tag
9936	130110	41826	653.5	41500.0	1055.9	0.321	5.143	4.177	108.813	1538759	47.1	11.827	174	730.1	832.4	100.4	0.253	6441	3580	ma120301_rel_withdbg.cz12b_sync_c32r128
9934	126355	41751	652.3	37793.9	1041.7	0.330	5.287	3.805	107.382	1518795	46.6	12.020	177	730.2	832.9	100.4	0.228	6265	3421	ma120301_rel_withdbg.cz12c_sync_c32r128
9481	104454	38399	600.0	36624.1	543.7	0.368	5.882	3.863	58.726	1643657	42.6	15.736	196	730.6	832.9	100.4	0.153	4795	2078	ma120301_rel_withdbg.cz12b_sync_dw0_c32r128
8539	88536	40118	626.8	35034.1	564.5	0.453	7.250	4.103	67.700	1616995	41.8	18.264	227	730.4	833.2	100.4	0.146	4219	1886	ma120301_rel_withdbg.cz12c_sync_dw0_c32r128
Average values from iostat.
r/s	rkB/s	rrqm/s	%rrqm	r_await	rareq-s	w/s	wkB/s	wrqm/s	%wrqm	w_await	wareq-s	d/s	dkB/s	drqm/s	%drqm	d_await	dareq-s	f/s	f_await	aqu-sz	%util
41825.9	669208	0.000	0.000	0.175	16.00	41500.0	1081225	0.000	0.000	0.077	26.02	0.000	0.000	0.000	0.000	0.000	0.000	0.000	0.000	10.41	90.81		ma120301_rel_withdbg.cz12b_sync_c32r128
41751.2	667985	0.000	0.000	0.174	16.00	37793.9	1066696	0.000	0.000	0.077	28.25	0.000	0.000	0.000	0.000	0.000	0.000	0.000	0.000	10.09	91.02		ma120301_rel_withdbg.cz12c_sync_c32r128
38398.7	614370	0.000	0.000	0.113	16.00	36624.1	556783	0.000	0.000	0.040	15.17	0.000	0.000	0.000	0.000	0.000	0.000	0.000	0.000	5.844	96.41		ma120301_rel_withdbg.cz12b_sync_dw0_c32r128
40118.2	641885	0.000	0.000	0.110	16.00	35034.1	578080	0.000	0.000	0.029	16.52	0.000	0.000	0.000	0.000	0.000	0.000	0.000	0.000	5.502	99.34		ma120301_rel_withdbg.cz12c_sync_dw0_c32r128
qp500.L4
qp500.L4: point queries with 500 insert/s per client. Graphs for performance per 1-second interval are here.
Average throughput:
Query response time histogram: each cell has the percentage of responses that take <= the time in the header and max is the max response time in seconds. For max values in the top 25% of the range have a red background and in the bottom 25% of the range have a green background. The red background is not used when the min value is within 80% of the max value.
| dbms | 256us | 1ms | 4ms | 16ms | 64ms | 256ms | 1s | 4s | 16s | gt | max |
|---|---|---|---|---|---|---|---|---|---|---|---|
| ma120301_rel_withdbg.cz12b_sync_c32r128 | nonzero | 6.853 | 77.673 | 10.751 | 4.657 | 0.066 | 0.183 | ||||
| ma120301_rel_withdbg.cz12c_sync_c32r128 | nonzero | 5.982 | 77.665 | 11.441 | 4.843 | 0.069 | 0.253 | ||||
| ma120301_rel_withdbg.cz12b_sync_dw0_c32r128 | nonzero | 12.615 | 81.805 | 2.864 | 2.241 | 0.475 | 0.001 | 0.519 | |||
| ma120301_rel_withdbg.cz12c_sync_dw0_c32r128 | nonzero | 12.507 | 82.051 | 2.726 | 2.230 | 0.485 | 0.001 | 0.407 |
Insert response time histogram: each cell has the percentage of responses that take <= the time in the header and max is the max response time in seconds. For max values in the top 25% of the range have a red background and in the bottom 25% of the range have a green background. The red background is not used when the min value is within 80% of the max value.
| dbms | 256us | 1ms | 4ms | 16ms | 64ms | 256ms | 1s | 4s | 16s | gt | max |
|---|---|---|---|---|---|---|---|---|---|---|---|
| ma120301_rel_withdbg.cz12b_sync_c32r128 | 0.053 | 18.364 | 56.194 | 25.389 | 0.654 | ||||||
| ma120301_rel_withdbg.cz12c_sync_c32r128 | 0.056 | 14.819 | 58.629 | 26.496 | 0.746 | ||||||
| ma120301_rel_withdbg.cz12b_sync_dw0_c32r128 | 0.052 | 4.903 | 53.291 | 41.753 | nonzero | 1.160 | |||||
| ma120301_rel_withdbg.cz12c_sync_dw0_c32r128 | 0.081 | 4.700 | 52.909 | 42.310 | nonzero | 1.038 |
Delete response time histogram: each cell has the percentage of responses that take <= the time in the header and max is the max response time in seconds. For max values in the top 25% of the range have a red background and in the bottom 25% of the range have a green background. The red background is not used when the min value is within 80% of the max value.
| dbms | 256us | 1ms | 4ms | 16ms | 64ms | 256ms | 1s | 4s | 16s | gt | max |
|---|---|---|---|---|---|---|---|---|---|---|---|
| ma120301_rel_withdbg.cz12b_sync_c32r128 | 0.075 | 19.748 | 57.578 | 22.599 | 0.606 | ||||||
| ma120301_rel_withdbg.cz12c_sync_c32r128 | 0.072 | 16.145 | 60.080 | 23.703 | 0.694 | ||||||
| ma120301_rel_withdbg.cz12b_sync_dw0_c32r128 | 0.096 | 14.125 | 50.050 | 35.728 | 0.989 | ||||||
| ma120301_rel_withdbg.cz12c_sync_dw0_c32r128 | 0.133 | 14.123 | 49.677 | 36.066 | nonzero | 1.105 |
Performance metrics for the DBMS listed above. Some are normalized by throughput, others are not. Legend for results is here.
ips	qps	rps	rmbps	wps	wmbps	rpq	rkbpq	wpi	wkbpi	csps	cpups	cspq	cpupq	dbgb1	dbgb2	rss	maxop	p50	p99	tag
5922	5179	75958	1186.8	35933.0	924.0	14.665	234.646	6.068	159.776	1195057	18.2	230.733	1687	730.2	832.6	100.4	0.183	128	48	ma120301_rel_withdbg.cz12b_sync_c32r128
5743	5046	73757	1152.4	32465.6	888.9	14.617	233.863	5.653	158.484	1189126	17.9	235.652	1703	730.3	833.2	100.4	0.253	128	48	ma120301_rel_withdbg.cz12c_sync_c32r128
4768	6804	87984	1374.7	30966.3	469.4	12.932	206.905	6.495	100.818	1292576	17.6	189.978	1242	730.6	832.9	100.4	0.519	192	64	ma120301_rel_withdbg.cz12b_sync_dw0_c32r128
4743	6808	87847	1372.6	28835.4	461.5	12.904	206.469	6.080	99.640	1290339	17.5	189.544	1234	730.4	833.3	100.4	0.407	192	64	ma120301_rel_withdbg.cz12c_sync_dw0_c32r128
Average values from iostat.
r/s	rkB/s	rrqm/s	%rrqm	r_await	rareq-s	w/s	wkB/s	wrqm/s	%wrqm	w_await	wareq-s	d/s	dkB/s	drqm/s	%drqm	d_await	dareq-s	f/s	f_await	aqu-sz	%util
75958.0	1215327	0.000	0.000	0.165	16.00	35933.0	946192	0.000	0.000	0.099	26.15	0.000	0.000	0.000	0.000	0.000	0.000	0.000	0.000	17.92	100.00		ma120301_rel_withdbg.cz12b_sync_c32r128
73756.6	1180097	0.000	0.000	0.168	16.00	32465.6	910239	0.000	0.000	0.101	28.04	0.000	0.000	0.000	0.000	0.000	0.000	0.000	0.000	17.31	100.00		ma120301_rel_withdbg.cz12c_sync_c32r128
87983.8	1407738	0.000	0.000	0.126	16.00	30966.3	480650	0.000	0.000	0.075	15.42	0.000	0.000	0.000	0.000	0.000	0.000	0.000	0.000	13.87	100.00		ma120301_rel_withdbg.cz12b_sync_dw0_c32r128
87847.4	1405555	0.000	0.000	0.126	16.00	28835.4	472591	0.000	0.000	0.083	16.41	0.000	0.000	0.000	0.000	0.000	0.000	0.000	0.000	13.90	100.00		ma120301_rel_withdbg.cz12c_sync_dw0_c32r128
qr1000.L5
qr1000.L5: range queries with 1000 insert/s per client. Graphs for performance per 1-second interval are here.
Average throughput:
Query response time histogram: each cell has the percentage of responses that take <= the time in the header and max is the max response time in seconds. For max values in the top 25% of the range have a red background and in the bottom 25% of the range have a green background. The red background is not used when the min value is within 80% of the max value.
| dbms | 256us | 1ms | 4ms | 16ms | 64ms | 256ms | 1s | 4s | 16s | gt | max |
|---|---|---|---|---|---|---|---|---|---|---|---|
| ma120301_rel_withdbg.cz12b_sync_c32r128 | 92.210 | 6.584 | 0.983 | 0.182 | 0.041 | nonzero | 0.233 | ||||
| ma120301_rel_withdbg.cz12c_sync_c32r128 | 92.155 | 6.646 | 0.975 | 0.182 | 0.042 | nonzero | 0.237 | ||||
| ma120301_rel_withdbg.cz12b_sync_dw0_c32r128 | 91.719 | 6.880 | 1.086 | 0.248 | 0.066 | nonzero | 0.178 | ||||
| ma120301_rel_withdbg.cz12c_sync_dw0_c32r128 | 91.775 | 6.836 | 1.072 | 0.250 | 0.066 | nonzero | 0.185 |
Insert response time histogram: each cell has the percentage of responses that take <= the time in the header and max is the max response time in seconds. For max values in the top 25% of the range have a red background and in the bottom 25% of the range have a green background. The red background is not used when the min value is within 80% of the max value.
| dbms | 256us | 1ms | 4ms | 16ms | 64ms | 256ms | 1s | 4s | 16s | gt | max |
|---|---|---|---|---|---|---|---|---|---|---|---|
| ma120301_rel_withdbg.cz12b_sync_c32r128 | 0.556 | 24.707 | 53.014 | 21.723 | 0.531 | ||||||
| ma120301_rel_withdbg.cz12c_sync_c32r128 | 0.642 | 22.900 | 53.889 | 22.569 | 0.510 | ||||||
| ma120301_rel_withdbg.cz12b_sync_dw0_c32r128 | 0.777 | 20.579 | 61.276 | 17.368 | 0.509 | ||||||
| ma120301_rel_withdbg.cz12c_sync_dw0_c32r128 | 1.364 | 20.014 | 61.151 | 17.472 | 0.466 |
Delete response time histogram: each cell has the percentage of responses that take <= the time in the header and max is the max response time in seconds. For max values in the top 25% of the range have a red background and in the bottom 25% of the range have a green background. The red background is not used when the min value is within 80% of the max value.
| dbms | 256us | 1ms | 4ms | 16ms | 64ms | 256ms | 1s | 4s | 16s | gt | max |
|---|---|---|---|---|---|---|---|---|---|---|---|
| ma120301_rel_withdbg.cz12b_sync_c32r128 | 2.979 | 32.393 | 43.206 | 21.422 | 0.510 | ||||||
| ma120301_rel_withdbg.cz12c_sync_c32r128 | 3.064 | 30.461 | 44.191 | 22.285 | 0.514 | ||||||
| ma120301_rel_withdbg.cz12b_sync_dw0_c32r128 | 5.193 | 27.646 | 50.140 | 17.021 | 0.494 | ||||||
| ma120301_rel_withdbg.cz12c_sync_dw0_c32r128 | 6.643 | 26.283 | 49.933 | 17.141 | 0.495 |
Performance metrics for the DBMS listed above. Some are normalized by throughput, others are not. Legend for results is here.
ips	qps	rps	rmbps	wps	wmbps	rpq	rkbpq	wpi	wkbpi	csps	cpups	cspq	cpupq	dbgb1	dbgb2	rss	maxop	p50	p99	tag
7652	102737	43717	683.1	46149.2	1191.2	0.426	6.808	6.031	159.402	1468681	46.7	14.296	218	730.3	832.6	100.4	0.233	5322	2317	ma120301_rel_withdbg.cz12b_sync_c32r128
7481	102508	42745	667.9	42076.5	1157.1	0.417	6.672	5.624	158.384	1442382	46.3	14.071	217	730.4	833.2	100.4	0.237	5306	2349	ma120301_rel_withdbg.cz12c_sync_c32r128
7882	96242	44977	702.8	42484.4	639.9	0.467	7.477	5.390	83.140	1569843	44.7	16.311	223	730.7	833.0	100.4	0.178	4875	1918	ma120301_rel_withdbg.cz12b_sync_dw0_c32r128
7893	95841	45031	703.7	39366.9	631.9	0.470	7.518	4.988	81.981	1567099	44.5	16.351	223	730.5	833.3	100.4	0.185	4859	1934	ma120301_rel_withdbg.cz12c_sync_dw0_c32r128
Average values from iostat.
r/s	rkB/s	rrqm/s	%rrqm	r_await	rareq-s	w/s	wkB/s	wrqm/s	%wrqm	w_await	wareq-s	d/s	dkB/s	drqm/s	%drqm	d_await	dareq-s	f/s	f_await	aqu-sz	%util
43717.3	699475	0.000	0.000	0.162	16.00	46149.2	1219772	0.000	0.000	0.076	26.42	0.000	0.000	0.000	0.000	0.000	0.000	0.000	0.000	10.64	100.00		ma120301_rel_withdbg.cz12b_sync_c32r128
42744.6	683898	0.000	0.000	0.163	16.00	42076.5	1184899	0.000	0.000	0.078	28.16	0.000	0.000	0.000	0.000	0.000	0.000	0.000	0.000	10.29	100.00		ma120301_rel_withdbg.cz12c_sync_c32r128
44976.6	719621	0.000	0.000	0.115	16.00	42484.4	655287	0.000	0.000	0.030	15.42	0.000	0.000	0.000	0.000	0.000	0.000	0.000	0.000	6.401	100.00		ma120301_rel_withdbg.cz12b_sync_dw0_c32r128
45030.9	720539	0.000	0.000	0.115	16.00	39366.9	647073	0.000	0.000	0.032	16.44	0.000	0.000	0.000	0.000	0.000	0.000	0.000	0.000	6.421	100.00		ma120301_rel_withdbg.cz12c_sync_dw0_c32r128
qp1000.L6
qp1000.L6: point queries with 1000 insert/s per client. Graphs for performance per 1-second interval are here.
Average throughput:
Query response time histogram: each cell has the percentage of responses that take <= the time in the header and max is the max response time in seconds. For max values in the top 25% of the range have a red background and in the bottom 25% of the range have a green background. The red background is not used when the min value is within 80% of the max value.
| dbms | 256us | 1ms | 4ms | 16ms | 64ms | 256ms | 1s | 4s | 16s | gt | max |
|---|---|---|---|---|---|---|---|---|---|---|---|
| ma120301_rel_withdbg.cz12b_sync_c32r128 | nonzero | 7.412 | 85.181 | 5.972 | 1.420 | 0.015 | 0.230 | ||||
| ma120301_rel_withdbg.cz12c_sync_c32r128 | nonzero | 7.346 | 84.543 | 6.531 | 1.561 | 0.019 | 0.224 | ||||
| ma120301_rel_withdbg.cz12b_sync_dw0_c32r128 | nonzero | 13.456 | 79.241 | 4.396 | 2.561 | 0.346 | 0.001 | 0.438 | |||
| ma120301_rel_withdbg.cz12c_sync_dw0_c32r128 | nonzero | 13.193 | 79.510 | 4.389 | 2.564 | 0.342 | 0.001 | 0.436 |
Insert response time histogram: each cell has the percentage of responses that take <= the time in the header and max is the max response time in seconds. For max values in the top 25% of the range have a red background and in the bottom 25% of the range have a green background. The red background is not used when the min value is within 80% of the max value.
| dbms | 256us | 1ms | 4ms | 16ms | 64ms | 256ms | 1s | 4s | 16s | gt | max |
|---|---|---|---|---|---|---|---|---|---|---|---|
| ma120301_rel_withdbg.cz12b_sync_c32r128 | 0.023 | 29.402 | 36.081 | 34.494 | 0.561 | ||||||
| ma120301_rel_withdbg.cz12c_sync_c32r128 | 0.016 | 25.294 | 39.431 | 35.259 | 0.602 | ||||||
| ma120301_rel_withdbg.cz12b_sync_dw0_c32r128 | 0.070 | 5.328 | 58.788 | 35.813 | nonzero | 1.111 | |||||
| ma120301_rel_withdbg.cz12c_sync_dw0_c32r128 | 0.091 | 5.410 | 58.658 | 35.841 | nonzero | 1.043 |
Delete response time histogram: each cell has the percentage of responses that take <= the time in the header and max is the max response time in seconds. For max values in the top 25% of the range have a red background and in the bottom 25% of the range have a green background. The red background is not used when the min value is within 80% of the max value.
| dbms | 256us | 1ms | 4ms | 16ms | 64ms | 256ms | 1s | 4s | 16s | gt | max |
|---|---|---|---|---|---|---|---|---|---|---|---|
| ma120301_rel_withdbg.cz12b_sync_c32r128 | 0.030 | 31.048 | 35.412 | 33.510 | 0.562 | ||||||
| ma120301_rel_withdbg.cz12c_sync_c32r128 | 0.022 | 27.023 | 38.831 | 34.124 | 0.561 | ||||||
| ma120301_rel_withdbg.cz12b_sync_dw0_c32r128 | 0.098 | 12.009 | 55.980 | 31.913 | 0.969 | ||||||
| ma120301_rel_withdbg.cz12c_sync_dw0_c32r128 | 0.119 | 12.071 | 55.836 | 31.974 | 0.940 |
Performance metrics for the DBMS listed above. Some are normalized by throughput, others are not. Legend for results is here.
ips	qps	rps	rmbps	wps	wmbps	rpq	rkbpq	wpi	wkbpi	csps	cpups	cspq	cpupq	dbgb1	dbgb2	rss	maxop	p50	p99	tag
6189	7583	103090	1610.8	43169.3	1125.4	13.595	217.519	6.975	186.189	1045321	18.4	137.851	1165	730.4	832.7	100.4	0.230	448	64	ma120301_rel_withdbg.cz12b_sync_c32r128
6018	7395	100428	1569.2	39682.8	1089.2	13.580	217.279	6.594	185.330	1052472	18.2	142.316	1181	730.5	833.3	100.4	0.224	432	64	ma120301_rel_withdbg.cz12c_sync_c32r128
5094	6848	89153	1393.0	32267.7	485.2	13.019	208.297	6.335	97.536	1281926	18.0	187.194	1262	730.7	833.0	100.3	0.438	208	64	ma120301_rel_withdbg.cz12b_sync_dw0_c32r128
5103	6849	89224	1394.1	30108.0	479.0	13.027	208.430	5.900	96.117	1276313	17.9	186.345	1254	730.5	833.4	100.4	0.436	208	64	ma120301_rel_withdbg.cz12c_sync_dw0_c32r128
Average values from iostat.
r/s	rkB/s	rrqm/s	%rrqm	r_await	rareq-s	w/s	wkB/s	wrqm/s	%wrqm	w_await	wareq-s	d/s	dkB/s	drqm/s	%drqm	d_await	dareq-s	f/s	f_await	aqu-sz	%util
103090	1649444	0.000	0.000	0.198	16.00	43169.3	1152358	0.000	0.000	0.126	26.67	0.000	0.000	0.000	0.000	0.000	0.000	0.000	0.000	26.20	100.00		ma120301_rel_withdbg.cz12b_sync_c32r128
100428	1606844	0.000	0.000	0.194	16.00	39682.8	1115314	0.000	0.000	0.123	28.10	0.000	0.000	0.000	0.000	0.000	0.000	0.000	0.000	24.74	100.00		ma120301_rel_withdbg.cz12c_sync_c32r128
89153.2	1426436	0.000	0.000	0.125	16.00	32267.7	496820	0.000	0.000	0.073	15.35	2.419	84242.0	0.000	0.000	0.000	25.03	0.000	0.000	13.71	100.00		ma120301_rel_withdbg.cz12b_sync_dw0_c32r128
89223.7	1427578	0.000	0.000	0.126	16.00	30108.0	490459	0.000	0.000	0.088	16.30	0.000	0.000	0.000	0.000	0.000	0.000	0.000	0.000	14.09	100.00		ma120301_rel_withdbg.cz12c_sync_dw0_c32r128
l.i0
l.i0: load without secondary indexes
Performance metrics for all DBMS, not just the ones listed above. Some are normalized by throughput, others are not. Legend for results is here.
ips	qps	rps	rmbps	wps	wmbps	rpq	rkbpq	wpi	wkbpi	csps	cpups	cspq	cpupq	dbgb1	dbgb2	rss	maxop	p50	p99	tag
829359	0	3	0.0	44219.6	353.8	0.000	0.000	0.053	0.437	573464	34.8	0.691	20	263.2	364.0	101.2	0.410	36361	24574	ma120301_rel_withdbg.cz12b_sync_c32r128
904977	0	5	0.2	12565.6	362.5	0.000	0.000	0.014	0.410	639005	43.8	0.706	23	263.2	364.5	100.2	0.144	35162	27770	ma120301_rel_withdbg.cz12c_sync_c32r128
836645	0	3	0.0	44014.8	353.4	0.000	0.000	0.053	0.433	543751	34.5	0.650	20	263.2	364.0	101.0	0.318	36860	24474	ma120301_rel_withdbg.cz12b_sync_dw0_c32r128
898674	0	4	0.0	12464.0	358.2	0.000	0.000	0.014	0.408	649757	44.0	0.723	24	263.2	364.5	100.2	0.097	34276	27770	ma120301_rel_withdbg.cz12c_sync_dw0_c32r128
l.x
l.x: create secondary indexes
Performance metrics for all DBMS, not just the ones listed above. Some are normalized by throughput, others are not. Legend for results is here.
ips	qps	rps	rmbps	wps	wmbps	rpq	rkbpq	wpi	wkbpi	csps	cpups	cspq	cpupq	dbgb1	dbgb2	rss	maxop	p50	p99	tag
1581653	0	17210	1413.6	19849.2	1578.4	0.011	0.915	0.013	1.022	108712	24.0	0.069	7	557.5	658.3	100.6	0.004	NA	NA	ma120301_rel_withdbg.cz12b_sync_c32r128
1590457	0	17318	1422.0	19063.5	1575.2	0.011	0.916	0.012	1.014	105890	23.9	0.067	7	557.5	658.8	100.7	0.003	NA	NA	ma120301_rel_withdbg.cz12c_sync_c32r128
1600640	0	17420	1430.5	20093.6	1597.6	0.011	0.915	0.013	1.022	110296	24.7	0.069	7	557.5	658.3	100.6	0.004	NA	NA	ma120301_rel_withdbg.cz12b_sync_dw0_c32r128
1601281	0	17445	1433.4	19310.3	1589.0	0.011	0.917	0.012	1.016	108298	24.5	0.068	7	557.5	658.8	100.7	0.005	NA	NA	ma120301_rel_withdbg.cz12c_sync_dw0_c32r128
l.i1
l.i1: continue load after secondary indexes created with 50 inserts per transaction
Performance metrics for all DBMS, not just the ones listed above. Some are normalized by throughput, others are not. Legend for results is here.
ips	qps	rps	rmbps	wps	wmbps	rpq	rkbpq	wpi	wkbpi	csps	cpups	cspq	cpupq	dbgb1	dbgb2	rss	maxop	p50	p99	tag
8284	0	49982	780.9	54096.6	1350.1	6.034	96.532	6.530	166.885	1057958	15.3	127.710	887	730.1	832.4	100.4	0.873	450	150	ma120301_rel_withdbg.cz12b_sync_c32r128
8189	0	49373	771.4	50194.9	1325.6	6.029	96.461	6.129	165.756	1040166	15.0	127.018	879	730.2	832.9	100.4	1.080	450	150	ma120301_rel_withdbg.cz12c_sync_c32r128
8327	0	50227	784.8	48778.5	747.1	6.032	96.503	5.858	91.875	1197085	16.2	143.756	934	730.4	832.7	100.3	0.426	450	150	ma120301_rel_withdbg.cz12b_sync_dw0_c32r128
8267	0	49868	779.2	44576.4	729.7	6.032	96.511	5.392	90.384	1189104	16.0	143.837	929	730.2	833.0	100.4	0.500	450	150	ma120301_rel_withdbg.cz12c_sync_dw0_c32r128
l.i2
l.i2: continue load after secondary indexes created with 5 inserts per transaction
Performance metrics for all DBMS, not just the ones listed above. Some are normalized by throughput, others are not. Legend for results is here.
ips	qps	rps	rmbps	wps	wmbps	rpq	rkbpq	wpi	wkbpi	csps	cpups	cspq	cpupq	dbgb1	dbgb2	rss	maxop	p50	p99	tag
8432	0	57103	892.2	60286.4	1443.0	6.772	108.358	7.150	175.253	740836	14.0	87.863	797	730.1	832.4	100.3	0.204	559	95	ma120301_rel_withdbg.cz12b_sync_c32r128
8522	0	57756	902.4	52644.9	1426.0	6.778	108.442	6.178	171.360	721050	13.8	84.615	777	730.2	832.9	100.3	0.209	569	95	ma120301_rel_withdbg.cz12c_sync_c32r128
10548	0	71003	1109.4	67942.6	972.9	6.731	107.696	6.441	94.447	917607	16.7	86.989	760	730.4	832.7	100.3	0.154	724	105	ma120301_rel_withdbg.cz12b_sync_dw0_c32r128
10650	0	71586	1118.5	58521.2	946.5	6.722	107.551	5.495	91.007	909271	16.3	85.381	735	730.2	833.0	100.3	0.162	725	105	ma120301_rel_withdbg.cz12c_sync_dw0_c32r128
qr100.L1
qr100.L1: range queries with 100 insert/s per client
Performance metrics for all DBMS, not just the ones listed above. Some are normalized by throughput, others are not. Legend for results is here.
ips	qps	rps	rmbps	wps	wmbps	rpq	rkbpq	wpi	wkbpi	csps	cpups	cspq	cpupq	dbgb1	dbgb2	rss	maxop	p50	p99	tag
1987	209134	8805	137.6	7749.0	199.7	0.042	0.674	3.900	102.927	1280967	45.8	6.125	105	730.1	832.4	100.3	0.103	10597	9465	ma120301_rel_withdbg.cz12b_sync_c32r128
1987	207878	8805	137.6	7230.5	199.6	0.042	0.678	3.638	102.826	1271581	45.6	6.117	105	730.2	832.9	100.4	0.087	10533	9574	ma120301_rel_withdbg.cz12c_sync_c32r128
1987	212192	8809	137.6	6921.1	107.3	0.042	0.664	3.484	55.282	1302788	45.7	6.140	103	730.4	832.7	100.4	0.119	10756	9622	ma120301_rel_withdbg.cz12b_sync_dw0_c32r128
1987	207584	8800	137.5	6425.8	106.5	0.042	0.678	3.234	54.873	1276625	45.5	6.150	105	730.2	833.0	100.4	0.074	10520	9465	ma120301_rel_withdbg.cz12c_sync_dw0_c32r128
qp100.L2
qp100.L2: point queries with 100 insert/s per client
Performance metrics for all DBMS, not just the ones listed above. Some are normalized by throughput, others are not. Legend for results is here.
ips	qps	rps	rmbps	wps	wmbps	rpq	rkbpq	wpi	wkbpi	csps	cpups	cspq	cpupq	dbgb1	dbgb2	rss	maxop	p50	p99	tag
1987	19298	139715	2183.0	12147.2	318.5	7.240	115.835	6.112	164.103	574737	15.1	29.782	376	730.1	832.4	100.4	0.129	991	543	ma120301_rel_withdbg.cz12b_sync_c32r128
1987	19019	137695	2151.5	11532.1	315.8	7.240	115.836	5.803	162.702	579736	15.2	30.482	384	730.2	832.9	100.4	0.134	975	543	ma120301_rel_withdbg.cz12c_sync_c32r128
1987	20015	143946	2249.1	10917.3	168.3	7.192	115.069	5.495	86.748	619407	15.4	30.947	369	730.4	832.7	100.4	0.177	1023	687	ma120301_rel_withdbg.cz12b_sync_dw0_c32r128
1987	20018	144063	2251.0	10297.5	166.4	7.197	115.149	5.182	85.750	622004	15.5	31.073	372	730.2	833.0	100.4	0.195	1023	640	ma120301_rel_withdbg.cz12c_sync_dw0_c32r128
qr500.L3
qr500.L3: range queries with 500 insert/s per client
Performance metrics for all DBMS, not just the ones listed above. Some are normalized by throughput, others are not. Legend for results is here.
ips	qps	rps	rmbps	wps	wmbps	rpq	rkbpq	wpi	wkbpi	csps	cpups	cspq	cpupq	dbgb1	dbgb2	rss	maxop	p50	p99	tag
9936	130110	41826	653.5	41500.0	1055.9	0.321	5.143	4.177	108.813	1538759	47.1	11.827	174	730.1	832.4	100.4	0.253	6441	3580	ma120301_rel_withdbg.cz12b_sync_c32r128
9934	126355	41751	652.3	37793.9	1041.7	0.330	5.287	3.805	107.382	1518795	46.6	12.020	177	730.2	832.9	100.4	0.228	6265	3421	ma120301_rel_withdbg.cz12c_sync_c32r128
9481	104454	38399	600.0	36624.1	543.7	0.368	5.882	3.863	58.726	1643657	42.6	15.736	196	730.6	832.9	100.4	0.153	4795	2078	ma120301_rel_withdbg.cz12b_sync_dw0_c32r128
8539	88536	40118	626.8	35034.1	564.5	0.453	7.250	4.103	67.700	1616995	41.8	18.264	227	730.4	833.2	100.4	0.146	4219	1886	ma120301_rel_withdbg.cz12c_sync_dw0_c32r128
qp500.L4
qp500.L4: point queries with 500 insert/s per client
Performance metrics for all DBMS, not just the ones listed above. Some are normalized by throughput, others are not. Legend for results is here.
ips	qps	rps	rmbps	wps	wmbps	rpq	rkbpq	wpi	wkbpi	csps	cpups	cspq	cpupq	dbgb1	dbgb2	rss	maxop	p50	p99	tag
5922	5179	75958	1186.8	35933.0	924.0	14.665	234.646	6.068	159.776	1195057	18.2	230.733	1687	730.2	832.6	100.4	0.183	128	48	ma120301_rel_withdbg.cz12b_sync_c32r128
5743	5046	73757	1152.4	32465.6	888.9	14.617	233.863	5.653	158.484	1189126	17.9	235.652	1703	730.3	833.2	100.4	0.253	128	48	ma120301_rel_withdbg.cz12c_sync_c32r128
4768	6804	87984	1374.7	30966.3	469.4	12.932	206.905	6.495	100.818	1292576	17.6	189.978	1242	730.6	832.9	100.4	0.519	192	64	ma120301_rel_withdbg.cz12b_sync_dw0_c32r128
4743	6808	87847	1372.6	28835.4	461.5	12.904	206.469	6.080	99.640	1290339	17.5	189.544	1234	730.4	833.3	100.4	0.407	192	64	ma120301_rel_withdbg.cz12c_sync_dw0_c32r128
qr1000.L5
qr1000.L5: range queries with 1000 insert/s per client
Performance metrics for all DBMS, not just the ones listed above. Some are normalized by throughput, others are not. Legend for results is here.
ips	qps	rps	rmbps	wps	wmbps	rpq	rkbpq	wpi	wkbpi	csps	cpups	cspq	cpupq	dbgb1	dbgb2	rss	maxop	p50	p99	tag
7652	102737	43717	683.1	46149.2	1191.2	0.426	6.808	6.031	159.402	1468681	46.7	14.296	218	730.3	832.6	100.4	0.233	5322	2317	ma120301_rel_withdbg.cz12b_sync_c32r128
7481	102508	42745	667.9	42076.5	1157.1	0.417	6.672	5.624	158.384	1442382	46.3	14.071	217	730.4	833.2	100.4	0.237	5306	2349	ma120301_rel_withdbg.cz12c_sync_c32r128
7882	96242	44977	702.8	42484.4	639.9	0.467	7.477	5.390	83.140	1569843	44.7	16.311	223	730.7	833.0	100.4	0.178	4875	1918	ma120301_rel_withdbg.cz12b_sync_dw0_c32r128
7893	95841	45031	703.7	39366.9	631.9	0.470	7.518	4.988	81.981	1567099	44.5	16.351	223	730.5	833.3	100.4	0.185	4859	1934	ma120301_rel_withdbg.cz12c_sync_dw0_c32r128
qp1000.L6
qp1000.L6: point queries with 1000 insert/s per client
Performance metrics for all DBMS, not just the ones listed above. Some are normalized by throughput, others are not. Legend for results is here.
ips	qps	rps	rmbps	wps	wmbps	rpq	rkbpq	wpi	wkbpi	csps	cpups	cspq	cpupq	dbgb1	dbgb2	rss	maxop	p50	p99	tag
6189	7583	103090	1610.8	43169.3	1125.4	13.595	217.519	6.975	186.189	1045321	18.4	137.851	1165	730.4	832.7	100.4	0.230	448	64	ma120301_rel_withdbg.cz12b_sync_c32r128
6018	7395	100428	1569.2	39682.8	1089.2	13.580	217.279	6.594	185.330	1052472	18.2	142.316	1181	730.5	833.3	100.4	0.224	432	64	ma120301_rel_withdbg.cz12c_sync_c32r128
5094	6848	89153	1393.0	32267.7	485.2	13.019	208.297	6.335	97.536	1281926	18.0	187.194	1262	730.7	833.0	100.3	0.438	208	64	ma120301_rel_withdbg.cz12b_sync_dw0_c32r128
5103	6849	89224	1394.1	30108.0	479.0	13.027	208.430	5.900	96.117	1276313	17.9	186.345	1254	730.5	833.4	100.4	0.436	208	64	ma120301_rel_withdbg.cz12c_sync_dw0_c32r128
l.i0
- l.i0: load without secondary indexes
- Legend for results is here.
- Each entry lists the percentage of responses that fit in that bucket (slower than max time for previous bucket, faster than min time for next bucket).
Insert response time histogram
256us	1ms	4ms	16ms	64ms	256ms	1s	4s	16s	gt	max	tag
0.000	0.115	98.854	0.952	0.022	0.057	nonzero	0.000	0.000	0.000	0.410	ma120301_rel_withdbg.cz12b_sync_c32r128
0.000	6.819	91.926	1.032	0.221	0.002	0.000	0.000	0.000	0.000	0.144	ma120301_rel_withdbg.cz12c_sync_c32r128
0.000	0.101	99.073	0.747	0.014	0.063	0.002	0.000	0.000	0.000	0.318	ma120301_rel_withdbg.cz12b_sync_dw0_c32r128
0.000	6.444	92.223	1.156	0.176	0.001	0.000	0.000	0.000	0.000	0.097	ma120301_rel_withdbg.cz12c_sync_dw0_c32r128
l.x
- l.x: create secondary indexes
- Legend for results is here.
- Each entry lists the percentage of responses that fit in that bucket (slower than max time for previous bucket, faster than min time for next bucket).
TODO - determine whether there is data for create index response time
l.i1
- l.i1: continue load after secondary indexes created with 50 inserts per transaction
- Legend for results is here.
- Each entry lists the percentage of responses that fit in that bucket (slower than max time for previous bucket, faster than min time for next bucket).
Insert response time histogram
256us	1ms	4ms	16ms	64ms	256ms	1s	4s	16s	gt	max	tag
0.000	0.000	0.000	0.187	29.096	51.854	18.862	0.000	0.000	0.000	0.873	ma120301_rel_withdbg.cz12b_sync_c32r128
0.000	0.000	0.000	0.225	27.566	52.860	19.349	nonzero	0.000	0.000	1.080	ma120301_rel_withdbg.cz12c_sync_c32r128
0.000	0.000	0.000	0.243	17.490	67.238	15.029	0.000	0.000	0.000	0.426	ma120301_rel_withdbg.cz12b_sync_dw0_c32r128
0.000	0.000	0.000	0.272	16.446	68.097	15.185	0.000	0.000	0.000	0.500	ma120301_rel_withdbg.cz12c_sync_dw0_c32r128
Delete response time histogram
256us	1ms	4ms	16ms	64ms	256ms	1s	4s	16s	gt	max	tag
0.000	0.000	0.000	1.935	50.243	29.137	18.685	0.000	0.000	0.000	0.865	ma120301_rel_withdbg.cz12b_sync_c32r128
0.000	0.000	0.000	2.159	48.836	29.848	19.157	nonzero	0.000	0.000	1.069	ma120301_rel_withdbg.cz12c_sync_c32r128
0.000	0.000	0.000	2.406	44.881	37.976	14.737	0.000	0.000	0.000	0.429	ma120301_rel_withdbg.cz12b_sync_dw0_c32r128
0.000	0.000	0.000	2.829	43.398	38.866	14.908	0.000	0.000	0.000	0.491	ma120301_rel_withdbg.cz12c_sync_dw0_c32r128
l.i2
- l.i2: continue load after secondary indexes created with 5 inserts per transaction
- Legend for results is here.
- Each entry lists the percentage of responses that fit in that bucket (slower than max time for previous bucket, faster than min time for next bucket).
Insert response time histogram
256us	1ms	4ms	16ms	64ms	256ms	1s	4s	16s	gt	max	tag
0.000	0.005	37.292	37.324	25.264	0.115	0.000	0.000	0.000	0.000	0.204	ma120301_rel_withdbg.cz12b_sync_c32r128
0.000	0.381	51.545	20.340	27.617	0.116	0.000	0.000	0.000	0.000	0.209	ma120301_rel_withdbg.cz12c_sync_c32r128
0.000	0.009	64.732	13.984	21.229	0.045	0.000	0.000	0.000	0.000	0.154	ma120301_rel_withdbg.cz12b_sync_dw0_c32r128
0.000	0.645	67.091	9.496	22.720	0.048	0.000	0.000	0.000	0.000	0.162	ma120301_rel_withdbg.cz12c_sync_dw0_c32r128
Delete response time histogram
256us	1ms	4ms	16ms	64ms	256ms	1s	4s	16s	gt	max	tag
0.000	0.014	45.299	29.745	24.859	0.083	0.000	0.000	0.000	0.000	0.198	ma120301_rel_withdbg.cz12b_sync_c32r128
0.000	0.891	59.147	12.542	27.331	0.089	0.000	0.000	0.000	0.000	0.253	ma120301_rel_withdbg.cz12c_sync_c32r128
0.000	0.024	70.430	8.545	20.973	0.028	0.000	0.000	0.000	0.000	0.141	ma120301_rel_withdbg.cz12b_sync_dw0_c32r128
0.000	1.523	68.810	7.235	22.405	0.026	0.000	0.000	0.000	0.000	0.144	ma120301_rel_withdbg.cz12c_sync_dw0_c32r128
qr100.L1
- qr100.L1: range queries with 100 insert/s per client
- Legend for results is here.
- Each entry lists the percentage of responses that fit in that bucket (slower than max time for previous bucket, faster than min time for next bucket).
Query response time histogram
256us	1ms	4ms	16ms	64ms	256ms	1s	4s	16s	gt	max	tag
99.605	0.371	0.024	0.001	nonzero	nonzero	0.000	0.000	0.000	0.000	0.103	ma120301_rel_withdbg.cz12b_sync_c32r128
99.598	0.376	0.025	0.001	nonzero	nonzero	0.000	0.000	0.000	0.000	0.087	ma120301_rel_withdbg.cz12c_sync_c32r128
99.645	0.334	0.020	0.001	nonzero	nonzero	0.000	0.000	0.000	0.000	0.119	ma120301_rel_withdbg.cz12b_sync_dw0_c32r128
99.631	0.347	0.021	0.001	nonzero	nonzero	0.000	0.000	0.000	0.000	0.074	ma120301_rel_withdbg.cz12c_sync_dw0_c32r128
Insert response time histogram
256us	1ms	4ms	16ms	64ms	256ms	1s	4s	16s	gt	max	tag
0.000	0.000	0.000	28.757	71.129	0.114	0.000	0.000	0.000	0.000	0.187	ma120301_rel_withdbg.cz12b_sync_c32r128
0.000	0.000	0.000	32.081	67.693	0.226	0.000	0.000	0.000	0.000	0.172	ma120301_rel_withdbg.cz12c_sync_c32r128
0.000	0.000	0.000	26.806	72.906	0.288	0.000	0.000	0.000	0.000	0.159	ma120301_rel_withdbg.cz12b_sync_dw0_c32r128
0.000	0.000	0.000	33.060	66.417	0.523	0.000	0.000	0.000	0.000	0.139	ma120301_rel_withdbg.cz12c_sync_dw0_c32r128
Delete response time histogram
256us	1ms	4ms	16ms	64ms	256ms	1s	4s	16s	gt	max	tag
0.000	0.000	0.000	59.138	40.774	0.088	0.000	0.000	0.000	0.000	0.185	ma120301_rel_withdbg.cz12b_sync_c32r128
0.000	0.000	0.000	59.616	40.235	0.149	0.000	0.000	0.000	0.000	0.146	ma120301_rel_withdbg.cz12c_sync_c32r128
0.000	0.000	0.000	69.083	30.799	0.117	0.000	0.000	0.000	0.000	0.111	ma120301_rel_withdbg.cz12b_sync_dw0_c32r128
0.000	0.000	0.000	75.233	24.557	0.210	0.000	0.000	0.000	0.000	0.119	ma120301_rel_withdbg.cz12c_sync_dw0_c32r128
qp100.L2
- qp100.L2: point queries with 100 insert/s per client
- Legend for results is here.
- Each entry lists the percentage of responses that fit in that bucket (slower than max time for previous bucket, faster than min time for next bucket).
Query response time histogram
256us	1ms	4ms	16ms	64ms	256ms	1s	4s	16s	gt	max	tag
0.020	63.680	36.228	0.070	0.003	nonzero	0.000	0.000	0.000	0.000	0.129	ma120301_rel_withdbg.cz12b_sync_c32r128
0.019	61.638	38.255	0.083	0.005	nonzero	0.000	0.000	0.000	0.000	0.134	ma120301_rel_withdbg.cz12c_sync_c32r128
0.023	66.686	33.183	0.066	0.041	0.001	0.000	0.000	0.000	0.000	0.177	ma120301_rel_withdbg.cz12b_sync_dw0_c32r128
0.021	66.997	32.855	0.080	0.045	0.001	0.000	0.000	0.000	0.000	0.195	ma120301_rel_withdbg.cz12c_sync_dw0_c32r128
Insert response time histogram
256us	1ms	4ms	16ms	64ms	256ms	1s	4s	16s	gt	max	tag
0.000	0.000	0.000	0.074	99.075	0.851	0.000	0.000	0.000	0.000	0.241	ma120301_rel_withdbg.cz12b_sync_c32r128
0.000	0.000	0.000	0.074	98.415	1.511	0.000	0.000	0.000	0.000	0.228	ma120301_rel_withdbg.cz12c_sync_c32r128
0.000	0.000	0.000	0.101	90.964	8.847	0.088	0.000	0.000	0.000	0.412	ma120301_rel_withdbg.cz12b_sync_dw0_c32r128
0.000	0.000	0.000	0.109	90.469	9.312	0.110	0.000	0.000	0.000	0.421	ma120301_rel_withdbg.cz12c_sync_dw0_c32r128
Delete response time histogram
256us	1ms	4ms	16ms	64ms	256ms	1s	4s	16s	gt	max	tag
0.000	0.000	0.000	0.112	99.280	0.608	0.000	0.000	0.000	0.000	0.198	ma120301_rel_withdbg.cz12b_sync_c32r128
0.000	0.000	0.000	0.119	98.717	1.165	0.000	0.000	0.000	0.000	0.225	ma120301_rel_withdbg.cz12c_sync_c32r128
0.000	0.000	0.000	0.169	93.319	6.464	0.048	0.000	0.000	0.000	0.415	ma120301_rel_withdbg.cz12b_sync_dw0_c32r128
0.000	0.000	0.000	0.190	92.931	6.804	0.075	0.000	0.000	0.000	0.433	ma120301_rel_withdbg.cz12c_sync_dw0_c32r128
qr500.L3
- qr500.L3: range queries with 500 insert/s per client
- Legend for results is here.
- Each entry lists the percentage of responses that fit in that bucket (slower than max time for previous bucket, faster than min time for next bucket).
Query response time histogram
256us	1ms	4ms	16ms	64ms	256ms	1s	4s	16s	gt	max	tag
95.391	4.016	0.411	0.154	0.027	0.001	0.000	0.000	0.000	0.000	0.253	ma120301_rel_withdbg.cz12b_sync_c32r128
95.059	4.282	0.460	0.168	0.029	0.001	0.000	0.000	0.000	0.000	0.228	ma120301_rel_withdbg.cz12c_sync_c32r128
93.320	5.597	0.713	0.298	0.072	nonzero	0.000	0.000	0.000	0.000	0.153	ma120301_rel_withdbg.cz12b_sync_dw0_c32r128
90.982	7.444	1.108	0.372	0.094	nonzero	0.000	0.000	0.000	0.000	0.146	ma120301_rel_withdbg.cz12c_sync_dw0_c32r128
Insert response time histogram
256us	1ms	4ms	16ms	64ms	256ms	1s	4s	16s	gt	max	tag
0.000	0.000	0.000	3.854	68.963	27.044	0.139	0.000	0.000	0.000	0.433	ma120301_rel_withdbg.cz12b_sync_c32r128
0.000	0.000	0.000	4.683	67.451	27.705	0.161	0.000	0.000	0.000	0.428	ma120301_rel_withdbg.cz12c_sync_c32r128
0.000	0.000	0.000	7.253	35.290	55.492	1.965	0.000	0.000	0.000	0.412	ma120301_rel_withdbg.cz12b_sync_dw0_c32r128
0.000	0.000	0.000	1.123	20.763	69.304	8.810	0.000	0.000	0.000	0.388	ma120301_rel_withdbg.cz12c_sync_dw0_c32r128
Delete response time histogram
256us	1ms	4ms	16ms	64ms	256ms	1s	4s	16s	gt	max	tag
0.000	0.000	0.000	14.661	61.473	23.807	0.059	0.000	0.000	0.000	0.390	ma120301_rel_withdbg.cz12b_sync_c32r128
0.000	0.000	0.000	15.653	59.892	24.384	0.071	0.000	0.000	0.000	0.399	ma120301_rel_withdbg.cz12c_sync_c32r128
0.000	0.000	0.000	16.628	36.213	45.258	1.901	0.000	0.000	0.000	0.409	ma120301_rel_withdbg.cz12b_sync_dw0_c32r128
0.000	0.000	0.000	5.102	29.880	56.372	8.646	0.000	0.000	0.000	0.404	ma120301_rel_withdbg.cz12c_sync_dw0_c32r128
qp500.L4
- qp500.L4: point queries with 500 insert/s per client
- Legend for results is here.
- Each entry lists the percentage of responses that fit in that bucket (slower than max time for previous bucket, faster than min time for next bucket).
Query response time histogram
256us	1ms	4ms	16ms	64ms	256ms	1s	4s	16s	gt	max	tag
nonzero	6.853	77.673	10.751	4.657	0.066	0.000	0.000	0.000	0.000	0.183	ma120301_rel_withdbg.cz12b_sync_c32r128
nonzero	5.982	77.665	11.441	4.843	0.069	0.000	0.000	0.000	0.000	0.253	ma120301_rel_withdbg.cz12c_sync_c32r128
nonzero	12.615	81.805	2.864	2.241	0.475	0.001	0.000	0.000	0.000	0.519	ma120301_rel_withdbg.cz12b_sync_dw0_c32r128
nonzero	12.507	82.051	2.726	2.230	0.485	0.001	0.000	0.000	0.000	0.407	ma120301_rel_withdbg.cz12c_sync_dw0_c32r128
Insert response time histogram
256us	1ms	4ms	16ms	64ms	256ms	1s	4s	16s	gt	max	tag
0.000	0.000	0.000	0.053	18.364	56.194	25.389	0.000	0.000	0.000	0.654	ma120301_rel_withdbg.cz12b_sync_c32r128
0.000	0.000	0.000	0.056	14.819	58.629	26.496	0.000	0.000	0.000	0.746	ma120301_rel_withdbg.cz12c_sync_c32r128
0.000	0.000	0.000	0.052	4.903	53.291	41.753	nonzero	0.000	0.000	1.160	ma120301_rel_withdbg.cz12b_sync_dw0_c32r128
0.000	0.000	0.000	0.081	4.700	52.909	42.310	nonzero	0.000	0.000	1.038	ma120301_rel_withdbg.cz12c_sync_dw0_c32r128
Delete response time histogram
256us	1ms	4ms	16ms	64ms	256ms	1s	4s	16s	gt	max	tag
0.000	0.000	0.000	0.075	19.748	57.578	22.599	0.000	0.000	0.000	0.606	ma120301_rel_withdbg.cz12b_sync_c32r128
0.000	0.000	0.000	0.072	16.145	60.080	23.703	0.000	0.000	0.000	0.694	ma120301_rel_withdbg.cz12c_sync_c32r128
0.000	0.000	0.000	0.096	14.125	50.050	35.728	0.000	0.000	0.000	0.989	ma120301_rel_withdbg.cz12b_sync_dw0_c32r128
0.000	0.000	0.000	0.133	14.123	49.677	36.066	nonzero	0.000	0.000	1.105	ma120301_rel_withdbg.cz12c_sync_dw0_c32r128
qr1000.L5
- qr1000.L5: range queries with 1000 insert/s per client
- Legend for results is here.
- Each entry lists the percentage of responses that fit in that bucket (slower than max time for previous bucket, faster than min time for next bucket).
Query response time histogram
256us	1ms	4ms	16ms	64ms	256ms	1s	4s	16s	gt	max	tag
92.210	6.584	0.983	0.182	0.041	nonzero	0.000	0.000	0.000	0.000	0.233	ma120301_rel_withdbg.cz12b_sync_c32r128
92.155	6.646	0.975	0.182	0.042	nonzero	0.000	0.000	0.000	0.000	0.237	ma120301_rel_withdbg.cz12c_sync_c32r128
91.719	6.880	1.086	0.248	0.066	nonzero	0.000	0.000	0.000	0.000	0.178	ma120301_rel_withdbg.cz12b_sync_dw0_c32r128
91.775	6.836	1.072	0.250	0.066	nonzero	0.000	0.000	0.000	0.000	0.185	ma120301_rel_withdbg.cz12c_sync_dw0_c32r128
Insert response time histogram
256us	1ms	4ms	16ms	64ms	256ms	1s	4s	16s	gt	max	tag
0.000	0.000	0.000	0.556	24.707	53.014	21.723	0.000	0.000	0.000	0.531	ma120301_rel_withdbg.cz12b_sync_c32r128
0.000	0.000	0.000	0.642	22.900	53.889	22.569	0.000	0.000	0.000	0.510	ma120301_rel_withdbg.cz12c_sync_c32r128
0.000	0.000	0.000	0.777	20.579	61.276	17.368	0.000	0.000	0.000	0.509	ma120301_rel_withdbg.cz12b_sync_dw0_c32r128
0.000	0.000	0.000	1.364	20.014	61.151	17.472	0.000	0.000	0.000	0.466	ma120301_rel_withdbg.cz12c_sync_dw0_c32r128
Delete response time histogram
256us	1ms	4ms	16ms	64ms	256ms	1s	4s	16s	gt	max	tag
0.000	0.000	0.000	2.979	32.393	43.206	21.422	0.000	0.000	0.000	0.510	ma120301_rel_withdbg.cz12b_sync_c32r128
0.000	0.000	0.000	3.064	30.461	44.191	22.285	0.000	0.000	0.000	0.514	ma120301_rel_withdbg.cz12c_sync_c32r128
0.000	0.000	0.000	5.193	27.646	50.140	17.021	0.000	0.000	0.000	0.494	ma120301_rel_withdbg.cz12b_sync_dw0_c32r128
0.000	0.000	0.000	6.643	26.283	49.933	17.141	0.000	0.000	0.000	0.495	ma120301_rel_withdbg.cz12c_sync_dw0_c32r128
qp1000.L6
- qp1000.L6: point queries with 1000 insert/s per client
- Legend for results is here.
- Each entry lists the percentage of responses that fit in that bucket (slower than max time for previous bucket, faster than min time for next bucket).
Query response time histogram
256us	1ms	4ms	16ms	64ms	256ms	1s	4s	16s	gt	max	tag
nonzero	7.412	85.181	5.972	1.420	0.015	0.000	0.000	0.000	0.000	0.230	ma120301_rel_withdbg.cz12b_sync_c32r128
nonzero	7.346	84.543	6.531	1.561	0.019	0.000	0.000	0.000	0.000	0.224	ma120301_rel_withdbg.cz12c_sync_c32r128
nonzero	13.456	79.241	4.396	2.561	0.346	0.001	0.000	0.000	0.000	0.438	ma120301_rel_withdbg.cz12b_sync_dw0_c32r128
nonzero	13.193	79.510	4.389	2.564	0.342	0.001	0.000	0.000	0.000	0.436	ma120301_rel_withdbg.cz12c_sync_dw0_c32r128
Insert response time histogram
256us	1ms	4ms	16ms	64ms	256ms	1s	4s	16s	gt	max	tag
0.000	0.000	0.000	0.023	29.402	36.081	34.494	0.000	0.000	0.000	0.561	ma120301_rel_withdbg.cz12b_sync_c32r128
0.000	0.000	0.000	0.016	25.294	39.431	35.259	0.000	0.000	0.000	0.602	ma120301_rel_withdbg.cz12c_sync_c32r128
0.000	0.000	0.000	0.070	5.328	58.788	35.813	nonzero	0.000	0.000	1.111	ma120301_rel_withdbg.cz12b_sync_dw0_c32r128
0.000	0.000	0.000	0.091	5.410	58.658	35.841	nonzero	0.000	0.000	1.043	ma120301_rel_withdbg.cz12c_sync_dw0_c32r128
Delete response time histogram
256us	1ms	4ms	16ms	64ms	256ms	1s	4s	16s	gt	max	tag
0.000	0.000	0.000	0.030	31.048	35.412	33.510	0.000	0.000	0.000	0.562	ma120301_rel_withdbg.cz12b_sync_c32r128
0.000	0.000	0.000	0.022	27.023	38.831	34.124	0.000	0.000	0.000	0.561	ma120301_rel_withdbg.cz12c_sync_c32r128
0.000	0.000	0.000	0.098	12.009	55.980	31.913	0.000	0.000	0.000	0.969	ma120301_rel_withdbg.cz12b_sync_dw0_c32r128
0.000	0.000	0.000	0.119	12.071	55.836	31.974	0.000	0.000	0.000	0.940	ma120301_rel_withdbg.cz12c_sync_dw0_c32r128