Introduction
This is a report for the insert benchmark with 3600M docs and 12 client(s). It is generated by scripts (bash, awk, sed) and Tufte might not be impressed. An overview of the insert benchmark is here and a short update is here. Below, by DBMS, I mean DBMS+version.config. An example is my8020.c10b40 where my means MySQL, 8020 is version 8.0.20 and c10b40 is the name for the configuration file.
The test server has 32 cores, 128G RAM and 1 NVMe device. The benchmark was run with 12 clients and there were 1 or 3 connections per client (1 for queries or inserts without rate limits, 1+1 for rate limited inserts+deletes). It uses 8 tables with a table per client. It loads 300M rows per table without secondary indexes, creates 3 secondary indexes per table, then inserts 4m+1m rows per table with a delete per insert to avoid growing the table. It then does 6 read+write tests for 1800s each that do queries as fast as possible with 100,100,500,500,1000,1000 inserts/s and the same for deletes/s per client concurrent with the queries. The database is larger than RAM and most tests are IO-bound except for the range query (qr*) tests that frequently have a cached working set. Clients and the DBMS share one server.
The tested DBMS are:
- ma120301_rel_withdbg.cz12b_sync_c32r128 - MariaDB 12.3.1 with the z12b_sync_config that adds sync_binlog=1 and innodb_flush_log_at_trx_commit=1 to z12b
- ma120301_rel_withdbg.cz12c_sync_c32r128 - MariaDB 12.3.1 with the z12c_sync_config that adds innodb_flush_log_at_trx_commit=1 to z12c
- ma120301_rel_withdbg.cz12b_sync_dw0_c32r128 - MariaDB 12.3.1 with the z12b_sync_dw0_config that adds sync_binlog=1 and innodb_flush_log_at_trx_commit=1 to z12b and disables the InnoDB doublewrite buffer
- ma120301_rel_withdbg.cz12c_sync_dw0_c32r128 - MariaDB 12.3.1 with the z12c_sync_dw0_config that adds innodb_flush_log_at_trx_commit=1 to z12c and disables the InnoDB doublewrite buffer
Contents
- Summary
- l.i0: load without secondary indexes
- l.x: create secondary indexes
- l.i1: continue load after secondary indexes created with 50 inserts per transaction
- l.i2: continue load after secondary indexes created with 5 inserts per transaction
- qr100.L1: range queries with 100 insert/s per client
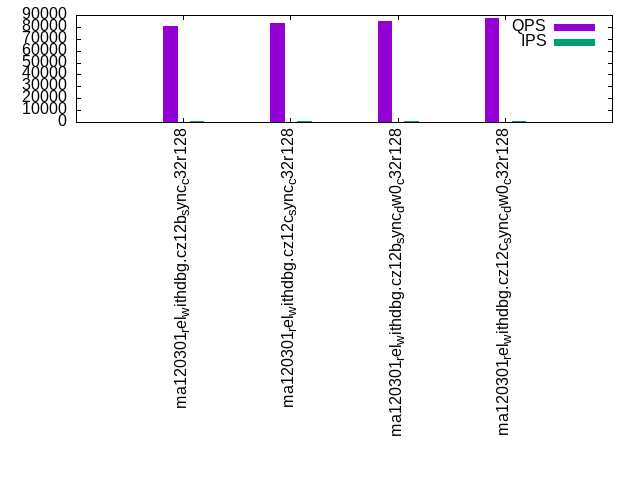
- qp100.L2: point queries with 100 insert/s per client
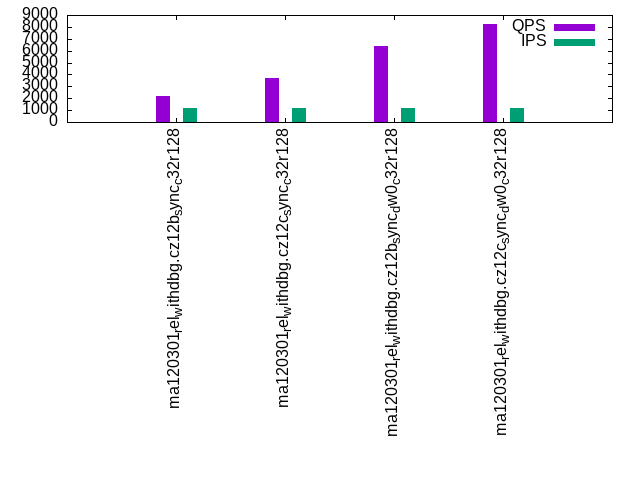
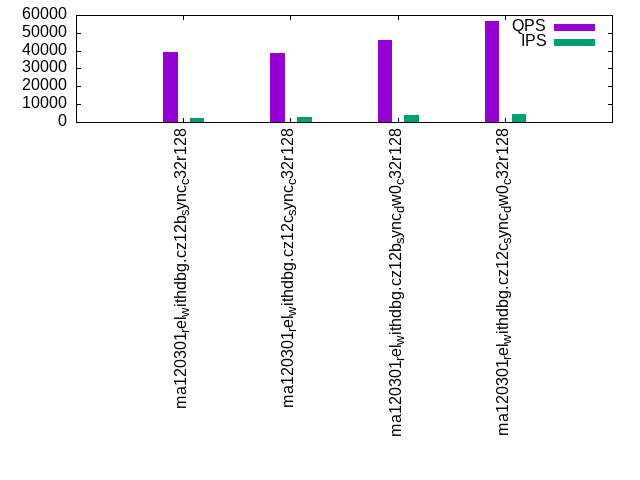
- qr500.L3: range queries with 500 insert/s per client
- qp500.L4: point queries with 500 insert/s per client
- qr1000.L5: range queries with 1000 insert/s per client
- qp1000.L6: point queries with 1000 insert/s per client
Summary
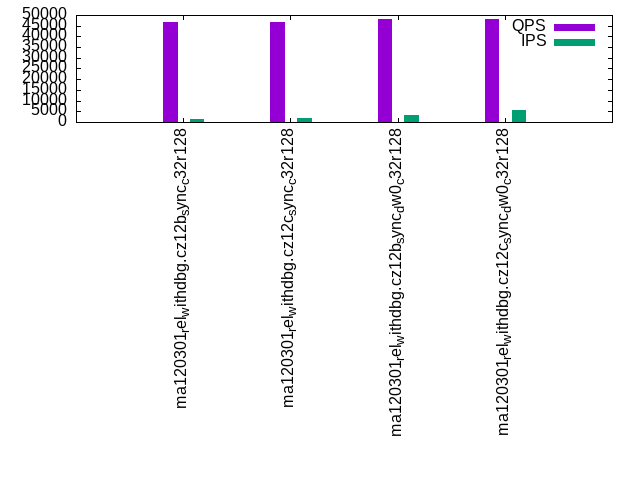
The numbers are inserts/s for l.i0, l.i1 and l.i2, indexed docs (or rows) /s for l.x and queries/s for qr100, qp100 thru qr1000, qp1000" The values are the average rate over the entire test for inserts (IPS) and queries (QPS). The range of values for IPS and QPS is split into 3 parts: bottom 25%, middle 50%, top 25%. Values in the bottom 25% have a red background, values in the top 25% have a green background and values in the middle have no color. A gray background is used for values that can be ignored because the DBMS did not sustain the target insert rate. Red backgrounds are not used when the minimum value is within 80% of the max value.
| dbms | l.i0 | l.x | l.i1 | l.i2 | qr100 | qp100 | qr500 | qp500 | qr1000 | qp1000 |
|---|---|---|---|---|---|---|---|---|---|---|
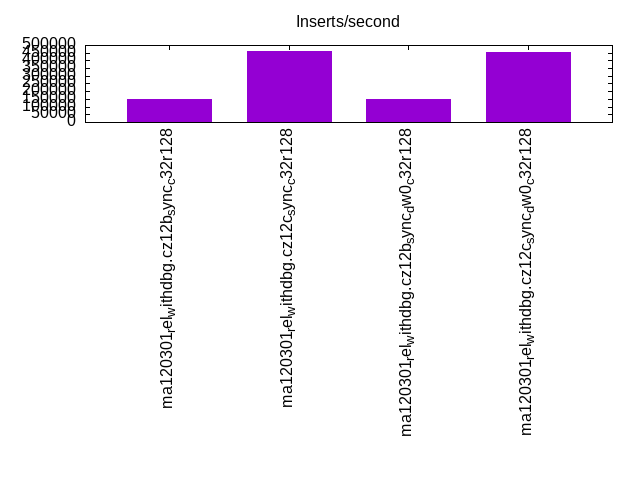
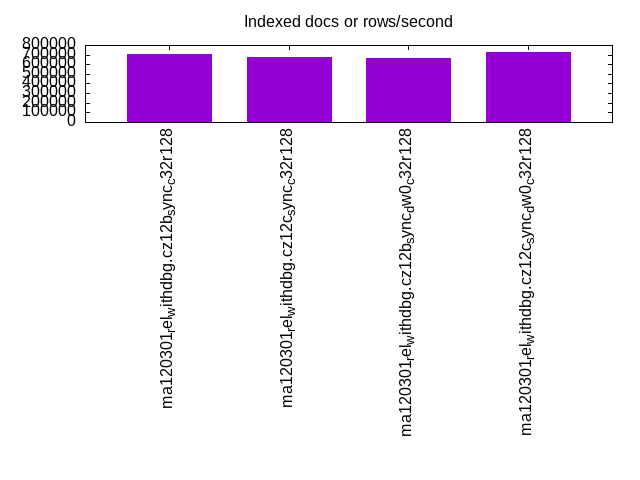
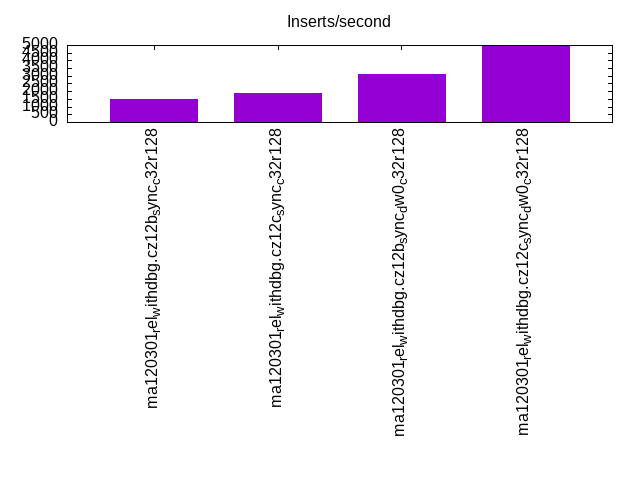
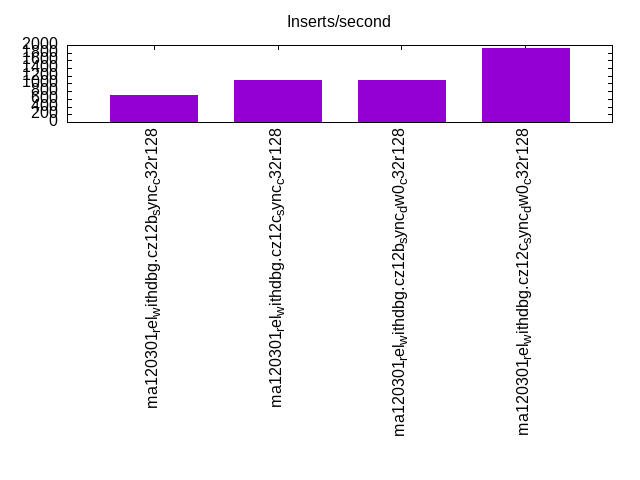
| ma120301_rel_withdbg.cz12b_sync_c32r128 | 151064 | 707686 | 1525 | 692 | 80682 | 2188 | 39430 | 572 | 46805 | 1012 |
| ma120301_rel_withdbg.cz12c_sync_c32r128 | 460594 | 678733 | 1858 | 1093 | 83659 | 3733 | 38735 | 744 | 46532 | 1242 |
| ma120301_rel_withdbg.cz12b_sync_dw0_c32r128 | 152523 | 665188 | 3138 | 1103 | 85114 | 6386 | 45711 | 879 | 47967 | 1880 |
| ma120301_rel_withdbg.cz12c_sync_dw0_c32r128 | 454087 | 728745 | 4979 | 1923 | 87164 | 8236 | 56559 | 1640 | 47961 | 2668 |
This table has relative throughput, throughput for the DBMS relative to the DBMS in the first line, using the absolute throughput from the previous table. Values less than 0.95 have a yellow background. Values greater than 1.05 have a blue background.
| dbms | l.i0 | l.x | l.i1 | l.i2 | qr100 | qp100 | qr500 | qp500 | qr1000 | qp1000 |
|---|---|---|---|---|---|---|---|---|---|---|
| ma120301_rel_withdbg.cz12b_sync_c32r128 | 1.00 | 1.00 | 1.00 | 1.00 | 1.00 | 1.00 | 1.00 | 1.00 | 1.00 | 1.00 |
| ma120301_rel_withdbg.cz12c_sync_c32r128 | 3.05 | 0.96 | 1.22 | 1.58 | 1.04 | 1.71 | 0.98 | 1.30 | 0.99 | 1.23 |
| ma120301_rel_withdbg.cz12b_sync_dw0_c32r128 | 1.01 | 0.94 | 2.06 | 1.59 | 1.05 | 2.92 | 1.16 | 1.54 | 1.02 | 1.86 |
| ma120301_rel_withdbg.cz12c_sync_dw0_c32r128 | 3.01 | 1.03 | 3.26 | 2.78 | 1.08 | 3.76 | 1.43 | 2.87 | 1.02 | 2.64 |
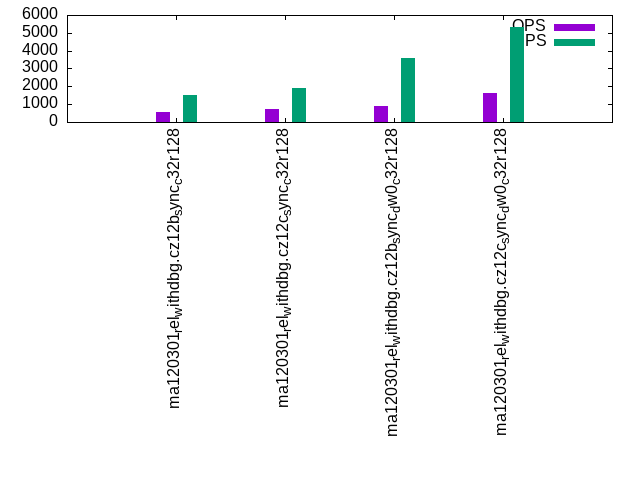
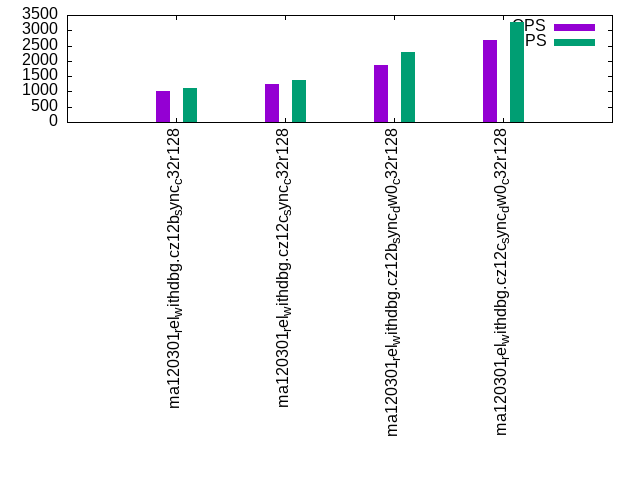
This lists the average rate of inserts/s for the tests that do inserts concurrent with queries. For such tests the query rate is listed in the table above. The read+write tests are setup so that the insert rate should match the target rate every second. Cells that are not at least 95% of the target have a red background to indicate a failure to satisfy the target.
| dbms | qr100.L1 | qp100.L2 | qr500.L3 | qp500.L4 | qr1000.L5 | qp1000.L6 |
|---|---|---|---|---|---|---|
| ma120301_rel_withdbg.cz12b_sync_c32r128 | 1193 | 1184 | 2049 | 1502 | 1470 | 1128 |
| ma120301_rel_withdbg.cz12c_sync_c32r128 | 1192 | 1192 | 2794 | 1904 | 1848 | 1363 |
| ma120301_rel_withdbg.cz12b_sync_dw0_c32r128 | 1193 | 1193 | 4127 | 3561 | 3122 | 2293 |
| ma120301_rel_withdbg.cz12c_sync_dw0_c32r128 | 1193 | 1193 | 4613 | 5341 | 5504 | 3264 |
| target | 1200 | 1200 | 6000 | 6000 | 12000 | 12000 |
l.i0
l.i0: load without secondary indexes. Graphs for performance per 1-second interval are here.
Average throughput:
Insert response time histogram: each cell has the percentage of responses that take <= the time in the header and max is the max response time in seconds. For the max column values in the top 25% of the range have a red background and in the bottom 25% of the range have a green background. The red background is not used when the min value is within 80% of the max value.
| dbms | 256us | 1ms | 4ms | 16ms | 64ms | 256ms | 1s | 4s | 16s | gt | max |
|---|---|---|---|---|---|---|---|---|---|---|---|
| ma120301_rel_withdbg.cz12b_sync_c32r128 | 0.048 | 97.902 | 1.861 | 0.190 | nonzero | 0.302 | |||||
| ma120301_rel_withdbg.cz12c_sync_c32r128 | 98.139 | 0.799 | 1.012 | 0.048 | 0.001 | nonzero | 1.842 | ||||
| ma120301_rel_withdbg.cz12b_sync_dw0_c32r128 | 0.123 | 98.099 | 1.577 | 0.198 | 0.003 | 0.348 | |||||
| ma120301_rel_withdbg.cz12c_sync_dw0_c32r128 | nonzero | 98.179 | 0.794 | 0.980 | 0.046 | 0.001 | 0.753 |
Performance metrics for the DBMS listed above. Some are normalized by throughput, others are not. Legend for results is here.
ips	qps	rps	rmbps	wps	wmbps	rpq	rkbpq	wpi	wkbpi	csps	cpups	cspq	cpupq	dbgb1	dbgb2	rss	maxop	p50	p99	tag
151064	0	0	0.0	3823.0	61.9	0.000	0.000	0.025	0.419	45765	7.8	0.303	17	236.8	337.6	101.2	0.302	12399	1899	ma120301_rel_withdbg.cz12b_sync_c32r128
460594	0	1	0.0	4971.5	180.6	0.000	0.000	0.011	0.402	87214	22.8	0.189	16	236.8	338.1	101.2	1.842	46094	2299	ma120301_rel_withdbg.cz12c_sync_c32r128
152523	0	0	0.0	3842.4	62.1	0.000	0.000	0.025	0.417	46251	7.9	0.303	17	236.8	337.6	100.2	0.348	12898	1800	ma120301_rel_withdbg.cz12b_sync_dw0_c32r128
454087	0	1	0.0	4898.1	177.4	0.000	0.000	0.011	0.400	85983	22.5	0.189	16	236.8	338.1	101.2	0.753	46694	2299	ma120301_rel_withdbg.cz12c_sync_dw0_c32r128
Average values from iostat.
r/s	rkB/s	rrqm/s	%rrqm	r_await	rareq-s	w/s	wkB/s	wrqm/s	%wrqm	w_await	wareq-s	d/s	dkB/s	drqm/s	%drqm	d_await	dareq-s	f/s	f_await	aqu-sz	%util
0.233	1.595	0.000	0.000	0.276	2.816	3823.0	63336.4	3524.5	48.01	0.744	16.54	23.58	1029.2	0.000	0.000	0.673	16.45	1262.0	0.678	2.832	97.17		ma120301_rel_withdbg.cz12b_sync_c32r128
0.704	4.874	0.003	0.046	0.478	4.056	4971.5	184957	547.5	7.237	5.022	38.65	1.527	21.42	0.000	0.000	3.284	14.75	1081.5	1.581	9.774	75.94		ma120301_rel_withdbg.cz12c_sync_c32r128
0.262	1.728	0.001	0.016	0.345	3.091	3842.4	63618.3	3546.5	48.04	0.743	16.54	23.59	631.5	0.000	0.000	0.671	10.12	1265.0	0.678	2.803	96.96		ma120301_rel_withdbg.cz12b_sync_dw0_c32r128
0.680	4.722	0.000	0.000	0.545	4.057	4898.1	181707	535.8	7.098	5.533	38.14	1.680	21.53	0.000	0.000	3.422	14.24	1062.2	1.528	10.22	75.73		ma120301_rel_withdbg.cz12c_sync_dw0_c32r128
l.x
l.x: create secondary indexes.
Average throughput:
Performance metrics for the DBMS listed above. Some are normalized by throughput, others are not. Legend for results is here.
ips	qps	rps	rmbps	wps	wmbps	rpq	rkbpq	wpi	wkbpi	csps	cpups	cspq	cpupq	dbgb1	dbgb2	rss	maxop	p50	p99	tag
707686	0	7955	660.0	8191.3	725.6	0.011	0.955	0.012	1.050	29025	17.0	0.041	8	501.7	602.5	101.5	0.014	NA	NA	ma120301_rel_withdbg.cz12b_sync_c32r128
678733	0	7605	629.7	7900.4	696.6	0.011	0.950	0.012	1.051	27469	16.7	0.040	8	501.7	603.0	101.5	0.055	NA	NA	ma120301_rel_withdbg.cz12c_sync_c32r128
665188	0	7422	614.0	7704.6	682.1	0.011	0.945	0.012	1.050	27237	16.3	0.041	8	501.7	602.5	100.5	0.019	NA	NA	ma120301_rel_withdbg.cz12b_sync_dw0_c32r128
728745	0	8198	679.8	8471.3	747.3	0.011	0.955	0.012	1.050	29880	17.7	0.041	8	501.7	603.0	101.5	0.080	NA	NA	ma120301_rel_withdbg.cz12c_sync_dw0_c32r128
Average values from iostat.
r/s	rkB/s	rrqm/s	%rrqm	r_await	rareq-s	w/s	wkB/s	wrqm/s	%wrqm	w_await	wareq-s	d/s	dkB/s	drqm/s	%drqm	d_await	dareq-s	f/s	f_await	aqu-sz	%util
7955.3	675879	0.000	0.000	1.710	111.8	8191.3	743045	177.1	1.575	41.08	104.1	7.131	57843.8	0.000	0.000	0.297	192.7	32.20	11.45	227.9	97.46		ma120301_rel_withdbg.cz12b_sync_c32r128
7604.8	644781	0.000	0.000	2.580	108.9	7900.4	713363	165.4	1.871	55.73	101.6	6.240	55874.9	0.000	0.000	0.228	302.5	35.77	19.31	213.0	94.40		ma120301_rel_withdbg.cz12c_sync_c32r128
7422.1	628756	0.000	0.000	3.461	107.4	7704.6	698442	150.8	1.874	67.82	99.10	6.749	54725.2	0.000	0.000	0.196	272.0	28.34	22.12	249.0	94.13		ma120301_rel_withdbg.cz12b_sync_dw0_c32r128
8197.5	696143	0.000	0.000	1.985	109.6	8471.3	765243	174.8	1.573	39.57	103.6	7.033	62732.6	0.000	0.000	0.177	278.7	37.53	15.56	200.8	97.16		ma120301_rel_withdbg.cz12c_sync_dw0_c32r128
l.i1
l.i1: continue load after secondary indexes created with 50 inserts per transaction. Graphs for performance per 1-second interval are here.
Average throughput:
Insert response time histogram: each cell has the percentage of responses that take <= the time in the header and max is the max response time in seconds. For the max column values in the top 25% of the range have a red background and in the bottom 25% of the range have a green background. The red background is not used when the min value is within 80% of the max value.
| dbms | 256us | 1ms | 4ms | 16ms | 64ms | 256ms | 1s | 4s | 16s | gt | max |
|---|---|---|---|---|---|---|---|---|---|---|---|
| ma120301_rel_withdbg.cz12b_sync_c32r128 | 0.002 | 15.495 | 81.251 | 3.250 | 0.002 | 6.047 | |||||
| ma120301_rel_withdbg.cz12c_sync_c32r128 | 0.050 | 46.015 | 52.955 | 0.979 | 0.002 | 5.313 | |||||
| ma120301_rel_withdbg.cz12b_sync_dw0_c32r128 | nonzero | 0.460 | 81.392 | 18.024 | 0.124 | 3.320 | |||||
| ma120301_rel_withdbg.cz12c_sync_dw0_c32r128 | 0.001 | 20.446 | 69.557 | 9.971 | 0.024 | nonzero | 5.447 |
Delete response time histogram: each cell has the percentage of responses that take <= the time in the header and max is the max response time in seconds. For the max column values in the top 25% of the range have a red background and in the bottom 25% of the range have a green background. The red background is not used when the min value is within 80% of the max value.
| dbms | 256us | 1ms | 4ms | 16ms | 64ms | 256ms | 1s | 4s | 16s | gt | max |
|---|---|---|---|---|---|---|---|---|---|---|---|
| ma120301_rel_withdbg.cz12b_sync_c32r128 | nonzero | 0.926 | 53.638 | 44.070 | 1.364 | 0.002 | 5.583 | ||||
| ma120301_rel_withdbg.cz12c_sync_c32r128 | 0.002 | 0.946 | 64.197 | 34.474 | 0.380 | 0.001 | 5.299 | ||||
| ma120301_rel_withdbg.cz12b_sync_dw0_c32r128 | 0.006 | 4.950 | 81.279 | 13.736 | 0.030 | 2.860 | |||||
| ma120301_rel_withdbg.cz12c_sync_dw0_c32r128 | 0.254 | 51.151 | 39.624 | 8.962 | 0.009 | nonzero | 4.525 |
Performance metrics for the DBMS listed above. Some are normalized by throughput, others are not. Legend for results is here.
ips	qps	rps	rmbps	wps	wmbps	rpq	rkbpq	wpi	wkbpi	csps	cpups	cspq	cpupq	dbgb1	dbgb2	rss	maxop	p50	p99	tag
1525	0	7988	124.8	8608.2	212.5	5.239	83.824	5.645	142.726	108597	3.5	71.220	735	645.8	748.2	101.3	6.047	150	0	ma120301_rel_withdbg.cz12b_sync_c32r128
1858	0	9818	153.4	10234.8	258.8	5.285	84.554	5.509	142.629	135446	4.1	72.903	706	647.3	750.1	101.3	5.313	150	50	ma120301_rel_withdbg.cz12c_sync_c32r128
3138	0	16272	254.3	15288.0	251.7	5.186	82.979	4.873	82.142	158687	5.7	50.576	581	643.2	745.4	100.3	3.320	300	50	ma120301_rel_withdbg.cz12b_sync_dw0_c32r128
4979	0	26375	412.1	23859.8	398.7	5.297	84.751	4.792	81.990	253655	8.8	50.943	566	646.4	749.1	101.3	5.447	400	100	ma120301_rel_withdbg.cz12c_sync_dw0_c32r128
Average values from iostat.
r/s	rkB/s	rrqm/s	%rrqm	r_await	rareq-s	w/s	wkB/s	wrqm/s	%wrqm	w_await	wareq-s	d/s	dkB/s	drqm/s	%drqm	d_await	dareq-s	f/s	f_await	aqu-sz	%util
7988.5	127815	0.000	0.000	1.349	16.00	8608.2	217628	695.4	7.263	1.403	25.29	0.006	0.088	0.000	0.000	0.162	0.436	781.8	1.733	19.86	98.65		ma120301_rel_withdbg.cz12b_sync_c32r128
9818.3	157093	0.000	0.000	1.086	16.00	10234.8	264990	469.3	4.089	1.026	25.91	0.368	151.0	0.000	0.000	3.839	344.4	832.2	1.235	18.22	97.89		ma120301_rel_withdbg.cz12c_sync_c32r128
16272.3	260356	0.000	0.000	1.374	16.00	15288.0	257728	915.1	5.599	9.298	16.85	0.091	35.06	0.000	0.000	0.566	19.24	369.5	2.661	128.0	99.73		ma120301_rel_withdbg.cz12b_sync_dw0_c32r128
26374.6	421993	0.000	0.000	0.734	16.00	23859.8	408243	248.1	0.990	6.882	17.12	4.398	1509.9	0.000	0.000	2.839	246.3	250.6	2.426	150.7	99.06		ma120301_rel_withdbg.cz12c_sync_dw0_c32r128
l.i2
l.i2: continue load after secondary indexes created with 5 inserts per transaction. Graphs for performance per 1-second interval are here.
Average throughput:
Insert response time histogram: each cell has the percentage of responses that take <= the time in the header and max is the max response time in seconds. For the max column values in the top 25% of the range have a red background and in the bottom 25% of the range have a green background. The red background is not used when the min value is within 80% of the max value.
| dbms | 256us | 1ms | 4ms | 16ms | 64ms | 256ms | 1s | 4s | 16s | gt | max |
|---|---|---|---|---|---|---|---|---|---|---|---|
| ma120301_rel_withdbg.cz12b_sync_c32r128 | 0.086 | 44.625 | 54.634 | 0.655 | nonzero | 1.039 | |||||
| ma120301_rel_withdbg.cz12c_sync_c32r128 | nonzero | 6.456 | 63.041 | 30.451 | 0.052 | nonzero | 1.123 | ||||
| ma120301_rel_withdbg.cz12b_sync_dw0_c32r128 | 1.858 | 68.360 | 29.641 | 0.139 | 0.001 | 1.969 | |||||
| ma120301_rel_withdbg.cz12c_sync_dw0_c32r128 | 0.003 | 24.690 | 64.886 | 10.400 | 0.021 | nonzero | 1.023 |
Delete response time histogram: each cell has the percentage of responses that take <= the time in the header and max is the max response time in seconds. For the max column values in the top 25% of the range have a red background and in the bottom 25% of the range have a green background. The red background is not used when the min value is within 80% of the max value.
| dbms | 256us | 1ms | 4ms | 16ms | 64ms | 256ms | 1s | 4s | 16s | gt | max |
|---|---|---|---|---|---|---|---|---|---|---|---|
| ma120301_rel_withdbg.cz12b_sync_c32r128 | 0.193 | 49.344 | 50.089 | 0.374 | nonzero | 1.051 | |||||
| ma120301_rel_withdbg.cz12c_sync_c32r128 | 0.001 | 11.061 | 60.203 | 28.694 | 0.041 | nonzero | 1.036 | ||||
| ma120301_rel_withdbg.cz12b_sync_dw0_c32r128 | 2.504 | 69.666 | 27.727 | 0.102 | 0.001 | 1.880 | |||||
| ma120301_rel_withdbg.cz12c_sync_dw0_c32r128 | 0.011 | 42.413 | 48.962 | 8.599 | 0.016 | 0.861 |
Performance metrics for the DBMS listed above. Some are normalized by throughput, others are not. Legend for results is here.
ips	qps	rps	rmbps	wps	wmbps	rpq	rkbpq	wpi	wkbpi	csps	cpups	cspq	cpupq	dbgb1	dbgb2	rss	maxop	p50	p99	tag
692	0	5587	87.3	5888.7	138.1	8.078	129.248	8.515	204.444	64544	2.3	93.326	1064	645.8	748.2	101.3	1.039	45	20	ma120301_rel_withdbg.cz12b_sync_c32r128
1093	0	8761	136.9	8535.3	212.3	8.018	128.294	7.812	199.005	102250	3.6	93.584	1054	647.3	750.1	101.3	1.123	65	30	ma120301_rel_withdbg.cz12c_sync_c32r128
1103	0	8800	137.5	7791.5	119.5	7.980	127.686	7.066	111.001	87613	3.4	79.453	987	643.2	745.4	100.3	1.969	70	25	ma120301_rel_withdbg.cz12b_sync_dw0_c32r128
1923	0	15031	234.9	12303.4	198.0	7.817	125.080	6.399	105.433	141321	5.5	73.501	915	646.4	749.1	101.3	1.023	120	45	ma120301_rel_withdbg.cz12c_sync_dw0_c32r128
Average values from iostat.
r/s	rkB/s	rrqm/s	%rrqm	r_await	rareq-s	w/s	wkB/s	wrqm/s	%wrqm	w_await	wareq-s	d/s	dkB/s	drqm/s	%drqm	d_await	dareq-s	f/s	f_await	aqu-sz	%util
5586.8	89388.1	0.000	0.000	1.923	16.00	5888.7	141394	428.4	6.873	2.679	24.00	0.003	0.013	0.000	0.000	0.092	0.063	727.9	2.545	24.16	99.86		ma120301_rel_withdbg.cz12b_sync_c32r128
8760.9	140174	0.000	0.000	1.304	16.00	8535.3	217433	3.506	0.043	1.662	25.48	0.147	1.162	0.000	0.000	1.967	3.276	871.3	1.811	21.59	99.52		ma120301_rel_withdbg.cz12c_sync_c32r128
8800.0	140799	0.000	0.000	1.592	16.00	7791.5	122401	631.7	7.538	7.505	15.68	0.003	0.039	0.000	0.000	0.075	0.193	490.2	2.347	60.15	99.85		ma120301_rel_withdbg.cz12b_sync_dw0_c32r128
15030.7	240491	0.000	0.000	1.151	16.00	12303.4	202716	33.61	0.274	4.267	16.47	1.797	7.204	0.000	0.000	1.607	1.657	427.2	2.190	56.38	99.57		ma120301_rel_withdbg.cz12c_sync_dw0_c32r128
qr100.L1
qr100.L1: range queries with 100 insert/s per client. Graphs for performance per 1-second interval are here.
Average throughput:
Query response time histogram: each cell has the percentage of responses that take <= the time in the header and max is the max response time in seconds. For max values in the top 25% of the range have a red background and in the bottom 25% of the range have a green background. The red background is not used when the min value is within 80% of the max value.
| dbms | 256us | 1ms | 4ms | 16ms | 64ms | 256ms | 1s | 4s | 16s | gt | max |
|---|---|---|---|---|---|---|---|---|---|---|---|
| ma120301_rel_withdbg.cz12b_sync_c32r128 | 99.257 | 0.517 | 0.179 | 0.028 | 0.017 | 0.002 | nonzero | 0.437 | |||
| ma120301_rel_withdbg.cz12c_sync_c32r128 | 99.376 | 0.481 | 0.117 | 0.019 | 0.007 | 0.001 | nonzero | 0.422 | |||
| ma120301_rel_withdbg.cz12b_sync_dw0_c32r128 | 99.396 | 0.466 | 0.125 | 0.007 | 0.006 | nonzero | nonzero | nonzero | 1.321 | ||
| ma120301_rel_withdbg.cz12c_sync_dw0_c32r128 | 99.514 | 0.413 | 0.069 | 0.002 | 0.001 | nonzero | nonzero | 0.272 |
Insert response time histogram: each cell has the percentage of responses that take <= the time in the header and max is the max response time in seconds. For max values in the top 25% of the range have a red background and in the bottom 25% of the range have a green background. The red background is not used when the min value is within 80% of the max value.
| dbms | 256us | 1ms | 4ms | 16ms | 64ms | 256ms | 1s | 4s | 16s | gt | max |
|---|---|---|---|---|---|---|---|---|---|---|---|
| ma120301_rel_withdbg.cz12b_sync_c32r128 | 0.028 | 68.970 | 22.162 | 8.558 | 0.282 | 1.549 | |||||
| ma120301_rel_withdbg.cz12c_sync_c32r128 | 3.146 | 81.204 | 12.799 | 2.801 | 0.051 | 1.236 | |||||
| ma120301_rel_withdbg.cz12b_sync_dw0_c32r128 | 0.130 | 86.275 | 11.609 | 1.787 | 0.199 | 1.928 | |||||
| ma120301_rel_withdbg.cz12c_sync_dw0_c32r128 | 8.319 | 85.475 | 5.924 | 0.282 | 0.746 |
Delete response time histogram: each cell has the percentage of responses that take <= the time in the header and max is the max response time in seconds. For max values in the top 25% of the range have a red background and in the bottom 25% of the range have a green background. The red background is not used when the min value is within 80% of the max value.
| dbms | 256us | 1ms | 4ms | 16ms | 64ms | 256ms | 1s | 4s | 16s | gt | max |
|---|---|---|---|---|---|---|---|---|---|---|---|
| ma120301_rel_withdbg.cz12b_sync_c32r128 | 1.704 | 78.595 | 12.532 | 7.097 | 0.072 | 1.353 | |||||
| ma120301_rel_withdbg.cz12c_sync_c32r128 | 12.690 | 73.451 | 11.590 | 2.264 | 0.005 | 1.109 | |||||
| ma120301_rel_withdbg.cz12b_sync_dw0_c32r128 | 2.833 | 88.148 | 7.824 | 1.028 | 0.167 | 1.871 | |||||
| ma120301_rel_withdbg.cz12c_sync_dw0_c32r128 | 19.954 | 75.405 | 4.481 | 0.160 | 0.689 |
Performance metrics for the DBMS listed above. Some are normalized by throughput, others are not. Legend for results is here.
ips	qps	rps	rmbps	wps	wmbps	rpq	rkbpq	wpi	wkbpi	csps	cpups	cspq	cpupq	dbgb1	dbgb2	rss	maxop	p50	p99	tag
1193	80682	5462	85.3	3278.9	82.9	0.068	1.083	2.749	71.133	502261	38.5	6.225	153	645.8	748.2	101.3	0.437	7279	1216	ma120301_rel_withdbg.cz12b_sync_c32r128
1192	83659	5433	84.9	3121.9	82.1	0.065	1.039	2.619	70.543	517438	39.7	6.185	152	647.3	750.1	101.3	0.422	7327	2000	ma120301_rel_withdbg.cz12c_sync_c32r128
1193	85114	5491	85.8	2757.8	46.1	0.065	1.032	2.312	39.606	525023	40.2	6.168	151	643.2	745.4	100.3	1.321	7327	3104	ma120301_rel_withdbg.cz12b_sync_dw0_c32r128
1193	87164	5419	84.7	2610.2	45.2	0.062	0.995	2.188	38.796	535773	40.7	6.147	149	646.4	749.1	101.3	0.272	7407	4879	ma120301_rel_withdbg.cz12c_sync_dw0_c32r128
Average values from iostat.
r/s	rkB/s	rrqm/s	%rrqm	r_await	rareq-s	w/s	wkB/s	wrqm/s	%wrqm	w_await	wareq-s	d/s	dkB/s	drqm/s	%drqm	d_await	dareq-s	f/s	f_await	aqu-sz	%util
5461.7	87387.3	0.000	0.000	0.662	16.00	3278.9	84840.5	208.8	12.32	0.689	25.96	0.007	0.080	0.000	0.000	0.108	0.398	339.7	1.004	5.724	37.86		ma120301_rel_withdbg.cz12b_sync_c32r128
5433.4	86933.7	0.000	0.000	0.419	16.00	3121.9	84087.4	9.272	1.408	0.451	30.19	0.007	0.119	0.000	0.000	0.084	0.530	274.3	0.800	3.700	32.41		ma120301_rel_withdbg.cz12c_sync_c32r128
5490.8	87853.4	0.000	0.000	0.475	16.00	2757.8	47238.1	212.5	12.78	2.772	18.49	0.007	0.088	0.000	0.000	0.094	0.365	133.0	1.020	12.92	23.85		ma120301_rel_withdbg.cz12b_sync_dw0_c32r128
5419.3	86708.4	0.000	0.000	0.236	16.00	2610.2	46271.6	10.40	1.646	1.108	22.29	0.003	0.020	0.000	0.000	0.014	0.061	64.81	0.778	5.433	17.06		ma120301_rel_withdbg.cz12c_sync_dw0_c32r128
qp100.L2
qp100.L2: point queries with 100 insert/s per client. Graphs for performance per 1-second interval are here.
Average throughput:
Query response time histogram: each cell has the percentage of responses that take <= the time in the header and max is the max response time in seconds. For max values in the top 25% of the range have a red background and in the bottom 25% of the range have a green background. The red background is not used when the min value is within 80% of the max value.
| dbms | 256us | 1ms | 4ms | 16ms | 64ms | 256ms | 1s | 4s | 16s | gt | max |
|---|---|---|---|---|---|---|---|---|---|---|---|
| ma120301_rel_withdbg.cz12b_sync_c32r128 | 0.001 | 10.698 | 42.917 | 42.520 | 3.427 | 0.430 | 0.006 | 0.001 | 1.853 | ||
| ma120301_rel_withdbg.cz12c_sync_c32r128 | 0.002 | 21.865 | 50.737 | 25.730 | 1.584 | 0.079 | 0.002 | nonzero | 1.008 | ||
| ma120301_rel_withdbg.cz12b_sync_dw0_c32r128 | 0.004 | 38.945 | 52.819 | 7.699 | 0.494 | 0.039 | nonzero | 0.424 | |||
| ma120301_rel_withdbg.cz12c_sync_dw0_c32r128 | 0.005 | 44.027 | 51.296 | 4.474 | 0.185 | 0.011 | nonzero | 0.785 |
Insert response time histogram: each cell has the percentage of responses that take <= the time in the header and max is the max response time in seconds. For max values in the top 25% of the range have a red background and in the bottom 25% of the range have a green background. The red background is not used when the min value is within 80% of the max value.
| dbms | 256us | 1ms | 4ms | 16ms | 64ms | 256ms | 1s | 4s | 16s | gt | max |
|---|---|---|---|---|---|---|---|---|---|---|---|
| ma120301_rel_withdbg.cz12b_sync_c32r128 | 16.863 | 66.569 | 15.148 | 1.419 | 2.829 | ||||||
| ma120301_rel_withdbg.cz12c_sync_c32r128 | 0.014 | 46.822 | 46.542 | 6.296 | 0.326 | 1.638 | |||||
| ma120301_rel_withdbg.cz12b_sync_dw0_c32r128 | 0.005 | 7.690 | 86.213 | 5.708 | 0.384 | 1.632 | |||||
| ma120301_rel_withdbg.cz12c_sync_dw0_c32r128 | 0.007 | 40.088 | 56.613 | 3.188 | 0.104 | 2.029 |
Delete response time histogram: each cell has the percentage of responses that take <= the time in the header and max is the max response time in seconds. For max values in the top 25% of the range have a red background and in the bottom 25% of the range have a green background. The red background is not used when the min value is within 80% of the max value.
| dbms | 256us | 1ms | 4ms | 16ms | 64ms | 256ms | 1s | 4s | 16s | gt | max |
|---|---|---|---|---|---|---|---|---|---|---|---|
| ma120301_rel_withdbg.cz12b_sync_c32r128 | 0.037 | 26.556 | 57.792 | 14.810 | 0.806 | 2.758 | |||||
| ma120301_rel_withdbg.cz12c_sync_c32r128 | 1.435 | 61.854 | 31.424 | 5.176 | 0.111 | 1.346 | |||||
| ma120301_rel_withdbg.cz12b_sync_dw0_c32r128 | 0.049 | 16.926 | 77.468 | 5.373 | 0.185 | 1.343 | |||||
| ma120301_rel_withdbg.cz12c_sync_dw0_c32r128 | 0.382 | 66.183 | 30.954 | 2.440 | 0.042 | 1.894 |
Performance metrics for the DBMS listed above. Some are normalized by throughput, others are not. Legend for results is here.
ips	qps	rps	rmbps	wps	wmbps	rpq	rkbpq	wpi	wkbpi	csps	cpups	cspq	cpupq	dbgb1	dbgb2	rss	maxop	p50	p99	tag
1184	2188	22684	354.4	8506.1	212.9	10.368	165.892	7.187	184.250	128374	5.1	58.677	746	645.8	748.2	101.3	1.853	144	0	ma120301_rel_withdbg.cz12b_sync_c32r128
1192	3733	32606	509.5	8710.3	223.9	8.735	139.758	7.307	192.375	155193	6.4	41.575	549	647.3	750.1	101.3	1.008	304	16	ma120301_rel_withdbg.cz12c_sync_c32r128
1193	6386	49166	768.2	7952.0	125.5	7.699	123.189	6.667	107.708	198812	8.5	31.134	426	643.2	745.4	100.3	0.424	592	16	ma120301_rel_withdbg.cz12b_sync_dw0_c32r128
1193	8236	60293	942.1	7885.7	125.8	7.321	117.129	6.612	108.007	231685	10.1	28.130	392	646.4	749.1	101.3	0.785	752	48	ma120301_rel_withdbg.cz12c_sync_dw0_c32r128
Average values from iostat.
r/s	rkB/s	rrqm/s	%rrqm	r_await	rareq-s	w/s	wkB/s	wrqm/s	%wrqm	w_await	wareq-s	d/s	dkB/s	drqm/s	%drqm	d_await	dareq-s	f/s	f_await	aqu-sz	%util
22683.6	362938	0.000	0.000	1.001	16.00	8506.1	218060	269.3	3.480	1.433	25.67	0.010	0.112	0.000	0.000	0.159	0.460	672.4	1.825	25.09	99.40		ma120301_rel_withdbg.cz12b_sync_c32r128
32606.4	521702	0.000	0.000	0.560	16.00	8710.3	229311	29.66	0.404	0.853	26.46	0.006	0.057	0.000	0.000	0.091	0.243	567.7	1.422	20.03	99.43		ma120301_rel_withdbg.cz12c_sync_c32r128
49165.5	786648	0.000	0.000	0.509	16.00	7952.0	128464	231.4	3.568	2.243	16.22	0.007	0.049	0.000	0.000	0.095	0.169	224.7	1.847	30.28	99.25		ma120301_rel_withdbg.cz12b_sync_dw0_c32r128
60293.0	964688	0.000	0.000	0.271	16.00	7885.7	128820	20.58	0.327	2.327	16.44	0.006	0.049	0.000	0.000	0.099	0.243	172.5	1.421	32.42	98.96		ma120301_rel_withdbg.cz12c_sync_dw0_c32r128
qr500.L3
qr500.L3: range queries with 500 insert/s per client. Graphs for performance per 1-second interval are here.
Average throughput:
Query response time histogram: each cell has the percentage of responses that take <= the time in the header and max is the max response time in seconds. For max values in the top 25% of the range have a red background and in the bottom 25% of the range have a green background. The red background is not used when the min value is within 80% of the max value.
| dbms | 256us | 1ms | 4ms | 16ms | 64ms | 256ms | 1s | 4s | 16s | gt | max |
|---|---|---|---|---|---|---|---|---|---|---|---|
| ma120301_rel_withdbg.cz12b_sync_c32r128 | 94.386 | 3.516 | 1.407 | 0.449 | 0.227 | 0.015 | nonzero | nonzero | 1.231 | ||
| ma120301_rel_withdbg.cz12c_sync_c32r128 | 93.787 | 3.934 | 1.510 | 0.564 | 0.194 | 0.011 | nonzero | 0.622 | |||
| ma120301_rel_withdbg.cz12b_sync_dw0_c32r128 | 92.541 | 4.026 | 3.024 | 0.353 | 0.053 | 0.002 | nonzero | 0.824 | |||
| ma120301_rel_withdbg.cz12c_sync_dw0_c32r128 | 96.772 | 2.485 | 0.562 | 0.086 | 0.083 | 0.010 | 0.003 | nonzero | 2.000 |
Insert response time histogram: each cell has the percentage of responses that take <= the time in the header and max is the max response time in seconds. For max values in the top 25% of the range have a red background and in the bottom 25% of the range have a green background. The red background is not used when the min value is within 80% of the max value.
| dbms | 256us | 1ms | 4ms | 16ms | 64ms | 256ms | 1s | 4s | 16s | gt | max |
|---|---|---|---|---|---|---|---|---|---|---|---|
| ma120301_rel_withdbg.cz12b_sync_c32r128 | 0.139 | 52.126 | 47.139 | 0.596 | 1.897 | ||||||
| ma120301_rel_withdbg.cz12c_sync_c32r128 | 0.001 | 1.660 | 81.969 | 16.284 | 0.086 | 1.554 | |||||
| ma120301_rel_withdbg.cz12b_sync_dw0_c32r128 | 0.027 | 14.721 | 79.832 | 5.310 | 0.111 | 1.996 | |||||
| ma120301_rel_withdbg.cz12c_sync_dw0_c32r128 | 11.962 | 68.603 | 14.960 | 3.063 | 1.412 | nonzero | 4.073 |
Delete response time histogram: each cell has the percentage of responses that take <= the time in the header and max is the max response time in seconds. For max values in the top 25% of the range have a red background and in the bottom 25% of the range have a green background. The red background is not used when the min value is within 80% of the max value.
| dbms | 256us | 1ms | 4ms | 16ms | 64ms | 256ms | 1s | 4s | 16s | gt | max |
|---|---|---|---|---|---|---|---|---|---|---|---|
| ma120301_rel_withdbg.cz12b_sync_c32r128 | 0.804 | 73.884 | 25.111 | 0.201 | 1.734 | ||||||
| ma120301_rel_withdbg.cz12c_sync_c32r128 | 0.019 | 2.144 | 85.635 | 12.169 | 0.033 | 1.449 | |||||
| ma120301_rel_withdbg.cz12b_sync_dw0_c32r128 | 0.292 | 16.174 | 79.824 | 3.667 | 0.044 | 1.544 | |||||
| ma120301_rel_withdbg.cz12c_sync_dw0_c32r128 | 25.250 | 58.443 | 11.755 | 3.282 | 1.271 | 3.597 |
Performance metrics for the DBMS listed above. Some are normalized by throughput, others are not. Legend for results is here.
ips	qps	rps	rmbps	wps	wmbps	rpq	rkbpq	wpi	wkbpi	csps	cpups	cspq	cpupq	dbgb1	dbgb2	rss	maxop	p50	p99	tag
2049	39430	7912	123.6	8058.6	197.7	0.201	3.211	3.932	98.803	351522	25.9	8.915	210	645.8	748.2	101.3	1.231	3280	336	ma120301_rel_withdbg.cz12b_sync_c32r128
2794	38735	10718	167.5	10315.1	261.8	0.277	4.427	3.691	95.933	393332	27.3	10.155	226	647.3	750.1	101.3	0.622	3232	688	ma120301_rel_withdbg.cz12c_sync_c32r128
4127	45711	17066	266.7	14102.7	225.2	0.373	5.974	3.417	55.874	406957	32.5	8.903	228	643.2	745.4	100.4	0.824	3936	384	ma120301_rel_withdbg.cz12b_sync_dw0_c32r128
4613	56559	19761	308.8	15199.9	252.8	0.349	5.590	3.295	56.102	500933	35.9	8.857	203	646.4	749.1	101.3	2.000	5679	64	ma120301_rel_withdbg.cz12c_sync_dw0_c32r128
Average values from iostat.
r/s	rkB/s	rrqm/s	%rrqm	r_await	rareq-s	w/s	wkB/s	wrqm/s	%wrqm	w_await	wareq-s	d/s	dkB/s	drqm/s	%drqm	d_await	dareq-s	f/s	f_await	aqu-sz	%util
7912.1	126594	0.000	0.000	1.466	16.00	8058.6	202477	415.6	4.923	1.509	25.13	0.005	0.021	0.000	0.000	0.120	0.093	814.1	1.842	21.05	98.66		ma120301_rel_withdbg.cz12b_sync_c32r128
10717.6	171481	0.000	0.000	1.130	16.00	10315.1	268065	7.110	0.073	1.141	26.01	0.187	1.278	0.000	0.000	1.943	2.947	909.9	1.281	20.54	97.55		ma120301_rel_withdbg.cz12c_sync_c32r128
17066.5	273065	0.000	0.000	1.621	16.00	14102.7	230581	773.4	5.651	11.30	16.39	0.015	0.101	0.000	0.000	0.264	0.299	437.9	2.525	152.3	99.85		ma120301_rel_withdbg.cz12b_sync_dw0_c32r128
19760.8	316172	0.000	0.000	2.075	16.00	15199.9	258822	21.87	0.171	42.94	17.02	0.951	7.258	0.000	0.000	2.974	2.946	201.1	6.084	379.3	84.87		ma120301_rel_withdbg.cz12c_sync_dw0_c32r128
qp500.L4
qp500.L4: point queries with 500 insert/s per client. Graphs for performance per 1-second interval are here.
Average throughput:
Query response time histogram: each cell has the percentage of responses that take <= the time in the header and max is the max response time in seconds. For max values in the top 25% of the range have a red background and in the bottom 25% of the range have a green background. The red background is not used when the min value is within 80% of the max value.
| dbms | 256us | 1ms | 4ms | 16ms | 64ms | 256ms | 1s | 4s | 16s | gt | max |
|---|---|---|---|---|---|---|---|---|---|---|---|
| ma120301_rel_withdbg.cz12b_sync_c32r128 | 0.036 | 3.646 | 47.070 | 45.852 | 3.384 | 0.012 | nonzero | 1.010 | |||
| ma120301_rel_withdbg.cz12c_sync_c32r128 | nonzero | 0.048 | 4.635 | 59.091 | 34.011 | 2.209 | 0.006 | 0.744 | |||
| ma120301_rel_withdbg.cz12b_sync_dw0_c32r128 | 0.010 | 10.583 | 59.922 | 28.800 | 0.673 | 0.011 | nonzero | 1.370 | |||
| ma120301_rel_withdbg.cz12c_sync_dw0_c32r128 | 0.039 | 30.729 | 64.806 | 4.174 | 0.246 | 0.006 | 0.702 |
Insert response time histogram: each cell has the percentage of responses that take <= the time in the header and max is the max response time in seconds. For max values in the top 25% of the range have a red background and in the bottom 25% of the range have a green background. The red background is not used when the min value is within 80% of the max value.
| dbms | 256us | 1ms | 4ms | 16ms | 64ms | 256ms | 1s | 4s | 16s | gt | max |
|---|---|---|---|---|---|---|---|---|---|---|---|
| ma120301_rel_withdbg.cz12b_sync_c32r128 | 18.134 | 78.848 | 3.019 | 2.737 | |||||||
| ma120301_rel_withdbg.cz12c_sync_c32r128 | 0.004 | 57.488 | 41.662 | 0.846 | 2.446 | ||||||
| ma120301_rel_withdbg.cz12b_sync_dw0_c32r128 | 0.001 | 5.019 | 86.201 | 8.711 | 0.068 | 2.928 | |||||
| ma120301_rel_withdbg.cz12c_sync_dw0_c32r128 | 0.044 | 32.049 | 64.654 | 3.232 | 0.020 | 1.818 |
Delete response time histogram: each cell has the percentage of responses that take <= the time in the header and max is the max response time in seconds. For max values in the top 25% of the range have a red background and in the bottom 25% of the range have a green background. The red background is not used when the min value is within 80% of the max value.
| dbms | 256us | 1ms | 4ms | 16ms | 64ms | 256ms | 1s | 4s | 16s | gt | max |
|---|---|---|---|---|---|---|---|---|---|---|---|
| ma120301_rel_withdbg.cz12b_sync_c32r128 | 0.001 | 37.749 | 60.318 | 1.933 | 2.167 | ||||||
| ma120301_rel_withdbg.cz12c_sync_c32r128 | 0.013 | 60.605 | 38.881 | 0.501 | 1.953 | ||||||
| ma120301_rel_withdbg.cz12b_sync_dw0_c32r128 | 8.731 | 84.409 | 6.830 | 0.031 | 2.658 | ||||||
| ma120301_rel_withdbg.cz12c_sync_dw0_c32r128 | 0.113 | 47.213 | 49.905 | 2.753 | 0.015 | 1.722 |
Performance metrics for the DBMS listed above. Some are normalized by throughput, others are not. Legend for results is here.
ips	qps	rps	rmbps	wps	wmbps	rpq	rkbpq	wpi	wkbpi	csps	cpups	cspq	cpupq	dbgb1	dbgb2	rss	maxop	p50	p99	tag
1502	572	12022	187.8	8280.2	203.3	21.000	335.994	5.511	138.586	139625	4.2	243.886	2348	645.9	748.3	101.3	1.010	32	0	ma120301_rel_withdbg.cz12b_sync_c32r128
1904	744	15429	241.1	10208.2	257.3	20.750	331.993	5.361	138.391	177041	5.0	238.086	2152	647.3	750.2	101.3	0.744	48	16	ma120301_rel_withdbg.cz12c_sync_c32r128
3561	879	22907	357.9	15114.9	235.9	26.058	416.924	4.245	67.827	154419	6.5	175.656	2366	643.2	745.4	100.4	1.370	64	16	ma120301_rel_withdbg.cz12b_sync_dw0_c32r128
5341	1640	38347	599.2	21920.7	351.7	23.383	374.121	4.104	67.420	259832	10.4	158.434	2029	646.4	749.1	101.3	0.702	144	16	ma120301_rel_withdbg.cz12c_sync_dw0_c32r128
Average values from iostat.
r/s	rkB/s	rrqm/s	%rrqm	r_await	rareq-s	w/s	wkB/s	wrqm/s	%wrqm	w_await	wareq-s	d/s	dkB/s	drqm/s	%drqm	d_await	dareq-s	f/s	f_await	aqu-sz	%util
12022.3	192357	0.000	0.000	1.366	16.00	8280.2	208226	327.6	3.831	1.332	25.14	0.005	0.022	0.000	0.000	0.144	0.090	800.8	1.744	24.49	98.99		ma120301_rel_withdbg.cz12b_sync_c32r128
15429.4	246870	0.000	0.000	1.189	16.00	10208.2	263497	7.111	0.072	1.188	25.81	0.161	0.658	0.000	0.000	1.809	1.526	888.4	1.251	26.48	98.46		ma120301_rel_withdbg.cz12c_sync_c32r128
22907.3	366518	0.000	0.000	1.745	16.00	15114.9	241520	660.8	4.220	12.92	15.97	0.012	0.086	0.000	0.000	0.372	0.329	402.5	2.897	197.9	99.88		ma120301_rel_withdbg.cz12b_sync_dw0_c32r128
38347.4	613558	0.000	0.000	0.996	16.00	21920.7	360102	56.37	0.271	8.804	16.43	1.813	7.299	0.000	0.000	1.140	1.111	294.4	2.834	145.0	99.52		ma120301_rel_withdbg.cz12c_sync_dw0_c32r128
qr1000.L5
qr1000.L5: range queries with 1000 insert/s per client. Graphs for performance per 1-second interval are here.
Average throughput:
Query response time histogram: each cell has the percentage of responses that take <= the time in the header and max is the max response time in seconds. For max values in the top 25% of the range have a red background and in the bottom 25% of the range have a green background. The red background is not used when the min value is within 80% of the max value.
| dbms | 256us | 1ms | 4ms | 16ms | 64ms | 256ms | 1s | 4s | 16s | gt | max |
|---|---|---|---|---|---|---|---|---|---|---|---|
| ma120301_rel_withdbg.cz12b_sync_c32r128 | 93.607 | 4.322 | 1.673 | 0.305 | 0.089 | 0.003 | nonzero | nonzero | 3.833 | ||
| ma120301_rel_withdbg.cz12c_sync_c32r128 | 92.952 | 5.083 | 1.529 | 0.355 | 0.079 | 0.002 | nonzero | nonzero | 3.683 | ||
| ma120301_rel_withdbg.cz12b_sync_dw0_c32r128 | 91.436 | 5.748 | 2.575 | 0.201 | 0.038 | 0.002 | nonzero | 0.793 | |||
| ma120301_rel_withdbg.cz12c_sync_dw0_c32r128 | 90.223 | 7.037 | 2.547 | 0.161 | 0.031 | 0.001 | nonzero | 0.887 |
Insert response time histogram: each cell has the percentage of responses that take <= the time in the header and max is the max response time in seconds. For max values in the top 25% of the range have a red background and in the bottom 25% of the range have a green background. The red background is not used when the min value is within 80% of the max value.
| dbms | 256us | 1ms | 4ms | 16ms | 64ms | 256ms | 1s | 4s | 16s | gt | max |
|---|---|---|---|---|---|---|---|---|---|---|---|
| ma120301_rel_withdbg.cz12b_sync_c32r128 | 0.010 | 22.200 | 75.038 | 2.744 | 0.009 | 5.304 | |||||
| ma120301_rel_withdbg.cz12c_sync_c32r128 | 0.012 | 45.356 | 53.931 | 0.688 | 0.013 | 5.511 | |||||
| ma120301_rel_withdbg.cz12b_sync_dw0_c32r128 | 5.108 | 70.553 | 24.145 | 0.194 | 2.572 | ||||||
| ma120301_rel_withdbg.cz12c_sync_dw0_c32r128 | 0.003 | 30.212 | 60.471 | 9.307 | 0.007 | 2.422 |
Delete response time histogram: each cell has the percentage of responses that take <= the time in the header and max is the max response time in seconds. For max values in the top 25% of the range have a red background and in the bottom 25% of the range have a green background. The red background is not used when the min value is within 80% of the max value.
| dbms | 256us | 1ms | 4ms | 16ms | 64ms | 256ms | 1s | 4s | 16s | gt | max |
|---|---|---|---|---|---|---|---|---|---|---|---|
| ma120301_rel_withdbg.cz12b_sync_c32r128 | 0.013 | 32.722 | 65.875 | 1.385 | 0.006 | 5.138 | |||||
| ma120301_rel_withdbg.cz12c_sync_c32r128 | 0.058 | 46.737 | 52.792 | 0.401 | 0.012 | 5.457 | |||||
| ma120301_rel_withdbg.cz12b_sync_dw0_c32r128 | 8.040 | 70.078 | 21.756 | 0.125 | 2.414 | ||||||
| ma120301_rel_withdbg.cz12c_sync_dw0_c32r128 | 0.003 | 43.261 | 47.804 | 8.926 | 0.006 | 1.720 |
Performance metrics for the DBMS listed above. Some are normalized by throughput, others are not. Legend for results is here.
ips	qps	rps	rmbps	wps	wmbps	rpq	rkbpq	wpi	wkbpi	csps	cpups	cspq	cpupq	dbgb1	dbgb2	rss	maxop	p50	p99	tag
1470	46805	8671	135.5	8479.4	210.7	0.185	2.964	5.766	146.706	375010	31.4	8.012	215	645.9	748.3	101.3	3.833	4079	1520	ma120301_rel_withdbg.cz12b_sync_c32r128
1848	46532	10843	169.4	10283.1	261.8	0.233	3.728	5.564	145.050	401211	32.7	8.622	225	647.4	750.3	101.3	3.683	4095	1504	ma120301_rel_withdbg.cz12c_sync_c32r128
3122	47967	17727	277.0	15356.5	243.6	0.370	5.913	4.919	79.897	430620	36.2	8.977	241	643.3	745.5	100.3	0.793	4207	608	ma120301_rel_withdbg.cz12b_sync_dw0_c32r128
5504	47961	26224	409.7	23000.9	369.7	0.547	8.748	4.179	68.769	495493	40.1	10.331	268	646.5	749.2	101.3	0.887	4079	560	ma120301_rel_withdbg.cz12c_sync_dw0_c32r128
Average values from iostat.
r/s	rkB/s	rrqm/s	%rrqm	r_await	rareq-s	w/s	wkB/s	wrqm/s	%wrqm	w_await	wareq-s	d/s	dkB/s	drqm/s	%drqm	d_await	dareq-s	f/s	f_await	aqu-sz	%util
8670.9	138735	0.000	0.000	1.276	16.00	8479.4	215731	333.8	3.843	1.262	25.43	0.005	0.040	0.000	0.000	0.102	0.174	816.3	1.669	18.94	98.92		ma120301_rel_withdbg.cz12b_sync_c32r128
10843.1	173489	0.000	0.000	1.008	16.00	10283.1	268080	4.975	0.050	0.935	26.07	0.272	1.129	0.000	0.000	2.974	2.485	895.5	1.227	17.62	98.29		ma120301_rel_withdbg.cz12c_sync_c32r128
17727.4	283639	0.000	0.000	1.227	16.00	15356.5	249424	603.4	3.798	9.838	16.24	0.009	0.135	0.000	0.000	0.245	0.650	345.1	2.629	135.4	99.51		ma120301_rel_withdbg.cz12b_sync_dw0_c32r128
26223.5	419576	0.000	0.000	0.766	16.00	23000.9	378540	46.58	0.207	6.580	16.46	4.210	32.06	0.000	0.000	2.257	5.012	255.5	2.387	150.4	99.24		ma120301_rel_withdbg.cz12c_sync_dw0_c32r128
qp1000.L6
qp1000.L6: point queries with 1000 insert/s per client. Graphs for performance per 1-second interval are here.
Average throughput:
Query response time histogram: each cell has the percentage of responses that take <= the time in the header and max is the max response time in seconds. For max values in the top 25% of the range have a red background and in the bottom 25% of the range have a green background. The red background is not used when the min value is within 80% of the max value.
| dbms | 256us | 1ms | 4ms | 16ms | 64ms | 256ms | 1s | 4s | 16s | gt | max |
|---|---|---|---|---|---|---|---|---|---|---|---|
| ma120301_rel_withdbg.cz12b_sync_c32r128 | nonzero | 0.109 | 7.496 | 72.751 | 19.068 | 0.574 | 0.001 | nonzero | 3.970 | ||
| ma120301_rel_withdbg.cz12c_sync_c32r128 | nonzero | 0.124 | 8.739 | 81.705 | 9.324 | 0.107 | 0.001 | nonzero | 1.392 | ||
| ma120301_rel_withdbg.cz12b_sync_dw0_c32r128 | nonzero | 1.584 | 52.720 | 37.619 | 7.965 | 0.111 | 0.001 | 0.707 | |||
| ma120301_rel_withdbg.cz12c_sync_dw0_c32r128 | nonzero | 1.742 | 57.259 | 38.911 | 2.055 | 0.031 | 0.002 | nonzero | 1.351 |
Insert response time histogram: each cell has the percentage of responses that take <= the time in the header and max is the max response time in seconds. For max values in the top 25% of the range have a red background and in the bottom 25% of the range have a green background. The red background is not used when the min value is within 80% of the max value.
| dbms | 256us | 1ms | 4ms | 16ms | 64ms | 256ms | 1s | 4s | 16s | gt | max |
|---|---|---|---|---|---|---|---|---|---|---|---|
| ma120301_rel_withdbg.cz12b_sync_c32r128 | 0.002 | 0.081 | 92.322 | 7.590 | 0.006 | 4.942 | |||||
| ma120301_rel_withdbg.cz12c_sync_c32r128 | 0.005 | 3.540 | 95.604 | 0.851 | 2.291 | ||||||
| ma120301_rel_withdbg.cz12b_sync_dw0_c32r128 | 0.196 | 56.656 | 42.928 | 0.220 | 2.021 | ||||||
| ma120301_rel_withdbg.cz12c_sync_dw0_c32r128 | 0.008 | 1.987 | 65.666 | 32.287 | 0.053 | 2.712 |
Delete response time histogram: each cell has the percentage of responses that take <= the time in the header and max is the max response time in seconds. For max values in the top 25% of the range have a red background and in the bottom 25% of the range have a green background. The red background is not used when the min value is within 80% of the max value.
| dbms | 256us | 1ms | 4ms | 16ms | 64ms | 256ms | 1s | 4s | 16s | gt | max |
|---|---|---|---|---|---|---|---|---|---|---|---|
| ma120301_rel_withdbg.cz12b_sync_c32r128 | 0.003 | 0.183 | 94.835 | 4.974 | 0.005 | 4.884 | |||||
| ma120301_rel_withdbg.cz12c_sync_c32r128 | 0.011 | 3.645 | 95.984 | 0.361 | 2.135 | ||||||
| ma120301_rel_withdbg.cz12b_sync_dw0_c32r128 | 0.922 | 57.380 | 41.547 | 0.151 | 1.877 | ||||||
| ma120301_rel_withdbg.cz12c_sync_dw0_c32r128 | 0.014 | 6.865 | 61.331 | 31.747 | 0.043 | 2.681 |
Performance metrics for the DBMS listed above. Some are normalized by throughput, others are not. Legend for results is here.
ips	qps	rps	rmbps	wps	wmbps	rpq	rkbpq	wpi	wkbpi	csps	cpups	cspq	cpupq	dbgb1	dbgb2	rss	maxop	p50	p99	tag
1128	1012	16108	251.7	8163.4	202.7	15.910	254.567	7.236	184.017	130505	4.5	128.907	1422	645.9	748.6	101.3	3.970	96	32	ma120301_rel_withdbg.cz12b_sync_c32r128
1363	1242	19675	307.4	9645.8	244.8	15.848	253.567	7.078	183.957	155565	5.0	125.304	1289	647.4	750.5	101.3	1.392	128	32	ma120301_rel_withdbg.cz12c_sync_c32r128
2293	1880	31496	492.1	13703.4	214.9	16.750	268.008	5.976	95.973	184972	7.0	98.374	1191	643.4	745.6	100.4	0.707	144	32	ma120301_rel_withdbg.cz12b_sync_dw0_c32r128
3264	2668	44817	700.3	19031.5	303.6	16.797	268.758	5.830	95.226	262714	9.9	98.465	1187	646.6	749.3	101.3	1.351	224	64	ma120301_rel_withdbg.cz12c_sync_dw0_c32r128
Average values from iostat.
r/s	rkB/s	rrqm/s	%rrqm	r_await	rareq-s	w/s	wkB/s	wrqm/s	%wrqm	w_await	wareq-s	d/s	dkB/s	drqm/s	%drqm	d_await	dareq-s	f/s	f_await	aqu-sz	%util
16107.7	257723	0.000	0.000	1.217	16.00	8163.4	207589	274.6	3.314	1.155	25.42	0.003	0.016	0.000	0.000	0.088	0.079	768.1	1.700	25.73	99.41		ma120301_rel_withdbg.cz12b_sync_c32r128
19675.2	314804	0.000	0.000	1.035	16.00	9645.8	250678	6.462	0.069	0.931	25.99	0.236	2.133	0.000	0.000	2.642	5.168	831.5	1.285	25.82	99.13		ma120301_rel_withdbg.cz12c_sync_c32r128
31495.9	503935	0.000	0.000	1.003	16.00	13703.4	220086	466.6	3.334	5.258	16.05	0.007	0.050	0.000	0.000	0.197	0.242	350.4	2.571	90.48	99.75		ma120301_rel_withdbg.cz12b_sync_dw0_c32r128
44817.1	717073	0.000	0.000	0.620	16.00	19031.5	310845	74.15	0.395	4.860	16.33	5.157	20.66	0.000	0.000	2.146	2.073	282.0	2.057	105.1	99.55		ma120301_rel_withdbg.cz12c_sync_dw0_c32r128
l.i0
l.i0: load without secondary indexes
Performance metrics for all DBMS, not just the ones listed above. Some are normalized by throughput, others are not. Legend for results is here.
ips	qps	rps	rmbps	wps	wmbps	rpq	rkbpq	wpi	wkbpi	csps	cpups	cspq	cpupq	dbgb1	dbgb2	rss	maxop	p50	p99	tag
151064	0	0	0.0	3823.0	61.9	0.000	0.000	0.025	0.419	45765	7.8	0.303	17	236.8	337.6	101.2	0.302	12399	1899	ma120301_rel_withdbg.cz12b_sync_c32r128
460594	0	1	0.0	4971.5	180.6	0.000	0.000	0.011	0.402	87214	22.8	0.189	16	236.8	338.1	101.2	1.842	46094	2299	ma120301_rel_withdbg.cz12c_sync_c32r128
152523	0	0	0.0	3842.4	62.1	0.000	0.000	0.025	0.417	46251	7.9	0.303	17	236.8	337.6	100.2	0.348	12898	1800	ma120301_rel_withdbg.cz12b_sync_dw0_c32r128
454087	0	1	0.0	4898.1	177.4	0.000	0.000	0.011	0.400	85983	22.5	0.189	16	236.8	338.1	101.2	0.753	46694	2299	ma120301_rel_withdbg.cz12c_sync_dw0_c32r128
l.x
l.x: create secondary indexes
Performance metrics for all DBMS, not just the ones listed above. Some are normalized by throughput, others are not. Legend for results is here.
ips	qps	rps	rmbps	wps	wmbps	rpq	rkbpq	wpi	wkbpi	csps	cpups	cspq	cpupq	dbgb1	dbgb2	rss	maxop	p50	p99	tag
707686	0	7955	660.0	8191.3	725.6	0.011	0.955	0.012	1.050	29025	17.0	0.041	8	501.7	602.5	101.5	0.014	NA	NA	ma120301_rel_withdbg.cz12b_sync_c32r128
678733	0	7605	629.7	7900.4	696.6	0.011	0.950	0.012	1.051	27469	16.7	0.040	8	501.7	603.0	101.5	0.055	NA	NA	ma120301_rel_withdbg.cz12c_sync_c32r128
665188	0	7422	614.0	7704.6	682.1	0.011	0.945	0.012	1.050	27237	16.3	0.041	8	501.7	602.5	100.5	0.019	NA	NA	ma120301_rel_withdbg.cz12b_sync_dw0_c32r128
728745	0	8198	679.8	8471.3	747.3	0.011	0.955	0.012	1.050	29880	17.7	0.041	8	501.7	603.0	101.5	0.080	NA	NA	ma120301_rel_withdbg.cz12c_sync_dw0_c32r128
l.i1
l.i1: continue load after secondary indexes created with 50 inserts per transaction
Performance metrics for all DBMS, not just the ones listed above. Some are normalized by throughput, others are not. Legend for results is here.
ips	qps	rps	rmbps	wps	wmbps	rpq	rkbpq	wpi	wkbpi	csps	cpups	cspq	cpupq	dbgb1	dbgb2	rss	maxop	p50	p99	tag
1525	0	7988	124.8	8608.2	212.5	5.239	83.824	5.645	142.726	108597	3.5	71.220	735	645.8	748.2	101.3	6.047	150	0	ma120301_rel_withdbg.cz12b_sync_c32r128
1858	0	9818	153.4	10234.8	258.8	5.285	84.554	5.509	142.629	135446	4.1	72.903	706	647.3	750.1	101.3	5.313	150	50	ma120301_rel_withdbg.cz12c_sync_c32r128
3138	0	16272	254.3	15288.0	251.7	5.186	82.979	4.873	82.142	158687	5.7	50.576	581	643.2	745.4	100.3	3.320	300	50	ma120301_rel_withdbg.cz12b_sync_dw0_c32r128
4979	0	26375	412.1	23859.8	398.7	5.297	84.751	4.792	81.990	253655	8.8	50.943	566	646.4	749.1	101.3	5.447	400	100	ma120301_rel_withdbg.cz12c_sync_dw0_c32r128
l.i2
l.i2: continue load after secondary indexes created with 5 inserts per transaction
Performance metrics for all DBMS, not just the ones listed above. Some are normalized by throughput, others are not. Legend for results is here.
ips	qps	rps	rmbps	wps	wmbps	rpq	rkbpq	wpi	wkbpi	csps	cpups	cspq	cpupq	dbgb1	dbgb2	rss	maxop	p50	p99	tag
692	0	5587	87.3	5888.7	138.1	8.078	129.248	8.515	204.444	64544	2.3	93.326	1064	645.8	748.2	101.3	1.039	45	20	ma120301_rel_withdbg.cz12b_sync_c32r128
1093	0	8761	136.9	8535.3	212.3	8.018	128.294	7.812	199.005	102250	3.6	93.584	1054	647.3	750.1	101.3	1.123	65	30	ma120301_rel_withdbg.cz12c_sync_c32r128
1103	0	8800	137.5	7791.5	119.5	7.980	127.686	7.066	111.001	87613	3.4	79.453	987	643.2	745.4	100.3	1.969	70	25	ma120301_rel_withdbg.cz12b_sync_dw0_c32r128
1923	0	15031	234.9	12303.4	198.0	7.817	125.080	6.399	105.433	141321	5.5	73.501	915	646.4	749.1	101.3	1.023	120	45	ma120301_rel_withdbg.cz12c_sync_dw0_c32r128
qr100.L1
qr100.L1: range queries with 100 insert/s per client
Performance metrics for all DBMS, not just the ones listed above. Some are normalized by throughput, others are not. Legend for results is here.
ips	qps	rps	rmbps	wps	wmbps	rpq	rkbpq	wpi	wkbpi	csps	cpups	cspq	cpupq	dbgb1	dbgb2	rss	maxop	p50	p99	tag
1193	80682	5462	85.3	3278.9	82.9	0.068	1.083	2.749	71.133	502261	38.5	6.225	153	645.8	748.2	101.3	0.437	7279	1216	ma120301_rel_withdbg.cz12b_sync_c32r128
1192	83659	5433	84.9	3121.9	82.1	0.065	1.039	2.619	70.543	517438	39.7	6.185	152	647.3	750.1	101.3	0.422	7327	2000	ma120301_rel_withdbg.cz12c_sync_c32r128
1193	85114	5491	85.8	2757.8	46.1	0.065	1.032	2.312	39.606	525023	40.2	6.168	151	643.2	745.4	100.3	1.321	7327	3104	ma120301_rel_withdbg.cz12b_sync_dw0_c32r128
1193	87164	5419	84.7	2610.2	45.2	0.062	0.995	2.188	38.796	535773	40.7	6.147	149	646.4	749.1	101.3	0.272	7407	4879	ma120301_rel_withdbg.cz12c_sync_dw0_c32r128
qp100.L2
qp100.L2: point queries with 100 insert/s per client
Performance metrics for all DBMS, not just the ones listed above. Some are normalized by throughput, others are not. Legend for results is here.
ips	qps	rps	rmbps	wps	wmbps	rpq	rkbpq	wpi	wkbpi	csps	cpups	cspq	cpupq	dbgb1	dbgb2	rss	maxop	p50	p99	tag
1184	2188	22684	354.4	8506.1	212.9	10.368	165.892	7.187	184.250	128374	5.1	58.677	746	645.8	748.2	101.3	1.853	144	0	ma120301_rel_withdbg.cz12b_sync_c32r128
1192	3733	32606	509.5	8710.3	223.9	8.735	139.758	7.307	192.375	155193	6.4	41.575	549	647.3	750.1	101.3	1.008	304	16	ma120301_rel_withdbg.cz12c_sync_c32r128
1193	6386	49166	768.2	7952.0	125.5	7.699	123.189	6.667	107.708	198812	8.5	31.134	426	643.2	745.4	100.3	0.424	592	16	ma120301_rel_withdbg.cz12b_sync_dw0_c32r128
1193	8236	60293	942.1	7885.7	125.8	7.321	117.129	6.612	108.007	231685	10.1	28.130	392	646.4	749.1	101.3	0.785	752	48	ma120301_rel_withdbg.cz12c_sync_dw0_c32r128
qr500.L3
qr500.L3: range queries with 500 insert/s per client
Performance metrics for all DBMS, not just the ones listed above. Some are normalized by throughput, others are not. Legend for results is here.
ips	qps	rps	rmbps	wps	wmbps	rpq	rkbpq	wpi	wkbpi	csps	cpups	cspq	cpupq	dbgb1	dbgb2	rss	maxop	p50	p99	tag
2049	39430	7912	123.6	8058.6	197.7	0.201	3.211	3.932	98.803	351522	25.9	8.915	210	645.8	748.2	101.3	1.231	3280	336	ma120301_rel_withdbg.cz12b_sync_c32r128
2794	38735	10718	167.5	10315.1	261.8	0.277	4.427	3.691	95.933	393332	27.3	10.155	226	647.3	750.1	101.3	0.622	3232	688	ma120301_rel_withdbg.cz12c_sync_c32r128
4127	45711	17066	266.7	14102.7	225.2	0.373	5.974	3.417	55.874	406957	32.5	8.903	228	643.2	745.4	100.4	0.824	3936	384	ma120301_rel_withdbg.cz12b_sync_dw0_c32r128
4613	56559	19761	308.8	15199.9	252.8	0.349	5.590	3.295	56.102	500933	35.9	8.857	203	646.4	749.1	101.3	2.000	5679	64	ma120301_rel_withdbg.cz12c_sync_dw0_c32r128
qp500.L4
qp500.L4: point queries with 500 insert/s per client
Performance metrics for all DBMS, not just the ones listed above. Some are normalized by throughput, others are not. Legend for results is here.
ips	qps	rps	rmbps	wps	wmbps	rpq	rkbpq	wpi	wkbpi	csps	cpups	cspq	cpupq	dbgb1	dbgb2	rss	maxop	p50	p99	tag
1502	572	12022	187.8	8280.2	203.3	21.000	335.994	5.511	138.586	139625	4.2	243.886	2348	645.9	748.3	101.3	1.010	32	0	ma120301_rel_withdbg.cz12b_sync_c32r128
1904	744	15429	241.1	10208.2	257.3	20.750	331.993	5.361	138.391	177041	5.0	238.086	2152	647.3	750.2	101.3	0.744	48	16	ma120301_rel_withdbg.cz12c_sync_c32r128
3561	879	22907	357.9	15114.9	235.9	26.058	416.924	4.245	67.827	154419	6.5	175.656	2366	643.2	745.4	100.4	1.370	64	16	ma120301_rel_withdbg.cz12b_sync_dw0_c32r128
5341	1640	38347	599.2	21920.7	351.7	23.383	374.121	4.104	67.420	259832	10.4	158.434	2029	646.4	749.1	101.3	0.702	144	16	ma120301_rel_withdbg.cz12c_sync_dw0_c32r128
qr1000.L5
qr1000.L5: range queries with 1000 insert/s per client
Performance metrics for all DBMS, not just the ones listed above. Some are normalized by throughput, others are not. Legend for results is here.
ips	qps	rps	rmbps	wps	wmbps	rpq	rkbpq	wpi	wkbpi	csps	cpups	cspq	cpupq	dbgb1	dbgb2	rss	maxop	p50	p99	tag
1470	46805	8671	135.5	8479.4	210.7	0.185	2.964	5.766	146.706	375010	31.4	8.012	215	645.9	748.3	101.3	3.833	4079	1520	ma120301_rel_withdbg.cz12b_sync_c32r128
1848	46532	10843	169.4	10283.1	261.8	0.233	3.728	5.564	145.050	401211	32.7	8.622	225	647.4	750.3	101.3	3.683	4095	1504	ma120301_rel_withdbg.cz12c_sync_c32r128
3122	47967	17727	277.0	15356.5	243.6	0.370	5.913	4.919	79.897	430620	36.2	8.977	241	643.3	745.5	100.3	0.793	4207	608	ma120301_rel_withdbg.cz12b_sync_dw0_c32r128
5504	47961	26224	409.7	23000.9	369.7	0.547	8.748	4.179	68.769	495493	40.1	10.331	268	646.5	749.2	101.3	0.887	4079	560	ma120301_rel_withdbg.cz12c_sync_dw0_c32r128
qp1000.L6
qp1000.L6: point queries with 1000 insert/s per client
Performance metrics for all DBMS, not just the ones listed above. Some are normalized by throughput, others are not. Legend for results is here.
ips	qps	rps	rmbps	wps	wmbps	rpq	rkbpq	wpi	wkbpi	csps	cpups	cspq	cpupq	dbgb1	dbgb2	rss	maxop	p50	p99	tag
1128	1012	16108	251.7	8163.4	202.7	15.910	254.567	7.236	184.017	130505	4.5	128.907	1422	645.9	748.6	101.3	3.970	96	32	ma120301_rel_withdbg.cz12b_sync_c32r128
1363	1242	19675	307.4	9645.8	244.8	15.848	253.567	7.078	183.957	155565	5.0	125.304	1289	647.4	750.5	101.3	1.392	128	32	ma120301_rel_withdbg.cz12c_sync_c32r128
2293	1880	31496	492.1	13703.4	214.9	16.750	268.008	5.976	95.973	184972	7.0	98.374	1191	643.4	745.6	100.4	0.707	144	32	ma120301_rel_withdbg.cz12b_sync_dw0_c32r128
3264	2668	44817	700.3	19031.5	303.6	16.797	268.758	5.830	95.226	262714	9.9	98.465	1187	646.6	749.3	101.3	1.351	224	64	ma120301_rel_withdbg.cz12c_sync_dw0_c32r128
l.i0
- l.i0: load without secondary indexes
- Legend for results is here.
- Each entry lists the percentage of responses that fit in that bucket (slower than max time for previous bucket, faster than min time for next bucket).
Insert response time histogram
256us	1ms	4ms	16ms	64ms	256ms	1s	4s	16s	gt	max	tag
0.000	0.000	0.048	97.902	1.861	0.190	nonzero	0.000	0.000	0.000	0.302	ma120301_rel_withdbg.cz12b_sync_c32r128
0.000	0.000	98.139	0.799	1.012	0.048	0.001	nonzero	0.000	0.000	1.842	ma120301_rel_withdbg.cz12c_sync_c32r128
0.000	0.000	0.123	98.099	1.577	0.198	0.003	0.000	0.000	0.000	0.348	ma120301_rel_withdbg.cz12b_sync_dw0_c32r128
0.000	nonzero	98.179	0.794	0.980	0.046	0.001	0.000	0.000	0.000	0.753	ma120301_rel_withdbg.cz12c_sync_dw0_c32r128
l.x
- l.x: create secondary indexes
- Legend for results is here.
- Each entry lists the percentage of responses that fit in that bucket (slower than max time for previous bucket, faster than min time for next bucket).
TODO - determine whether there is data for create index response time
l.i1
- l.i1: continue load after secondary indexes created with 50 inserts per transaction
- Legend for results is here.
- Each entry lists the percentage of responses that fit in that bucket (slower than max time for previous bucket, faster than min time for next bucket).
Insert response time histogram
256us	1ms	4ms	16ms	64ms	256ms	1s	4s	16s	gt	max	tag
0.000	0.000	0.000	0.000	0.002	15.495	81.251	3.250	0.002	0.000	6.047	ma120301_rel_withdbg.cz12b_sync_c32r128
0.000	0.000	0.000	0.000	0.050	46.015	52.955	0.979	0.002	0.000	5.313	ma120301_rel_withdbg.cz12c_sync_c32r128
0.000	0.000	0.000	nonzero	0.460	81.392	18.024	0.124	0.000	0.000	3.320	ma120301_rel_withdbg.cz12b_sync_dw0_c32r128
0.000	0.000	0.000	0.001	20.446	69.557	9.971	0.024	nonzero	0.000	5.447	ma120301_rel_withdbg.cz12c_sync_dw0_c32r128
Delete response time histogram
256us	1ms	4ms	16ms	64ms	256ms	1s	4s	16s	gt	max	tag
0.000	0.000	0.000	nonzero	0.926	53.638	44.070	1.364	0.002	0.000	5.583	ma120301_rel_withdbg.cz12b_sync_c32r128
0.000	0.000	0.000	0.002	0.946	64.197	34.474	0.380	0.001	0.000	5.299	ma120301_rel_withdbg.cz12c_sync_c32r128
0.000	0.000	0.000	0.006	4.950	81.279	13.736	0.030	0.000	0.000	2.860	ma120301_rel_withdbg.cz12b_sync_dw0_c32r128
0.000	0.000	0.000	0.254	51.151	39.624	8.962	0.009	nonzero	0.000	4.525	ma120301_rel_withdbg.cz12c_sync_dw0_c32r128
l.i2
- l.i2: continue load after secondary indexes created with 5 inserts per transaction
- Legend for results is here.
- Each entry lists the percentage of responses that fit in that bucket (slower than max time for previous bucket, faster than min time for next bucket).
Insert response time histogram
256us	1ms	4ms	16ms	64ms	256ms	1s	4s	16s	gt	max	tag
0.000	0.000	0.000	0.086	44.625	54.634	0.655	nonzero	0.000	0.000	1.039	ma120301_rel_withdbg.cz12b_sync_c32r128
0.000	0.000	nonzero	6.456	63.041	30.451	0.052	nonzero	0.000	0.000	1.123	ma120301_rel_withdbg.cz12c_sync_c32r128
0.000	0.000	0.000	1.858	68.360	29.641	0.139	0.001	0.000	0.000	1.969	ma120301_rel_withdbg.cz12b_sync_dw0_c32r128
0.000	0.000	0.003	24.690	64.886	10.400	0.021	nonzero	0.000	0.000	1.023	ma120301_rel_withdbg.cz12c_sync_dw0_c32r128
Delete response time histogram
256us	1ms	4ms	16ms	64ms	256ms	1s	4s	16s	gt	max	tag
0.000	0.000	0.000	0.193	49.344	50.089	0.374	nonzero	0.000	0.000	1.051	ma120301_rel_withdbg.cz12b_sync_c32r128
0.000	0.000	0.001	11.061	60.203	28.694	0.041	nonzero	0.000	0.000	1.036	ma120301_rel_withdbg.cz12c_sync_c32r128
0.000	0.000	0.000	2.504	69.666	27.727	0.102	0.001	0.000	0.000	1.880	ma120301_rel_withdbg.cz12b_sync_dw0_c32r128
0.000	0.000	0.011	42.413	48.962	8.599	0.016	0.000	0.000	0.000	0.861	ma120301_rel_withdbg.cz12c_sync_dw0_c32r128
qr100.L1
- qr100.L1: range queries with 100 insert/s per client
- Legend for results is here.
- Each entry lists the percentage of responses that fit in that bucket (slower than max time for previous bucket, faster than min time for next bucket).
Query response time histogram
256us	1ms	4ms	16ms	64ms	256ms	1s	4s	16s	gt	max	tag
99.257	0.517	0.179	0.028	0.017	0.002	nonzero	0.000	0.000	0.000	0.437	ma120301_rel_withdbg.cz12b_sync_c32r128
99.376	0.481	0.117	0.019	0.007	0.001	nonzero	0.000	0.000	0.000	0.422	ma120301_rel_withdbg.cz12c_sync_c32r128
99.396	0.466	0.125	0.007	0.006	nonzero	nonzero	nonzero	0.000	0.000	1.321	ma120301_rel_withdbg.cz12b_sync_dw0_c32r128
99.514	0.413	0.069	0.002	0.001	nonzero	nonzero	0.000	0.000	0.000	0.272	ma120301_rel_withdbg.cz12c_sync_dw0_c32r128
Insert response time histogram
256us	1ms	4ms	16ms	64ms	256ms	1s	4s	16s	gt	max	tag
0.000	0.000	0.000	0.028	68.970	22.162	8.558	0.282	0.000	0.000	1.549	ma120301_rel_withdbg.cz12b_sync_c32r128
0.000	0.000	0.000	3.146	81.204	12.799	2.801	0.051	0.000	0.000	1.236	ma120301_rel_withdbg.cz12c_sync_c32r128
0.000	0.000	0.000	0.130	86.275	11.609	1.787	0.199	0.000	0.000	1.928	ma120301_rel_withdbg.cz12b_sync_dw0_c32r128
0.000	0.000	0.000	8.319	85.475	5.924	0.282	0.000	0.000	0.000	0.746	ma120301_rel_withdbg.cz12c_sync_dw0_c32r128
Delete response time histogram
256us	1ms	4ms	16ms	64ms	256ms	1s	4s	16s	gt	max	tag
0.000	0.000	0.000	1.704	78.595	12.532	7.097	0.072	0.000	0.000	1.353	ma120301_rel_withdbg.cz12b_sync_c32r128
0.000	0.000	0.000	12.690	73.451	11.590	2.264	0.005	0.000	0.000	1.109	ma120301_rel_withdbg.cz12c_sync_c32r128
0.000	0.000	0.000	2.833	88.148	7.824	1.028	0.167	0.000	0.000	1.871	ma120301_rel_withdbg.cz12b_sync_dw0_c32r128
0.000	0.000	0.000	19.954	75.405	4.481	0.160	0.000	0.000	0.000	0.689	ma120301_rel_withdbg.cz12c_sync_dw0_c32r128
qp100.L2
- qp100.L2: point queries with 100 insert/s per client
- Legend for results is here.
- Each entry lists the percentage of responses that fit in that bucket (slower than max time for previous bucket, faster than min time for next bucket).
Query response time histogram
256us	1ms	4ms	16ms	64ms	256ms	1s	4s	16s	gt	max	tag
0.001	10.698	42.917	42.520	3.427	0.430	0.006	0.001	0.000	0.000	1.853	ma120301_rel_withdbg.cz12b_sync_c32r128
0.002	21.865	50.737	25.730	1.584	0.079	0.002	nonzero	0.000	0.000	1.008	ma120301_rel_withdbg.cz12c_sync_c32r128
0.004	38.945	52.819	7.699	0.494	0.039	nonzero	0.000	0.000	0.000	0.424	ma120301_rel_withdbg.cz12b_sync_dw0_c32r128
0.005	44.027	51.296	4.474	0.185	0.011	nonzero	0.000	0.000	0.000	0.785	ma120301_rel_withdbg.cz12c_sync_dw0_c32r128
Insert response time histogram
256us	1ms	4ms	16ms	64ms	256ms	1s	4s	16s	gt	max	tag
0.000	0.000	0.000	0.000	16.863	66.569	15.148	1.419	0.000	0.000	2.829	ma120301_rel_withdbg.cz12b_sync_c32r128
0.000	0.000	0.000	0.014	46.822	46.542	6.296	0.326	0.000	0.000	1.638	ma120301_rel_withdbg.cz12c_sync_c32r128
0.000	0.000	0.000	0.005	7.690	86.213	5.708	0.384	0.000	0.000	1.632	ma120301_rel_withdbg.cz12b_sync_dw0_c32r128
0.000	0.000	0.000	0.007	40.088	56.613	3.188	0.104	0.000	0.000	2.029	ma120301_rel_withdbg.cz12c_sync_dw0_c32r128
Delete response time histogram
256us	1ms	4ms	16ms	64ms	256ms	1s	4s	16s	gt	max	tag
0.000	0.000	0.000	0.037	26.556	57.792	14.810	0.806	0.000	0.000	2.758	ma120301_rel_withdbg.cz12b_sync_c32r128
0.000	0.000	0.000	1.435	61.854	31.424	5.176	0.111	0.000	0.000	1.346	ma120301_rel_withdbg.cz12c_sync_c32r128
0.000	0.000	0.000	0.049	16.926	77.468	5.373	0.185	0.000	0.000	1.343	ma120301_rel_withdbg.cz12b_sync_dw0_c32r128
0.000	0.000	0.000	0.382	66.183	30.954	2.440	0.042	0.000	0.000	1.894	ma120301_rel_withdbg.cz12c_sync_dw0_c32r128
qr500.L3
- qr500.L3: range queries with 500 insert/s per client
- Legend for results is here.
- Each entry lists the percentage of responses that fit in that bucket (slower than max time for previous bucket, faster than min time for next bucket).
Query response time histogram
256us	1ms	4ms	16ms	64ms	256ms	1s	4s	16s	gt	max	tag
94.386	3.516	1.407	0.449	0.227	0.015	nonzero	nonzero	0.000	0.000	1.231	ma120301_rel_withdbg.cz12b_sync_c32r128
93.787	3.934	1.510	0.564	0.194	0.011	nonzero	0.000	0.000	0.000	0.622	ma120301_rel_withdbg.cz12c_sync_c32r128
92.541	4.026	3.024	0.353	0.053	0.002	nonzero	0.000	0.000	0.000	0.824	ma120301_rel_withdbg.cz12b_sync_dw0_c32r128
96.772	2.485	0.562	0.086	0.083	0.010	0.003	nonzero	0.000	0.000	2.000	ma120301_rel_withdbg.cz12c_sync_dw0_c32r128
Insert response time histogram
256us	1ms	4ms	16ms	64ms	256ms	1s	4s	16s	gt	max	tag
0.000	0.000	0.000	0.000	0.139	52.126	47.139	0.596	0.000	0.000	1.897	ma120301_rel_withdbg.cz12b_sync_c32r128
0.000	0.000	0.000	0.001	1.660	81.969	16.284	0.086	0.000	0.000	1.554	ma120301_rel_withdbg.cz12c_sync_c32r128
0.000	0.000	0.000	0.027	14.721	79.832	5.310	0.111	0.000	0.000	1.996	ma120301_rel_withdbg.cz12b_sync_dw0_c32r128
0.000	0.000	0.000	11.962	68.603	14.960	3.063	1.412	nonzero	0.000	4.073	ma120301_rel_withdbg.cz12c_sync_dw0_c32r128
Delete response time histogram
256us	1ms	4ms	16ms	64ms	256ms	1s	4s	16s	gt	max	tag
0.000	0.000	0.000	0.000	0.804	73.884	25.111	0.201	0.000	0.000	1.734	ma120301_rel_withdbg.cz12b_sync_c32r128
0.000	0.000	0.000	0.019	2.144	85.635	12.169	0.033	0.000	0.000	1.449	ma120301_rel_withdbg.cz12c_sync_c32r128
0.000	0.000	0.000	0.292	16.174	79.824	3.667	0.044	0.000	0.000	1.544	ma120301_rel_withdbg.cz12b_sync_dw0_c32r128
0.000	0.000	0.000	25.250	58.443	11.755	3.282	1.271	0.000	0.000	3.597	ma120301_rel_withdbg.cz12c_sync_dw0_c32r128
qp500.L4
- qp500.L4: point queries with 500 insert/s per client
- Legend for results is here.
- Each entry lists the percentage of responses that fit in that bucket (slower than max time for previous bucket, faster than min time for next bucket).
Query response time histogram
256us	1ms	4ms	16ms	64ms	256ms	1s	4s	16s	gt	max	tag
0.000	0.036	3.646	47.070	45.852	3.384	0.012	nonzero	0.000	0.000	1.010	ma120301_rel_withdbg.cz12b_sync_c32r128
nonzero	0.048	4.635	59.091	34.011	2.209	0.006	0.000	0.000	0.000	0.744	ma120301_rel_withdbg.cz12c_sync_c32r128
0.000	0.010	10.583	59.922	28.800	0.673	0.011	nonzero	0.000	0.000	1.370	ma120301_rel_withdbg.cz12b_sync_dw0_c32r128
0.000	0.039	30.729	64.806	4.174	0.246	0.006	0.000	0.000	0.000	0.702	ma120301_rel_withdbg.cz12c_sync_dw0_c32r128
Insert response time histogram
256us	1ms	4ms	16ms	64ms	256ms	1s	4s	16s	gt	max	tag
0.000	0.000	0.000	0.000	0.000	18.134	78.848	3.019	0.000	0.000	2.737	ma120301_rel_withdbg.cz12b_sync_c32r128
0.000	0.000	0.000	0.000	0.004	57.488	41.662	0.846	0.000	0.000	2.446	ma120301_rel_withdbg.cz12c_sync_c32r128
0.000	0.000	0.000	0.001	5.019	86.201	8.711	0.068	0.000	0.000	2.928	ma120301_rel_withdbg.cz12b_sync_dw0_c32r128
0.000	0.000	0.000	0.044	32.049	64.654	3.232	0.020	0.000	0.000	1.818	ma120301_rel_withdbg.cz12c_sync_dw0_c32r128
Delete response time histogram
256us	1ms	4ms	16ms	64ms	256ms	1s	4s	16s	gt	max	tag
0.000	0.000	0.000	0.000	0.001	37.749	60.318	1.933	0.000	0.000	2.167	ma120301_rel_withdbg.cz12b_sync_c32r128
0.000	0.000	0.000	0.000	0.013	60.605	38.881	0.501	0.000	0.000	1.953	ma120301_rel_withdbg.cz12c_sync_c32r128
0.000	0.000	0.000	0.000	8.731	84.409	6.830	0.031	0.000	0.000	2.658	ma120301_rel_withdbg.cz12b_sync_dw0_c32r128
0.000	0.000	0.000	0.113	47.213	49.905	2.753	0.015	0.000	0.000	1.722	ma120301_rel_withdbg.cz12c_sync_dw0_c32r128
qr1000.L5
- qr1000.L5: range queries with 1000 insert/s per client
- Legend for results is here.
- Each entry lists the percentage of responses that fit in that bucket (slower than max time for previous bucket, faster than min time for next bucket).
Query response time histogram
256us	1ms	4ms	16ms	64ms	256ms	1s	4s	16s	gt	max	tag
93.607	4.322	1.673	0.305	0.089	0.003	nonzero	nonzero	0.000	0.000	3.833	ma120301_rel_withdbg.cz12b_sync_c32r128
92.952	5.083	1.529	0.355	0.079	0.002	nonzero	nonzero	0.000	0.000	3.683	ma120301_rel_withdbg.cz12c_sync_c32r128
91.436	5.748	2.575	0.201	0.038	0.002	nonzero	0.000	0.000	0.000	0.793	ma120301_rel_withdbg.cz12b_sync_dw0_c32r128
90.223	7.037	2.547	0.161	0.031	0.001	nonzero	0.000	0.000	0.000	0.887	ma120301_rel_withdbg.cz12c_sync_dw0_c32r128
Insert response time histogram
256us	1ms	4ms	16ms	64ms	256ms	1s	4s	16s	gt	max	tag
0.000	0.000	0.000	0.000	0.010	22.200	75.038	2.744	0.009	0.000	5.304	ma120301_rel_withdbg.cz12b_sync_c32r128
0.000	0.000	0.000	0.000	0.012	45.356	53.931	0.688	0.013	0.000	5.511	ma120301_rel_withdbg.cz12c_sync_c32r128
0.000	0.000	0.000	0.000	5.108	70.553	24.145	0.194	0.000	0.000	2.572	ma120301_rel_withdbg.cz12b_sync_dw0_c32r128
0.000	0.000	0.000	0.003	30.212	60.471	9.307	0.007	0.000	0.000	2.422	ma120301_rel_withdbg.cz12c_sync_dw0_c32r128
Delete response time histogram
256us	1ms	4ms	16ms	64ms	256ms	1s	4s	16s	gt	max	tag
0.000	0.000	0.000	0.000	0.013	32.722	65.875	1.385	0.006	0.000	5.138	ma120301_rel_withdbg.cz12b_sync_c32r128
0.000	0.000	0.000	0.000	0.058	46.737	52.792	0.401	0.012	0.000	5.457	ma120301_rel_withdbg.cz12c_sync_c32r128
0.000	0.000	0.000	0.000	8.040	70.078	21.756	0.125	0.000	0.000	2.414	ma120301_rel_withdbg.cz12b_sync_dw0_c32r128
0.000	0.000	0.000	0.003	43.261	47.804	8.926	0.006	0.000	0.000	1.720	ma120301_rel_withdbg.cz12c_sync_dw0_c32r128
qp1000.L6
- qp1000.L6: point queries with 1000 insert/s per client
- Legend for results is here.
- Each entry lists the percentage of responses that fit in that bucket (slower than max time for previous bucket, faster than min time for next bucket).
Query response time histogram
256us	1ms	4ms	16ms	64ms	256ms	1s	4s	16s	gt	max	tag
nonzero	0.109	7.496	72.751	19.068	0.574	0.001	nonzero	0.000	0.000	3.970	ma120301_rel_withdbg.cz12b_sync_c32r128
nonzero	0.124	8.739	81.705	9.324	0.107	0.001	nonzero	0.000	0.000	1.392	ma120301_rel_withdbg.cz12c_sync_c32r128
nonzero	1.584	52.720	37.619	7.965	0.111	0.001	0.000	0.000	0.000	0.707	ma120301_rel_withdbg.cz12b_sync_dw0_c32r128
nonzero	1.742	57.259	38.911	2.055	0.031	0.002	nonzero	0.000	0.000	1.351	ma120301_rel_withdbg.cz12c_sync_dw0_c32r128
Insert response time histogram
256us	1ms	4ms	16ms	64ms	256ms	1s	4s	16s	gt	max	tag
0.000	0.000	0.000	0.000	0.002	0.081	92.322	7.590	0.006	0.000	4.942	ma120301_rel_withdbg.cz12b_sync_c32r128
0.000	0.000	0.000	0.000	0.005	3.540	95.604	0.851	0.000	0.000	2.291	ma120301_rel_withdbg.cz12c_sync_c32r128
0.000	0.000	0.000	0.000	0.196	56.656	42.928	0.220	0.000	0.000	2.021	ma120301_rel_withdbg.cz12b_sync_dw0_c32r128
0.000	0.000	0.000	0.008	1.987	65.666	32.287	0.053	0.000	0.000	2.712	ma120301_rel_withdbg.cz12c_sync_dw0_c32r128
Delete response time histogram
256us	1ms	4ms	16ms	64ms	256ms	1s	4s	16s	gt	max	tag
0.000	0.000	0.000	0.000	0.003	0.183	94.835	4.974	0.005	0.000	4.884	ma120301_rel_withdbg.cz12b_sync_c32r128
0.000	0.000	0.000	0.000	0.011	3.645	95.984	0.361	0.000	0.000	2.135	ma120301_rel_withdbg.cz12c_sync_c32r128
0.000	0.000	0.000	0.000	0.922	57.380	41.547	0.151	0.000	0.000	1.877	ma120301_rel_withdbg.cz12b_sync_dw0_c32r128
0.000	0.000	0.000	0.014	6.865	61.331	31.747	0.043	0.000	0.000	2.681	ma120301_rel_withdbg.cz12c_sync_dw0_c32r128