Introduction
This is a report for the insert benchmark with 3600M docs and 12 client(s). It is generated by scripts (bash, awk, sed) and Tufte might not be impressed. An overview of the insert benchmark is here and a short update is here. Below, by DBMS, I mean DBMS+version.config. An example is my8020.c10b40 where my means MySQL, 8020 is version 8.0.20 and c10b40 is the name for the configuration file.
The test server has 32 cores, 128G RAM and 1 NVMe device. The benchmark was run with 12 clients and there were 1 or 3 connections per client (1 for queries or inserts without rate limits, 1+1 for rate limited inserts+deletes). It uses 8 tables with a table per client. It loads 300M rows per table without secondary indexes, creates 3 secondary indexes per table, then inserts 4m+1m rows per table with a delete per insert to avoid growing the table. It then does 6 read+write tests for 1800s each that do queries as fast as possible with 100,100,500,500,1000,1000 inserts/s and the same for deletes/s per client concurrent with the queries. The database is larger than RAM and most tests are IO-bound except for the range query (qr*) tests that frequently have a cached working set. Clients and the DBMS share one server.
The tested DBMS are:
- ma120301_rel_withdbg.cz12b_c32r128 - MariaDB 12.3.1 with the z12b config, my standard config
- ma120301_rel_withdbg.cz12c_c32r128 - MariaDB 12.3.1 with the z12c config that uses the binlog storage engine
- ma120301_rel_withdbg.cz12b_dw0_c32r128 - MariaDB 12.3.1 with the z12b_dw0_config that is like cz12b_c32r128 and then disables the InnoDB doublewrite buffer
- ma120301_rel_withdbg.cz12c_dw0_c32r128 - MariaDB 12.3.1 with the z12c_dw0_config that is like cz12c_c32r128 and then disables the InnoDB doublewrite buffer
Contents
- Summary
- l.i0: load without secondary indexes
- l.x: create secondary indexes
- l.i1: continue load after secondary indexes created with 50 inserts per transaction
- l.i2: continue load after secondary indexes created with 5 inserts per transaction
- qr100.L1: range queries with 100 insert/s per client
- qp100.L2: point queries with 100 insert/s per client
- qr500.L3: range queries with 500 insert/s per client
- qp500.L4: point queries with 500 insert/s per client
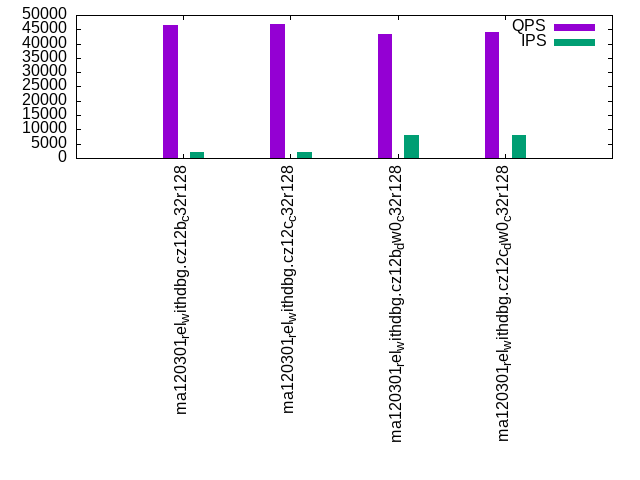
- qr1000.L5: range queries with 1000 insert/s per client
- qp1000.L6: point queries with 1000 insert/s per client
Summary
The numbers are inserts/s for l.i0, l.i1 and l.i2, indexed docs (or rows) /s for l.x and queries/s for qr100, qp100 thru qr1000, qp1000" The values are the average rate over the entire test for inserts (IPS) and queries (QPS). The range of values for IPS and QPS is split into 3 parts: bottom 25%, middle 50%, top 25%. Values in the bottom 25% have a red background, values in the top 25% have a green background and values in the middle have no color. A gray background is used for values that can be ignored because the DBMS did not sustain the target insert rate. Red backgrounds are not used when the minimum value is within 80% of the max value.
| dbms | l.i0 | l.x | l.i1 | l.i2 | qr100 | qp100 | qr500 | qp500 | qr1000 | qp1000 |
|---|---|---|---|---|---|---|---|---|---|---|
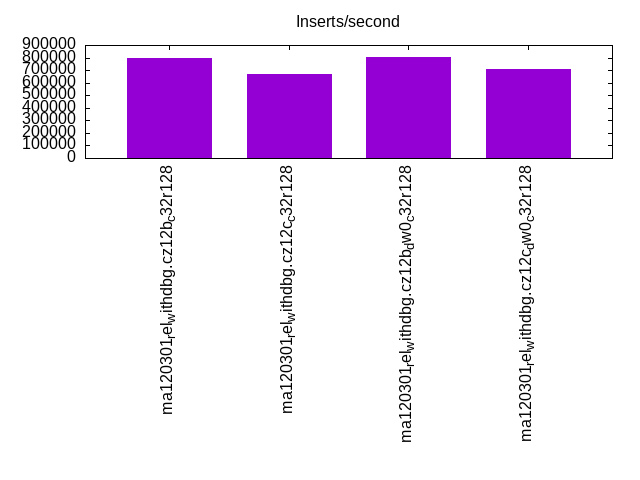
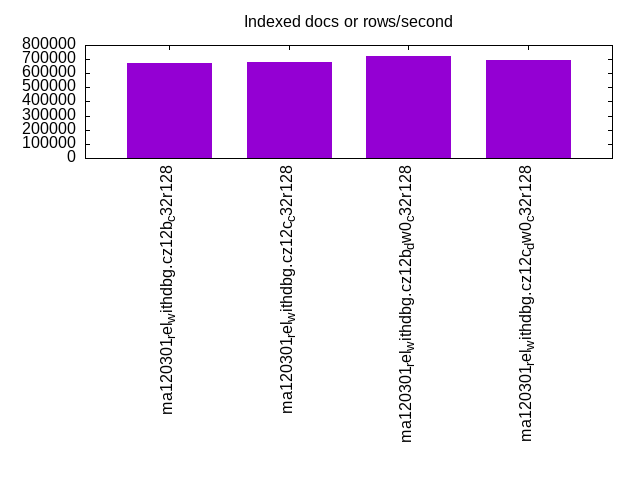
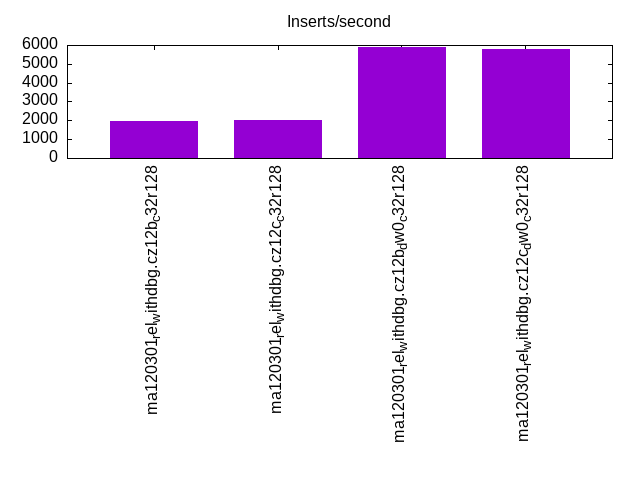
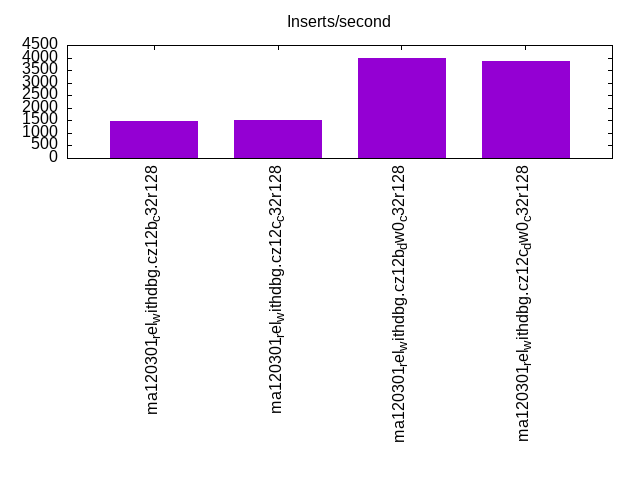
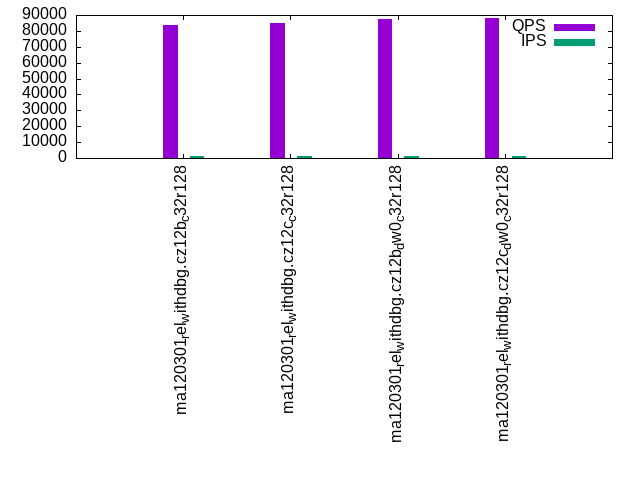
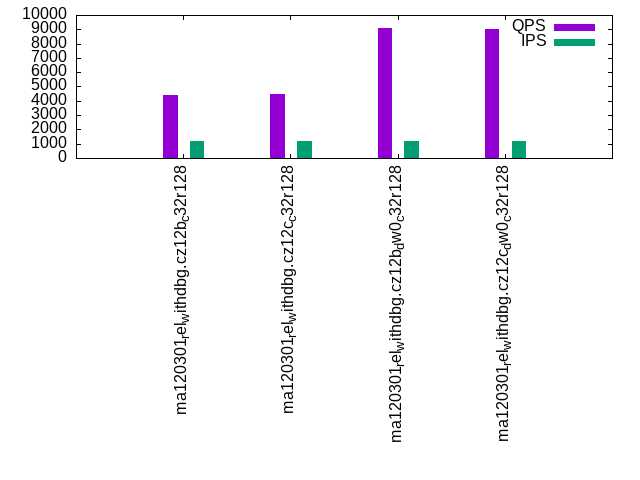
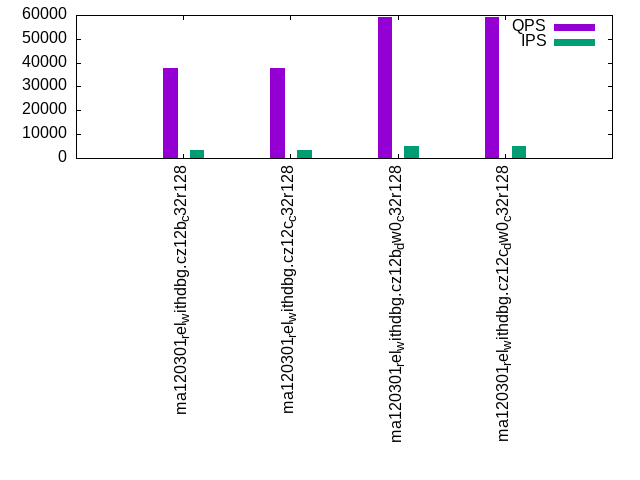
| ma120301_rel_withdbg.cz12b_c32r128 | 799467 | 671642 | 1982 | 1484 | 83703 | 4438 | 37823 | 845 | 46389 | 1342 |
| ma120301_rel_withdbg.cz12c_c32r128 | 670017 | 679373 | 2008 | 1522 | 84853 | 4441 | 37821 | 887 | 46894 | 1366 |
| ma120301_rel_withdbg.cz12b_dw0_c32r128 | 803392 | 721443 | 5893 | 4001 | 87204 | 9080 | 59249 | 3060 | 43374 | 3460 |
| ma120301_rel_withdbg.cz12c_dw0_c32r128 | 706298 | 694310 | 5797 | 3844 | 88150 | 8991 | 59008 | 2731 | 44194 | 3360 |
This table has relative throughput, throughput for the DBMS relative to the DBMS in the first line, using the absolute throughput from the previous table. Values less than 0.95 have a yellow background. Values greater than 1.05 have a blue background.
| dbms | l.i0 | l.x | l.i1 | l.i2 | qr100 | qp100 | qr500 | qp500 | qr1000 | qp1000 |
|---|---|---|---|---|---|---|---|---|---|---|
| ma120301_rel_withdbg.cz12b_c32r128 | 1.00 | 1.00 | 1.00 | 1.00 | 1.00 | 1.00 | 1.00 | 1.00 | 1.00 | 1.00 |
| ma120301_rel_withdbg.cz12c_c32r128 | 0.84 | 1.01 | 1.01 | 1.03 | 1.01 | 1.00 | 1.00 | 1.05 | 1.01 | 1.02 |
| ma120301_rel_withdbg.cz12b_dw0_c32r128 | 1.00 | 1.07 | 2.97 | 2.70 | 1.04 | 2.05 | 1.57 | 3.62 | 0.94 | 2.58 |
| ma120301_rel_withdbg.cz12c_dw0_c32r128 | 0.88 | 1.03 | 2.92 | 2.59 | 1.05 | 2.03 | 1.56 | 3.23 | 0.95 | 2.50 |
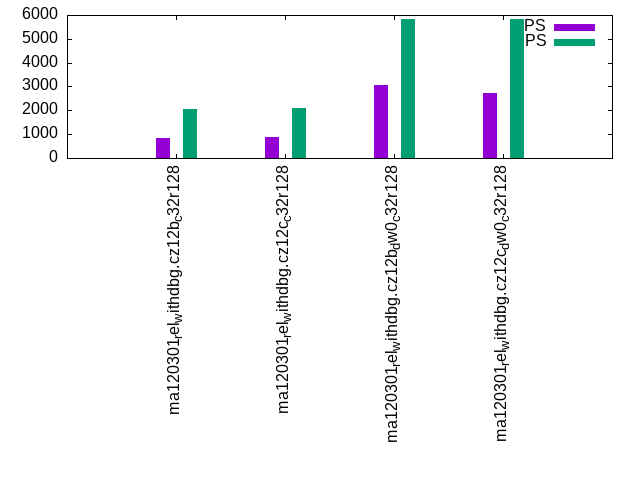
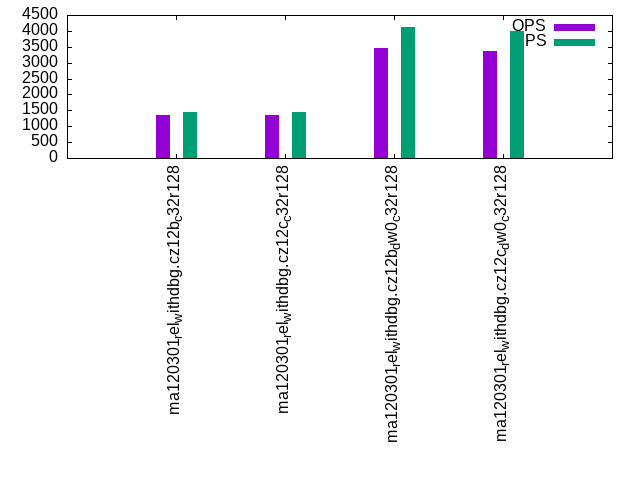
This lists the average rate of inserts/s for the tests that do inserts concurrent with queries. For such tests the query rate is listed in the table above. The read+write tests are setup so that the insert rate should match the target rate every second. Cells that are not at least 95% of the target have a red background to indicate a failure to satisfy the target.
| dbms | qr100.L1 | qp100.L2 | qr500.L3 | qp500.L4 | qr1000.L5 | qp1000.L6 |
|---|---|---|---|---|---|---|
| ma120301_rel_withdbg.cz12b_c32r128 | 1193 | 1191 | 3190 | 2049 | 1978 | 1437 |
| ma120301_rel_withdbg.cz12c_c32r128 | 1192 | 1191 | 3246 | 2080 | 2022 | 1463 |
| ma120301_rel_withdbg.cz12b_dw0_c32r128 | 1193 | 1193 | 5073 | 5813 | 7900 | 4134 |
| ma120301_rel_withdbg.cz12c_dw0_c32r128 | 1192 | 1192 | 4991 | 5819 | 8045 | 4012 |
| target | 1200 | 1200 | 6000 | 6000 | 12000 | 12000 |
l.i0
l.i0: load without secondary indexes. Graphs for performance per 1-second interval are here.
Average throughput:
Insert response time histogram: each cell has the percentage of responses that take <= the time in the header and max is the max response time in seconds. For the max column values in the top 25% of the range have a red background and in the bottom 25% of the range have a green background. The red background is not used when the min value is within 80% of the max value.
| dbms | 256us | 1ms | 4ms | 16ms | 64ms | 256ms | 1s | 4s | 16s | gt | max |
|---|---|---|---|---|---|---|---|---|---|---|---|
| ma120301_rel_withdbg.cz12b_c32r128 | 76.222 | 23.503 | 0.083 | 0.092 | 0.072 | 0.019 | 0.008 | nonzero | 5.010 | ||
| ma120301_rel_withdbg.cz12c_c32r128 | 54.122 | 45.567 | 0.088 | 0.093 | 0.063 | 0.053 | 0.014 | nonzero | 8.187 | ||
| ma120301_rel_withdbg.cz12b_dw0_c32r128 | 72.713 | 27.070 | 0.068 | 0.049 | 0.076 | 0.016 | 0.008 | nonzero | 5.913 | ||
| ma120301_rel_withdbg.cz12c_dw0_c32r128 | 53.176 | 46.614 | 0.080 | 0.032 | 0.040 | 0.046 | 0.013 | nonzero | 6.729 |
Performance metrics for the DBMS listed above. Some are normalized by throughput, others are not. Legend for results is here.
ips	qps	rps	rmbps	wps	wmbps	rpq	rkbpq	wpi	wkbpi	csps	cpups	cspq	cpupq	dbgb1	dbgb2	rss	maxop	p50	p99	tag
799467	0	2	0.0	4133.3	204.1	0.000	0.000	0.005	0.261	180689	37.8	0.226	15	236.8	337.6	101.2	5.010	69391	0	ma120301_rel_withdbg.cz12b_c32r128
670017	0	1	0.0	4360.3	248.4	0.000	0.000	0.007	0.380	208126	34.7	0.311	17	236.8	338.1	101.4	8.187	60392	0	ma120301_rel_withdbg.cz12c_c32r128
803392	0	2	0.0	4108.7	204.2	0.000	0.000	0.005	0.260	183965	38.3	0.229	15	236.8	337.6	101.3	5.913	66792	0	ma120301_rel_withdbg.cz12b_dw0_c32r128
706298	0	1	0.0	4568.6	261.4	0.000	0.000	0.006	0.379	214290	36.3	0.303	16	236.8	338.2	101.4	6.729	65692	0	ma120301_rel_withdbg.cz12c_dw0_c32r128
Average values from iostat.
r/s	rkB/s	rrqm/s	%rrqm	r_await	rareq-s	w/s	wkB/s	wrqm/s	%wrqm	w_await	wareq-s	d/s	dkB/s	drqm/s	%drqm	d_await	dareq-s	f/s	f_await	aqu-sz	%util
1.460	9.961	0.000	0.000	37.47	4.899	4133.3	209025	162.7	3.994	78.13	54.65	2.794	50.94	0.000	0.000	12.52	22.00	67.55	5.964	211.2	42.81		ma120301_rel_withdbg.cz12b_c32r128
1.183	8.333	0.000	0.000	15.61	4.633	4360.3	254356	133.9	3.032	82.03	60.39	1.286	66.58	0.000	0.000	17.29	54.08	49.47	14.50	197.6	53.39		ma120301_rel_withdbg.cz12c_c32r128
1.500	10.17	0.000	0.000	31.10	4.854	4108.7	209057	152.2	3.758	70.85	55.17	3.579	163.5	0.000	0.000	11.10	45.04	55.44	6.659	198.3	42.90		ma120301_rel_withdbg.cz12b_dw0_c32r128
1.312	9.108	0.000	0.000	20.03	4.923	4568.6	267674	127.0	2.622	89.22	61.99	1.336	22.41	0.000	0.000	25.28	15.22	37.72	21.23	214.0	55.97		ma120301_rel_withdbg.cz12c_dw0_c32r128
l.x
l.x: create secondary indexes.
Average throughput:
Performance metrics for the DBMS listed above. Some are normalized by throughput, others are not. Legend for results is here.
ips	qps	rps	rmbps	wps	wmbps	rpq	rkbpq	wpi	wkbpi	csps	cpups	cspq	cpupq	dbgb1	dbgb2	rss	maxop	p50	p99	tag
671642	0	7515	622.1	8357.5	697.4	0.011	0.949	0.012	1.063	30509	16.7	0.045	8	501.7	602.5	101.5	0.001	NA	NA	ma120301_rel_withdbg.cz12b_c32r128
679373	0	7629	633.5	8111.7	700.0	0.011	0.955	0.012	1.055	28847	16.5	0.042	8	501.7	603.0	101.6	0.004	NA	NA	ma120301_rel_withdbg.cz12c_c32r128
721443	0	8133	672.7	8974.1	749.0	0.011	0.955	0.012	1.063	32173	17.8	0.045	8	501.7	602.5	101.5	0.003	NA	NA	ma120301_rel_withdbg.cz12b_dw0_c32r128
694310	0	7796	647.6	8323.5	715.9	0.011	0.955	0.012	1.056	30100	16.9	0.043	8	501.7	603.1	101.6	0.004	NA	NA	ma120301_rel_withdbg.cz12c_dw0_c32r128
Average values from iostat.
r/s	rkB/s	rrqm/s	%rrqm	r_await	rareq-s	w/s	wkB/s	wrqm/s	%wrqm	w_await	wareq-s	d/s	dkB/s	drqm/s	%drqm	d_await	dareq-s	f/s	f_await	aqu-sz	%util
7514.6	637053	0.000	0.000	2.531	108.3	8357.5	714157	181.2	2.027	49.84	93.88	6.656	57823.6	0.000	0.000	0.232	296.2	34.26	20.86	227.6	94.13		ma120301_rel_withdbg.cz12b_c32r128
7629.1	648660	0.000	0.000	1.881	110.8	8111.7	716809	178.3	1.772	39.36	101.0	6.360	58466.3	0.000	0.000	0.081	157.5	34.78	20.42	217.3	97.34		ma120301_rel_withdbg.cz12c_c32r128
8132.7	688859	0.000	0.000	1.728	108.7	8974.1	767012	201.6	1.773	41.64	97.25	7.201	62074.4	0.000	0.000	0.176	222.9	38.98	19.16	224.7	97.15		ma120301_rel_withdbg.cz12b_dw0_c32r128
7796.0	663099	0.000	0.000	2.947	111.9	8323.5	733105	172.5	1.620	49.24	100.8	6.568	59766.1	0.001	0.000	0.234	240.3	36.20	23.79	231.7	97.52		ma120301_rel_withdbg.cz12c_dw0_c32r128
l.i1
l.i1: continue load after secondary indexes created with 50 inserts per transaction. Graphs for performance per 1-second interval are here.
Average throughput:
Insert response time histogram: each cell has the percentage of responses that take <= the time in the header and max is the max response time in seconds. For the max column values in the top 25% of the range have a red background and in the bottom 25% of the range have a green background. The red background is not used when the min value is within 80% of the max value.
| dbms | 256us | 1ms | 4ms | 16ms | 64ms | 256ms | 1s | 4s | 16s | gt | max |
|---|---|---|---|---|---|---|---|---|---|---|---|
| ma120301_rel_withdbg.cz12b_c32r128 | 0.132 | 56.060 | 42.776 | 1.025 | 0.007 | 5.810 | |||||
| ma120301_rel_withdbg.cz12c_c32r128 | 0.083 | 56.734 | 42.404 | 0.769 | 0.009 | 5.919 | |||||
| ma120301_rel_withdbg.cz12b_dw0_c32r128 | 0.182 | 48.326 | 39.613 | 11.743 | 0.122 | 0.013 | 8.217 | ||||
| ma120301_rel_withdbg.cz12c_dw0_c32r128 | 0.146 | 46.174 | 41.676 | 11.922 | 0.074 | 0.007 | 7.966 |
Delete response time histogram: each cell has the percentage of responses that take <= the time in the header and max is the max response time in seconds. For the max column values in the top 25% of the range have a red background and in the bottom 25% of the range have a green background. The red background is not used when the min value is within 80% of the max value.
| dbms | 256us | 1ms | 4ms | 16ms | 64ms | 256ms | 1s | 4s | 16s | gt | max |
|---|---|---|---|---|---|---|---|---|---|---|---|
| ma120301_rel_withdbg.cz12b_c32r128 | 0.026 | 1.461 | 65.375 | 32.688 | 0.445 | 0.006 | 5.777 | ||||
| ma120301_rel_withdbg.cz12c_c32r128 | 0.049 | 1.412 | 65.834 | 32.417 | 0.278 | 0.008 | 5.914 | ||||
| ma120301_rel_withdbg.cz12b_dw0_c32r128 | 2.392 | 75.814 | 11.026 | 10.700 | 0.061 | 0.008 | 8.204 | ||||
| ma120301_rel_withdbg.cz12c_dw0_c32r128 | 1.866 | 74.647 | 12.601 | 10.841 | 0.043 | 0.003 | 7.852 |
Performance metrics for the DBMS listed above. Some are normalized by throughput, others are not. Legend for results is here.
ips	qps	rps	rmbps	wps	wmbps	rpq	rkbpq	wpi	wkbpi	csps	cpups	cspq	cpupq	dbgb1	dbgb2	rss	maxop	p50	p99	tag
1982	0	10541	164.7	10851.9	276.9	5.319	85.102	5.475	143.077	147150	4.4	74.247	710	648.7	751.1	101.3	5.810	150	50	ma120301_rel_withdbg.cz12b_c32r128
2008	0	10670	166.7	10998.8	280.7	5.312	84.999	5.476	143.094	148387	4.4	73.879	701	648.6	751.5	101.3	5.919	150	50	ma120301_rel_withdbg.cz12c_c32r128
5893	0	31574	493.3	28733.6	482.2	5.358	85.725	4.876	83.783	328813	10.4	55.796	565	649.3	751.5	101.3	8.217	500	0	ma120301_rel_withdbg.cz12b_dw0_c32r128
5797	0	31032	484.9	28191.9	474.0	5.353	85.647	4.863	83.723	321966	10.1	55.539	558	649.1	751.8	101.3	7.966	500	0	ma120301_rel_withdbg.cz12c_dw0_c32r128
Average values from iostat.
r/s	rkB/s	rrqm/s	%rrqm	r_await	rareq-s	w/s	wkB/s	wrqm/s	%wrqm	w_await	wareq-s	d/s	dkB/s	drqm/s	%drqm	d_await	dareq-s	f/s	f_await	aqu-sz	%util
10541.4	168663	0.000	0.000	0.859	16.00	10851.9	283565	561.5	4.610	0.611	26.16	0.015	1.762	0.000	0.000	0.401	8.250	818.2	1.023	13.26	97.46		ma120301_rel_withdbg.cz12b_c32r128
10670.0	170720	0.000	0.000	0.843	16.00	10998.8	287405	516.7	4.222	0.581	26.16	0.174	1.158	0.000	0.000	1.720	2.470	829.2	0.994	13.14	97.41		ma120301_rel_withdbg.cz12c_c32r128
31574.1	505185	0.000	0.000	0.519	16.00	28733.6	493740	156.6	0.535	18.42	17.21	0.031	0.634	0.000	0.000	1.827	2.822	73.65	4.660	220.3	97.80		ma120301_rel_withdbg.cz12b_dw0_c32r128
31031.7	496506	0.000	0.000	0.525	16.00	28191.9	485350	170.2	0.609	12.18	17.24	1.386	5.725	0.000	0.000	2.190	1.527	77.24	2.907	195.7	97.93		ma120301_rel_withdbg.cz12c_dw0_c32r128
l.i2
l.i2: continue load after secondary indexes created with 5 inserts per transaction. Graphs for performance per 1-second interval are here.
Average throughput:
Insert response time histogram: each cell has the percentage of responses that take <= the time in the header and max is the max response time in seconds. For the max column values in the top 25% of the range have a red background and in the bottom 25% of the range have a green background. The red background is not used when the min value is within 80% of the max value.
| dbms | 256us | 1ms | 4ms | 16ms | 64ms | 256ms | 1s | 4s | 16s | gt | max |
|---|---|---|---|---|---|---|---|---|---|---|---|
| ma120301_rel_withdbg.cz12b_c32r128 | 0.067 | 2.561 | 18.926 | 56.576 | 21.809 | 0.057 | 0.003 | 2.560 | |||
| ma120301_rel_withdbg.cz12c_c32r128 | nonzero | 0.072 | 2.677 | 19.036 | 57.476 | 20.678 | 0.056 | 0.004 | 2.772 | ||
| ma120301_rel_withdbg.cz12b_dw0_c32r128 | 0.520 | 36.382 | 31.416 | 31.137 | 0.528 | 0.012 | 0.004 | 3.017 | |||
| ma120301_rel_withdbg.cz12c_dw0_c32r128 | 0.553 | 34.462 | 32.223 | 32.041 | 0.712 | 0.008 | 0.001 | 2.127 |
Delete response time histogram: each cell has the percentage of responses that take <= the time in the header and max is the max response time in seconds. For the max column values in the top 25% of the range have a red background and in the bottom 25% of the range have a green background. The red background is not used when the min value is within 80% of the max value.
| dbms | 256us | 1ms | 4ms | 16ms | 64ms | 256ms | 1s | 4s | 16s | gt | max |
|---|---|---|---|---|---|---|---|---|---|---|---|
| ma120301_rel_withdbg.cz12b_c32r128 | nonzero | 0.295 | 6.164 | 25.715 | 47.832 | 19.949 | 0.044 | 0.002 | 2.404 | ||
| ma120301_rel_withdbg.cz12c_c32r128 | nonzero | 0.325 | 6.393 | 25.723 | 48.622 | 18.896 | 0.039 | 0.003 | 2.206 | ||
| ma120301_rel_withdbg.cz12b_dw0_c32r128 | nonzero | 1.904 | 45.320 | 22.153 | 30.264 | 0.350 | 0.007 | 0.002 | 3.022 | ||
| ma120301_rel_withdbg.cz12c_dw0_c32r128 | nonzero | 1.967 | 43.224 | 23.293 | 31.026 | 0.486 | 0.003 | nonzero | 2.170 |
Performance metrics for the DBMS listed above. Some are normalized by throughput, others are not. Legend for results is here.
ips	qps	rps	rmbps	wps	wmbps	rpq	rkbpq	wpi	wkbpi	csps	cpups	cspq	cpupq	dbgb1	dbgb2	rss	maxop	p50	p99	tag
1484	0	11852	185.2	10938.8	283.7	7.985	127.763	7.370	195.757	140981	4.4	94.988	949	648.7	751.1	101.3	2.560	85	40	ma120301_rel_withdbg.cz12b_c32r128
1522	0	12170	190.2	11246.8	292.0	7.994	127.907	7.388	196.389	144611	4.6	94.989	967	648.6	751.5	101.3	2.772	90	40	ma120301_rel_withdbg.cz12c_c32r128
4001	0	31195	487.4	24249.6	407.8	7.796	124.739	6.060	104.371	317056	10.3	79.238	824	649.3	751.5	101.3	3.017	360	80	ma120301_rel_withdbg.cz12b_dw0_c32r128
3844	0	30043	469.4	23213.4	391.4	7.816	125.063	6.039	104.263	304389	9.8	79.194	816	649.1	751.8	101.3	2.127	355	80	ma120301_rel_withdbg.cz12c_dw0_c32r128
Average values from iostat.
r/s	rkB/s	rrqm/s	%rrqm	r_await	rareq-s	w/s	wkB/s	wrqm/s	%wrqm	w_await	wareq-s	d/s	dkB/s	drqm/s	%drqm	d_await	dareq-s	f/s	f_await	aqu-sz	%util
11851.6	189626	0.000	0.000	0.777	16.00	10938.8	290543	2.477	0.025	0.467	26.59	0.005	0.041	0.000	0.000	0.115	0.195	867.4	1.043	12.03	98.45		ma120301_rel_withdbg.cz12b_c32r128
12170.4	194726	0.000	0.000	0.740	16.00	11246.8	298982	3.770	0.034	0.403	26.60	0.088	0.701	0.000	0.000	0.937	1.500	892.1	0.983	11.82	98.43		ma120301_rel_withdbg.cz12c_c32r128
31194.8	499117	0.000	0.000	0.322	16.00	24249.6	417619	2.244	0.011	5.148	17.22	0.013	0.088	0.000	0.000	0.282	0.353	74.67	1.627	125.9	98.08		ma120301_rel_withdbg.cz12b_dw0_c32r128
30043.4	480694	0.000	0.000	0.351	16.00	23213.4	400744	46.55	0.212	5.028	17.26	2.037	8.742	0.000	0.000	1.302	1.334	80.14	1.647	110.7	98.19		ma120301_rel_withdbg.cz12c_dw0_c32r128
qr100.L1
qr100.L1: range queries with 100 insert/s per client. Graphs for performance per 1-second interval are here.
Average throughput:
Query response time histogram: each cell has the percentage of responses that take <= the time in the header and max is the max response time in seconds. For max values in the top 25% of the range have a red background and in the bottom 25% of the range have a green background. The red background is not used when the min value is within 80% of the max value.
| dbms | 256us | 1ms | 4ms | 16ms | 64ms | 256ms | 1s | 4s | 16s | gt | max |
|---|---|---|---|---|---|---|---|---|---|---|---|
| ma120301_rel_withdbg.cz12b_c32r128 | 99.421 | 0.468 | 0.085 | 0.017 | 0.007 | 0.001 | nonzero | 0.557 | |||
| ma120301_rel_withdbg.cz12c_c32r128 | 99.422 | 0.465 | 0.090 | 0.018 | 0.006 | nonzero | nonzero | 0.392 | |||
| ma120301_rel_withdbg.cz12b_dw0_c32r128 | 99.530 | 0.413 | 0.054 | 0.002 | 0.001 | nonzero | nonzero | 0.282 | |||
| ma120301_rel_withdbg.cz12c_dw0_c32r128 | 99.548 | 0.398 | 0.052 | 0.001 | 0.001 | nonzero | nonzero | nonzero | 1.083 |
Insert response time histogram: each cell has the percentage of responses that take <= the time in the header and max is the max response time in seconds. For max values in the top 25% of the range have a red background and in the bottom 25% of the range have a green background. The red background is not used when the min value is within 80% of the max value.
| dbms | 256us | 1ms | 4ms | 16ms | 64ms | 256ms | 1s | 4s | 16s | gt | max |
|---|---|---|---|---|---|---|---|---|---|---|---|
| ma120301_rel_withdbg.cz12b_c32r128 | 21.549 | 67.407 | 8.440 | 2.600 | 0.005 | 1.050 | |||||
| ma120301_rel_withdbg.cz12c_c32r128 | 18.123 | 71.030 | 9.083 | 1.759 | 0.005 | 1.045 | |||||
| ma120301_rel_withdbg.cz12b_dw0_c32r128 | 38.729 | 59.808 | 1.356 | 0.106 | 0.512 | ||||||
| ma120301_rel_withdbg.cz12c_dw0_c32r128 | 39.657 | 58.694 | 1.590 | 0.046 | 0.012 | 1.217 |
Delete response time histogram: each cell has the percentage of responses that take <= the time in the header and max is the max response time in seconds. For max values in the top 25% of the range have a red background and in the bottom 25% of the range have a green background. The red background is not used when the min value is within 80% of the max value.
| dbms | 256us | 1ms | 4ms | 16ms | 64ms | 256ms | 1s | 4s | 16s | gt | max |
|---|---|---|---|---|---|---|---|---|---|---|---|
| ma120301_rel_withdbg.cz12b_c32r128 | 43.093 | 47.630 | 7.058 | 2.220 | 0.901 | ||||||
| ma120301_rel_withdbg.cz12c_c32r128 | 39.808 | 51.755 | 6.917 | 1.521 | 0.881 | ||||||
| ma120301_rel_withdbg.cz12b_dw0_c32r128 | 71.907 | 27.106 | 0.933 | 0.053 | 0.472 | ||||||
| ma120301_rel_withdbg.cz12c_dw0_c32r128 | 73.144 | 25.715 | 1.125 | 0.009 | 0.007 | 1.140 |
Performance metrics for the DBMS listed above. Some are normalized by throughput, others are not. Legend for results is here.
ips	qps	rps	rmbps	wps	wmbps	rpq	rkbpq	wpi	wkbpi	csps	cpups	cspq	cpupq	dbgb1	dbgb2	rss	maxop	p50	p99	tag
1193	83703	5424	84.8	2984.8	80.1	0.065	1.037	2.503	68.800	517208	39.7	6.179	152	648.7	751.1	101.3	0.557	7279	2240	ma120301_rel_withdbg.cz12b_c32r128
1192	84853	5424	84.7	3037.1	81.4	0.064	1.023	2.548	69.946	523739	39.9	6.172	150	648.6	751.5	101.3	0.392	7359	2384	ma120301_rel_withdbg.cz12c_c32r128
1193	87204	5408	84.5	2460.9	43.5	0.062	0.992	2.063	37.360	536382	40.8	6.151	150	649.3	751.5	101.3	0.282	7391	5455	ma120301_rel_withdbg.cz12b_dw0_c32r128
1192	88150	5411	84.5	2508.3	44.5	0.061	0.982	2.104	38.189	542294	41.1	6.152	149	649.1	751.8	101.3	1.083	7471	5455	ma120301_rel_withdbg.cz12c_dw0_c32r128
Average values from iostat.
r/s	rkB/s	rrqm/s	%rrqm	r_await	rareq-s	w/s	wkB/s	wrqm/s	%wrqm	w_await	wareq-s	d/s	dkB/s	drqm/s	%drqm	d_await	dareq-s	f/s	f_await	aqu-sz	%util
5424.0	86784.1	0.000	0.000	0.270	16.00	2984.8	82057.7	1.551	0.328	0.299	37.16	0.008	0.349	0.000	0.000	0.272	1.735	223.1	0.646	2.420	29.10		ma120301_rel_withdbg.cz12b_c32r128
5423.5	86775.3	0.000	0.000	0.275	16.00	3037.1	83376.1	9.344	2.260	0.316	36.65	0.003	0.049	0.000	0.000	0.025	0.210	232.9	0.645	2.488	30.04		ma120301_rel_withdbg.cz12c_c32r128
5408.0	86527.2	0.000	0.000	0.151	16.00	2460.9	44559.8	1.290	0.297	1.690	29.31	0.008	0.161	0.000	0.000	0.047	0.624	21.84	0.665	7.592	15.00		ma120301_rel_withdbg.cz12b_dw0_c32r128
5410.7	86571.8	0.000	0.000	0.151	16.00	2508.3	45521.4	9.388	2.439	1.964	29.55	0.002	0.022	0.000	0.000	0.017	0.110	22.60	0.667	8.987	15.39		ma120301_rel_withdbg.cz12c_dw0_c32r128
qp100.L2
qp100.L2: point queries with 100 insert/s per client. Graphs for performance per 1-second interval are here.
Average throughput:
Query response time histogram: each cell has the percentage of responses that take <= the time in the header and max is the max response time in seconds. For max values in the top 25% of the range have a red background and in the bottom 25% of the range have a green background. The red background is not used when the min value is within 80% of the max value.
| dbms | 256us | 1ms | 4ms | 16ms | 64ms | 256ms | 1s | 4s | 16s | gt | max |
|---|---|---|---|---|---|---|---|---|---|---|---|
| ma120301_rel_withdbg.cz12b_c32r128 | 0.003 | 26.549 | 51.204 | 21.082 | 1.109 | 0.051 | 0.003 | 0.951 | |||
| ma120301_rel_withdbg.cz12c_c32r128 | 0.003 | 26.503 | 51.568 | 20.783 | 1.079 | 0.061 | 0.003 | 0.971 | |||
| ma120301_rel_withdbg.cz12b_dw0_c32r128 | 0.006 | 45.259 | 51.723 | 2.916 | 0.090 | 0.006 | nonzero | 0.918 | |||
| ma120301_rel_withdbg.cz12c_dw0_c32r128 | 0.005 | 45.527 | 51.188 | 3.175 | 0.100 | 0.005 | nonzero | 0.497 |
Insert response time histogram: each cell has the percentage of responses that take <= the time in the header and max is the max response time in seconds. For max values in the top 25% of the range have a red background and in the bottom 25% of the range have a green background. The red background is not used when the min value is within 80% of the max value.
| dbms | 256us | 1ms | 4ms | 16ms | 64ms | 256ms | 1s | 4s | 16s | gt | max |
|---|---|---|---|---|---|---|---|---|---|---|---|
| ma120301_rel_withdbg.cz12b_c32r128 | 0.660 | 62.729 | 32.414 | 3.942 | 0.255 | 1.746 | |||||
| ma120301_rel_withdbg.cz12c_c32r128 | 0.850 | 62.752 | 31.775 | 4.252 | 0.370 | 2.003 | |||||
| ma120301_rel_withdbg.cz12b_dw0_c32r128 | 0.199 | 89.090 | 10.060 | 0.639 | 0.012 | 1.727 | |||||
| ma120301_rel_withdbg.cz12c_dw0_c32r128 | 0.153 | 87.627 | 11.912 | 0.306 | 0.002 | 1.434 |
Delete response time histogram: each cell has the percentage of responses that take <= the time in the header and max is the max response time in seconds. For max values in the top 25% of the range have a red background and in the bottom 25% of the range have a green background. The red background is not used when the min value is within 80% of the max value.
| dbms | 256us | 1ms | 4ms | 16ms | 64ms | 256ms | 1s | 4s | 16s | gt | max |
|---|---|---|---|---|---|---|---|---|---|---|---|
| ma120301_rel_withdbg.cz12b_c32r128 | 12.347 | 64.215 | 20.005 | 3.308 | 0.125 | 1.410 | |||||
| ma120301_rel_withdbg.cz12c_c32r128 | 12.646 | 64.618 | 18.831 | 3.780 | 0.125 | 1.573 | |||||
| ma120301_rel_withdbg.cz12b_dw0_c32r128 | 0.836 | 93.310 | 5.412 | 0.433 | 0.009 | 1.703 | |||||
| ma120301_rel_withdbg.cz12c_dw0_c32r128 | 0.590 | 92.995 | 6.220 | 0.194 | 0.694 |
Performance metrics for the DBMS listed above. Some are normalized by throughput, others are not. Legend for results is here.
ips	qps	rps	rmbps	wps	wmbps	rpq	rkbpq	wpi	wkbpi	csps	cpups	cspq	cpupq	dbgb1	dbgb2	rss	maxop	p50	p99	tag
1191	4438	36959	577.5	8742.5	226.9	8.327	133.237	7.339	195.039	168032	7.1	37.860	512	648.7	751.1	101.3	0.951	352	16	ma120301_rel_withdbg.cz12b_c32r128
1191	4441	37006	578.2	8743.4	226.7	8.333	133.336	7.339	194.880	168337	7.0	37.908	504	648.6	751.5	101.3	0.971	384	16	ma120301_rel_withdbg.cz12c_c32r128
1193	9080	65266	1019.8	7874.7	126.6	7.188	115.003	6.602	108.682	247658	10.7	27.275	377	649.3	751.5	101.3	0.918	832	160	ma120301_rel_withdbg.cz12b_dw0_c32r128
1192	8991	64782	1012.2	7875.7	126.5	7.205	115.280	6.607	108.679	246979	10.5	27.469	374	649.1	751.8	101.3	0.497	816	176	ma120301_rel_withdbg.cz12c_dw0_c32r128
Average values from iostat.
r/s	rkB/s	rrqm/s	%rrqm	r_await	rareq-s	w/s	wkB/s	wrqm/s	%wrqm	w_await	wareq-s	d/s	dkB/s	drqm/s	%drqm	d_await	dareq-s	f/s	f_await	aqu-sz	%util
36959.1	591345	0.000	0.000	0.444	16.00	8742.5	232350	1.869	0.025	0.372	26.75	0.010	0.155	0.000	0.000	0.145	0.514	504.0	1.305	15.72	99.40		ma120301_rel_withdbg.cz12b_c32r128
37006.5	592104	0.000	0.000	0.435	16.00	8743.4	232161	36.11	0.502	0.618	26.73	0.009	0.057	0.000	0.000	0.108	0.232	518.0	1.259	17.28	99.38		ma120301_rel_withdbg.cz12c_c32r128
65265.6	1044250	0.000	0.000	0.191	16.00	7874.7	129625	1.507	0.023	2.034	16.58	0.011	0.261	0.000	0.000	0.177	0.994	111.1	1.018	33.71	98.83		ma120301_rel_withdbg.cz12b_dw0_c32r128
64781.7	1036507	0.000	0.000	0.189	16.00	7875.7	129545	16.91	0.269	1.789	16.56	0.004	0.049	0.000	0.000	0.094	0.193	131.8	0.900	28.88	98.81		ma120301_rel_withdbg.cz12c_dw0_c32r128
qr500.L3
qr500.L3: range queries with 500 insert/s per client. Graphs for performance per 1-second interval are here.
Average throughput:
Query response time histogram: each cell has the percentage of responses that take <= the time in the header and max is the max response time in seconds. For max values in the top 25% of the range have a red background and in the bottom 25% of the range have a green background. The red background is not used when the min value is within 80% of the max value.
| dbms | 256us | 1ms | 4ms | 16ms | 64ms | 256ms | 1s | 4s | 16s | gt | max |
|---|---|---|---|---|---|---|---|---|---|---|---|
| ma120301_rel_withdbg.cz12b_c32r128 | 93.699 | 4.294 | 1.168 | 0.608 | 0.219 | 0.013 | nonzero | 0.561 | |||
| ma120301_rel_withdbg.cz12c_c32r128 | 93.647 | 4.318 | 1.179 | 0.622 | 0.223 | 0.011 | nonzero | 0.391 | |||
| ma120301_rel_withdbg.cz12b_dw0_c32r128 | 96.852 | 2.462 | 0.528 | 0.093 | 0.054 | 0.009 | 0.002 | nonzero | 1.848 | ||
| ma120301_rel_withdbg.cz12c_dw0_c32r128 | 96.969 | 2.366 | 0.501 | 0.090 | 0.062 | 0.010 | 0.002 | nonzero | 1.385 |
Insert response time histogram: each cell has the percentage of responses that take <= the time in the header and max is the max response time in seconds. For max values in the top 25% of the range have a red background and in the bottom 25% of the range have a green background. The red background is not used when the min value is within 80% of the max value.
| dbms | 256us | 1ms | 4ms | 16ms | 64ms | 256ms | 1s | 4s | 16s | gt | max |
|---|---|---|---|---|---|---|---|---|---|---|---|
| ma120301_rel_withdbg.cz12b_c32r128 | 0.026 | 4.782 | 81.240 | 13.908 | 0.044 | 1.493 | |||||
| ma120301_rel_withdbg.cz12c_c32r128 | 0.020 | 3.834 | 82.452 | 13.670 | 0.023 | 1.435 | |||||
| ma120301_rel_withdbg.cz12b_dw0_c32r128 | 34.035 | 52.600 | 9.663 | 2.962 | 0.738 | 3.910 | |||||
| ma120301_rel_withdbg.cz12c_dw0_c32r128 | 38.410 | 47.317 | 10.225 | 3.242 | 0.806 | 2.820 |
Delete response time histogram: each cell has the percentage of responses that take <= the time in the header and max is the max response time in seconds. For max values in the top 25% of the range have a red background and in the bottom 25% of the range have a green background. The red background is not used when the min value is within 80% of the max value.
| dbms | 256us | 1ms | 4ms | 16ms | 64ms | 256ms | 1s | 4s | 16s | gt | max |
|---|---|---|---|---|---|---|---|---|---|---|---|
| ma120301_rel_withdbg.cz12b_c32r128 | 0.155 | 8.463 | 80.351 | 11.009 | 0.022 | 1.368 | |||||
| ma120301_rel_withdbg.cz12c_c32r128 | 0.125 | 8.062 | 81.739 | 10.067 | 0.006 | 1.183 | |||||
| ma120301_rel_withdbg.cz12b_dw0_c32r128 | 51.226 | 37.429 | 7.569 | 3.242 | 0.534 | 3.652 | |||||
| ma120301_rel_withdbg.cz12c_dw0_c32r128 | 54.799 | 32.756 | 8.375 | 3.469 | 0.602 | 2.672 |
Performance metrics for the DBMS listed above. Some are normalized by throughput, others are not. Legend for results is here.
ips	qps	rps	rmbps	wps	wmbps	rpq	rkbpq	wpi	wkbpi	csps	cpups	cspq	cpupq	dbgb1	dbgb2	rss	maxop	p50	p99	tag
3190	37823	12115	189.3	11413.0	293.6	0.320	5.125	3.578	94.248	416727	27.3	11.018	231	648.7	751.1	101.3	0.561	3168	704	ma120301_rel_withdbg.cz12b_c32r128
3246	37821	12294	192.1	11636.6	299.6	0.325	5.201	3.585	94.521	424837	27.5	11.233	233	648.6	751.5	101.3	0.391	3168	832	ma120301_rel_withdbg.cz12c_c32r128
5073	59249	21712	339.2	16110.9	271.5	0.366	5.863	3.176	54.805	558647	38.2	9.429	206	649.3	751.5	101.3	1.848	5823	64	ma120301_rel_withdbg.cz12b_dw0_c32r128
4991	59008	21407	334.5	15911.3	268.8	0.363	5.804	3.188	55.160	557952	37.8	9.456	205	649.1	751.8	101.3	1.385	5775	80	ma120301_rel_withdbg.cz12c_dw0_c32r128
Average values from iostat.
r/s	rkB/s	rrqm/s	%rrqm	r_await	rareq-s	w/s	wkB/s	wrqm/s	%wrqm	w_await	wareq-s	d/s	dkB/s	drqm/s	%drqm	d_await	dareq-s	f/s	f_await	aqu-sz	%util
12114.7	193835	0.000	0.000	0.763	16.00	11413.0	300613	2.180	0.023	0.505	26.38	0.007	0.219	0.000	0.000	0.142	0.969	904.2	0.967	12.53	96.83		ma120301_rel_withdbg.cz12b_c32r128
12293.7	196699	0.000	0.000	0.723	16.00	11636.6	306825	5.703	0.056	0.488	26.41	0.216	0.917	0.000	0.000	1.948	1.817	921.9	0.919	12.49	96.83		ma120301_rel_withdbg.cz12c_c32r128
21711.8	347389	0.000	0.000	0.818	16.00	16110.9	278016	1.765	0.014	39.53	17.31	0.027	0.342	0.000	0.000	1.174	1.254	32.00	5.983	405.3	87.41		ma120301_rel_withdbg.cz12b_dw0_c32r128
21406.7	342507	0.000	0.000	0.858	16.00	15911.3	275288	17.40	0.127	41.10	17.34	0.190	1.085	0.000	0.000	1.118	1.327	33.97	5.849	413.7	87.02		ma120301_rel_withdbg.cz12c_dw0_c32r128
qp500.L4
qp500.L4: point queries with 500 insert/s per client. Graphs for performance per 1-second interval are here.
Average throughput:
Query response time histogram: each cell has the percentage of responses that take <= the time in the header and max is the max response time in seconds. For max values in the top 25% of the range have a red background and in the bottom 25% of the range have a green background. The red background is not used when the min value is within 80% of the max value.
| dbms | 256us | 1ms | 4ms | 16ms | 64ms | 256ms | 1s | 4s | 16s | gt | max |
|---|---|---|---|---|---|---|---|---|---|---|---|
| ma120301_rel_withdbg.cz12b_c32r128 | 0.084 | 7.050 | 63.053 | 28.155 | 1.652 | 0.006 | 0.655 | ||||
| ma120301_rel_withdbg.cz12c_c32r128 | 0.093 | 7.516 | 64.173 | 27.235 | 0.978 | 0.004 | 0.706 | ||||
| ma120301_rel_withdbg.cz12b_dw0_c32r128 | 0.720 | 64.434 | 33.151 | 1.592 | 0.099 | 0.003 | nonzero | nonzero | 6.291 | ||
| ma120301_rel_withdbg.cz12c_dw0_c32r128 | 0.275 | 59.548 | 38.060 | 1.974 | 0.134 | 0.007 | 0.001 | 2.260 |
Insert response time histogram: each cell has the percentage of responses that take <= the time in the header and max is the max response time in seconds. For max values in the top 25% of the range have a red background and in the bottom 25% of the range have a green background. The red background is not used when the min value is within 80% of the max value.
| dbms | 256us | 1ms | 4ms | 16ms | 64ms | 256ms | 1s | 4s | 16s | gt | max |
|---|---|---|---|---|---|---|---|---|---|---|---|
| ma120301_rel_withdbg.cz12b_c32r128 | 0.001 | 0.055 | 58.618 | 40.515 | 0.811 | 2.073 | |||||
| ma120301_rel_withdbg.cz12c_c32r128 | 0.049 | 57.564 | 41.967 | 0.420 | 2.012 | ||||||
| ma120301_rel_withdbg.cz12b_dw0_c32r128 | 1.197 | 69.892 | 28.097 | 0.807 | 0.002 | 0.005 | 6.471 | ||||
| ma120301_rel_withdbg.cz12c_dw0_c32r128 | 0.688 | 68.596 | 29.879 | 0.803 | 0.032 | 0.002 | 6.163 |
Delete response time histogram: each cell has the percentage of responses that take <= the time in the header and max is the max response time in seconds. For max values in the top 25% of the range have a red background and in the bottom 25% of the range have a green background. The red background is not used when the min value is within 80% of the max value.
| dbms | 256us | 1ms | 4ms | 16ms | 64ms | 256ms | 1s | 4s | 16s | gt | max |
|---|---|---|---|---|---|---|---|---|---|---|---|
| ma120301_rel_withdbg.cz12b_c32r128 | 0.001 | 0.077 | 59.542 | 39.888 | 0.492 | 1.979 | |||||
| ma120301_rel_withdbg.cz12c_c32r128 | 0.063 | 58.605 | 41.081 | 0.251 | 1.762 | ||||||
| ma120301_rel_withdbg.cz12b_dw0_c32r128 | 5.500 | 74.802 | 19.143 | 0.550 | 0.006 | 6.499 | |||||
| ma120301_rel_withdbg.cz12c_dw0_c32r128 | 3.594 | 75.876 | 19.908 | 0.588 | 0.033 | 3.973 |
Performance metrics for the DBMS listed above. Some are normalized by throughput, others are not. Legend for results is here.
ips	qps	rps	rmbps	wps	wmbps	rpq	rkbpq	wpi	wkbpi	csps	cpups	cspq	cpupq	dbgb1	dbgb2	rss	maxop	p50	p99	tag
2049	845	17005	265.7	10947.2	278.5	20.125	321.995	5.343	139.208	192427	5.6	227.725	2121	648.8	751.2	101.3	0.655	64	16	ma120301_rel_withdbg.cz12b_c32r128
2080	887	17611	275.2	11218.4	285.7	19.846	317.536	5.394	140.689	196799	5.8	221.771	2092	648.7	751.6	101.3	0.706	64	16	ma120301_rel_withdbg.cz12c_c32r128
5813	3060	54273	848.0	22974.9	378.3	17.738	283.801	3.953	66.643	419956	14.7	137.249	1537	649.3	751.5	101.3	6.291	288	48	ma120301_rel_withdbg.cz12b_dw0_c32r128
5819	2731	51386	802.9	22472.7	371.6	18.816	301.063	3.862	65.388	428228	14.4	156.808	1687	649.1	751.8	101.3	2.260	256	48	ma120301_rel_withdbg.cz12c_dw0_c32r128
Average values from iostat.
r/s	rkB/s	rrqm/s	%rrqm	r_await	rareq-s	w/s	wkB/s	wrqm/s	%wrqm	w_await	wareq-s	d/s	dkB/s	drqm/s	%drqm	d_await	dareq-s	f/s	f_await	aqu-sz	%util
17005.4	272086	0.000	0.000	0.924	16.00	10947.2	285223	8.660	0.085	0.492	26.06	0.007	0.252	0.000	0.000	0.210	1.121	887.3	1.028	18.49	98.06		ma120301_rel_withdbg.cz12b_c32r128
17611.4	281782	0.000	0.000	0.888	16.00	11218.4	292592	8.757	0.081	0.417	26.08	0.102	0.415	0.000	0.000	1.043	0.921	909.4	0.979	18.38	98.07		ma120301_rel_withdbg.cz12c_c32r128
54273.4	868375	0.000	0.000	0.735	16.00	22974.9	387378	1.985	0.011	9.352	16.87	0.029	0.304	0.000	0.000	0.550	1.281	96.92	2.903	132.6	98.96		ma120301_rel_withdbg.cz12b_dw0_c32r128
51385.8	822173	0.000	0.000	0.469	16.00	22472.7	380487	49.05	0.220	9.918	16.94	2.560	33.01	0.000	0.000	1.497	4.342	89.35	2.209	185.9	98.94		ma120301_rel_withdbg.cz12c_dw0_c32r128
qr1000.L5
qr1000.L5: range queries with 1000 insert/s per client. Graphs for performance per 1-second interval are here.
Average throughput:
Query response time histogram: each cell has the percentage of responses that take <= the time in the header and max is the max response time in seconds. For max values in the top 25% of the range have a red background and in the bottom 25% of the range have a green background. The red background is not used when the min value is within 80% of the max value.
| dbms | 256us | 1ms | 4ms | 16ms | 64ms | 256ms | 1s | 4s | 16s | gt | max |
|---|---|---|---|---|---|---|---|---|---|---|---|
| ma120301_rel_withdbg.cz12b_c32r128 | 93.115 | 5.159 | 1.258 | 0.377 | 0.088 | 0.003 | nonzero | nonzero | nonzero | 4.623 | |
| ma120301_rel_withdbg.cz12c_c32r128 | 93.162 | 5.116 | 1.253 | 0.382 | 0.085 | 0.002 | nonzero | nonzero | nonzero | 4.021 | |
| ma120301_rel_withdbg.cz12b_dw0_c32r128 | 89.494 | 7.924 | 2.277 | 0.267 | 0.032 | 0.005 | 0.001 | nonzero | nonzero | 6.345 | |
| ma120301_rel_withdbg.cz12c_dw0_c32r128 | 89.545 | 7.901 | 2.242 | 0.276 | 0.030 | 0.005 | nonzero | nonzero | nonzero | 7.606 |
Insert response time histogram: each cell has the percentage of responses that take <= the time in the header and max is the max response time in seconds. For max values in the top 25% of the range have a red background and in the bottom 25% of the range have a green background. The red background is not used when the min value is within 80% of the max value.
| dbms | 256us | 1ms | 4ms | 16ms | 64ms | 256ms | 1s | 4s | 16s | gt | max |
|---|---|---|---|---|---|---|---|---|---|---|---|
| ma120301_rel_withdbg.cz12b_c32r128 | 0.074 | 48.468 | 50.728 | 0.718 | 0.012 | 6.257 | |||||
| ma120301_rel_withdbg.cz12c_c32r128 | nonzero | 0.111 | 48.624 | 50.871 | 0.381 | 0.013 | 5.091 | ||||
| ma120301_rel_withdbg.cz12b_dw0_c32r128 | 0.481 | 68.903 | 26.224 | 4.169 | 0.171 | 0.051 | 8.509 | ||||
| ma120301_rel_withdbg.cz12c_dw0_c32r128 | 0.240 | 68.882 | 26.438 | 4.291 | 0.109 | 0.041 | 8.052 |
Delete response time histogram: each cell has the percentage of responses that take <= the time in the header and max is the max response time in seconds. For max values in the top 25% of the range have a red background and in the bottom 25% of the range have a green background. The red background is not used when the min value is within 80% of the max value.
| dbms | 256us | 1ms | 4ms | 16ms | 64ms | 256ms | 1s | 4s | 16s | gt | max |
|---|---|---|---|---|---|---|---|---|---|---|---|
| ma120301_rel_withdbg.cz12b_c32r128 | 0.254 | 49.684 | 49.617 | 0.436 | 0.010 | 6.176 | |||||
| ma120301_rel_withdbg.cz12c_c32r128 | nonzero | 0.307 | 50.037 | 49.393 | 0.253 | 0.011 | 4.993 | ||||
| ma120301_rel_withdbg.cz12b_dw0_c32r128 | 1.226 | 78.505 | 16.109 | 4.006 | 0.124 | 0.029 | 8.628 | ||||
| ma120301_rel_withdbg.cz12c_dw0_c32r128 | 0.660 | 79.205 | 15.921 | 4.119 | 0.066 | 0.028 | 8.045 |
Performance metrics for the DBMS listed above. Some are normalized by throughput, others are not. Legend for results is here.
ips	qps	rps	rmbps	wps	wmbps	rpq	rkbpq	wpi	wkbpi	csps	cpups	cspq	cpupq	dbgb1	dbgb2	rss	maxop	p50	p99	tag
1978	46389	11607	181.4	10863.2	279.1	0.250	4.003	5.491	144.463	412910	32.5	8.901	224	648.8	751.2	101.3	4.623	4063	1264	ma120301_rel_withdbg.cz12b_c32r128
2022	46894	11868	185.4	11127.1	286.1	0.253	4.049	5.504	144.902	419186	32.7	8.939	223	648.8	751.7	101.3	4.021	4127	1232	ma120301_rel_withdbg.cz12c_c32r128
7900	43374	31024	484.7	28447.4	460.3	0.715	11.444	3.601	59.663	608387	40.9	14.027	302	649.5	751.8	101.3	6.345	3792	0	ma120301_rel_withdbg.cz12b_dw0_c32r128
8045	44194	31570	493.3	28882.0	468.5	0.714	11.430	3.590	59.637	630254	41.8	14.261	303	649.3	752.1	101.3	7.606	3839	0	ma120301_rel_withdbg.cz12c_dw0_c32r128
Average values from iostat.
r/s	rkB/s	rrqm/s	%rrqm	r_await	rareq-s	w/s	wkB/s	wrqm/s	%wrqm	w_await	wareq-s	d/s	dkB/s	drqm/s	%drqm	d_await	dareq-s	f/s	f_await	aqu-sz	%util
11607.4	185718	0.000	0.000	0.815	16.00	10863.2	285777	3.556	0.036	0.454	26.32	0.008	0.124	0.000	0.000	0.217	0.598	882.8	1.013	12.02	97.78		ma120301_rel_withdbg.cz12b_c32r128
11868.4	189895	0.000	0.000	0.786	16.00	11127.1	292948	5.366	0.049	0.390	26.33	0.066	0.282	0.000	0.000	0.684	0.607	904.0	0.968	11.79	97.72		ma120301_rel_withdbg.cz12c_c32r128
31023.9	496383	0.000	0.000	1.744	16.00	28447.4	471371	6.886	0.031	77.80	16.60	0.025	0.619	0.000	0.000	0.713	2.128	58.90	17.88	375.4	98.71		ma120301_rel_withdbg.cz12b_dw0_c32r128
31570.3	505125	0.000	0.000	0.897	16.00	28882.0	479757	20.66	0.078	45.64	16.61	1.036	4.700	0.000	0.000	2.430	2.320	61.34	9.338	295.4	98.62		ma120301_rel_withdbg.cz12c_dw0_c32r128
qp1000.L6
qp1000.L6: point queries with 1000 insert/s per client. Graphs for performance per 1-second interval are here.
Average throughput:
Query response time histogram: each cell has the percentage of responses that take <= the time in the header and max is the max response time in seconds. For max values in the top 25% of the range have a red background and in the bottom 25% of the range have a green background. The red background is not used when the min value is within 80% of the max value.
| dbms | 256us | 1ms | 4ms | 16ms | 64ms | 256ms | 1s | 4s | 16s | gt | max |
|---|---|---|---|---|---|---|---|---|---|---|---|
| ma120301_rel_withdbg.cz12b_c32r128 | nonzero | 0.201 | 12.328 | 78.361 | 9.005 | 0.104 | 0.001 | 0.001 | 3.816 | ||
| ma120301_rel_withdbg.cz12c_c32r128 | nonzero | 0.200 | 12.367 | 78.695 | 8.650 | 0.086 | nonzero | nonzero | 1.401 | ||
| ma120301_rel_withdbg.cz12b_dw0_c32r128 | nonzero | 1.844 | 65.366 | 31.935 | 0.838 | 0.016 | 0.001 | nonzero | 3.289 | ||
| ma120301_rel_withdbg.cz12c_dw0_c32r128 | nonzero | 1.888 | 62.948 | 34.373 | 0.779 | 0.011 | nonzero | nonzero | nonzero | 7.006 |
Insert response time histogram: each cell has the percentage of responses that take <= the time in the header and max is the max response time in seconds. For max values in the top 25% of the range have a red background and in the bottom 25% of the range have a green background. The red background is not used when the min value is within 80% of the max value.
| dbms | 256us | 1ms | 4ms | 16ms | 64ms | 256ms | 1s | 4s | 16s | gt | max |
|---|---|---|---|---|---|---|---|---|---|---|---|
| ma120301_rel_withdbg.cz12b_c32r128 | 0.026 | 9.635 | 89.159 | 1.172 | 0.009 | 4.656 | |||||
| ma120301_rel_withdbg.cz12c_c32r128 | 0.022 | 9.825 | 89.274 | 0.880 | 2.496 | ||||||
| ma120301_rel_withdbg.cz12b_dw0_c32r128 | 0.021 | 37.480 | 32.622 | 29.862 | 0.013 | 0.001 | 4.586 | ||||
| ma120301_rel_withdbg.cz12c_dw0_c32r128 | 0.028 | 35.562 | 33.383 | 31.015 | 0.009 | 0.003 | 8.381 |
Delete response time histogram: each cell has the percentage of responses that take <= the time in the header and max is the max response time in seconds. For max values in the top 25% of the range have a red background and in the bottom 25% of the range have a green background. The red background is not used when the min value is within 80% of the max value.
| dbms | 256us | 1ms | 4ms | 16ms | 64ms | 256ms | 1s | 4s | 16s | gt | max |
|---|---|---|---|---|---|---|---|---|---|---|---|
| ma120301_rel_withdbg.cz12b_c32r128 | 0.035 | 9.792 | 89.514 | 0.650 | 0.009 | 4.628 | |||||
| ma120301_rel_withdbg.cz12c_c32r128 | 0.025 | 10.012 | 89.449 | 0.515 | 2.142 | ||||||
| ma120301_rel_withdbg.cz12b_dw0_c32r128 | 0.035 | 49.738 | 20.600 | 29.618 | 0.009 | 3.558 | |||||
| ma120301_rel_withdbg.cz12c_dw0_c32r128 | 0.053 | 48.575 | 20.618 | 30.747 | 0.005 | 0.003 | 8.322 |
Performance metrics for the DBMS listed above. Some are normalized by throughput, others are not. Legend for results is here.
ips	qps	rps	rmbps	wps	wmbps	rpq	rkbpq	wpi	wkbpi	csps	cpups	cspq	cpupq	dbgb1	dbgb2	rss	maxop	p50	p99	tag
1437	1342	21004	328.2	10147.6	259.4	15.646	250.339	7.062	184.855	164270	5.6	122.371	1335	648.8	751.4	101.3	3.816	128	32	ma120301_rel_withdbg.cz12b_c32r128
1463	1366	21382	334.1	10327.8	264.2	15.655	250.485	7.060	184.928	167519	5.7	122.653	1335	648.8	751.9	101.3	1.401	128	32	ma120301_rel_withdbg.cz12c_c32r128
4134	3460	57269	894.8	23785.9	382.5	16.551	264.814	5.754	94.741	345659	12.4	99.896	1147	649.5	751.8	101.3	3.289	288	144	ma120301_rel_withdbg.cz12b_dw0_c32r128
4012	3360	55647	869.5	23152.6	372.9	16.564	265.026	5.771	95.186	336676	12.2	100.216	1162	649.3	752.1	101.3	7.006	272	144	ma120301_rel_withdbg.cz12c_dw0_c32r128
Average values from iostat.
r/s	rkB/s	rrqm/s	%rrqm	r_await	rareq-s	w/s	wkB/s	wrqm/s	%wrqm	w_await	wareq-s	d/s	dkB/s	drqm/s	%drqm	d_await	dareq-s	f/s	f_await	aqu-sz	%util
21003.5	336055	0.000	0.000	0.900	16.00	10147.6	265618	7.020	0.072	0.442	26.18	0.007	0.149	0.000	0.000	0.208	0.733	827.5	1.096	20.57	98.91		ma120301_rel_withdbg.cz12b_c32r128
21382.1	342113	0.000	0.000	0.877	16.00	10327.8	270532	7.284	0.072	0.395	26.20	0.128	2.262	0.000	0.000	1.340	5.173	842.3	1.057	20.46	98.93		ma120301_rel_withdbg.cz12c_c32r128
57269.3	916309	0.000	0.000	0.424	16.00	23785.9	391649	5.114	0.022	4.021	16.47	0.021	0.259	0.000	0.000	0.517	1.166	144.4	1.297	107.7	99.37		ma120301_rel_withdbg.cz12b_dw0_c32r128
55647.2	890355	0.000	0.000	0.439	16.00	23152.6	381866	62.32	0.274	3.272	16.49	2.304	9.364	0.000	0.000	1.001	1.053	150.6	1.339	82.89	99.36		ma120301_rel_withdbg.cz12c_dw0_c32r128
l.i0
l.i0: load without secondary indexes
Performance metrics for all DBMS, not just the ones listed above. Some are normalized by throughput, others are not. Legend for results is here.
ips	qps	rps	rmbps	wps	wmbps	rpq	rkbpq	wpi	wkbpi	csps	cpups	cspq	cpupq	dbgb1	dbgb2	rss	maxop	p50	p99	tag
799467	0	2	0.0	4133.3	204.1	0.000	0.000	0.005	0.261	180689	37.8	0.226	15	236.8	337.6	101.2	5.010	69391	0	ma120301_rel_withdbg.cz12b_c32r128
670017	0	1	0.0	4360.3	248.4	0.000	0.000	0.007	0.380	208126	34.7	0.311	17	236.8	338.1	101.4	8.187	60392	0	ma120301_rel_withdbg.cz12c_c32r128
803392	0	2	0.0	4108.7	204.2	0.000	0.000	0.005	0.260	183965	38.3	0.229	15	236.8	337.6	101.3	5.913	66792	0	ma120301_rel_withdbg.cz12b_dw0_c32r128
706298	0	1	0.0	4568.6	261.4	0.000	0.000	0.006	0.379	214290	36.3	0.303	16	236.8	338.2	101.4	6.729	65692	0	ma120301_rel_withdbg.cz12c_dw0_c32r128
l.x
l.x: create secondary indexes
Performance metrics for all DBMS, not just the ones listed above. Some are normalized by throughput, others are not. Legend for results is here.
ips	qps	rps	rmbps	wps	wmbps	rpq	rkbpq	wpi	wkbpi	csps	cpups	cspq	cpupq	dbgb1	dbgb2	rss	maxop	p50	p99	tag
671642	0	7515	622.1	8357.5	697.4	0.011	0.949	0.012	1.063	30509	16.7	0.045	8	501.7	602.5	101.5	0.001	NA	NA	ma120301_rel_withdbg.cz12b_c32r128
679373	0	7629	633.5	8111.7	700.0	0.011	0.955	0.012	1.055	28847	16.5	0.042	8	501.7	603.0	101.6	0.004	NA	NA	ma120301_rel_withdbg.cz12c_c32r128
721443	0	8133	672.7	8974.1	749.0	0.011	0.955	0.012	1.063	32173	17.8	0.045	8	501.7	602.5	101.5	0.003	NA	NA	ma120301_rel_withdbg.cz12b_dw0_c32r128
694310	0	7796	647.6	8323.5	715.9	0.011	0.955	0.012	1.056	30100	16.9	0.043	8	501.7	603.1	101.6	0.004	NA	NA	ma120301_rel_withdbg.cz12c_dw0_c32r128
l.i1
l.i1: continue load after secondary indexes created with 50 inserts per transaction
Performance metrics for all DBMS, not just the ones listed above. Some are normalized by throughput, others are not. Legend for results is here.
ips	qps	rps	rmbps	wps	wmbps	rpq	rkbpq	wpi	wkbpi	csps	cpups	cspq	cpupq	dbgb1	dbgb2	rss	maxop	p50	p99	tag
1982	0	10541	164.7	10851.9	276.9	5.319	85.102	5.475	143.077	147150	4.4	74.247	710	648.7	751.1	101.3	5.810	150	50	ma120301_rel_withdbg.cz12b_c32r128
2008	0	10670	166.7	10998.8	280.7	5.312	84.999	5.476	143.094	148387	4.4	73.879	701	648.6	751.5	101.3	5.919	150	50	ma120301_rel_withdbg.cz12c_c32r128
5893	0	31574	493.3	28733.6	482.2	5.358	85.725	4.876	83.783	328813	10.4	55.796	565	649.3	751.5	101.3	8.217	500	0	ma120301_rel_withdbg.cz12b_dw0_c32r128
5797	0	31032	484.9	28191.9	474.0	5.353	85.647	4.863	83.723	321966	10.1	55.539	558	649.1	751.8	101.3	7.966	500	0	ma120301_rel_withdbg.cz12c_dw0_c32r128
l.i2
l.i2: continue load after secondary indexes created with 5 inserts per transaction
Performance metrics for all DBMS, not just the ones listed above. Some are normalized by throughput, others are not. Legend for results is here.
ips	qps	rps	rmbps	wps	wmbps	rpq	rkbpq	wpi	wkbpi	csps	cpups	cspq	cpupq	dbgb1	dbgb2	rss	maxop	p50	p99	tag
1484	0	11852	185.2	10938.8	283.7	7.985	127.763	7.370	195.757	140981	4.4	94.988	949	648.7	751.1	101.3	2.560	85	40	ma120301_rel_withdbg.cz12b_c32r128
1522	0	12170	190.2	11246.8	292.0	7.994	127.907	7.388	196.389	144611	4.6	94.989	967	648.6	751.5	101.3	2.772	90	40	ma120301_rel_withdbg.cz12c_c32r128
4001	0	31195	487.4	24249.6	407.8	7.796	124.739	6.060	104.371	317056	10.3	79.238	824	649.3	751.5	101.3	3.017	360	80	ma120301_rel_withdbg.cz12b_dw0_c32r128
3844	0	30043	469.4	23213.4	391.4	7.816	125.063	6.039	104.263	304389	9.8	79.194	816	649.1	751.8	101.3	2.127	355	80	ma120301_rel_withdbg.cz12c_dw0_c32r128
qr100.L1
qr100.L1: range queries with 100 insert/s per client
Performance metrics for all DBMS, not just the ones listed above. Some are normalized by throughput, others are not. Legend for results is here.
ips	qps	rps	rmbps	wps	wmbps	rpq	rkbpq	wpi	wkbpi	csps	cpups	cspq	cpupq	dbgb1	dbgb2	rss	maxop	p50	p99	tag
1193	83703	5424	84.8	2984.8	80.1	0.065	1.037	2.503	68.800	517208	39.7	6.179	152	648.7	751.1	101.3	0.557	7279	2240	ma120301_rel_withdbg.cz12b_c32r128
1192	84853	5424	84.7	3037.1	81.4	0.064	1.023	2.548	69.946	523739	39.9	6.172	150	648.6	751.5	101.3	0.392	7359	2384	ma120301_rel_withdbg.cz12c_c32r128
1193	87204	5408	84.5	2460.9	43.5	0.062	0.992	2.063	37.360	536382	40.8	6.151	150	649.3	751.5	101.3	0.282	7391	5455	ma120301_rel_withdbg.cz12b_dw0_c32r128
1192	88150	5411	84.5	2508.3	44.5	0.061	0.982	2.104	38.189	542294	41.1	6.152	149	649.1	751.8	101.3	1.083	7471	5455	ma120301_rel_withdbg.cz12c_dw0_c32r128
qp100.L2
qp100.L2: point queries with 100 insert/s per client
Performance metrics for all DBMS, not just the ones listed above. Some are normalized by throughput, others are not. Legend for results is here.
ips	qps	rps	rmbps	wps	wmbps	rpq	rkbpq	wpi	wkbpi	csps	cpups	cspq	cpupq	dbgb1	dbgb2	rss	maxop	p50	p99	tag
1191	4438	36959	577.5	8742.5	226.9	8.327	133.237	7.339	195.039	168032	7.1	37.860	512	648.7	751.1	101.3	0.951	352	16	ma120301_rel_withdbg.cz12b_c32r128
1191	4441	37006	578.2	8743.4	226.7	8.333	133.336	7.339	194.880	168337	7.0	37.908	504	648.6	751.5	101.3	0.971	384	16	ma120301_rel_withdbg.cz12c_c32r128
1193	9080	65266	1019.8	7874.7	126.6	7.188	115.003	6.602	108.682	247658	10.7	27.275	377	649.3	751.5	101.3	0.918	832	160	ma120301_rel_withdbg.cz12b_dw0_c32r128
1192	8991	64782	1012.2	7875.7	126.5	7.205	115.280	6.607	108.679	246979	10.5	27.469	374	649.1	751.8	101.3	0.497	816	176	ma120301_rel_withdbg.cz12c_dw0_c32r128
qr500.L3
qr500.L3: range queries with 500 insert/s per client
Performance metrics for all DBMS, not just the ones listed above. Some are normalized by throughput, others are not. Legend for results is here.
ips	qps	rps	rmbps	wps	wmbps	rpq	rkbpq	wpi	wkbpi	csps	cpups	cspq	cpupq	dbgb1	dbgb2	rss	maxop	p50	p99	tag
3190	37823	12115	189.3	11413.0	293.6	0.320	5.125	3.578	94.248	416727	27.3	11.018	231	648.7	751.1	101.3	0.561	3168	704	ma120301_rel_withdbg.cz12b_c32r128
3246	37821	12294	192.1	11636.6	299.6	0.325	5.201	3.585	94.521	424837	27.5	11.233	233	648.6	751.5	101.3	0.391	3168	832	ma120301_rel_withdbg.cz12c_c32r128
5073	59249	21712	339.2	16110.9	271.5	0.366	5.863	3.176	54.805	558647	38.2	9.429	206	649.3	751.5	101.3	1.848	5823	64	ma120301_rel_withdbg.cz12b_dw0_c32r128
4991	59008	21407	334.5	15911.3	268.8	0.363	5.804	3.188	55.160	557952	37.8	9.456	205	649.1	751.8	101.3	1.385	5775	80	ma120301_rel_withdbg.cz12c_dw0_c32r128
qp500.L4
qp500.L4: point queries with 500 insert/s per client
Performance metrics for all DBMS, not just the ones listed above. Some are normalized by throughput, others are not. Legend for results is here.
ips	qps	rps	rmbps	wps	wmbps	rpq	rkbpq	wpi	wkbpi	csps	cpups	cspq	cpupq	dbgb1	dbgb2	rss	maxop	p50	p99	tag
2049	845	17005	265.7	10947.2	278.5	20.125	321.995	5.343	139.208	192427	5.6	227.725	2121	648.8	751.2	101.3	0.655	64	16	ma120301_rel_withdbg.cz12b_c32r128
2080	887	17611	275.2	11218.4	285.7	19.846	317.536	5.394	140.689	196799	5.8	221.771	2092	648.7	751.6	101.3	0.706	64	16	ma120301_rel_withdbg.cz12c_c32r128
5813	3060	54273	848.0	22974.9	378.3	17.738	283.801	3.953	66.643	419956	14.7	137.249	1537	649.3	751.5	101.3	6.291	288	48	ma120301_rel_withdbg.cz12b_dw0_c32r128
5819	2731	51386	802.9	22472.7	371.6	18.816	301.063	3.862	65.388	428228	14.4	156.808	1687	649.1	751.8	101.3	2.260	256	48	ma120301_rel_withdbg.cz12c_dw0_c32r128
qr1000.L5
qr1000.L5: range queries with 1000 insert/s per client
Performance metrics for all DBMS, not just the ones listed above. Some are normalized by throughput, others are not. Legend for results is here.
ips	qps	rps	rmbps	wps	wmbps	rpq	rkbpq	wpi	wkbpi	csps	cpups	cspq	cpupq	dbgb1	dbgb2	rss	maxop	p50	p99	tag
1978	46389	11607	181.4	10863.2	279.1	0.250	4.003	5.491	144.463	412910	32.5	8.901	224	648.8	751.2	101.3	4.623	4063	1264	ma120301_rel_withdbg.cz12b_c32r128
2022	46894	11868	185.4	11127.1	286.1	0.253	4.049	5.504	144.902	419186	32.7	8.939	223	648.8	751.7	101.3	4.021	4127	1232	ma120301_rel_withdbg.cz12c_c32r128
7900	43374	31024	484.7	28447.4	460.3	0.715	11.444	3.601	59.663	608387	40.9	14.027	302	649.5	751.8	101.3	6.345	3792	0	ma120301_rel_withdbg.cz12b_dw0_c32r128
8045	44194	31570	493.3	28882.0	468.5	0.714	11.430	3.590	59.637	630254	41.8	14.261	303	649.3	752.1	101.3	7.606	3839	0	ma120301_rel_withdbg.cz12c_dw0_c32r128
qp1000.L6
qp1000.L6: point queries with 1000 insert/s per client
Performance metrics for all DBMS, not just the ones listed above. Some are normalized by throughput, others are not. Legend for results is here.
ips	qps	rps	rmbps	wps	wmbps	rpq	rkbpq	wpi	wkbpi	csps	cpups	cspq	cpupq	dbgb1	dbgb2	rss	maxop	p50	p99	tag
1437	1342	21004	328.2	10147.6	259.4	15.646	250.339	7.062	184.855	164270	5.6	122.371	1335	648.8	751.4	101.3	3.816	128	32	ma120301_rel_withdbg.cz12b_c32r128
1463	1366	21382	334.1	10327.8	264.2	15.655	250.485	7.060	184.928	167519	5.7	122.653	1335	648.8	751.9	101.3	1.401	128	32	ma120301_rel_withdbg.cz12c_c32r128
4134	3460	57269	894.8	23785.9	382.5	16.551	264.814	5.754	94.741	345659	12.4	99.896	1147	649.5	751.8	101.3	3.289	288	144	ma120301_rel_withdbg.cz12b_dw0_c32r128
4012	3360	55647	869.5	23152.6	372.9	16.564	265.026	5.771	95.186	336676	12.2	100.216	1162	649.3	752.1	101.3	7.006	272	144	ma120301_rel_withdbg.cz12c_dw0_c32r128
l.i0
- l.i0: load without secondary indexes
- Legend for results is here.
- Each entry lists the percentage of responses that fit in that bucket (slower than max time for previous bucket, faster than min time for next bucket).
Insert response time histogram
256us	1ms	4ms	16ms	64ms	256ms	1s	4s	16s	gt	max	tag
0.000	76.222	23.503	0.083	0.092	0.072	0.019	0.008	nonzero	0.000	5.010	ma120301_rel_withdbg.cz12b_c32r128
0.000	54.122	45.567	0.088	0.093	0.063	0.053	0.014	nonzero	0.000	8.187	ma120301_rel_withdbg.cz12c_c32r128
0.000	72.713	27.070	0.068	0.049	0.076	0.016	0.008	nonzero	0.000	5.913	ma120301_rel_withdbg.cz12b_dw0_c32r128
0.000	53.176	46.614	0.080	0.032	0.040	0.046	0.013	nonzero	0.000	6.729	ma120301_rel_withdbg.cz12c_dw0_c32r128
l.x
- l.x: create secondary indexes
- Legend for results is here.
- Each entry lists the percentage of responses that fit in that bucket (slower than max time for previous bucket, faster than min time for next bucket).
TODO - determine whether there is data for create index response time
l.i1
- l.i1: continue load after secondary indexes created with 50 inserts per transaction
- Legend for results is here.
- Each entry lists the percentage of responses that fit in that bucket (slower than max time for previous bucket, faster than min time for next bucket).
Insert response time histogram
256us	1ms	4ms	16ms	64ms	256ms	1s	4s	16s	gt	max	tag
0.000	0.000	0.000	0.000	0.132	56.060	42.776	1.025	0.007	0.000	5.810	ma120301_rel_withdbg.cz12b_c32r128
0.000	0.000	0.000	0.000	0.083	56.734	42.404	0.769	0.009	0.000	5.919	ma120301_rel_withdbg.cz12c_c32r128
0.000	0.000	0.000	0.182	48.326	39.613	11.743	0.122	0.013	0.000	8.217	ma120301_rel_withdbg.cz12b_dw0_c32r128
0.000	0.000	0.000	0.146	46.174	41.676	11.922	0.074	0.007	0.000	7.966	ma120301_rel_withdbg.cz12c_dw0_c32r128
Delete response time histogram
256us	1ms	4ms	16ms	64ms	256ms	1s	4s	16s	gt	max	tag
0.000	0.000	0.000	0.026	1.461	65.375	32.688	0.445	0.006	0.000	5.777	ma120301_rel_withdbg.cz12b_c32r128
0.000	0.000	0.000	0.049	1.412	65.834	32.417	0.278	0.008	0.000	5.914	ma120301_rel_withdbg.cz12c_c32r128
0.000	0.000	0.000	2.392	75.814	11.026	10.700	0.061	0.008	0.000	8.204	ma120301_rel_withdbg.cz12b_dw0_c32r128
0.000	0.000	0.000	1.866	74.647	12.601	10.841	0.043	0.003	0.000	7.852	ma120301_rel_withdbg.cz12c_dw0_c32r128
l.i2
- l.i2: continue load after secondary indexes created with 5 inserts per transaction
- Legend for results is here.
- Each entry lists the percentage of responses that fit in that bucket (slower than max time for previous bucket, faster than min time for next bucket).
Insert response time histogram
256us	1ms	4ms	16ms	64ms	256ms	1s	4s	16s	gt	max	tag
0.000	0.067	2.561	18.926	56.576	21.809	0.057	0.003	0.000	0.000	2.560	ma120301_rel_withdbg.cz12b_c32r128
nonzero	0.072	2.677	19.036	57.476	20.678	0.056	0.004	0.000	0.000	2.772	ma120301_rel_withdbg.cz12c_c32r128
0.000	0.520	36.382	31.416	31.137	0.528	0.012	0.004	0.000	0.000	3.017	ma120301_rel_withdbg.cz12b_dw0_c32r128
0.000	0.553	34.462	32.223	32.041	0.712	0.008	0.001	0.000	0.000	2.127	ma120301_rel_withdbg.cz12c_dw0_c32r128
Delete response time histogram
256us	1ms	4ms	16ms	64ms	256ms	1s	4s	16s	gt	max	tag
nonzero	0.295	6.164	25.715	47.832	19.949	0.044	0.002	0.000	0.000	2.404	ma120301_rel_withdbg.cz12b_c32r128
nonzero	0.325	6.393	25.723	48.622	18.896	0.039	0.003	0.000	0.000	2.206	ma120301_rel_withdbg.cz12c_c32r128
nonzero	1.904	45.320	22.153	30.264	0.350	0.007	0.002	0.000	0.000	3.022	ma120301_rel_withdbg.cz12b_dw0_c32r128
nonzero	1.967	43.224	23.293	31.026	0.486	0.003	nonzero	0.000	0.000	2.170	ma120301_rel_withdbg.cz12c_dw0_c32r128
qr100.L1
- qr100.L1: range queries with 100 insert/s per client
- Legend for results is here.
- Each entry lists the percentage of responses that fit in that bucket (slower than max time for previous bucket, faster than min time for next bucket).
Query response time histogram
256us	1ms	4ms	16ms	64ms	256ms	1s	4s	16s	gt	max	tag
99.421	0.468	0.085	0.017	0.007	0.001	nonzero	0.000	0.000	0.000	0.557	ma120301_rel_withdbg.cz12b_c32r128
99.422	0.465	0.090	0.018	0.006	nonzero	nonzero	0.000	0.000	0.000	0.392	ma120301_rel_withdbg.cz12c_c32r128
99.530	0.413	0.054	0.002	0.001	nonzero	nonzero	0.000	0.000	0.000	0.282	ma120301_rel_withdbg.cz12b_dw0_c32r128
99.548	0.398	0.052	0.001	0.001	nonzero	nonzero	nonzero	0.000	0.000	1.083	ma120301_rel_withdbg.cz12c_dw0_c32r128
Insert response time histogram
256us	1ms	4ms	16ms	64ms	256ms	1s	4s	16s	gt	max	tag
0.000	0.000	0.000	21.549	67.407	8.440	2.600	0.005	0.000	0.000	1.050	ma120301_rel_withdbg.cz12b_c32r128
0.000	0.000	0.000	18.123	71.030	9.083	1.759	0.005	0.000	0.000	1.045	ma120301_rel_withdbg.cz12c_c32r128
0.000	0.000	0.000	38.729	59.808	1.356	0.106	0.000	0.000	0.000	0.512	ma120301_rel_withdbg.cz12b_dw0_c32r128
0.000	0.000	0.000	39.657	58.694	1.590	0.046	0.012	0.000	0.000	1.217	ma120301_rel_withdbg.cz12c_dw0_c32r128
Delete response time histogram
256us	1ms	4ms	16ms	64ms	256ms	1s	4s	16s	gt	max	tag
0.000	0.000	0.000	43.093	47.630	7.058	2.220	0.000	0.000	0.000	0.901	ma120301_rel_withdbg.cz12b_c32r128
0.000	0.000	0.000	39.808	51.755	6.917	1.521	0.000	0.000	0.000	0.881	ma120301_rel_withdbg.cz12c_c32r128
0.000	0.000	0.000	71.907	27.106	0.933	0.053	0.000	0.000	0.000	0.472	ma120301_rel_withdbg.cz12b_dw0_c32r128
0.000	0.000	0.000	73.144	25.715	1.125	0.009	0.007	0.000	0.000	1.140	ma120301_rel_withdbg.cz12c_dw0_c32r128
qp100.L2
- qp100.L2: point queries with 100 insert/s per client
- Legend for results is here.
- Each entry lists the percentage of responses that fit in that bucket (slower than max time for previous bucket, faster than min time for next bucket).
Query response time histogram
256us	1ms	4ms	16ms	64ms	256ms	1s	4s	16s	gt	max	tag
0.003	26.549	51.204	21.082	1.109	0.051	0.003	0.000	0.000	0.000	0.951	ma120301_rel_withdbg.cz12b_c32r128
0.003	26.503	51.568	20.783	1.079	0.061	0.003	0.000	0.000	0.000	0.971	ma120301_rel_withdbg.cz12c_c32r128
0.006	45.259	51.723	2.916	0.090	0.006	nonzero	0.000	0.000	0.000	0.918	ma120301_rel_withdbg.cz12b_dw0_c32r128
0.005	45.527	51.188	3.175	0.100	0.005	nonzero	0.000	0.000	0.000	0.497	ma120301_rel_withdbg.cz12c_dw0_c32r128
Insert response time histogram
256us	1ms	4ms	16ms	64ms	256ms	1s	4s	16s	gt	max	tag
0.000	0.000	0.000	0.660	62.729	32.414	3.942	0.255	0.000	0.000	1.746	ma120301_rel_withdbg.cz12b_c32r128
0.000	0.000	0.000	0.850	62.752	31.775	4.252	0.370	0.000	0.000	2.003	ma120301_rel_withdbg.cz12c_c32r128
0.000	0.000	0.000	0.199	89.090	10.060	0.639	0.012	0.000	0.000	1.727	ma120301_rel_withdbg.cz12b_dw0_c32r128
0.000	0.000	0.000	0.153	87.627	11.912	0.306	0.002	0.000	0.000	1.434	ma120301_rel_withdbg.cz12c_dw0_c32r128
Delete response time histogram
256us	1ms	4ms	16ms	64ms	256ms	1s	4s	16s	gt	max	tag
0.000	0.000	0.000	12.347	64.215	20.005	3.308	0.125	0.000	0.000	1.410	ma120301_rel_withdbg.cz12b_c32r128
0.000	0.000	0.000	12.646	64.618	18.831	3.780	0.125	0.000	0.000	1.573	ma120301_rel_withdbg.cz12c_c32r128
0.000	0.000	0.000	0.836	93.310	5.412	0.433	0.009	0.000	0.000	1.703	ma120301_rel_withdbg.cz12b_dw0_c32r128
0.000	0.000	0.000	0.590	92.995	6.220	0.194	0.000	0.000	0.000	0.694	ma120301_rel_withdbg.cz12c_dw0_c32r128
qr500.L3
- qr500.L3: range queries with 500 insert/s per client
- Legend for results is here.
- Each entry lists the percentage of responses that fit in that bucket (slower than max time for previous bucket, faster than min time for next bucket).
Query response time histogram
256us	1ms	4ms	16ms	64ms	256ms	1s	4s	16s	gt	max	tag
93.699	4.294	1.168	0.608	0.219	0.013	nonzero	0.000	0.000	0.000	0.561	ma120301_rel_withdbg.cz12b_c32r128
93.647	4.318	1.179	0.622	0.223	0.011	nonzero	0.000	0.000	0.000	0.391	ma120301_rel_withdbg.cz12c_c32r128
96.852	2.462	0.528	0.093	0.054	0.009	0.002	nonzero	0.000	0.000	1.848	ma120301_rel_withdbg.cz12b_dw0_c32r128
96.969	2.366	0.501	0.090	0.062	0.010	0.002	nonzero	0.000	0.000	1.385	ma120301_rel_withdbg.cz12c_dw0_c32r128
Insert response time histogram
256us	1ms	4ms	16ms	64ms	256ms	1s	4s	16s	gt	max	tag
0.000	0.000	0.000	0.026	4.782	81.240	13.908	0.044	0.000	0.000	1.493	ma120301_rel_withdbg.cz12b_c32r128
0.000	0.000	0.000	0.020	3.834	82.452	13.670	0.023	0.000	0.000	1.435	ma120301_rel_withdbg.cz12c_c32r128
0.000	0.000	0.000	34.035	52.600	9.663	2.962	0.738	0.000	0.000	3.910	ma120301_rel_withdbg.cz12b_dw0_c32r128
0.000	0.000	0.000	38.410	47.317	10.225	3.242	0.806	0.000	0.000	2.820	ma120301_rel_withdbg.cz12c_dw0_c32r128
Delete response time histogram
256us	1ms	4ms	16ms	64ms	256ms	1s	4s	16s	gt	max	tag
0.000	0.000	0.000	0.155	8.463	80.351	11.009	0.022	0.000	0.000	1.368	ma120301_rel_withdbg.cz12b_c32r128
0.000	0.000	0.000	0.125	8.062	81.739	10.067	0.006	0.000	0.000	1.183	ma120301_rel_withdbg.cz12c_c32r128
0.000	0.000	0.000	51.226	37.429	7.569	3.242	0.534	0.000	0.000	3.652	ma120301_rel_withdbg.cz12b_dw0_c32r128
0.000	0.000	0.000	54.799	32.756	8.375	3.469	0.602	0.000	0.000	2.672	ma120301_rel_withdbg.cz12c_dw0_c32r128
qp500.L4
- qp500.L4: point queries with 500 insert/s per client
- Legend for results is here.
- Each entry lists the percentage of responses that fit in that bucket (slower than max time for previous bucket, faster than min time for next bucket).
Query response time histogram
256us	1ms	4ms	16ms	64ms	256ms	1s	4s	16s	gt	max	tag
0.000	0.084	7.050	63.053	28.155	1.652	0.006	0.000	0.000	0.000	0.655	ma120301_rel_withdbg.cz12b_c32r128
0.000	0.093	7.516	64.173	27.235	0.978	0.004	0.000	0.000	0.000	0.706	ma120301_rel_withdbg.cz12c_c32r128
0.000	0.720	64.434	33.151	1.592	0.099	0.003	nonzero	nonzero	0.000	6.291	ma120301_rel_withdbg.cz12b_dw0_c32r128
0.000	0.275	59.548	38.060	1.974	0.134	0.007	0.001	0.000	0.000	2.260	ma120301_rel_withdbg.cz12c_dw0_c32r128
Insert response time histogram
256us	1ms	4ms	16ms	64ms	256ms	1s	4s	16s	gt	max	tag
0.000	0.000	0.000	0.001	0.055	58.618	40.515	0.811	0.000	0.000	2.073	ma120301_rel_withdbg.cz12b_c32r128
0.000	0.000	0.000	0.000	0.049	57.564	41.967	0.420	0.000	0.000	2.012	ma120301_rel_withdbg.cz12c_c32r128
0.000	0.000	0.000	1.197	69.892	28.097	0.807	0.002	0.005	0.000	6.471	ma120301_rel_withdbg.cz12b_dw0_c32r128
0.000	0.000	0.000	0.688	68.596	29.879	0.803	0.032	0.002	0.000	6.163	ma120301_rel_withdbg.cz12c_dw0_c32r128
Delete response time histogram
256us	1ms	4ms	16ms	64ms	256ms	1s	4s	16s	gt	max	tag
0.000	0.000	0.000	0.001	0.077	59.542	39.888	0.492	0.000	0.000	1.979	ma120301_rel_withdbg.cz12b_c32r128
0.000	0.000	0.000	0.000	0.063	58.605	41.081	0.251	0.000	0.000	1.762	ma120301_rel_withdbg.cz12c_c32r128
0.000	0.000	0.000	5.500	74.802	19.143	0.550	0.000	0.006	0.000	6.499	ma120301_rel_withdbg.cz12b_dw0_c32r128
0.000	0.000	0.000	3.594	75.876	19.908	0.588	0.033	0.000	0.000	3.973	ma120301_rel_withdbg.cz12c_dw0_c32r128
qr1000.L5
- qr1000.L5: range queries with 1000 insert/s per client
- Legend for results is here.
- Each entry lists the percentage of responses that fit in that bucket (slower than max time for previous bucket, faster than min time for next bucket).
Query response time histogram
256us	1ms	4ms	16ms	64ms	256ms	1s	4s	16s	gt	max	tag
93.115	5.159	1.258	0.377	0.088	0.003	nonzero	nonzero	nonzero	0.000	4.623	ma120301_rel_withdbg.cz12b_c32r128
93.162	5.116	1.253	0.382	0.085	0.002	nonzero	nonzero	nonzero	0.000	4.021	ma120301_rel_withdbg.cz12c_c32r128
89.494	7.924	2.277	0.267	0.032	0.005	0.001	nonzero	nonzero	0.000	6.345	ma120301_rel_withdbg.cz12b_dw0_c32r128
89.545	7.901	2.242	0.276	0.030	0.005	nonzero	nonzero	nonzero	0.000	7.606	ma120301_rel_withdbg.cz12c_dw0_c32r128
Insert response time histogram
256us	1ms	4ms	16ms	64ms	256ms	1s	4s	16s	gt	max	tag
0.000	0.000	0.000	0.000	0.074	48.468	50.728	0.718	0.012	0.000	6.257	ma120301_rel_withdbg.cz12b_c32r128
0.000	0.000	0.000	nonzero	0.111	48.624	50.871	0.381	0.013	0.000	5.091	ma120301_rel_withdbg.cz12c_c32r128
0.000	0.000	0.000	0.481	68.903	26.224	4.169	0.171	0.051	0.000	8.509	ma120301_rel_withdbg.cz12b_dw0_c32r128
0.000	0.000	0.000	0.240	68.882	26.438	4.291	0.109	0.041	0.000	8.052	ma120301_rel_withdbg.cz12c_dw0_c32r128
Delete response time histogram
256us	1ms	4ms	16ms	64ms	256ms	1s	4s	16s	gt	max	tag
0.000	0.000	0.000	0.000	0.254	49.684	49.617	0.436	0.010	0.000	6.176	ma120301_rel_withdbg.cz12b_c32r128
0.000	0.000	0.000	nonzero	0.307	50.037	49.393	0.253	0.011	0.000	4.993	ma120301_rel_withdbg.cz12c_c32r128
0.000	0.000	0.000	1.226	78.505	16.109	4.006	0.124	0.029	0.000	8.628	ma120301_rel_withdbg.cz12b_dw0_c32r128
0.000	0.000	0.000	0.660	79.205	15.921	4.119	0.066	0.028	0.000	8.045	ma120301_rel_withdbg.cz12c_dw0_c32r128
qp1000.L6
- qp1000.L6: point queries with 1000 insert/s per client
- Legend for results is here.
- Each entry lists the percentage of responses that fit in that bucket (slower than max time for previous bucket, faster than min time for next bucket).
Query response time histogram
256us	1ms	4ms	16ms	64ms	256ms	1s	4s	16s	gt	max	tag
nonzero	0.201	12.328	78.361	9.005	0.104	0.001	0.001	0.000	0.000	3.816	ma120301_rel_withdbg.cz12b_c32r128
nonzero	0.200	12.367	78.695	8.650	0.086	nonzero	nonzero	0.000	0.000	1.401	ma120301_rel_withdbg.cz12c_c32r128
nonzero	1.844	65.366	31.935	0.838	0.016	0.001	nonzero	0.000	0.000	3.289	ma120301_rel_withdbg.cz12b_dw0_c32r128
nonzero	1.888	62.948	34.373	0.779	0.011	nonzero	nonzero	nonzero	0.000	7.006	ma120301_rel_withdbg.cz12c_dw0_c32r128
Insert response time histogram
256us	1ms	4ms	16ms	64ms	256ms	1s	4s	16s	gt	max	tag
0.000	0.000	0.000	0.000	0.026	9.635	89.159	1.172	0.009	0.000	4.656	ma120301_rel_withdbg.cz12b_c32r128
0.000	0.000	0.000	0.000	0.022	9.825	89.274	0.880	0.000	0.000	2.496	ma120301_rel_withdbg.cz12c_c32r128
0.000	0.000	0.000	0.021	37.480	32.622	29.862	0.013	0.001	0.000	4.586	ma120301_rel_withdbg.cz12b_dw0_c32r128
0.000	0.000	0.000	0.028	35.562	33.383	31.015	0.009	0.003	0.000	8.381	ma120301_rel_withdbg.cz12c_dw0_c32r128
Delete response time histogram
256us	1ms	4ms	16ms	64ms	256ms	1s	4s	16s	gt	max	tag
0.000	0.000	0.000	0.000	0.035	9.792	89.514	0.650	0.009	0.000	4.628	ma120301_rel_withdbg.cz12b_c32r128
0.000	0.000	0.000	0.000	0.025	10.012	89.449	0.515	0.000	0.000	2.142	ma120301_rel_withdbg.cz12c_c32r128
0.000	0.000	0.000	0.035	49.738	20.600	29.618	0.009	0.000	0.000	3.558	ma120301_rel_withdbg.cz12b_dw0_c32r128
0.000	0.000	0.000	0.053	48.575	20.618	30.747	0.005	0.003	0.000	8.322	ma120301_rel_withdbg.cz12c_dw0_c32r128