Introduction
This is a report for the insert benchmark with 800M docs and 1 client(s). It is generated by scripts (bash, awk, sed) and Tufte might not be impressed. An overview of the insert benchmark is here and a short update is here. Below, by DBMS, I mean DBMS+version.config. An example is my8020.c10b40 where my means MySQL, 8020 is version 8.0.20 and c10b40 is the name for the configuration file.
The test server has 8 AMD cores, 32G RAM and an NVMe SSD. It is described here as the PN53. The benchmark was run with 1 client and there were 1 or 3 connections per client (1 for queries or inserts without rate limits, 1+1 for rate limited inserts+deletes). It uses 1 table. It loads 800M rows per table without secondary indexes, creates 3 secondary indexes per table, then inserts 4m+1m rows per table with a delete per insert to avoid growing the table. It then does 6 read+write tests for 3600s each that do queries as fast as possible with 100,100,500,500,1000,1000 inserts/s and the same for deletes/s per client concurrent with the queries. The database is larger than memory. Clients and the DBMS share one server. The per-database configs are in the per-database subdirectories here.
The tested DBMS are:
- pg1710_o2nofp.cx10a_c8r32 - Postgres 17.10 with the cx10a config
- pg184_o2nofp.cx10b_c8r32 - Postgres 18.4 with the cx10b config
- pg19b1_o2nofp.cx10b_c8r32 - Postgres 19 beta1 with the cx10b config
- my8408_rel_o2nofp.cz12a_c8r32 - MySQL 8.4.8 with the cz12a config
Contents
- Summary
- l.i0: load without secondary indexes
- l.x: create secondary indexes
- l.i1: continue load after secondary indexes created with 50 inserts per transaction
- l.i2: continue load after secondary indexes created with 5 inserts per transaction
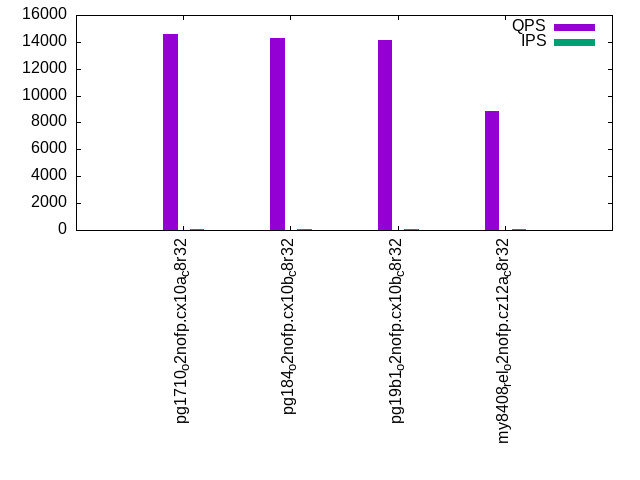
- qr100.L1: range queries with 100 insert/s per client
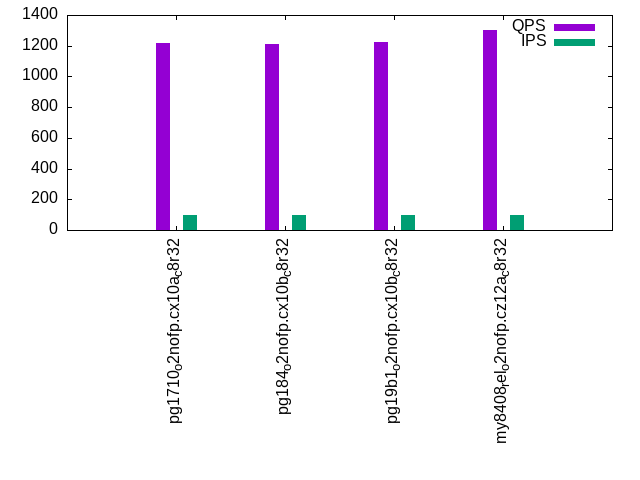
- qp100.L2: point queries with 100 insert/s per client
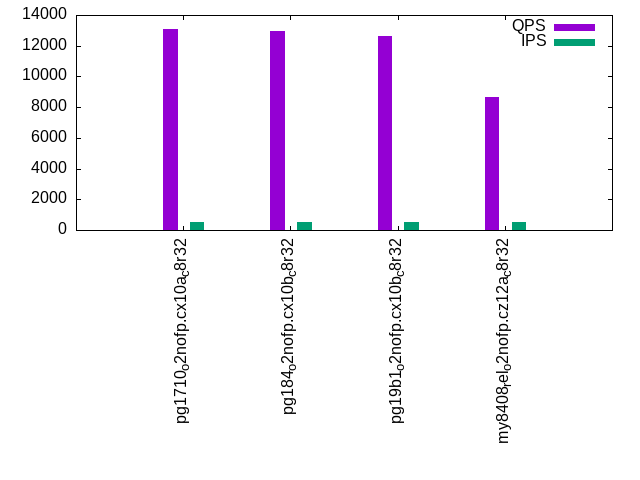
- qr500.L3: range queries with 500 insert/s per client
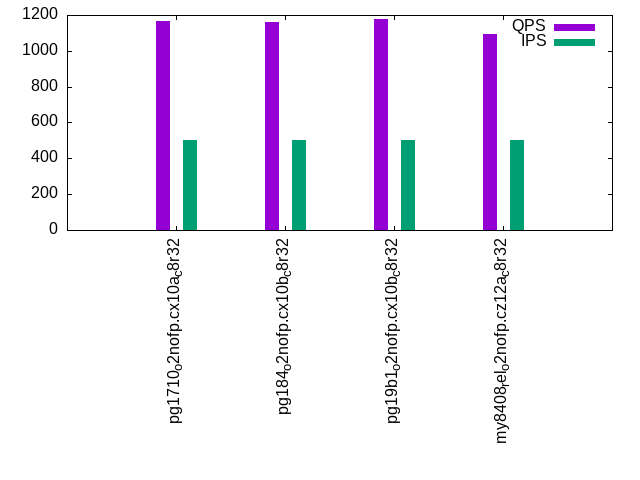
- qp500.L4: point queries with 500 insert/s per client
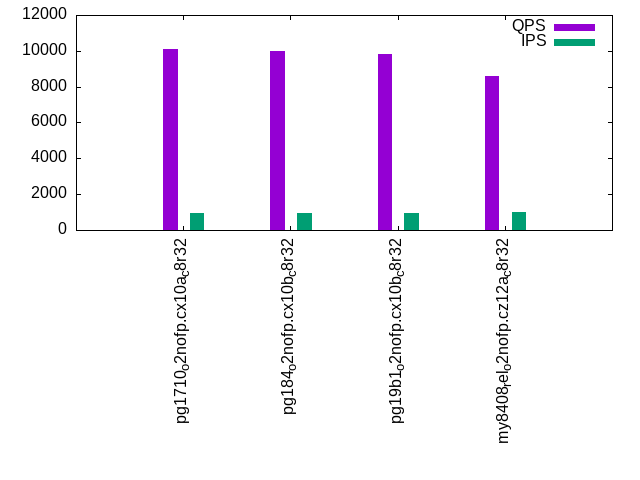
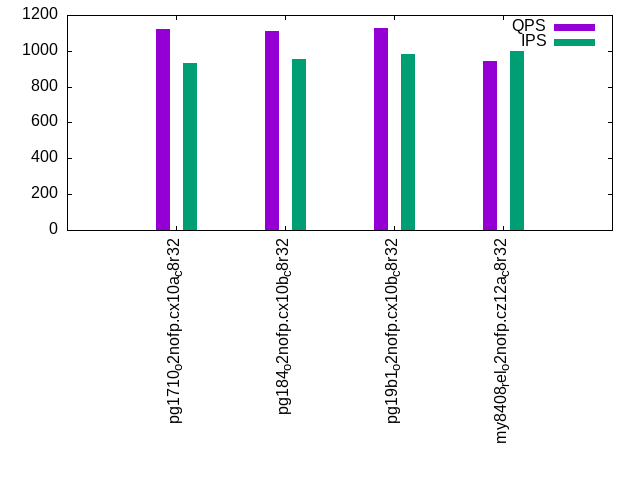
- qr1000.L5: range queries with 1000 insert/s per client
- qp1000.L6: point queries with 1000 insert/s per client
Summary
The numbers are inserts/s for l.i0, l.i1 and l.i2, indexed docs (or rows) /s for l.x and queries/s for qr100, qp100 thru qr1000, qp1000" The values are the average rate over the entire test for inserts (IPS) and queries (QPS). The range of values for IPS and QPS is split into 3 parts: bottom 25%, middle 50%, top 25%. Values in the bottom 25% have a red background, values in the top 25% have a green background and values in the middle have no color. A gray background is used for values that can be ignored because the DBMS did not sustain the target insert rate. Red backgrounds are not used when the minimum value is within 80% of the max value.
| dbms | l.i0 | l.x | l.i1 | l.i2 | qr100 | qp100 | qr500 | qp500 | qr1000 | qp1000 |
|---|---|---|---|---|---|---|---|---|---|---|
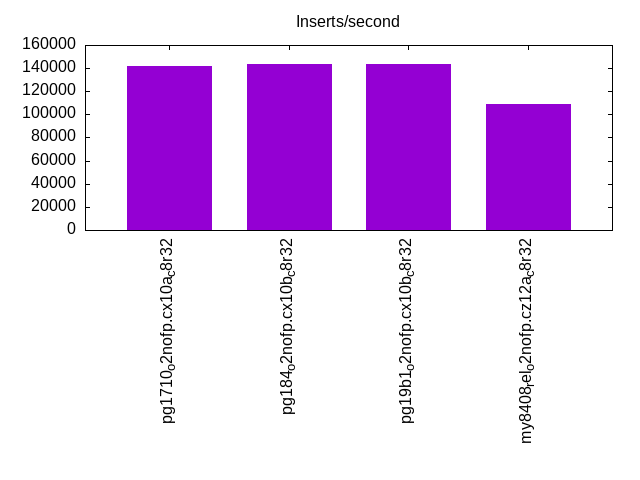
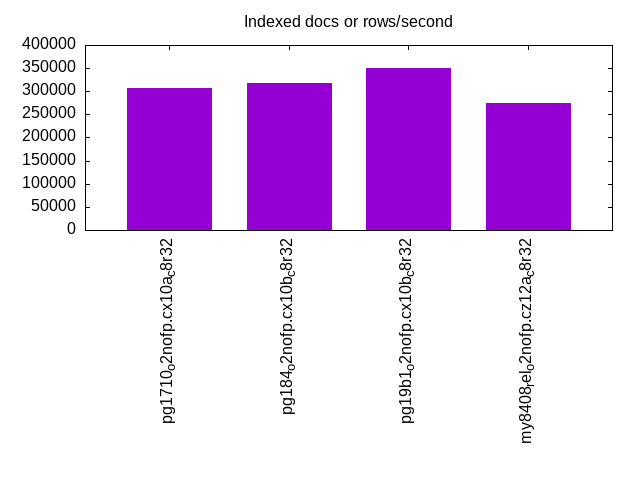
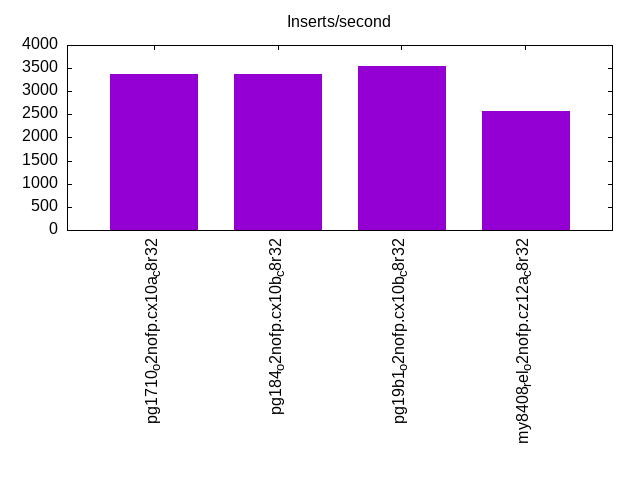
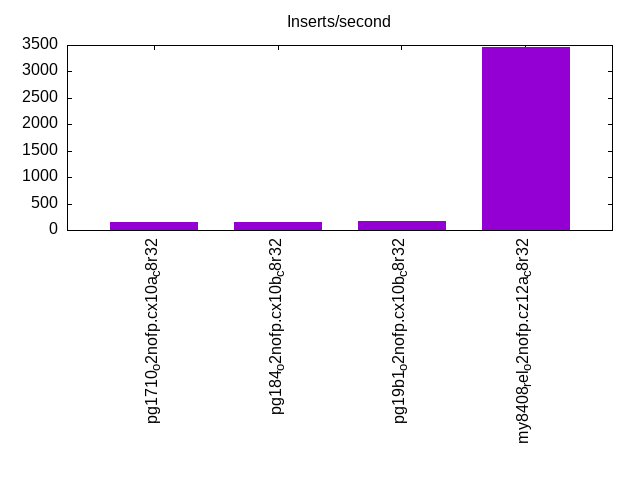
| pg1710_o2nofp.cx10a_c8r32 | 141869 | 306748 | 3370 | 160 | 14575 | 1215 | 13112 | 1169 | 10115 | 1124 |
| pg184_o2nofp.cx10b_c8r32 | 143498 | 316832 | 3373 | 160 | 14266 | 1212 | 12942 | 1163 | 9987 | 1113 |
| pg19b1_o2nofp.cx10b_c8r32 | 143988 | 351340 | 3543 | 174 | 14113 | 1227 | 12601 | 1180 | 9799 | 1128 |
| my8408_rel_o2nofp.cz12a_c8r32 | 109290 | 274537 | 2569 | 3460 | 8860 | 1305 | 8673 | 1092 | 8594 | 942 |
This table has relative throughput, throughput for the DBMS relative to the DBMS in the first line, using the absolute throughput from the previous table. Values less than 0.95 have a yellow background. Values greater than 1.05 have a blue background.
| dbms | l.i0 | l.x | l.i1 | l.i2 | qr100 | qp100 | qr500 | qp500 | qr1000 | qp1000 |
|---|---|---|---|---|---|---|---|---|---|---|
| pg1710_o2nofp.cx10a_c8r32 | 1.00 | 1.00 | 1.00 | 1.00 | 1.00 | 1.00 | 1.00 | 1.00 | 1.00 | 1.00 |
| pg184_o2nofp.cx10b_c8r32 | 1.01 | 1.03 | 1.00 | 1.00 | 0.98 | 1.00 | 0.99 | 0.99 | 0.99 | 0.99 |
| pg19b1_o2nofp.cx10b_c8r32 | 1.01 | 1.15 | 1.05 | 1.09 | 0.97 | 1.01 | 0.96 | 1.01 | 0.97 | 1.00 |
| my8408_rel_o2nofp.cz12a_c8r32 | 0.77 | 0.89 | 0.76 | 21.62 | 0.61 | 1.07 | 0.66 | 0.93 | 0.85 | 0.84 |
This lists the average rate of inserts/s for the tests that do inserts concurrent with queries. For such tests the query rate is listed in the table above. The read+write tests are setup so that the insert rate should match the target rate every second. Cells that are not at least 95% of the target have a red background to indicate a failure to satisfy the target.
| dbms | qr100.L1 | qp100.L2 | qr500.L3 | qp500.L4 | qr1000.L5 | qp1000.L6 |
|---|---|---|---|---|---|---|
| pg1710_o2nofp.cx10a_c8r32 | 100 | 100 | 500 | 500 | 951 | 930 |
| pg184_o2nofp.cx10b_c8r32 | 100 | 100 | 500 | 500 | 970 | 957 |
| pg19b1_o2nofp.cx10b_c8r32 | 100 | 100 | 500 | 500 | 973 | 980 |
| my8408_rel_o2nofp.cz12a_c8r32 | 100 | 100 | 500 | 500 | 1000 | 1000 |
| target | 100 | 100 | 500 | 500 | 1000 | 1000 |
l.i0
l.i0: load without secondary indexes. Graphs for performance per 1-second interval are here.
Average throughput:
Insert response time histogram: each cell has the percentage of responses that take <= the time in the header and max is the max response time in seconds. For the max column values in the top 25% of the range have a red background and in the bottom 25% of the range have a green background. The red background is not used when the min value is within 80% of the max value.
| dbms | 256us | 1ms | 4ms | 16ms | 64ms | 256ms | 1s | 4s | 16s | gt | max |
|---|---|---|---|---|---|---|---|---|---|---|---|
| pg1710_o2nofp.cx10a_c8r32 | 99.950 | 0.044 | 0.006 | nonzero | 0.037 | ||||||
| pg184_o2nofp.cx10b_c8r32 | 99.954 | 0.042 | 0.004 | nonzero | 0.037 | ||||||
| pg19b1_o2nofp.cx10b_c8r32 | 99.956 | 0.041 | 0.003 | nonzero | 0.032 | ||||||
| my8408_rel_o2nofp.cz12a_c8r32 | 99.543 | 0.283 | 0.171 | 0.002 | nonzero | nonzero | 0.281 |
Performance metrics for the DBMS listed above. Some are normalized by throughput, others are not. Legend for results is here.
ips	qps	rps	rmbps	wps	wmbps	rpq	rkbpq	wpi	wkbpi	csps	cpups	cspq	cpupq	dbgb1	dbgb2	rss	maxop	p50	p99	tag
141869	0	25	0.2	532.1	58.7	0.000	0.001	0.004	0.424	14671	20.2	0.103	11	76.5	116.6	2.1	0.037	142084	138286	pg1710_o2nofp.cx10a_c8r32
143498	0	26	0.2	536.4	59.1	0.000	0.001	0.004	0.422	14835	20.3	0.103	11	76.5	116.6	18.9	0.037	143881	140081	pg184_o2nofp.cx10b_c8r32
143988	0	26	0.2	537.5	59.3	0.000	0.001	0.004	0.422	14904	20.4	0.104	11	76.5	116.6	2.1	0.032	144285	140685	pg19b1_o2nofp.cx10b_c8r32
109290	0	0	0.0	742.1	41.0	0.000	0.000	0.007	0.384	13984	17.3	0.128	13	52.4	120.1	25.2	0.281	109088	102886	my8408_rel_o2nofp.cz12a_c8r32
Average values from iostat.
l.x
l.x: create secondary indexes.
Average throughput:
Performance metrics for the DBMS listed above. Some are normalized by throughput, others are not. Legend for results is here.
ips	qps	rps	rmbps	wps	wmbps	rpq	rkbpq	wpi	wkbpi	csps	cpups	cspq	cpupq	dbgb1	dbgb2	rss	maxop	p50	p99	tag
306748	0	826	102.4	951.7	114.2	0.003	0.342	0.003	0.381	746	13.1	0.002	3	153.6	193.7	21.7	0.002	NA	NA	pg1710_o2nofp.cx10a_c8r32
316832	0	858	106.5	981.0	118.4	0.003	0.344	0.003	0.383	466	13.3	0.001	3	153.6	193.7	23.4	0.003	NA	NA	pg184_o2nofp.cx10b_c8r32
351340	0	953	118.3	1085.1	131.0	0.003	0.345	0.003	0.382	554	13.4	0.002	3	153.6	193.7	23.4	0.002	NA	NA	pg19b1_o2nofp.cx10b_c8r32
274537	0	3818	376.1	8304.8	419.0	0.014	1.403	0.030	1.563	21180	37.0	0.077	11	120.7	188.4	25.4	0.001	NA	NA	my8408_rel_o2nofp.cz12a_c8r32
Average values from iostat.
l.i1
l.i1: continue load after secondary indexes created with 50 inserts per transaction. Graphs for performance per 1-second interval are here.
Average throughput:
Insert response time histogram: each cell has the percentage of responses that take <= the time in the header and max is the max response time in seconds. For the max column values in the top 25% of the range have a red background and in the bottom 25% of the range have a green background. The red background is not used when the min value is within 80% of the max value.
| dbms | 256us | 1ms | 4ms | 16ms | 64ms | 256ms | 1s | 4s | 16s | gt | max |
|---|---|---|---|---|---|---|---|---|---|---|---|
| pg1710_o2nofp.cx10a_c8r32 | 0.009 | 99.916 | 0.074 | 0.001 | 0.074 | ||||||
| pg184_o2nofp.cx10b_c8r32 | 0.011 | 99.918 | 0.071 | 0.033 | |||||||
| pg19b1_o2nofp.cx10b_c8r32 | 0.021 | 99.919 | 0.060 | 0.037 | |||||||
| my8408_rel_o2nofp.cz12a_c8r32 | 67.684 | 27.081 | 5.230 | 0.005 | 0.534 |
Delete response time histogram: each cell has the percentage of responses that take <= the time in the header and max is the max response time in seconds. For the max column values in the top 25% of the range have a red background and in the bottom 25% of the range have a green background. The red background is not used when the min value is within 80% of the max value.
| dbms | 256us | 1ms | 4ms | 16ms | 64ms | 256ms | 1s | 4s | 16s | gt | max |
|---|---|---|---|---|---|---|---|---|---|---|---|
| pg1710_o2nofp.cx10a_c8r32 | 2.956 | 14.911 | 39.578 | 42.555 | 0.047 | ||||||
| pg184_o2nofp.cx10b_c8r32 | 3.201 | 14.863 | 38.556 | 43.380 | 0.036 | ||||||
| pg19b1_o2nofp.cx10b_c8r32 | 3.682 | 15.757 | 41.045 | 39.515 | 0.037 | ||||||
| my8408_rel_o2nofp.cz12a_c8r32 | 99.364 | 0.514 | 0.118 | 0.003 | 0.003 | 0.533 |
Performance metrics for the DBMS listed above. Some are normalized by throughput, others are not. Legend for results is here.
ips	qps	rps	rmbps	wps	wmbps	rpq	rkbpq	wpi	wkbpi	csps	cpups	cspq	cpupq	dbgb1	dbgb2	rss	maxop	p50	p99	tag
3370	0	4836	38.4	3974.7	68.0	1.435	11.654	1.179	20.674	11071	15.3	3.285	363	154.3	194.3	22.3	0.074	2599	1750	pg1710_o2nofp.cx10a_c8r32
3373	0	4846	38.4	3986.1	68.3	1.437	11.655	1.182	20.730	11057	15.5	3.279	368	154.3	194.3	22.9	0.033	2600	1800	pg184_o2nofp.cx10b_c8r32
3543	0	5099	40.4	4208.3	72.2	1.439	11.676	1.188	20.863	11655	15.6	3.290	352	154.3	194.3	0.4	0.037	2750	1800	pg19b1_o2nofp.cx10b_c8r32
2569	0	9618	150.3	14275.0	428.4	3.744	59.903	5.557	170.747	74298	17.2	28.921	536	148.7	217.1	25.4	0.534	2400	1450	my8408_rel_o2nofp.cz12a_c8r32
Average values from iostat.
l.i2
l.i2: continue load after secondary indexes created with 5 inserts per transaction. Graphs for performance per 1-second interval are here.
Average throughput:
Insert response time histogram: each cell has the percentage of responses that take <= the time in the header and max is the max response time in seconds. For the max column values in the top 25% of the range have a red background and in the bottom 25% of the range have a green background. The red background is not used when the min value is within 80% of the max value.
| dbms | 256us | 1ms | 4ms | 16ms | 64ms | 256ms | 1s | 4s | 16s | gt | max |
|---|---|---|---|---|---|---|---|---|---|---|---|
| pg1710_o2nofp.cx10a_c8r32 | 91.945 | 8.022 | 0.033 | 0.006 | |||||||
| pg184_o2nofp.cx10b_c8r32 | 95.261 | 4.722 | 0.016 | 0.001 | 0.018 | ||||||
| pg19b1_o2nofp.cx10b_c8r32 | 95.398 | 4.588 | 0.015 | 0.012 | |||||||
| my8408_rel_o2nofp.cz12a_c8r32 | 55.731 | 40.263 | 3.338 | 0.667 | 0.001 | 0.101 |
Delete response time histogram: each cell has the percentage of responses that take <= the time in the header and max is the max response time in seconds. For the max column values in the top 25% of the range have a red background and in the bottom 25% of the range have a green background. The red background is not used when the min value is within 80% of the max value.
| dbms | 256us | 1ms | 4ms | 16ms | 64ms | 256ms | 1s | 4s | 16s | gt | max |
|---|---|---|---|---|---|---|---|---|---|---|---|
| pg1710_o2nofp.cx10a_c8r32 | 99.999 | 0.001 | 0.103 | ||||||||
| pg184_o2nofp.cx10b_c8r32 | 99.999 | 0.001 | 0.105 | ||||||||
| pg19b1_o2nofp.cx10b_c8r32 | 99.999 | 0.001 | 0.100 | ||||||||
| my8408_rel_o2nofp.cz12a_c8r32 | 98.714 | 1.016 | 0.257 | 0.012 | 0.001 | 0.101 |
Performance metrics for the DBMS listed above. Some are normalized by throughput, others are not. Legend for results is here.
ips	qps	rps	rmbps	wps	wmbps	rpq	rkbpq	wpi	wkbpi	csps	cpups	cspq	cpupq	dbgb1	dbgb2	rss	maxop	p50	p99	tag
160	0	172	1.4	474.7	6.6	1.070	8.773	2.960	41.979	1155	12.6	7.202	6284	154.5	194.5	23.3	0.006	160	140	pg1710_o2nofp.cx10a_c8r32
160	0	172	1.4	473.7	6.6	1.072	8.780	2.955	42.013	1188	12.6	7.414	6288	154.4	194.5	23.4	0.018	160	145	pg184_o2nofp.cx10b_c8r32
174	0	186	1.5	501.8	7.0	1.070	8.758	2.890	41.228	1263	12.6	7.273	5806	154.5	194.5	1.9	0.012	170	155	pg19b1_o2nofp.cx10b_c8r32
3460	0	9380	146.6	14342.7	416.5	2.711	43.373	4.145	123.244	94301	24.6	27.253	569	149.0	217.5	25.4	0.101	3450	2890	my8408_rel_o2nofp.cz12a_c8r32
Average values from iostat.
qr100.L1
qr100.L1: range queries with 100 insert/s per client. Graphs for performance per 1-second interval are here.
Average throughput:
Query response time histogram: each cell has the percentage of responses that take <= the time in the header and max is the max response time in seconds. For max values in the top 25% of the range have a red background and in the bottom 25% of the range have a green background. The red background is not used when the min value is within 80% of the max value.
| dbms | 256us | 1ms | 4ms | 16ms | 64ms | 256ms | 1s | 4s | 16s | gt | max |
|---|---|---|---|---|---|---|---|---|---|---|---|
| pg1710_o2nofp.cx10a_c8r32 | 99.991 | 0.009 | nonzero | nonzero | 0.010 | ||||||
| pg184_o2nofp.cx10b_c8r32 | 99.999 | 0.001 | nonzero | nonzero | 0.013 | ||||||
| pg19b1_o2nofp.cx10b_c8r32 | 99.999 | 0.001 | nonzero | nonzero | 0.010 | ||||||
| my8408_rel_o2nofp.cz12a_c8r32 | 99.993 | 0.006 | 0.001 | nonzero | 0.005 |
Insert response time histogram: each cell has the percentage of responses that take <= the time in the header and max is the max response time in seconds. For max values in the top 25% of the range have a red background and in the bottom 25% of the range have a green background. The red background is not used when the min value is within 80% of the max value.
| dbms | 256us | 1ms | 4ms | 16ms | 64ms | 256ms | 1s | 4s | 16s | gt | max |
|---|---|---|---|---|---|---|---|---|---|---|---|
| pg1710_o2nofp.cx10a_c8r32 | 0.472 | 99.514 | 0.014 | 0.022 | |||||||
| pg184_o2nofp.cx10b_c8r32 | 0.444 | 99.528 | 0.028 | 0.022 | |||||||
| pg19b1_o2nofp.cx10b_c8r32 | 0.431 | 99.556 | 0.014 | 0.023 | |||||||
| my8408_rel_o2nofp.cz12a_c8r32 | 99.931 | 0.069 | 0.041 |
Delete response time histogram: each cell has the percentage of responses that take <= the time in the header and max is the max response time in seconds. For max values in the top 25% of the range have a red background and in the bottom 25% of the range have a green background. The red background is not used when the min value is within 80% of the max value.
| dbms | 256us | 1ms | 4ms | 16ms | 64ms | 256ms | 1s | 4s | 16s | gt | max |
|---|---|---|---|---|---|---|---|---|---|---|---|
| pg1710_o2nofp.cx10a_c8r32 | 27.625 | 72.375 | 0.004 | ||||||||
| pg184_o2nofp.cx10b_c8r32 | 30.819 | 69.181 | 0.003 | ||||||||
| pg19b1_o2nofp.cx10b_c8r32 | 34.028 | 65.972 | 0.004 | ||||||||
| my8408_rel_o2nofp.cz12a_c8r32 | 99.972 | 0.028 | 0.007 |
Performance metrics for the DBMS listed above. Some are normalized by throughput, others are not. Legend for results is here.
ips	qps	rps	rmbps	wps	wmbps	rpq	rkbpq	wpi	wkbpi	csps	cpups	cspq	cpupq	dbgb1	dbgb2	rss	maxop	p50	p99	tag
100	14575	110	0.9	115.6	2.3	0.008	0.063	1.157	23.521	56003	12.7	3.842	70	154.5	191.8	23.3	0.010	14558	14222	pg1710_o2nofp.cx10a_c8r32
100	14266	109	0.9	115.7	2.3	0.008	0.063	1.159	23.530	54824	12.7	3.843	71	154.5	193.3	23.4	0.013	14270	13950	pg184_o2nofp.cx10b_c8r32
100	14113	110	0.9	115.9	2.3	0.008	0.064	1.160	23.547	54222	12.7	3.842	72	154.5	192.9	1.8	0.010	14110	13806	pg19b1_o2nofp.cx10b_c8r32
100	8860	417	6.5	362.6	10.4	0.047	0.752	3.629	106.668	52689	13.3	5.947	120	149.0	217.6	25.3	0.005	8863	8783	my8408_rel_o2nofp.cz12a_c8r32
Average values from iostat.
qp100.L2
qp100.L2: point queries with 100 insert/s per client. Graphs for performance per 1-second interval are here.
Average throughput:
Query response time histogram: each cell has the percentage of responses that take <= the time in the header and max is the max response time in seconds. For max values in the top 25% of the range have a red background and in the bottom 25% of the range have a green background. The red background is not used when the min value is within 80% of the max value.
| dbms | 256us | 1ms | 4ms | 16ms | 64ms | 256ms | 1s | 4s | 16s | gt | max |
|---|---|---|---|---|---|---|---|---|---|---|---|
| pg1710_o2nofp.cx10a_c8r32 | nonzero | 91.474 | 8.500 | 0.017 | 0.010 | 0.021 | |||||
| pg184_o2nofp.cx10b_c8r32 | nonzero | 91.164 | 8.813 | 0.013 | 0.010 | 0.023 | |||||
| pg19b1_o2nofp.cx10b_c8r32 | nonzero | 92.661 | 7.315 | 0.020 | 0.004 | 0.024 | |||||
| my8408_rel_o2nofp.cz12a_c8r32 | 0.012 | 94.729 | 5.036 | 0.222 | 0.001 | 0.022 |
Insert response time histogram: each cell has the percentage of responses that take <= the time in the header and max is the max response time in seconds. For max values in the top 25% of the range have a red background and in the bottom 25% of the range have a green background. The red background is not used when the min value is within 80% of the max value.
| dbms | 256us | 1ms | 4ms | 16ms | 64ms | 256ms | 1s | 4s | 16s | gt | max |
|---|---|---|---|---|---|---|---|---|---|---|---|
| pg1710_o2nofp.cx10a_c8r32 | 99.792 | 0.208 | 0.023 | ||||||||
| pg184_o2nofp.cx10b_c8r32 | 99.778 | 0.222 | 0.022 | ||||||||
| pg19b1_o2nofp.cx10b_c8r32 | 99.750 | 0.250 | 0.027 | ||||||||
| my8408_rel_o2nofp.cz12a_c8r32 | 94.847 | 5.153 | 0.033 |
Delete response time histogram: each cell has the percentage of responses that take <= the time in the header and max is the max response time in seconds. For max values in the top 25% of the range have a red background and in the bottom 25% of the range have a green background. The red background is not used when the min value is within 80% of the max value.
| dbms | 256us | 1ms | 4ms | 16ms | 64ms | 256ms | 1s | 4s | 16s | gt | max |
|---|---|---|---|---|---|---|---|---|---|---|---|
| pg1710_o2nofp.cx10a_c8r32 | 51.653 | 48.347 | 0.015 | ||||||||
| pg184_o2nofp.cx10b_c8r32 | 63.306 | 36.694 | 0.016 | ||||||||
| pg19b1_o2nofp.cx10b_c8r32 | 71.486 | 28.514 | 0.016 | ||||||||
| my8408_rel_o2nofp.cz12a_c8r32 | 99.597 | 0.389 | 0.014 | 0.019 |
Performance metrics for the DBMS listed above. Some are normalized by throughput, others are not. Legend for results is here.
ips	qps	rps	rmbps	wps	wmbps	rpq	rkbpq	wpi	wkbpi	csps	cpups	cspq	cpupq	dbgb1	dbgb2	rss	maxop	p50	p99	tag
100	1215	14847	116.9	314.7	3.8	12.217	98.464	3.150	39.035	33208	6.0	27.325	395	154.5	187.7	23.3	0.021	1232	800	pg1710_o2nofp.cx10a_c8r32
100	1212	14799	116.4	314.4	3.8	12.209	98.332	3.144	38.992	33106	6.3	27.310	416	154.5	188.3	23.4	0.023	1232	800	pg184_o2nofp.cx10b_c8r32
100	1227	14977	117.8	308.3	3.8	12.209	98.333	3.086	38.508	33501	5.8	27.310	378	154.5	187.9	0.8	0.024	1248	816	pg19b1_o2nofp.cx10b_c8r32
100	1305	8750	136.7	1170.9	32.6	6.706	107.303	11.721	334.404	27219	5.6	20.862	343	149.0	217.6	25.3	0.022	1344	960	my8408_rel_o2nofp.cz12a_c8r32
Average values from iostat.
qr500.L3
qr500.L3: range queries with 500 insert/s per client. Graphs for performance per 1-second interval are here.
Average throughput:
Query response time histogram: each cell has the percentage of responses that take <= the time in the header and max is the max response time in seconds. For max values in the top 25% of the range have a red background and in the bottom 25% of the range have a green background. The red background is not used when the min value is within 80% of the max value.
| dbms | 256us | 1ms | 4ms | 16ms | 64ms | 256ms | 1s | 4s | 16s | gt | max |
|---|---|---|---|---|---|---|---|---|---|---|---|
| pg1710_o2nofp.cx10a_c8r32 | 99.988 | 0.010 | 0.002 | nonzero | nonzero | 0.033 | |||||
| pg184_o2nofp.cx10b_c8r32 | 99.993 | 0.005 | 0.002 | nonzero | nonzero | 0.045 | |||||
| pg19b1_o2nofp.cx10b_c8r32 | 99.993 | 0.006 | 0.002 | nonzero | nonzero | 0.041 | |||||
| my8408_rel_o2nofp.cz12a_c8r32 | 99.964 | 0.034 | 0.002 | nonzero | 0.006 |
Insert response time histogram: each cell has the percentage of responses that take <= the time in the header and max is the max response time in seconds. For max values in the top 25% of the range have a red background and in the bottom 25% of the range have a green background. The red background is not used when the min value is within 80% of the max value.
| dbms | 256us | 1ms | 4ms | 16ms | 64ms | 256ms | 1s | 4s | 16s | gt | max |
|---|---|---|---|---|---|---|---|---|---|---|---|
| pg1710_o2nofp.cx10a_c8r32 | 0.033 | 99.878 | 0.089 | 0.025 | |||||||
| pg184_o2nofp.cx10b_c8r32 | 0.033 | 99.847 | 0.119 | 0.023 | |||||||
| pg19b1_o2nofp.cx10b_c8r32 | 0.031 | 99.881 | 0.089 | 0.022 | |||||||
| my8408_rel_o2nofp.cz12a_c8r32 | 0.036 | 99.772 | 0.189 | 0.003 | 0.299 |
Delete response time histogram: each cell has the percentage of responses that take <= the time in the header and max is the max response time in seconds. For max values in the top 25% of the range have a red background and in the bottom 25% of the range have a green background. The red background is not used when the min value is within 80% of the max value.
| dbms | 256us | 1ms | 4ms | 16ms | 64ms | 256ms | 1s | 4s | 16s | gt | max |
|---|---|---|---|---|---|---|---|---|---|---|---|
| pg1710_o2nofp.cx10a_c8r32 | 1.578 | 75.242 | 23.181 | 0.026 | |||||||
| pg184_o2nofp.cx10b_c8r32 | 2.214 | 78.992 | 18.794 | 0.027 | |||||||
| pg19b1_o2nofp.cx10b_c8r32 | 4.319 | 81.742 | 13.939 | 0.026 | |||||||
| my8408_rel_o2nofp.cz12a_c8r32 | 99.964 | 0.028 | 0.006 | 0.003 | 0.287 |
Performance metrics for the DBMS listed above. Some are normalized by throughput, others are not. Legend for results is here.
ips	qps	rps	rmbps	wps	wmbps	rpq	rkbpq	wpi	wkbpi	csps	cpups	cspq	cpupq	dbgb1	dbgb2	rss	maxop	p50	p99	tag
500	13112	761	6.1	505.3	10.7	0.058	0.477	1.011	21.872	51887	14.5	3.957	88	154.7	183.4	23.3	0.033	13055	12351	pg1710_o2nofp.cx10a_c8r32
500	12942	762	6.1	507.5	10.7	0.059	0.483	1.015	21.917	51238	14.4	3.959	89	154.7	183.6	23.4	0.045	12894	12175	pg184_o2nofp.cx10b_c8r32
500	12601	762	6.1	507.5	10.7	0.060	0.496	1.015	21.905	49913	14.3	3.961	91	154.7	183.5	2.9	0.041	12542	11855	pg19b1_o2nofp.cx10b_c8r32
500	8673	2228	34.8	2652.1	75.9	0.257	4.110	5.304	155.486	60601	15.4	6.987	142	149.0	217.8	25.3	0.006	8671	8559	my8408_rel_o2nofp.cz12a_c8r32
Average values from iostat.
qp500.L4
qp500.L4: point queries with 500 insert/s per client. Graphs for performance per 1-second interval are here.
Average throughput:
Query response time histogram: each cell has the percentage of responses that take <= the time in the header and max is the max response time in seconds. For max values in the top 25% of the range have a red background and in the bottom 25% of the range have a green background. The red background is not used when the min value is within 80% of the max value.
| dbms | 256us | 1ms | 4ms | 16ms | 64ms | 256ms | 1s | 4s | 16s | gt | max |
|---|---|---|---|---|---|---|---|---|---|---|---|
| pg1710_o2nofp.cx10a_c8r32 | nonzero | 87.852 | 12.115 | 0.024 | 0.009 | 0.022 | |||||
| pg184_o2nofp.cx10b_c8r32 | nonzero | 87.113 | 12.849 | 0.037 | 0.002 | 0.022 | |||||
| pg19b1_o2nofp.cx10b_c8r32 | nonzero | 89.218 | 10.751 | 0.027 | 0.005 | 0.022 | |||||
| my8408_rel_o2nofp.cz12a_c8r32 | 0.001 | 86.412 | 12.908 | 0.582 | 0.097 | nonzero | 0.109 |
Insert response time histogram: each cell has the percentage of responses that take <= the time in the header and max is the max response time in seconds. For max values in the top 25% of the range have a red background and in the bottom 25% of the range have a green background. The red background is not used when the min value is within 80% of the max value.
| dbms | 256us | 1ms | 4ms | 16ms | 64ms | 256ms | 1s | 4s | 16s | gt | max |
|---|---|---|---|---|---|---|---|---|---|---|---|
| pg1710_o2nofp.cx10a_c8r32 | 99.661 | 0.339 | 0.023 | ||||||||
| pg184_o2nofp.cx10b_c8r32 | 99.694 | 0.306 | 0.045 | ||||||||
| pg19b1_o2nofp.cx10b_c8r32 | 99.719 | 0.281 | 0.024 | ||||||||
| my8408_rel_o2nofp.cz12a_c8r32 | 0.003 | 93.225 | 6.739 | 0.033 | 0.105 |
Delete response time histogram: each cell has the percentage of responses that take <= the time in the header and max is the max response time in seconds. For max values in the top 25% of the range have a red background and in the bottom 25% of the range have a green background. The red background is not used when the min value is within 80% of the max value.
| dbms | 256us | 1ms | 4ms | 16ms | 64ms | 256ms | 1s | 4s | 16s | gt | max |
|---|---|---|---|---|---|---|---|---|---|---|---|
| pg1710_o2nofp.cx10a_c8r32 | 99.997 | 0.003 | 0.073 | ||||||||
| pg184_o2nofp.cx10b_c8r32 | 99.997 | 0.003 | 0.074 | ||||||||
| pg19b1_o2nofp.cx10b_c8r32 | 0.097 | 99.900 | 0.003 | 0.073 | |||||||
| my8408_rel_o2nofp.cz12a_c8r32 | 99.486 | 0.497 | 0.011 | 0.006 | 0.102 |
Performance metrics for the DBMS listed above. Some are normalized by throughput, others are not. Legend for results is here.
ips	qps	rps	rmbps	wps	wmbps	rpq	rkbpq	wpi	wkbpi	csps	cpups	cspq	cpupq	dbgb1	dbgb2	rss	maxop	p50	p99	tag
500	1169	15388	120.9	1427.3	17.4	13.160	105.898	2.855	35.555	34259	9.5	29.298	650	154.8	182.7	23.3	0.022	1184	784	pg1710_o2nofp.cx10a_c8r32
500	1163	15310	120.2	1424.9	17.3	13.166	105.884	2.851	35.545	34109	9.6	29.333	660	154.8	182.8	23.4	0.022	1184	784	pg184_o2nofp.cx10b_c8r32
500	1180	15510	121.8	1392.1	17.0	13.143	105.722	2.785	34.824	34528	9.3	29.259	630	154.8	182.7	2.2	0.022	1200	800	pg19b1_o2nofp.cx10b_c8r32
500	1092	10722	167.5	3711.9	104.7	9.815	157.047	7.424	214.397	39458	7.6	36.121	557	149.0	218.0	25.3	0.109	1104	928	my8408_rel_o2nofp.cz12a_c8r32
Average values from iostat.
qr1000.L5
qr1000.L5: range queries with 1000 insert/s per client. Graphs for performance per 1-second interval are here.
Average throughput:
Query response time histogram: each cell has the percentage of responses that take <= the time in the header and max is the max response time in seconds. For max values in the top 25% of the range have a red background and in the bottom 25% of the range have a green background. The red background is not used when the min value is within 80% of the max value.
| dbms | 256us | 1ms | 4ms | 16ms | 64ms | 256ms | 1s | 4s | 16s | gt | max |
|---|---|---|---|---|---|---|---|---|---|---|---|
| pg1710_o2nofp.cx10a_c8r32 | 99.941 | 0.054 | 0.005 | nonzero | nonzero | nonzero | 0.181 | ||||
| pg184_o2nofp.cx10b_c8r32 | 99.937 | 0.057 | 0.005 | 0.001 | nonzero | nonzero | 0.184 | ||||
| pg19b1_o2nofp.cx10b_c8r32 | 99.931 | 0.063 | 0.005 | nonzero | nonzero | nonzero | 0.182 | ||||
| my8408_rel_o2nofp.cz12a_c8r32 | 99.941 | 0.055 | 0.004 | nonzero | 0.005 |
Insert response time histogram: each cell has the percentage of responses that take <= the time in the header and max is the max response time in seconds. For max values in the top 25% of the range have a red background and in the bottom 25% of the range have a green background. The red background is not used when the min value is within 80% of the max value.
| dbms | 256us | 1ms | 4ms | 16ms | 64ms | 256ms | 1s | 4s | 16s | gt | max |
|---|---|---|---|---|---|---|---|---|---|---|---|
| pg1710_o2nofp.cx10a_c8r32 | 0.293 | 99.675 | 0.032 | 0.023 | |||||||
| pg184_o2nofp.cx10b_c8r32 | 0.369 | 99.551 | 0.079 | 0.024 | |||||||
| pg19b1_o2nofp.cx10b_c8r32 | 0.511 | 99.440 | 0.049 | 0.026 | |||||||
| my8408_rel_o2nofp.cz12a_c8r32 | 0.533 | 99.403 | 0.062 | 0.001 | 0.108 |
Delete response time histogram: each cell has the percentage of responses that take <= the time in the header and max is the max response time in seconds. For max values in the top 25% of the range have a red background and in the bottom 25% of the range have a green background. The red background is not used when the min value is within 80% of the max value.
| dbms | 256us | 1ms | 4ms | 16ms | 64ms | 256ms | 1s | 4s | 16s | gt | max |
|---|---|---|---|---|---|---|---|---|---|---|---|
| pg1710_o2nofp.cx10a_c8r32 | 99.876 | 0.124 | 0.108 | ||||||||
| pg184_o2nofp.cx10b_c8r32 | 99.860 | 0.140 | 0.111 | ||||||||
| pg19b1_o2nofp.cx10b_c8r32 | 99.954 | 0.046 | 0.106 | ||||||||
| my8408_rel_o2nofp.cz12a_c8r32 | 99.986 | 0.007 | 0.007 | 0.035 |
Performance metrics for the DBMS listed above. Some are normalized by throughput, others are not. Legend for results is here.
ips	qps	rps	rmbps	wps	wmbps	rpq	rkbpq	wpi	wkbpi	csps	cpups	cspq	cpupq	dbgb1	dbgb2	rss	maxop	p50	p99	tag
951	10115	1239	9.9	1241.3	22.9	0.123	1.004	1.306	24.707	41933	24.4	4.146	193	155.4	191.0	23.3	0.181	10095	9295	pg1710_o2nofp.cx10a_c8r32
970	9987	1267	10.1	1262.9	23.3	0.127	1.039	1.302	24.644	41540	24.1	4.159	193	155.4	191.1	23.4	0.184	9951	9183	pg184_o2nofp.cx10b_c8r32
973	9799	1270	10.2	1264.2	23.4	0.130	1.062	1.300	24.607	40806	24.1	4.164	197	155.4	190.9	3.7	0.182	9791	8991	pg19b1_o2nofp.cx10b_c8r32
1000	8594	3991	62.4	5184.5	147.5	0.464	7.430	5.186	151.093	68601	18.1	7.983	168	149.0	218.3	25.3	0.005	8607	8447	my8408_rel_o2nofp.cz12a_c8r32
Average values from iostat.
qp1000.L6
qp1000.L6: point queries with 1000 insert/s per client. Graphs for performance per 1-second interval are here.
Average throughput:
Query response time histogram: each cell has the percentage of responses that take <= the time in the header and max is the max response time in seconds. For max values in the top 25% of the range have a red background and in the bottom 25% of the range have a green background. The red background is not used when the min value is within 80% of the max value.
| dbms | 256us | 1ms | 4ms | 16ms | 64ms | 256ms | 1s | 4s | 16s | gt | max |
|---|---|---|---|---|---|---|---|---|---|---|---|
| pg1710_o2nofp.cx10a_c8r32 | nonzero | 82.761 | 17.205 | 0.024 | 0.010 | 0.023 | |||||
| pg184_o2nofp.cx10b_c8r32 | nonzero | 81.494 | 18.464 | 0.032 | 0.009 | 0.021 | |||||
| pg19b1_o2nofp.cx10b_c8r32 | nonzero | 83.837 | 16.122 | 0.032 | 0.009 | 0.023 | |||||
| my8408_rel_o2nofp.cz12a_c8r32 | 70.573 | 28.375 | 0.734 | 0.318 | 0.056 |
Insert response time histogram: each cell has the percentage of responses that take <= the time in the header and max is the max response time in seconds. For max values in the top 25% of the range have a red background and in the bottom 25% of the range have a green background. The red background is not used when the min value is within 80% of the max value.
| dbms | 256us | 1ms | 4ms | 16ms | 64ms | 256ms | 1s | 4s | 16s | gt | max |
|---|---|---|---|---|---|---|---|---|---|---|---|
| pg1710_o2nofp.cx10a_c8r32 | 99.676 | 0.324 | 0.028 | ||||||||
| pg184_o2nofp.cx10b_c8r32 | 99.642 | 0.358 | 0.036 | ||||||||
| pg19b1_o2nofp.cx10b_c8r32 | 99.617 | 0.383 | 0.028 | ||||||||
| my8408_rel_o2nofp.cz12a_c8r32 | 0.007 | 95.142 | 4.793 | 0.057 | 0.001 | 0.474 |
Delete response time histogram: each cell has the percentage of responses that take <= the time in the header and max is the max response time in seconds. For max values in the top 25% of the range have a red background and in the bottom 25% of the range have a green background. The red background is not used when the min value is within 80% of the max value.
| dbms | 256us | 1ms | 4ms | 16ms | 64ms | 256ms | 1s | 4s | 16s | gt | max |
|---|---|---|---|---|---|---|---|---|---|---|---|
| pg1710_o2nofp.cx10a_c8r32 | 84.753 | 15.247 | 0.180 | ||||||||
| pg184_o2nofp.cx10b_c8r32 | 97.915 | 2.085 | 0.181 | ||||||||
| pg19b1_o2nofp.cx10b_c8r32 | 99.535 | 0.465 | 0.174 | ||||||||
| my8408_rel_o2nofp.cz12a_c8r32 | 99.715 | 0.265 | 0.018 | 0.001 | 0.472 |
Performance metrics for the DBMS listed above. Some are normalized by throughput, others are not. Legend for results is here.
ips	qps	rps	rmbps	wps	wmbps	rpq	rkbpq	wpi	wkbpi	csps	cpups	cspq	cpupq	dbgb1	dbgb2	rss	maxop	p50	p99	tag
930	1124	16035	125.8	2368.2	29.3	14.265	114.571	2.547	32.244	35634	17.5	31.700	1245	156.0	191.9	23.3	0.023	1136	752	pg1710_o2nofp.cx10a_c8r32
957	1113	15949	125.1	2435.8	30.3	14.326	115.066	2.546	32.487	35469	17.4	31.859	1250	156.0	193.2	23.4	0.021	1120	752	pg184_o2nofp.cx10b_c8r32
980	1128	16187	127.0	2396.4	30.1	14.350	115.287	2.445	31.405	35968	16.7	31.886	1184	156.0	193.4	1.9	0.023	1136	768	pg19b1_o2nofp.cx10b_c8r32
1000	942	12572	196.4	6160.1	173.7	13.340	213.440	6.162	177.873	52563	10.3	55.775	874	149.0	218.7	25.3	0.056	944	864	my8408_rel_o2nofp.cz12a_c8r32
Average values from iostat.
l.i0
l.i0: load without secondary indexes
Performance metrics for all DBMS, not just the ones listed above. Some are normalized by throughput, others are not. Legend for results is here.
ips	qps	rps	rmbps	wps	wmbps	rpq	rkbpq	wpi	wkbpi	csps	cpups	cspq	cpupq	dbgb1	dbgb2	rss	maxop	p50	p99	tag
141869	0	25	0.2	532.1	58.7	0.000	0.001	0.004	0.424	14671	20.2	0.103	11	76.5	116.6	2.1	0.037	142084	138286	pg1710_o2nofp.cx10a_c8r32
143498	0	26	0.2	536.4	59.1	0.000	0.001	0.004	0.422	14835	20.3	0.103	11	76.5	116.6	18.9	0.037	143881	140081	pg184_o2nofp.cx10b_c8r32
143988	0	26	0.2	537.5	59.3	0.000	0.001	0.004	0.422	14904	20.4	0.104	11	76.5	116.6	2.1	0.032	144285	140685	pg19b1_o2nofp.cx10b_c8r32
109290	0	0	0.0	742.1	41.0	0.000	0.000	0.007	0.384	13984	17.3	0.128	13	52.4	120.1	25.2	0.281	109088	102886	my8408_rel_o2nofp.cz12a_c8r32
l.x
l.x: create secondary indexes
Performance metrics for all DBMS, not just the ones listed above. Some are normalized by throughput, others are not. Legend for results is here.
ips	qps	rps	rmbps	wps	wmbps	rpq	rkbpq	wpi	wkbpi	csps	cpups	cspq	cpupq	dbgb1	dbgb2	rss	maxop	p50	p99	tag
306748	0	826	102.4	951.7	114.2	0.003	0.342	0.003	0.381	746	13.1	0.002	3	153.6	193.7	21.7	0.002	NA	NA	pg1710_o2nofp.cx10a_c8r32
316832	0	858	106.5	981.0	118.4	0.003	0.344	0.003	0.383	466	13.3	0.001	3	153.6	193.7	23.4	0.003	NA	NA	pg184_o2nofp.cx10b_c8r32
351340	0	953	118.3	1085.1	131.0	0.003	0.345	0.003	0.382	554	13.4	0.002	3	153.6	193.7	23.4	0.002	NA	NA	pg19b1_o2nofp.cx10b_c8r32
274537	0	3818	376.1	8304.8	419.0	0.014	1.403	0.030	1.563	21180	37.0	0.077	11	120.7	188.4	25.4	0.001	NA	NA	my8408_rel_o2nofp.cz12a_c8r32
l.i1
l.i1: continue load after secondary indexes created with 50 inserts per transaction
Performance metrics for all DBMS, not just the ones listed above. Some are normalized by throughput, others are not. Legend for results is here.
ips	qps	rps	rmbps	wps	wmbps	rpq	rkbpq	wpi	wkbpi	csps	cpups	cspq	cpupq	dbgb1	dbgb2	rss	maxop	p50	p99	tag
3370	0	4836	38.4	3974.7	68.0	1.435	11.654	1.179	20.674	11071	15.3	3.285	363	154.3	194.3	22.3	0.074	2599	1750	pg1710_o2nofp.cx10a_c8r32
3373	0	4846	38.4	3986.1	68.3	1.437	11.655	1.182	20.730	11057	15.5	3.279	368	154.3	194.3	22.9	0.033	2600	1800	pg184_o2nofp.cx10b_c8r32
3543	0	5099	40.4	4208.3	72.2	1.439	11.676	1.188	20.863	11655	15.6	3.290	352	154.3	194.3	0.4	0.037	2750	1800	pg19b1_o2nofp.cx10b_c8r32
2569	0	9618	150.3	14275.0	428.4	3.744	59.903	5.557	170.747	74298	17.2	28.921	536	148.7	217.1	25.4	0.534	2400	1450	my8408_rel_o2nofp.cz12a_c8r32
l.i2
l.i2: continue load after secondary indexes created with 5 inserts per transaction
Performance metrics for all DBMS, not just the ones listed above. Some are normalized by throughput, others are not. Legend for results is here.
ips	qps	rps	rmbps	wps	wmbps	rpq	rkbpq	wpi	wkbpi	csps	cpups	cspq	cpupq	dbgb1	dbgb2	rss	maxop	p50	p99	tag
160	0	172	1.4	474.7	6.6	1.070	8.773	2.960	41.979	1155	12.6	7.202	6284	154.5	194.5	23.3	0.006	160	140	pg1710_o2nofp.cx10a_c8r32
160	0	172	1.4	473.7	6.6	1.072	8.780	2.955	42.013	1188	12.6	7.414	6288	154.4	194.5	23.4	0.018	160	145	pg184_o2nofp.cx10b_c8r32
174	0	186	1.5	501.8	7.0	1.070	8.758	2.890	41.228	1263	12.6	7.273	5806	154.5	194.5	1.9	0.012	170	155	pg19b1_o2nofp.cx10b_c8r32
3460	0	9380	146.6	14342.7	416.5	2.711	43.373	4.145	123.244	94301	24.6	27.253	569	149.0	217.5	25.4	0.101	3450	2890	my8408_rel_o2nofp.cz12a_c8r32
qr100.L1
qr100.L1: range queries with 100 insert/s per client
Performance metrics for all DBMS, not just the ones listed above. Some are normalized by throughput, others are not. Legend for results is here.
ips	qps	rps	rmbps	wps	wmbps	rpq	rkbpq	wpi	wkbpi	csps	cpups	cspq	cpupq	dbgb1	dbgb2	rss	maxop	p50	p99	tag
100	14575	110	0.9	115.6	2.3	0.008	0.063	1.157	23.521	56003	12.7	3.842	70	154.5	191.8	23.3	0.010	14558	14222	pg1710_o2nofp.cx10a_c8r32
100	14266	109	0.9	115.7	2.3	0.008	0.063	1.159	23.530	54824	12.7	3.843	71	154.5	193.3	23.4	0.013	14270	13950	pg184_o2nofp.cx10b_c8r32
100	14113	110	0.9	115.9	2.3	0.008	0.064	1.160	23.547	54222	12.7	3.842	72	154.5	192.9	1.8	0.010	14110	13806	pg19b1_o2nofp.cx10b_c8r32
100	8860	417	6.5	362.6	10.4	0.047	0.752	3.629	106.668	52689	13.3	5.947	120	149.0	217.6	25.3	0.005	8863	8783	my8408_rel_o2nofp.cz12a_c8r32
qp100.L2
qp100.L2: point queries with 100 insert/s per client
Performance metrics for all DBMS, not just the ones listed above. Some are normalized by throughput, others are not. Legend for results is here.
ips	qps	rps	rmbps	wps	wmbps	rpq	rkbpq	wpi	wkbpi	csps	cpups	cspq	cpupq	dbgb1	dbgb2	rss	maxop	p50	p99	tag
100	1215	14847	116.9	314.7	3.8	12.217	98.464	3.150	39.035	33208	6.0	27.325	395	154.5	187.7	23.3	0.021	1232	800	pg1710_o2nofp.cx10a_c8r32
100	1212	14799	116.4	314.4	3.8	12.209	98.332	3.144	38.992	33106	6.3	27.310	416	154.5	188.3	23.4	0.023	1232	800	pg184_o2nofp.cx10b_c8r32
100	1227	14977	117.8	308.3	3.8	12.209	98.333	3.086	38.508	33501	5.8	27.310	378	154.5	187.9	0.8	0.024	1248	816	pg19b1_o2nofp.cx10b_c8r32
100	1305	8750	136.7	1170.9	32.6	6.706	107.303	11.721	334.404	27219	5.6	20.862	343	149.0	217.6	25.3	0.022	1344	960	my8408_rel_o2nofp.cz12a_c8r32
qr500.L3
qr500.L3: range queries with 500 insert/s per client
Performance metrics for all DBMS, not just the ones listed above. Some are normalized by throughput, others are not. Legend for results is here.
ips	qps	rps	rmbps	wps	wmbps	rpq	rkbpq	wpi	wkbpi	csps	cpups	cspq	cpupq	dbgb1	dbgb2	rss	maxop	p50	p99	tag
500	13112	761	6.1	505.3	10.7	0.058	0.477	1.011	21.872	51887	14.5	3.957	88	154.7	183.4	23.3	0.033	13055	12351	pg1710_o2nofp.cx10a_c8r32
500	12942	762	6.1	507.5	10.7	0.059	0.483	1.015	21.917	51238	14.4	3.959	89	154.7	183.6	23.4	0.045	12894	12175	pg184_o2nofp.cx10b_c8r32
500	12601	762	6.1	507.5	10.7	0.060	0.496	1.015	21.905	49913	14.3	3.961	91	154.7	183.5	2.9	0.041	12542	11855	pg19b1_o2nofp.cx10b_c8r32
500	8673	2228	34.8	2652.1	75.9	0.257	4.110	5.304	155.486	60601	15.4	6.987	142	149.0	217.8	25.3	0.006	8671	8559	my8408_rel_o2nofp.cz12a_c8r32
qp500.L4
qp500.L4: point queries with 500 insert/s per client
Performance metrics for all DBMS, not just the ones listed above. Some are normalized by throughput, others are not. Legend for results is here.
ips	qps	rps	rmbps	wps	wmbps	rpq	rkbpq	wpi	wkbpi	csps	cpups	cspq	cpupq	dbgb1	dbgb2	rss	maxop	p50	p99	tag
500	1169	15388	120.9	1427.3	17.4	13.160	105.898	2.855	35.555	34259	9.5	29.298	650	154.8	182.7	23.3	0.022	1184	784	pg1710_o2nofp.cx10a_c8r32
500	1163	15310	120.2	1424.9	17.3	13.166	105.884	2.851	35.545	34109	9.6	29.333	660	154.8	182.8	23.4	0.022	1184	784	pg184_o2nofp.cx10b_c8r32
500	1180	15510	121.8	1392.1	17.0	13.143	105.722	2.785	34.824	34528	9.3	29.259	630	154.8	182.7	2.2	0.022	1200	800	pg19b1_o2nofp.cx10b_c8r32
500	1092	10722	167.5	3711.9	104.7	9.815	157.047	7.424	214.397	39458	7.6	36.121	557	149.0	218.0	25.3	0.109	1104	928	my8408_rel_o2nofp.cz12a_c8r32
qr1000.L5
qr1000.L5: range queries with 1000 insert/s per client
Performance metrics for all DBMS, not just the ones listed above. Some are normalized by throughput, others are not. Legend for results is here.
ips	qps	rps	rmbps	wps	wmbps	rpq	rkbpq	wpi	wkbpi	csps	cpups	cspq	cpupq	dbgb1	dbgb2	rss	maxop	p50	p99	tag
951	10115	1239	9.9	1241.3	22.9	0.123	1.004	1.306	24.707	41933	24.4	4.146	193	155.4	191.0	23.3	0.181	10095	9295	pg1710_o2nofp.cx10a_c8r32
970	9987	1267	10.1	1262.9	23.3	0.127	1.039	1.302	24.644	41540	24.1	4.159	193	155.4	191.1	23.4	0.184	9951	9183	pg184_o2nofp.cx10b_c8r32
973	9799	1270	10.2	1264.2	23.4	0.130	1.062	1.300	24.607	40806	24.1	4.164	197	155.4	190.9	3.7	0.182	9791	8991	pg19b1_o2nofp.cx10b_c8r32
1000	8594	3991	62.4	5184.5	147.5	0.464	7.430	5.186	151.093	68601	18.1	7.983	168	149.0	218.3	25.3	0.005	8607	8447	my8408_rel_o2nofp.cz12a_c8r32
qp1000.L6
qp1000.L6: point queries with 1000 insert/s per client
Performance metrics for all DBMS, not just the ones listed above. Some are normalized by throughput, others are not. Legend for results is here.
ips	qps	rps	rmbps	wps	wmbps	rpq	rkbpq	wpi	wkbpi	csps	cpups	cspq	cpupq	dbgb1	dbgb2	rss	maxop	p50	p99	tag
930	1124	16035	125.8	2368.2	29.3	14.265	114.571	2.547	32.244	35634	17.5	31.700	1245	156.0	191.9	23.3	0.023	1136	752	pg1710_o2nofp.cx10a_c8r32
957	1113	15949	125.1	2435.8	30.3	14.326	115.066	2.546	32.487	35469	17.4	31.859	1250	156.0	193.2	23.4	0.021	1120	752	pg184_o2nofp.cx10b_c8r32
980	1128	16187	127.0	2396.4	30.1	14.350	115.287	2.445	31.405	35968	16.7	31.886	1184	156.0	193.4	1.9	0.023	1136	768	pg19b1_o2nofp.cx10b_c8r32
1000	942	12572	196.4	6160.1	173.7	13.340	213.440	6.162	177.873	52563	10.3	55.775	874	149.0	218.7	25.3	0.056	944	864	my8408_rel_o2nofp.cz12a_c8r32
l.i0
- l.i0: load without secondary indexes
- Legend for results is here.
- Each entry lists the percentage of responses that fit in that bucket (slower than max time for previous bucket, faster than min time for next bucket).
Insert response time histogram
256us	1ms	4ms	16ms	64ms	256ms	1s	4s	16s	gt	max	tag
0.000	99.950	0.044	0.006	nonzero	0.000	0.000	0.000	0.000	0.000	0.037	pg1710_o2nofp.cx10a_c8r32
0.000	99.954	0.042	0.004	nonzero	0.000	0.000	0.000	0.000	0.000	0.037	pg184_o2nofp.cx10b_c8r32
0.000	99.956	0.041	0.003	nonzero	0.000	0.000	0.000	0.000	0.000	0.032	pg19b1_o2nofp.cx10b_c8r32
0.000	99.543	0.283	0.171	0.002	nonzero	nonzero	0.000	0.000	0.000	0.281	my8408_rel_o2nofp.cz12a_c8r32
l.x
- l.x: create secondary indexes
- Legend for results is here.
- Each entry lists the percentage of responses that fit in that bucket (slower than max time for previous bucket, faster than min time for next bucket).
TODO - determine whether there is data for create index response time
l.i1
- l.i1: continue load after secondary indexes created with 50 inserts per transaction
- Legend for results is here.
- Each entry lists the percentage of responses that fit in that bucket (slower than max time for previous bucket, faster than min time for next bucket).
Insert response time histogram
256us	1ms	4ms	16ms	64ms	256ms	1s	4s	16s	gt	max	tag
0.000	0.000	0.009	99.916	0.074	0.001	0.000	0.000	0.000	0.000	0.074	pg1710_o2nofp.cx10a_c8r32
0.000	0.000	0.011	99.918	0.071	0.000	0.000	0.000	0.000	0.000	0.033	pg184_o2nofp.cx10b_c8r32
0.000	0.000	0.021	99.919	0.060	0.000	0.000	0.000	0.000	0.000	0.037	pg19b1_o2nofp.cx10b_c8r32
0.000	0.000	0.000	67.684	27.081	5.230	0.005	0.000	0.000	0.000	0.534	my8408_rel_o2nofp.cz12a_c8r32
Delete response time histogram
256us	1ms	4ms	16ms	64ms	256ms	1s	4s	16s	gt	max	tag
0.000	2.956	14.911	39.578	42.555	0.000	0.000	0.000	0.000	0.000	0.047	pg1710_o2nofp.cx10a_c8r32
0.000	3.201	14.863	38.556	43.380	0.000	0.000	0.000	0.000	0.000	0.036	pg184_o2nofp.cx10b_c8r32
0.000	3.682	15.757	41.045	39.515	0.000	0.000	0.000	0.000	0.000	0.037	pg19b1_o2nofp.cx10b_c8r32
0.000	0.000	99.364	0.514	0.118	0.003	0.003	0.000	0.000	0.000	0.533	my8408_rel_o2nofp.cz12a_c8r32
l.i2
- l.i2: continue load after secondary indexes created with 5 inserts per transaction
- Legend for results is here.
- Each entry lists the percentage of responses that fit in that bucket (slower than max time for previous bucket, faster than min time for next bucket).
Insert response time histogram
256us	1ms	4ms	16ms	64ms	256ms	1s	4s	16s	gt	max	tag
0.000	91.945	8.022	0.033	0.000	0.000	0.000	0.000	0.000	0.000	0.006	pg1710_o2nofp.cx10a_c8r32
0.000	95.261	4.722	0.016	0.001	0.000	0.000	0.000	0.000	0.000	0.018	pg184_o2nofp.cx10b_c8r32
0.000	95.398	4.588	0.015	0.000	0.000	0.000	0.000	0.000	0.000	0.012	pg19b1_o2nofp.cx10b_c8r32
0.000	55.731	40.263	3.338	0.667	0.001	0.000	0.000	0.000	0.000	0.101	my8408_rel_o2nofp.cz12a_c8r32
Delete response time histogram
256us	1ms	4ms	16ms	64ms	256ms	1s	4s	16s	gt	max	tag
0.000	0.000	0.000	0.000	99.999	0.001	0.000	0.000	0.000	0.000	0.103	pg1710_o2nofp.cx10a_c8r32
0.000	0.000	0.000	0.000	99.999	0.001	0.000	0.000	0.000	0.000	0.105	pg184_o2nofp.cx10b_c8r32
0.000	0.000	0.000	0.000	99.999	0.001	0.000	0.000	0.000	0.000	0.100	pg19b1_o2nofp.cx10b_c8r32
0.000	98.714	1.016	0.257	0.012	0.001	0.000	0.000	0.000	0.000	0.101	my8408_rel_o2nofp.cz12a_c8r32
qr100.L1
- qr100.L1: range queries with 100 insert/s per client
- Legend for results is here.
- Each entry lists the percentage of responses that fit in that bucket (slower than max time for previous bucket, faster than min time for next bucket).
Query response time histogram
256us	1ms	4ms	16ms	64ms	256ms	1s	4s	16s	gt	max	tag
99.991	0.009	nonzero	nonzero	0.000	0.000	0.000	0.000	0.000	0.000	0.010	pg1710_o2nofp.cx10a_c8r32
99.999	0.001	nonzero	nonzero	0.000	0.000	0.000	0.000	0.000	0.000	0.013	pg184_o2nofp.cx10b_c8r32
99.999	0.001	nonzero	nonzero	0.000	0.000	0.000	0.000	0.000	0.000	0.010	pg19b1_o2nofp.cx10b_c8r32
99.993	0.006	0.001	nonzero	0.000	0.000	0.000	0.000	0.000	0.000	0.005	my8408_rel_o2nofp.cz12a_c8r32
Insert response time histogram
256us	1ms	4ms	16ms	64ms	256ms	1s	4s	16s	gt	max	tag
0.000	0.000	0.472	99.514	0.014	0.000	0.000	0.000	0.000	0.000	0.022	pg1710_o2nofp.cx10a_c8r32
0.000	0.000	0.444	99.528	0.028	0.000	0.000	0.000	0.000	0.000	0.022	pg184_o2nofp.cx10b_c8r32
0.000	0.000	0.431	99.556	0.014	0.000	0.000	0.000	0.000	0.000	0.023	pg19b1_o2nofp.cx10b_c8r32
0.000	0.000	0.000	99.931	0.069	0.000	0.000	0.000	0.000	0.000	0.041	my8408_rel_o2nofp.cz12a_c8r32
Delete response time histogram
256us	1ms	4ms	16ms	64ms	256ms	1s	4s	16s	gt	max	tag
0.000	27.625	72.375	0.000	0.000	0.000	0.000	0.000	0.000	0.000	0.004	pg1710_o2nofp.cx10a_c8r32
0.000	30.819	69.181	0.000	0.000	0.000	0.000	0.000	0.000	0.000	0.003	pg184_o2nofp.cx10b_c8r32
0.000	34.028	65.972	0.000	0.000	0.000	0.000	0.000	0.000	0.000	0.004	pg19b1_o2nofp.cx10b_c8r32
0.000	0.000	99.972	0.028	0.000	0.000	0.000	0.000	0.000	0.000	0.007	my8408_rel_o2nofp.cz12a_c8r32
qp100.L2
- qp100.L2: point queries with 100 insert/s per client
- Legend for results is here.
- Each entry lists the percentage of responses that fit in that bucket (slower than max time for previous bucket, faster than min time for next bucket).
Query response time histogram
256us	1ms	4ms	16ms	64ms	256ms	1s	4s	16s	gt	max	tag
nonzero	91.474	8.500	0.017	0.010	0.000	0.000	0.000	0.000	0.000	0.021	pg1710_o2nofp.cx10a_c8r32
nonzero	91.164	8.813	0.013	0.010	0.000	0.000	0.000	0.000	0.000	0.023	pg184_o2nofp.cx10b_c8r32
nonzero	92.661	7.315	0.020	0.004	0.000	0.000	0.000	0.000	0.000	0.024	pg19b1_o2nofp.cx10b_c8r32
0.012	94.729	5.036	0.222	0.001	0.000	0.000	0.000	0.000	0.000	0.022	my8408_rel_o2nofp.cz12a_c8r32
Insert response time histogram
256us	1ms	4ms	16ms	64ms	256ms	1s	4s	16s	gt	max	tag
0.000	0.000	0.000	99.792	0.208	0.000	0.000	0.000	0.000	0.000	0.023	pg1710_o2nofp.cx10a_c8r32
0.000	0.000	0.000	99.778	0.222	0.000	0.000	0.000	0.000	0.000	0.022	pg184_o2nofp.cx10b_c8r32
0.000	0.000	0.000	99.750	0.250	0.000	0.000	0.000	0.000	0.000	0.027	pg19b1_o2nofp.cx10b_c8r32
0.000	0.000	0.000	94.847	5.153	0.000	0.000	0.000	0.000	0.000	0.033	my8408_rel_o2nofp.cz12a_c8r32
Delete response time histogram
256us	1ms	4ms	16ms	64ms	256ms	1s	4s	16s	gt	max	tag
0.000	0.000	51.653	48.347	0.000	0.000	0.000	0.000	0.000	0.000	0.015	pg1710_o2nofp.cx10a_c8r32
0.000	0.000	63.306	36.694	0.000	0.000	0.000	0.000	0.000	0.000	0.016	pg184_o2nofp.cx10b_c8r32
0.000	0.000	71.486	28.514	0.000	0.000	0.000	0.000	0.000	0.000	0.016	pg19b1_o2nofp.cx10b_c8r32
0.000	0.000	99.597	0.389	0.014	0.000	0.000	0.000	0.000	0.000	0.019	my8408_rel_o2nofp.cz12a_c8r32
qr500.L3
- qr500.L3: range queries with 500 insert/s per client
- Legend for results is here.
- Each entry lists the percentage of responses that fit in that bucket (slower than max time for previous bucket, faster than min time for next bucket).
Query response time histogram
256us	1ms	4ms	16ms	64ms	256ms	1s	4s	16s	gt	max	tag
99.988	0.010	0.002	nonzero	nonzero	0.000	0.000	0.000	0.000	0.000	0.033	pg1710_o2nofp.cx10a_c8r32
99.993	0.005	0.002	nonzero	nonzero	0.000	0.000	0.000	0.000	0.000	0.045	pg184_o2nofp.cx10b_c8r32
99.993	0.006	0.002	nonzero	nonzero	0.000	0.000	0.000	0.000	0.000	0.041	pg19b1_o2nofp.cx10b_c8r32
99.964	0.034	0.002	nonzero	0.000	0.000	0.000	0.000	0.000	0.000	0.006	my8408_rel_o2nofp.cz12a_c8r32
Insert response time histogram
256us	1ms	4ms	16ms	64ms	256ms	1s	4s	16s	gt	max	tag
0.000	0.000	0.033	99.878	0.089	0.000	0.000	0.000	0.000	0.000	0.025	pg1710_o2nofp.cx10a_c8r32
0.000	0.000	0.033	99.847	0.119	0.000	0.000	0.000	0.000	0.000	0.023	pg184_o2nofp.cx10b_c8r32
0.000	0.000	0.031	99.881	0.089	0.000	0.000	0.000	0.000	0.000	0.022	pg19b1_o2nofp.cx10b_c8r32
0.000	0.000	0.036	99.772	0.189	0.000	0.003	0.000	0.000	0.000	0.299	my8408_rel_o2nofp.cz12a_c8r32
Delete response time histogram
256us	1ms	4ms	16ms	64ms	256ms	1s	4s	16s	gt	max	tag
0.000	0.000	1.578	75.242	23.181	0.000	0.000	0.000	0.000	0.000	0.026	pg1710_o2nofp.cx10a_c8r32
0.000	0.000	2.214	78.992	18.794	0.000	0.000	0.000	0.000	0.000	0.027	pg184_o2nofp.cx10b_c8r32
0.000	0.000	4.319	81.742	13.939	0.000	0.000	0.000	0.000	0.000	0.026	pg19b1_o2nofp.cx10b_c8r32
0.000	0.000	99.964	0.028	0.006	0.000	0.003	0.000	0.000	0.000	0.287	my8408_rel_o2nofp.cz12a_c8r32
qp500.L4
- qp500.L4: point queries with 500 insert/s per client
- Legend for results is here.
- Each entry lists the percentage of responses that fit in that bucket (slower than max time for previous bucket, faster than min time for next bucket).
Query response time histogram
256us	1ms	4ms	16ms	64ms	256ms	1s	4s	16s	gt	max	tag
nonzero	87.852	12.115	0.024	0.009	0.000	0.000	0.000	0.000	0.000	0.022	pg1710_o2nofp.cx10a_c8r32
nonzero	87.113	12.849	0.037	0.002	0.000	0.000	0.000	0.000	0.000	0.022	pg184_o2nofp.cx10b_c8r32
nonzero	89.218	10.751	0.027	0.005	0.000	0.000	0.000	0.000	0.000	0.022	pg19b1_o2nofp.cx10b_c8r32
0.001	86.412	12.908	0.582	0.097	nonzero	0.000	0.000	0.000	0.000	0.109	my8408_rel_o2nofp.cz12a_c8r32
Insert response time histogram
256us	1ms	4ms	16ms	64ms	256ms	1s	4s	16s	gt	max	tag
0.000	0.000	0.000	99.661	0.339	0.000	0.000	0.000	0.000	0.000	0.023	pg1710_o2nofp.cx10a_c8r32
0.000	0.000	0.000	99.694	0.306	0.000	0.000	0.000	0.000	0.000	0.045	pg184_o2nofp.cx10b_c8r32
0.000	0.000	0.000	99.719	0.281	0.000	0.000	0.000	0.000	0.000	0.024	pg19b1_o2nofp.cx10b_c8r32
0.000	0.000	0.003	93.225	6.739	0.033	0.000	0.000	0.000	0.000	0.105	my8408_rel_o2nofp.cz12a_c8r32
Delete response time histogram
256us	1ms	4ms	16ms	64ms	256ms	1s	4s	16s	gt	max	tag
0.000	0.000	0.000	0.000	99.997	0.003	0.000	0.000	0.000	0.000	0.073	pg1710_o2nofp.cx10a_c8r32
0.000	0.000	0.000	0.000	99.997	0.003	0.000	0.000	0.000	0.000	0.074	pg184_o2nofp.cx10b_c8r32
0.000	0.000	0.000	0.097	99.900	0.003	0.000	0.000	0.000	0.000	0.073	pg19b1_o2nofp.cx10b_c8r32
0.000	0.000	99.486	0.497	0.011	0.006	0.000	0.000	0.000	0.000	0.102	my8408_rel_o2nofp.cz12a_c8r32
qr1000.L5
- qr1000.L5: range queries with 1000 insert/s per client
- Legend for results is here.
- Each entry lists the percentage of responses that fit in that bucket (slower than max time for previous bucket, faster than min time for next bucket).
Query response time histogram
256us	1ms	4ms	16ms	64ms	256ms	1s	4s	16s	gt	max	tag
99.941	0.054	0.005	nonzero	nonzero	nonzero	0.000	0.000	0.000	0.000	0.181	pg1710_o2nofp.cx10a_c8r32
99.937	0.057	0.005	0.001	nonzero	nonzero	0.000	0.000	0.000	0.000	0.184	pg184_o2nofp.cx10b_c8r32
99.931	0.063	0.005	nonzero	nonzero	nonzero	0.000	0.000	0.000	0.000	0.182	pg19b1_o2nofp.cx10b_c8r32
99.941	0.055	0.004	nonzero	0.000	0.000	0.000	0.000	0.000	0.000	0.005	my8408_rel_o2nofp.cz12a_c8r32
Insert response time histogram
256us	1ms	4ms	16ms	64ms	256ms	1s	4s	16s	gt	max	tag
0.000	0.000	0.293	99.675	0.032	0.000	0.000	0.000	0.000	0.000	0.023	pg1710_o2nofp.cx10a_c8r32
0.000	0.000	0.369	99.551	0.079	0.000	0.000	0.000	0.000	0.000	0.024	pg184_o2nofp.cx10b_c8r32
0.000	0.000	0.511	99.440	0.049	0.000	0.000	0.000	0.000	0.000	0.026	pg19b1_o2nofp.cx10b_c8r32
0.000	0.000	0.533	99.403	0.062	0.001	0.000	0.000	0.000	0.000	0.108	my8408_rel_o2nofp.cz12a_c8r32
Delete response time histogram
256us	1ms	4ms	16ms	64ms	256ms	1s	4s	16s	gt	max	tag
0.000	0.000	0.000	0.000	99.876	0.124	0.000	0.000	0.000	0.000	0.108	pg1710_o2nofp.cx10a_c8r32
0.000	0.000	0.000	0.000	99.860	0.140	0.000	0.000	0.000	0.000	0.111	pg184_o2nofp.cx10b_c8r32
0.000	0.000	0.000	0.000	99.954	0.046	0.000	0.000	0.000	0.000	0.106	pg19b1_o2nofp.cx10b_c8r32
0.000	0.000	99.986	0.007	0.007	0.000	0.000	0.000	0.000	0.000	0.035	my8408_rel_o2nofp.cz12a_c8r32
qp1000.L6
- qp1000.L6: point queries with 1000 insert/s per client
- Legend for results is here.
- Each entry lists the percentage of responses that fit in that bucket (slower than max time for previous bucket, faster than min time for next bucket).
Query response time histogram
256us	1ms	4ms	16ms	64ms	256ms	1s	4s	16s	gt	max	tag
nonzero	82.761	17.205	0.024	0.010	0.000	0.000	0.000	0.000	0.000	0.023	pg1710_o2nofp.cx10a_c8r32
nonzero	81.494	18.464	0.032	0.009	0.000	0.000	0.000	0.000	0.000	0.021	pg184_o2nofp.cx10b_c8r32
nonzero	83.837	16.122	0.032	0.009	0.000	0.000	0.000	0.000	0.000	0.023	pg19b1_o2nofp.cx10b_c8r32
0.000	70.573	28.375	0.734	0.318	0.000	0.000	0.000	0.000	0.000	0.056	my8408_rel_o2nofp.cz12a_c8r32
Insert response time histogram
256us	1ms	4ms	16ms	64ms	256ms	1s	4s	16s	gt	max	tag
0.000	0.000	0.000	99.676	0.324	0.000	0.000	0.000	0.000	0.000	0.028	pg1710_o2nofp.cx10a_c8r32
0.000	0.000	0.000	99.642	0.358	0.000	0.000	0.000	0.000	0.000	0.036	pg184_o2nofp.cx10b_c8r32
0.000	0.000	0.000	99.617	0.383	0.000	0.000	0.000	0.000	0.000	0.028	pg19b1_o2nofp.cx10b_c8r32
0.000	0.000	0.007	95.142	4.793	0.057	0.001	0.000	0.000	0.000	0.474	my8408_rel_o2nofp.cz12a_c8r32
Delete response time histogram
256us	1ms	4ms	16ms	64ms	256ms	1s	4s	16s	gt	max	tag
0.000	0.000	0.000	0.000	84.753	15.247	0.000	0.000	0.000	0.000	0.180	pg1710_o2nofp.cx10a_c8r32
0.000	0.000	0.000	0.000	97.915	2.085	0.000	0.000	0.000	0.000	0.181	pg184_o2nofp.cx10b_c8r32
0.000	0.000	0.000	0.000	99.535	0.465	0.000	0.000	0.000	0.000	0.174	pg19b1_o2nofp.cx10b_c8r32
0.000	0.000	99.715	0.265	0.018	0.000	0.001	0.000	0.000	0.000	0.472	my8408_rel_o2nofp.cz12a_c8r32