Introduction
This is a report for the insert benchmark with 30M docs and 1 client(s). It is generated by scripts (bash, awk, sed) and Tufte might not be impressed. An overview of the insert benchmark is here and a short update is here. Below, by DBMS, I mean DBMS+version.config. An example is my8020.c10b40 where my means MySQL, 8020 is version 8.0.20 and c10b40 is the name for the configuration file.
The test server has 8 AMD cores, 32G RAM and an NVMe SSD. It is described here as the PN53. The benchmark was run with 1 client and there were 1 or 3 connections per client (1 for queries or inserts without rate limits, 1+1 for rate limited inserts+deletes). It uses 1 table. It loads 30M rows per table without secondary indexes, creates 3 secondary indexes per table, then inserts 40m+10m rows per table with a delete per insert to avoid growing the table. It then does 6 read+write tests for 3600s each that do queries as fast as possible with 100,100,500,500,1000,1000 inserts/s and the same for deletes/s per client concurrent with the queries. The database is cached by InnoDB. Clients and the DBMS share one server. The per-database configs are in the per-database subdirectories here.
The tested DBMS are:
- pg1710_o2nofp.cx10a_c8r32 - Postgres 17.10 with the cx10a config
- pg184_o2nofp.cx10b_c8r32 - Postgres 18.4 with the cx10b config
- pg19b1_o2nofp.cx10b_c8r32 - Postgres 19 beta1 with the cx10b config
Contents
- Summary
- l.i0: load without secondary indexes
- l.x: create secondary indexes
- l.i1: continue load after secondary indexes created with 50 inserts per transaction
- l.i2: continue load after secondary indexes created with 5 inserts per transaction
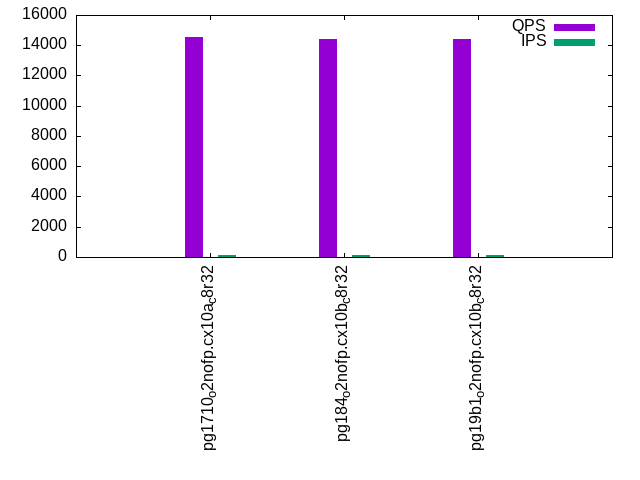
- qr100.L1: range queries with 100 insert/s per client
- qp100.L2: point queries with 100 insert/s per client
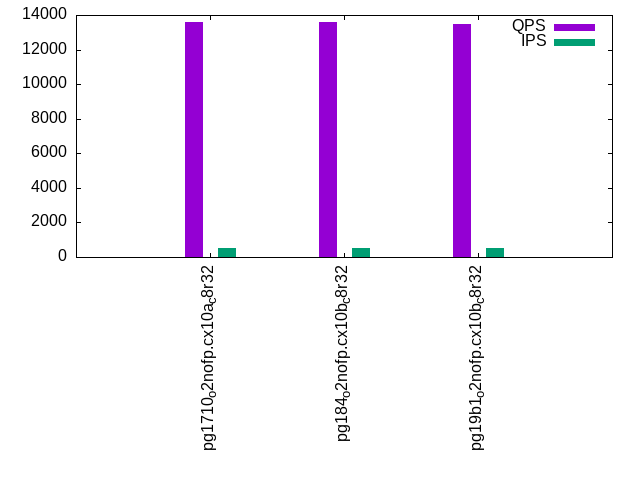
- qr500.L3: range queries with 500 insert/s per client
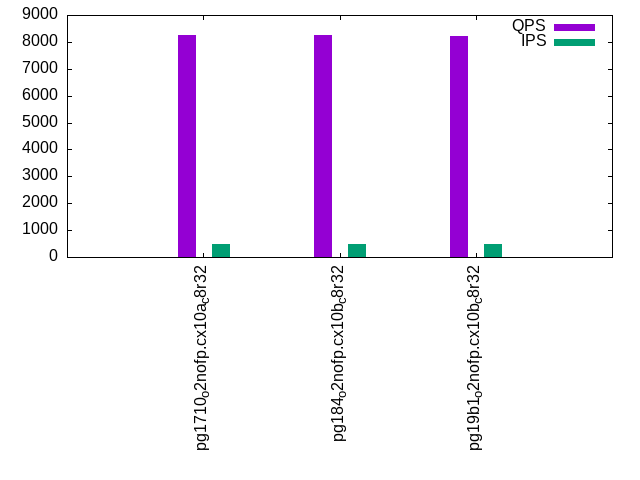
- qp500.L4: point queries with 500 insert/s per client
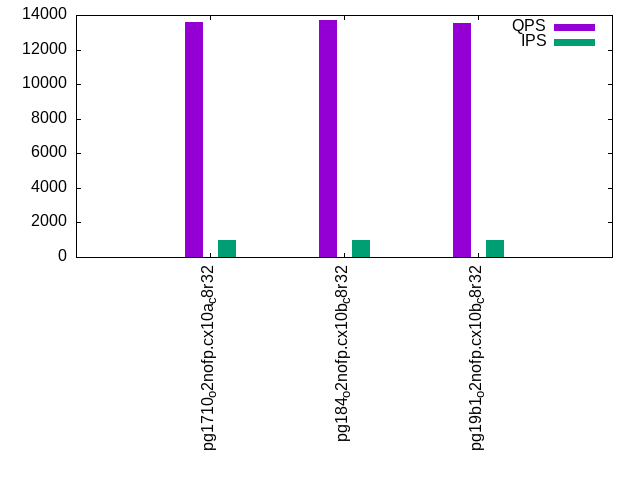
- qr1000.L5: range queries with 1000 insert/s per client
- qp1000.L6: point queries with 1000 insert/s per client
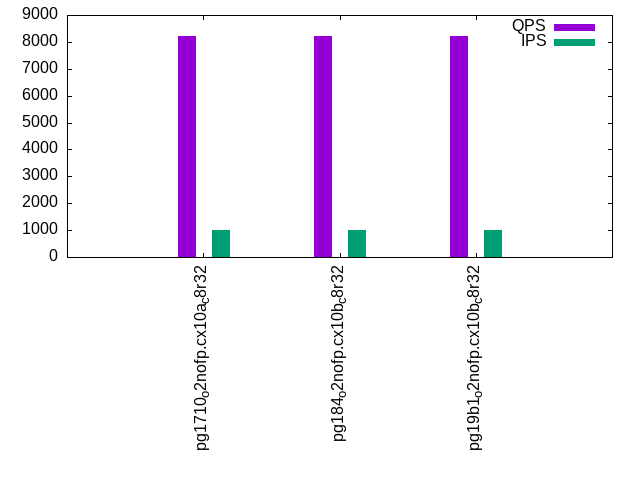
Summary
The numbers are inserts/s for l.i0, l.i1 and l.i2, indexed docs (or rows) /s for l.x and queries/s for qr100, qp100 thru qr1000, qp1000" The values are the average rate over the entire test for inserts (IPS) and queries (QPS). The range of values for IPS and QPS is split into 3 parts: bottom 25%, middle 50%, top 25%. Values in the bottom 25% have a red background, values in the top 25% have a green background and values in the middle have no color. A gray background is used for values that can be ignored because the DBMS did not sustain the target insert rate. Red backgrounds are not used when the minimum value is within 80% of the max value.
| dbms | l.i0 | l.x | l.i1 | l.i2 | qr100 | qp100 | qr500 | qp500 | qr1000 | qp1000 |
|---|---|---|---|---|---|---|---|---|---|---|
| pg1710_o2nofp.cx10a_c8r32 | 139535 | 370372 | 17346 | 2198 | 14568 | 8313 | 13602 | 8274 | 13601 | 8204 |
| pg184_o2nofp.cx10b_c8r32 | 139535 | 379748 | 17637 | 2347 | 14410 | 8274 | 13576 | 8251 | 13702 | 8225 |
| pg19b1_o2nofp.cx10b_c8r32 | 141509 | 428573 | 21379 | 2671 | 14400 | 8304 | 13487 | 8222 | 13554 | 8228 |
This table has relative throughput, throughput for the DBMS relative to the DBMS in the first line, using the absolute throughput from the previous table. Values less than 0.95 have a yellow background. Values greater than 1.05 have a blue background.
| dbms | l.i0 | l.x | l.i1 | l.i2 | qr100 | qp100 | qr500 | qp500 | qr1000 | qp1000 |
|---|---|---|---|---|---|---|---|---|---|---|
| pg1710_o2nofp.cx10a_c8r32 | 1.00 | 1.00 | 1.00 | 1.00 | 1.00 | 1.00 | 1.00 | 1.00 | 1.00 | 1.00 |
| pg184_o2nofp.cx10b_c8r32 | 1.00 | 1.03 | 1.02 | 1.07 | 0.99 | 1.00 | 1.00 | 1.00 | 1.01 | 1.00 |
| pg19b1_o2nofp.cx10b_c8r32 | 1.01 | 1.16 | 1.23 | 1.22 | 0.99 | 1.00 | 0.99 | 0.99 | 1.00 | 1.00 |
This lists the average rate of inserts/s for the tests that do inserts concurrent with queries. For such tests the query rate is listed in the table above. The read+write tests are setup so that the insert rate should match the target rate every second. Cells that are not at least 95% of the target have a red background to indicate a failure to satisfy the target.
| dbms | qr100.L1 | qp100.L2 | qr500.L3 | qp500.L4 | qr1000.L5 | qp1000.L6 |
|---|---|---|---|---|---|---|
| pg1710_o2nofp.cx10a_c8r32 | 100 | 100 | 500 | 500 | 999 | 999 |
| pg184_o2nofp.cx10b_c8r32 | 100 | 100 | 500 | 500 | 999 | 999 |
| pg19b1_o2nofp.cx10b_c8r32 | 100 | 100 | 500 | 500 | 999 | 1000 |
| target | 100 | 100 | 500 | 500 | 1000 | 1000 |
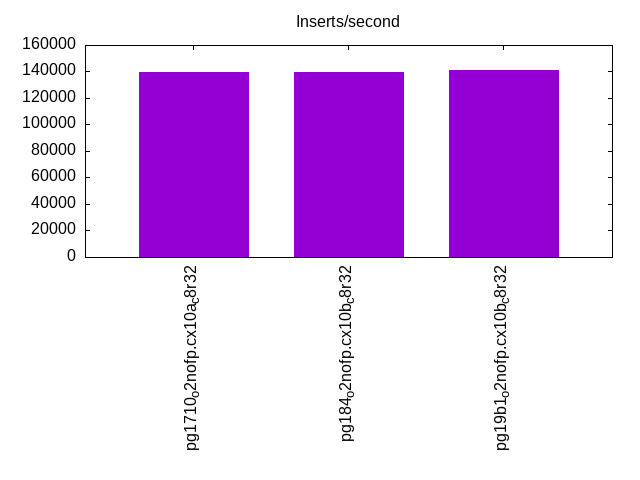
l.i0
l.i0: load without secondary indexes. Graphs for performance per 1-second interval are here.
Average throughput:
Insert response time histogram: each cell has the percentage of responses that take <= the time in the header and max is the max response time in seconds. For the max column values in the top 25% of the range have a red background and in the bottom 25% of the range have a green background. The red background is not used when the min value is within 80% of the max value.
| dbms | 256us | 1ms | 4ms | 16ms | 64ms | 256ms | 1s | 4s | 16s | gt | max |
|---|---|---|---|---|---|---|---|---|---|---|---|
| pg1710_o2nofp.cx10a_c8r32 | 99.967 | 0.033 | 0.003 | ||||||||
| pg184_o2nofp.cx10b_c8r32 | 99.969 | 0.031 | 0.003 | ||||||||
| pg19b1_o2nofp.cx10b_c8r32 | 99.975 | 0.025 | 0.003 |
Performance metrics for the DBMS listed above. Some are normalized by throughput, others are not. Legend for results is here.
ips	qps	rps	rmbps	wps	wmbps	rpq	rkbpq	wpi	wkbpi	csps	cpups	cspq	cpupq	dbgb1	dbgb2	rss	maxop	p50	p99	tag
139535	0	0	0.0	516.0	58.7	0.000	0.000	0.004	0.431	15094	19.5	0.108	11	2.9	7.8	0.4	0.003	139981	137582	pg1710_o2nofp.cx10a_c8r32
139535	0	0	0.0	523.2	59.3	0.000	0.000	0.004	0.435	15052	19.4	0.108	11	2.9	7.8	2.9	0.003	140481	137585	pg184_o2nofp.cx10b_c8r32
141509	0	0	0.0	528.4	59.8	0.000	0.000	0.004	0.433	15167	19.5	0.107	11	2.9	7.8	2.9	0.003	141985	138491	pg19b1_o2nofp.cx10b_c8r32
Average values from iostat.
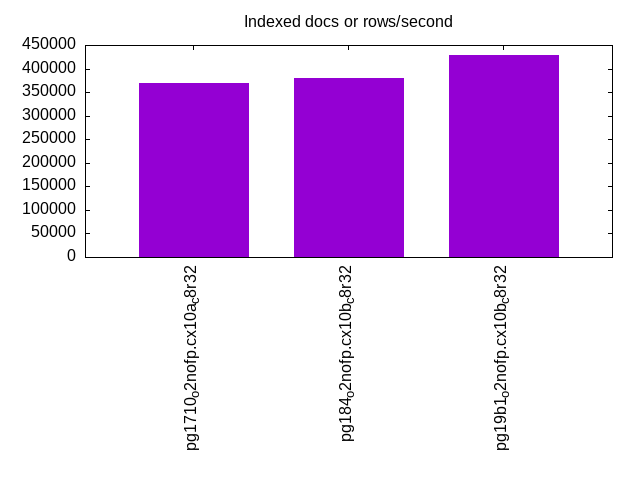
l.x
l.x: create secondary indexes.
Average throughput:
Performance metrics for the DBMS listed above. Some are normalized by throughput, others are not. Legend for results is here.
ips	qps	rps	rmbps	wps	wmbps	rpq	rkbpq	wpi	wkbpi	csps	cpups	cspq	cpupq	dbgb1	dbgb2	rss	maxop	p50	p99	tag
370372	0	0	0.0	754.5	92.6	0.000	0.000	0.002	0.256	1854	11.6	0.005	3	5.8	13.3	3.0	0.002	NA	NA	pg1710_o2nofp.cx10a_c8r32
379748	0	0	0.0	715.2	87.8	0.000	0.000	0.002	0.237	1702	12.1	0.004	3	5.8	13.3	3.0	0.002	NA	NA	pg184_o2nofp.cx10b_c8r32
428573	0	0	0.0	857.6	105.1	0.000	0.000	0.002	0.251	2162	12.1	0.005	2	5.8	13.3	3.0	0.002	NA	NA	pg19b1_o2nofp.cx10b_c8r32
Average values from iostat.
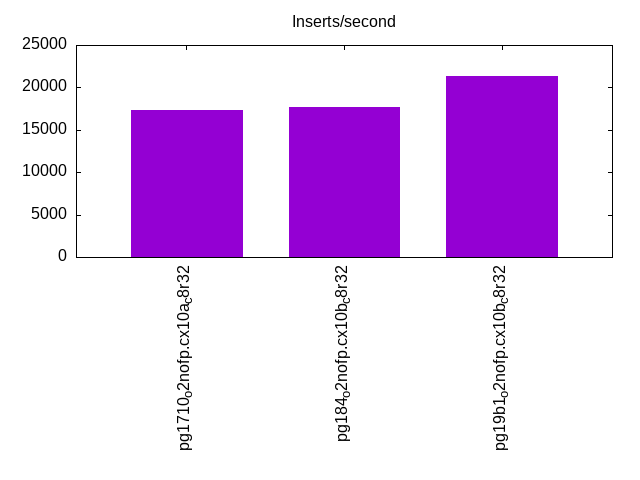
l.i1
l.i1: continue load after secondary indexes created with 50 inserts per transaction. Graphs for performance per 1-second interval are here.
Average throughput:
Insert response time histogram: each cell has the percentage of responses that take <= the time in the header and max is the max response time in seconds. For the max column values in the top 25% of the range have a red background and in the bottom 25% of the range have a green background. The red background is not used when the min value is within 80% of the max value.
| dbms | 256us | 1ms | 4ms | 16ms | 64ms | 256ms | 1s | 4s | 16s | gt | max |
|---|---|---|---|---|---|---|---|---|---|---|---|
| pg1710_o2nofp.cx10a_c8r32 | 25.769 | 74.225 | 0.005 | 0.001 | 0.043 | ||||||
| pg184_o2nofp.cx10b_c8r32 | 24.371 | 75.623 | 0.005 | 0.001 | 0.037 | ||||||
| pg19b1_o2nofp.cx10b_c8r32 | 38.359 | 61.637 | 0.003 | 0.001 | 0.036 |
Delete response time histogram: each cell has the percentage of responses that take <= the time in the header and max is the max response time in seconds. For the max column values in the top 25% of the range have a red background and in the bottom 25% of the range have a green background. The red background is not used when the min value is within 80% of the max value.
| dbms | 256us | 1ms | 4ms | 16ms | 64ms | 256ms | 1s | 4s | 16s | gt | max |
|---|---|---|---|---|---|---|---|---|---|---|---|
| pg1710_o2nofp.cx10a_c8r32 | 19.570 | 55.030 | 25.398 | 0.001 | 0.042 | ||||||
| pg184_o2nofp.cx10b_c8r32 | 19.826 | 57.110 | 23.062 | 0.001 | 0.037 | ||||||
| pg19b1_o2nofp.cx10b_c8r32 | 24.097 | 71.153 | 4.749 | 0.001 | 0.036 |
Performance metrics for the DBMS listed above. Some are normalized by throughput, others are not. Legend for results is here.
ips	qps	rps	rmbps	wps	wmbps	rpq	rkbpq	wpi	wkbpi	csps	cpups	cspq	cpupq	dbgb1	dbgb2	rss	maxop	p50	p99	tag
17346	0	0	0.0	213.1	23.4	0.000	0.000	0.012	1.382	7514	18.2	0.433	84	7.8	38.5	7.4	0.043	13648	9249	pg1710_o2nofp.cx10a_c8r32
17637	0	0	0.0	224.6	24.7	0.000	0.000	0.013	1.435	8044	19.0	0.456	86	7.8	38.5	3.0	0.037	13948	9599	pg184_o2nofp.cx10b_c8r32
21379	0	0	0.0	270.8	29.8	0.000	0.000	0.013	1.428	9473	19.7	0.443	74	7.8	38.3	3.3	0.036	17348	11148	pg19b1_o2nofp.cx10b_c8r32
Average values from iostat.
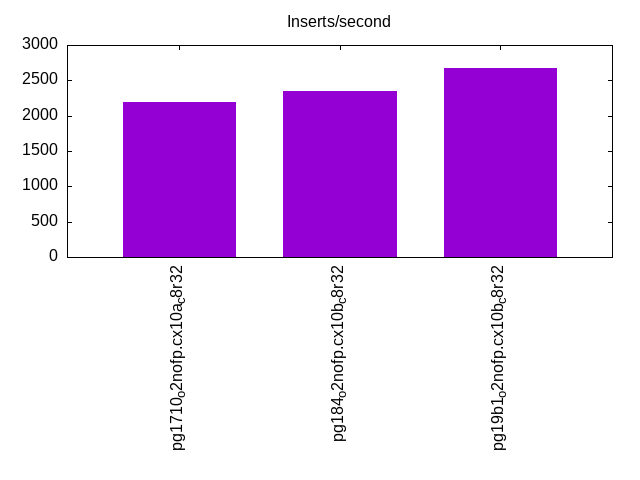
l.i2
l.i2: continue load after secondary indexes created with 5 inserts per transaction. Graphs for performance per 1-second interval are here.
Average throughput:
Insert response time histogram: each cell has the percentage of responses that take <= the time in the header and max is the max response time in seconds. For the max column values in the top 25% of the range have a red background and in the bottom 25% of the range have a green background. The red background is not used when the min value is within 80% of the max value.
| dbms | 256us | 1ms | 4ms | 16ms | 64ms | 256ms | 1s | 4s | 16s | gt | max |
|---|---|---|---|---|---|---|---|---|---|---|---|
| pg1710_o2nofp.cx10a_c8r32 | 55.974 | 43.988 | 0.038 | 0.003 | |||||||
| pg184_o2nofp.cx10b_c8r32 | 67.155 | 32.820 | 0.024 | nonzero | 0.022 | ||||||
| pg19b1_o2nofp.cx10b_c8r32 | 75.789 | 24.196 | 0.015 | nonzero | nonzero | 0.027 |
Delete response time histogram: each cell has the percentage of responses that take <= the time in the header and max is the max response time in seconds. For the max column values in the top 25% of the range have a red background and in the bottom 25% of the range have a green background. The red background is not used when the min value is within 80% of the max value.
| dbms | 256us | 1ms | 4ms | 16ms | 64ms | 256ms | 1s | 4s | 16s | gt | max |
|---|---|---|---|---|---|---|---|---|---|---|---|
| pg1710_o2nofp.cx10a_c8r32 | 1.012 | 18.175 | 67.718 | 13.095 | 0.014 | ||||||
| pg184_o2nofp.cx10b_c8r32 | 0.743 | 24.510 | 69.203 | 5.545 | nonzero | 0.022 | |||||
| pg19b1_o2nofp.cx10b_c8r32 | 1.046 | 34.522 | 64.082 | 0.349 | nonzero | 0.027 |
Performance metrics for the DBMS listed above. Some are normalized by throughput, others are not. Legend for results is here.
ips	qps	rps	rmbps	wps	wmbps	rpq	rkbpq	wpi	wkbpi	csps	cpups	cspq	cpupq	dbgb1	dbgb2	rss	maxop	p50	p99	tag
2198	0	0	0.0	52.6	5.0	0.000	0.000	0.024	2.327	8827	14.1	4.016	513	7.9	39.9	0.3	0.003	1630	1030	pg1710_o2nofp.cx10a_c8r32
2347	0	0	0.0	53.6	5.2	0.000	0.000	0.023	2.254	9531	14.4	4.061	491	7.9	39.7	1.2	0.022	1780	1080	pg184_o2nofp.cx10b_c8r32
2671	0	0	0.0	58.6	5.8	0.000	0.000	0.022	2.223	10936	14.8	4.095	443	7.9	40.2	0.2	0.027	1880	1280	pg19b1_o2nofp.cx10b_c8r32
Average values from iostat.
qr100.L1
qr100.L1: range queries with 100 insert/s per client. Graphs for performance per 1-second interval are here.
Average throughput:
Query response time histogram: each cell has the percentage of responses that take <= the time in the header and max is the max response time in seconds. For max values in the top 25% of the range have a red background and in the bottom 25% of the range have a green background. The red background is not used when the min value is within 80% of the max value.
| dbms | 256us | 1ms | 4ms | 16ms | 64ms | 256ms | 1s | 4s | 16s | gt | max |
|---|---|---|---|---|---|---|---|---|---|---|---|
| pg1710_o2nofp.cx10a_c8r32 | 99.988 | 0.012 | nonzero | 0.003 | |||||||
| pg184_o2nofp.cx10b_c8r32 | 99.994 | 0.006 | nonzero | 0.003 | |||||||
| pg19b1_o2nofp.cx10b_c8r32 | 99.993 | 0.007 | nonzero | 0.003 |
Insert response time histogram: each cell has the percentage of responses that take <= the time in the header and max is the max response time in seconds. For max values in the top 25% of the range have a red background and in the bottom 25% of the range have a green background. The red background is not used when the min value is within 80% of the max value.
| dbms | 256us | 1ms | 4ms | 16ms | 64ms | 256ms | 1s | 4s | 16s | gt | max |
|---|---|---|---|---|---|---|---|---|---|---|---|
| pg1710_o2nofp.cx10a_c8r32 | 99.986 | 0.014 | 0.006 | ||||||||
| pg184_o2nofp.cx10b_c8r32 | 99.986 | 0.014 | 0.006 | ||||||||
| pg19b1_o2nofp.cx10b_c8r32 | 99.986 | 0.014 | 0.006 |
Delete response time histogram: each cell has the percentage of responses that take <= the time in the header and max is the max response time in seconds. For max values in the top 25% of the range have a red background and in the bottom 25% of the range have a green background. The red background is not used when the min value is within 80% of the max value.
| dbms | 256us | 1ms | 4ms | 16ms | 64ms | 256ms | 1s | 4s | 16s | gt | max |
|---|---|---|---|---|---|---|---|---|---|---|---|
| pg1710_o2nofp.cx10a_c8r32 | 32.625 | 67.375 | 0.003 | ||||||||
| pg184_o2nofp.cx10b_c8r32 | 32.250 | 67.750 | 0.003 | ||||||||
| pg19b1_o2nofp.cx10b_c8r32 | 35.181 | 64.819 | 0.003 |
Performance metrics for the DBMS listed above. Some are normalized by throughput, others are not. Legend for results is here.
ips	qps	rps	rmbps	wps	wmbps	rpq	rkbpq	wpi	wkbpi	csps	cpups	cspq	cpupq	dbgb1	dbgb2	rss	maxop	p50	p99	tag
100	14568	0	0.0	36.0	1.2	0.000	0.000	0.360	12.245	55733	12.4	3.826	68	7.9	39.2	0.2	0.003	14590	14298	pg1710_o2nofp.cx10a_c8r32
100	14410	0	0.0	35.9	1.2	0.000	0.000	0.360	12.227	55139	12.5	3.827	69	7.9	39.3	0.2	0.003	14412	14092	pg184_o2nofp.cx10b_c8r32
100	14400	0	0.0	36.2	1.2	0.000	0.000	0.363	12.238	55103	12.5	3.827	69	7.9	40.2	0.2	0.003	14396	14078	pg19b1_o2nofp.cx10b_c8r32
Average values from iostat.
qp100.L2
qp100.L2: point queries with 100 insert/s per client. Graphs for performance per 1-second interval are here.
Average throughput:

Query response time histogram: each cell has the percentage of responses that take <= the time in the header and max is the max response time in seconds. For max values in the top 25% of the range have a red background and in the bottom 25% of the range have a green background. The red background is not used when the min value is within 80% of the max value.
| dbms | 256us | 1ms | 4ms | 16ms | 64ms | 256ms | 1s | 4s | 16s | gt | max |
|---|---|---|---|---|---|---|---|---|---|---|---|
| pg1710_o2nofp.cx10a_c8r32 | 99.978 | 0.022 | nonzero | 0.003 | |||||||
| pg184_o2nofp.cx10b_c8r32 | 99.985 | 0.015 | nonzero | 0.004 | |||||||
| pg19b1_o2nofp.cx10b_c8r32 | 99.985 | 0.015 | nonzero | 0.003 |
Insert response time histogram: each cell has the percentage of responses that take <= the time in the header and max is the max response time in seconds. For max values in the top 25% of the range have a red background and in the bottom 25% of the range have a green background. The red background is not used when the min value is within 80% of the max value.
| dbms | 256us | 1ms | 4ms | 16ms | 64ms | 256ms | 1s | 4s | 16s | gt | max |
|---|---|---|---|---|---|---|---|---|---|---|---|
| pg1710_o2nofp.cx10a_c8r32 | 99.986 | 0.014 | 0.005 | ||||||||
| pg184_o2nofp.cx10b_c8r32 | 99.986 | 0.014 | 0.006 | ||||||||
| pg19b1_o2nofp.cx10b_c8r32 | 99.986 | 0.014 | 0.006 |
Delete response time histogram: each cell has the percentage of responses that take <= the time in the header and max is the max response time in seconds. For max values in the top 25% of the range have a red background and in the bottom 25% of the range have a green background. The red background is not used when the min value is within 80% of the max value.
| dbms | 256us | 1ms | 4ms | 16ms | 64ms | 256ms | 1s | 4s | 16s | gt | max |
|---|---|---|---|---|---|---|---|---|---|---|---|
| pg1710_o2nofp.cx10a_c8r32 | 99.972 | 0.028 | 0.006 | ||||||||
| pg184_o2nofp.cx10b_c8r32 | 99.972 | 0.028 | 0.006 | ||||||||
| pg19b1_o2nofp.cx10b_c8r32 | 99.986 | 0.014 | 0.006 |
Performance metrics for the DBMS listed above. Some are normalized by throughput, others are not. Legend for results is here.
ips	qps	rps	rmbps	wps	wmbps	rpq	rkbpq	wpi	wkbpi	csps	cpups	cspq	cpupq	dbgb1	dbgb2	rss	maxop	p50	p99	tag
100	8313	0	0.0	60.1	1.5	0.000	0.000	0.602	15.420	32204	12.4	3.874	119	7.9	36.8	0.2	0.003	8332	8157	pg1710_o2nofp.cx10a_c8r32
100	8274	0	0.0	60.3	1.5	0.000	0.000	0.604	15.412	32052	12.4	3.874	120	7.9	37.0	0.2	0.004	8285	8175	pg184_o2nofp.cx10b_c8r32
100	8304	0	0.0	60.9	1.5	0.000	0.000	0.610	15.418	32163	12.4	3.873	119	7.9	37.8	0.2	0.003	8316	8207	pg19b1_o2nofp.cx10b_c8r32
Average values from iostat.
qr500.L3
qr500.L3: range queries with 500 insert/s per client. Graphs for performance per 1-second interval are here.
Average throughput:
Query response time histogram: each cell has the percentage of responses that take <= the time in the header and max is the max response time in seconds. For max values in the top 25% of the range have a red background and in the bottom 25% of the range have a green background. The red background is not used when the min value is within 80% of the max value.
| dbms | 256us | 1ms | 4ms | 16ms | 64ms | 256ms | 1s | 4s | 16s | gt | max |
|---|---|---|---|---|---|---|---|---|---|---|---|
| pg1710_o2nofp.cx10a_c8r32 | 99.985 | 0.014 | 0.001 | nonzero | 0.004 | ||||||
| pg184_o2nofp.cx10b_c8r32 | 99.991 | 0.009 | nonzero | nonzero | 0.004 | ||||||
| pg19b1_o2nofp.cx10b_c8r32 | 99.991 | 0.009 | nonzero | 0.004 |
Insert response time histogram: each cell has the percentage of responses that take <= the time in the header and max is the max response time in seconds. For max values in the top 25% of the range have a red background and in the bottom 25% of the range have a green background. The red background is not used when the min value is within 80% of the max value.
| dbms | 256us | 1ms | 4ms | 16ms | 64ms | 256ms | 1s | 4s | 16s | gt | max |
|---|---|---|---|---|---|---|---|---|---|---|---|
| pg1710_o2nofp.cx10a_c8r32 | 11.944 | 88.044 | 0.011 | 0.005 | |||||||
| pg184_o2nofp.cx10b_c8r32 | 11.769 | 88.225 | 0.006 | 0.006 | |||||||
| pg19b1_o2nofp.cx10b_c8r32 | 18.294 | 81.700 | 0.006 | 0.006 |
Delete response time histogram: each cell has the percentage of responses that take <= the time in the header and max is the max response time in seconds. For max values in the top 25% of the range have a red background and in the bottom 25% of the range have a green background. The red background is not used when the min value is within 80% of the max value.
| dbms | 256us | 1ms | 4ms | 16ms | 64ms | 256ms | 1s | 4s | 16s | gt | max |
|---|---|---|---|---|---|---|---|---|---|---|---|
| pg1710_o2nofp.cx10a_c8r32 | 10.019 | 73.617 | 16.364 | 0.008 | |||||||
| pg184_o2nofp.cx10b_c8r32 | 8.933 | 83.372 | 7.694 | 0.009 | |||||||
| pg19b1_o2nofp.cx10b_c8r32 | 10.769 | 84.758 | 4.472 | 0.009 |
Performance metrics for the DBMS listed above. Some are normalized by throughput, others are not. Legend for results is here.
ips	qps	rps	rmbps	wps	wmbps	rpq	rkbpq	wpi	wkbpi	csps	cpups	cspq	cpupq	dbgb1	dbgb2	rss	maxop	p50	p99	tag
500	13602	0	0.0	50.8	2.7	0.000	0.000	0.102	5.557	52206	12.8	3.838	75	8.0	33.4	0.4	0.004	13550	12687	pg1710_o2nofp.cx10a_c8r32
500	13576	0	0.0	52.1	2.7	0.000	0.000	0.104	5.527	52107	12.8	3.838	75	8.0	33.6	0.3	0.004	13484	12734	pg184_o2nofp.cx10b_c8r32
500	13487	0	0.0	54.3	2.6	0.000	0.000	0.109	5.412	51770	12.8	3.839	76	8.0	34.5	0.3	0.004	13358	12748	pg19b1_o2nofp.cx10b_c8r32
Average values from iostat.
qp500.L4
qp500.L4: point queries with 500 insert/s per client. Graphs for performance per 1-second interval are here.
Average throughput:
Query response time histogram: each cell has the percentage of responses that take <= the time in the header and max is the max response time in seconds. For max values in the top 25% of the range have a red background and in the bottom 25% of the range have a green background. The red background is not used when the min value is within 80% of the max value.
| dbms | 256us | 1ms | 4ms | 16ms | 64ms | 256ms | 1s | 4s | 16s | gt | max |
|---|---|---|---|---|---|---|---|---|---|---|---|
| pg1710_o2nofp.cx10a_c8r32 | 99.971 | 0.029 | 0.001 | nonzero | 0.036 | ||||||
| pg184_o2nofp.cx10b_c8r32 | 99.982 | 0.017 | 0.001 | 0.004 | |||||||
| pg19b1_o2nofp.cx10b_c8r32 | 99.983 | 0.017 | 0.001 | nonzero | 0.016 |
Insert response time histogram: each cell has the percentage of responses that take <= the time in the header and max is the max response time in seconds. For max values in the top 25% of the range have a red background and in the bottom 25% of the range have a green background. The red background is not used when the min value is within 80% of the max value.
| dbms | 256us | 1ms | 4ms | 16ms | 64ms | 256ms | 1s | 4s | 16s | gt | max |
|---|---|---|---|---|---|---|---|---|---|---|---|
| pg1710_o2nofp.cx10a_c8r32 | 6.217 | 93.778 | 0.006 | 0.005 | |||||||
| pg184_o2nofp.cx10b_c8r32 | 7.672 | 92.308 | 0.017 | 0.003 | 0.024 | ||||||
| pg19b1_o2nofp.cx10b_c8r32 | 11.744 | 88.231 | 0.019 | 0.006 | 0.020 |
Delete response time histogram: each cell has the percentage of responses that take <= the time in the header and max is the max response time in seconds. For max values in the top 25% of the range have a red background and in the bottom 25% of the range have a green background. The red background is not used when the min value is within 80% of the max value.
| dbms | 256us | 1ms | 4ms | 16ms | 64ms | 256ms | 1s | 4s | 16s | gt | max |
|---|---|---|---|---|---|---|---|---|---|---|---|
| pg1710_o2nofp.cx10a_c8r32 | 8.836 | 68.669 | 22.494 | 0.011 | |||||||
| pg184_o2nofp.cx10b_c8r32 | 12.447 | 72.236 | 15.314 | 0.003 | 0.023 | ||||||
| pg19b1_o2nofp.cx10b_c8r32 | 32.744 | 62.528 | 4.722 | 0.006 | 0.019 |
Performance metrics for the DBMS listed above. Some are normalized by throughput, others are not. Legend for results is here.
ips	qps	rps	rmbps	wps	wmbps	rpq	rkbpq	wpi	wkbpi	csps	cpups	cspq	cpupq	dbgb1	dbgb2	rss	maxop	p50	p99	tag
500	8274	0	0.0	43.7	2.9	0.000	0.000	0.088	5.912	32188	12.6	3.890	122	8.0	29.0	0.3	0.036	8287	8109	pg1710_o2nofp.cx10a_c8r32
500	8251	0	0.0	45.5	2.9	0.000	0.000	0.091	5.951	32096	12.7	3.890	123	8.0	29.2	1.1	0.004	8255	8143	pg184_o2nofp.cx10b_c8r32
500	8222	0	0.0	49.4	2.9	0.000	0.000	0.099	5.864	31991	12.5	3.891	122	8.0	30.1	0.2	0.016	8237	8111	pg19b1_o2nofp.cx10b_c8r32
Average values from iostat.
qr1000.L5
qr1000.L5: range queries with 1000 insert/s per client. Graphs for performance per 1-second interval are here.
Average throughput:
Query response time histogram: each cell has the percentage of responses that take <= the time in the header and max is the max response time in seconds. For max values in the top 25% of the range have a red background and in the bottom 25% of the range have a green background. The red background is not used when the min value is within 80% of the max value.
| dbms | 256us | 1ms | 4ms | 16ms | 64ms | 256ms | 1s | 4s | 16s | gt | max |
|---|---|---|---|---|---|---|---|---|---|---|---|
| pg1710_o2nofp.cx10a_c8r32 | 99.984 | 0.014 | 0.002 | nonzero | nonzero | 0.017 | |||||
| pg184_o2nofp.cx10b_c8r32 | 99.991 | 0.008 | 0.001 | 0.004 | |||||||
| pg19b1_o2nofp.cx10b_c8r32 | 99.990 | 0.009 | 0.001 | nonzero | 0.004 |
Insert response time histogram: each cell has the percentage of responses that take <= the time in the header and max is the max response time in seconds. For max values in the top 25% of the range have a red background and in the bottom 25% of the range have a green background. The red background is not used when the min value is within 80% of the max value.
| dbms | 256us | 1ms | 4ms | 16ms | 64ms | 256ms | 1s | 4s | 16s | gt | max |
|---|---|---|---|---|---|---|---|---|---|---|---|
| pg1710_o2nofp.cx10a_c8r32 | 28.967 | 71.026 | 0.006 | 0.001 | 0.022 | ||||||
| pg184_o2nofp.cx10b_c8r32 | 32.139 | 67.858 | 0.003 | 0.006 | |||||||
| pg19b1_o2nofp.cx10b_c8r32 | 33.217 | 66.782 | 0.001 | 0.006 |
Delete response time histogram: each cell has the percentage of responses that take <= the time in the header and max is the max response time in seconds. For max values in the top 25% of the range have a red background and in the bottom 25% of the range have a green background. The red background is not used when the min value is within 80% of the max value.
| dbms | 256us | 1ms | 4ms | 16ms | 64ms | 256ms | 1s | 4s | 16s | gt | max |
|---|---|---|---|---|---|---|---|---|---|---|---|
| pg1710_o2nofp.cx10a_c8r32 | 14.001 | 65.997 | 20.000 | 0.001 | 0.021 | ||||||
| pg184_o2nofp.cx10b_c8r32 | 11.671 | 82.060 | 6.269 | 0.005 | |||||||
| pg19b1_o2nofp.cx10b_c8r32 | 23.044 | 67.601 | 9.354 | 0.008 |
Performance metrics for the DBMS listed above. Some are normalized by throughput, others are not. Legend for results is here.
ips	qps	rps	rmbps	wps	wmbps	rpq	rkbpq	wpi	wkbpi	csps	cpups	cspq	cpupq	dbgb1	dbgb2	rss	maxop	p50	p99	tag
999	13601	0	0.0	45.4	3.5	0.000	0.000	0.045	3.543	52616	13.4	3.869	79	8.1	28.1	0.3	0.017	13646	12570	pg1710_o2nofp.cx10a_c8r32
999	13702	0	0.0	38.1	3.5	0.000	0.000	0.038	3.571	52790	13.3	3.853	78	8.0	28.1	0.6	0.004	13726	12702	pg184_o2nofp.cx10b_c8r32
999	13554	0	0.0	47.0	3.4	0.000	0.000	0.047	3.501	52240	13.4	3.854	79	8.0	28.1	0.4	0.004	13518	12635	pg19b1_o2nofp.cx10b_c8r32
Average values from iostat.
qp1000.L6
qp1000.L6: point queries with 1000 insert/s per client. Graphs for performance per 1-second interval are here.
Average throughput:
Query response time histogram: each cell has the percentage of responses that take <= the time in the header and max is the max response time in seconds. For max values in the top 25% of the range have a red background and in the bottom 25% of the range have a green background. The red background is not used when the min value is within 80% of the max value.
| dbms | 256us | 1ms | 4ms | 16ms | 64ms | 256ms | 1s | 4s | 16s | gt | max |
|---|---|---|---|---|---|---|---|---|---|---|---|
| pg1710_o2nofp.cx10a_c8r32 | 99.971 | 0.028 | 0.001 | 0.004 | |||||||
| pg184_o2nofp.cx10b_c8r32 | 99.983 | 0.016 | 0.001 | 0.004 | |||||||
| pg19b1_o2nofp.cx10b_c8r32 | 99.982 | 0.017 | 0.001 | 0.003 |
Insert response time histogram: each cell has the percentage of responses that take <= the time in the header and max is the max response time in seconds. For max values in the top 25% of the range have a red background and in the bottom 25% of the range have a green background. The red background is not used when the min value is within 80% of the max value.
| dbms | 256us | 1ms | 4ms | 16ms | 64ms | 256ms | 1s | 4s | 16s | gt | max |
|---|---|---|---|---|---|---|---|---|---|---|---|
| pg1710_o2nofp.cx10a_c8r32 | 22.986 | 77.011 | 0.001 | 0.001 | 0.021 | ||||||
| pg184_o2nofp.cx10b_c8r32 | 25.942 | 74.050 | 0.004 | 0.004 | 0.022 | ||||||
| pg19b1_o2nofp.cx10b_c8r32 | 26.940 | 73.057 | 0.003 | 0.006 |
Delete response time histogram: each cell has the percentage of responses that take <= the time in the header and max is the max response time in seconds. For max values in the top 25% of the range have a red background and in the bottom 25% of the range have a green background. The red background is not used when the min value is within 80% of the max value.
| dbms | 256us | 1ms | 4ms | 16ms | 64ms | 256ms | 1s | 4s | 16s | gt | max |
|---|---|---|---|---|---|---|---|---|---|---|---|
| pg1710_o2nofp.cx10a_c8r32 | 9.786 | 74.171 | 16.042 | 0.001 | 0.020 | ||||||
| pg184_o2nofp.cx10b_c8r32 | 14.292 | 78.144 | 7.560 | 0.004 | 0.021 | ||||||
| pg19b1_o2nofp.cx10b_c8r32 | 25.892 | 56.282 | 17.826 | 0.009 |
Performance metrics for the DBMS listed above. Some are normalized by throughput, others are not. Legend for results is here.
ips	qps	rps	rmbps	wps	wmbps	rpq	rkbpq	wpi	wkbpi	csps	cpups	cspq	cpupq	dbgb1	dbgb2	rss	maxop	p50	p99	tag
999	8204	0	0.0	37.7	3.4	0.000	0.000	0.038	3.524	32126	13.1	3.916	128	8.1	28.1	6.7	0.004	8221	8047	pg1710_o2nofp.cx10a_c8r32
999	8225	0	0.0	40.6	3.5	0.000	0.000	0.041	3.564	32209	13.2	3.916	128	8.1	28.1	0.3	0.004	8237	8111	pg184_o2nofp.cx10b_c8r32
1000	8228	0	0.0	40.7	3.4	0.000	0.000	0.041	3.517	32218	13.1	3.916	127	8.0	28.1	0.4	0.003	8239	8111	pg19b1_o2nofp.cx10b_c8r32
Average values from iostat.
l.i0
l.i0: load without secondary indexes
Performance metrics for all DBMS, not just the ones listed above. Some are normalized by throughput, others are not. Legend for results is here.
ips	qps	rps	rmbps	wps	wmbps	rpq	rkbpq	wpi	wkbpi	csps	cpups	cspq	cpupq	dbgb1	dbgb2	rss	maxop	p50	p99	tag
139535	0	0	0.0	516.0	58.7	0.000	0.000	0.004	0.431	15094	19.5	0.108	11	2.9	7.8	0.4	0.003	139981	137582	pg1710_o2nofp.cx10a_c8r32
139535	0	0	0.0	523.2	59.3	0.000	0.000	0.004	0.435	15052	19.4	0.108	11	2.9	7.8	2.9	0.003	140481	137585	pg184_o2nofp.cx10b_c8r32
141509	0	0	0.0	528.4	59.8	0.000	0.000	0.004	0.433	15167	19.5	0.107	11	2.9	7.8	2.9	0.003	141985	138491	pg19b1_o2nofp.cx10b_c8r32
l.x
l.x: create secondary indexes
Performance metrics for all DBMS, not just the ones listed above. Some are normalized by throughput, others are not. Legend for results is here.
ips	qps	rps	rmbps	wps	wmbps	rpq	rkbpq	wpi	wkbpi	csps	cpups	cspq	cpupq	dbgb1	dbgb2	rss	maxop	p50	p99	tag
370372	0	0	0.0	754.5	92.6	0.000	0.000	0.002	0.256	1854	11.6	0.005	3	5.8	13.3	3.0	0.002	NA	NA	pg1710_o2nofp.cx10a_c8r32
379748	0	0	0.0	715.2	87.8	0.000	0.000	0.002	0.237	1702	12.1	0.004	3	5.8	13.3	3.0	0.002	NA	NA	pg184_o2nofp.cx10b_c8r32
428573	0	0	0.0	857.6	105.1	0.000	0.000	0.002	0.251	2162	12.1	0.005	2	5.8	13.3	3.0	0.002	NA	NA	pg19b1_o2nofp.cx10b_c8r32
l.i1
l.i1: continue load after secondary indexes created with 50 inserts per transaction
Performance metrics for all DBMS, not just the ones listed above. Some are normalized by throughput, others are not. Legend for results is here.
ips	qps	rps	rmbps	wps	wmbps	rpq	rkbpq	wpi	wkbpi	csps	cpups	cspq	cpupq	dbgb1	dbgb2	rss	maxop	p50	p99	tag
17346	0	0	0.0	213.1	23.4	0.000	0.000	0.012	1.382	7514	18.2	0.433	84	7.8	38.5	7.4	0.043	13648	9249	pg1710_o2nofp.cx10a_c8r32
17637	0	0	0.0	224.6	24.7	0.000	0.000	0.013	1.435	8044	19.0	0.456	86	7.8	38.5	3.0	0.037	13948	9599	pg184_o2nofp.cx10b_c8r32
21379	0	0	0.0	270.8	29.8	0.000	0.000	0.013	1.428	9473	19.7	0.443	74	7.8	38.3	3.3	0.036	17348	11148	pg19b1_o2nofp.cx10b_c8r32
l.i2
l.i2: continue load after secondary indexes created with 5 inserts per transaction
Performance metrics for all DBMS, not just the ones listed above. Some are normalized by throughput, others are not. Legend for results is here.
ips	qps	rps	rmbps	wps	wmbps	rpq	rkbpq	wpi	wkbpi	csps	cpups	cspq	cpupq	dbgb1	dbgb2	rss	maxop	p50	p99	tag
2198	0	0	0.0	52.6	5.0	0.000	0.000	0.024	2.327	8827	14.1	4.016	513	7.9	39.9	0.3	0.003	1630	1030	pg1710_o2nofp.cx10a_c8r32
2347	0	0	0.0	53.6	5.2	0.000	0.000	0.023	2.254	9531	14.4	4.061	491	7.9	39.7	1.2	0.022	1780	1080	pg184_o2nofp.cx10b_c8r32
2671	0	0	0.0	58.6	5.8	0.000	0.000	0.022	2.223	10936	14.8	4.095	443	7.9	40.2	0.2	0.027	1880	1280	pg19b1_o2nofp.cx10b_c8r32
qr100.L1
qr100.L1: range queries with 100 insert/s per client
Performance metrics for all DBMS, not just the ones listed above. Some are normalized by throughput, others are not. Legend for results is here.
ips	qps	rps	rmbps	wps	wmbps	rpq	rkbpq	wpi	wkbpi	csps	cpups	cspq	cpupq	dbgb1	dbgb2	rss	maxop	p50	p99	tag
100	14568	0	0.0	36.0	1.2	0.000	0.000	0.360	12.245	55733	12.4	3.826	68	7.9	39.2	0.2	0.003	14590	14298	pg1710_o2nofp.cx10a_c8r32
100	14410	0	0.0	35.9	1.2	0.000	0.000	0.360	12.227	55139	12.5	3.827	69	7.9	39.3	0.2	0.003	14412	14092	pg184_o2nofp.cx10b_c8r32
100	14400	0	0.0	36.2	1.2	0.000	0.000	0.363	12.238	55103	12.5	3.827	69	7.9	40.2	0.2	0.003	14396	14078	pg19b1_o2nofp.cx10b_c8r32
qp100.L2
qp100.L2: point queries with 100 insert/s per client
Performance metrics for all DBMS, not just the ones listed above. Some are normalized by throughput, others are not. Legend for results is here.
ips	qps	rps	rmbps	wps	wmbps	rpq	rkbpq	wpi	wkbpi	csps	cpups	cspq	cpupq	dbgb1	dbgb2	rss	maxop	p50	p99	tag
100	8313	0	0.0	60.1	1.5	0.000	0.000	0.602	15.420	32204	12.4	3.874	119	7.9	36.8	0.2	0.003	8332	8157	pg1710_o2nofp.cx10a_c8r32
100	8274	0	0.0	60.3	1.5	0.000	0.000	0.604	15.412	32052	12.4	3.874	120	7.9	37.0	0.2	0.004	8285	8175	pg184_o2nofp.cx10b_c8r32
100	8304	0	0.0	60.9	1.5	0.000	0.000	0.610	15.418	32163	12.4	3.873	119	7.9	37.8	0.2	0.003	8316	8207	pg19b1_o2nofp.cx10b_c8r32
qr500.L3
qr500.L3: range queries with 500 insert/s per client
Performance metrics for all DBMS, not just the ones listed above. Some are normalized by throughput, others are not. Legend for results is here.
ips	qps	rps	rmbps	wps	wmbps	rpq	rkbpq	wpi	wkbpi	csps	cpups	cspq	cpupq	dbgb1	dbgb2	rss	maxop	p50	p99	tag
500	13602	0	0.0	50.8	2.7	0.000	0.000	0.102	5.557	52206	12.8	3.838	75	8.0	33.4	0.4	0.004	13550	12687	pg1710_o2nofp.cx10a_c8r32
500	13576	0	0.0	52.1	2.7	0.000	0.000	0.104	5.527	52107	12.8	3.838	75	8.0	33.6	0.3	0.004	13484	12734	pg184_o2nofp.cx10b_c8r32
500	13487	0	0.0	54.3	2.6	0.000	0.000	0.109	5.412	51770	12.8	3.839	76	8.0	34.5	0.3	0.004	13358	12748	pg19b1_o2nofp.cx10b_c8r32
qp500.L4
qp500.L4: point queries with 500 insert/s per client
Performance metrics for all DBMS, not just the ones listed above. Some are normalized by throughput, others are not. Legend for results is here.
ips	qps	rps	rmbps	wps	wmbps	rpq	rkbpq	wpi	wkbpi	csps	cpups	cspq	cpupq	dbgb1	dbgb2	rss	maxop	p50	p99	tag
500	8274	0	0.0	43.7	2.9	0.000	0.000	0.088	5.912	32188	12.6	3.890	122	8.0	29.0	0.3	0.036	8287	8109	pg1710_o2nofp.cx10a_c8r32
500	8251	0	0.0	45.5	2.9	0.000	0.000	0.091	5.951	32096	12.7	3.890	123	8.0	29.2	1.1	0.004	8255	8143	pg184_o2nofp.cx10b_c8r32
500	8222	0	0.0	49.4	2.9	0.000	0.000	0.099	5.864	31991	12.5	3.891	122	8.0	30.1	0.2	0.016	8237	8111	pg19b1_o2nofp.cx10b_c8r32
qr1000.L5
qr1000.L5: range queries with 1000 insert/s per client
Performance metrics for all DBMS, not just the ones listed above. Some are normalized by throughput, others are not. Legend for results is here.
ips	qps	rps	rmbps	wps	wmbps	rpq	rkbpq	wpi	wkbpi	csps	cpups	cspq	cpupq	dbgb1	dbgb2	rss	maxop	p50	p99	tag
999	13601	0	0.0	45.4	3.5	0.000	0.000	0.045	3.543	52616	13.4	3.869	79	8.1	28.1	0.3	0.017	13646	12570	pg1710_o2nofp.cx10a_c8r32
999	13702	0	0.0	38.1	3.5	0.000	0.000	0.038	3.571	52790	13.3	3.853	78	8.0	28.1	0.6	0.004	13726	12702	pg184_o2nofp.cx10b_c8r32
999	13554	0	0.0	47.0	3.4	0.000	0.000	0.047	3.501	52240	13.4	3.854	79	8.0	28.1	0.4	0.004	13518	12635	pg19b1_o2nofp.cx10b_c8r32
qp1000.L6
qp1000.L6: point queries with 1000 insert/s per client
Performance metrics for all DBMS, not just the ones listed above. Some are normalized by throughput, others are not. Legend for results is here.
ips	qps	rps	rmbps	wps	wmbps	rpq	rkbpq	wpi	wkbpi	csps	cpups	cspq	cpupq	dbgb1	dbgb2	rss	maxop	p50	p99	tag
999	8204	0	0.0	37.7	3.4	0.000	0.000	0.038	3.524	32126	13.1	3.916	128	8.1	28.1	6.7	0.004	8221	8047	pg1710_o2nofp.cx10a_c8r32
999	8225	0	0.0	40.6	3.5	0.000	0.000	0.041	3.564	32209	13.2	3.916	128	8.1	28.1	0.3	0.004	8237	8111	pg184_o2nofp.cx10b_c8r32
1000	8228	0	0.0	40.7	3.4	0.000	0.000	0.041	3.517	32218	13.1	3.916	127	8.0	28.1	0.4	0.003	8239	8111	pg19b1_o2nofp.cx10b_c8r32
l.i0
- l.i0: load without secondary indexes
- Legend for results is here.
- Each entry lists the percentage of responses that fit in that bucket (slower than max time for previous bucket, faster than min time for next bucket).
Insert response time histogram
256us	1ms	4ms	16ms	64ms	256ms	1s	4s	16s	gt	max	tag
0.000	99.967	0.033	0.000	0.000	0.000	0.000	0.000	0.000	0.000	0.003	pg1710_o2nofp.cx10a_c8r32
0.000	99.969	0.031	0.000	0.000	0.000	0.000	0.000	0.000	0.000	0.003	pg184_o2nofp.cx10b_c8r32
0.000	99.975	0.025	0.000	0.000	0.000	0.000	0.000	0.000	0.000	0.003	pg19b1_o2nofp.cx10b_c8r32
l.x
- l.x: create secondary indexes
- Legend for results is here.
- Each entry lists the percentage of responses that fit in that bucket (slower than max time for previous bucket, faster than min time for next bucket).
TODO - determine whether there is data for create index response time
l.i1
- l.i1: continue load after secondary indexes created with 50 inserts per transaction
- Legend for results is here.
- Each entry lists the percentage of responses that fit in that bucket (slower than max time for previous bucket, faster than min time for next bucket).
Insert response time histogram
256us	1ms	4ms	16ms	64ms	256ms	1s	4s	16s	gt	max	tag
0.000	25.769	74.225	0.005	0.001	0.000	0.000	0.000	0.000	0.000	0.043	pg1710_o2nofp.cx10a_c8r32
0.000	24.371	75.623	0.005	0.001	0.000	0.000	0.000	0.000	0.000	0.037	pg184_o2nofp.cx10b_c8r32
0.000	38.359	61.637	0.003	0.001	0.000	0.000	0.000	0.000	0.000	0.036	pg19b1_o2nofp.cx10b_c8r32
Delete response time histogram
256us	1ms	4ms	16ms	64ms	256ms	1s	4s	16s	gt	max	tag
0.000	19.570	55.030	25.398	0.001	0.000	0.000	0.000	0.000	0.000	0.042	pg1710_o2nofp.cx10a_c8r32
0.000	19.826	57.110	23.062	0.001	0.000	0.000	0.000	0.000	0.000	0.037	pg184_o2nofp.cx10b_c8r32
0.000	24.097	71.153	4.749	0.001	0.000	0.000	0.000	0.000	0.000	0.036	pg19b1_o2nofp.cx10b_c8r32
l.i2
- l.i2: continue load after secondary indexes created with 5 inserts per transaction
- Legend for results is here.
- Each entry lists the percentage of responses that fit in that bucket (slower than max time for previous bucket, faster than min time for next bucket).
Insert response time histogram
256us	1ms	4ms	16ms	64ms	256ms	1s	4s	16s	gt	max	tag
55.974	43.988	0.038	0.000	0.000	0.000	0.000	0.000	0.000	0.000	0.003	pg1710_o2nofp.cx10a_c8r32
67.155	32.820	0.024	0.000	nonzero	0.000	0.000	0.000	0.000	0.000	0.022	pg184_o2nofp.cx10b_c8r32
75.789	24.196	0.015	nonzero	nonzero	0.000	0.000	0.000	0.000	0.000	0.027	pg19b1_o2nofp.cx10b_c8r32
Delete response time histogram
256us	1ms	4ms	16ms	64ms	256ms	1s	4s	16s	gt	max	tag
1.012	18.175	67.718	13.095	0.000	0.000	0.000	0.000	0.000	0.000	0.014	pg1710_o2nofp.cx10a_c8r32
0.743	24.510	69.203	5.545	nonzero	0.000	0.000	0.000	0.000	0.000	0.022	pg184_o2nofp.cx10b_c8r32
1.046	34.522	64.082	0.349	nonzero	0.000	0.000	0.000	0.000	0.000	0.027	pg19b1_o2nofp.cx10b_c8r32
qr100.L1
- qr100.L1: range queries with 100 insert/s per client
- Legend for results is here.
- Each entry lists the percentage of responses that fit in that bucket (slower than max time for previous bucket, faster than min time for next bucket).
Query response time histogram
256us	1ms	4ms	16ms	64ms	256ms	1s	4s	16s	gt	max	tag
99.988	0.012	nonzero	0.000	0.000	0.000	0.000	0.000	0.000	0.000	0.003	pg1710_o2nofp.cx10a_c8r32
99.994	0.006	nonzero	0.000	0.000	0.000	0.000	0.000	0.000	0.000	0.003	pg184_o2nofp.cx10b_c8r32
99.993	0.007	nonzero	0.000	0.000	0.000	0.000	0.000	0.000	0.000	0.003	pg19b1_o2nofp.cx10b_c8r32
Insert response time histogram
256us	1ms	4ms	16ms	64ms	256ms	1s	4s	16s	gt	max	tag
0.000	0.000	99.986	0.014	0.000	0.000	0.000	0.000	0.000	0.000	0.006	pg1710_o2nofp.cx10a_c8r32
0.000	0.000	99.986	0.014	0.000	0.000	0.000	0.000	0.000	0.000	0.006	pg184_o2nofp.cx10b_c8r32
0.000	0.000	99.986	0.014	0.000	0.000	0.000	0.000	0.000	0.000	0.006	pg19b1_o2nofp.cx10b_c8r32
Delete response time histogram
256us	1ms	4ms	16ms	64ms	256ms	1s	4s	16s	gt	max	tag
0.000	32.625	67.375	0.000	0.000	0.000	0.000	0.000	0.000	0.000	0.003	pg1710_o2nofp.cx10a_c8r32
0.000	32.250	67.750	0.000	0.000	0.000	0.000	0.000	0.000	0.000	0.003	pg184_o2nofp.cx10b_c8r32
0.000	35.181	64.819	0.000	0.000	0.000	0.000	0.000	0.000	0.000	0.003	pg19b1_o2nofp.cx10b_c8r32
qp100.L2
- qp100.L2: point queries with 100 insert/s per client
- Legend for results is here.
- Each entry lists the percentage of responses that fit in that bucket (slower than max time for previous bucket, faster than min time for next bucket).
Query response time histogram
256us	1ms	4ms	16ms	64ms	256ms	1s	4s	16s	gt	max	tag
99.978	0.022	nonzero	0.000	0.000	0.000	0.000	0.000	0.000	0.000	0.003	pg1710_o2nofp.cx10a_c8r32
99.985	0.015	nonzero	0.000	0.000	0.000	0.000	0.000	0.000	0.000	0.004	pg184_o2nofp.cx10b_c8r32
99.985	0.015	nonzero	0.000	0.000	0.000	0.000	0.000	0.000	0.000	0.003	pg19b1_o2nofp.cx10b_c8r32
Insert response time histogram
256us	1ms	4ms	16ms	64ms	256ms	1s	4s	16s	gt	max	tag
0.000	0.000	99.986	0.014	0.000	0.000	0.000	0.000	0.000	0.000	0.005	pg1710_o2nofp.cx10a_c8r32
0.000	0.000	99.986	0.014	0.000	0.000	0.000	0.000	0.000	0.000	0.006	pg184_o2nofp.cx10b_c8r32
0.000	0.000	99.986	0.014	0.000	0.000	0.000	0.000	0.000	0.000	0.006	pg19b1_o2nofp.cx10b_c8r32
Delete response time histogram
256us	1ms	4ms	16ms	64ms	256ms	1s	4s	16s	gt	max	tag
0.000	0.000	99.972	0.028	0.000	0.000	0.000	0.000	0.000	0.000	0.006	pg1710_o2nofp.cx10a_c8r32
0.000	0.000	99.972	0.028	0.000	0.000	0.000	0.000	0.000	0.000	0.006	pg184_o2nofp.cx10b_c8r32
0.000	0.000	99.986	0.014	0.000	0.000	0.000	0.000	0.000	0.000	0.006	pg19b1_o2nofp.cx10b_c8r32
qr500.L3
- qr500.L3: range queries with 500 insert/s per client
- Legend for results is here.
- Each entry lists the percentage of responses that fit in that bucket (slower than max time for previous bucket, faster than min time for next bucket).
Query response time histogram
256us	1ms	4ms	16ms	64ms	256ms	1s	4s	16s	gt	max	tag
99.985	0.014	0.001	nonzero	0.000	0.000	0.000	0.000	0.000	0.000	0.004	pg1710_o2nofp.cx10a_c8r32
99.991	0.009	nonzero	nonzero	0.000	0.000	0.000	0.000	0.000	0.000	0.004	pg184_o2nofp.cx10b_c8r32
99.991	0.009	nonzero	0.000	0.000	0.000	0.000	0.000	0.000	0.000	0.004	pg19b1_o2nofp.cx10b_c8r32
Insert response time histogram
256us	1ms	4ms	16ms	64ms	256ms	1s	4s	16s	gt	max	tag
0.000	11.944	88.044	0.011	0.000	0.000	0.000	0.000	0.000	0.000	0.005	pg1710_o2nofp.cx10a_c8r32
0.000	11.769	88.225	0.006	0.000	0.000	0.000	0.000	0.000	0.000	0.006	pg184_o2nofp.cx10b_c8r32
0.000	18.294	81.700	0.006	0.000	0.000	0.000	0.000	0.000	0.000	0.006	pg19b1_o2nofp.cx10b_c8r32
Delete response time histogram
256us	1ms	4ms	16ms	64ms	256ms	1s	4s	16s	gt	max	tag
0.000	10.019	73.617	16.364	0.000	0.000	0.000	0.000	0.000	0.000	0.008	pg1710_o2nofp.cx10a_c8r32
0.000	8.933	83.372	7.694	0.000	0.000	0.000	0.000	0.000	0.000	0.009	pg184_o2nofp.cx10b_c8r32
0.000	10.769	84.758	4.472	0.000	0.000	0.000	0.000	0.000	0.000	0.009	pg19b1_o2nofp.cx10b_c8r32
qp500.L4
- qp500.L4: point queries with 500 insert/s per client
- Legend for results is here.
- Each entry lists the percentage of responses that fit in that bucket (slower than max time for previous bucket, faster than min time for next bucket).
Query response time histogram
256us	1ms	4ms	16ms	64ms	256ms	1s	4s	16s	gt	max	tag
99.971	0.029	0.001	0.000	nonzero	0.000	0.000	0.000	0.000	0.000	0.036	pg1710_o2nofp.cx10a_c8r32
99.982	0.017	0.001	0.000	0.000	0.000	0.000	0.000	0.000	0.000	0.004	pg184_o2nofp.cx10b_c8r32
99.983	0.017	0.001	nonzero	0.000	0.000	0.000	0.000	0.000	0.000	0.016	pg19b1_o2nofp.cx10b_c8r32
Insert response time histogram
256us	1ms	4ms	16ms	64ms	256ms	1s	4s	16s	gt	max	tag
0.000	6.217	93.778	0.006	0.000	0.000	0.000	0.000	0.000	0.000	0.005	pg1710_o2nofp.cx10a_c8r32
0.000	7.672	92.308	0.017	0.003	0.000	0.000	0.000	0.000	0.000	0.024	pg184_o2nofp.cx10b_c8r32
0.000	11.744	88.231	0.019	0.006	0.000	0.000	0.000	0.000	0.000	0.020	pg19b1_o2nofp.cx10b_c8r32
Delete response time histogram
256us	1ms	4ms	16ms	64ms	256ms	1s	4s	16s	gt	max	tag
0.000	8.836	68.669	22.494	0.000	0.000	0.000	0.000	0.000	0.000	0.011	pg1710_o2nofp.cx10a_c8r32
0.000	12.447	72.236	15.314	0.003	0.000	0.000	0.000	0.000	0.000	0.023	pg184_o2nofp.cx10b_c8r32
0.000	32.744	62.528	4.722	0.006	0.000	0.000	0.000	0.000	0.000	0.019	pg19b1_o2nofp.cx10b_c8r32
qr1000.L5
- qr1000.L5: range queries with 1000 insert/s per client
- Legend for results is here.
- Each entry lists the percentage of responses that fit in that bucket (slower than max time for previous bucket, faster than min time for next bucket).
Query response time histogram
256us	1ms	4ms	16ms	64ms	256ms	1s	4s	16s	gt	max	tag
99.984	0.014	0.002	nonzero	nonzero	0.000	0.000	0.000	0.000	0.000	0.017	pg1710_o2nofp.cx10a_c8r32
99.991	0.008	0.001	0.000	0.000	0.000	0.000	0.000	0.000	0.000	0.004	pg184_o2nofp.cx10b_c8r32
99.990	0.009	0.001	nonzero	0.000	0.000	0.000	0.000	0.000	0.000	0.004	pg19b1_o2nofp.cx10b_c8r32
Insert response time histogram
256us	1ms	4ms	16ms	64ms	256ms	1s	4s	16s	gt	max	tag
0.000	28.967	71.026	0.006	0.001	0.000	0.000	0.000	0.000	0.000	0.022	pg1710_o2nofp.cx10a_c8r32
0.000	32.139	67.858	0.003	0.000	0.000	0.000	0.000	0.000	0.000	0.006	pg184_o2nofp.cx10b_c8r32
0.000	33.217	66.782	0.001	0.000	0.000	0.000	0.000	0.000	0.000	0.006	pg19b1_o2nofp.cx10b_c8r32
Delete response time histogram
256us	1ms	4ms	16ms	64ms	256ms	1s	4s	16s	gt	max	tag
0.000	14.001	65.997	20.000	0.001	0.000	0.000	0.000	0.000	0.000	0.021	pg1710_o2nofp.cx10a_c8r32
0.000	11.671	82.060	6.269	0.000	0.000	0.000	0.000	0.000	0.000	0.005	pg184_o2nofp.cx10b_c8r32
0.000	23.044	67.601	9.354	0.000	0.000	0.000	0.000	0.000	0.000	0.008	pg19b1_o2nofp.cx10b_c8r32
qp1000.L6
- qp1000.L6: point queries with 1000 insert/s per client
- Legend for results is here.
- Each entry lists the percentage of responses that fit in that bucket (slower than max time for previous bucket, faster than min time for next bucket).
Query response time histogram
256us	1ms	4ms	16ms	64ms	256ms	1s	4s	16s	gt	max	tag
99.971	0.028	0.001	0.000	0.000	0.000	0.000	0.000	0.000	0.000	0.004	pg1710_o2nofp.cx10a_c8r32
99.983	0.016	0.001	0.000	0.000	0.000	0.000	0.000	0.000	0.000	0.004	pg184_o2nofp.cx10b_c8r32
99.982	0.017	0.001	0.000	0.000	0.000	0.000	0.000	0.000	0.000	0.003	pg19b1_o2nofp.cx10b_c8r32
Insert response time histogram
256us	1ms	4ms	16ms	64ms	256ms	1s	4s	16s	gt	max	tag
0.000	22.986	77.011	0.001	0.001	0.000	0.000	0.000	0.000	0.000	0.021	pg1710_o2nofp.cx10a_c8r32
0.000	25.942	74.050	0.004	0.004	0.000	0.000	0.000	0.000	0.000	0.022	pg184_o2nofp.cx10b_c8r32
0.000	26.940	73.057	0.003	0.000	0.000	0.000	0.000	0.000	0.000	0.006	pg19b1_o2nofp.cx10b_c8r32
Delete response time histogram
256us	1ms	4ms	16ms	64ms	256ms	1s	4s	16s	gt	max	tag
0.000	9.786	74.171	16.042	0.001	0.000	0.000	0.000	0.000	0.000	0.020	pg1710_o2nofp.cx10a_c8r32
0.000	14.292	78.144	7.560	0.004	0.000	0.000	0.000	0.000	0.000	0.021	pg184_o2nofp.cx10b_c8r32
0.000	25.892	56.282	17.826	0.000	0.000	0.000	0.000	0.000	0.000	0.009	pg19b1_o2nofp.cx10b_c8r32