Introduction
This is a report for the insert benchmark with 80M docs and 8 client(s). It is generated by scripts (bash, awk, sed) and Tufte might not be impressed. An overview of the insert benchmark is here and a short update is here. Below, by DBMS, I mean DBMS+version.config. An example is my8020.c10b40 where my means MySQL, 8020 is version 8.0.20 and c10b40 is the name for the configuration file.
The test server has 24 cores, 2 sockets, 64G RAM and 1 NVMe devices. The benchmark was run with 8 clients and there were 1 or 3 connections per client (1 for queries or inserts without rate limits, 1+1 for rate limited inserts+deletes). It uses 8 tables with a table per client. It loads 10M rows per table without secondary indexes, creates 3 secondary indexes per table, then inserts 16m+4m rows per table with a delete per insert to avoid growing the table. It then does 6 read+write tests for 1800s each that do queries as fast as possible with 100,100,500,500,1000,1000 inserts/s and the same for deletes/s per client concurrent with the queries. The database is cached by InnoDB. Clients and the DBMS share one server.
The tested DBMS are:
- my8407_rel_o2nofp.cz12a_c24r64 - MySQL 8.4.7 with the cz12a_c24r64 config
- my8407_rel_o2nofp.cz12a_nocb_c24r64 - MySQL 8.4.7 with the cz12a_nocb_c24r64 config that disables the InnoDb change buffer
- pg181_o2nofp.cx10b_c24r64 - Postgres 18.1 with the cx10b_24r64 config
Contents
- Summary
- l.i0: load without secondary indexes
- l.x: create secondary indexes
- l.i1: continue load after secondary indexes created with 50 inserts per transaction
- l.i2: continue load after secondary indexes created with 5 inserts per transaction
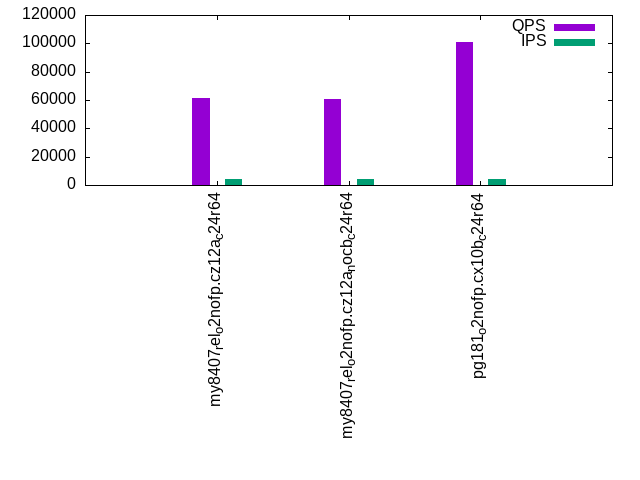
- qr100.L1: range queries with 100 insert/s per client
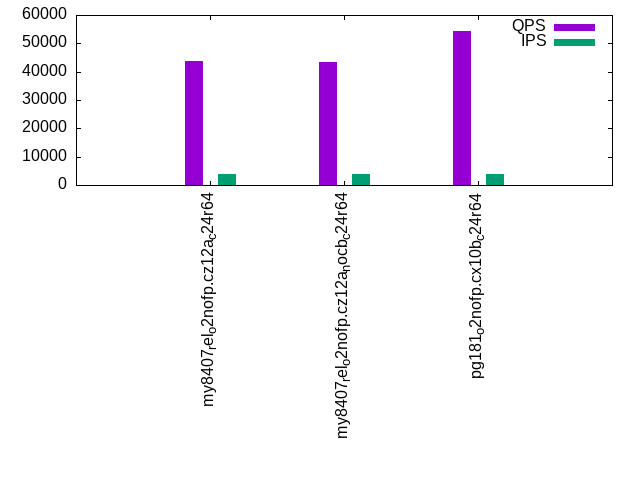
- qp100.L2: point queries with 100 insert/s per client
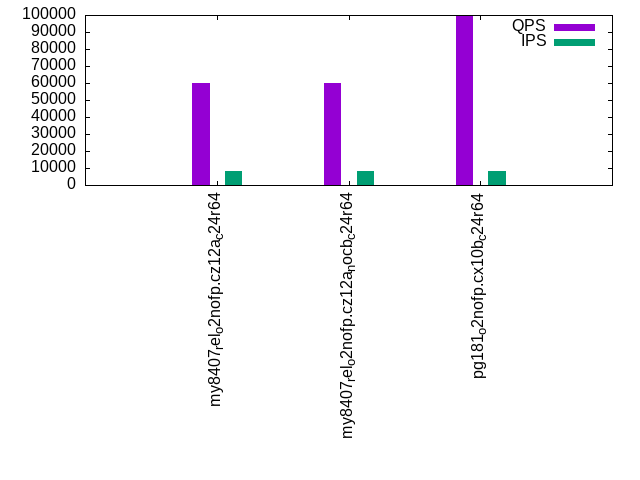
- qr500.L3: range queries with 500 insert/s per client
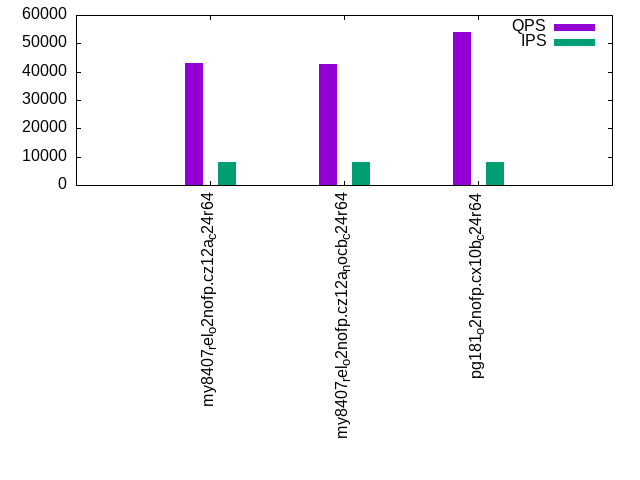
- qp500.L4: point queries with 500 insert/s per client
- qr1000.L5: range queries with 1000 insert/s per client
- qp1000.L6: point queries with 1000 insert/s per client
Summary
The numbers are inserts/s for l.i0, l.i1 and l.i2, indexed docs (or rows) /s for l.x and queries/s for qr100, qp100 thru qr1000, qp1000" The values are the average rate over the entire test for inserts (IPS) and queries (QPS). The range of values for IPS and QPS is split into 3 parts: bottom 25%, middle 50%, top 25%. Values in the bottom 25% have a red background, values in the top 25% have a green background and values in the middle have no color. A gray background is used for values that can be ignored because the DBMS did not sustain the target insert rate. Red backgrounds are not used when the minimum value is within 80% of the max value.
| dbms | l.i0 | l.x | l.i1 | l.i2 | qr100 | qp100 | qr500 | qp500 | qr1000 | qp1000 |
|---|---|---|---|---|---|---|---|---|---|---|
| my8407_rel_o2nofp.cz12a_c24r64 | 467836 | 1025642 | 119738 | 53782 | 61985 | 44306 | 61535 | 43764 | 60208 | 43030 |
| my8407_rel_o2nofp.cz12a_nocb_c24r64 | 465116 | 1052633 | 120869 | 53333 | 61709 | 44157 | 61056 | 43568 | 59769 | 42827 |
| pg181_o2nofp.cx10b_c24r64 | 655738 | 1403510 | 162643 | 26468 | 103714 | 55134 | 100668 | 54378 | 99674 | 53849 |
This table has relative throughput, throughput for the DBMS relative to the DBMS in the first line, using the absolute throughput from the previous table. Values less than 0.95 have a yellow background. Values greater than 1.05 have a blue background.
| dbms | l.i0 | l.x | l.i1 | l.i2 | qr100 | qp100 | qr500 | qp500 | qr1000 | qp1000 |
|---|---|---|---|---|---|---|---|---|---|---|
| my8407_rel_o2nofp.cz12a_c24r64 | 1.00 | 1.00 | 1.00 | 1.00 | 1.00 | 1.00 | 1.00 | 1.00 | 1.00 | 1.00 |
| my8407_rel_o2nofp.cz12a_nocb_c24r64 | 0.99 | 1.03 | 1.01 | 0.99 | 1.00 | 1.00 | 0.99 | 1.00 | 0.99 | 1.00 |
| pg181_o2nofp.cx10b_c24r64 | 1.40 | 1.37 | 1.36 | 0.49 | 1.67 | 1.24 | 1.64 | 1.24 | 1.66 | 1.25 |
This lists the average rate of inserts/s for the tests that do inserts concurrent with queries. For such tests the query rate is listed in the table above. The read+write tests are setup so that the insert rate should match the target rate every second. Cells that are not at least 95% of the target have a red background to indicate a failure to satisfy the target.
| dbms | qr100.L1 | qp100.L2 | qr500.L3 | qp500.L4 | qr1000.L5 | qp1000.L6 |
|---|---|---|---|---|---|---|
| my8407_rel_o2nofp.cz12a_c24r64 | 796 | 797 | 3982 | 3982 | 7969 | 7965 |
| my8407_rel_o2nofp.cz12a_nocb_c24r64 | 797 | 796 | 3984 | 3984 | 7965 | 7969 |
| pg181_o2nofp.cx10b_c24r64 | 796 | 797 | 3984 | 3982 | 7965 | 7969 |
| target | 800 | 800 | 4000 | 4000 | 8000 | 8000 |
l.i0
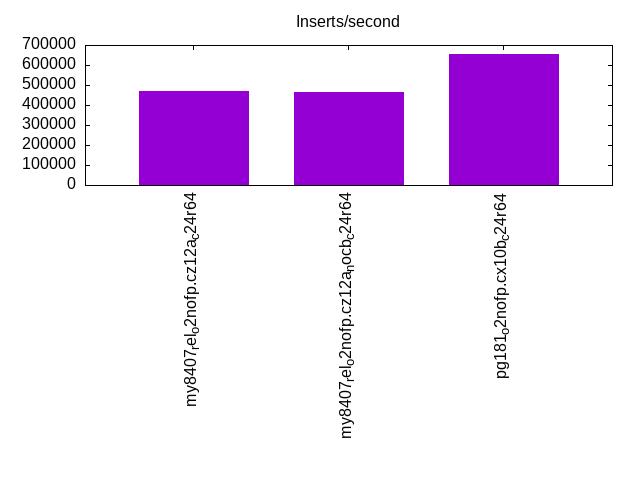
l.i0: load without secondary indexes. Graphs for performance per 1-second interval are here.
Average throughput:
Insert response time histogram: each cell has the percentage of responses that take <= the time in the header and max is the max response time in seconds. For the max column values in the top 25% of the range have a red background and in the bottom 25% of the range have a green background. The red background is not used when the min value is within 80% of the max value.
| dbms | 256us | 1ms | 4ms | 16ms | 64ms | 256ms | 1s | 4s | 16s | gt | max |
|---|---|---|---|---|---|---|---|---|---|---|---|
| my8407_rel_o2nofp.cz12a_c24r64 | 99.786 | 0.187 | 0.013 | 0.014 | 0.243 | ||||||
| my8407_rel_o2nofp.cz12a_nocb_c24r64 | 99.801 | 0.168 | 0.017 | 0.014 | 0.250 | ||||||
| pg181_o2nofp.cx10b_c24r64 | 30.006 | 69.944 | 0.022 | 0.020 | 0.009 | 0.165 |
Performance metrics for the DBMS listed above. Some are normalized by throughput, others are not. Legend for results is here.
ips	qps	rps	rmbps	wps	wmbps	rpq	rkbpq	wpi	wkbpi	csps	cpups	cspq	cpupq	dbgb1	dbgb2	rss	maxop	p50	p99	tag
467836	0	0	0.0	1769.4	136.3	0.000	0.000	0.004	0.298	89008	44.8	0.190	23	5.3	59.6	8.6	0.243	63892	49891	my8407_rel_o2nofp.cz12a_c24r64
465116	0	0	0.0	1777.5	136.6	0.000	0.000	0.004	0.301	89361	44.7	0.192	23	5.3	59.6	8.7	0.250	65791	50594	my8407_rel_o2nofp.cz12a_nocb_c24r64
655738	0	0	0.0	2436.5	283.3	0.000	0.000	0.004	0.442	63331	45.8	0.097	17	7.7	20.7	0.2	0.165	95588	64192	pg181_o2nofp.cx10b_c24r64
Average values from iostat.
r/s	rkB/s	rrqm/s	%rrqm	r_await	rareq-s	w/s	wkB/s	wrqm/s	%wrqm	w_await	wareq-s	d/s	dkB/s	drqm/s	%drqm	d_await	dareq-s	f/s	f_await	aqu-sz	%util
0.400	1.671	0.000	0.000	2.902	4.000	1769.4	139607	76.71	5.918	8.452	85.70	0.471	7.129	0.000	0.000	0.160	5.343	0.000	0.000	15.54	9.024		my8407_rel_o2nofp.cz12a_c24r64
0.429	2.000	0.000	0.000	3.704	4.618	1777.5	139905	75.96	5.866	8.604	85.57	0.406	4.259	0.000	0.000	0.133	4.795	0.000	0.000	15.92	9.062		my8407_rel_o2nofp.cz12a_nocb_c24r64
0.025	0.100	0.000	0.000	0.750	0.500	2436.5	290141	158.7	6.821	4.156	119.2	0.425	9.233	0.000	0.000	0.145	10.37	0.000	0.000	15.49	16.51		pg181_o2nofp.cx10b_c24r64
l.x
l.x: create secondary indexes.
Average throughput:

Performance metrics for the DBMS listed above. Some are normalized by throughput, others are not. Legend for results is here.
ips	qps	rps	rmbps	wps	wmbps	rpq	rkbpq	wpi	wkbpi	csps	cpups	cspq	cpupq	dbgb1	dbgb2	rss	maxop	p50	p99	tag
1025642	0	24	0.8	31439.9	1216.4	0.000	0.001	0.031	1.214	69039	64.5	0.067	15	12.1	66.5	11.8	0.005	NA	NA	my8407_rel_o2nofp.cz12a_c24r64
1052633	0	29	0.8	32694.6	1236.3	0.000	0.001	0.031	1.203	69654	63.7	0.066	15	12.1	66.5	12.0	0.002	NA	NA	my8407_rel_o2nofp.cz12a_nocb_c24r64
1403510	0	0	0.0	3758.5	426.6	0.000	0.000	0.003	0.311	3709	23.8	0.003	4	15.4	35.4	6.7	0.003	NA	NA	pg181_o2nofp.cx10b_c24r64
Average values from iostat.
r/s	rkB/s	rrqm/s	%rrqm	r_await	rareq-s	w/s	wkB/s	wrqm/s	%wrqm	w_await	wareq-s	d/s	dkB/s	drqm/s	%drqm	d_await	dareq-s	f/s	f_await	aqu-sz	%util
23.92	804.2	0.000	0.000	0.313	31.82	31439.9	1245636	240.2	1.175	6.367	51.43	45.85	172629	0.027	0.031	1.053	2866.5	0.000	0.000	148.1	86.66		my8407_rel_o2nofp.cz12a_c24r64
28.77	849.5	0.000	0.000	0.293	30.55	32694.6	1265944	261.3	1.217	5.901	50.24	45.91	172746	0.000	0.000	0.869	3132.5	0.000	0.000	141.9	87.30		my8407_rel_o2nofp.cz12a_nocb_c24r64
0.036	0.145	0.000	0.000	0.500	0.364	3758.5	436871	131.9	13.85	6.635	99.84	3.327	33289.5	0.000	0.000	0.300	7377.9	0.000	0.000	40.33	28.73		pg181_o2nofp.cx10b_c24r64
l.i1
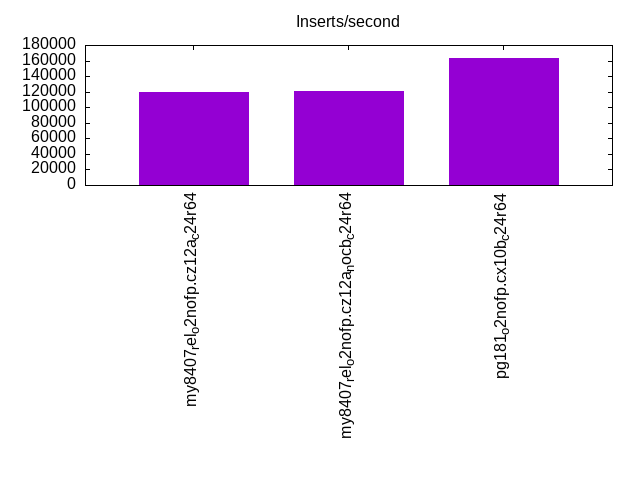
l.i1: continue load after secondary indexes created with 50 inserts per transaction. Graphs for performance per 1-second interval are here.
Average throughput:
Insert response time histogram: each cell has the percentage of responses that take <= the time in the header and max is the max response time in seconds. For the max column values in the top 25% of the range have a red background and in the bottom 25% of the range have a green background. The red background is not used when the min value is within 80% of the max value.
| dbms | 256us | 1ms | 4ms | 16ms | 64ms | 256ms | 1s | 4s | 16s | gt | max |
|---|---|---|---|---|---|---|---|---|---|---|---|
| my8407_rel_o2nofp.cz12a_c24r64 | 94.673 | 4.662 | 0.642 | 0.018 | 0.006 | 0.433 | |||||
| my8407_rel_o2nofp.cz12a_nocb_c24r64 | 94.859 | 4.493 | 0.625 | 0.020 | 0.003 | 0.367 | |||||
| pg181_o2nofp.cx10b_c24r64 | 99.704 | 0.185 | 0.110 | 0.001 | 0.089 |
Delete response time histogram: each cell has the percentage of responses that take <= the time in the header and max is the max response time in seconds. For the max column values in the top 25% of the range have a red background and in the bottom 25% of the range have a green background. The red background is not used when the min value is within 80% of the max value.
| dbms | 256us | 1ms | 4ms | 16ms | 64ms | 256ms | 1s | 4s | 16s | gt | max |
|---|---|---|---|---|---|---|---|---|---|---|---|
| my8407_rel_o2nofp.cz12a_c24r64 | 97.219 | 2.354 | 0.407 | 0.015 | 0.005 | 0.439 | |||||
| my8407_rel_o2nofp.cz12a_nocb_c24r64 | 97.171 | 2.406 | 0.405 | 0.016 | 0.003 | 0.366 | |||||
| pg181_o2nofp.cx10b_c24r64 | 13.214 | 83.440 | 3.226 | 0.119 | 0.001 | 0.090 |
Performance metrics for the DBMS listed above. Some are normalized by throughput, others are not. Legend for results is here.
ips	qps	rps	rmbps	wps	wmbps	rpq	rkbpq	wpi	wkbpi	csps	cpups	cspq	cpupq	dbgb1	dbgb2	rss	maxop	p50	p99	tag
119738	0	362	5.7	6735.1	274.4	0.003	0.048	0.056	2.347	104437	81.5	0.872	163	19.9	87.7	24.3	0.433	15598	5949	my8407_rel_o2nofp.cz12a_c24r64
120869	0	364	5.7	6657.8	271.0	0.003	0.048	0.055	2.296	103661	81.7	0.858	162	20.0	88.0	24.5	0.367	15748	5549	my8407_rel_o2nofp.cz12a_nocb_c24r64
162643	0	0	0.0	1974.2	230.1	0.000	0.000	0.012	1.449	74951	60.3	0.461	89	21.6	85.7	10.9	0.089	16898	4949	pg181_o2nofp.cx10b_c24r64
Average values from iostat.
r/s	rkB/s	rrqm/s	%rrqm	r_await	rareq-s	w/s	wkB/s	wrqm/s	%wrqm	w_await	wareq-s	d/s	dkB/s	drqm/s	%drqm	d_await	dareq-s	f/s	f_await	aqu-sz	%util
362.4	5796.5	0.000	0.000	1.205	10.28	6735.1	281023	49.58	0.714	7.722	42.58	0.216	14.05	0.000	0.000	0.087	13.00	0.000	0.000	50.84	20.31		my8407_rel_o2nofp.cz12a_c24r64
364.1	5823.9	0.000	0.000	0.826	10.17	6657.8	277540	49.95	0.728	7.797	42.54	0.160	5.487	0.000	0.000	0.068	7.947	0.000	0.000	50.73	20.62		my8407_rel_o2nofp.cz12a_nocb_c24r64
0.009	0.036	0.000	0.000	0.038	0.178	1974.2	235658	101.8	4.157	1.768	119.0	0.079	103.3	0.000	0.000	0.030	146.6	0.000	0.000	3.961	12.07		pg181_o2nofp.cx10b_c24r64
l.i2
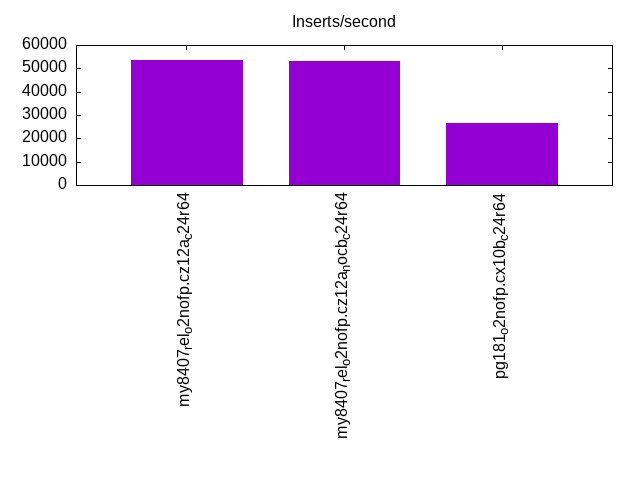
l.i2: continue load after secondary indexes created with 5 inserts per transaction. Graphs for performance per 1-second interval are here.
Average throughput:
Insert response time histogram: each cell has the percentage of responses that take <= the time in the header and max is the max response time in seconds. For the max column values in the top 25% of the range have a red background and in the bottom 25% of the range have a green background. The red background is not used when the min value is within 80% of the max value.
| dbms | 256us | 1ms | 4ms | 16ms | 64ms | 256ms | 1s | 4s | 16s | gt | max |
|---|---|---|---|---|---|---|---|---|---|---|---|
| my8407_rel_o2nofp.cz12a_c24r64 | 93.696 | 6.041 | 0.192 | 0.068 | 0.002 | 0.001 | 0.321 | ||||
| my8407_rel_o2nofp.cz12a_nocb_c24r64 | 93.342 | 6.258 | 0.331 | 0.066 | 0.002 | 0.001 | 0.333 | ||||
| pg181_o2nofp.cx10b_c24r64 | 26.150 | 73.850 | nonzero | 0.002 |
Delete response time histogram: each cell has the percentage of responses that take <= the time in the header and max is the max response time in seconds. For the max column values in the top 25% of the range have a red background and in the bottom 25% of the range have a green background. The red background is not used when the min value is within 80% of the max value.
| dbms | 256us | 1ms | 4ms | 16ms | 64ms | 256ms | 1s | 4s | 16s | gt | max |
|---|---|---|---|---|---|---|---|---|---|---|---|
| my8407_rel_o2nofp.cz12a_c24r64 | nonzero | 94.859 | 4.927 | 0.155 | 0.056 | 0.002 | 0.001 | 0.320 | |||
| my8407_rel_o2nofp.cz12a_nocb_c24r64 | nonzero | 94.386 | 5.274 | 0.284 | 0.053 | 0.002 | nonzero | 0.332 | |||
| pg181_o2nofp.cx10b_c24r64 | 0.005 | 34.018 | 65.558 | 0.420 | 0.012 |
Performance metrics for the DBMS listed above. Some are normalized by throughput, others are not. Legend for results is here.
ips	qps	rps	rmbps	wps	wmbps	rpq	rkbpq	wpi	wkbpi	csps	cpups	cspq	cpupq	dbgb1	dbgb2	rss	maxop	p50	p99	tag
53782	0	0	0.0	5064.6	199.9	0.000	0.000	0.094	3.806	295766	71.8	5.499	320	19.9	93.9	24.5	0.321	7204	1300	my8407_rel_o2nofp.cz12a_c24r64
53333	0	0	0.0	5058.4	199.5	0.000	0.000	0.095	3.830	292391	71.7	5.482	323	20.0	94.1	24.7	0.333	7299	1185	my8407_rel_o2nofp.cz12a_nocb_c24r64
26468	0	0	0.0	218.0	26.1	0.000	0.000	0.008	1.011	113515	42.2	4.289	383	21.8	85.9	15.3	0.002	2360	1200	pg181_o2nofp.cx10b_c24r64
Average values from iostat.
r/s	rkB/s	rrqm/s	%rrqm	r_await	rareq-s	w/s	wkB/s	wrqm/s	%wrqm	w_await	wareq-s	d/s	dkB/s	drqm/s	%drqm	d_await	dareq-s	f/s	f_await	aqu-sz	%util
0.121	0.484	0.000	0.000	1.858	1.445	5064.6	204716	3.333	0.065	7.845	40.40	0.163	6.205	0.000	0.000	0.058	6.769	0.000	0.000	39.87	14.13		my8407_rel_o2nofp.cz12a_c24r64
0.087	0.347	0.000	0.000	4.840	1.333	5058.4	204253	3.295	0.065	7.953	40.38	0.167	2.540	0.000	0.000	0.061	2.252	0.000	0.000	40.39	14.18		my8407_rel_o2nofp.cz12a_nocb_c24r64
0.000	0.000	0.000	0.000	0.000	0.000	218.0	26764.0	4.547	2.223	0.139	122.8	0.002	0.010	0.000	0.000	0.004	0.050	0.000	0.000	0.031	1.118		pg181_o2nofp.cx10b_c24r64
qr100.L1
qr100.L1: range queries with 100 insert/s per client. Graphs for performance per 1-second interval are here.
Average throughput:

Query response time histogram: each cell has the percentage of responses that take <= the time in the header and max is the max response time in seconds. For max values in the top 25% of the range have a red background and in the bottom 25% of the range have a green background. The red background is not used when the min value is within 80% of the max value.
| dbms | 256us | 1ms | 4ms | 16ms | 64ms | 256ms | 1s | 4s | 16s | gt | max |
|---|---|---|---|---|---|---|---|---|---|---|---|
| my8407_rel_o2nofp.cz12a_c24r64 | 99.974 | 0.026 | nonzero | 0.004 | |||||||
| my8407_rel_o2nofp.cz12a_nocb_c24r64 | 99.976 | 0.024 | nonzero | 0.004 | |||||||
| pg181_o2nofp.cx10b_c24r64 | 99.998 | 0.002 | nonzero | 0.002 |
Insert response time histogram: each cell has the percentage of responses that take <= the time in the header and max is the max response time in seconds. For max values in the top 25% of the range have a red background and in the bottom 25% of the range have a green background. The red background is not used when the min value is within 80% of the max value.
| dbms | 256us | 1ms | 4ms | 16ms | 64ms | 256ms | 1s | 4s | 16s | gt | max |
|---|---|---|---|---|---|---|---|---|---|---|---|
| my8407_rel_o2nofp.cz12a_c24r64 | 99.840 | 0.160 | 0.005 | ||||||||
| my8407_rel_o2nofp.cz12a_nocb_c24r64 | 99.757 | 0.243 | 0.007 | ||||||||
| pg181_o2nofp.cx10b_c24r64 | 99.795 | 0.205 | 0.009 |
Delete response time histogram: each cell has the percentage of responses that take <= the time in the header and max is the max response time in seconds. For max values in the top 25% of the range have a red background and in the bottom 25% of the range have a green background. The red background is not used when the min value is within 80% of the max value.
| dbms | 256us | 1ms | 4ms | 16ms | 64ms | 256ms | 1s | 4s | 16s | gt | max |
|---|---|---|---|---|---|---|---|---|---|---|---|
| my8407_rel_o2nofp.cz12a_c24r64 | 99.931 | 0.069 | 0.007 | ||||||||
| my8407_rel_o2nofp.cz12a_nocb_c24r64 | 99.885 | 0.115 | 0.006 | ||||||||
| pg181_o2nofp.cx10b_c24r64 | 25.583 | 74.417 | 0.003 |
Performance metrics for the DBMS listed above. Some are normalized by throughput, others are not. Legend for results is here.
ips	qps	rps	rmbps	wps	wmbps	rpq	rkbpq	wpi	wkbpi	csps	cpups	cspq	cpupq	dbgb1	dbgb2	rss	maxop	p50	p99	tag
796	61985	0	0.0	1009.1	28.6	0.000	0.000	1.267	36.767	357719	33.7	5.771	130	19.9	94.0	24.5	0.004	7807	7423	my8407_rel_o2nofp.cz12a_c24r64
797	61709	0	0.0	1041.5	29.5	0.000	0.000	1.307	37.920	356131	33.8	5.771	131	20.0	94.2	24.7	0.004	7775	7327	my8407_rel_o2nofp.cz12a_nocb_c24r64
796	103714	0	0.0	36.3	3.7	0.000	0.000	0.046	4.718	396398	33.3	3.822	77	21.8	85.8	0.4	0.002	13038	12413	pg181_o2nofp.cx10b_c24r64
Average values from iostat.
r/s	rkB/s	rrqm/s	%rrqm	r_await	rareq-s	w/s	wkB/s	wrqm/s	%wrqm	w_await	wareq-s	d/s	dkB/s	drqm/s	%drqm	d_await	dareq-s	f/s	f_await	aqu-sz	%util
0.001	0.004	0.000	0.000	0.003	0.022	1009.1	29281.2	1.133	0.425	2.602	30.71	0.011	0.042	0.000	0.000	0.017	0.188	0.000	0.000	5.642	2.822		my8407_rel_o2nofp.cz12a_c24r64
0.001	0.004	0.000	0.000	0.000	0.022	1041.5	30218.8	1.393	0.431	2.860	30.25	0.008	0.058	0.000	0.000	0.012	0.259	0.000	0.000	5.754	22.23		my8407_rel_o2nofp.cz12a_nocb_c24r64
0.000	0.000	0.000	0.000	0.000	0.000	36.32	3757.7	0.800	2.851	0.172	102.0	0.001	0.002	0.000	0.000	0.000	0.011	0.000	0.000	0.006	0.235		pg181_o2nofp.cx10b_c24r64
qp100.L2
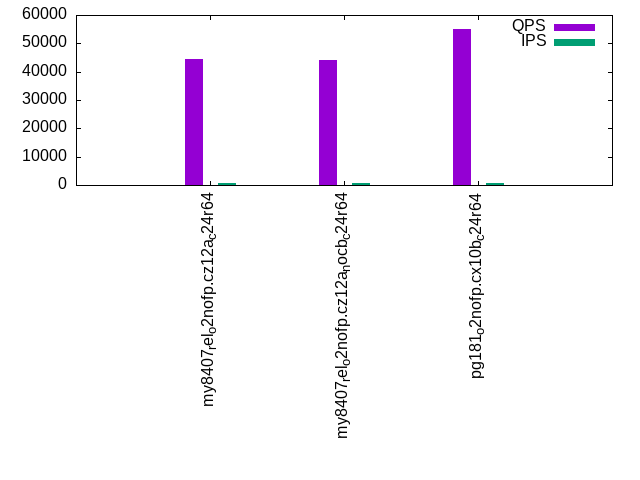
qp100.L2: point queries with 100 insert/s per client. Graphs for performance per 1-second interval are here.
Average throughput:
Query response time histogram: each cell has the percentage of responses that take <= the time in the header and max is the max response time in seconds. For max values in the top 25% of the range have a red background and in the bottom 25% of the range have a green background. The red background is not used when the min value is within 80% of the max value.
| dbms | 256us | 1ms | 4ms | 16ms | 64ms | 256ms | 1s | 4s | 16s | gt | max |
|---|---|---|---|---|---|---|---|---|---|---|---|
| my8407_rel_o2nofp.cz12a_c24r64 | 99.855 | 0.145 | nonzero | nonzero | 0.004 | ||||||
| my8407_rel_o2nofp.cz12a_nocb_c24r64 | 99.831 | 0.169 | nonzero | 0.004 | |||||||
| pg181_o2nofp.cx10b_c24r64 | 99.981 | 0.019 | nonzero | 0.001 |
Insert response time histogram: each cell has the percentage of responses that take <= the time in the header and max is the max response time in seconds. For max values in the top 25% of the range have a red background and in the bottom 25% of the range have a green background. The red background is not used when the min value is within 80% of the max value.
| dbms | 256us | 1ms | 4ms | 16ms | 64ms | 256ms | 1s | 4s | 16s | gt | max |
|---|---|---|---|---|---|---|---|---|---|---|---|
| my8407_rel_o2nofp.cz12a_c24r64 | 99.906 | 0.094 | 0.006 | ||||||||
| my8407_rel_o2nofp.cz12a_nocb_c24r64 | 99.851 | 0.149 | 0.006 | ||||||||
| pg181_o2nofp.cx10b_c24r64 | 99.840 | 0.160 | 0.009 |
Delete response time histogram: each cell has the percentage of responses that take <= the time in the header and max is the max response time in seconds. For max values in the top 25% of the range have a red background and in the bottom 25% of the range have a green background. The red background is not used when the min value is within 80% of the max value.
| dbms | 256us | 1ms | 4ms | 16ms | 64ms | 256ms | 1s | 4s | 16s | gt | max |
|---|---|---|---|---|---|---|---|---|---|---|---|
| my8407_rel_o2nofp.cz12a_c24r64 | 99.997 | 0.003 | 0.004 | ||||||||
| my8407_rel_o2nofp.cz12a_nocb_c24r64 | 99.976 | 0.024 | 0.005 | ||||||||
| pg181_o2nofp.cx10b_c24r64 | 99.924 | 0.076 | 0.008 |
Performance metrics for the DBMS listed above. Some are normalized by throughput, others are not. Legend for results is here.
ips	qps	rps	rmbps	wps	wmbps	rpq	rkbpq	wpi	wkbpi	csps	cpups	cspq	cpupq	dbgb1	dbgb2	rss	maxop	p50	p99	tag
797	44306	0	0.0	88.5	3.0	0.000	0.000	0.111	3.884	257804	33.3	5.819	180	19.9	94.2	24.5	0.004	5567	5151	my8407_rel_o2nofp.cz12a_c24r64
796	44157	0	0.0	76.4	2.7	0.000	0.000	0.096	3.503	257121	33.3	5.823	181	20.0	94.4	24.7	0.004	5567	5167	my8407_rel_o2nofp.cz12a_nocb_c24r64
797	55134	0	0.0	102.3	7.1	0.000	0.000	0.128	9.146	213220	33.0	3.867	144	21.8	85.3	0.4	0.001	6895	6607	pg181_o2nofp.cx10b_c24r64
Average values from iostat.
r/s	rkB/s	rrqm/s	%rrqm	r_await	rareq-s	w/s	wkB/s	wrqm/s	%wrqm	w_await	wareq-s	d/s	dkB/s	drqm/s	%drqm	d_await	dareq-s	f/s	f_await	aqu-sz	%util
0.001	0.004	0.000	0.000	0.000	0.022	88.47	3095.1	1.105	1.287	0.234	35.38	0.019	0.078	0.000	0.000	0.030	0.388	0.000	0.000	0.022	43.58		my8407_rel_o2nofp.cz12a_c24r64
0.001	0.004	0.000	0.000	0.000	0.022	76.43	2789.6	1.290	1.735	0.210	37.03	0.008	0.062	0.000	0.000	0.011	0.310	0.000	0.000	0.019	0.218		my8407_rel_o2nofp.cz12a_nocb_c24r64
0.000	0.000	0.000	0.000	0.000	0.000	102.3	7288.2	2.704	3.273	0.090	73.98	0.024	327.0	0.000	0.000	0.001	38.03	0.000	0.000	0.010	0.346		pg181_o2nofp.cx10b_c24r64
qr500.L3
qr500.L3: range queries with 500 insert/s per client. Graphs for performance per 1-second interval are here.
Average throughput:
Query response time histogram: each cell has the percentage of responses that take <= the time in the header and max is the max response time in seconds. For max values in the top 25% of the range have a red background and in the bottom 25% of the range have a green background. The red background is not used when the min value is within 80% of the max value.
| dbms | 256us | 1ms | 4ms | 16ms | 64ms | 256ms | 1s | 4s | 16s | gt | max |
|---|---|---|---|---|---|---|---|---|---|---|---|
| my8407_rel_o2nofp.cz12a_c24r64 | 99.938 | 0.060 | 0.001 | nonzero | 0.005 | ||||||
| my8407_rel_o2nofp.cz12a_nocb_c24r64 | 99.944 | 0.055 | 0.001 | nonzero | 0.004 | ||||||
| pg181_o2nofp.cx10b_c24r64 | 99.994 | 0.006 | nonzero | nonzero | nonzero | 0.022 |
Insert response time histogram: each cell has the percentage of responses that take <= the time in the header and max is the max response time in seconds. For max values in the top 25% of the range have a red background and in the bottom 25% of the range have a green background. The red background is not used when the min value is within 80% of the max value.
| dbms | 256us | 1ms | 4ms | 16ms | 64ms | 256ms | 1s | 4s | 16s | gt | max |
|---|---|---|---|---|---|---|---|---|---|---|---|
| my8407_rel_o2nofp.cz12a_c24r64 | 97.339 | 2.661 | 0.014 | ||||||||
| my8407_rel_o2nofp.cz12a_nocb_c24r64 | 98.660 | 1.340 | 0.012 | ||||||||
| pg181_o2nofp.cx10b_c24r64 | 99.592 | 0.305 | 0.103 | 0.032 |
Delete response time histogram: each cell has the percentage of responses that take <= the time in the header and max is the max response time in seconds. For max values in the top 25% of the range have a red background and in the bottom 25% of the range have a green background. The red background is not used when the min value is within 80% of the max value.
| dbms | 256us | 1ms | 4ms | 16ms | 64ms | 256ms | 1s | 4s | 16s | gt | max |
|---|---|---|---|---|---|---|---|---|---|---|---|
| my8407_rel_o2nofp.cz12a_c24r64 | 98.636 | 1.364 | 0.016 | ||||||||
| my8407_rel_o2nofp.cz12a_nocb_c24r64 | 99.463 | 0.537 | 0.015 | ||||||||
| pg181_o2nofp.cx10b_c24r64 | 15.689 | 83.783 | 0.460 | 0.069 | 0.028 |
Performance metrics for the DBMS listed above. Some are normalized by throughput, others are not. Legend for results is here.
ips	qps	rps	rmbps	wps	wmbps	rpq	rkbpq	wpi	wkbpi	csps	cpups	cspq	cpupq	dbgb1	dbgb2	rss	maxop	p50	p99	tag
3982	61535	0	0.0	500.1	17.2	0.000	0.000	0.126	4.432	355506	35.3	5.777	138	19.9	94.9	24.5	0.005	7743	7294	my8407_rel_o2nofp.cz12a_c24r64
3984	61056	0	0.0	505.5	17.4	0.000	0.000	0.127	4.471	353189	35.3	5.785	139	20.0	95.1	24.7	0.004	7695	7263	my8407_rel_o2nofp.cz12a_nocb_c24r64
3984	100668	0	0.0	170.4	10.4	0.000	0.000	0.043	2.670	384638	34.4	3.821	82	21.9	80.4	13.1	0.022	12654	11854	pg181_o2nofp.cx10b_c24r64
Average values from iostat.
r/s	rkB/s	rrqm/s	%rrqm	r_await	rareq-s	w/s	wkB/s	wrqm/s	%wrqm	w_await	wareq-s	d/s	dkB/s	drqm/s	%drqm	d_await	dareq-s	f/s	f_await	aqu-sz	%util
0.006	0.022	0.000	0.000	0.001	0.100	500.1	17649.9	1.346	0.321	2.737	36.81	0.044	0.722	0.000	0.000	0.050	2.033	0.000	0.000	1.530	2.316		my8407_rel_o2nofp.cz12a_c24r64
0.004	0.016	0.000	0.000	0.001	0.066	505.5	17813.5	1.328	0.309	2.833	36.42	0.041	0.301	0.000	0.000	0.047	1.252	0.000	0.000	1.574	3.259		my8407_rel_o2nofp.cz12a_nocb_c24r64
0.000	0.000	0.000	0.000	0.000	0.000	170.4	10639.1	4.290	2.173	0.149	64.06	0.188	2895.6	0.000	0.000	0.003	42.87	0.000	0.000	0.036	0.543		pg181_o2nofp.cx10b_c24r64
qp500.L4
qp500.L4: point queries with 500 insert/s per client. Graphs for performance per 1-second interval are here.
Average throughput:
Query response time histogram: each cell has the percentage of responses that take <= the time in the header and max is the max response time in seconds. For max values in the top 25% of the range have a red background and in the bottom 25% of the range have a green background. The red background is not used when the min value is within 80% of the max value.
| dbms | 256us | 1ms | 4ms | 16ms | 64ms | 256ms | 1s | 4s | 16s | gt | max |
|---|---|---|---|---|---|---|---|---|---|---|---|
| my8407_rel_o2nofp.cz12a_c24r64 | 99.437 | 0.562 | 0.001 | nonzero | 0.004 | ||||||
| my8407_rel_o2nofp.cz12a_nocb_c24r64 | 99.394 | 0.605 | 0.001 | nonzero | 0.012 | ||||||
| pg181_o2nofp.cx10b_c24r64 | 99.967 | 0.033 | nonzero | nonzero | nonzero | 0.020 |
Insert response time histogram: each cell has the percentage of responses that take <= the time in the header and max is the max response time in seconds. For max values in the top 25% of the range have a red background and in the bottom 25% of the range have a green background. The red background is not used when the min value is within 80% of the max value.
| dbms | 256us | 1ms | 4ms | 16ms | 64ms | 256ms | 1s | 4s | 16s | gt | max |
|---|---|---|---|---|---|---|---|---|---|---|---|
| my8407_rel_o2nofp.cz12a_c24r64 | 99.300 | 0.700 | 0.014 | ||||||||
| my8407_rel_o2nofp.cz12a_nocb_c24r64 | 98.028 | 1.972 | 0.015 | ||||||||
| pg181_o2nofp.cx10b_c24r64 | 99.617 | 0.299 | 0.085 | 0.037 |
Delete response time histogram: each cell has the percentage of responses that take <= the time in the header and max is the max response time in seconds. For max values in the top 25% of the range have a red background and in the bottom 25% of the range have a green background. The red background is not used when the min value is within 80% of the max value.
| dbms | 256us | 1ms | 4ms | 16ms | 64ms | 256ms | 1s | 4s | 16s | gt | max |
|---|---|---|---|---|---|---|---|---|---|---|---|
| my8407_rel_o2nofp.cz12a_c24r64 | 99.595 | 0.405 | 0.013 | ||||||||
| my8407_rel_o2nofp.cz12a_nocb_c24r64 | 99.147 | 0.852 | 0.001 | 0.019 | |||||||
| pg181_o2nofp.cx10b_c24r64 | 17.674 | 82.092 | 0.185 | 0.049 | 0.027 |
Performance metrics for the DBMS listed above. Some are normalized by throughput, others are not. Legend for results is here.
ips	qps	rps	rmbps	wps	wmbps	rpq	rkbpq	wpi	wkbpi	csps	cpups	cspq	cpupq	dbgb1	dbgb2	rss	maxop	p50	p99	tag
3982	43764	0	0.0	559.6	18.9	0.000	0.000	0.141	4.864	258426	35.2	5.905	193	19.9	95.6	24.6	0.004	5535	5119	my8407_rel_o2nofp.cz12a_c24r64
3984	43568	0	0.0	551.4	18.7	0.000	0.000	0.138	4.799	256158	35.2	5.879	194	20.0	95.8	24.8	0.012	5519	5151	my8407_rel_o2nofp.cz12a_nocb_c24r64
3982	54378	0	0.0	106.7	10.9	0.000	0.000	0.027	2.813	210871	33.9	3.878	150	22.0	76.2	0.3	0.020	6847	6575	pg181_o2nofp.cx10b_c24r64
Average values from iostat.
r/s	rkB/s	rrqm/s	%rrqm	r_await	rareq-s	w/s	wkB/s	wrqm/s	%wrqm	w_await	wareq-s	d/s	dkB/s	drqm/s	%drqm	d_await	dareq-s	f/s	f_await	aqu-sz	%util
0.006	0.024	0.000	0.000	0.003	0.111	559.6	19368.8	2.011	0.356	2.902	34.94	0.042	0.589	0.000	0.000	0.049	1.706	0.000	0.000	1.645	2.294		my8407_rel_o2nofp.cz12a_c24r64
0.005	0.020	0.000	0.000	0.004	0.078	551.4	19121.9	1.472	0.273	3.061	34.97	0.043	0.308	0.000	0.000	0.060	1.235	0.000	0.000	1.700	3.557		my8407_rel_o2nofp.cz12a_nocb_c24r64
0.000	0.000	0.000	0.000	0.000	0.000	106.7	11204.1	4.302	2.852	0.163	105.9	0.166	2478.2	0.000	0.000	0.004	76.12	0.000	0.000	0.028	0.530		pg181_o2nofp.cx10b_c24r64
qr1000.L5
qr1000.L5: range queries with 1000 insert/s per client. Graphs for performance per 1-second interval are here.
Average throughput:
Query response time histogram: each cell has the percentage of responses that take <= the time in the header and max is the max response time in seconds. For max values in the top 25% of the range have a red background and in the bottom 25% of the range have a green background. The red background is not used when the min value is within 80% of the max value.
| dbms | 256us | 1ms | 4ms | 16ms | 64ms | 256ms | 1s | 4s | 16s | gt | max |
|---|---|---|---|---|---|---|---|---|---|---|---|
| my8407_rel_o2nofp.cz12a_c24r64 | 99.874 | 0.123 | 0.003 | nonzero | 0.006 | ||||||
| my8407_rel_o2nofp.cz12a_nocb_c24r64 | 99.848 | 0.147 | 0.004 | nonzero | 0.007 | ||||||
| pg181_o2nofp.cx10b_c24r64 | 99.992 | 0.007 | nonzero | nonzero | nonzero | nonzero | 0.098 |
Insert response time histogram: each cell has the percentage of responses that take <= the time in the header and max is the max response time in seconds. For max values in the top 25% of the range have a red background and in the bottom 25% of the range have a green background. The red background is not used when the min value is within 80% of the max value.
| dbms | 256us | 1ms | 4ms | 16ms | 64ms | 256ms | 1s | 4s | 16s | gt | max |
|---|---|---|---|---|---|---|---|---|---|---|---|
| my8407_rel_o2nofp.cz12a_c24r64 | 97.244 | 2.753 | 0.003 | 0.023 | |||||||
| my8407_rel_o2nofp.cz12a_nocb_c24r64 | 93.461 | 6.536 | 0.003 | 0.027 | |||||||
| pg181_o2nofp.cx10b_c24r64 | 99.653 | 0.257 | 0.090 | 0.033 |
Delete response time histogram: each cell has the percentage of responses that take <= the time in the header and max is the max response time in seconds. For max values in the top 25% of the range have a red background and in the bottom 25% of the range have a green background. The red background is not used when the min value is within 80% of the max value.
| dbms | 256us | 1ms | 4ms | 16ms | 64ms | 256ms | 1s | 4s | 16s | gt | max |
|---|---|---|---|---|---|---|---|---|---|---|---|
| my8407_rel_o2nofp.cz12a_c24r64 | 98.634 | 1.363 | 0.002 | 0.028 | |||||||
| my8407_rel_o2nofp.cz12a_nocb_c24r64 | 96.449 | 3.548 | 0.003 | 0.024 | |||||||
| pg181_o2nofp.cx10b_c24r64 | 20.899 | 78.822 | 0.236 | 0.044 | 0.030 |
Performance metrics for the DBMS listed above. Some are normalized by throughput, others are not. Legend for results is here.
ips	qps	rps	rmbps	wps	wmbps	rpq	rkbpq	wpi	wkbpi	csps	cpups	cspq	cpupq	dbgb1	dbgb2	rss	maxop	p50	p99	tag
7969	60208	0	0.0	905.9	32.1	0.000	0.000	0.114	4.122	351152	38.2	5.832	152	19.9	97.0	24.6	0.006	7599	7199	my8407_rel_o2nofp.cz12a_c24r64
7965	59769	0	0.0	920.0	32.5	0.000	0.000	0.116	4.181	347556	38.2	5.815	153	20.0	97.2	24.8	0.007	7535	7125	my8407_rel_o2nofp.cz12a_nocb_c24r64
7965	99674	0	0.0	129.8	14.1	0.000	0.000	0.016	1.812	381247	35.8	3.825	86	21.9	72.6	0.5	0.098	12526	11742	pg181_o2nofp.cx10b_c24r64
Average values from iostat.
r/s	rkB/s	rrqm/s	%rrqm	r_await	rareq-s	w/s	wkB/s	wrqm/s	%wrqm	w_await	wareq-s	d/s	dkB/s	drqm/s	%drqm	d_await	dareq-s	f/s	f_await	aqu-sz	%util
0.012	0.047	0.000	0.000	0.010	0.222	905.9	32848.4	1.635	0.183	4.503	36.33	0.048	0.696	0.000	0.000	0.043	1.950	0.000	0.000	4.123	2.127		my8407_rel_o2nofp.cz12a_c24r64
0.009	0.035	0.000	0.000	0.006	0.177	920.0	33298.1	1.608	0.176	4.734	36.24	0.049	0.290	0.000	0.000	0.058	1.013	0.000	0.000	4.397	2.175		my8407_rel_o2nofp.cz12a_nocb_c24r64
0.000	0.000	0.000	0.000	0.000	0.000	129.8	14435.2	4.668	2.712	0.161	112.9	0.141	2127.1	0.000	0.000	0.005	248.8	0.000	0.000	0.044	0.667		pg181_o2nofp.cx10b_c24r64
qp1000.L6
qp1000.L6: point queries with 1000 insert/s per client. Graphs for performance per 1-second interval are here.
Average throughput:
Query response time histogram: each cell has the percentage of responses that take <= the time in the header and max is the max response time in seconds. For max values in the top 25% of the range have a red background and in the bottom 25% of the range have a green background. The red background is not used when the min value is within 80% of the max value.
| dbms | 256us | 1ms | 4ms | 16ms | 64ms | 256ms | 1s | 4s | 16s | gt | max |
|---|---|---|---|---|---|---|---|---|---|---|---|
| my8407_rel_o2nofp.cz12a_c24r64 | 98.749 | 1.245 | 0.006 | nonzero | 0.007 | ||||||
| my8407_rel_o2nofp.cz12a_nocb_c24r64 | 98.644 | 1.348 | 0.008 | nonzero | 0.006 | ||||||
| pg181_o2nofp.cx10b_c24r64 | 99.944 | 0.056 | nonzero | nonzero | nonzero | nonzero | 0.074 |
Insert response time histogram: each cell has the percentage of responses that take <= the time in the header and max is the max response time in seconds. For max values in the top 25% of the range have a red background and in the bottom 25% of the range have a green background. The red background is not used when the min value is within 80% of the max value.
| dbms | 256us | 1ms | 4ms | 16ms | 64ms | 256ms | 1s | 4s | 16s | gt | max |
|---|---|---|---|---|---|---|---|---|---|---|---|
| my8407_rel_o2nofp.cz12a_c24r64 | 94.376 | 5.622 | 0.002 | 0.018 | |||||||
| my8407_rel_o2nofp.cz12a_nocb_c24r64 | 91.824 | 8.172 | 0.004 | 0.026 | |||||||
| pg181_o2nofp.cx10b_c24r64 | 99.729 | 0.211 | 0.060 | 0.030 |
Delete response time histogram: each cell has the percentage of responses that take <= the time in the header and max is the max response time in seconds. For max values in the top 25% of the range have a red background and in the bottom 25% of the range have a green background. The red background is not used when the min value is within 80% of the max value.
| dbms | 256us | 1ms | 4ms | 16ms | 64ms | 256ms | 1s | 4s | 16s | gt | max |
|---|---|---|---|---|---|---|---|---|---|---|---|
| my8407_rel_o2nofp.cz12a_c24r64 | 96.846 | 3.151 | 0.003 | 0.023 | |||||||
| my8407_rel_o2nofp.cz12a_nocb_c24r64 | 95.147 | 4.851 | 0.001 | 0.025 | |||||||
| pg181_o2nofp.cx10b_c24r64 | 21.577 | 77.675 | 0.706 | 0.042 | 0.025 |
Performance metrics for the DBMS listed above. Some are normalized by throughput, others are not. Legend for results is here.
ips	qps	rps	rmbps	wps	wmbps	rpq	rkbpq	wpi	wkbpi	csps	cpups	cspq	cpupq	dbgb1	dbgb2	rss	maxop	p50	p99	tag
7965	43030	0	0.0	941.3	33.1	0.000	0.000	0.118	4.259	256460	38.0	5.960	212	19.9	98.4	24.6	0.007	5439	5071	my8407_rel_o2nofp.cz12a_c24r64
7969	42827	0	0.0	939.2	33.1	0.000	0.000	0.118	4.251	254317	38.1	5.938	214	20.0	98.6	24.8	0.006	5391	5039	my8407_rel_o2nofp.cz12a_nocb_c24r64
7969	53849	0	0.0	128.0	14.0	0.000	0.000	0.016	1.803	209127	35.3	3.884	157	22.0	70.3	4.9	0.074	6783	6495	pg181_o2nofp.cx10b_c24r64
Average values from iostat.
r/s	rkB/s	rrqm/s	%rrqm	r_await	rareq-s	w/s	wkB/s	wrqm/s	%wrqm	w_await	wareq-s	d/s	dkB/s	drqm/s	%drqm	d_await	dareq-s	f/s	f_await	aqu-sz	%util
0.014	0.055	0.000	0.000	0.010	0.244	941.3	33924.9	1.551	0.164	4.678	36.02	0.047	0.736	0.000	0.000	0.053	2.055	0.000	0.000	4.406	3.241		my8407_rel_o2nofp.cz12a_c24r64
0.007	0.027	0.000	0.000	0.003	0.133	939.2	33879.1	1.531	0.162	4.873	36.05	0.055	0.279	0.000	0.000	0.051	0.834	0.000	0.000	4.578	2.209		my8407_rel_o2nofp.cz12a_nocb_c24r64
0.000	0.000	0.000	0.000	0.000	0.000	128.0	14367.8	5.008	2.708	0.163	112.6	0.090	1372.5	0.000	0.000	0.002	69.76	0.000	0.000	0.033	0.665		pg181_o2nofp.cx10b_c24r64
l.i0
l.i0: load without secondary indexes
Performance metrics for all DBMS, not just the ones listed above. Some are normalized by throughput, others are not. Legend for results is here.
ips	qps	rps	rmbps	wps	wmbps	rpq	rkbpq	wpi	wkbpi	csps	cpups	cspq	cpupq	dbgb1	dbgb2	rss	maxop	p50	p99	tag
467836	0	0	0.0	1769.4	136.3	0.000	0.000	0.004	0.298	89008	44.8	0.190	23	5.3	59.6	8.6	0.243	63892	49891	my8407_rel_o2nofp.cz12a_c24r64
465116	0	0	0.0	1777.5	136.6	0.000	0.000	0.004	0.301	89361	44.7	0.192	23	5.3	59.6	8.7	0.250	65791	50594	my8407_rel_o2nofp.cz12a_nocb_c24r64
655738	0	0	0.0	2436.5	283.3	0.000	0.000	0.004	0.442	63331	45.8	0.097	17	7.7	20.7	0.2	0.165	95588	64192	pg181_o2nofp.cx10b_c24r64
l.x
l.x: create secondary indexes
Performance metrics for all DBMS, not just the ones listed above. Some are normalized by throughput, others are not. Legend for results is here.
ips	qps	rps	rmbps	wps	wmbps	rpq	rkbpq	wpi	wkbpi	csps	cpups	cspq	cpupq	dbgb1	dbgb2	rss	maxop	p50	p99	tag
1025642	0	24	0.8	31439.9	1216.4	0.000	0.001	0.031	1.214	69039	64.5	0.067	15	12.1	66.5	11.8	0.005	NA	NA	my8407_rel_o2nofp.cz12a_c24r64
1052633	0	29	0.8	32694.6	1236.3	0.000	0.001	0.031	1.203	69654	63.7	0.066	15	12.1	66.5	12.0	0.002	NA	NA	my8407_rel_o2nofp.cz12a_nocb_c24r64
1403510	0	0	0.0	3758.5	426.6	0.000	0.000	0.003	0.311	3709	23.8	0.003	4	15.4	35.4	6.7	0.003	NA	NA	pg181_o2nofp.cx10b_c24r64
l.i1
l.i1: continue load after secondary indexes created with 50 inserts per transaction
Performance metrics for all DBMS, not just the ones listed above. Some are normalized by throughput, others are not. Legend for results is here.
ips	qps	rps	rmbps	wps	wmbps	rpq	rkbpq	wpi	wkbpi	csps	cpups	cspq	cpupq	dbgb1	dbgb2	rss	maxop	p50	p99	tag
119738	0	362	5.7	6735.1	274.4	0.003	0.048	0.056	2.347	104437	81.5	0.872	163	19.9	87.7	24.3	0.433	15598	5949	my8407_rel_o2nofp.cz12a_c24r64
120869	0	364	5.7	6657.8	271.0	0.003	0.048	0.055	2.296	103661	81.7	0.858	162	20.0	88.0	24.5	0.367	15748	5549	my8407_rel_o2nofp.cz12a_nocb_c24r64
162643	0	0	0.0	1974.2	230.1	0.000	0.000	0.012	1.449	74951	60.3	0.461	89	21.6	85.7	10.9	0.089	16898	4949	pg181_o2nofp.cx10b_c24r64
l.i2
l.i2: continue load after secondary indexes created with 5 inserts per transaction
Performance metrics for all DBMS, not just the ones listed above. Some are normalized by throughput, others are not. Legend for results is here.
ips	qps	rps	rmbps	wps	wmbps	rpq	rkbpq	wpi	wkbpi	csps	cpups	cspq	cpupq	dbgb1	dbgb2	rss	maxop	p50	p99	tag
53782	0	0	0.0	5064.6	199.9	0.000	0.000	0.094	3.806	295766	71.8	5.499	320	19.9	93.9	24.5	0.321	7204	1300	my8407_rel_o2nofp.cz12a_c24r64
53333	0	0	0.0	5058.4	199.5	0.000	0.000	0.095	3.830	292391	71.7	5.482	323	20.0	94.1	24.7	0.333	7299	1185	my8407_rel_o2nofp.cz12a_nocb_c24r64
26468	0	0	0.0	218.0	26.1	0.000	0.000	0.008	1.011	113515	42.2	4.289	383	21.8	85.9	15.3	0.002	2360	1200	pg181_o2nofp.cx10b_c24r64
qr100.L1
qr100.L1: range queries with 100 insert/s per client
Performance metrics for all DBMS, not just the ones listed above. Some are normalized by throughput, others are not. Legend for results is here.
ips	qps	rps	rmbps	wps	wmbps	rpq	rkbpq	wpi	wkbpi	csps	cpups	cspq	cpupq	dbgb1	dbgb2	rss	maxop	p50	p99	tag
796	61985	0	0.0	1009.1	28.6	0.000	0.000	1.267	36.767	357719	33.7	5.771	130	19.9	94.0	24.5	0.004	7807	7423	my8407_rel_o2nofp.cz12a_c24r64
797	61709	0	0.0	1041.5	29.5	0.000	0.000	1.307	37.920	356131	33.8	5.771	131	20.0	94.2	24.7	0.004	7775	7327	my8407_rel_o2nofp.cz12a_nocb_c24r64
796	103714	0	0.0	36.3	3.7	0.000	0.000	0.046	4.718	396398	33.3	3.822	77	21.8	85.8	0.4	0.002	13038	12413	pg181_o2nofp.cx10b_c24r64
qp100.L2
qp100.L2: point queries with 100 insert/s per client
Performance metrics for all DBMS, not just the ones listed above. Some are normalized by throughput, others are not. Legend for results is here.
ips	qps	rps	rmbps	wps	wmbps	rpq	rkbpq	wpi	wkbpi	csps	cpups	cspq	cpupq	dbgb1	dbgb2	rss	maxop	p50	p99	tag
797	44306	0	0.0	88.5	3.0	0.000	0.000	0.111	3.884	257804	33.3	5.819	180	19.9	94.2	24.5	0.004	5567	5151	my8407_rel_o2nofp.cz12a_c24r64
796	44157	0	0.0	76.4	2.7	0.000	0.000	0.096	3.503	257121	33.3	5.823	181	20.0	94.4	24.7	0.004	5567	5167	my8407_rel_o2nofp.cz12a_nocb_c24r64
797	55134	0	0.0	102.3	7.1	0.000	0.000	0.128	9.146	213220	33.0	3.867	144	21.8	85.3	0.4	0.001	6895	6607	pg181_o2nofp.cx10b_c24r64
qr500.L3
qr500.L3: range queries with 500 insert/s per client
Performance metrics for all DBMS, not just the ones listed above. Some are normalized by throughput, others are not. Legend for results is here.
ips	qps	rps	rmbps	wps	wmbps	rpq	rkbpq	wpi	wkbpi	csps	cpups	cspq	cpupq	dbgb1	dbgb2	rss	maxop	p50	p99	tag
3982	61535	0	0.0	500.1	17.2	0.000	0.000	0.126	4.432	355506	35.3	5.777	138	19.9	94.9	24.5	0.005	7743	7294	my8407_rel_o2nofp.cz12a_c24r64
3984	61056	0	0.0	505.5	17.4	0.000	0.000	0.127	4.471	353189	35.3	5.785	139	20.0	95.1	24.7	0.004	7695	7263	my8407_rel_o2nofp.cz12a_nocb_c24r64
3984	100668	0	0.0	170.4	10.4	0.000	0.000	0.043	2.670	384638	34.4	3.821	82	21.9	80.4	13.1	0.022	12654	11854	pg181_o2nofp.cx10b_c24r64
qp500.L4
qp500.L4: point queries with 500 insert/s per client
Performance metrics for all DBMS, not just the ones listed above. Some are normalized by throughput, others are not. Legend for results is here.
ips	qps	rps	rmbps	wps	wmbps	rpq	rkbpq	wpi	wkbpi	csps	cpups	cspq	cpupq	dbgb1	dbgb2	rss	maxop	p50	p99	tag
3982	43764	0	0.0	559.6	18.9	0.000	0.000	0.141	4.864	258426	35.2	5.905	193	19.9	95.6	24.6	0.004	5535	5119	my8407_rel_o2nofp.cz12a_c24r64
3984	43568	0	0.0	551.4	18.7	0.000	0.000	0.138	4.799	256158	35.2	5.879	194	20.0	95.8	24.8	0.012	5519	5151	my8407_rel_o2nofp.cz12a_nocb_c24r64
3982	54378	0	0.0	106.7	10.9	0.000	0.000	0.027	2.813	210871	33.9	3.878	150	22.0	76.2	0.3	0.020	6847	6575	pg181_o2nofp.cx10b_c24r64
qr1000.L5
qr1000.L5: range queries with 1000 insert/s per client
Performance metrics for all DBMS, not just the ones listed above. Some are normalized by throughput, others are not. Legend for results is here.
ips	qps	rps	rmbps	wps	wmbps	rpq	rkbpq	wpi	wkbpi	csps	cpups	cspq	cpupq	dbgb1	dbgb2	rss	maxop	p50	p99	tag
7969	60208	0	0.0	905.9	32.1	0.000	0.000	0.114	4.122	351152	38.2	5.832	152	19.9	97.0	24.6	0.006	7599	7199	my8407_rel_o2nofp.cz12a_c24r64
7965	59769	0	0.0	920.0	32.5	0.000	0.000	0.116	4.181	347556	38.2	5.815	153	20.0	97.2	24.8	0.007	7535	7125	my8407_rel_o2nofp.cz12a_nocb_c24r64
7965	99674	0	0.0	129.8	14.1	0.000	0.000	0.016	1.812	381247	35.8	3.825	86	21.9	72.6	0.5	0.098	12526	11742	pg181_o2nofp.cx10b_c24r64
qp1000.L6
qp1000.L6: point queries with 1000 insert/s per client
Performance metrics for all DBMS, not just the ones listed above. Some are normalized by throughput, others are not. Legend for results is here.
ips	qps	rps	rmbps	wps	wmbps	rpq	rkbpq	wpi	wkbpi	csps	cpups	cspq	cpupq	dbgb1	dbgb2	rss	maxop	p50	p99	tag
7965	43030	0	0.0	941.3	33.1	0.000	0.000	0.118	4.259	256460	38.0	5.960	212	19.9	98.4	24.6	0.007	5439	5071	my8407_rel_o2nofp.cz12a_c24r64
7969	42827	0	0.0	939.2	33.1	0.000	0.000	0.118	4.251	254317	38.1	5.938	214	20.0	98.6	24.8	0.006	5391	5039	my8407_rel_o2nofp.cz12a_nocb_c24r64
7969	53849	0	0.0	128.0	14.0	0.000	0.000	0.016	1.803	209127	35.3	3.884	157	22.0	70.3	4.9	0.074	6783	6495	pg181_o2nofp.cx10b_c24r64
l.i0
- l.i0: load without secondary indexes
- Legend for results is here.
- Each entry lists the percentage of responses that fit in that bucket (slower than max time for previous bucket, faster than min time for next bucket).
Insert response time histogram
256us	1ms	4ms	16ms	64ms	256ms	1s	4s	16s	gt	max	tag
0.000	0.000	99.786	0.187	0.013	0.014	0.000	0.000	0.000	0.000	0.243	my8407_rel_o2nofp.cz12a_c24r64
0.000	0.000	99.801	0.168	0.017	0.014	0.000	0.000	0.000	0.000	0.250	my8407_rel_o2nofp.cz12a_nocb_c24r64
0.000	30.006	69.944	0.022	0.020	0.009	0.000	0.000	0.000	0.000	0.165	pg181_o2nofp.cx10b_c24r64
l.x
- l.x: create secondary indexes
- Legend for results is here.
- Each entry lists the percentage of responses that fit in that bucket (slower than max time for previous bucket, faster than min time for next bucket).
TODO - determine whether there is data for create index response time
l.i1
- l.i1: continue load after secondary indexes created with 50 inserts per transaction
- Legend for results is here.
- Each entry lists the percentage of responses that fit in that bucket (slower than max time for previous bucket, faster than min time for next bucket).
Insert response time histogram
256us	1ms	4ms	16ms	64ms	256ms	1s	4s	16s	gt	max	tag
0.000	0.000	94.673	4.662	0.642	0.018	0.006	0.000	0.000	0.000	0.433	my8407_rel_o2nofp.cz12a_c24r64
0.000	0.000	94.859	4.493	0.625	0.020	0.003	0.000	0.000	0.000	0.367	my8407_rel_o2nofp.cz12a_nocb_c24r64
0.000	0.000	99.704	0.185	0.110	0.001	0.000	0.000	0.000	0.000	0.089	pg181_o2nofp.cx10b_c24r64
Delete response time histogram
256us	1ms	4ms	16ms	64ms	256ms	1s	4s	16s	gt	max	tag
0.000	0.000	97.219	2.354	0.407	0.015	0.005	0.000	0.000	0.000	0.439	my8407_rel_o2nofp.cz12a_c24r64
0.000	0.000	97.171	2.406	0.405	0.016	0.003	0.000	0.000	0.000	0.366	my8407_rel_o2nofp.cz12a_nocb_c24r64
0.000	13.214	83.440	3.226	0.119	0.001	0.000	0.000	0.000	0.000	0.090	pg181_o2nofp.cx10b_c24r64
l.i2
- l.i2: continue load after secondary indexes created with 5 inserts per transaction
- Legend for results is here.
- Each entry lists the percentage of responses that fit in that bucket (slower than max time for previous bucket, faster than min time for next bucket).
Insert response time histogram
256us	1ms	4ms	16ms	64ms	256ms	1s	4s	16s	gt	max	tag
0.000	93.696	6.041	0.192	0.068	0.002	0.001	0.000	0.000	0.000	0.321	my8407_rel_o2nofp.cz12a_c24r64
0.000	93.342	6.258	0.331	0.066	0.002	0.001	0.000	0.000	0.000	0.333	my8407_rel_o2nofp.cz12a_nocb_c24r64
26.150	73.850	nonzero	0.000	0.000	0.000	0.000	0.000	0.000	0.000	0.002	pg181_o2nofp.cx10b_c24r64
Delete response time histogram
256us	1ms	4ms	16ms	64ms	256ms	1s	4s	16s	gt	max	tag
nonzero	94.859	4.927	0.155	0.056	0.002	0.001	0.000	0.000	0.000	0.320	my8407_rel_o2nofp.cz12a_c24r64
nonzero	94.386	5.274	0.284	0.053	0.002	nonzero	0.000	0.000	0.000	0.332	my8407_rel_o2nofp.cz12a_nocb_c24r64
0.005	34.018	65.558	0.420	0.000	0.000	0.000	0.000	0.000	0.000	0.012	pg181_o2nofp.cx10b_c24r64
qr100.L1
- qr100.L1: range queries with 100 insert/s per client
- Legend for results is here.
- Each entry lists the percentage of responses that fit in that bucket (slower than max time for previous bucket, faster than min time for next bucket).
Query response time histogram
256us	1ms	4ms	16ms	64ms	256ms	1s	4s	16s	gt	max	tag
99.974	0.026	nonzero	0.000	0.000	0.000	0.000	0.000	0.000	0.000	0.004	my8407_rel_o2nofp.cz12a_c24r64
99.976	0.024	nonzero	0.000	0.000	0.000	0.000	0.000	0.000	0.000	0.004	my8407_rel_o2nofp.cz12a_nocb_c24r64
99.998	0.002	nonzero	0.000	0.000	0.000	0.000	0.000	0.000	0.000	0.002	pg181_o2nofp.cx10b_c24r64
Insert response time histogram
256us	1ms	4ms	16ms	64ms	256ms	1s	4s	16s	gt	max	tag
0.000	0.000	99.840	0.160	0.000	0.000	0.000	0.000	0.000	0.000	0.005	my8407_rel_o2nofp.cz12a_c24r64
0.000	0.000	99.757	0.243	0.000	0.000	0.000	0.000	0.000	0.000	0.007	my8407_rel_o2nofp.cz12a_nocb_c24r64
0.000	0.000	99.795	0.205	0.000	0.000	0.000	0.000	0.000	0.000	0.009	pg181_o2nofp.cx10b_c24r64
Delete response time histogram
256us	1ms	4ms	16ms	64ms	256ms	1s	4s	16s	gt	max	tag
0.000	0.000	99.931	0.069	0.000	0.000	0.000	0.000	0.000	0.000	0.007	my8407_rel_o2nofp.cz12a_c24r64
0.000	0.000	99.885	0.115	0.000	0.000	0.000	0.000	0.000	0.000	0.006	my8407_rel_o2nofp.cz12a_nocb_c24r64
0.000	25.583	74.417	0.000	0.000	0.000	0.000	0.000	0.000	0.000	0.003	pg181_o2nofp.cx10b_c24r64
qp100.L2
- qp100.L2: point queries with 100 insert/s per client
- Legend for results is here.
- Each entry lists the percentage of responses that fit in that bucket (slower than max time for previous bucket, faster than min time for next bucket).
Query response time histogram
256us	1ms	4ms	16ms	64ms	256ms	1s	4s	16s	gt	max	tag
99.855	0.145	nonzero	nonzero	0.000	0.000	0.000	0.000	0.000	0.000	0.004	my8407_rel_o2nofp.cz12a_c24r64
99.831	0.169	nonzero	0.000	0.000	0.000	0.000	0.000	0.000	0.000	0.004	my8407_rel_o2nofp.cz12a_nocb_c24r64
99.981	0.019	nonzero	0.000	0.000	0.000	0.000	0.000	0.000	0.000	0.001	pg181_o2nofp.cx10b_c24r64
Insert response time histogram
256us	1ms	4ms	16ms	64ms	256ms	1s	4s	16s	gt	max	tag
0.000	0.000	99.906	0.094	0.000	0.000	0.000	0.000	0.000	0.000	0.006	my8407_rel_o2nofp.cz12a_c24r64
0.000	0.000	99.851	0.149	0.000	0.000	0.000	0.000	0.000	0.000	0.006	my8407_rel_o2nofp.cz12a_nocb_c24r64
0.000	0.000	99.840	0.160	0.000	0.000	0.000	0.000	0.000	0.000	0.009	pg181_o2nofp.cx10b_c24r64
Delete response time histogram
256us	1ms	4ms	16ms	64ms	256ms	1s	4s	16s	gt	max	tag
0.000	0.000	99.997	0.003	0.000	0.000	0.000	0.000	0.000	0.000	0.004	my8407_rel_o2nofp.cz12a_c24r64
0.000	0.000	99.976	0.024	0.000	0.000	0.000	0.000	0.000	0.000	0.005	my8407_rel_o2nofp.cz12a_nocb_c24r64
0.000	0.000	99.924	0.076	0.000	0.000	0.000	0.000	0.000	0.000	0.008	pg181_o2nofp.cx10b_c24r64
qr500.L3
- qr500.L3: range queries with 500 insert/s per client
- Legend for results is here.
- Each entry lists the percentage of responses that fit in that bucket (slower than max time for previous bucket, faster than min time for next bucket).
Query response time histogram
256us	1ms	4ms	16ms	64ms	256ms	1s	4s	16s	gt	max	tag
99.938	0.060	0.001	nonzero	0.000	0.000	0.000	0.000	0.000	0.000	0.005	my8407_rel_o2nofp.cz12a_c24r64
99.944	0.055	0.001	nonzero	0.000	0.000	0.000	0.000	0.000	0.000	0.004	my8407_rel_o2nofp.cz12a_nocb_c24r64
99.994	0.006	nonzero	nonzero	nonzero	0.000	0.000	0.000	0.000	0.000	0.022	pg181_o2nofp.cx10b_c24r64
Insert response time histogram
256us	1ms	4ms	16ms	64ms	256ms	1s	4s	16s	gt	max	tag
0.000	0.000	97.339	2.661	0.000	0.000	0.000	0.000	0.000	0.000	0.014	my8407_rel_o2nofp.cz12a_c24r64
0.000	0.000	98.660	1.340	0.000	0.000	0.000	0.000	0.000	0.000	0.012	my8407_rel_o2nofp.cz12a_nocb_c24r64
0.000	0.000	99.592	0.305	0.103	0.000	0.000	0.000	0.000	0.000	0.032	pg181_o2nofp.cx10b_c24r64
Delete response time histogram
256us	1ms	4ms	16ms	64ms	256ms	1s	4s	16s	gt	max	tag
0.000	0.000	98.636	1.364	0.000	0.000	0.000	0.000	0.000	0.000	0.016	my8407_rel_o2nofp.cz12a_c24r64
0.000	0.000	99.463	0.537	0.000	0.000	0.000	0.000	0.000	0.000	0.015	my8407_rel_o2nofp.cz12a_nocb_c24r64
0.000	15.689	83.783	0.460	0.069	0.000	0.000	0.000	0.000	0.000	0.028	pg181_o2nofp.cx10b_c24r64
qp500.L4
- qp500.L4: point queries with 500 insert/s per client
- Legend for results is here.
- Each entry lists the percentage of responses that fit in that bucket (slower than max time for previous bucket, faster than min time for next bucket).
Query response time histogram
256us	1ms	4ms	16ms	64ms	256ms	1s	4s	16s	gt	max	tag
99.437	0.562	0.001	nonzero	0.000	0.000	0.000	0.000	0.000	0.000	0.004	my8407_rel_o2nofp.cz12a_c24r64
99.394	0.605	0.001	nonzero	0.000	0.000	0.000	0.000	0.000	0.000	0.012	my8407_rel_o2nofp.cz12a_nocb_c24r64
99.967	0.033	nonzero	nonzero	nonzero	0.000	0.000	0.000	0.000	0.000	0.020	pg181_o2nofp.cx10b_c24r64
Insert response time histogram
256us	1ms	4ms	16ms	64ms	256ms	1s	4s	16s	gt	max	tag
0.000	0.000	99.300	0.700	0.000	0.000	0.000	0.000	0.000	0.000	0.014	my8407_rel_o2nofp.cz12a_c24r64
0.000	0.000	98.028	1.972	0.000	0.000	0.000	0.000	0.000	0.000	0.015	my8407_rel_o2nofp.cz12a_nocb_c24r64
0.000	0.000	99.617	0.299	0.085	0.000	0.000	0.000	0.000	0.000	0.037	pg181_o2nofp.cx10b_c24r64
Delete response time histogram
256us	1ms	4ms	16ms	64ms	256ms	1s	4s	16s	gt	max	tag
0.000	0.000	99.595	0.405	0.000	0.000	0.000	0.000	0.000	0.000	0.013	my8407_rel_o2nofp.cz12a_c24r64
0.000	0.000	99.147	0.852	0.001	0.000	0.000	0.000	0.000	0.000	0.019	my8407_rel_o2nofp.cz12a_nocb_c24r64
0.000	17.674	82.092	0.185	0.049	0.000	0.000	0.000	0.000	0.000	0.027	pg181_o2nofp.cx10b_c24r64
qr1000.L5
- qr1000.L5: range queries with 1000 insert/s per client
- Legend for results is here.
- Each entry lists the percentage of responses that fit in that bucket (slower than max time for previous bucket, faster than min time for next bucket).
Query response time histogram
256us	1ms	4ms	16ms	64ms	256ms	1s	4s	16s	gt	max	tag
99.874	0.123	0.003	nonzero	0.000	0.000	0.000	0.000	0.000	0.000	0.006	my8407_rel_o2nofp.cz12a_c24r64
99.848	0.147	0.004	nonzero	0.000	0.000	0.000	0.000	0.000	0.000	0.007	my8407_rel_o2nofp.cz12a_nocb_c24r64
99.992	0.007	nonzero	nonzero	nonzero	nonzero	0.000	0.000	0.000	0.000	0.098	pg181_o2nofp.cx10b_c24r64
Insert response time histogram
256us	1ms	4ms	16ms	64ms	256ms	1s	4s	16s	gt	max	tag
0.000	0.000	97.244	2.753	0.003	0.000	0.000	0.000	0.000	0.000	0.023	my8407_rel_o2nofp.cz12a_c24r64
0.000	0.000	93.461	6.536	0.003	0.000	0.000	0.000	0.000	0.000	0.027	my8407_rel_o2nofp.cz12a_nocb_c24r64
0.000	0.000	99.653	0.257	0.090	0.000	0.000	0.000	0.000	0.000	0.033	pg181_o2nofp.cx10b_c24r64
Delete response time histogram
256us	1ms	4ms	16ms	64ms	256ms	1s	4s	16s	gt	max	tag
0.000	0.000	98.634	1.363	0.002	0.000	0.000	0.000	0.000	0.000	0.028	my8407_rel_o2nofp.cz12a_c24r64
0.000	0.000	96.449	3.548	0.003	0.000	0.000	0.000	0.000	0.000	0.024	my8407_rel_o2nofp.cz12a_nocb_c24r64
0.000	20.899	78.822	0.236	0.044	0.000	0.000	0.000	0.000	0.000	0.030	pg181_o2nofp.cx10b_c24r64
qp1000.L6
- qp1000.L6: point queries with 1000 insert/s per client
- Legend for results is here.
- Each entry lists the percentage of responses that fit in that bucket (slower than max time for previous bucket, faster than min time for next bucket).
Query response time histogram
256us	1ms	4ms	16ms	64ms	256ms	1s	4s	16s	gt	max	tag
98.749	1.245	0.006	nonzero	0.000	0.000	0.000	0.000	0.000	0.000	0.007	my8407_rel_o2nofp.cz12a_c24r64
98.644	1.348	0.008	nonzero	0.000	0.000	0.000	0.000	0.000	0.000	0.006	my8407_rel_o2nofp.cz12a_nocb_c24r64
99.944	0.056	nonzero	nonzero	nonzero	nonzero	0.000	0.000	0.000	0.000	0.074	pg181_o2nofp.cx10b_c24r64
Insert response time histogram
256us	1ms	4ms	16ms	64ms	256ms	1s	4s	16s	gt	max	tag
0.000	0.000	94.376	5.622	0.002	0.000	0.000	0.000	0.000	0.000	0.018	my8407_rel_o2nofp.cz12a_c24r64
0.000	0.000	91.824	8.172	0.004	0.000	0.000	0.000	0.000	0.000	0.026	my8407_rel_o2nofp.cz12a_nocb_c24r64
0.000	0.000	99.729	0.211	0.060	0.000	0.000	0.000	0.000	0.000	0.030	pg181_o2nofp.cx10b_c24r64
Delete response time histogram
256us	1ms	4ms	16ms	64ms	256ms	1s	4s	16s	gt	max	tag
0.000	0.000	96.846	3.151	0.003	0.000	0.000	0.000	0.000	0.000	0.023	my8407_rel_o2nofp.cz12a_c24r64
0.000	0.000	95.147	4.851	0.001	0.000	0.000	0.000	0.000	0.000	0.025	my8407_rel_o2nofp.cz12a_nocb_c24r64
0.000	21.577	77.675	0.706	0.042	0.000	0.000	0.000	0.000	0.000	0.025	pg181_o2nofp.cx10b_c24r64