Introduction
This is a report for the insert benchmark with 80M docs and 8 client(s). It is generated by scripts (bash, awk, sed) and Tufte might not be impressed. An overview of the insert benchmark is here and a short update is here. Below, by DBMS, I mean DBMS+version.config. An example is my8020.c10b40 where my means MySQL, 8020 is version 8.0.20 and c10b40 is the name for the configuration file.
The test server has 24 cores, 2 sockets, 64G RAM and 1 NVMe devices. The benchmark was run with 8 clients and there were 1 or 3 connections per client (1 for queries or inserts without rate limits, 1+1 for rate limited inserts+deletes). It uses 8 tables with a table per client. It loads 10M rows per table without secondary indexes, creates 3 secondary indexes per table, then inserts 16m+4m rows per table with a delete per insert to avoid growing the table. It then does 6 read+write tests for 1800s each that do queries as fast as possible with 100,100,500,500,1000,1000 inserts/s and the same for deletes/s per client concurrent with the queries. The database is cached by InnoDB. Clients and the DBMS share one server.
The tested DBMS are:
- my5651_rel_o2nofp.cz12a_c24r64 - MySQL 5.6.51 with the cz12a_c24r64 config
- my5744_rel_o2nofp.cz12a_c24r64 - MySQL 5.7.44 with the cz12a_c24r64 config
- my8044_rel_o2nofp.cz12a_c24r64 - MySQL 8.0.44 with the cz12a_c24r64 config
- my8407_rel_o2nofp.cz12a_c24r64 - MySQL 8.4.7 with the cz12a_c24r64 config
- my9400_rel_o2nofp.cz12a_c24r64 - MySQL 9.4.0 with the cz12a_c24r64 config
- my9500_rel_o2nofp.cz13a_c24r64 - MySQL 9.5.0 with the cz13a_c24r64 config
Contents
- Summary
- l.i0: load without secondary indexes
- l.x: create secondary indexes
- l.i1: continue load after secondary indexes created with 50 inserts per transaction
- l.i2: continue load after secondary indexes created with 5 inserts per transaction
- qr100.L1: range queries with 100 insert/s per client
- qp100.L2: point queries with 100 insert/s per client
- qr500.L3: range queries with 500 insert/s per client
- qp500.L4: point queries with 500 insert/s per client
- qr1000.L5: range queries with 1000 insert/s per client
- qp1000.L6: point queries with 1000 insert/s per client
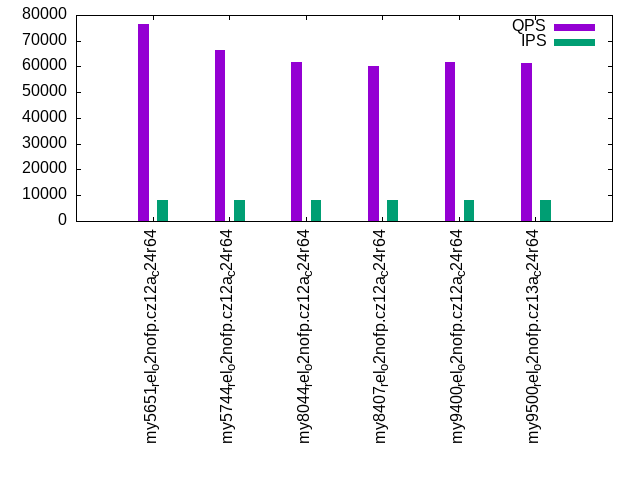
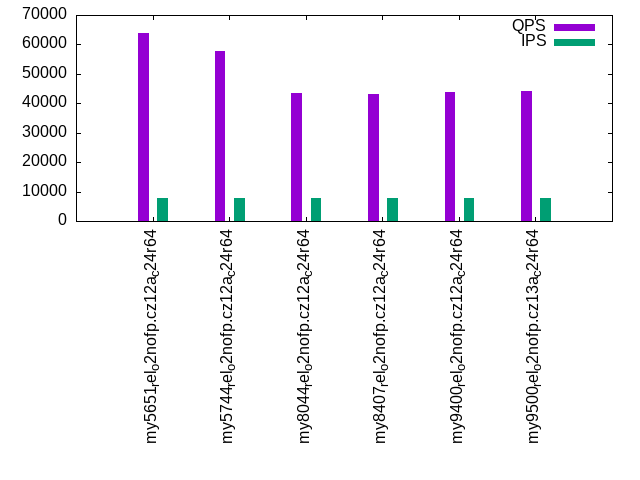
Summary
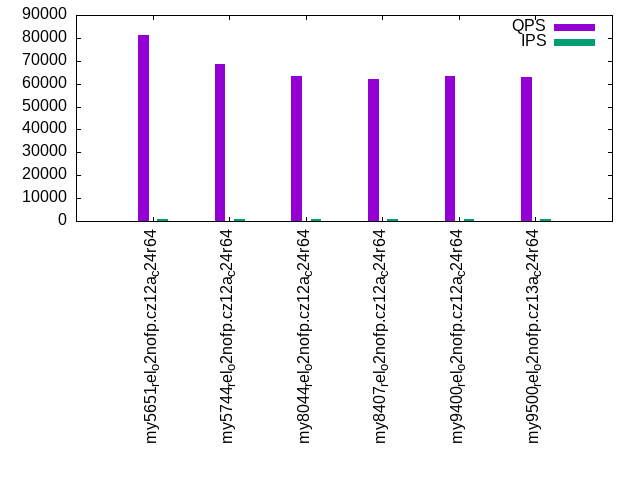
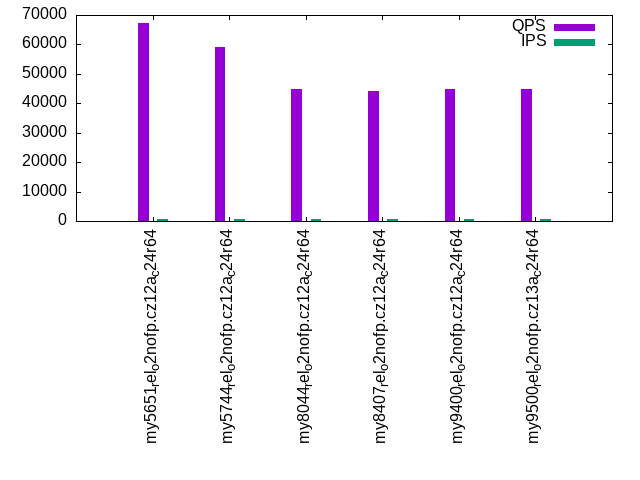
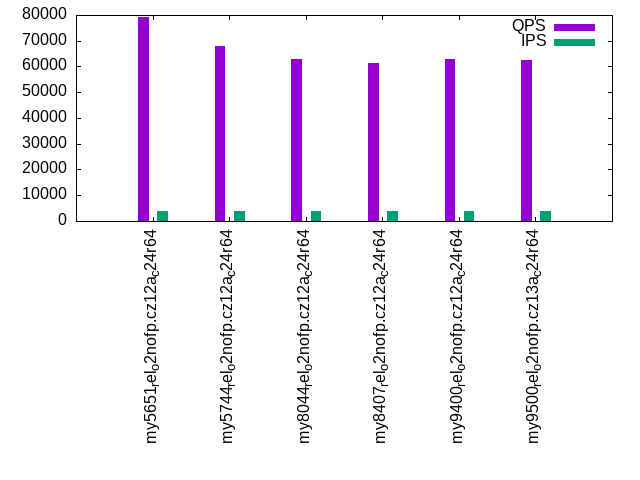
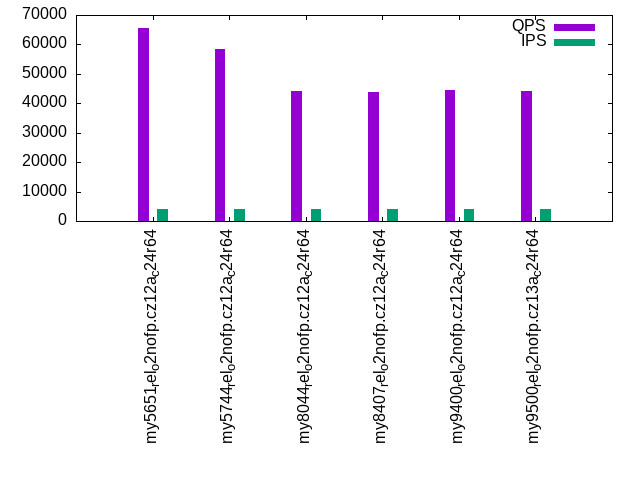
The numbers are inserts/s for l.i0, l.i1 and l.i2, indexed docs (or rows) /s for l.x and queries/s for qr100, qp100 thru qr1000, qp1000" The values are the average rate over the entire test for inserts (IPS) and queries (QPS). The range of values for IPS and QPS is split into 3 parts: bottom 25%, middle 50%, top 25%. Values in the bottom 25% have a red background, values in the top 25% have a green background and values in the middle have no color. A gray background is used for values that can be ignored because the DBMS did not sustain the target insert rate. Red backgrounds are not used when the minimum value is within 80% of the max value.
| dbms | l.i0 | l.x | l.i1 | l.i2 | qr100 | qp100 | qr500 | qp500 | qr1000 | qp1000 |
|---|---|---|---|---|---|---|---|---|---|---|
| my5651_rel_o2nofp.cz12a_c24r64 | 490798 | 365297 | 57736 | 37603 | 81244 | 67356 | 79062 | 65649 | 76472 | 64046 |
| my5744_rel_o2nofp.cz12a_c24r64 | 496894 | 1052633 | 84768 | 53244 | 68643 | 59281 | 67989 | 58510 | 66585 | 57803 |
| my8044_rel_o2nofp.cz12a_c24r64 | 470588 | 1038962 | 120869 | 53963 | 63497 | 44909 | 62878 | 44271 | 61859 | 43627 |
| my8407_rel_o2nofp.cz12a_c24r64 | 467836 | 1025642 | 119738 | 53782 | 61985 | 44306 | 61535 | 43764 | 60208 | 43030 |
| my9400_rel_o2nofp.cz12a_c24r64 | 454545 | 1038962 | 93091 | 50955 | 63519 | 44922 | 62976 | 44358 | 61766 | 43796 |
| my9500_rel_o2nofp.cz13a_c24r64 | 459770 | 1025642 | 96096 | 50713 | 62928 | 44873 | 62401 | 44208 | 61407 | 44144 |
This table has relative throughput, throughput for the DBMS relative to the DBMS in the first line, using the absolute throughput from the previous table. Values less than 0.95 have a yellow background. Values greater than 1.05 have a blue background.
| dbms | l.i0 | l.x | l.i1 | l.i2 | qr100 | qp100 | qr500 | qp500 | qr1000 | qp1000 |
|---|---|---|---|---|---|---|---|---|---|---|
| my5651_rel_o2nofp.cz12a_c24r64 | 1.00 | 1.00 | 1.00 | 1.00 | 1.00 | 1.00 | 1.00 | 1.00 | 1.00 | 1.00 |
| my5744_rel_o2nofp.cz12a_c24r64 | 1.01 | 2.88 | 1.47 | 1.42 | 0.84 | 0.88 | 0.86 | 0.89 | 0.87 | 0.90 |
| my8044_rel_o2nofp.cz12a_c24r64 | 0.96 | 2.84 | 2.09 | 1.44 | 0.78 | 0.67 | 0.80 | 0.67 | 0.81 | 0.68 |
| my8407_rel_o2nofp.cz12a_c24r64 | 0.95 | 2.81 | 2.07 | 1.43 | 0.76 | 0.66 | 0.78 | 0.67 | 0.79 | 0.67 |
| my9400_rel_o2nofp.cz12a_c24r64 | 0.93 | 2.84 | 1.61 | 1.36 | 0.78 | 0.67 | 0.80 | 0.68 | 0.81 | 0.68 |
| my9500_rel_o2nofp.cz13a_c24r64 | 0.94 | 2.81 | 1.66 | 1.35 | 0.77 | 0.67 | 0.79 | 0.67 | 0.80 | 0.69 |
This lists the average rate of inserts/s for the tests that do inserts concurrent with queries. For such tests the query rate is listed in the table above. The read+write tests are setup so that the insert rate should match the target rate every second. Cells that are not at least 95% of the target have a red background to indicate a failure to satisfy the target.
| dbms | qr100.L1 | qp100.L2 | qr500.L3 | qp500.L4 | qr1000.L5 | qp1000.L6 |
|---|---|---|---|---|---|---|
| my5651_rel_o2nofp.cz12a_c24r64 | 796 | 797 | 3982 | 3982 | 7969 | 7969 |
| my5744_rel_o2nofp.cz12a_c24r64 | 796 | 797 | 3984 | 3982 | 7965 | 7965 |
| my8044_rel_o2nofp.cz12a_c24r64 | 796 | 796 | 3984 | 3984 | 7969 | 7969 |
| my8407_rel_o2nofp.cz12a_c24r64 | 796 | 797 | 3982 | 3982 | 7969 | 7965 |
| my9400_rel_o2nofp.cz12a_c24r64 | 797 | 797 | 3982 | 3984 | 7965 | 7960 |
| my9500_rel_o2nofp.cz13a_c24r64 | 797 | 797 | 3982 | 3984 | 7969 | 7938 |
| target | 800 | 800 | 4000 | 4000 | 8000 | 8000 |
l.i0
l.i0: load without secondary indexes. Graphs for performance per 1-second interval are here.
Average throughput:

Insert response time histogram: each cell has the percentage of responses that take <= the time in the header and max is the max response time in seconds. For the max column values in the top 25% of the range have a red background and in the bottom 25% of the range have a green background. The red background is not used when the min value is within 80% of the max value.
| dbms | 256us | 1ms | 4ms | 16ms | 64ms | 256ms | 1s | 4s | 16s | gt | max |
|---|---|---|---|---|---|---|---|---|---|---|---|
| my5651_rel_o2nofp.cz12a_c24r64 | 3.511 | 96.279 | 0.059 | 0.137 | 0.014 | 0.229 | |||||
| my5744_rel_o2nofp.cz12a_c24r64 | 3.535 | 96.362 | 0.077 | 0.012 | 0.013 | 0.001 | 0.265 | ||||
| my8044_rel_o2nofp.cz12a_c24r64 | 99.793 | 0.179 | 0.014 | 0.011 | 0.003 | 0.262 | |||||
| my8407_rel_o2nofp.cz12a_c24r64 | 99.786 | 0.187 | 0.013 | 0.014 | 0.243 | ||||||
| my9400_rel_o2nofp.cz12a_c24r64 | 99.814 | 0.160 | 0.011 | 0.015 | 0.245 | ||||||
| my9500_rel_o2nofp.cz13a_c24r64 | 99.811 | 0.154 | 0.018 | 0.016 | 0.001 | 0.263 |
Performance metrics for the DBMS listed above. Some are normalized by throughput, others are not. Legend for results is here.
ips	qps	rps	rmbps	wps	wmbps	rpq	rkbpq	wpi	wkbpi	csps	cpups	cspq	cpupq	dbgb1	dbgb2	rss	maxop	p50	p99	tag
490798	0	143	0.6	1456.8	127.7	0.000	0.001	0.003	0.267	62074	39.1	0.126	19	5.3	55.8	8.0	0.229	66592	50794	my5651_rel_o2nofp.cz12a_c24r64
496894	0	0	0.0	1732.4	135.6	0.000	0.000	0.003	0.279	61504	40.5	0.124	20	5.3	55.8	8.7	0.265	71991	52193	my5744_rel_o2nofp.cz12a_c24r64
470588	0	0	0.0	1784.0	136.9	0.000	0.000	0.004	0.298	89025	44.4	0.189	23	5.3	55.9	8.7	0.262	65493	51094	my8044_rel_o2nofp.cz12a_c24r64
467836	0	0	0.0	1769.4	136.3	0.000	0.000	0.004	0.298	89008	44.8	0.190	23	5.3	59.6	8.6	0.243	63892	49891	my8407_rel_o2nofp.cz12a_c24r64
454545	0	0	0.0	1769.1	133.7	0.000	0.000	0.004	0.301	60816	39.9	0.134	21	5.3	59.6	9.4	0.245	64991	44692	my9400_rel_o2nofp.cz12a_c24r64
459770	0	0	0.0	1759.3	135.4	0.000	0.000	0.004	0.302	62170	40.3	0.135	21	5.3	59.6	8.7	0.263	65292	50094	my9500_rel_o2nofp.cz13a_c24r64
Average values from iostat.
r/s	rkB/s	rrqm/s	%rrqm	r_await	rareq-s	w/s	wkB/s	wrqm/s	%wrqm	w_await	wareq-s	d/s	dkB/s	drqm/s	%drqm	d_await	dareq-s	f/s	f_await	aqu-sz	%util
142.7	571.4	0.000	0.000	4.829	3.751	1456.8	130816	21.79	1.821	9.179	100.7	0.369	6.400	0.000	0.000	0.114	4.848	0.000	0.000	12.84	9.189		my5651_rel_o2nofp.cz12a_c24r64
0.462	2.000	0.000	0.000	2.742	4.250	1732.4	138820	70.99	5.308	7.192	87.21	0.856	11.50	0.000	0.000	0.140	3.975	0.000	0.000	12.26	8.435		my5744_rel_o2nofp.cz12a_c24r64
0.424	1.976	0.000	0.000	2.738	4.353	1784.0	140171	76.04	5.811	8.186	85.37	0.418	4.518	0.000	0.000	0.152	5.440	0.000	0.000	15.31	9.047		my8044_rel_o2nofp.cz12a_c24r64
0.400	1.671	0.000	0.000	2.902	4.000	1769.4	139607	76.71	5.918	8.452	85.70	0.471	7.129	0.000	0.000	0.160	5.343	0.000	0.000	15.54	9.024		my8407_rel_o2nofp.cz12a_c24r64
0.389	1.691	0.000	0.000	2.347	3.943	1769.1	136931	71.68	5.573	7.251	84.08	0.617	9.920	0.000	0.000	0.166	6.520	0.000	0.000	13.55	8.893		my9400_rel_o2nofp.cz12a_c24r64
0.453	2.235	0.000	0.000	3.529	4.206	1759.3	138623	72.90	5.667	7.551	85.66	0.518	22.85	0.000	0.000	0.145	14.44	0.000	0.000	14.17	8.847		my9500_rel_o2nofp.cz13a_c24r64
l.x
l.x: create secondary indexes.
Average throughput:

Performance metrics for the DBMS listed above. Some are normalized by throughput, others are not. Legend for results is here.
ips	qps	rps	rmbps	wps	wmbps	rpq	rkbpq	wpi	wkbpi	csps	cpups	cspq	cpupq	dbgb1	dbgb2	rss	maxop	p50	p99	tag
365297	0	0	0.0	26341.1	790.7	0.000	0.000	0.072	2.216	51939	30.3	0.142	20	11.2	61.7	14.2	0.002	NA	NA	my5651_rel_o2nofp.cz12a_c24r64
1052633	0	1	0.0	17432.1	935.7	0.000	0.000	0.017	0.910	83989	29.3	0.080	7	12.2	62.7	12.9	0.040	NA	NA	my5744_rel_o2nofp.cz12a_c24r64
1038962	0	27	0.7	32140.2	1224.9	0.000	0.001	0.031	1.207	67178	62.0	0.065	14	12.1	62.8	12.1	0.005	NA	NA	my8044_rel_o2nofp.cz12a_c24r64
1025642	0	24	0.8	31439.9	1216.4	0.000	0.001	0.031	1.214	69039	64.5	0.067	15	12.1	66.5	11.8	0.005	NA	NA	my8407_rel_o2nofp.cz12a_c24r64
1038962	0	26	0.7	32711.7	1235.8	0.000	0.001	0.031	1.218	66304	59.0	0.064	14	12.1	66.5	12.0	0.002	NA	NA	my9400_rel_o2nofp.cz12a_c24r64
1025642	0	28	0.8	31895.6	1223.3	0.000	0.001	0.031	1.221	69228	62.3	0.067	15	12.1	66.5	12.1	0.002	NA	NA	my9500_rel_o2nofp.cz13a_c24r64
Average values from iostat.
r/s	rkB/s	rrqm/s	%rrqm	r_await	rareq-s	w/s	wkB/s	wrqm/s	%wrqm	w_await	wareq-s	d/s	dkB/s	drqm/s	%drqm	d_await	dareq-s	f/s	f_await	aqu-sz	%util
0.314	1.363	0.000	0.000	0.104	3.273	26341.1	809667	2851.9	8.785	0.297	38.08	3.867	31351.2	0.000	0.000	0.116	2754.4	0.000	0.000	4.415	45.39		my5651_rel_o2nofp.cz12a_c24r64
0.800	3.200	0.000	0.000	0.121	3.733	17432.1	958187	197.2	1.013	0.588	55.33	11.63	86001.1	0.000	0.000	0.268	4587.3	0.000	0.000	11.52	56.56		my5744_rel_o2nofp.cz12a_c24r64
26.78	731.8	0.000	0.000	0.496	27.30	32140.2	1254323	254.3	1.109	6.521	50.90	46.35	172713	0.000	0.000	0.857	2849.0	0.000	0.000	147.7	86.82		my8044_rel_o2nofp.cz12a_c24r64
23.92	804.2	0.000	0.000	0.313	31.82	31439.9	1245636	240.2	1.175	6.367	51.43	45.85	172629	0.027	0.031	1.053	2866.5	0.000	0.000	148.1	86.66		my8407_rel_o2nofp.cz12a_c24r64
26.16	720.8	0.000	0.000	0.281	27.98	32711.7	1265467	224.6	1.033	7.187	51.24	46.47	172706	0.000	0.000	1.433	2868.2	0.000	0.000	166.0	87.85		my9400_rel_o2nofp.cz12a_c24r64
27.84	857.1	0.000	0.000	0.448	31.29	31895.6	1252656	231.4	1.047	5.851	50.56	45.51	172627	0.000	0.000	0.637	2894.1	0.000	0.000	135.5	86.03		my9500_rel_o2nofp.cz13a_c24r64
l.i1
l.i1: continue load after secondary indexes created with 50 inserts per transaction. Graphs for performance per 1-second interval are here.
Average throughput:

Insert response time histogram: each cell has the percentage of responses that take <= the time in the header and max is the max response time in seconds. For the max column values in the top 25% of the range have a red background and in the bottom 25% of the range have a green background. The red background is not used when the min value is within 80% of the max value.
| dbms | 256us | 1ms | 4ms | 16ms | 64ms | 256ms | 1s | 4s | 16s | gt | max |
|---|---|---|---|---|---|---|---|---|---|---|---|
| my5651_rel_o2nofp.cz12a_c24r64 | 1.127 | 98.001 | 0.812 | 0.060 | nonzero | 0.271 | |||||
| my5744_rel_o2nofp.cz12a_c24r64 | 50.356 | 49.592 | 0.036 | 0.016 | 0.256 | ||||||
| my8044_rel_o2nofp.cz12a_c24r64 | 94.906 | 4.454 | 0.614 | 0.021 | 0.004 | 0.349 | |||||
| my8407_rel_o2nofp.cz12a_c24r64 | 94.673 | 4.662 | 0.642 | 0.018 | 0.006 | 0.433 | |||||
| my9400_rel_o2nofp.cz12a_c24r64 | 95.260 | 3.021 | 0.652 | 1.062 | 0.005 | 0.384 | |||||
| my9500_rel_o2nofp.cz13a_c24r64 | 95.471 | 2.913 | 0.656 | 0.957 | 0.003 | 0.378 |
Delete response time histogram: each cell has the percentage of responses that take <= the time in the header and max is the max response time in seconds. For the max column values in the top 25% of the range have a red background and in the bottom 25% of the range have a green background. The red background is not used when the min value is within 80% of the max value.
| dbms | 256us | 1ms | 4ms | 16ms | 64ms | 256ms | 1s | 4s | 16s | gt | max |
|---|---|---|---|---|---|---|---|---|---|---|---|
| my5651_rel_o2nofp.cz12a_c24r64 | 4.276 | 95.014 | 0.661 | 0.049 | nonzero | 0.259 | |||||
| my5744_rel_o2nofp.cz12a_c24r64 | 42.056 | 57.907 | 0.024 | 0.014 | 0.252 | ||||||
| my8044_rel_o2nofp.cz12a_c24r64 | 97.277 | 2.309 | 0.394 | 0.016 | 0.004 | 0.350 | |||||
| my8407_rel_o2nofp.cz12a_c24r64 | 97.219 | 2.354 | 0.407 | 0.015 | 0.005 | 0.439 | |||||
| my9400_rel_o2nofp.cz12a_c24r64 | 97.106 | 1.489 | 0.398 | 1.003 | 0.004 | 0.386 | |||||
| my9500_rel_o2nofp.cz13a_c24r64 | 97.278 | 1.414 | 0.404 | 0.902 | 0.003 | 0.376 |
Performance metrics for the DBMS listed above. Some are normalized by throughput, others are not. Legend for results is here.
ips	qps	rps	rmbps	wps	wmbps	rpq	rkbpq	wpi	wkbpi	csps	cpups	cspq	cpupq	dbgb1	dbgb2	rss	maxop	p50	p99	tag
57736	0	1494	5.8	3908.1	156.8	0.026	0.104	0.068	2.782	140801	73.0	2.439	303	19.0	69.8	22.5	0.271	7099	3799	my5651_rel_o2nofp.cz12a_c24r64
84768	0	0	0.0	4960.7	191.9	0.000	0.000	0.059	2.318	47724	87.0	0.563	246	20.0	71.2	24.0	0.256	11987	8299	my5744_rel_o2nofp.cz12a_c24r64
120869	0	366	5.7	6695.0	272.8	0.003	0.048	0.055	2.311	105852	81.6	0.876	162	20.1	71.9	24.6	0.349	15875	4949	my8044_rel_o2nofp.cz12a_c24r64
119738	0	362	5.7	6735.1	274.4	0.003	0.048	0.056	2.347	104437	81.5	0.872	163	19.9	87.7	24.3	0.433	15598	5949	my8407_rel_o2nofp.cz12a_c24r64
93091	0	281	4.4	6957.1	293.8	0.003	0.048	0.075	3.231	56407	63.0	0.606	162	18.1	85.3	22.3	0.384	11848	5799	my9400_rel_o2nofp.cz12a_c24r64
96096	0	290	4.5	7052.5	298.0	0.003	0.048	0.073	3.176	58961	64.8	0.614	162	18.1	85.3	22.4	0.378	12248	5749	my9500_rel_o2nofp.cz13a_c24r64
Average values from iostat.
r/s	rkB/s	rrqm/s	%rrqm	r_await	rareq-s	w/s	wkB/s	wrqm/s	%wrqm	w_await	wareq-s	d/s	dkB/s	drqm/s	%drqm	d_await	dareq-s	f/s	f_await	aqu-sz	%util
1494.2	5976.8	0.000	0.000	0.086	3.648	3908.1	160592	72.27	1.825	1.329	41.20	0.102	1.885	0.000	0.000	0.063	4.530	0.000	0.000	5.220	18.95		my5651_rel_o2nofp.cz12a_c24r64
0.125	0.527	0.007	0.255	1.097	1.276	4960.7	196512	101.4	1.997	1.173	39.52	0.140	0.882	0.000	0.000	0.046	0.960	0.000	0.000	5.977	11.22		my5744_rel_o2nofp.cz12a_c24r64
365.9	5852.1	0.000	0.000	1.497	10.28	6695.0	279301	44.71	0.656	7.743	42.51	0.191	20.41	0.000	0.000	0.085	26.84	0.000	0.000	50.73	20.27		my8044_rel_o2nofp.cz12a_c24r64
362.4	5796.5	0.000	0.000	1.205	10.28	6735.1	281023	49.58	0.714	7.722	42.58	0.216	14.05	0.000	0.000	0.087	13.00	0.000	0.000	50.84	20.31		my8407_rel_o2nofp.cz12a_c24r64
280.7	4489.8	0.000	0.000	0.831	10.14	6957.1	300813	26.93	0.356	8.229	43.93	0.148	10.21	0.000	0.000	0.060	12.04	0.000	0.000	56.23	21.54		my9400_rel_o2nofp.cz12a_c24r64
290.2	4641.9	0.000	0.000	1.018	10.25	7052.5	305191	28.15	0.375	8.195	43.97	0.159	14.79	0.000	0.000	0.058	17.70	0.000	0.000	56.92	21.80		my9500_rel_o2nofp.cz13a_c24r64
l.i2
l.i2: continue load after secondary indexes created with 5 inserts per transaction. Graphs for performance per 1-second interval are here.
Average throughput:

Insert response time histogram: each cell has the percentage of responses that take <= the time in the header and max is the max response time in seconds. For the max column values in the top 25% of the range have a red background and in the bottom 25% of the range have a green background. The red background is not used when the min value is within 80% of the max value.
| dbms | 256us | 1ms | 4ms | 16ms | 64ms | 256ms | 1s | 4s | 16s | gt | max |
|---|---|---|---|---|---|---|---|---|---|---|---|
| my5651_rel_o2nofp.cz12a_c24r64 | 0.026 | 63.716 | 35.999 | 0.052 | 0.206 | 0.001 | 0.077 | ||||
| my5744_rel_o2nofp.cz12a_c24r64 | 0.077 | 92.434 | 7.343 | 0.024 | 0.119 | 0.003 | 0.235 | ||||
| my8044_rel_o2nofp.cz12a_c24r64 | nonzero | 93.796 | 5.856 | 0.280 | 0.065 | 0.002 | 0.001 | 0.319 | |||
| my8407_rel_o2nofp.cz12a_c24r64 | 93.696 | 6.041 | 0.192 | 0.068 | 0.002 | 0.001 | 0.321 | ||||
| my9400_rel_o2nofp.cz12a_c24r64 | 96.698 | 3.065 | 0.062 | 0.045 | 0.128 | 0.001 | 0.296 | ||||
| my9500_rel_o2nofp.cz13a_c24r64 | 96.920 | 2.835 | 0.060 | 0.048 | 0.138 | nonzero | 0.298 |
Delete response time histogram: each cell has the percentage of responses that take <= the time in the header and max is the max response time in seconds. For the max column values in the top 25% of the range have a red background and in the bottom 25% of the range have a green background. The red background is not used when the min value is within 80% of the max value.
| dbms | 256us | 1ms | 4ms | 16ms | 64ms | 256ms | 1s | 4s | 16s | gt | max |
|---|---|---|---|---|---|---|---|---|---|---|---|
| my5651_rel_o2nofp.cz12a_c24r64 | 0.032 | 64.324 | 35.386 | 0.051 | 0.206 | 0.001 | 0.076 | ||||
| my5744_rel_o2nofp.cz12a_c24r64 | 0.074 | 91.718 | 8.066 | 0.020 | 0.119 | 0.003 | 0.235 | ||||
| my8044_rel_o2nofp.cz12a_c24r64 | 0.007 | 94.824 | 4.871 | 0.244 | 0.051 | 0.002 | 0.001 | 0.320 | |||
| my8407_rel_o2nofp.cz12a_c24r64 | nonzero | 94.859 | 4.927 | 0.155 | 0.056 | 0.002 | 0.001 | 0.320 | |||
| my9400_rel_o2nofp.cz12a_c24r64 | nonzero | 97.289 | 2.496 | 0.052 | 0.035 | 0.127 | 0.001 | 0.294 | |||
| my9500_rel_o2nofp.cz13a_c24r64 | 0.004 | 97.361 | 2.409 | 0.051 | 0.038 | 0.137 | nonzero | 0.297 |
Performance metrics for the DBMS listed above. Some are normalized by throughput, others are not. Legend for results is here.
ips	qps	rps	rmbps	wps	wmbps	rpq	rkbpq	wpi	wkbpi	csps	cpups	cspq	cpupq	dbgb1	dbgb2	rss	maxop	p50	p99	tag
37603	0	5937	23.2	3378.8	131.7	0.158	0.632	0.090	3.586	241716	76.5	6.428	488	19.0	69.8	22.6	0.077	4894	170	my5651_rel_o2nofp.cz12a_c24r64
53244	0	0	0.0	4789.2	187.9	0.000	0.000	0.090	3.613	231359	76.2	4.345	343	20.0	71.2	24.3	0.235	7224	185	my5744_rel_o2nofp.cz12a_c24r64
53963	0	0	0.0	5079.9	200.9	0.000	0.000	0.094	3.813	295349	72.4	5.473	322	20.1	71.9	24.8	0.319	7354	1225	my8044_rel_o2nofp.cz12a_c24r64
53782	0	0	0.0	5064.6	199.9	0.000	0.000	0.094	3.806	295766	71.8	5.499	320	19.9	93.9	24.5	0.321	7204	1300	my8407_rel_o2nofp.cz12a_c24r64
50955	0	0	0.0	4337.2	174.2	0.000	0.000	0.085	3.501	252009	60.1	4.946	283	18.1	91.4	22.3	0.296	6434	4178	my9400_rel_o2nofp.cz12a_c24r64
50713	0	0	0.0	4331.2	173.6	0.000	0.000	0.085	3.506	249503	58.9	4.920	279	18.1	91.5	22.5	0.298	6504	840	my9500_rel_o2nofp.cz13a_c24r64
Average values from iostat.
r/s	rkB/s	rrqm/s	%rrqm	r_await	rareq-s	w/s	wkB/s	wrqm/s	%wrqm	w_await	wareq-s	d/s	dkB/s	drqm/s	%drqm	d_await	dareq-s	f/s	f_await	aqu-sz	%util
5936.7	23746.8	0.000	0.000	0.021	4.000	3378.8	134851	47.38	1.384	0.931	39.91	0.135	1.398	0.000	0.000	0.067	2.063	0.000	0.000	3.262	17.27		my5651_rel_o2nofp.cz12a_c24r64
0.085	0.340	0.000	0.000	1.935	0.867	4789.2	192362	63.95	1.325	1.423	40.12	0.158	1.313	0.000	0.000	0.059	1.363	0.000	0.000	6.941	11.46		my5744_rel_o2nofp.cz12a_c24r64
0.075	0.298	0.000	0.000	0.977	1.085	5079.9	205742	3.151	0.061	8.232	40.50	0.125	5.925	0.000	0.000	0.063	6.503	0.000	0.000	41.97	14.26		my8044_rel_o2nofp.cz12a_c24r64
0.121	0.484	0.000	0.000	1.858	1.445	5064.6	204716	3.333	0.065	7.845	40.40	0.163	6.205	0.000	0.000	0.058	6.769	0.000	0.000	39.87	14.13		my8407_rel_o2nofp.cz12a_c24r64
0.107	0.429	0.000	0.000	2.186	1.376	4337.2	178416	3.202	0.072	7.281	41.12	0.195	14.04	0.000	0.000	0.063	14.64	0.000	0.000	31.72	12.13		my9400_rel_o2nofp.cz12a_c24r64
0.090	0.362	0.000	0.000	2.220	1.143	4331.2	177797	3.271	0.073	7.337	41.07	0.163	3.581	0.000	0.000	0.069	3.148	0.000	0.000	31.88	12.09		my9500_rel_o2nofp.cz13a_c24r64
qr100.L1
qr100.L1: range queries with 100 insert/s per client. Graphs for performance per 1-second interval are here.
Average throughput:
Query response time histogram: each cell has the percentage of responses that take <= the time in the header and max is the max response time in seconds. For max values in the top 25% of the range have a red background and in the bottom 25% of the range have a green background. The red background is not used when the min value is within 80% of the max value.
| dbms | 256us | 1ms | 4ms | 16ms | 64ms | 256ms | 1s | 4s | 16s | gt | max |
|---|---|---|---|---|---|---|---|---|---|---|---|
| my5651_rel_o2nofp.cz12a_c24r64 | 99.969 | 0.029 | 0.002 | nonzero | 0.008 | ||||||
| my5744_rel_o2nofp.cz12a_c24r64 | 99.988 | 0.012 | nonzero | nonzero | 0.009 | ||||||
| my8044_rel_o2nofp.cz12a_c24r64 | 99.982 | 0.018 | nonzero | 0.004 | |||||||
| my8407_rel_o2nofp.cz12a_c24r64 | 99.974 | 0.026 | nonzero | 0.004 | |||||||
| my9400_rel_o2nofp.cz12a_c24r64 | 99.981 | 0.019 | nonzero | nonzero | 0.004 | ||||||
| my9500_rel_o2nofp.cz13a_c24r64 | 99.978 | 0.022 | nonzero | nonzero | 0.007 |
Insert response time histogram: each cell has the percentage of responses that take <= the time in the header and max is the max response time in seconds. For max values in the top 25% of the range have a red background and in the bottom 25% of the range have a green background. The red background is not used when the min value is within 80% of the max value.
| dbms | 256us | 1ms | 4ms | 16ms | 64ms | 256ms | 1s | 4s | 16s | gt | max |
|---|---|---|---|---|---|---|---|---|---|---|---|
| my5651_rel_o2nofp.cz12a_c24r64 | 70.306 | 29.691 | 0.003 | 0.017 | |||||||
| my5744_rel_o2nofp.cz12a_c24r64 | 99.188 | 0.812 | 0.009 | ||||||||
| my8044_rel_o2nofp.cz12a_c24r64 | 99.899 | 0.101 | 0.005 | ||||||||
| my8407_rel_o2nofp.cz12a_c24r64 | 99.840 | 0.160 | 0.005 | ||||||||
| my9400_rel_o2nofp.cz12a_c24r64 | 99.597 | 0.128 | 0.274 | 0.105 | |||||||
| my9500_rel_o2nofp.cz13a_c24r64 | 99.920 | 0.007 | 0.021 | 0.052 | 0.104 |
Delete response time histogram: each cell has the percentage of responses that take <= the time in the header and max is the max response time in seconds. For max values in the top 25% of the range have a red background and in the bottom 25% of the range have a green background. The red background is not used when the min value is within 80% of the max value.
| dbms | 256us | 1ms | 4ms | 16ms | 64ms | 256ms | 1s | 4s | 16s | gt | max |
|---|---|---|---|---|---|---|---|---|---|---|---|
| my5651_rel_o2nofp.cz12a_c24r64 | 84.774 | 15.215 | 0.010 | 0.018 | |||||||
| my5744_rel_o2nofp.cz12a_c24r64 | 99.490 | 0.510 | 0.010 | ||||||||
| my8044_rel_o2nofp.cz12a_c24r64 | 99.958 | 0.042 | 0.004 | ||||||||
| my8407_rel_o2nofp.cz12a_c24r64 | 99.931 | 0.069 | 0.007 | ||||||||
| my9400_rel_o2nofp.cz12a_c24r64 | 99.712 | 0.035 | 0.253 | 0.104 | |||||||
| my9500_rel_o2nofp.cz13a_c24r64 | 99.931 | 0.021 | 0.049 | 0.102 |
Performance metrics for the DBMS listed above. Some are normalized by throughput, others are not. Legend for results is here.
ips	qps	rps	rmbps	wps	wmbps	rpq	rkbpq	wpi	wkbpi	csps	cpups	cspq	cpupq	dbgb1	dbgb2	rss	maxop	p50	p99	tag
796	81244	28	0.1	4052.9	112.8	0.000	0.001	5.089	145.075	468141	33.8	5.762	100	19.0	69.8	22.6	0.008	10159	9743	my5651_rel_o2nofp.cz12a_c24r64
796	68643	0	0.0	850.9	24.1	0.000	0.000	1.068	30.950	394924	34.5	5.753	121	20.0	71.2	24.3	0.009	8622	8143	my5744_rel_o2nofp.cz12a_c24r64
796	63497	0	0.0	986.7	28.0	0.000	0.000	1.239	35.969	366348	33.7	5.770	127	20.1	71.9	24.8	0.004	7999	7823	my8044_rel_o2nofp.cz12a_c24r64
796	61985	0	0.0	1009.1	28.6	0.000	0.000	1.267	36.767	357719	33.7	5.771	130	19.9	94.0	24.5	0.004	7807	7423	my8407_rel_o2nofp.cz12a_c24r64
797	63519	0	0.0	974.7	27.7	0.000	0.000	1.223	35.536	366046	33.8	5.763	128	18.1	91.6	22.3	0.004	7999	7839	my9400_rel_o2nofp.cz12a_c24r64
797	62928	0	0.0	848.4	24.1	0.000	0.000	1.065	31.028	362292	33.5	5.757	128	18.1	91.6	22.5	0.007	7945	7727	my9500_rel_o2nofp.cz13a_c24r64
Average values from iostat.
r/s	rkB/s	rrqm/s	%rrqm	r_await	rareq-s	w/s	wkB/s	wrqm/s	%wrqm	w_await	wareq-s	d/s	dkB/s	drqm/s	%drqm	d_await	dareq-s	f/s	f_await	aqu-sz	%util
28.26	113.1	0.000	0.000	0.081	4.001	4052.9	115537	14.60	6.727	0.110	34.58	0.001	0.007	0.000	0.000	0.000	0.033	0.000	0.000	0.700	5.325		my5651_rel_o2nofp.cz12a_c24r64
0.004	0.051	0.000	0.000	0.001	0.069	850.9	24648.3	4.751	1.752	0.083	30.16	0.001	0.007	0.000	0.000	0.000	0.033	0.000	0.000	0.101	1.583		my5744_rel_o2nofp.cz12a_c24r64
0.000	0.000	0.000	0.000	0.000	0.000	986.7	28645.6	1.079	0.358	2.699	30.45	0.001	0.816	0.000	0.000	0.003	4.078	0.000	0.000	5.502	2.210		my8044_rel_o2nofp.cz12a_c24r64
0.001	0.004	0.000	0.000	0.003	0.022	1009.1	29281.2	1.133	0.425	2.602	30.71	0.011	0.042	0.000	0.000	0.017	0.188	0.000	0.000	5.642	2.822		my8407_rel_o2nofp.cz12a_c24r64
0.001	0.004	0.000	0.000	0.000	0.022	974.7	28318.4	1.130	0.433	2.592	30.78	0.008	2.185	0.000	0.000	0.009	10.30	0.000	0.000	5.563	1.888		my9400_rel_o2nofp.cz12a_c24r64
0.001	0.004	0.000	0.000	0.000	0.022	848.4	24726.2	1.117	0.468	2.156	31.02	0.008	0.031	0.000	0.000	0.009	0.133	0.000	0.000	4.657	4.165		my9500_rel_o2nofp.cz13a_c24r64
qp100.L2
qp100.L2: point queries with 100 insert/s per client. Graphs for performance per 1-second interval are here.
Average throughput:
Query response time histogram: each cell has the percentage of responses that take <= the time in the header and max is the max response time in seconds. For max values in the top 25% of the range have a red background and in the bottom 25% of the range have a green background. The red background is not used when the min value is within 80% of the max value.
| dbms | 256us | 1ms | 4ms | 16ms | 64ms | 256ms | 1s | 4s | 16s | gt | max |
|---|---|---|---|---|---|---|---|---|---|---|---|
| my5651_rel_o2nofp.cz12a_c24r64 | 99.956 | 0.042 | 0.002 | nonzero | 0.008 | ||||||
| my5744_rel_o2nofp.cz12a_c24r64 | 99.973 | 0.026 | nonzero | nonzero | 0.009 | ||||||
| my8044_rel_o2nofp.cz12a_c24r64 | 99.883 | 0.117 | nonzero | 0.003 | |||||||
| my8407_rel_o2nofp.cz12a_c24r64 | 99.855 | 0.145 | nonzero | nonzero | 0.004 | ||||||
| my9400_rel_o2nofp.cz12a_c24r64 | 99.864 | 0.136 | nonzero | nonzero | 0.005 | ||||||
| my9500_rel_o2nofp.cz13a_c24r64 | 99.871 | 0.129 | nonzero | 0.004 |
Insert response time histogram: each cell has the percentage of responses that take <= the time in the header and max is the max response time in seconds. For max values in the top 25% of the range have a red background and in the bottom 25% of the range have a green background. The red background is not used when the min value is within 80% of the max value.
| dbms | 256us | 1ms | 4ms | 16ms | 64ms | 256ms | 1s | 4s | 16s | gt | max |
|---|---|---|---|---|---|---|---|---|---|---|---|
| my5651_rel_o2nofp.cz12a_c24r64 | 75.625 | 24.354 | 0.021 | 0.019 | |||||||
| my5744_rel_o2nofp.cz12a_c24r64 | 99.792 | 0.208 | 0.006 | ||||||||
| my8044_rel_o2nofp.cz12a_c24r64 | 99.840 | 0.160 | 0.014 | ||||||||
| my8407_rel_o2nofp.cz12a_c24r64 | 99.906 | 0.094 | 0.006 | ||||||||
| my9400_rel_o2nofp.cz12a_c24r64 | 99.649 | 0.184 | 0.167 | 0.107 | |||||||
| my9500_rel_o2nofp.cz13a_c24r64 | 99.486 | 0.236 | 0.278 | 0.105 |
Delete response time histogram: each cell has the percentage of responses that take <= the time in the header and max is the max response time in seconds. For max values in the top 25% of the range have a red background and in the bottom 25% of the range have a green background. The red background is not used when the min value is within 80% of the max value.
| dbms | 256us | 1ms | 4ms | 16ms | 64ms | 256ms | 1s | 4s | 16s | gt | max |
|---|---|---|---|---|---|---|---|---|---|---|---|
| my5651_rel_o2nofp.cz12a_c24r64 | 87.208 | 12.785 | 0.007 | 0.017 | |||||||
| my5744_rel_o2nofp.cz12a_c24r64 | 99.892 | 0.108 | 0.005 | ||||||||
| my8044_rel_o2nofp.cz12a_c24r64 | 99.927 | 0.073 | 0.013 | ||||||||
| my8407_rel_o2nofp.cz12a_c24r64 | 99.997 | 0.003 | 0.004 | ||||||||
| my9400_rel_o2nofp.cz12a_c24r64 | 99.753 | 0.080 | 0.167 | 0.107 | |||||||
| my9500_rel_o2nofp.cz13a_c24r64 | 99.708 | 0.028 | 0.264 | 0.105 |
Performance metrics for the DBMS listed above. Some are normalized by throughput, others are not. Legend for results is here.
ips	qps	rps	rmbps	wps	wmbps	rpq	rkbpq	wpi	wkbpi	csps	cpups	cspq	cpupq	dbgb1	dbgb2	rss	maxop	p50	p99	tag
797	67356	29	0.1	4563.9	127.0	0.000	0.002	5.727	163.150	392496	33.7	5.827	120	19.0	69.8	22.6	0.008	8446	7967	my5651_rel_o2nofp.cz12a_c24r64
797	59281	0	0.0	78.6	2.6	0.000	0.000	0.099	3.365	344053	34.3	5.804	139	20.0	71.2	24.3	0.009	7503	7119	my5744_rel_o2nofp.cz12a_c24r64
796	44909	0	0.0	81.0	2.8	0.000	0.000	0.102	3.645	261687	33.4	5.827	178	20.1	71.9	24.8	0.003	5647	5215	my8044_rel_o2nofp.cz12a_c24r64
797	44306	0	0.0	88.5	3.0	0.000	0.000	0.111	3.884	257804	33.3	5.819	180	19.9	94.2	24.5	0.004	5567	5151	my8407_rel_o2nofp.cz12a_c24r64
797	44922	0	0.0	111.1	3.6	0.000	0.000	0.139	4.681	263529	33.3	5.866	178	18.1	91.7	22.3	0.005	5647	5343	my9400_rel_o2nofp.cz12a_c24r64
797	44873	0	0.0	83.8	2.9	0.000	0.000	0.105	3.785	260486	33.3	5.805	178	18.1	91.7	22.5	0.004	5647	5231	my9500_rel_o2nofp.cz13a_c24r64
Average values from iostat.
r/s	rkB/s	rrqm/s	%rrqm	r_await	rareq-s	w/s	wkB/s	wrqm/s	%wrqm	w_await	wareq-s	d/s	dkB/s	drqm/s	%drqm	d_await	dareq-s	f/s	f_await	aqu-sz	%util
28.92	115.7	0.000	0.000	0.090	4.000	4563.9	130014	16.30	6.996	0.126	35.77	0.011	0.133	0.000	0.000	0.014	0.665	0.000	0.000	0.800	5.861		my5651_rel_o2nofp.cz12a_c24r64
0.000	0.000	0.000	0.000	0.000	0.000	78.57	2681.5	5.121	6.627	0.042	34.74	0.002	0.020	0.000	0.000	0.000	0.100	0.000	0.000	0.001	0.210		my5744_rel_o2nofp.cz12a_c24r64
0.001	0.002	0.000	0.000	0.000	0.011	80.98	2902.7	1.081	1.386	0.213	36.35	0.002	1.631	0.000	0.000	0.006	8.155	0.000	0.000	0.020	62.17		my8044_rel_o2nofp.cz12a_c24r64
0.001	0.004	0.000	0.000	0.000	0.022	88.47	3095.1	1.105	1.287	0.234	35.38	0.019	0.078	0.000	0.000	0.030	0.388	0.000	0.000	0.022	43.58		my8407_rel_o2nofp.cz12a_c24r64
0.001	0.004	0.000	0.000	0.000	0.022	111.1	3730.0	1.085	0.981	0.389	33.63	0.004	1.454	0.000	0.000	0.006	7.269	0.000	0.000	0.044	5.743		my9400_rel_o2nofp.cz12a_c24r64
0.001	0.004	0.000	0.000	0.000	0.022	83.78	3015.9	1.088	1.331	0.262	36.37	0.004	0.018	0.000	0.000	0.006	0.089	0.000	0.000	0.023	0.142		my9500_rel_o2nofp.cz13a_c24r64
qr500.L3
qr500.L3: range queries with 500 insert/s per client. Graphs for performance per 1-second interval are here.
Average throughput:
Query response time histogram: each cell has the percentage of responses that take <= the time in the header and max is the max response time in seconds. For max values in the top 25% of the range have a red background and in the bottom 25% of the range have a green background. The red background is not used when the min value is within 80% of the max value.
| dbms | 256us | 1ms | 4ms | 16ms | 64ms | 256ms | 1s | 4s | 16s | gt | max |
|---|---|---|---|---|---|---|---|---|---|---|---|
| my5651_rel_o2nofp.cz12a_c24r64 | 99.843 | 0.151 | 0.006 | nonzero | 0.007 | ||||||
| my5744_rel_o2nofp.cz12a_c24r64 | 99.967 | 0.031 | 0.001 | nonzero | 0.009 | ||||||
| my8044_rel_o2nofp.cz12a_c24r64 | 99.951 | 0.048 | 0.001 | nonzero | 0.005 | ||||||
| my8407_rel_o2nofp.cz12a_c24r64 | 99.938 | 0.060 | 0.001 | nonzero | 0.005 | ||||||
| my9400_rel_o2nofp.cz12a_c24r64 | 99.958 | 0.041 | 0.001 | nonzero | 0.006 | ||||||
| my9500_rel_o2nofp.cz13a_c24r64 | 99.959 | 0.041 | 0.001 | nonzero | 0.006 |
Insert response time histogram: each cell has the percentage of responses that take <= the time in the header and max is the max response time in seconds. For max values in the top 25% of the range have a red background and in the bottom 25% of the range have a green background. The red background is not used when the min value is within 80% of the max value.
| dbms | 256us | 1ms | 4ms | 16ms | 64ms | 256ms | 1s | 4s | 16s | gt | max |
|---|---|---|---|---|---|---|---|---|---|---|---|
| my5651_rel_o2nofp.cz12a_c24r64 | 58.472 | 41.518 | 0.010 | 0.023 | |||||||
| my5744_rel_o2nofp.cz12a_c24r64 | 96.119 | 3.881 | 0.012 | ||||||||
| my8044_rel_o2nofp.cz12a_c24r64 | 98.448 | 1.552 | 0.012 | ||||||||
| my8407_rel_o2nofp.cz12a_c24r64 | 97.339 | 2.661 | 0.014 | ||||||||
| my9400_rel_o2nofp.cz12a_c24r64 | 99.172 | 0.673 | 0.156 | 0.106 | |||||||
| my9500_rel_o2nofp.cz13a_c24r64 | 99.427 | 0.484 | 0.011 | 0.078 | 0.106 |
Delete response time histogram: each cell has the percentage of responses that take <= the time in the header and max is the max response time in seconds. For max values in the top 25% of the range have a red background and in the bottom 25% of the range have a green background. The red background is not used when the min value is within 80% of the max value.
| dbms | 256us | 1ms | 4ms | 16ms | 64ms | 256ms | 1s | 4s | 16s | gt | max |
|---|---|---|---|---|---|---|---|---|---|---|---|
| my5651_rel_o2nofp.cz12a_c24r64 | 74.569 | 25.423 | 0.008 | 0.025 | |||||||
| my5744_rel_o2nofp.cz12a_c24r64 | 96.943 | 3.057 | 0.011 | ||||||||
| my8044_rel_o2nofp.cz12a_c24r64 | 99.302 | 0.698 | 0.008 | ||||||||
| my8407_rel_o2nofp.cz12a_c24r64 | 98.636 | 1.364 | 0.016 | ||||||||
| my9400_rel_o2nofp.cz12a_c24r64 | 99.490 | 0.358 | 0.151 | 0.105 | |||||||
| my9500_rel_o2nofp.cz13a_c24r64 | 99.673 | 0.250 | 0.008 | 0.069 | 0.106 |
Performance metrics for the DBMS listed above. Some are normalized by throughput, others are not. Legend for results is here.
ips	qps	rps	rmbps	wps	wmbps	rpq	rkbpq	wpi	wkbpi	csps	cpups	cspq	cpupq	dbgb1	dbgb2	rss	maxop	p50	p99	tag
3982	79062	129	0.5	2830.6	81.6	0.002	0.007	0.711	20.993	457995	36.5	5.793	111	19.0	69.8	22.6	0.007	9935	9343	my5651_rel_o2nofp.cz12a_c24r64
3984	67989	0	0.0	452.5	15.8	0.000	0.000	0.114	4.050	391123	36.5	5.753	129	20.0	71.2	24.3	0.009	8574	8431	my5744_rel_o2nofp.cz12a_c24r64
3984	62878	0	0.0	505.1	17.4	0.000	0.000	0.127	4.475	363424	35.3	5.780	135	20.1	71.9	24.8	0.005	7887	7503	my8044_rel_o2nofp.cz12a_c24r64
3982	61535	0	0.0	500.1	17.2	0.000	0.000	0.126	4.432	355506	35.3	5.777	138	19.9	94.9	24.5	0.005	7743	7294	my8407_rel_o2nofp.cz12a_c24r64
3982	62976	0	0.0	495.7	17.2	0.000	0.000	0.124	4.421	363074	35.2	5.765	134	18.1	92.4	22.3	0.006	7919	7423	my9400_rel_o2nofp.cz12a_c24r64
3982	62401	0	0.0	494.3	17.2	0.000	0.000	0.124	4.413	359577	35.3	5.762	136	18.1	92.4	22.5	0.006	7823	7263	my9500_rel_o2nofp.cz13a_c24r64
Average values from iostat.
r/s	rkB/s	rrqm/s	%rrqm	r_await	rareq-s	w/s	wkB/s	wrqm/s	%wrqm	w_await	wareq-s	d/s	dkB/s	drqm/s	%drqm	d_await	dareq-s	f/s	f_await	aqu-sz	%util
128.7	515.0	0.000	0.000	0.074	4.000	2830.6	83598.9	14.64	6.221	0.466	76.80	0.023	0.242	0.000	0.000	0.032	1.160	0.000	0.000	0.510	4.765		my5651_rel_o2nofp.cz12a_c24r64
0.001	0.004	0.000	0.000	0.000	0.022	452.5	16136.8	4.920	1.390	0.213	37.71	0.017	0.131	0.000	0.000	0.019	0.547	0.000	0.000	0.083	0.880		my5744_rel_o2nofp.cz12a_c24r64
0.002	0.007	0.000	0.000	0.000	0.033	505.1	17829.9	1.177	0.282	2.547	36.74	0.017	3.801	0.000	0.000	0.022	15.77	0.000	0.000	1.395	1.288		my8044_rel_o2nofp.cz12a_c24r64
0.006	0.022	0.000	0.000	0.001	0.100	500.1	17649.9	1.346	0.321	2.737	36.81	0.044	0.722	0.000	0.000	0.050	2.033	0.000	0.000	1.530	2.316		my8407_rel_o2nofp.cz12a_c24r64
0.005	0.020	0.000	0.000	0.001	0.078	495.7	17605.7	1.432	0.313	2.822	36.44	0.042	9.618	0.000	0.000	0.045	41.39	0.000	0.000	1.499	1.090		my9400_rel_o2nofp.cz12a_c24r64
0.006	0.022	0.000	0.000	0.006	0.111	494.3	17572.1	1.269	0.324	2.660	37.33	0.052	0.222	0.000	0.000	0.048	0.680	0.000	0.000	1.518	2.777		my9500_rel_o2nofp.cz13a_c24r64
qp500.L4
qp500.L4: point queries with 500 insert/s per client. Graphs for performance per 1-second interval are here.
Average throughput:
Query response time histogram: each cell has the percentage of responses that take <= the time in the header and max is the max response time in seconds. For max values in the top 25% of the range have a red background and in the bottom 25% of the range have a green background. The red background is not used when the min value is within 80% of the max value.
| dbms | 256us | 1ms | 4ms | 16ms | 64ms | 256ms | 1s | 4s | 16s | gt | max |
|---|---|---|---|---|---|---|---|---|---|---|---|
| my5651_rel_o2nofp.cz12a_c24r64 | 99.801 | 0.192 | 0.007 | nonzero | 0.008 | ||||||
| my5744_rel_o2nofp.cz12a_c24r64 | 99.941 | 0.058 | 0.002 | nonzero | 0.009 | ||||||
| my8044_rel_o2nofp.cz12a_c24r64 | 99.555 | 0.444 | 0.001 | nonzero | 0.004 | ||||||
| my8407_rel_o2nofp.cz12a_c24r64 | 99.437 | 0.562 | 0.001 | nonzero | 0.004 | ||||||
| my9400_rel_o2nofp.cz12a_c24r64 | 99.649 | 0.350 | 0.001 | nonzero | 0.005 | ||||||
| my9500_rel_o2nofp.cz13a_c24r64 | 99.455 | 0.543 | 0.002 | nonzero | 0.008 |
Insert response time histogram: each cell has the percentage of responses that take <= the time in the header and max is the max response time in seconds. For max values in the top 25% of the range have a red background and in the bottom 25% of the range have a green background. The red background is not used when the min value is within 80% of the max value.
| dbms | 256us | 1ms | 4ms | 16ms | 64ms | 256ms | 1s | 4s | 16s | gt | max |
|---|---|---|---|---|---|---|---|---|---|---|---|
| my5651_rel_o2nofp.cz12a_c24r64 | 59.773 | 40.212 | 0.015 | 0.021 | |||||||
| my5744_rel_o2nofp.cz12a_c24r64 | 96.585 | 3.414 | 0.001 | 0.017 | |||||||
| my8044_rel_o2nofp.cz12a_c24r64 | 98.572 | 1.428 | 0.009 | ||||||||
| my8407_rel_o2nofp.cz12a_c24r64 | 99.300 | 0.700 | 0.014 | ||||||||
| my9400_rel_o2nofp.cz12a_c24r64 | 99.475 | 0.459 | 0.066 | 0.105 | |||||||
| my9500_rel_o2nofp.cz13a_c24r64 | 98.200 | 1.581 | 0.011 | 0.208 | 0.112 |
Delete response time histogram: each cell has the percentage of responses that take <= the time in the header and max is the max response time in seconds. For max values in the top 25% of the range have a red background and in the bottom 25% of the range have a green background. The red background is not used when the min value is within 80% of the max value.
| dbms | 256us | 1ms | 4ms | 16ms | 64ms | 256ms | 1s | 4s | 16s | gt | max |
|---|---|---|---|---|---|---|---|---|---|---|---|
| my5651_rel_o2nofp.cz12a_c24r64 | 74.811 | 25.184 | 0.005 | 0.018 | |||||||
| my5744_rel_o2nofp.cz12a_c24r64 | 97.485 | 2.514 | 0.001 | 0.017 | |||||||
| my8044_rel_o2nofp.cz12a_c24r64 | 99.422 | 0.578 | 0.012 | ||||||||
| my8407_rel_o2nofp.cz12a_c24r64 | 99.595 | 0.405 | 0.013 | ||||||||
| my9400_rel_o2nofp.cz12a_c24r64 | 99.722 | 0.224 | 0.055 | 0.104 | |||||||
| my9500_rel_o2nofp.cz13a_c24r64 | 98.842 | 0.956 | 0.008 | 0.194 | 0.107 |
Performance metrics for the DBMS listed above. Some are normalized by throughput, others are not. Legend for results is here.
ips	qps	rps	rmbps	wps	wmbps	rpq	rkbpq	wpi	wkbpi	csps	cpups	cspq	cpupq	dbgb1	dbgb2	rss	maxop	p50	p99	tag
3982	65649	129	0.5	3216.8	92.3	0.002	0.008	0.808	23.739	385871	36.6	5.878	134	19.0	69.8	22.6	0.008	8239	7775	my5651_rel_o2nofp.cz12a_c24r64
3982	58510	0	0.0	538.7	18.1	0.000	0.000	0.135	4.666	340838	36.2	5.825	148	20.0	71.2	24.3	0.009	7343	7151	my5744_rel_o2nofp.cz12a_c24r64
3984	44271	0	0.0	553.8	18.8	0.000	0.000	0.139	4.821	260217	35.2	5.878	191	20.1	71.9	24.9	0.004	5551	5215	my8044_rel_o2nofp.cz12a_c24r64
3982	43764	0	0.0	559.6	18.9	0.000	0.000	0.141	4.864	258426	35.2	5.905	193	19.9	95.6	24.6	0.004	5535	5119	my8407_rel_o2nofp.cz12a_c24r64
3984	44358	0	0.0	534.2	18.2	0.000	0.000	0.134	4.687	259575	35.2	5.852	190	18.1	93.1	22.3	0.005	5583	5199	my9400_rel_o2nofp.cz12a_c24r64
3984	44208	0	0.0	516.0	17.7	0.000	0.000	0.129	4.555	257627	35.2	5.828	191	18.1	93.2	22.5	0.008	5551	5183	my9500_rel_o2nofp.cz13a_c24r64
Average values from iostat.
r/s	rkB/s	rrqm/s	%rrqm	r_await	rareq-s	w/s	wkB/s	wrqm/s	%wrqm	w_await	wareq-s	d/s	dkB/s	drqm/s	%drqm	d_await	dareq-s	f/s	f_await	aqu-sz	%util
128.6	514.5	0.000	0.000	0.080	4.000	3216.8	94534.7	16.60	6.083	0.424	73.56	0.035	0.401	0.000	0.000	0.049	1.932	0.000	0.000	0.584	5.472		my5651_rel_o2nofp.cz12a_c24r64
0.001	0.004	0.000	0.000	0.000	0.022	538.7	18579.7	5.564	1.147	0.177	35.29	0.035	0.301	0.000	0.000	0.048	1.267	0.000	0.000	0.090	0.992		my5744_rel_o2nofp.cz12a_c24r64
0.002	0.007	0.000	0.000	0.000	0.033	553.8	19209.4	1.273	0.237	2.800	35.02	0.017	4.536	0.000	0.000	0.022	21.58	0.000	0.000	1.549	4.472		my8044_rel_o2nofp.cz12a_c24r64
0.006	0.024	0.000	0.000	0.003	0.111	559.6	19368.8	2.011	0.356	2.902	34.94	0.042	0.589	0.000	0.000	0.049	1.706	0.000	0.000	1.645	2.294		my8407_rel_o2nofp.cz12a_c24r64
0.006	0.024	0.000	0.000	0.006	0.122	534.2	18676.5	1.584	0.300	2.940	35.32	0.052	10.86	0.000	0.000	0.051	41.16	0.000	0.000	1.586	2.868		my9400_rel_o2nofp.cz12a_c24r64
0.006	0.022	0.000	0.000	0.003	0.111	516.0	18148.9	1.290	0.269	2.582	35.75	0.044	0.195	0.000	0.000	0.041	0.580	0.000	0.000	1.373	1.162		my9500_rel_o2nofp.cz13a_c24r64
qr1000.L5
qr1000.L5: range queries with 1000 insert/s per client. Graphs for performance per 1-second interval are here.
Average throughput:
Query response time histogram: each cell has the percentage of responses that take <= the time in the header and max is the max response time in seconds. For max values in the top 25% of the range have a red background and in the bottom 25% of the range have a green background. The red background is not used when the min value is within 80% of the max value.
| dbms | 256us | 1ms | 4ms | 16ms | 64ms | 256ms | 1s | 4s | 16s | gt | max |
|---|---|---|---|---|---|---|---|---|---|---|---|
| my5651_rel_o2nofp.cz12a_c24r64 | 99.560 | 0.412 | 0.028 | nonzero | nonzero | 0.019 | |||||
| my5744_rel_o2nofp.cz12a_c24r64 | 99.915 | 0.079 | 0.006 | nonzero | 0.008 | ||||||
| my8044_rel_o2nofp.cz12a_c24r64 | 99.870 | 0.123 | 0.006 | nonzero | nonzero | 0.039 | |||||
| my8407_rel_o2nofp.cz12a_c24r64 | 99.874 | 0.123 | 0.003 | nonzero | 0.006 | ||||||
| my9400_rel_o2nofp.cz12a_c24r64 | 99.898 | 0.098 | 0.004 | nonzero | 0.007 | ||||||
| my9500_rel_o2nofp.cz13a_c24r64 | 99.890 | 0.106 | 0.004 | nonzero | 0.006 |
Insert response time histogram: each cell has the percentage of responses that take <= the time in the header and max is the max response time in seconds. For max values in the top 25% of the range have a red background and in the bottom 25% of the range have a green background. The red background is not used when the min value is within 80% of the max value.
| dbms | 256us | 1ms | 4ms | 16ms | 64ms | 256ms | 1s | 4s | 16s | gt | max |
|---|---|---|---|---|---|---|---|---|---|---|---|
| my5651_rel_o2nofp.cz12a_c24r64 | 25.334 | 74.628 | 0.037 | 0.029 | |||||||
| my5744_rel_o2nofp.cz12a_c24r64 | 95.883 | 4.114 | 0.003 | 0.023 | |||||||
| my8044_rel_o2nofp.cz12a_c24r64 | 93.533 | 6.403 | 0.064 | 0.051 | |||||||
| my8407_rel_o2nofp.cz12a_c24r64 | 97.244 | 2.753 | 0.003 | 0.023 | |||||||
| my9400_rel_o2nofp.cz12a_c24r64 | 96.761 | 2.641 | 0.021 | 0.577 | 0.110 | ||||||
| my9500_rel_o2nofp.cz13a_c24r64 | 96.389 | 2.889 | 0.048 | 0.674 | 0.115 |
Delete response time histogram: each cell has the percentage of responses that take <= the time in the header and max is the max response time in seconds. For max values in the top 25% of the range have a red background and in the bottom 25% of the range have a green background. The red background is not used when the min value is within 80% of the max value.
| dbms | 256us | 1ms | 4ms | 16ms | 64ms | 256ms | 1s | 4s | 16s | gt | max |
|---|---|---|---|---|---|---|---|---|---|---|---|
| my5651_rel_o2nofp.cz12a_c24r64 | 38.377 | 61.605 | 0.019 | 0.027 | |||||||
| my5744_rel_o2nofp.cz12a_c24r64 | 96.723 | 3.275 | 0.002 | 0.019 | |||||||
| my8044_rel_o2nofp.cz12a_c24r64 | 96.286 | 3.681 | 0.032 | 0.048 | |||||||
| my8407_rel_o2nofp.cz12a_c24r64 | 98.634 | 1.363 | 0.002 | 0.028 | |||||||
| my9400_rel_o2nofp.cz12a_c24r64 | 97.885 | 1.561 | 0.021 | 0.532 | 0.110 | ||||||
| my9500_rel_o2nofp.cz13a_c24r64 | 97.719 | 1.589 | 0.047 | 0.645 | 0.107 |
Performance metrics for the DBMS listed above. Some are normalized by throughput, others are not. Legend for results is here.
ips	qps	rps	rmbps	wps	wmbps	rpq	rkbpq	wpi	wkbpi	csps	cpups	cspq	cpupq	dbgb1	dbgb2	rss	maxop	p50	p99	tag
7969	76472	241	0.9	1448.5	46.7	0.003	0.013	0.182	5.998	445299	40.1	5.823	126	19.0	69.8	22.6	0.019	9614	9038	my5651_rel_o2nofp.cz12a_c24r64
7965	66585	0	0.0	888.4	31.2	0.000	0.000	0.112	4.010	383802	39.8	5.764	143	20.0	71.2	24.4	0.008	8415	7999	my5744_rel_o2nofp.cz12a_c24r64
7969	61859	0	0.0	920.1	32.5	0.000	0.000	0.115	4.175	359658	38.5	5.814	149	20.1	71.9	24.9	0.039	7823	7199	my8044_rel_o2nofp.cz12a_c24r64
7969	60208	0	0.0	905.9	32.1	0.000	0.000	0.114	4.122	351152	38.2	5.832	152	19.9	97.0	24.6	0.006	7599	7199	my8407_rel_o2nofp.cz12a_c24r64
7965	61766	0	0.0	896.7	31.9	0.000	0.000	0.113	4.097	357289	38.2	5.785	148	18.1	94.5	22.3	0.007	7807	7343	my9400_rel_o2nofp.cz12a_c24r64
7969	61407	0	0.0	897.5	31.9	0.000	0.000	0.113	4.099	354633	38.3	5.775	150	18.1	94.6	22.5	0.006	7711	7295	my9500_rel_o2nofp.cz13a_c24r64
Average values from iostat.
r/s	rkB/s	rrqm/s	%rrqm	r_await	rareq-s	w/s	wkB/s	wrqm/s	%wrqm	w_await	wareq-s	d/s	dkB/s	drqm/s	%drqm	d_await	dareq-s	f/s	f_await	aqu-sz	%util
241.1	964.6	0.000	0.000	0.073	3.956	1448.5	47798.2	15.98	3.759	0.738	69.52	0.033	0.370	0.000	0.000	0.037	1.212	0.000	0.000	0.310	4.089		my5651_rel_o2nofp.cz12a_c24r64
0.003	0.013	0.000	0.000	0.001	0.055	888.4	31938.8	11.80	1.318	0.234	35.97	0.034	0.244	0.000	0.000	0.043	0.971	0.000	0.000	0.209	1.786		my5744_rel_o2nofp.cz12a_c24r64
0.004	0.018	0.000	0.000	0.003	0.089	920.1	33272.2	1.312	0.143	3.792	36.24	0.040	26.32	0.000	0.000	0.030	88.63	0.000	0.000	3.532	2.186		my8044_rel_o2nofp.cz12a_c24r64
0.012	0.047	0.000	0.000	0.010	0.222	905.9	32848.4	1.635	0.183	4.503	36.33	0.048	0.696	0.000	0.000	0.043	1.950	0.000	0.000	4.123	2.127		my8407_rel_o2nofp.cz12a_c24r64
0.016	0.054	0.000	0.000	0.008	0.217	896.7	32634.1	1.696	0.191	4.523	36.46	0.054	11.21	0.000	0.000	0.070	42.94	0.000	0.000	4.091	2.118		my9400_rel_o2nofp.cz12a_c24r64
0.007	0.029	0.000	0.000	0.003	0.122	897.5	32664.7	1.688	0.189	4.461	36.44	0.058	0.341	0.000	0.000	0.083	0.888	0.000	0.000	4.043	2.615		my9500_rel_o2nofp.cz13a_c24r64
qp1000.L6
qp1000.L6: point queries with 1000 insert/s per client. Graphs for performance per 1-second interval are here.
Average throughput:
Query response time histogram: each cell has the percentage of responses that take <= the time in the header and max is the max response time in seconds. For max values in the top 25% of the range have a red background and in the bottom 25% of the range have a green background. The red background is not used when the min value is within 80% of the max value.
| dbms | 256us | 1ms | 4ms | 16ms | 64ms | 256ms | 1s | 4s | 16s | gt | max |
|---|---|---|---|---|---|---|---|---|---|---|---|
| my5651_rel_o2nofp.cz12a_c24r64 | 99.535 | 0.439 | 0.026 | nonzero | 0.007 | ||||||
| my5744_rel_o2nofp.cz12a_c24r64 | 99.867 | 0.127 | 0.006 | nonzero | 0.011 | ||||||
| my8044_rel_o2nofp.cz12a_c24r64 | 98.941 | 1.051 | 0.008 | nonzero | 0.008 | ||||||
| my8407_rel_o2nofp.cz12a_c24r64 | 98.749 | 1.245 | 0.006 | nonzero | 0.007 | ||||||
| my9400_rel_o2nofp.cz12a_c24r64 | 99.225 | 0.770 | 0.004 | nonzero | nonzero | 0.017 | |||||
| my9500_rel_o2nofp.cz13a_c24r64 | 99.711 | 0.289 | nonzero | nonzero | nonzero | 0.018 |
Insert response time histogram: each cell has the percentage of responses that take <= the time in the header and max is the max response time in seconds. For max values in the top 25% of the range have a red background and in the bottom 25% of the range have a green background. The red background is not used when the min value is within 80% of the max value.
| dbms | 256us | 1ms | 4ms | 16ms | 64ms | 256ms | 1s | 4s | 16s | gt | max |
|---|---|---|---|---|---|---|---|---|---|---|---|
| my5651_rel_o2nofp.cz12a_c24r64 | 29.318 | 70.656 | 0.026 | 0.024 | |||||||
| my5744_rel_o2nofp.cz12a_c24r64 | 95.994 | 4.004 | 0.002 | 0.021 | |||||||
| my8044_rel_o2nofp.cz12a_c24r64 | 92.257 | 7.743 | nonzero | 0.017 | |||||||
| my8407_rel_o2nofp.cz12a_c24r64 | 94.376 | 5.622 | 0.002 | 0.018 | |||||||
| my9400_rel_o2nofp.cz12a_c24r64 | 98.059 | 1.502 | 0.001 | 0.438 | 0.107 | ||||||
| my9500_rel_o2nofp.cz13a_c24r64 | 99.444 | 0.217 | 0.004 | 0.335 | 0.105 |
Delete response time histogram: each cell has the percentage of responses that take <= the time in the header and max is the max response time in seconds. For max values in the top 25% of the range have a red background and in the bottom 25% of the range have a green background. The red background is not used when the min value is within 80% of the max value.
| dbms | 256us | 1ms | 4ms | 16ms | 64ms | 256ms | 1s | 4s | 16s | gt | max |
|---|---|---|---|---|---|---|---|---|---|---|---|
| my5651_rel_o2nofp.cz12a_c24r64 | 45.090 | 54.897 | 0.013 | 0.024 | |||||||
| my5744_rel_o2nofp.cz12a_c24r64 | 96.754 | 3.243 | 0.003 | 0.020 | |||||||
| my8044_rel_o2nofp.cz12a_c24r64 | 95.322 | 4.678 | 0.016 | ||||||||
| my8407_rel_o2nofp.cz12a_c24r64 | 96.846 | 3.151 | 0.003 | 0.023 | |||||||
| my9400_rel_o2nofp.cz12a_c24r64 | 98.680 | 0.890 | nonzero | 0.429 | 0.106 | ||||||
| my9500_rel_o2nofp.cz13a_c24r64 | 99.468 | 0.198 | 0.004 | 0.331 | 0.105 |
Performance metrics for the DBMS listed above. Some are normalized by throughput, others are not. Legend for results is here.
ips	qps	rps	rmbps	wps	wmbps	rpq	rkbpq	wpi	wkbpi	csps	cpups	cspq	cpupq	dbgb1	dbgb2	rss	maxop	p50	p99	tag
7969	64046	250	1.0	950.7	32.9	0.004	0.016	0.119	4.233	378500	40.2	5.910	151	19.0	69.8	22.7	0.007	8031	7535	my5651_rel_o2nofp.cz12a_c24r64
7965	57803	0	0.0	907.9	31.9	0.000	0.000	0.114	4.098	337765	39.3	5.843	163	20.0	71.2	24.4	0.011	7407	7039	my5744_rel_o2nofp.cz12a_c24r64
7969	43627	0	0.0	949.4	33.3	0.000	0.000	0.119	4.285	258905	38.0	5.935	209	20.1	71.9	24.9	0.008	5503	5119	my8044_rel_o2nofp.cz12a_c24r64
7965	43030	0	0.0	941.3	33.1	0.000	0.000	0.118	4.259	256460	38.0	5.960	212	19.9	98.4	24.6	0.007	5439	5071	my8407_rel_o2nofp.cz12a_c24r64
7960	43796	0	0.0	909.2	32.2	0.000	0.000	0.114	4.140	260270	37.4	5.943	205	18.1	95.9	22.3	0.017	5567	5247	my9400_rel_o2nofp.cz12a_c24r64
7938	44144	0	0.0	907.5	32.1	0.000	0.000	0.114	4.146	266379	37.1	6.034	202	18.1	96.0	22.5	0.018	5583	5247	my9500_rel_o2nofp.cz13a_c24r64
Average values from iostat.
r/s	rkB/s	rrqm/s	%rrqm	r_await	rareq-s	w/s	wkB/s	wrqm/s	%wrqm	w_await	wareq-s	d/s	dkB/s	drqm/s	%drqm	d_await	dareq-s	f/s	f_await	aqu-sz	%util
250.2	1000.8	0.000	0.000	0.073	4.000	950.7	33730.8	13.75	2.581	0.397	51.18	0.035	0.363	0.000	0.000	0.043	1.518	0.000	0.000	0.219	3.426		my5651_rel_o2nofp.cz12a_c24r64
0.006	0.024	0.000	0.000	0.004	0.100	907.9	32642.6	4.751	0.520	0.276	35.93	0.039	0.255	0.000	0.000	0.033	0.805	0.000	0.000	0.252	1.792		my5744_rel_o2nofp.cz12a_c24r64
0.005	0.020	0.000	0.000	0.003	0.100	949.4	34150.4	1.130	0.119	3.916	35.95	0.031	18.90	0.000	0.000	0.043	89.79	0.000	0.000	3.718	2.245		my8044_rel_o2nofp.cz12a_c24r64
0.014	0.055	0.000	0.000	0.010	0.244	941.3	33924.9	1.551	0.164	4.678	36.02	0.047	0.736	0.000	0.000	0.053	2.055	0.000	0.000	4.406	3.241		my8407_rel_o2nofp.cz12a_c24r64
0.007	0.027	0.000	0.000	0.025	0.133	909.2	32958.6	1.545	0.169	4.422	36.23	0.054	11.21	0.000	0.000	0.098	42.28	0.000	0.000	4.023	2.338		my9400_rel_o2nofp.cz12a_c24r64
0.011	0.044	0.000	0.000	0.011	0.210	907.5	32907.9	1.592	0.174	4.315	36.24	0.054	0.217	0.000	0.000	0.049	0.685	0.000	0.000	3.918	2.120		my9500_rel_o2nofp.cz13a_c24r64
l.i0
l.i0: load without secondary indexes
Performance metrics for all DBMS, not just the ones listed above. Some are normalized by throughput, others are not. Legend for results is here.
ips	qps	rps	rmbps	wps	wmbps	rpq	rkbpq	wpi	wkbpi	csps	cpups	cspq	cpupq	dbgb1	dbgb2	rss	maxop	p50	p99	tag
490798	0	143	0.6	1456.8	127.7	0.000	0.001	0.003	0.267	62074	39.1	0.126	19	5.3	55.8	8.0	0.229	66592	50794	my5651_rel_o2nofp.cz12a_c24r64
496894	0	0	0.0	1732.4	135.6	0.000	0.000	0.003	0.279	61504	40.5	0.124	20	5.3	55.8	8.7	0.265	71991	52193	my5744_rel_o2nofp.cz12a_c24r64
470588	0	0	0.0	1784.0	136.9	0.000	0.000	0.004	0.298	89025	44.4	0.189	23	5.3	55.9	8.7	0.262	65493	51094	my8044_rel_o2nofp.cz12a_c24r64
467836	0	0	0.0	1769.4	136.3	0.000	0.000	0.004	0.298	89008	44.8	0.190	23	5.3	59.6	8.6	0.243	63892	49891	my8407_rel_o2nofp.cz12a_c24r64
454545	0	0	0.0	1769.1	133.7	0.000	0.000	0.004	0.301	60816	39.9	0.134	21	5.3	59.6	9.4	0.245	64991	44692	my9400_rel_o2nofp.cz12a_c24r64
459770	0	0	0.0	1759.3	135.4	0.000	0.000	0.004	0.302	62170	40.3	0.135	21	5.3	59.6	8.7	0.263	65292	50094	my9500_rel_o2nofp.cz13a_c24r64
l.x
l.x: create secondary indexes
Performance metrics for all DBMS, not just the ones listed above. Some are normalized by throughput, others are not. Legend for results is here.
ips	qps	rps	rmbps	wps	wmbps	rpq	rkbpq	wpi	wkbpi	csps	cpups	cspq	cpupq	dbgb1	dbgb2	rss	maxop	p50	p99	tag
365297	0	0	0.0	26341.1	790.7	0.000	0.000	0.072	2.216	51939	30.3	0.142	20	11.2	61.7	14.2	0.002	NA	NA	my5651_rel_o2nofp.cz12a_c24r64
1052633	0	1	0.0	17432.1	935.7	0.000	0.000	0.017	0.910	83989	29.3	0.080	7	12.2	62.7	12.9	0.040	NA	NA	my5744_rel_o2nofp.cz12a_c24r64
1038962	0	27	0.7	32140.2	1224.9	0.000	0.001	0.031	1.207	67178	62.0	0.065	14	12.1	62.8	12.1	0.005	NA	NA	my8044_rel_o2nofp.cz12a_c24r64
1025642	0	24	0.8	31439.9	1216.4	0.000	0.001	0.031	1.214	69039	64.5	0.067	15	12.1	66.5	11.8	0.005	NA	NA	my8407_rel_o2nofp.cz12a_c24r64
1038962	0	26	0.7	32711.7	1235.8	0.000	0.001	0.031	1.218	66304	59.0	0.064	14	12.1	66.5	12.0	0.002	NA	NA	my9400_rel_o2nofp.cz12a_c24r64
1025642	0	28	0.8	31895.6	1223.3	0.000	0.001	0.031	1.221	69228	62.3	0.067	15	12.1	66.5	12.1	0.002	NA	NA	my9500_rel_o2nofp.cz13a_c24r64
l.i1
l.i1: continue load after secondary indexes created with 50 inserts per transaction
Performance metrics for all DBMS, not just the ones listed above. Some are normalized by throughput, others are not. Legend for results is here.
ips	qps	rps	rmbps	wps	wmbps	rpq	rkbpq	wpi	wkbpi	csps	cpups	cspq	cpupq	dbgb1	dbgb2	rss	maxop	p50	p99	tag
57736	0	1494	5.8	3908.1	156.8	0.026	0.104	0.068	2.782	140801	73.0	2.439	303	19.0	69.8	22.5	0.271	7099	3799	my5651_rel_o2nofp.cz12a_c24r64
84768	0	0	0.0	4960.7	191.9	0.000	0.000	0.059	2.318	47724	87.0	0.563	246	20.0	71.2	24.0	0.256	11987	8299	my5744_rel_o2nofp.cz12a_c24r64
120869	0	366	5.7	6695.0	272.8	0.003	0.048	0.055	2.311	105852	81.6	0.876	162	20.1	71.9	24.6	0.349	15875	4949	my8044_rel_o2nofp.cz12a_c24r64
119738	0	362	5.7	6735.1	274.4	0.003	0.048	0.056	2.347	104437	81.5	0.872	163	19.9	87.7	24.3	0.433	15598	5949	my8407_rel_o2nofp.cz12a_c24r64
93091	0	281	4.4	6957.1	293.8	0.003	0.048	0.075	3.231	56407	63.0	0.606	162	18.1	85.3	22.3	0.384	11848	5799	my9400_rel_o2nofp.cz12a_c24r64
96096	0	290	4.5	7052.5	298.0	0.003	0.048	0.073	3.176	58961	64.8	0.614	162	18.1	85.3	22.4	0.378	12248	5749	my9500_rel_o2nofp.cz13a_c24r64
l.i2
l.i2: continue load after secondary indexes created with 5 inserts per transaction
Performance metrics for all DBMS, not just the ones listed above. Some are normalized by throughput, others are not. Legend for results is here.
ips	qps	rps	rmbps	wps	wmbps	rpq	rkbpq	wpi	wkbpi	csps	cpups	cspq	cpupq	dbgb1	dbgb2	rss	maxop	p50	p99	tag
37603	0	5937	23.2	3378.8	131.7	0.158	0.632	0.090	3.586	241716	76.5	6.428	488	19.0	69.8	22.6	0.077	4894	170	my5651_rel_o2nofp.cz12a_c24r64
53244	0	0	0.0	4789.2	187.9	0.000	0.000	0.090	3.613	231359	76.2	4.345	343	20.0	71.2	24.3	0.235	7224	185	my5744_rel_o2nofp.cz12a_c24r64
53963	0	0	0.0	5079.9	200.9	0.000	0.000	0.094	3.813	295349	72.4	5.473	322	20.1	71.9	24.8	0.319	7354	1225	my8044_rel_o2nofp.cz12a_c24r64
53782	0	0	0.0	5064.6	199.9	0.000	0.000	0.094	3.806	295766	71.8	5.499	320	19.9	93.9	24.5	0.321	7204	1300	my8407_rel_o2nofp.cz12a_c24r64
50955	0	0	0.0	4337.2	174.2	0.000	0.000	0.085	3.501	252009	60.1	4.946	283	18.1	91.4	22.3	0.296	6434	4178	my9400_rel_o2nofp.cz12a_c24r64
50713	0	0	0.0	4331.2	173.6	0.000	0.000	0.085	3.506	249503	58.9	4.920	279	18.1	91.5	22.5	0.298	6504	840	my9500_rel_o2nofp.cz13a_c24r64
qr100.L1
qr100.L1: range queries with 100 insert/s per client
Performance metrics for all DBMS, not just the ones listed above. Some are normalized by throughput, others are not. Legend for results is here.
ips	qps	rps	rmbps	wps	wmbps	rpq	rkbpq	wpi	wkbpi	csps	cpups	cspq	cpupq	dbgb1	dbgb2	rss	maxop	p50	p99	tag
796	81244	28	0.1	4052.9	112.8	0.000	0.001	5.089	145.075	468141	33.8	5.762	100	19.0	69.8	22.6	0.008	10159	9743	my5651_rel_o2nofp.cz12a_c24r64
796	68643	0	0.0	850.9	24.1	0.000	0.000	1.068	30.950	394924	34.5	5.753	121	20.0	71.2	24.3	0.009	8622	8143	my5744_rel_o2nofp.cz12a_c24r64
796	63497	0	0.0	986.7	28.0	0.000	0.000	1.239	35.969	366348	33.7	5.770	127	20.1	71.9	24.8	0.004	7999	7823	my8044_rel_o2nofp.cz12a_c24r64
796	61985	0	0.0	1009.1	28.6	0.000	0.000	1.267	36.767	357719	33.7	5.771	130	19.9	94.0	24.5	0.004	7807	7423	my8407_rel_o2nofp.cz12a_c24r64
797	63519	0	0.0	974.7	27.7	0.000	0.000	1.223	35.536	366046	33.8	5.763	128	18.1	91.6	22.3	0.004	7999	7839	my9400_rel_o2nofp.cz12a_c24r64
797	62928	0	0.0	848.4	24.1	0.000	0.000	1.065	31.028	362292	33.5	5.757	128	18.1	91.6	22.5	0.007	7945	7727	my9500_rel_o2nofp.cz13a_c24r64
qp100.L2
qp100.L2: point queries with 100 insert/s per client
Performance metrics for all DBMS, not just the ones listed above. Some are normalized by throughput, others are not. Legend for results is here.
ips	qps	rps	rmbps	wps	wmbps	rpq	rkbpq	wpi	wkbpi	csps	cpups	cspq	cpupq	dbgb1	dbgb2	rss	maxop	p50	p99	tag
797	67356	29	0.1	4563.9	127.0	0.000	0.002	5.727	163.150	392496	33.7	5.827	120	19.0	69.8	22.6	0.008	8446	7967	my5651_rel_o2nofp.cz12a_c24r64
797	59281	0	0.0	78.6	2.6	0.000	0.000	0.099	3.365	344053	34.3	5.804	139	20.0	71.2	24.3	0.009	7503	7119	my5744_rel_o2nofp.cz12a_c24r64
796	44909	0	0.0	81.0	2.8	0.000	0.000	0.102	3.645	261687	33.4	5.827	178	20.1	71.9	24.8	0.003	5647	5215	my8044_rel_o2nofp.cz12a_c24r64
797	44306	0	0.0	88.5	3.0	0.000	0.000	0.111	3.884	257804	33.3	5.819	180	19.9	94.2	24.5	0.004	5567	5151	my8407_rel_o2nofp.cz12a_c24r64
797	44922	0	0.0	111.1	3.6	0.000	0.000	0.139	4.681	263529	33.3	5.866	178	18.1	91.7	22.3	0.005	5647	5343	my9400_rel_o2nofp.cz12a_c24r64
797	44873	0	0.0	83.8	2.9	0.000	0.000	0.105	3.785	260486	33.3	5.805	178	18.1	91.7	22.5	0.004	5647	5231	my9500_rel_o2nofp.cz13a_c24r64
qr500.L3
qr500.L3: range queries with 500 insert/s per client
Performance metrics for all DBMS, not just the ones listed above. Some are normalized by throughput, others are not. Legend for results is here.
ips	qps	rps	rmbps	wps	wmbps	rpq	rkbpq	wpi	wkbpi	csps	cpups	cspq	cpupq	dbgb1	dbgb2	rss	maxop	p50	p99	tag
3982	79062	129	0.5	2830.6	81.6	0.002	0.007	0.711	20.993	457995	36.5	5.793	111	19.0	69.8	22.6	0.007	9935	9343	my5651_rel_o2nofp.cz12a_c24r64
3984	67989	0	0.0	452.5	15.8	0.000	0.000	0.114	4.050	391123	36.5	5.753	129	20.0	71.2	24.3	0.009	8574	8431	my5744_rel_o2nofp.cz12a_c24r64
3984	62878	0	0.0	505.1	17.4	0.000	0.000	0.127	4.475	363424	35.3	5.780	135	20.1	71.9	24.8	0.005	7887	7503	my8044_rel_o2nofp.cz12a_c24r64
3982	61535	0	0.0	500.1	17.2	0.000	0.000	0.126	4.432	355506	35.3	5.777	138	19.9	94.9	24.5	0.005	7743	7294	my8407_rel_o2nofp.cz12a_c24r64
3982	62976	0	0.0	495.7	17.2	0.000	0.000	0.124	4.421	363074	35.2	5.765	134	18.1	92.4	22.3	0.006	7919	7423	my9400_rel_o2nofp.cz12a_c24r64
3982	62401	0	0.0	494.3	17.2	0.000	0.000	0.124	4.413	359577	35.3	5.762	136	18.1	92.4	22.5	0.006	7823	7263	my9500_rel_o2nofp.cz13a_c24r64
qp500.L4
qp500.L4: point queries with 500 insert/s per client
Performance metrics for all DBMS, not just the ones listed above. Some are normalized by throughput, others are not. Legend for results is here.
ips	qps	rps	rmbps	wps	wmbps	rpq	rkbpq	wpi	wkbpi	csps	cpups	cspq	cpupq	dbgb1	dbgb2	rss	maxop	p50	p99	tag
3982	65649	129	0.5	3216.8	92.3	0.002	0.008	0.808	23.739	385871	36.6	5.878	134	19.0	69.8	22.6	0.008	8239	7775	my5651_rel_o2nofp.cz12a_c24r64
3982	58510	0	0.0	538.7	18.1	0.000	0.000	0.135	4.666	340838	36.2	5.825	148	20.0	71.2	24.3	0.009	7343	7151	my5744_rel_o2nofp.cz12a_c24r64
3984	44271	0	0.0	553.8	18.8	0.000	0.000	0.139	4.821	260217	35.2	5.878	191	20.1	71.9	24.9	0.004	5551	5215	my8044_rel_o2nofp.cz12a_c24r64
3982	43764	0	0.0	559.6	18.9	0.000	0.000	0.141	4.864	258426	35.2	5.905	193	19.9	95.6	24.6	0.004	5535	5119	my8407_rel_o2nofp.cz12a_c24r64
3984	44358	0	0.0	534.2	18.2	0.000	0.000	0.134	4.687	259575	35.2	5.852	190	18.1	93.1	22.3	0.005	5583	5199	my9400_rel_o2nofp.cz12a_c24r64
3984	44208	0	0.0	516.0	17.7	0.000	0.000	0.129	4.555	257627	35.2	5.828	191	18.1	93.2	22.5	0.008	5551	5183	my9500_rel_o2nofp.cz13a_c24r64
qr1000.L5
qr1000.L5: range queries with 1000 insert/s per client
Performance metrics for all DBMS, not just the ones listed above. Some are normalized by throughput, others are not. Legend for results is here.
ips	qps	rps	rmbps	wps	wmbps	rpq	rkbpq	wpi	wkbpi	csps	cpups	cspq	cpupq	dbgb1	dbgb2	rss	maxop	p50	p99	tag
7969	76472	241	0.9	1448.5	46.7	0.003	0.013	0.182	5.998	445299	40.1	5.823	126	19.0	69.8	22.6	0.019	9614	9038	my5651_rel_o2nofp.cz12a_c24r64
7965	66585	0	0.0	888.4	31.2	0.000	0.000	0.112	4.010	383802	39.8	5.764	143	20.0	71.2	24.4	0.008	8415	7999	my5744_rel_o2nofp.cz12a_c24r64
7969	61859	0	0.0	920.1	32.5	0.000	0.000	0.115	4.175	359658	38.5	5.814	149	20.1	71.9	24.9	0.039	7823	7199	my8044_rel_o2nofp.cz12a_c24r64
7969	60208	0	0.0	905.9	32.1	0.000	0.000	0.114	4.122	351152	38.2	5.832	152	19.9	97.0	24.6	0.006	7599	7199	my8407_rel_o2nofp.cz12a_c24r64
7965	61766	0	0.0	896.7	31.9	0.000	0.000	0.113	4.097	357289	38.2	5.785	148	18.1	94.5	22.3	0.007	7807	7343	my9400_rel_o2nofp.cz12a_c24r64
7969	61407	0	0.0	897.5	31.9	0.000	0.000	0.113	4.099	354633	38.3	5.775	150	18.1	94.6	22.5	0.006	7711	7295	my9500_rel_o2nofp.cz13a_c24r64
qp1000.L6
qp1000.L6: point queries with 1000 insert/s per client
Performance metrics for all DBMS, not just the ones listed above. Some are normalized by throughput, others are not. Legend for results is here.
ips	qps	rps	rmbps	wps	wmbps	rpq	rkbpq	wpi	wkbpi	csps	cpups	cspq	cpupq	dbgb1	dbgb2	rss	maxop	p50	p99	tag
7969	64046	250	1.0	950.7	32.9	0.004	0.016	0.119	4.233	378500	40.2	5.910	151	19.0	69.8	22.7	0.007	8031	7535	my5651_rel_o2nofp.cz12a_c24r64
7965	57803	0	0.0	907.9	31.9	0.000	0.000	0.114	4.098	337765	39.3	5.843	163	20.0	71.2	24.4	0.011	7407	7039	my5744_rel_o2nofp.cz12a_c24r64
7969	43627	0	0.0	949.4	33.3	0.000	0.000	0.119	4.285	258905	38.0	5.935	209	20.1	71.9	24.9	0.008	5503	5119	my8044_rel_o2nofp.cz12a_c24r64
7965	43030	0	0.0	941.3	33.1	0.000	0.000	0.118	4.259	256460	38.0	5.960	212	19.9	98.4	24.6	0.007	5439	5071	my8407_rel_o2nofp.cz12a_c24r64
7960	43796	0	0.0	909.2	32.2	0.000	0.000	0.114	4.140	260270	37.4	5.943	205	18.1	95.9	22.3	0.017	5567	5247	my9400_rel_o2nofp.cz12a_c24r64
7938	44144	0	0.0	907.5	32.1	0.000	0.000	0.114	4.146	266379	37.1	6.034	202	18.1	96.0	22.5	0.018	5583	5247	my9500_rel_o2nofp.cz13a_c24r64
l.i0
- l.i0: load without secondary indexes
- Legend for results is here.
- Each entry lists the percentage of responses that fit in that bucket (slower than max time for previous bucket, faster than min time for next bucket).
Insert response time histogram
256us	1ms	4ms	16ms	64ms	256ms	1s	4s	16s	gt	max	tag
0.000	3.511	96.279	0.059	0.137	0.014	0.000	0.000	0.000	0.000	0.229	my5651_rel_o2nofp.cz12a_c24r64
0.000	3.535	96.362	0.077	0.012	0.013	0.001	0.000	0.000	0.000	0.265	my5744_rel_o2nofp.cz12a_c24r64
0.000	0.000	99.793	0.179	0.014	0.011	0.003	0.000	0.000	0.000	0.262	my8044_rel_o2nofp.cz12a_c24r64
0.000	0.000	99.786	0.187	0.013	0.014	0.000	0.000	0.000	0.000	0.243	my8407_rel_o2nofp.cz12a_c24r64
0.000	0.000	99.814	0.160	0.011	0.015	0.000	0.000	0.000	0.000	0.245	my9400_rel_o2nofp.cz12a_c24r64
0.000	0.000	99.811	0.154	0.018	0.016	0.001	0.000	0.000	0.000	0.263	my9500_rel_o2nofp.cz13a_c24r64
l.x
- l.x: create secondary indexes
- Legend for results is here.
- Each entry lists the percentage of responses that fit in that bucket (slower than max time for previous bucket, faster than min time for next bucket).
TODO - determine whether there is data for create index response time
l.i1
- l.i1: continue load after secondary indexes created with 50 inserts per transaction
- Legend for results is here.
- Each entry lists the percentage of responses that fit in that bucket (slower than max time for previous bucket, faster than min time for next bucket).
Insert response time histogram
256us	1ms	4ms	16ms	64ms	256ms	1s	4s	16s	gt	max	tag
0.000	0.000	1.127	98.001	0.812	0.060	nonzero	0.000	0.000	0.000	0.271	my5651_rel_o2nofp.cz12a_c24r64
0.000	0.000	50.356	49.592	0.036	0.016	0.000	0.000	0.000	0.000	0.256	my5744_rel_o2nofp.cz12a_c24r64
0.000	0.000	94.906	4.454	0.614	0.021	0.004	0.000	0.000	0.000	0.349	my8044_rel_o2nofp.cz12a_c24r64
0.000	0.000	94.673	4.662	0.642	0.018	0.006	0.000	0.000	0.000	0.433	my8407_rel_o2nofp.cz12a_c24r64
0.000	0.000	95.260	3.021	0.652	1.062	0.005	0.000	0.000	0.000	0.384	my9400_rel_o2nofp.cz12a_c24r64
0.000	0.000	95.471	2.913	0.656	0.957	0.003	0.000	0.000	0.000	0.378	my9500_rel_o2nofp.cz13a_c24r64
Delete response time histogram
256us	1ms	4ms	16ms	64ms	256ms	1s	4s	16s	gt	max	tag
0.000	0.000	4.276	95.014	0.661	0.049	nonzero	0.000	0.000	0.000	0.259	my5651_rel_o2nofp.cz12a_c24r64
0.000	0.000	42.056	57.907	0.024	0.014	0.000	0.000	0.000	0.000	0.252	my5744_rel_o2nofp.cz12a_c24r64
0.000	0.000	97.277	2.309	0.394	0.016	0.004	0.000	0.000	0.000	0.350	my8044_rel_o2nofp.cz12a_c24r64
0.000	0.000	97.219	2.354	0.407	0.015	0.005	0.000	0.000	0.000	0.439	my8407_rel_o2nofp.cz12a_c24r64
0.000	0.000	97.106	1.489	0.398	1.003	0.004	0.000	0.000	0.000	0.386	my9400_rel_o2nofp.cz12a_c24r64
0.000	0.000	97.278	1.414	0.404	0.902	0.003	0.000	0.000	0.000	0.376	my9500_rel_o2nofp.cz13a_c24r64
l.i2
- l.i2: continue load after secondary indexes created with 5 inserts per transaction
- Legend for results is here.
- Each entry lists the percentage of responses that fit in that bucket (slower than max time for previous bucket, faster than min time for next bucket).
Insert response time histogram
256us	1ms	4ms	16ms	64ms	256ms	1s	4s	16s	gt	max	tag
0.026	63.716	35.999	0.052	0.206	0.001	0.000	0.000	0.000	0.000	0.077	my5651_rel_o2nofp.cz12a_c24r64
0.077	92.434	7.343	0.024	0.119	0.003	0.000	0.000	0.000	0.000	0.235	my5744_rel_o2nofp.cz12a_c24r64
nonzero	93.796	5.856	0.280	0.065	0.002	0.001	0.000	0.000	0.000	0.319	my8044_rel_o2nofp.cz12a_c24r64
0.000	93.696	6.041	0.192	0.068	0.002	0.001	0.000	0.000	0.000	0.321	my8407_rel_o2nofp.cz12a_c24r64
0.000	96.698	3.065	0.062	0.045	0.128	0.001	0.000	0.000	0.000	0.296	my9400_rel_o2nofp.cz12a_c24r64
0.000	96.920	2.835	0.060	0.048	0.138	nonzero	0.000	0.000	0.000	0.298	my9500_rel_o2nofp.cz13a_c24r64
Delete response time histogram
256us	1ms	4ms	16ms	64ms	256ms	1s	4s	16s	gt	max	tag
0.032	64.324	35.386	0.051	0.206	0.001	0.000	0.000	0.000	0.000	0.076	my5651_rel_o2nofp.cz12a_c24r64
0.074	91.718	8.066	0.020	0.119	0.003	0.000	0.000	0.000	0.000	0.235	my5744_rel_o2nofp.cz12a_c24r64
0.007	94.824	4.871	0.244	0.051	0.002	0.001	0.000	0.000	0.000	0.320	my8044_rel_o2nofp.cz12a_c24r64
nonzero	94.859	4.927	0.155	0.056	0.002	0.001	0.000	0.000	0.000	0.320	my8407_rel_o2nofp.cz12a_c24r64
nonzero	97.289	2.496	0.052	0.035	0.127	0.001	0.000	0.000	0.000	0.294	my9400_rel_o2nofp.cz12a_c24r64
0.004	97.361	2.409	0.051	0.038	0.137	nonzero	0.000	0.000	0.000	0.297	my9500_rel_o2nofp.cz13a_c24r64
qr100.L1
- qr100.L1: range queries with 100 insert/s per client
- Legend for results is here.
- Each entry lists the percentage of responses that fit in that bucket (slower than max time for previous bucket, faster than min time for next bucket).
Query response time histogram
256us	1ms	4ms	16ms	64ms	256ms	1s	4s	16s	gt	max	tag
99.969	0.029	0.002	nonzero	0.000	0.000	0.000	0.000	0.000	0.000	0.008	my5651_rel_o2nofp.cz12a_c24r64
99.988	0.012	nonzero	nonzero	0.000	0.000	0.000	0.000	0.000	0.000	0.009	my5744_rel_o2nofp.cz12a_c24r64
99.982	0.018	nonzero	0.000	0.000	0.000	0.000	0.000	0.000	0.000	0.004	my8044_rel_o2nofp.cz12a_c24r64
99.974	0.026	nonzero	0.000	0.000	0.000	0.000	0.000	0.000	0.000	0.004	my8407_rel_o2nofp.cz12a_c24r64
99.981	0.019	nonzero	nonzero	0.000	0.000	0.000	0.000	0.000	0.000	0.004	my9400_rel_o2nofp.cz12a_c24r64
99.978	0.022	nonzero	nonzero	0.000	0.000	0.000	0.000	0.000	0.000	0.007	my9500_rel_o2nofp.cz13a_c24r64
Insert response time histogram
256us	1ms	4ms	16ms	64ms	256ms	1s	4s	16s	gt	max	tag
0.000	0.000	70.306	29.691	0.003	0.000	0.000	0.000	0.000	0.000	0.017	my5651_rel_o2nofp.cz12a_c24r64
0.000	0.000	99.188	0.812	0.000	0.000	0.000	0.000	0.000	0.000	0.009	my5744_rel_o2nofp.cz12a_c24r64
0.000	0.000	99.899	0.101	0.000	0.000	0.000	0.000	0.000	0.000	0.005	my8044_rel_o2nofp.cz12a_c24r64
0.000	0.000	99.840	0.160	0.000	0.000	0.000	0.000	0.000	0.000	0.005	my8407_rel_o2nofp.cz12a_c24r64
0.000	0.000	99.597	0.128	0.000	0.274	0.000	0.000	0.000	0.000	0.105	my9400_rel_o2nofp.cz12a_c24r64
0.000	0.000	99.920	0.007	0.021	0.052	0.000	0.000	0.000	0.000	0.104	my9500_rel_o2nofp.cz13a_c24r64
Delete response time histogram
256us	1ms	4ms	16ms	64ms	256ms	1s	4s	16s	gt	max	tag
0.000	0.000	84.774	15.215	0.010	0.000	0.000	0.000	0.000	0.000	0.018	my5651_rel_o2nofp.cz12a_c24r64
0.000	0.000	99.490	0.510	0.000	0.000	0.000	0.000	0.000	0.000	0.010	my5744_rel_o2nofp.cz12a_c24r64
0.000	0.000	99.958	0.042	0.000	0.000	0.000	0.000	0.000	0.000	0.004	my8044_rel_o2nofp.cz12a_c24r64
0.000	0.000	99.931	0.069	0.000	0.000	0.000	0.000	0.000	0.000	0.007	my8407_rel_o2nofp.cz12a_c24r64
0.000	0.000	99.712	0.035	0.000	0.253	0.000	0.000	0.000	0.000	0.104	my9400_rel_o2nofp.cz12a_c24r64
0.000	0.000	99.931	0.000	0.021	0.049	0.000	0.000	0.000	0.000	0.102	my9500_rel_o2nofp.cz13a_c24r64
qp100.L2
- qp100.L2: point queries with 100 insert/s per client
- Legend for results is here.
- Each entry lists the percentage of responses that fit in that bucket (slower than max time for previous bucket, faster than min time for next bucket).
Query response time histogram
256us	1ms	4ms	16ms	64ms	256ms	1s	4s	16s	gt	max	tag
99.956	0.042	0.002	nonzero	0.000	0.000	0.000	0.000	0.000	0.000	0.008	my5651_rel_o2nofp.cz12a_c24r64
99.973	0.026	nonzero	nonzero	0.000	0.000	0.000	0.000	0.000	0.000	0.009	my5744_rel_o2nofp.cz12a_c24r64
99.883	0.117	nonzero	0.000	0.000	0.000	0.000	0.000	0.000	0.000	0.003	my8044_rel_o2nofp.cz12a_c24r64
99.855	0.145	nonzero	nonzero	0.000	0.000	0.000	0.000	0.000	0.000	0.004	my8407_rel_o2nofp.cz12a_c24r64
99.864	0.136	nonzero	nonzero	0.000	0.000	0.000	0.000	0.000	0.000	0.005	my9400_rel_o2nofp.cz12a_c24r64
99.871	0.129	nonzero	0.000	0.000	0.000	0.000	0.000	0.000	0.000	0.004	my9500_rel_o2nofp.cz13a_c24r64
Insert response time histogram
256us	1ms	4ms	16ms	64ms	256ms	1s	4s	16s	gt	max	tag
0.000	0.000	75.625	24.354	0.021	0.000	0.000	0.000	0.000	0.000	0.019	my5651_rel_o2nofp.cz12a_c24r64
0.000	0.000	99.792	0.208	0.000	0.000	0.000	0.000	0.000	0.000	0.006	my5744_rel_o2nofp.cz12a_c24r64
0.000	0.000	99.840	0.160	0.000	0.000	0.000	0.000	0.000	0.000	0.014	my8044_rel_o2nofp.cz12a_c24r64
0.000	0.000	99.906	0.094	0.000	0.000	0.000	0.000	0.000	0.000	0.006	my8407_rel_o2nofp.cz12a_c24r64
0.000	0.000	99.649	0.184	0.000	0.167	0.000	0.000	0.000	0.000	0.107	my9400_rel_o2nofp.cz12a_c24r64
0.000	0.000	99.486	0.236	0.000	0.278	0.000	0.000	0.000	0.000	0.105	my9500_rel_o2nofp.cz13a_c24r64
Delete response time histogram
256us	1ms	4ms	16ms	64ms	256ms	1s	4s	16s	gt	max	tag
0.000	0.000	87.208	12.785	0.007	0.000	0.000	0.000	0.000	0.000	0.017	my5651_rel_o2nofp.cz12a_c24r64
0.000	0.000	99.892	0.108	0.000	0.000	0.000	0.000	0.000	0.000	0.005	my5744_rel_o2nofp.cz12a_c24r64
0.000	0.000	99.927	0.073	0.000	0.000	0.000	0.000	0.000	0.000	0.013	my8044_rel_o2nofp.cz12a_c24r64
0.000	0.000	99.997	0.003	0.000	0.000	0.000	0.000	0.000	0.000	0.004	my8407_rel_o2nofp.cz12a_c24r64
0.000	0.000	99.753	0.080	0.000	0.167	0.000	0.000	0.000	0.000	0.107	my9400_rel_o2nofp.cz12a_c24r64
0.000	0.000	99.708	0.028	0.000	0.264	0.000	0.000	0.000	0.000	0.105	my9500_rel_o2nofp.cz13a_c24r64
qr500.L3
- qr500.L3: range queries with 500 insert/s per client
- Legend for results is here.
- Each entry lists the percentage of responses that fit in that bucket (slower than max time for previous bucket, faster than min time for next bucket).
Query response time histogram
256us	1ms	4ms	16ms	64ms	256ms	1s	4s	16s	gt	max	tag
99.843	0.151	0.006	nonzero	0.000	0.000	0.000	0.000	0.000	0.000	0.007	my5651_rel_o2nofp.cz12a_c24r64
99.967	0.031	0.001	nonzero	0.000	0.000	0.000	0.000	0.000	0.000	0.009	my5744_rel_o2nofp.cz12a_c24r64
99.951	0.048	0.001	nonzero	0.000	0.000	0.000	0.000	0.000	0.000	0.005	my8044_rel_o2nofp.cz12a_c24r64
99.938	0.060	0.001	nonzero	0.000	0.000	0.000	0.000	0.000	0.000	0.005	my8407_rel_o2nofp.cz12a_c24r64
99.958	0.041	0.001	nonzero	0.000	0.000	0.000	0.000	0.000	0.000	0.006	my9400_rel_o2nofp.cz12a_c24r64
99.959	0.041	0.001	nonzero	0.000	0.000	0.000	0.000	0.000	0.000	0.006	my9500_rel_o2nofp.cz13a_c24r64
Insert response time histogram
256us	1ms	4ms	16ms	64ms	256ms	1s	4s	16s	gt	max	tag
0.000	0.000	58.472	41.518	0.010	0.000	0.000	0.000	0.000	0.000	0.023	my5651_rel_o2nofp.cz12a_c24r64
0.000	0.000	96.119	3.881	0.000	0.000	0.000	0.000	0.000	0.000	0.012	my5744_rel_o2nofp.cz12a_c24r64
0.000	0.000	98.448	1.552	0.000	0.000	0.000	0.000	0.000	0.000	0.012	my8044_rel_o2nofp.cz12a_c24r64
0.000	0.000	97.339	2.661	0.000	0.000	0.000	0.000	0.000	0.000	0.014	my8407_rel_o2nofp.cz12a_c24r64
0.000	0.000	99.172	0.673	0.000	0.156	0.000	0.000	0.000	0.000	0.106	my9400_rel_o2nofp.cz12a_c24r64
0.000	0.000	99.427	0.484	0.011	0.078	0.000	0.000	0.000	0.000	0.106	my9500_rel_o2nofp.cz13a_c24r64
Delete response time histogram
256us	1ms	4ms	16ms	64ms	256ms	1s	4s	16s	gt	max	tag
0.000	0.000	74.569	25.423	0.008	0.000	0.000	0.000	0.000	0.000	0.025	my5651_rel_o2nofp.cz12a_c24r64
0.000	0.000	96.943	3.057	0.000	0.000	0.000	0.000	0.000	0.000	0.011	my5744_rel_o2nofp.cz12a_c24r64
0.000	0.000	99.302	0.698	0.000	0.000	0.000	0.000	0.000	0.000	0.008	my8044_rel_o2nofp.cz12a_c24r64
0.000	0.000	98.636	1.364	0.000	0.000	0.000	0.000	0.000	0.000	0.016	my8407_rel_o2nofp.cz12a_c24r64
0.000	0.000	99.490	0.358	0.000	0.151	0.000	0.000	0.000	0.000	0.105	my9400_rel_o2nofp.cz12a_c24r64
0.000	0.000	99.673	0.250	0.008	0.069	0.000	0.000	0.000	0.000	0.106	my9500_rel_o2nofp.cz13a_c24r64
qp500.L4
- qp500.L4: point queries with 500 insert/s per client
- Legend for results is here.
- Each entry lists the percentage of responses that fit in that bucket (slower than max time for previous bucket, faster than min time for next bucket).
Query response time histogram
256us	1ms	4ms	16ms	64ms	256ms	1s	4s	16s	gt	max	tag
99.801	0.192	0.007	nonzero	0.000	0.000	0.000	0.000	0.000	0.000	0.008	my5651_rel_o2nofp.cz12a_c24r64
99.941	0.058	0.002	nonzero	0.000	0.000	0.000	0.000	0.000	0.000	0.009	my5744_rel_o2nofp.cz12a_c24r64
99.555	0.444	0.001	nonzero	0.000	0.000	0.000	0.000	0.000	0.000	0.004	my8044_rel_o2nofp.cz12a_c24r64
99.437	0.562	0.001	nonzero	0.000	0.000	0.000	0.000	0.000	0.000	0.004	my8407_rel_o2nofp.cz12a_c24r64
99.649	0.350	0.001	nonzero	0.000	0.000	0.000	0.000	0.000	0.000	0.005	my9400_rel_o2nofp.cz12a_c24r64
99.455	0.543	0.002	nonzero	0.000	0.000	0.000	0.000	0.000	0.000	0.008	my9500_rel_o2nofp.cz13a_c24r64
Insert response time histogram
256us	1ms	4ms	16ms	64ms	256ms	1s	4s	16s	gt	max	tag
0.000	0.000	59.773	40.212	0.015	0.000	0.000	0.000	0.000	0.000	0.021	my5651_rel_o2nofp.cz12a_c24r64
0.000	0.000	96.585	3.414	0.001	0.000	0.000	0.000	0.000	0.000	0.017	my5744_rel_o2nofp.cz12a_c24r64
0.000	0.000	98.572	1.428	0.000	0.000	0.000	0.000	0.000	0.000	0.009	my8044_rel_o2nofp.cz12a_c24r64
0.000	0.000	99.300	0.700	0.000	0.000	0.000	0.000	0.000	0.000	0.014	my8407_rel_o2nofp.cz12a_c24r64
0.000	0.000	99.475	0.459	0.000	0.066	0.000	0.000	0.000	0.000	0.105	my9400_rel_o2nofp.cz12a_c24r64
0.000	0.000	98.200	1.581	0.011	0.208	0.000	0.000	0.000	0.000	0.112	my9500_rel_o2nofp.cz13a_c24r64
Delete response time histogram
256us	1ms	4ms	16ms	64ms	256ms	1s	4s	16s	gt	max	tag
0.000	0.000	74.811	25.184	0.005	0.000	0.000	0.000	0.000	0.000	0.018	my5651_rel_o2nofp.cz12a_c24r64
0.000	0.000	97.485	2.514	0.001	0.000	0.000	0.000	0.000	0.000	0.017	my5744_rel_o2nofp.cz12a_c24r64
0.000	0.000	99.422	0.578	0.000	0.000	0.000	0.000	0.000	0.000	0.012	my8044_rel_o2nofp.cz12a_c24r64
0.000	0.000	99.595	0.405	0.000	0.000	0.000	0.000	0.000	0.000	0.013	my8407_rel_o2nofp.cz12a_c24r64
0.000	0.000	99.722	0.224	0.000	0.055	0.000	0.000	0.000	0.000	0.104	my9400_rel_o2nofp.cz12a_c24r64
0.000	0.000	98.842	0.956	0.008	0.194	0.000	0.000	0.000	0.000	0.107	my9500_rel_o2nofp.cz13a_c24r64
qr1000.L5
- qr1000.L5: range queries with 1000 insert/s per client
- Legend for results is here.
- Each entry lists the percentage of responses that fit in that bucket (slower than max time for previous bucket, faster than min time for next bucket).
Query response time histogram
256us	1ms	4ms	16ms	64ms	256ms	1s	4s	16s	gt	max	tag
99.560	0.412	0.028	nonzero	nonzero	0.000	0.000	0.000	0.000	0.000	0.019	my5651_rel_o2nofp.cz12a_c24r64
99.915	0.079	0.006	nonzero	0.000	0.000	0.000	0.000	0.000	0.000	0.008	my5744_rel_o2nofp.cz12a_c24r64
99.870	0.123	0.006	nonzero	nonzero	0.000	0.000	0.000	0.000	0.000	0.039	my8044_rel_o2nofp.cz12a_c24r64
99.874	0.123	0.003	nonzero	0.000	0.000	0.000	0.000	0.000	0.000	0.006	my8407_rel_o2nofp.cz12a_c24r64
99.898	0.098	0.004	nonzero	0.000	0.000	0.000	0.000	0.000	0.000	0.007	my9400_rel_o2nofp.cz12a_c24r64
99.890	0.106	0.004	nonzero	0.000	0.000	0.000	0.000	0.000	0.000	0.006	my9500_rel_o2nofp.cz13a_c24r64
Insert response time histogram
256us	1ms	4ms	16ms	64ms	256ms	1s	4s	16s	gt	max	tag
0.000	0.000	25.334	74.628	0.037	0.000	0.000	0.000	0.000	0.000	0.029	my5651_rel_o2nofp.cz12a_c24r64
0.000	0.000	95.883	4.114	0.003	0.000	0.000	0.000	0.000	0.000	0.023	my5744_rel_o2nofp.cz12a_c24r64
0.000	0.000	93.533	6.403	0.064	0.000	0.000	0.000	0.000	0.000	0.051	my8044_rel_o2nofp.cz12a_c24r64
0.000	0.000	97.244	2.753	0.003	0.000	0.000	0.000	0.000	0.000	0.023	my8407_rel_o2nofp.cz12a_c24r64
0.000	0.000	96.761	2.641	0.021	0.577	0.000	0.000	0.000	0.000	0.110	my9400_rel_o2nofp.cz12a_c24r64
0.000	0.000	96.389	2.889	0.048	0.674	0.000	0.000	0.000	0.000	0.115	my9500_rel_o2nofp.cz13a_c24r64
Delete response time histogram
256us	1ms	4ms	16ms	64ms	256ms	1s	4s	16s	gt	max	tag
0.000	0.000	38.377	61.605	0.019	0.000	0.000	0.000	0.000	0.000	0.027	my5651_rel_o2nofp.cz12a_c24r64
0.000	0.000	96.723	3.275	0.002	0.000	0.000	0.000	0.000	0.000	0.019	my5744_rel_o2nofp.cz12a_c24r64
0.000	0.000	96.286	3.681	0.032	0.000	0.000	0.000	0.000	0.000	0.048	my8044_rel_o2nofp.cz12a_c24r64
0.000	0.000	98.634	1.363	0.002	0.000	0.000	0.000	0.000	0.000	0.028	my8407_rel_o2nofp.cz12a_c24r64
0.000	0.000	97.885	1.561	0.021	0.532	0.000	0.000	0.000	0.000	0.110	my9400_rel_o2nofp.cz12a_c24r64
0.000	0.000	97.719	1.589	0.047	0.645	0.000	0.000	0.000	0.000	0.107	my9500_rel_o2nofp.cz13a_c24r64
qp1000.L6
- qp1000.L6: point queries with 1000 insert/s per client
- Legend for results is here.
- Each entry lists the percentage of responses that fit in that bucket (slower than max time for previous bucket, faster than min time for next bucket).
Query response time histogram
256us	1ms	4ms	16ms	64ms	256ms	1s	4s	16s	gt	max	tag
99.535	0.439	0.026	nonzero	0.000	0.000	0.000	0.000	0.000	0.000	0.007	my5651_rel_o2nofp.cz12a_c24r64
99.867	0.127	0.006	nonzero	0.000	0.000	0.000	0.000	0.000	0.000	0.011	my5744_rel_o2nofp.cz12a_c24r64
98.941	1.051	0.008	nonzero	0.000	0.000	0.000	0.000	0.000	0.000	0.008	my8044_rel_o2nofp.cz12a_c24r64
98.749	1.245	0.006	nonzero	0.000	0.000	0.000	0.000	0.000	0.000	0.007	my8407_rel_o2nofp.cz12a_c24r64
99.225	0.770	0.004	nonzero	nonzero	0.000	0.000	0.000	0.000	0.000	0.017	my9400_rel_o2nofp.cz12a_c24r64
99.711	0.289	nonzero	nonzero	nonzero	0.000	0.000	0.000	0.000	0.000	0.018	my9500_rel_o2nofp.cz13a_c24r64
Insert response time histogram
256us	1ms	4ms	16ms	64ms	256ms	1s	4s	16s	gt	max	tag
0.000	0.000	29.318	70.656	0.026	0.000	0.000	0.000	0.000	0.000	0.024	my5651_rel_o2nofp.cz12a_c24r64
0.000	0.000	95.994	4.004	0.002	0.000	0.000	0.000	0.000	0.000	0.021	my5744_rel_o2nofp.cz12a_c24r64
0.000	0.000	92.257	7.743	nonzero	0.000	0.000	0.000	0.000	0.000	0.017	my8044_rel_o2nofp.cz12a_c24r64
0.000	0.000	94.376	5.622	0.002	0.000	0.000	0.000	0.000	0.000	0.018	my8407_rel_o2nofp.cz12a_c24r64
0.000	0.000	98.059	1.502	0.001	0.438	0.000	0.000	0.000	0.000	0.107	my9400_rel_o2nofp.cz12a_c24r64
0.000	0.000	99.444	0.217	0.004	0.335	0.000	0.000	0.000	0.000	0.105	my9500_rel_o2nofp.cz13a_c24r64
Delete response time histogram
256us	1ms	4ms	16ms	64ms	256ms	1s	4s	16s	gt	max	tag
0.000	0.000	45.090	54.897	0.013	0.000	0.000	0.000	0.000	0.000	0.024	my5651_rel_o2nofp.cz12a_c24r64
0.000	0.000	96.754	3.243	0.003	0.000	0.000	0.000	0.000	0.000	0.020	my5744_rel_o2nofp.cz12a_c24r64
0.000	0.000	95.322	4.678	0.000	0.000	0.000	0.000	0.000	0.000	0.016	my8044_rel_o2nofp.cz12a_c24r64
0.000	0.000	96.846	3.151	0.003	0.000	0.000	0.000	0.000	0.000	0.023	my8407_rel_o2nofp.cz12a_c24r64
0.000	0.000	98.680	0.890	nonzero	0.429	0.000	0.000	0.000	0.000	0.106	my9400_rel_o2nofp.cz12a_c24r64
0.000	0.000	99.468	0.198	0.004	0.331	0.000	0.000	0.000	0.000	0.105	my9500_rel_o2nofp.cz13a_c24r64