Introduction
This is a report for the insert benchmark with 200M docs and 20 client(s). It is generated by scripts (bash, awk, sed) and Tufte might not be impressed. An overview of the insert benchmark is here and a short update is here. Below, by DBMS, I mean DBMS+version.config. An example is my8020.c10b40 where my means MySQL, 8020 is version 8.0.20 and c10b40 is the name for the configuration file.
The test server has 48 cores, 128G RAM and 2 NVMe devices setup with SW RAID. The benchmark was run with 20 clients and there were 1 or 3 connections per client (1 for queries or inserts without rate limits, 1+1 for rate limited inserts+deletes). It uses 12 tables with a table per client. It loads 10M rows per table without secondary indexes, creates 3 secondary indexes per table, then inserts 40m+10m rows per table with a delete per insert to avoid growing the table. It then does 6 read+write tests for 3600s each that do queries as fast as possible with 100,100,500,500,1000,1000 inserts/s and the same for deletes/s per client concurrent with the queries. The database is cached. Clients and the DBMS share one server.
The tested DBMS are:
- pg1222_o2nofp.cx10a_c32r128 - Postgres 12.22 with the cx10a_c32r128 config
- pg1323_o2nofp.cx10a_c32r128 - Postgres 13.23 with the cx10a_c32r128 config
- pg1420_o2nofp.cx10a_c32r128 - Postgres 14.20 with the cx10a_c32r128 config
- pg1515_o2nofp.cx10a_c32r128 - Postgres 15.15 with the cx10a_c32r128 config
- pg1611_o2nofp.cx10a_c32r128 - Postgres 16.11 with the cx10a_c32r128 config
- pg177_o2nofp.cx10a_c32r128 - Postgres 17.7 with the cx10a_c32r128 config
- pg181_o2nofp.cx10b_c32r128 - Postgres 18.1 with the cx10b_c32r128 config that uses io_method=sync
Contents
- Summary
- l.i0: load without secondary indexes
- l.x: create secondary indexes
- l.i1: continue load after secondary indexes created with 50 inserts per transaction
- l.i2: continue load after secondary indexes created with 5 inserts per transaction
- qr100.L1: range queries with 100 insert/s per client
- qp100.L2: point queries with 100 insert/s per client
- qr500.L3: range queries with 500 insert/s per client
- qp500.L4: point queries with 500 insert/s per client
- qr1000.L5: range queries with 1000 insert/s per client
- qp1000.L6: point queries with 1000 insert/s per client
Summary
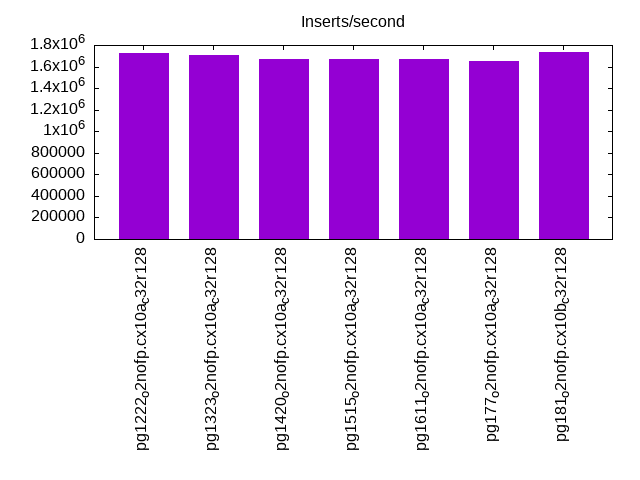
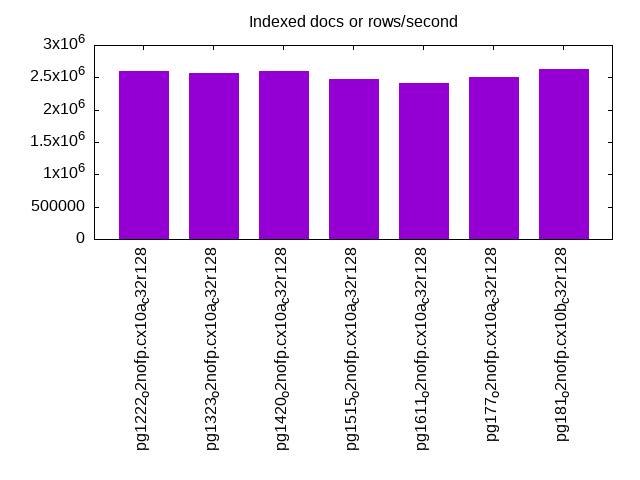
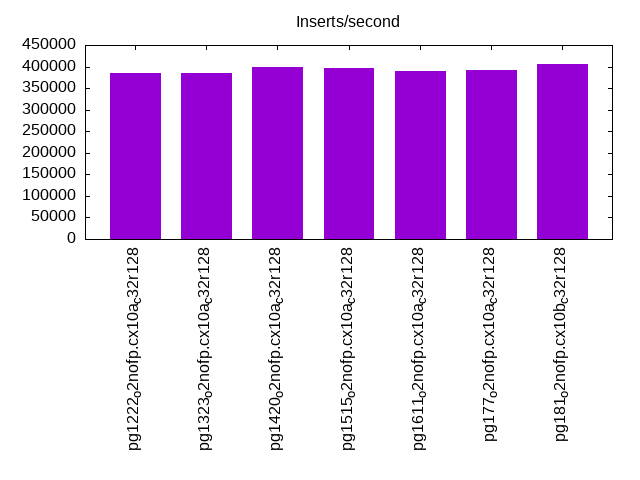
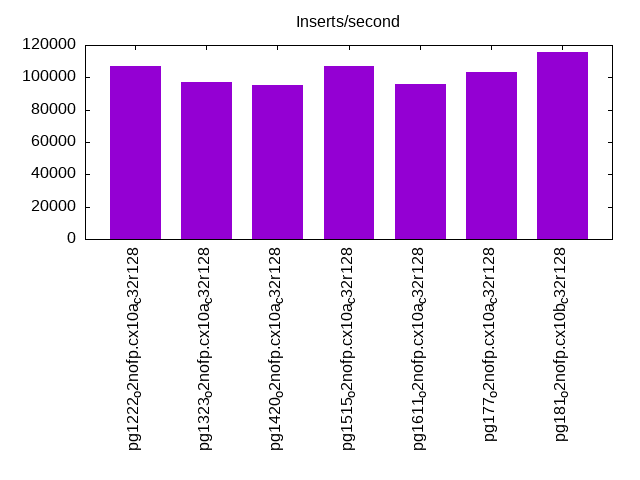
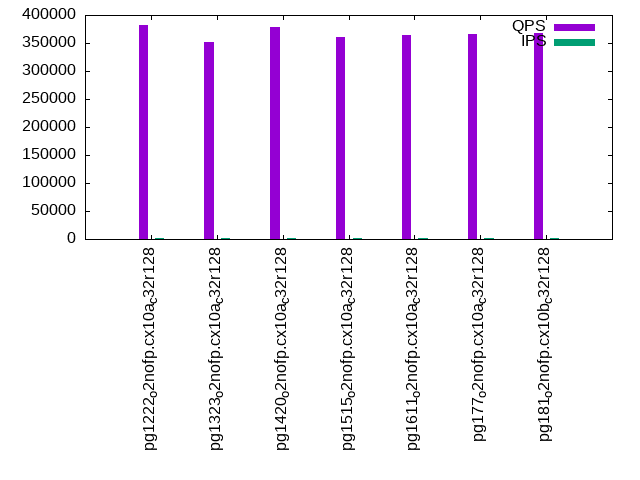
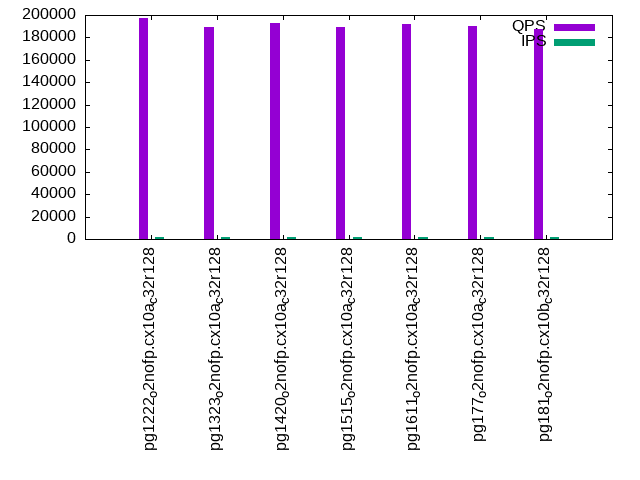
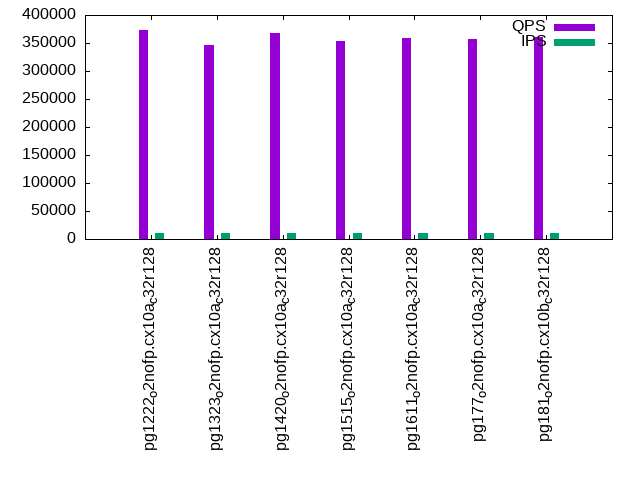
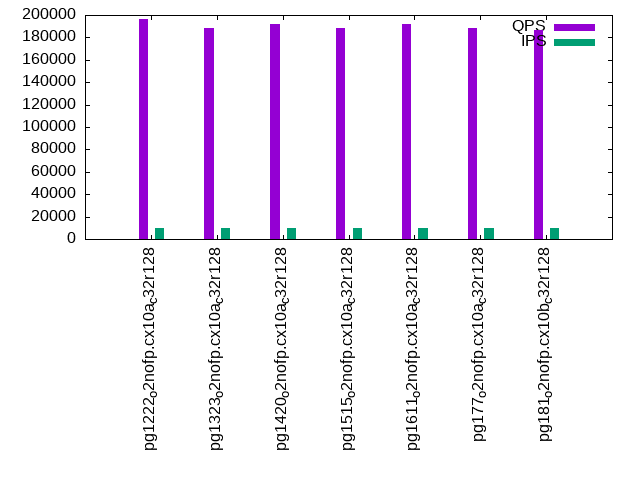
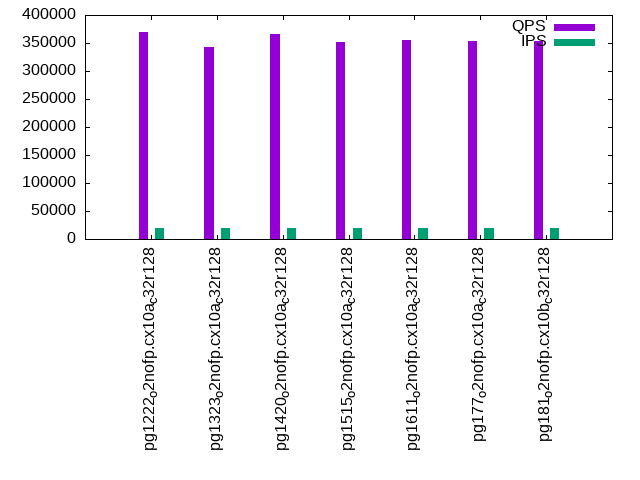
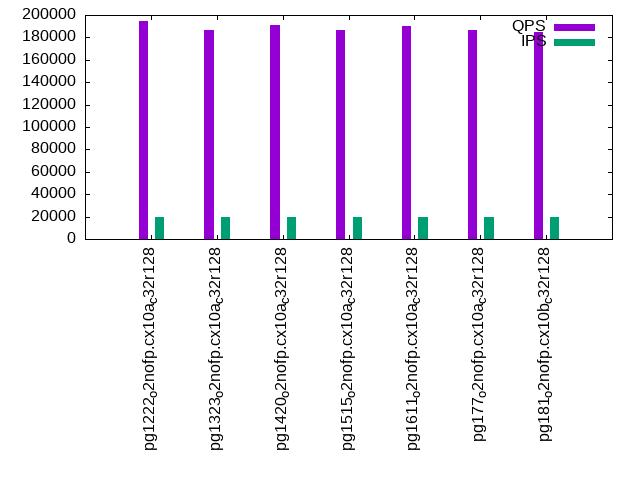
The numbers are inserts/s for l.i0, l.i1 and l.i2, indexed docs (or rows) /s for l.x and queries/s for qr100, qp100 thru qr1000, qp1000" The values are the average rate over the entire test for inserts (IPS) and queries (QPS). The range of values for IPS and QPS is split into 3 parts: bottom 25%, middle 50%, top 25%. Values in the bottom 25% have a red background, values in the top 25% have a green background and values in the middle have no color. A gray background is used for values that can be ignored because the DBMS did not sustain the target insert rate. Red backgrounds are not used when the minimum value is within 80% of the max value.
| dbms | l.i0 | l.x | l.i1 | l.i2 | qr100 | qp100 | qr500 | qp500 | qr1000 | qp1000 |
|---|---|---|---|---|---|---|---|---|---|---|
| pg1222_o2nofp.cx10a_c32r128 | 1724138 | 2597404 | 384615 | 106838 | 381257 | 197134 | 373679 | 196399 | 368957 | 194906 |
| pg1323_o2nofp.cx10a_c32r128 | 1709402 | 2564104 | 384615 | 96946 | 352616 | 189507 | 346789 | 188208 | 342124 | 186676 |
| pg1420_o2nofp.cx10a_c32r128 | 1666667 | 2597404 | 398605 | 95238 | 378340 | 192993 | 368460 | 191950 | 366756 | 190800 |
| pg1515_o2nofp.cx10a_c32r128 | 1666667 | 2469137 | 395648 | 107066 | 360188 | 189561 | 353318 | 188414 | 351054 | 186865 |
| pg1611_o2nofp.cx10a_c32r128 | 1666667 | 2409640 | 389484 | 95831 | 363641 | 192349 | 358226 | 191676 | 354700 | 190167 |
| pg177_o2nofp.cx10a_c32r128 | 1652892 | 2500001 | 391965 | 103413 | 365850 | 190048 | 357294 | 188399 | 354246 | 186922 |
| pg181_o2nofp.cx10b_c32r128 | 1739130 | 2631580 | 406091 | 115741 | 367323 | 187489 | 360974 | 186654 | 353185 | 184865 |
This table has relative throughput, throughput for the DBMS relative to the DBMS in the first line, using the absolute throughput from the previous table. Values less than 0.95 have a yellow background. Values greater than 1.05 have a blue background.
| dbms | l.i0 | l.x | l.i1 | l.i2 | qr100 | qp100 | qr500 | qp500 | qr1000 | qp1000 |
|---|---|---|---|---|---|---|---|---|---|---|
| pg1222_o2nofp.cx10a_c32r128 | 1.00 | 1.00 | 1.00 | 1.00 | 1.00 | 1.00 | 1.00 | 1.00 | 1.00 | 1.00 |
| pg1323_o2nofp.cx10a_c32r128 | 0.99 | 0.99 | 1.00 | 0.91 | 0.92 | 0.96 | 0.93 | 0.96 | 0.93 | 0.96 |
| pg1420_o2nofp.cx10a_c32r128 | 0.97 | 1.00 | 1.04 | 0.89 | 0.99 | 0.98 | 0.99 | 0.98 | 0.99 | 0.98 |
| pg1515_o2nofp.cx10a_c32r128 | 0.97 | 0.95 | 1.03 | 1.00 | 0.94 | 0.96 | 0.95 | 0.96 | 0.95 | 0.96 |
| pg1611_o2nofp.cx10a_c32r128 | 0.97 | 0.93 | 1.01 | 0.90 | 0.95 | 0.98 | 0.96 | 0.98 | 0.96 | 0.98 |
| pg177_o2nofp.cx10a_c32r128 | 0.96 | 0.96 | 1.02 | 0.97 | 0.96 | 0.96 | 0.96 | 0.96 | 0.96 | 0.96 |
| pg181_o2nofp.cx10b_c32r128 | 1.01 | 1.01 | 1.06 | 1.08 | 0.96 | 0.95 | 0.97 | 0.95 | 0.96 | 0.95 |
This lists the average rate of inserts/s for the tests that do inserts concurrent with queries. For such tests the query rate is listed in the table above. The read+write tests are setup so that the insert rate should match the target rate every second. Cells that are not at least 95% of the target have a red background to indicate a failure to satisfy the target.
| dbms | qr100.L1 | qp100.L2 | qr500.L3 | qp500.L4 | qr1000.L5 | qp1000.L6 |
|---|---|---|---|---|---|---|
| pg1222_o2nofp.cx10a_c32r128 | 1987 | 1988 | 9939 | 9936 | 19868 | 19868 |
| pg1323_o2nofp.cx10a_c32r128 | 1987 | 1987 | 9936 | 9936 | 19868 | 19868 |
| pg1420_o2nofp.cx10a_c32r128 | 1987 | 1988 | 9939 | 9936 | 19868 | 19868 |
| pg1515_o2nofp.cx10a_c32r128 | 1988 | 1988 | 9936 | 9936 | 19873 | 19873 |
| pg1611_o2nofp.cx10a_c32r128 | 1987 | 1987 | 9936 | 9936 | 19868 | 19868 |
| pg177_o2nofp.cx10a_c32r128 | 1987 | 1987 | 9934 | 9936 | 19868 | 19868 |
| pg181_o2nofp.cx10b_c32r128 | 1987 | 1987 | 9934 | 9936 | 19868 | 19868 |
| target | 2000 | 2000 | 10000 | 10000 | 20000 | 20000 |
l.i0
l.i0: load without secondary indexes. Graphs for performance per 1-second interval are here.
Average throughput:
Insert response time histogram: each cell has the percentage of responses that take <= the time in the header and max is the max response time in seconds. For the max column values in the top 25% of the range have a red background and in the bottom 25% of the range have a green background. The red background is not used when the min value is within 80% of the max value.
| dbms | 256us | 1ms | 4ms | 16ms | 64ms | 256ms | 1s | 4s | 16s | gt | max |
|---|---|---|---|---|---|---|---|---|---|---|---|
| pg1222_o2nofp.cx10a_c32r128 | 96.059 | 3.897 | 0.020 | 0.004 | 0.018 | 0.002 | 0.389 | ||||
| pg1323_o2nofp.cx10a_c32r128 | 94.636 | 5.326 | 0.016 | 0.002 | 0.018 | 0.002 | 0.462 | ||||
| pg1420_o2nofp.cx10a_c32r128 | 92.085 | 7.874 | 0.015 | 0.009 | 0.013 | 0.004 | 0.527 | ||||
| pg1515_o2nofp.cx10a_c32r128 | 93.852 | 6.111 | 0.019 | 0.001 | 0.008 | 0.009 | 0.842 | ||||
| pg1611_o2nofp.cx10a_c32r128 | 93.267 | 6.702 | 0.012 | 0.001 | 0.011 | 0.007 | 0.755 | ||||
| pg177_o2nofp.cx10a_c32r128 | 92.862 | 7.083 | 0.037 | 0.002 | 0.007 | 0.009 | 0.999 | ||||
| pg181_o2nofp.cx10b_c32r128 | 95.800 | 4.161 | 0.015 | 0.005 | 0.012 | 0.007 | 0.412 |
Performance metrics for the DBMS listed above. Some are normalized by throughput, others are not. Legend for results is here.
ips	qps	rps	rmbps	wps	wmbps	rpq	rkbpq	wpi	wkbpi	csps	cpups	cspq	cpupq	dbgb1	dbgb2	rss	maxop	p50	p99	tag
1724138	0	3	0.0	6888.2	725.1	0.000	0.000	0.004	0.431	242515	47.0	0.141	13	19.1	51.6	1.8	0.389	115577	58892	pg1222_o2nofp.cx10a_c32r128
1709402	0	4	0.0	6935.8	729.3	0.000	0.000	0.004	0.437	261605	47.0	0.153	13	19.1	51.7	1.9	0.462	113403	53643	pg1323_o2nofp.cx10a_c32r128
1666667	0	1	0.0	6673.1	703.9	0.000	0.000	0.004	0.432	281636	46.1	0.169	13	19.1	51.7	6.5	0.527	110681	52559	pg1420_o2nofp.cx10a_c32r128
1666667	0	3	0.0	6672.6	703.9	0.000	0.000	0.004	0.432	257177	45.6	0.154	13	19.1	51.7	1.9	0.842	112466	48246	pg1515_o2nofp.cx10a_c32r128
1666667	0	4	0.0	6620.4	701.9	0.000	0.000	0.004	0.431	265641	45.7	0.159	13	19.1	51.7	3.1	0.755	111080	34363	pg1611_o2nofp.cx10a_c32r128
1652892	0	4	0.0	6617.2	705.5	0.000	0.000	0.004	0.437	281310	45.2	0.170	13	19.1	51.7	0.5	0.999	110881	19479	pg177_o2nofp.cx10a_c32r128
1739130	0	4	0.0	6939.6	732.0	0.000	0.000	0.004	0.431	263133	46.5	0.151	13	19.1	51.7	0.4	0.412	116175	55241	pg181_o2nofp.cx10b_c32r128
Average values from iostat.
r/s	rkB/s	rrqm/s	%rrqm	r_await	rareq-s	w/s	wkB/s	wrqm/s	%wrqm	w_await	wareq-s	d/s	dkB/s	drqm/s	%drqm	d_await	dareq-s	f/s	f_await	aqu-sz	%util
0.113	0.452	0.000	0.000	0.048	0.522	6001.2	742599	904.2	12.28	1.607	122.7	0.000	0.000	0.000	0.000	0.000	0.000	0.000	0.000	10.88	55.24		pg1222_o2nofp.cx10a_c32r128
0.130	1.322	0.000	0.000	0.041	3.217	6038.9	746911	913.9	12.41	2.269	122.7	0.000	0.000	0.000	0.000	0.000	0.000	0.000	0.000	16.56	56.42		pg1323_o2nofp.cx10a_c32r128
0.325	1.633	0.000	0.000	0.076	2.778	5856.7	720815	833.3	11.77	1.702	122.2	0.000	0.000	0.000	0.000	0.000	0.000	0.000	0.000	11.55	60.38		pg1420_o2nofp.cx10a_c32r128
0.175	0.767	0.000	0.000	0.158	1.333	5829.5	720856	855.2	12.03	2.357	122.6	0.000	0.000	0.000	0.000	0.000	0.000	0.000	0.000	16.65	58.64		pg1515_o2nofp.cx10a_c32r128
0.758	3.467	0.108	3.869	0.177	3.833	5819.7	718777	816.8	11.54	1.520	122.7	0.000	0.000	0.000	0.000	0.000	0.000	0.000	0.000	9.813	59.09		pg1611_o2nofp.cx10a_c32r128
0.892	7.800	1.000	3.906	0.231	5.271	5824.6	722543	808.4	11.64	1.905	123.1	0.000	0.000	0.000	0.000	0.000	0.000	0.000	0.000	11.45	58.12		pg177_o2nofp.cx10a_c32r128
0.217	0.904	0.000	0.000	0.110	1.101	6043.3	748679	901.7	12.17	2.471	123.0	0.000	0.000	0.000	0.000	0.000	0.000	0.000	0.000	17.01	57.43		pg181_o2nofp.cx10b_c32r128
l.x
l.x: create secondary indexes.
Average throughput:
Performance metrics for the DBMS listed above. Some are normalized by throughput, others are not. Legend for results is here.
ips	qps	rps	rmbps	wps	wmbps	rpq	rkbpq	wpi	wkbpi	csps	cpups	cspq	cpupq	dbgb1	dbgb2	rss	maxop	p50	p99	tag
2597404	0	4	0.0	6350.2	730.8	0.000	0.000	0.002	0.288	104583	17.6	0.040	3	38.4	88.5	6.9	0.042	NA	NA	pg1222_o2nofp.cx10a_c32r128
2564104	0	4	0.0	6169.0	711.9	0.000	0.000	0.002	0.284	96915	16.9	0.038	3	38.4	88.6	6.9	0.037	NA	NA	pg1323_o2nofp.cx10a_c32r128
2597404	0	2	0.0	6299.9	726.1	0.000	0.000	0.002	0.286	101631	17.6	0.039	3	38.4	88.6	6.9	0.028	NA	NA	pg1420_o2nofp.cx10a_c32r128
2469137	0	4	0.0	6057.1	699.2	0.000	0.000	0.002	0.290	100757	15.8	0.041	3	38.4	88.6	6.9	0.048	NA	NA	pg1515_o2nofp.cx10a_c32r128
2409640	0	4	0.0	5785.4	667.8	0.000	0.000	0.002	0.284	101620	15.9	0.042	3	38.4	88.6	6.9	0.032	NA	NA	pg1611_o2nofp.cx10a_c32r128
2500001	0	137	7.6	6314.4	731.1	0.000	0.003	0.003	0.299	40160	15.2	0.016	3	38.4	88.5	7.2	0.038	NA	NA	pg177_o2nofp.cx10a_c32r128
2631580	0	4	0.0	6928.7	804.6	0.000	0.000	0.003	0.313	42080	15.6	0.016	3	38.4	88.5	7.2	0.037	NA	NA	pg181_o2nofp.cx10b_c32r128
Average values from iostat.
r/s	rkB/s	rrqm/s	%rrqm	r_await	rareq-s	w/s	wkB/s	wrqm/s	%wrqm	w_await	wareq-s	d/s	dkB/s	drqm/s	%drqm	d_await	dareq-s	f/s	f_await	aqu-sz	%util
0.160	0.640	0.000	0.000	0.024	0.533	5946.6	748357	419.0	6.723	4.406	125.7	0.000	0.000	0.000	0.000	0.000	0.000	0.000	0.000	28.30	35.64		pg1222_o2nofp.cx10a_c32r128
0.213	1.000	0.000	0.000	0.146	2.250	5790.2	729090	395.1	6.579	5.164	125.8	0.000	0.000	0.000	0.000	0.000	0.000	0.000	0.000	30.37	35.06		pg1323_o2nofp.cx10a_c32r128
0.027	0.107	0.000	0.000	0.067	0.533	5910.5	743621	406.2	6.889	5.073	125.5	0.000	0.000	0.000	0.000	0.000	0.000	0.000	0.000	32.03	35.42		pg1420_o2nofp.cx10a_c32r128
0.987	3.950	0.000	0.000	0.511	3.750	5668.4	714075	388.0	6.594	5.408	125.7	0.000	0.000	0.000	0.000	0.000	0.000	0.000	0.000	32.93	37.95		pg1515_o2nofp.cx10a_c32r128
0.612	2.500	0.000	0.000	0.205	2.333	5429.8	683874	371.1	6.644	7.455	125.9	0.000	0.000	0.000	0.000	0.000	0.000	0.000	0.000	39.47	40.63		pg1611_o2nofp.cx10a_c32r128
36.51	2082.3	0.713	2.509	0.117	10.35	5938.0	748672	389.8	10.33	4.952	118.7	0.000	0.000	0.000	0.000	0.000	0.000	0.000	0.000	51.63	46.99		pg177_o2nofp.cx10a_c32r128
0.067	0.267	0.000	0.000	0.027	0.267	6527.1	823990	416.8	6.722	5.163	126.0	0.000	0.000	0.000	0.000	0.000	0.000	0.000	0.000	42.36	44.16		pg181_o2nofp.cx10b_c32r128
l.i1
l.i1: continue load after secondary indexes created with 50 inserts per transaction. Graphs for performance per 1-second interval are here.
Average throughput:
Insert response time histogram: each cell has the percentage of responses that take <= the time in the header and max is the max response time in seconds. For the max column values in the top 25% of the range have a red background and in the bottom 25% of the range have a green background. The red background is not used when the min value is within 80% of the max value.
| dbms | 256us | 1ms | 4ms | 16ms | 64ms | 256ms | 1s | 4s | 16s | gt | max |
|---|---|---|---|---|---|---|---|---|---|---|---|
| pg1222_o2nofp.cx10a_c32r128 | 0.787 | 90.267 | 8.419 | 0.525 | 0.002 | nonzero | 0.295 | ||||
| pg1323_o2nofp.cx10a_c32r128 | 1.134 | 89.955 | 8.479 | 0.430 | 0.002 | nonzero | 0.257 | ||||
| pg1420_o2nofp.cx10a_c32r128 | 1.499 | 90.957 | 7.085 | 0.457 | 0.001 | nonzero | 0.479 | ||||
| pg1515_o2nofp.cx10a_c32r128 | 1.053 | 91.307 | 7.158 | 0.479 | 0.003 | nonzero | 0.562 | ||||
| pg1611_o2nofp.cx10a_c32r128 | 1.733 | 90.489 | 7.318 | 0.458 | 0.002 | nonzero | 0.323 | ||||
| pg177_o2nofp.cx10a_c32r128 | 1.780 | 89.976 | 7.768 | 0.472 | 0.002 | 0.001 | 0.811 | ||||
| pg181_o2nofp.cx10b_c32r128 | 1.788 | 90.473 | 7.262 | 0.472 | 0.003 | 0.001 | nonzero | 1.052 |
Delete response time histogram: each cell has the percentage of responses that take <= the time in the header and max is the max response time in seconds. For the max column values in the top 25% of the range have a red background and in the bottom 25% of the range have a green background. The red background is not used when the min value is within 80% of the max value.
| dbms | 256us | 1ms | 4ms | 16ms | 64ms | 256ms | 1s | 4s | 16s | gt | max |
|---|---|---|---|---|---|---|---|---|---|---|---|
| pg1222_o2nofp.cx10a_c32r128 | 18.524 | 78.049 | 3.172 | 0.254 | 0.002 | nonzero | 0.292 | ||||
| pg1323_o2nofp.cx10a_c32r128 | 15.499 | 80.855 | 3.453 | 0.192 | 0.002 | nonzero | 0.259 | ||||
| pg1420_o2nofp.cx10a_c32r128 | 15.543 | 81.249 | 3.002 | 0.206 | 0.001 | nonzero | 0.478 | ||||
| pg1515_o2nofp.cx10a_c32r128 | 18.633 | 78.321 | 2.840 | 0.204 | 0.002 | nonzero | 0.537 | ||||
| pg1611_o2nofp.cx10a_c32r128 | 15.203 | 80.961 | 3.635 | 0.199 | 0.002 | nonzero | 0.324 | ||||
| pg177_o2nofp.cx10a_c32r128 | 19.193 | 77.380 | 3.217 | 0.208 | 0.002 | 0.001 | 0.809 | ||||
| pg181_o2nofp.cx10b_c32r128 | 19.438 | 77.351 | 3.010 | 0.199 | 0.002 | 0.001 | 0.686 |
Performance metrics for the DBMS listed above. Some are normalized by throughput, others are not. Legend for results is here.
ips	qps	rps	rmbps	wps	wmbps	rpq	rkbpq	wpi	wkbpi	csps	cpups	cspq	cpupq	dbgb1	dbgb2	rss	maxop	p50	p99	tag
384615	0	218	4.0	6347.9	584.7	0.001	0.011	0.017	1.557	268340	55.8	0.698	70	60.9	157.0	57.1	0.295	21127	4146	pg1222_o2nofp.cx10a_c32r128
384615	0	292	2.7	6133.3	567.6	0.001	0.007	0.016	1.511	253909	57.2	0.660	71	60.6	156.6	42.0	0.257	21388	4196	pg1323_o2nofp.cx10a_c32r128
398605	0	390	2.3	6157.7	576.4	0.001	0.006	0.015	1.481	291932	56.1	0.732	68	58.4	154.4	42.9	0.479	22775	4245	pg1420_o2nofp.cx10a_c32r128
395648	0	446	2.1	6113.2	573.0	0.001	0.005	0.015	1.483	286858	55.1	0.725	67	58.6	154.6	47.3	0.562	22298	3996	pg1515_o2nofp.cx10a_c32r128
389484	0	260	1.2	5893.6	559.2	0.001	0.003	0.015	1.470	271406	56.2	0.697	69	58.1	154.2	51.7	0.323	21869	3946	pg1611_o2nofp.cx10a_c32r128
391965	0	270	1.2	5950.7	565.0	0.001	0.003	0.015	1.476	252926	53.7	0.645	66	58.2	154.3	14.7	0.811	22725	3646	pg177_o2nofp.cx10a_c32r128
406091	0	25	0.1	6195.3	587.1	0.000	0.000	0.015	1.480	250964	55.3	0.618	65	58.2	154.3	40.5	1.052	23025	3246	pg181_o2nofp.cx10b_c32r128
Average values from iostat.
r/s	rkB/s	rrqm/s	%rrqm	r_await	rareq-s	w/s	wkB/s	wrqm/s	%wrqm	w_await	wareq-s	d/s	dkB/s	drqm/s	%drqm	d_await	dareq-s	f/s	f_await	aqu-sz	%util
101.8	1772.8	0.059	1.295	0.039	3.585	6075.4	599081	357.6	4.997	0.163	98.10	0.000	0.000	0.000	0.000	0.000	0.000	0.000	0.000	1.217	95.75		pg1222_o2nofp.cx10a_c32r128
139.5	1206.2	0.030	0.635	0.061	4.425	5881.3	581331	290.7	4.274	0.193	98.24	0.000	0.000	0.000	0.000	0.000	0.000	0.000	0.000	1.333	95.08		pg1323_o2nofp.cx10a_c32r128
187.5	1054.8	0.024	0.954	0.054	3.774	5968.6	590431	230.7	2.956	0.163	98.77	0.000	0.000	0.000	0.000	0.000	0.000	0.000	0.000	1.182	96.01		pg1420_o2nofp.cx10a_c32r128
216.3	1015.1	0.054	0.747	0.063	3.735	5916.9	586932	235.1	3.061	0.202	99.12	0.000	0.000	0.000	0.000	0.000	0.000	0.000	0.000	1.426	95.63		pg1515_o2nofp.cx10a_c32r128
125.4	568.3	0.017	0.393	0.046	2.709	5709.9	572740	222.0	2.969	0.214	100.3	0.000	0.000	0.000	0.000	0.000	0.000	0.000	0.000	1.429	95.21		pg1611_o2nofp.cx10a_c32r128
126.6	582.2	0.040	0.798	0.034	1.577	5761.3	578672	227.9	2.988	0.278	100.1	0.000	0.000	0.000	0.000	0.000	0.000	0.000	0.000	1.926	93.60		pg177_o2nofp.cx10a_c32r128
11.50	56.03	0.025	0.705	0.044	1.166	5999.6	601368	236.0	2.919	0.192	100.2	0.000	0.000	0.000	0.000	0.000	0.000	0.000	0.000	1.335	95.30		pg181_o2nofp.cx10b_c32r128
l.i2
l.i2: continue load after secondary indexes created with 5 inserts per transaction. Graphs for performance per 1-second interval are here.
Average throughput:
Insert response time histogram: each cell has the percentage of responses that take <= the time in the header and max is the max response time in seconds. For the max column values in the top 25% of the range have a red background and in the bottom 25% of the range have a green background. The red background is not used when the min value is within 80% of the max value.
| dbms | 256us | 1ms | 4ms | 16ms | 64ms | 256ms | 1s | 4s | 16s | gt | max |
|---|---|---|---|---|---|---|---|---|---|---|---|
| pg1222_o2nofp.cx10a_c32r128 | 86.403 | 12.862 | 0.713 | 0.021 | nonzero | nonzero | 0.118 | ||||
| pg1323_o2nofp.cx10a_c32r128 | 86.259 | 13.141 | 0.587 | 0.013 | nonzero | nonzero | 0.089 | ||||
| pg1420_o2nofp.cx10a_c32r128 | 87.534 | 11.965 | 0.484 | 0.017 | nonzero | nonzero | 0.086 | ||||
| pg1515_o2nofp.cx10a_c32r128 | 83.334 | 15.882 | 0.755 | 0.028 | nonzero | nonzero | 0.091 | ||||
| pg1611_o2nofp.cx10a_c32r128 | 84.667 | 14.786 | 0.532 | 0.015 | nonzero | nonzero | 0.088 | ||||
| pg177_o2nofp.cx10a_c32r128 | 90.919 | 8.875 | 0.198 | 0.009 | nonzero | nonzero | 0.096 | ||||
| pg181_o2nofp.cx10b_c32r128 | 88.676 | 11.052 | 0.256 | 0.016 | nonzero | nonzero | 0.092 |
Delete response time histogram: each cell has the percentage of responses that take <= the time in the header and max is the max response time in seconds. For the max column values in the top 25% of the range have a red background and in the bottom 25% of the range have a green background. The red background is not used when the min value is within 80% of the max value.
| dbms | 256us | 1ms | 4ms | 16ms | 64ms | 256ms | 1s | 4s | 16s | gt | max |
|---|---|---|---|---|---|---|---|---|---|---|---|
| pg1222_o2nofp.cx10a_c32r128 | 3.247 | 57.993 | 38.740 | 0.020 | nonzero | nonzero | 0.118 | ||||
| pg1323_o2nofp.cx10a_c32r128 | 2.051 | 50.409 | 47.527 | 0.013 | nonzero | nonzero | 0.089 | ||||
| pg1420_o2nofp.cx10a_c32r128 | 2.058 | 47.596 | 50.320 | 0.025 | nonzero | nonzero | 0.087 | ||||
| pg1515_o2nofp.cx10a_c32r128 | 1.844 | 56.348 | 41.774 | 0.034 | nonzero | nonzero | 0.091 | ||||
| pg1611_o2nofp.cx10a_c32r128 | 1.557 | 46.737 | 51.685 | 0.020 | nonzero | nonzero | 0.088 | ||||
| pg177_o2nofp.cx10a_c32r128 | 2.349 | 53.044 | 44.559 | 0.048 | nonzero | nonzero | 0.096 | ||||
| pg181_o2nofp.cx10b_c32r128 | 1.902 | 71.647 | 26.384 | 0.067 | 0.001 | nonzero | 0.092 |
Performance metrics for the DBMS listed above. Some are normalized by throughput, others are not. Legend for results is here.
ips	qps	rps	rmbps	wps	wmbps	rpq	rkbpq	wpi	wkbpi	csps	cpups	cspq	cpupq	dbgb1	dbgb2	rss	maxop	p50	p99	tag
106838	0	0	0.0	1697.8	157.8	0.000	0.000	0.016	1.512	400778	57.2	3.751	257	60.1	156.2	25.9	0.118	4385	2576	pg1222_o2nofp.cx10a_c32r128
96946	0	2	0.0	1485.6	135.8	0.000	0.000	0.015	1.435	375633	55.8	3.875	276	59.9	156.0	31.3	0.089	3910	2478	pg1323_o2nofp.cx10a_c32r128
95238	0	5	0.4	1433.6	132.5	0.000	0.004	0.015	1.425	388817	54.0	4.083	272	57.9	154.0	24.0	0.086	4485	3277	pg1420_o2nofp.cx10a_c32r128
107066	0	2	0.0	1601.0	148.4	0.000	0.000	0.015	1.419	417590	56.7	3.900	254	58.0	154.0	29.5	0.091	4700	3323	pg1515_o2nofp.cx10a_c32r128
95831	0	1	0.0	1421.8	132.4	0.000	0.000	0.015	1.414	387079	54.9	4.039	275	57.6	153.7	34.0	0.088	3916	2892	pg1611_o2nofp.cx10a_c32r128
103413	0	0	0.0	1550.3	143.9	0.000	0.000	0.015	1.425	389472	54.6	3.766	253	57.8	153.8	27.2	0.096	4860	3626	pg177_o2nofp.cx10a_c32r128
115741	0	7	0.3	1919.1	178.6	0.000	0.003	0.017	1.580	422970	57.1	3.654	237	57.6	153.7	40.3	0.092	5386	2473	pg181_o2nofp.cx10b_c32r128
Average values from iostat.
r/s	rkB/s	rrqm/s	%rrqm	r_await	rareq-s	w/s	wkB/s	wrqm/s	%wrqm	w_await	wareq-s	d/s	dkB/s	drqm/s	%drqm	d_await	dareq-s	f/s	f_await	aqu-sz	%util
0.070	1.155	0.047	0.202	0.012	1.782	1661.2	161657	57.10	3.069	0.071	97.70	0.000	0.000	0.000	0.000	0.000	0.000	0.000	0.000	0.119	43.30		pg1222_o2nofp.cx10a_c32r128
0.466	6.652	0.183	0.205	0.038	6.207	1447.0	139192	63.08	4.124	0.070	97.03	0.000	0.000	0.000	0.000	0.000	0.000	0.000	0.000	0.098	39.25		pg1323_o2nofp.cx10a_c32r128
0.484	13.07	0.145	0.907	0.033	4.915	1403.6	135818	56.70	3.345	0.074	97.74	0.000	0.000	0.000	0.000	0.000	0.000	0.000	0.000	0.109	37.16		pg1420_o2nofp.cx10a_c32r128
0.430	4.738	0.204	0.565	0.028	3.795	1567.1	152025	53.36	2.625	0.070	97.51	0.000	0.000	0.000	0.000	0.000	0.000	0.000	0.000	0.116	40.52		pg1515_o2nofp.cx10a_c32r128
0.182	2.179	0.001	0.109	0.024	2.810	1393.8	135612	46.69	2.485	0.069	98.58	0.000	0.000	0.000	0.000	0.000	0.000	0.000	0.000	0.097	37.06		pg1611_o2nofp.cx10a_c32r128
0.217	1.809	0.000	0.000	0.021	1.809	1519.8	147424	49.77	2.396	0.071	98.00	0.000	0.000	0.000	0.000	0.000	0.000	0.000	0.000	0.109	39.39		pg177_o2nofp.cx10a_c32r128
1.624	37.95	0.024	0.068	0.034	3.943	1882.6	182941	57.88	2.231	0.081	98.37	0.000	0.000	0.000	0.000	0.000	0.000	0.000	0.000	0.158	45.11		pg181_o2nofp.cx10b_c32r128
qr100.L1
qr100.L1: range queries with 100 insert/s per client. Graphs for performance per 1-second interval are here.
Average throughput:
Query response time histogram: each cell has the percentage of responses that take <= the time in the header and max is the max response time in seconds. For max values in the top 25% of the range have a red background and in the bottom 25% of the range have a green background. The red background is not used when the min value is within 80% of the max value.
| dbms | 256us | 1ms | 4ms | 16ms | 64ms | 256ms | 1s | 4s | 16s | gt | max |
|---|---|---|---|---|---|---|---|---|---|---|---|
| pg1222_o2nofp.cx10a_c32r128 | 99.998 | 0.001 | 0.001 | nonzero | nonzero | 0.043 | |||||
| pg1323_o2nofp.cx10a_c32r128 | 99.998 | 0.001 | 0.001 | nonzero | 0.011 | ||||||
| pg1420_o2nofp.cx10a_c32r128 | 99.998 | 0.001 | 0.001 | nonzero | 0.012 | ||||||
| pg1515_o2nofp.cx10a_c32r128 | 99.998 | 0.001 | 0.001 | nonzero | 0.008 | ||||||
| pg1611_o2nofp.cx10a_c32r128 | 99.998 | 0.001 | 0.001 | nonzero | 0.008 | ||||||
| pg177_o2nofp.cx10a_c32r128 | 99.998 | 0.001 | 0.001 | nonzero | 0.008 | ||||||
| pg181_o2nofp.cx10b_c32r128 | 99.998 | 0.001 | 0.001 | nonzero | nonzero | nonzero | 0.084 |
Insert response time histogram: each cell has the percentage of responses that take <= the time in the header and max is the max response time in seconds. For max values in the top 25% of the range have a red background and in the bottom 25% of the range have a green background. The red background is not used when the min value is within 80% of the max value.
| dbms | 256us | 1ms | 4ms | 16ms | 64ms | 256ms | 1s | 4s | 16s | gt | max |
|---|---|---|---|---|---|---|---|---|---|---|---|
| pg1222_o2nofp.cx10a_c32r128 | 99.808 | 0.174 | 0.017 | 0.045 | |||||||
| pg1323_o2nofp.cx10a_c32r128 | 99.805 | 0.195 | 0.010 | ||||||||
| pg1420_o2nofp.cx10a_c32r128 | 0.001 | 99.823 | 0.176 | 0.014 | |||||||
| pg1515_o2nofp.cx10a_c32r128 | 99.833 | 0.167 | 0.011 | ||||||||
| pg1611_o2nofp.cx10a_c32r128 | 0.001 | 99.829 | 0.170 | 0.010 | |||||||
| pg177_o2nofp.cx10a_c32r128 | 0.019 | 99.828 | 0.152 | 0.010 | |||||||
| pg181_o2nofp.cx10b_c32r128 | 0.144 | 99.635 | 0.199 | 0.021 | 0.023 |
Delete response time histogram: each cell has the percentage of responses that take <= the time in the header and max is the max response time in seconds. For max values in the top 25% of the range have a red background and in the bottom 25% of the range have a green background. The red background is not used when the min value is within 80% of the max value.
| dbms | 256us | 1ms | 4ms | 16ms | 64ms | 256ms | 1s | 4s | 16s | gt | max |
|---|---|---|---|---|---|---|---|---|---|---|---|
| pg1222_o2nofp.cx10a_c32r128 | 50.335 | 49.621 | 0.032 | 0.013 | 0.045 | ||||||
| pg1323_o2nofp.cx10a_c32r128 | 46.558 | 53.408 | 0.033 | 0.010 | |||||||
| pg1420_o2nofp.cx10a_c32r128 | 41.471 | 58.501 | 0.028 | 0.008 | |||||||
| pg1515_o2nofp.cx10a_c32r128 | 46.689 | 53.295 | 0.016 | 0.006 | |||||||
| pg1611_o2nofp.cx10a_c32r128 | 41.434 | 58.544 | 0.022 | 0.008 | |||||||
| pg177_o2nofp.cx10a_c32r128 | 43.464 | 56.519 | 0.017 | 0.007 | |||||||
| pg181_o2nofp.cx10b_c32r128 | 66.289 | 33.631 | 0.073 | 0.008 | 0.021 |
Performance metrics for the DBMS listed above. Some are normalized by throughput, others are not. Legend for results is here.
ips	qps	rps	rmbps	wps	wmbps	rpq	rkbpq	wpi	wkbpi	csps	cpups	cspq	cpupq	dbgb1	dbgb2	rss	maxop	p50	p99	tag
1987	381257	0	0.0	255.9	14.3	0.000	0.000	0.129	7.361	1454336	42.9	3.815	54	60.0	152.1	62.1	0.043	19173	18371	pg1222_o2nofp.cx10a_c32r128
1987	352616	0	0.0	264.1	14.5	0.000	0.000	0.133	7.456	1345170	42.8	3.815	58	59.7	155.8	61.8	0.011	17725	17052	pg1323_o2nofp.cx10a_c32r128
1987	378340	0	0.0	258.7	14.4	0.000	0.000	0.130	7.424	1443298	42.6	3.815	54	57.8	153.9	59.4	0.012	18860	18141	pg1420_o2nofp.cx10a_c32r128
1988	360188	0	0.0	254.3	14.4	0.000	0.000	0.128	7.414	1373572	42.7	3.813	57	57.9	154.0	0.8	0.008	18028	17283	pg1515_o2nofp.cx10a_c32r128
1987	363641	0	0.0	251.5	14.4	0.000	0.000	0.127	7.398	1387050	42.8	3.814	56	57.6	153.7	2.6	0.008	18476	17721	pg1611_o2nofp.cx10a_c32r128
1987	365850	0	0.0	250.1	14.4	0.000	0.000	0.126	7.398	1395304	42.9	3.814	56	57.8	153.8	59.4	0.008	18444	17635	pg177_o2nofp.cx10a_c32r128
1987	367323	0	0.0	240.9	14.7	0.000	0.000	0.121	7.576	1401102	42.8	3.814	56	57.6	148.3	0.9	0.084	18590	17811	pg181_o2nofp.cx10b_c32r128
Average values from iostat.
r/s	rkB/s	rrqm/s	%rrqm	r_await	rareq-s	w/s	wkB/s	wrqm/s	%wrqm	w_await	wareq-s	d/s	dkB/s	drqm/s	%drqm	d_await	dareq-s	f/s	f_await	aqu-sz	%util
0.067	1.262	0.112	0.165	0.008	1.079	256.9	14680.8	13.42	8.187	0.065	68.49	0.000	0.000	0.000	0.000	0.000	0.000	0.000	0.000	0.013	6.881		pg1222_o2nofp.cx10a_c32r128
0.090	1.002	0.000	0.000	0.019	2.137	265.0	14875.3	15.17	8.689	0.064	67.02	0.000	0.000	0.000	0.000	0.000	0.000	0.000	0.000	0.013	7.068		pg1323_o2nofp.cx10a_c32r128
0.080	0.959	0.006	0.121	0.016	1.997	259.7	14809.9	14.24	8.487	0.064	68.21	0.000	0.000	0.000	0.000	0.000	0.000	0.000	0.000	0.013	6.870		pg1420_o2nofp.cx10a_c32r128
0.083	1.165	0.024	0.095	0.013	1.550	258.3	14782.5	8.548	5.490	0.065	69.05	0.000	0.000	0.000	0.000	0.000	0.000	0.000	0.000	0.013	6.819		pg1515_o2nofp.cx10a_c32r128
0.063	0.564	0.000	0.000	0.009	1.103	255.6	14746.8	8.406	5.415	0.064	69.62	0.000	0.000	0.000	0.000	0.000	0.000	0.000	0.000	0.013	6.703		pg1611_o2nofp.cx10a_c32r128
0.062	0.576	0.002	0.107	0.008	1.027	253.9	14747.6	8.170	5.459	0.066	71.19	0.000	0.000	0.000	0.000	0.000	0.000	0.000	0.000	0.013	6.629		pg177_o2nofp.cx10a_c32r128
0.022	0.308	0.017	0.258	0.004	0.471	244.1	15097.8	8.284	5.421	0.067	73.56	0.000	0.000	0.000	0.000	0.000	0.000	0.000	0.000	0.013	6.439		pg181_o2nofp.cx10b_c32r128
qp100.L2
qp100.L2: point queries with 100 insert/s per client. Graphs for performance per 1-second interval are here.
Average throughput:
Query response time histogram: each cell has the percentage of responses that take <= the time in the header and max is the max response time in seconds. For max values in the top 25% of the range have a red background and in the bottom 25% of the range have a green background. The red background is not used when the min value is within 80% of the max value.
| dbms | 256us | 1ms | 4ms | 16ms | 64ms | 256ms | 1s | 4s | 16s | gt | max |
|---|---|---|---|---|---|---|---|---|---|---|---|
| pg1222_o2nofp.cx10a_c32r128 | 99.995 | 0.004 | 0.001 | nonzero | nonzero | 0.020 | |||||
| pg1323_o2nofp.cx10a_c32r128 | 99.994 | 0.005 | 0.001 | nonzero | nonzero | 0.024 | |||||
| pg1420_o2nofp.cx10a_c32r128 | 99.995 | 0.004 | 0.001 | nonzero | nonzero | 0.082 | |||||
| pg1515_o2nofp.cx10a_c32r128 | 99.995 | 0.004 | 0.001 | nonzero | nonzero | 0.018 | |||||
| pg1611_o2nofp.cx10a_c32r128 | 99.995 | 0.004 | 0.001 | nonzero | 0.013 | ||||||
| pg177_o2nofp.cx10a_c32r128 | 99.995 | 0.004 | 0.001 | nonzero | 0.012 | ||||||
| pg181_o2nofp.cx10b_c32r128 | 99.995 | 0.004 | 0.001 | nonzero | nonzero | 0.017 |
Insert response time histogram: each cell has the percentage of responses that take <= the time in the header and max is the max response time in seconds. For max values in the top 25% of the range have a red background and in the bottom 25% of the range have a green background. The red background is not used when the min value is within 80% of the max value.
| dbms | 256us | 1ms | 4ms | 16ms | 64ms | 256ms | 1s | 4s | 16s | gt | max |
|---|---|---|---|---|---|---|---|---|---|---|---|
| pg1222_o2nofp.cx10a_c32r128 | 99.659 | 0.316 | 0.025 | 0.051 | |||||||
| pg1323_o2nofp.cx10a_c32r128 | 99.753 | 0.242 | 0.006 | 0.024 | |||||||
| pg1420_o2nofp.cx10a_c32r128 | 99.709 | 0.291 | 0.009 | ||||||||
| pg1515_o2nofp.cx10a_c32r128 | 99.779 | 0.219 | 0.002 | 0.021 | |||||||
| pg1611_o2nofp.cx10a_c32r128 | 99.790 | 0.210 | 0.015 | ||||||||
| pg177_o2nofp.cx10a_c32r128 | 99.718 | 0.278 | 0.004 | 0.024 | |||||||
| pg181_o2nofp.cx10b_c32r128 | 99.691 | 0.276 | 0.033 | 0.032 |
Delete response time histogram: each cell has the percentage of responses that take <= the time in the header and max is the max response time in seconds. For max values in the top 25% of the range have a red background and in the bottom 25% of the range have a green background. The red background is not used when the min value is within 80% of the max value.
| dbms | 256us | 1ms | 4ms | 16ms | 64ms | 256ms | 1s | 4s | 16s | gt | max |
|---|---|---|---|---|---|---|---|---|---|---|---|
| pg1222_o2nofp.cx10a_c32r128 | 42.325 | 57.517 | 0.145 | 0.013 | 0.051 | ||||||
| pg1323_o2nofp.cx10a_c32r128 | 39.397 | 60.484 | 0.114 | 0.005 | 0.022 | ||||||
| pg1420_o2nofp.cx10a_c32r128 | 38.436 | 61.387 | 0.177 | 0.016 | |||||||
| pg1515_o2nofp.cx10a_c32r128 | 40.301 | 59.607 | 0.089 | 0.003 | 0.019 | ||||||
| pg1611_o2nofp.cx10a_c32r128 | 38.519 | 61.380 | 0.101 | 0.016 | |||||||
| pg177_o2nofp.cx10a_c32r128 | 38.549 | 61.272 | 0.175 | 0.004 | 0.021 | ||||||
| pg181_o2nofp.cx10b_c32r128 | 51.496 | 48.325 | 0.155 | 0.024 | 0.030 |
Performance metrics for the DBMS listed above. Some are normalized by throughput, others are not. Legend for results is here.
ips	qps	rps	rmbps	wps	wmbps	rpq	rkbpq	wpi	wkbpi	csps	cpups	cspq	cpupq	dbgb1	dbgb2	rss	maxop	p50	p99	tag
1988	197134	0	0.0	376.7	19.7	0.000	0.000	0.190	10.128	760710	41.7	3.859	102	60.1	139.9	49.4	0.020	9961	9749	pg1222_o2nofp.cx10a_c32r128
1987	189507	1	0.0	373.4	19.6	0.000	0.000	0.188	10.092	731515	41.6	3.860	105	59.8	143.7	38.1	0.024	9561	9350	pg1323_o2nofp.cx10a_c32r128
1988	192993	0	0.0	369.1	19.4	0.000	0.000	0.186	10.002	744755	41.8	3.859	104	57.8	141.5	3.2	0.082	9769	9574	pg1420_o2nofp.cx10a_c32r128
1988	189561	4	0.0	363.0	19.4	0.000	0.000	0.183	9.989	731455	41.5	3.859	105	57.9	141.5	28.8	0.018	9561	9366	pg1515_o2nofp.cx10a_c32r128
1987	192349	0	0.0	360.1	19.3	0.000	0.000	0.181	9.949	742282	41.2	3.859	103	57.6	141.4	33.2	0.013	9701	9510	pg1611_o2nofp.cx10a_c32r128
1987	190048	0	0.0	358.9	19.3	0.000	0.000	0.181	9.940	733280	41.4	3.858	105	57.8	141.4	54.0	0.012	9561	9382	pg177_o2nofp.cx10a_c32r128
1987	187489	0	0.0	387.4	18.1	0.000	0.000	0.195	9.343	723486	41.3	3.859	106	57.6	136.1	0.8	0.017	9526	9318	pg181_o2nofp.cx10b_c32r128
Average values from iostat.
r/s	rkB/s	rrqm/s	%rrqm	r_await	rareq-s	w/s	wkB/s	wrqm/s	%wrqm	w_await	wareq-s	d/s	dkB/s	drqm/s	%drqm	d_await	dareq-s	f/s	f_await	aqu-sz	%util
0.011	0.159	0.001	0.069	0.002	0.311	375.4	20182.4	14.49	4.597	0.054	62.22	0.000	0.000	0.000	0.000	0.000	0.000	0.000	0.000	0.017	9.304		pg1222_o2nofp.cx10a_c32r128
0.079	1.314	0.134	0.207	0.007	0.567	371.6	20106.2	15.00	4.931	0.053	63.30	0.000	0.000	0.000	0.000	0.000	0.000	0.000	0.000	0.017	9.249		pg1323_o2nofp.cx10a_c32r128
0.051	0.621	0.059	0.123	0.008	0.956	367.4	19930.7	14.59	4.644	0.056	63.00	0.000	0.000	0.000	0.000	0.000	0.000	0.000	0.000	0.018	9.048		pg1420_o2nofp.cx10a_c32r128
3.958	15.97	0.000	0.000	0.006	0.639	370.7	19921.8	9.710	3.020	0.056	63.70	22.36	612367	0.004	0.000	0.000	140.7	0.000	0.000	0.020	9.395		pg1515_o2nofp.cx10a_c32r128
0.031	0.346	0.012	0.192	0.006	0.826	361.8	19815.4	9.894	3.062	0.054	63.98	0.000	0.000	0.000	0.000	0.000	0.000	0.000	0.000	0.017	9.010		pg1611_o2nofp.cx10a_c32r128
0.019	0.187	0.002	0.107	0.007	0.549	360.8	19796.0	9.523	3.060	0.056	64.14	0.000	0.000	0.000	0.000	0.000	0.000	0.000	0.000	0.017	8.786		pg177_o2nofp.cx10a_c32r128
0.011	0.101	0.007	0.191	0.002	0.179	389.7	18610.9	9.498	3.254	0.056	58.89	0.000	0.000	0.000	0.000	0.000	0.000	0.000	0.000	0.018	8.389		pg181_o2nofp.cx10b_c32r128
qr500.L3
qr500.L3: range queries with 500 insert/s per client. Graphs for performance per 1-second interval are here.
Average throughput:
Query response time histogram: each cell has the percentage of responses that take <= the time in the header and max is the max response time in seconds. For max values in the top 25% of the range have a red background and in the bottom 25% of the range have a green background. The red background is not used when the min value is within 80% of the max value.
| dbms | 256us | 1ms | 4ms | 16ms | 64ms | 256ms | 1s | 4s | 16s | gt | max |
|---|---|---|---|---|---|---|---|---|---|---|---|
| pg1222_o2nofp.cx10a_c32r128 | 99.994 | 0.003 | 0.003 | nonzero | nonzero | 0.036 | |||||
| pg1323_o2nofp.cx10a_c32r128 | 99.994 | 0.003 | 0.003 | nonzero | nonzero | 0.024 | |||||
| pg1420_o2nofp.cx10a_c32r128 | 99.994 | 0.003 | 0.003 | nonzero | nonzero | 0.028 | |||||
| pg1515_o2nofp.cx10a_c32r128 | 99.994 | 0.003 | 0.003 | nonzero | nonzero | 0.020 | |||||
| pg1611_o2nofp.cx10a_c32r128 | 99.994 | 0.003 | 0.003 | nonzero | nonzero | 0.022 | |||||
| pg177_o2nofp.cx10a_c32r128 | 99.994 | 0.003 | 0.003 | nonzero | nonzero | 0.024 | |||||
| pg181_o2nofp.cx10b_c32r128 | 99.995 | 0.003 | 0.002 | nonzero | nonzero | 0.018 |
Insert response time histogram: each cell has the percentage of responses that take <= the time in the header and max is the max response time in seconds. For max values in the top 25% of the range have a red background and in the bottom 25% of the range have a green background. The red background is not used when the min value is within 80% of the max value.
| dbms | 256us | 1ms | 4ms | 16ms | 64ms | 256ms | 1s | 4s | 16s | gt | max |
|---|---|---|---|---|---|---|---|---|---|---|---|
| pg1222_o2nofp.cx10a_c32r128 | 9.475 | 89.944 | 0.563 | 0.017 | 0.049 | ||||||
| pg1323_o2nofp.cx10a_c32r128 | 7.494 | 91.961 | 0.535 | 0.010 | 0.030 | ||||||
| pg1420_o2nofp.cx10a_c32r128 | 6.891 | 92.571 | 0.523 | 0.014 | 0.035 | ||||||
| pg1515_o2nofp.cx10a_c32r128 | 5.533 | 93.936 | 0.524 | 0.006 | 0.030 | ||||||
| pg1611_o2nofp.cx10a_c32r128 | 7.849 | 91.652 | 0.488 | 0.011 | 0.026 | ||||||
| pg177_o2nofp.cx10a_c32r128 | 14.823 | 84.666 | 0.501 | 0.010 | 0.027 | ||||||
| pg181_o2nofp.cx10b_c32r128 | 15.572 | 83.919 | 0.497 | 0.011 | 0.033 |
Delete response time histogram: each cell has the percentage of responses that take <= the time in the header and max is the max response time in seconds. For max values in the top 25% of the range have a red background and in the bottom 25% of the range have a green background. The red background is not used when the min value is within 80% of the max value.
| dbms | 256us | 1ms | 4ms | 16ms | 64ms | 256ms | 1s | 4s | 16s | gt | max |
|---|---|---|---|---|---|---|---|---|---|---|---|
| pg1222_o2nofp.cx10a_c32r128 | 54.019 | 45.687 | 0.284 | 0.010 | 0.040 | ||||||
| pg1323_o2nofp.cx10a_c32r128 | 46.540 | 53.158 | 0.297 | 0.005 | 0.030 | ||||||
| pg1420_o2nofp.cx10a_c32r128 | 41.228 | 58.482 | 0.284 | 0.006 | 0.032 | ||||||
| pg1515_o2nofp.cx10a_c32r128 | 50.263 | 49.500 | 0.235 | 0.002 | 0.023 | ||||||
| pg1611_o2nofp.cx10a_c32r128 | 41.381 | 58.350 | 0.262 | 0.007 | 0.022 | ||||||
| pg177_o2nofp.cx10a_c32r128 | 47.079 | 52.640 | 0.276 | 0.005 | 0.021 | ||||||
| pg181_o2nofp.cx10b_c32r128 | 72.045 | 27.693 | 0.258 | 0.004 | 0.021 |
Performance metrics for the DBMS listed above. Some are normalized by throughput, others are not. Legend for results is here.
ips	qps	rps	rmbps	wps	wmbps	rpq	rkbpq	wpi	wkbpi	csps	cpups	cspq	cpupq	dbgb1	dbgb2	rss	maxop	p50	p99	tag
9939	373679	0	0.0	474.4	28.6	0.000	0.000	0.048	2.950	1421488	43.9	3.804	56	60.1	131.4	43.7	0.036	18812	17789	pg1222_o2nofp.cx10a_c32r128
9936	346789	0	0.0	463.5	28.4	0.000	0.000	0.047	2.927	1319537	43.7	3.805	60	59.8	134.4	36.6	0.024	17485	16563	pg1323_o2nofp.cx10a_c32r128
9939	368460	0	0.0	461.8	28.3	0.000	0.000	0.046	2.917	1401824	43.4	3.805	57	57.9	132.2	41.4	0.028	18348	17435	pg1420_o2nofp.cx10a_c32r128
9936	353318	0	0.0	453.9	28.3	0.000	0.000	0.046	2.913	1344411	43.6	3.805	59	57.9	132.3	41.0	0.020	17684	16780	pg1515_o2nofp.cx10a_c32r128
9936	358226	0	0.0	450.9	28.2	0.000	0.000	0.045	2.904	1363028	43.7	3.805	59	57.7	132.1	30.6	0.022	18019	17054	pg1611_o2nofp.cx10a_c32r128
9934	357294	0	0.0	451.8	28.3	0.000	0.000	0.045	2.916	1357596	43.7	3.800	59	57.8	132.2	32.8	0.024	17869	16958	pg177_o2nofp.cx10a_c32r128
9934	360974	0	0.0	418.4	28.8	0.000	0.000	0.042	2.971	1371880	43.7	3.801	58	57.6	128.2	24.9	0.018	18348	17533	pg181_o2nofp.cx10b_c32r128
Average values from iostat.
r/s	rkB/s	rrqm/s	%rrqm	r_await	rareq-s	w/s	wkB/s	wrqm/s	%wrqm	w_await	wareq-s	d/s	dkB/s	drqm/s	%drqm	d_await	dareq-s	f/s	f_await	aqu-sz	%util
0.088	4.544	0.020	0.107	0.004	0.354	470.5	29373.7	18.44	4.665	0.061	64.44	0.000	0.000	0.000	0.000	0.000	0.000	0.000	0.000	0.030	10.62		pg1222_o2nofp.cx10a_c32r128
0.037	0.436	0.001	0.038	0.006	0.772	460.2	29142.3	17.82	4.643	0.058	67.17	0.000	0.000	0.000	0.000	0.000	0.000	0.000	0.000	0.029	10.56		pg1323_o2nofp.cx10a_c32r128
0.032	0.366	0.024	0.111	0.007	0.593	457.9	29045.9	18.47	4.707	0.058	66.71	0.000	0.000	0.000	0.000	0.000	0.000	0.000	0.000	0.029	10.27		pg1420_o2nofp.cx10a_c32r128
0.028	0.269	0.000	0.000	0.006	0.676	453.5	29000.9	16.29	3.900	0.059	67.85	0.000	0.000	0.000	0.000	0.000	0.000	0.000	0.000	0.029	10.05		pg1515_o2nofp.cx10a_c32r128
0.055	0.583	0.024	0.440	0.009	0.770	453.8	29325.1	16.20	3.823	0.082	68.40	0.000	0.000	0.000	0.000	0.000	0.000	0.000	0.000	0.050	10.04		pg1611_o2nofp.cx10a_c32r128
0.080	0.559	0.018	0.131	0.005	0.642	451.0	29010.8	13.55	3.236	0.061	67.95	0.000	0.000	0.000	0.000	0.000	0.000	0.000	0.000	0.031	9.950		pg177_o2nofp.cx10a_c32r128
0.054	0.278	0.000	0.000	0.002	0.240	418.4	29563.8	12.47	3.112	0.065	75.46	0.000	0.000	0.000	0.000	0.000	0.000	0.000	0.000	0.030	10.07		pg181_o2nofp.cx10b_c32r128
qp500.L4
qp500.L4: point queries with 500 insert/s per client. Graphs for performance per 1-second interval are here.
Average throughput:
Query response time histogram: each cell has the percentage of responses that take <= the time in the header and max is the max response time in seconds. For max values in the top 25% of the range have a red background and in the bottom 25% of the range have a green background. The red background is not used when the min value is within 80% of the max value.
| dbms | 256us | 1ms | 4ms | 16ms | 64ms | 256ms | 1s | 4s | 16s | gt | max |
|---|---|---|---|---|---|---|---|---|---|---|---|
| pg1222_o2nofp.cx10a_c32r128 | 99.990 | 0.007 | 0.003 | nonzero | nonzero | 0.016 | |||||
| pg1323_o2nofp.cx10a_c32r128 | 99.989 | 0.008 | 0.003 | nonzero | nonzero | 0.019 | |||||
| pg1420_o2nofp.cx10a_c32r128 | 99.989 | 0.007 | 0.003 | nonzero | nonzero | 0.023 | |||||
| pg1515_o2nofp.cx10a_c32r128 | 99.989 | 0.008 | 0.003 | nonzero | nonzero | 0.020 | |||||
| pg1611_o2nofp.cx10a_c32r128 | 99.989 | 0.007 | 0.003 | nonzero | nonzero | 0.020 | |||||
| pg177_o2nofp.cx10a_c32r128 | 99.989 | 0.008 | 0.003 | nonzero | nonzero | 0.017 | |||||
| pg181_o2nofp.cx10b_c32r128 | 99.988 | 0.008 | 0.003 | nonzero | nonzero | 0.023 |
Insert response time histogram: each cell has the percentage of responses that take <= the time in the header and max is the max response time in seconds. For max values in the top 25% of the range have a red background and in the bottom 25% of the range have a green background. The red background is not used when the min value is within 80% of the max value.
| dbms | 256us | 1ms | 4ms | 16ms | 64ms | 256ms | 1s | 4s | 16s | gt | max |
|---|---|---|---|---|---|---|---|---|---|---|---|
| pg1222_o2nofp.cx10a_c32r128 | 8.707 | 90.937 | 0.348 | 0.009 | 0.041 | ||||||
| pg1323_o2nofp.cx10a_c32r128 | 6.984 | 92.741 | 0.267 | 0.008 | 0.037 | ||||||
| pg1420_o2nofp.cx10a_c32r128 | 6.942 | 92.731 | 0.321 | 0.006 | 0.060 | ||||||
| pg1515_o2nofp.cx10a_c32r128 | 3.118 | 96.598 | 0.278 | 0.006 | 0.029 | ||||||
| pg1611_o2nofp.cx10a_c32r128 | 6.284 | 93.417 | 0.295 | 0.004 | 0.031 | ||||||
| pg177_o2nofp.cx10a_c32r128 | 11.990 | 87.737 | 0.269 | 0.004 | 0.028 | ||||||
| pg181_o2nofp.cx10b_c32r128 | 12.833 | 86.828 | 0.332 | 0.006 | 0.029 |
Delete response time histogram: each cell has the percentage of responses that take <= the time in the header and max is the max response time in seconds. For max values in the top 25% of the range have a red background and in the bottom 25% of the range have a green background. The red background is not used when the min value is within 80% of the max value.
| dbms | 256us | 1ms | 4ms | 16ms | 64ms | 256ms | 1s | 4s | 16s | gt | max |
|---|---|---|---|---|---|---|---|---|---|---|---|
| pg1222_o2nofp.cx10a_c32r128 | 62.651 | 37.154 | 0.190 | 0.005 | 0.039 | ||||||
| pg1323_o2nofp.cx10a_c32r128 | 56.862 | 42.994 | 0.138 | 0.006 | 0.024 | ||||||
| pg1420_o2nofp.cx10a_c32r128 | 52.993 | 46.814 | 0.188 | 0.005 | 0.037 | ||||||
| pg1515_o2nofp.cx10a_c32r128 | 59.682 | 40.179 | 0.137 | 0.003 | 0.024 | ||||||
| pg1611_o2nofp.cx10a_c32r128 | 53.179 | 46.666 | 0.152 | 0.004 | 0.030 | ||||||
| pg177_o2nofp.cx10a_c32r128 | 57.484 | 42.357 | 0.157 | 0.003 | 0.024 | ||||||
| pg181_o2nofp.cx10b_c32r128 | 60.955 | 38.849 | 0.194 | 0.002 | 0.020 |
Performance metrics for the DBMS listed above. Some are normalized by throughput, others are not. Legend for results is here.
ips	qps	rps	rmbps	wps	wmbps	rpq	rkbpq	wpi	wkbpi	csps	cpups	cspq	cpupq	dbgb1	dbgb2	rss	maxop	p50	p99	tag
9936	196399	0	0.0	360.0	28.3	0.000	0.000	0.036	2.912	757483	42.3	3.857	103	60.1	127.1	23.0	0.016	9829	9529	pg1222_o2nofp.cx10a_c32r128
9936	188208	0	0.0	352.5	28.1	0.000	0.000	0.035	2.900	725951	42.3	3.857	108	59.8	129.3	12.7	0.019	9544	9270	pg1323_o2nofp.cx10a_c32r128
9936	191950	0	0.0	349.8	27.7	0.000	0.000	0.035	2.851	739373	42.5	3.852	106	57.9	127.3	32.9	0.023	9733	9462	pg1420_o2nofp.cx10a_c32r128
9936	188414	0	0.0	344.3	27.8	0.000	0.000	0.035	2.865	726438	42.1	3.856	107	58.0	127.3	42.6	0.020	9556	9285	pg1515_o2nofp.cx10a_c32r128
9936	191676	0	0.0	341.0	27.6	0.000	0.000	0.034	2.843	739021	42.2	3.856	106	57.7	127.2	30.8	0.020	9701	9449	pg1611_o2nofp.cx10a_c32r128
9936	188399	0	0.0	343.6	27.6	0.000	0.000	0.035	2.842	725953	42.1	3.853	107	57.8	127.2	24.2	0.017	9543	9286	pg177_o2nofp.cx10a_c32r128
9936	186654	0	0.0	334.3	27.6	0.000	0.000	0.034	2.846	719348	42.1	3.854	108	57.7	123.9	8.4	0.023	9401	9142	pg181_o2nofp.cx10b_c32r128
Average values from iostat.
r/s	rkB/s	rrqm/s	%rrqm	r_await	rareq-s	w/s	wkB/s	wrqm/s	%wrqm	w_await	wareq-s	d/s	dkB/s	drqm/s	%drqm	d_await	dareq-s	f/s	f_await	aqu-sz	%util
0.018	0.145	0.002	0.096	0.004	0.454	356.7	28985.4	17.04	4.794	0.066	81.06	0.000	0.000	0.000	0.000	0.000	0.000	0.000	0.000	0.025	10.55		pg1222_o2nofp.cx10a_c32r128
0.063	0.544	0.000	0.000	0.011	1.095	349.6	28870.5	17.69	5.050	0.065	83.01	0.000	0.000	0.000	0.000	0.000	0.000	0.000	0.000	0.024	10.58		pg1323_o2nofp.cx10a_c32r128
0.109	0.716	0.000	0.000	0.011	1.017	346.5	28386.1	18.22	5.239	0.065	82.31	0.000	0.000	0.000	0.000	0.000	0.000	0.000	0.000	0.024	10.14		pg1420_o2nofp.cx10a_c32r128
0.062	0.549	0.024	0.119	0.012	0.881	344.2	28523.0	14.98	3.957	0.066	83.57	0.000	0.000	0.000	0.000	0.000	0.000	0.000	0.000	0.024	9.909		pg1515_o2nofp.cx10a_c32r128
0.099	2.119	0.394	0.222	0.007	0.569	341.0	28309.3	15.58	4.258	0.065	83.94	0.000	0.000	0.000	0.000	0.000	0.000	0.000	0.000	0.024	9.952		pg1611_o2nofp.cx10a_c32r128
0.040	0.324	0.001	0.061	0.007	0.798	342.6	28286.6	13.66	3.576	0.066	83.41	0.000	0.000	0.000	0.000	0.000	0.000	0.000	0.000	0.025	9.816		pg177_o2nofp.cx10a_c32r128
0.024	0.231	0.000	0.000	0.004	0.499	333.5	28325.5	12.94	3.593	0.068	85.57	0.000	0.000	0.000	0.000	0.000	0.000	0.000	0.000	0.025	9.861		pg181_o2nofp.cx10b_c32r128
qr1000.L5
qr1000.L5: range queries with 1000 insert/s per client. Graphs for performance per 1-second interval are here.
Average throughput:
Query response time histogram: each cell has the percentage of responses that take <= the time in the header and max is the max response time in seconds. For max values in the top 25% of the range have a red background and in the bottom 25% of the range have a green background. The red background is not used when the min value is within 80% of the max value.
| dbms | 256us | 1ms | 4ms | 16ms | 64ms | 256ms | 1s | 4s | 16s | gt | max |
|---|---|---|---|---|---|---|---|---|---|---|---|
| pg1222_o2nofp.cx10a_c32r128 | 99.988 | 0.007 | 0.005 | nonzero | nonzero | nonzero | 0.089 | ||||
| pg1323_o2nofp.cx10a_c32r128 | 99.988 | 0.007 | 0.005 | nonzero | nonzero | 0.044 | |||||
| pg1420_o2nofp.cx10a_c32r128 | 99.989 | 0.006 | 0.004 | nonzero | nonzero | 0.061 | |||||
| pg1515_o2nofp.cx10a_c32r128 | 99.989 | 0.007 | 0.004 | nonzero | nonzero | 0.031 | |||||
| pg1611_o2nofp.cx10a_c32r128 | 99.989 | 0.006 | 0.004 | nonzero | nonzero | nonzero | 0.070 | ||||
| pg177_o2nofp.cx10a_c32r128 | 99.989 | 0.007 | 0.004 | nonzero | nonzero | nonzero | 0.071 | ||||
| pg181_o2nofp.cx10b_c32r128 | 99.990 | 0.006 | 0.004 | nonzero | nonzero | nonzero | 0.067 |
Insert response time histogram: each cell has the percentage of responses that take <= the time in the header and max is the max response time in seconds. For max values in the top 25% of the range have a red background and in the bottom 25% of the range have a green background. The red background is not used when the min value is within 80% of the max value.
| dbms | 256us | 1ms | 4ms | 16ms | 64ms | 256ms | 1s | 4s | 16s | gt | max |
|---|---|---|---|---|---|---|---|---|---|---|---|
| pg1222_o2nofp.cx10a_c32r128 | 28.415 | 71.268 | 0.310 | 0.006 | 0.036 | ||||||
| pg1323_o2nofp.cx10a_c32r128 | 27.924 | 71.762 | 0.307 | 0.006 | 0.031 | ||||||
| pg1420_o2nofp.cx10a_c32r128 | 25.196 | 74.481 | 0.316 | 0.006 | 0.030 | ||||||
| pg1515_o2nofp.cx10a_c32r128 | 21.359 | 78.223 | 0.411 | 0.007 | 0.033 | ||||||
| pg1611_o2nofp.cx10a_c32r128 | 27.049 | 72.598 | 0.348 | 0.005 | 0.026 | ||||||
| pg177_o2nofp.cx10a_c32r128 | 30.168 | 69.468 | 0.355 | 0.009 | 0.030 | ||||||
| pg181_o2nofp.cx10b_c32r128 | 38.722 | 61.033 | 0.241 | 0.004 | 0.033 |
Delete response time histogram: each cell has the percentage of responses that take <= the time in the header and max is the max response time in seconds. For max values in the top 25% of the range have a red background and in the bottom 25% of the range have a green background. The red background is not used when the min value is within 80% of the max value.
| dbms | 256us | 1ms | 4ms | 16ms | 64ms | 256ms | 1s | 4s | 16s | gt | max |
|---|---|---|---|---|---|---|---|---|---|---|---|
| pg1222_o2nofp.cx10a_c32r128 | 58.555 | 41.270 | 0.170 | 0.004 | 0.030 | ||||||
| pg1323_o2nofp.cx10a_c32r128 | 51.936 | 47.885 | 0.176 | 0.003 | 0.037 | ||||||
| pg1420_o2nofp.cx10a_c32r128 | 47.482 | 52.335 | 0.179 | 0.004 | 0.026 | ||||||
| pg1515_o2nofp.cx10a_c32r128 | 56.164 | 43.601 | 0.231 | 0.004 | 0.036 | ||||||
| pg1611_o2nofp.cx10a_c32r128 | 47.785 | 52.014 | 0.199 | 0.002 | 0.027 | ||||||
| pg177_o2nofp.cx10a_c32r128 | 52.085 | 47.651 | 0.258 | 0.005 | 0.029 | ||||||
| pg181_o2nofp.cx10b_c32r128 | 53.410 | 46.404 | 0.184 | 0.002 | 0.038 |
Performance metrics for the DBMS listed above. Some are normalized by throughput, others are not. Legend for results is here.
ips	qps	rps	rmbps	wps	wmbps	rpq	rkbpq	wpi	wkbpi	csps	cpups	cspq	cpupq	dbgb1	dbgb2	rss	maxop	p50	p99	tag
19868	368957	0	0.0	420.4	37.0	0.000	0.000	0.021	1.908	1398532	44.9	3.791	58	60.1	125.1	27.7	0.089	18476	17005	pg1222_o2nofp.cx10a_c32r128
19868	342124	0	0.0	419.1	36.8	0.000	0.000	0.021	1.895	1296674	44.8	3.790	63	59.8	126.9	22.2	0.044	17101	15892	pg1323_o2nofp.cx10a_c32r128
19868	366756	0	0.0	418.3	36.6	0.000	0.000	0.021	1.886	1390456	44.5	3.791	58	57.9	124.8	28.8	0.061	18396	17182	pg1420_o2nofp.cx10a_c32r128
19873	351054	0	0.0	412.7	36.6	0.000	0.000	0.021	1.888	1331615	44.7	3.793	61	58.0	124.9	35.5	0.031	17677	16686	pg1515_o2nofp.cx10a_c32r128
19868	354700	0	0.0	410.9	36.4	0.000	0.000	0.021	1.877	1344231	44.7	3.790	60	57.7	124.7	29.4	0.070	17996	16782	pg1611_o2nofp.cx10a_c32r128
19868	354246	0	0.0	411.6	36.5	0.000	0.000	0.021	1.879	1340857	44.7	3.785	61	57.9	124.8	24.1	0.071	17852	16558	pg177_o2nofp.cx10a_c32r128
19868	353185	0	0.0	407.0	35.8	0.000	0.000	0.020	1.845	1337684	44.7	3.787	61	57.8	122.0	2.5	0.067	17885	16846	pg181_o2nofp.cx10b_c32r128
Average values from iostat.
r/s	rkB/s	rrqm/s	%rrqm	r_await	rareq-s	w/s	wkB/s	wrqm/s	%wrqm	w_await	wareq-s	d/s	dkB/s	drqm/s	%drqm	d_await	dareq-s	f/s	f_await	aqu-sz	%util
0.060	0.447	0.004	0.190	0.000	0.125	416.3	37965.5	18.28	4.209	0.068	90.56	0.000	0.000	0.000	0.000	0.000	0.000	0.000	0.000	0.030	12.80		pg1222_o2nofp.cx10a_c32r128
0.103	0.979	0.000	0.000	0.009	1.123	414.6	37713.5	19.40	4.422	0.068	90.43	0.000	0.000	0.000	0.000	0.000	0.000	0.000	0.000	0.029	12.97		pg1323_o2nofp.cx10a_c32r128
0.126	0.864	0.000	0.000	0.013	1.197	413.7	37520.7	20.38	4.741	0.069	89.98	0.000	0.000	0.000	0.000	0.000	0.000	0.000	0.000	0.031	12.55		pg1420_o2nofp.cx10a_c32r128
0.087	0.703	0.004	0.078	0.012	1.137	410.8	37586.9	17.34	3.725	0.069	90.94	0.000	0.000	0.000	0.000	0.000	0.000	0.000	0.000	0.032	12.29		pg1515_o2nofp.cx10a_c32r128
0.126	1.007	0.003	0.106	0.009	1.233	409.1	37345.9	17.29	3.756	0.069	90.98	0.000	0.000	0.000	0.000	0.000	0.000	0.000	0.000	0.029	12.26		pg1611_o2nofp.cx10a_c32r128
0.111	0.855	0.000	0.000	0.016	1.259	409.0	37405.1	20.27	4.348	0.071	90.83	0.000	0.000	0.000	0.000	0.000	0.000	0.000	0.000	0.033	12.18		pg177_o2nofp.cx10a_c32r128
0.063	0.402	0.004	0.128	0.002	0.290	404.7	36694.6	15.30	3.352	0.068	90.91	0.000	0.000	0.000	0.000	0.000	0.000	0.000	0.000	0.029	12.41		pg181_o2nofp.cx10b_c32r128
qp1000.L6
qp1000.L6: point queries with 1000 insert/s per client. Graphs for performance per 1-second interval are here.
Average throughput:
Query response time histogram: each cell has the percentage of responses that take <= the time in the header and max is the max response time in seconds. For max values in the top 25% of the range have a red background and in the bottom 25% of the range have a green background. The red background is not used when the min value is within 80% of the max value.
| dbms | 256us | 1ms | 4ms | 16ms | 64ms | 256ms | 1s | 4s | 16s | gt | max |
|---|---|---|---|---|---|---|---|---|---|---|---|
| pg1222_o2nofp.cx10a_c32r128 | 99.983 | 0.012 | 0.005 | nonzero | nonzero | nonzero | 0.104 | ||||
| pg1323_o2nofp.cx10a_c32r128 | 99.981 | 0.014 | 0.005 | nonzero | nonzero | nonzero | 0.070 | ||||
| pg1420_o2nofp.cx10a_c32r128 | 99.982 | 0.013 | 0.005 | nonzero | nonzero | nonzero | 0.066 | ||||
| pg1515_o2nofp.cx10a_c32r128 | 99.981 | 0.014 | 0.005 | nonzero | nonzero | nonzero | 0.074 | ||||
| pg1611_o2nofp.cx10a_c32r128 | 99.981 | 0.013 | 0.005 | nonzero | nonzero | nonzero | 0.074 | ||||
| pg177_o2nofp.cx10a_c32r128 | 99.981 | 0.014 | 0.005 | nonzero | nonzero | nonzero | 0.075 | ||||
| pg181_o2nofp.cx10b_c32r128 | 99.980 | 0.015 | 0.005 | nonzero | nonzero | 0.036 |
Insert response time histogram: each cell has the percentage of responses that take <= the time in the header and max is the max response time in seconds. For max values in the top 25% of the range have a red background and in the bottom 25% of the range have a green background. The red background is not used when the min value is within 80% of the max value.
| dbms | 256us | 1ms | 4ms | 16ms | 64ms | 256ms | 1s | 4s | 16s | gt | max |
|---|---|---|---|---|---|---|---|---|---|---|---|
| pg1222_o2nofp.cx10a_c32r128 | 30.559 | 69.146 | 0.292 | 0.003 | nonzero | 0.084 | |||||
| pg1323_o2nofp.cx10a_c32r128 | 24.834 | 74.893 | 0.269 | 0.004 | 0.035 | ||||||
| pg1420_o2nofp.cx10a_c32r128 | 27.839 | 71.890 | 0.264 | 0.008 | 0.039 | ||||||
| pg1515_o2nofp.cx10a_c32r128 | 20.240 | 79.427 | 0.328 | 0.006 | nonzero | 0.066 | |||||
| pg1611_o2nofp.cx10a_c32r128 | 25.563 | 74.152 | 0.278 | 0.007 | 0.038 | ||||||
| pg177_o2nofp.cx10a_c32r128 | 36.617 | 63.060 | 0.314 | 0.010 | 0.047 | ||||||
| pg181_o2nofp.cx10b_c32r128 | 35.732 | 64.018 | 0.241 | 0.009 | 0.035 |
Delete response time histogram: each cell has the percentage of responses that take <= the time in the header and max is the max response time in seconds. For max values in the top 25% of the range have a red background and in the bottom 25% of the range have a green background. The red background is not used when the min value is within 80% of the max value.
| dbms | 256us | 1ms | 4ms | 16ms | 64ms | 256ms | 1s | 4s | 16s | gt | max |
|---|---|---|---|---|---|---|---|---|---|---|---|
| pg1222_o2nofp.cx10a_c32r128 | 59.099 | 40.754 | 0.145 | 0.002 | nonzero | 0.083 | |||||
| pg1323_o2nofp.cx10a_c32r128 | 52.037 | 47.811 | 0.150 | 0.003 | 0.025 | ||||||
| pg1420_o2nofp.cx10a_c32r128 | 47.552 | 52.274 | 0.169 | 0.005 | 0.033 | ||||||
| pg1515_o2nofp.cx10a_c32r128 | 55.549 | 44.257 | 0.191 | 0.003 | nonzero | 0.065 | |||||
| pg1611_o2nofp.cx10a_c32r128 | 47.635 | 52.179 | 0.182 | 0.005 | 0.030 | ||||||
| pg177_o2nofp.cx10a_c32r128 | 52.510 | 47.273 | 0.212 | 0.005 | 0.037 | ||||||
| pg181_o2nofp.cx10b_c32r128 | 55.431 | 44.361 | 0.204 | 0.004 | 0.030 |
Performance metrics for the DBMS listed above. Some are normalized by throughput, others are not. Legend for results is here.
ips	qps	rps	rmbps	wps	wmbps	rpq	rkbpq	wpi	wkbpi	csps	cpups	cspq	cpupq	dbgb1	dbgb2	rss	maxop	p50	p99	tag
19868	194906	2	0.2	413.8	36.0	0.000	0.001	0.021	1.856	750662	43.5	3.851	107	60.0	125.2	25.8	0.104	9865	9494	pg1222_o2nofp.cx10a_c32r128
19868	186676	0	0.0	410.5	35.8	0.000	0.000	0.021	1.847	718710	43.6	3.850	112	59.8	126.8	11.6	0.070	9331	8953	pg1323_o2nofp.cx10a_c32r128
19868	190800	0	0.0	412.2	35.7	0.000	0.000	0.021	1.842	734552	43.5	3.850	109	57.9	124.8	36.8	0.066	9669	9305	pg1420_o2nofp.cx10a_c32r128
19873	186865	0	0.0	406.9	35.7	0.000	0.000	0.020	1.840	718990	43.2	3.848	111	58.0	124.9	21.0	0.074	9510	9126	pg1515_o2nofp.cx10a_c32r128
19868	190167	0	0.0	405.9	35.6	0.000	0.000	0.020	1.835	731437	43.3	3.846	109	57.7	124.7	19.7	0.074	9622	9193	pg1611_o2nofp.cx10a_c32r128
19868	186922	0	0.0	403.1	35.5	0.000	0.000	0.020	1.832	718368	43.2	3.843	111	57.9	124.8	4.4	0.075	9558	9126	pg177_o2nofp.cx10a_c32r128
19868	184865	0	0.0	403.2	35.7	0.000	0.000	0.020	1.840	710473	43.3	3.843	112	57.8	122.5	4.4	0.036	9350	8966	pg181_o2nofp.cx10b_c32r128
Average values from iostat.
r/s	rkB/s	rrqm/s	%rrqm	r_await	rareq-s	w/s	wkB/s	wrqm/s	%wrqm	w_await	wareq-s	d/s	dkB/s	drqm/s	%drqm	d_await	dareq-s	f/s	f_await	aqu-sz	%util
0.246	16.92	0.074	0.164	0.003	0.491	408.3	36927.5	19.62	4.425	0.071	90.16	0.000	0.000	0.000	0.000	0.000	0.000	0.000	0.000	0.029	12.83		pg1222_o2nofp.cx10a_c32r128
0.103	0.808	0.000	0.000	0.009	1.071	405.1	36759.5	20.03	4.651	0.068	90.46	0.000	0.000	0.000	0.000	0.000	0.000	0.000	0.000	0.028	12.81		pg1323_o2nofp.cx10a_c32r128
0.138	1.023	0.002	0.055	0.013	1.442	406.5	36656.9	21.48	5.040	0.070	89.20	0.000	0.000	0.000	0.000	0.000	0.000	0.000	0.000	0.029	12.42		pg1420_o2nofp.cx10a_c32r128
0.133	0.919	0.000	0.000	0.016	1.369	403.7	36621.6	19.05	4.161	0.070	90.11	0.000	0.000	0.000	0.000	0.000	0.000	0.000	0.000	0.029	12.14		pg1515_o2nofp.cx10a_c32r128
0.103	0.803	0.000	0.000	0.011	0.865	402.6	36501.7	17.74	3.842	0.070	89.80	0.000	0.000	0.000	0.000	0.000	0.000	0.000	0.000	0.029	12.08		pg1611_o2nofp.cx10a_c32r128
0.078	0.486	0.000	0.000	0.004	0.673	399.5	36446.3	17.26	3.748	0.069	90.99	0.000	0.000	0.000	0.000	0.000	0.000	0.000	0.000	0.029	12.07		pg177_o2nofp.cx10a_c32r128
0.068	0.469	0.003	0.106	0.006	0.481	400.1	36607.9	16.29	3.478	0.071	91.29	0.000	0.000	0.000	0.000	0.000	0.000	0.000	0.000	0.031	12.32		pg181_o2nofp.cx10b_c32r128
l.i0
l.i0: load without secondary indexes
Performance metrics for all DBMS, not just the ones listed above. Some are normalized by throughput, others are not. Legend for results is here.
ips	qps	rps	rmbps	wps	wmbps	rpq	rkbpq	wpi	wkbpi	csps	cpups	cspq	cpupq	dbgb1	dbgb2	rss	maxop	p50	p99	tag
1724138	0	3	0.0	6888.2	725.1	0.000	0.000	0.004	0.431	242515	47.0	0.141	13	19.1	51.6	1.8	0.389	115577	58892	pg1222_o2nofp.cx10a_c32r128
1709402	0	4	0.0	6935.8	729.3	0.000	0.000	0.004	0.437	261605	47.0	0.153	13	19.1	51.7	1.9	0.462	113403	53643	pg1323_o2nofp.cx10a_c32r128
1666667	0	1	0.0	6673.1	703.9	0.000	0.000	0.004	0.432	281636	46.1	0.169	13	19.1	51.7	6.5	0.527	110681	52559	pg1420_o2nofp.cx10a_c32r128
1666667	0	3	0.0	6672.6	703.9	0.000	0.000	0.004	0.432	257177	45.6	0.154	13	19.1	51.7	1.9	0.842	112466	48246	pg1515_o2nofp.cx10a_c32r128
1666667	0	4	0.0	6620.4	701.9	0.000	0.000	0.004	0.431	265641	45.7	0.159	13	19.1	51.7	3.1	0.755	111080	34363	pg1611_o2nofp.cx10a_c32r128
1652892	0	4	0.0	6617.2	705.5	0.000	0.000	0.004	0.437	281310	45.2	0.170	13	19.1	51.7	0.5	0.999	110881	19479	pg177_o2nofp.cx10a_c32r128
1739130	0	4	0.0	6939.6	732.0	0.000	0.000	0.004	0.431	263133	46.5	0.151	13	19.1	51.7	0.4	0.412	116175	55241	pg181_o2nofp.cx10b_c32r128
l.x
l.x: create secondary indexes
Performance metrics for all DBMS, not just the ones listed above. Some are normalized by throughput, others are not. Legend for results is here.
ips	qps	rps	rmbps	wps	wmbps	rpq	rkbpq	wpi	wkbpi	csps	cpups	cspq	cpupq	dbgb1	dbgb2	rss	maxop	p50	p99	tag
2597404	0	4	0.0	6350.2	730.8	0.000	0.000	0.002	0.288	104583	17.6	0.040	3	38.4	88.5	6.9	0.042	NA	NA	pg1222_o2nofp.cx10a_c32r128
2564104	0	4	0.0	6169.0	711.9	0.000	0.000	0.002	0.284	96915	16.9	0.038	3	38.4	88.6	6.9	0.037	NA	NA	pg1323_o2nofp.cx10a_c32r128
2597404	0	2	0.0	6299.9	726.1	0.000	0.000	0.002	0.286	101631	17.6	0.039	3	38.4	88.6	6.9	0.028	NA	NA	pg1420_o2nofp.cx10a_c32r128
2469137	0	4	0.0	6057.1	699.2	0.000	0.000	0.002	0.290	100757	15.8	0.041	3	38.4	88.6	6.9	0.048	NA	NA	pg1515_o2nofp.cx10a_c32r128
2409640	0	4	0.0	5785.4	667.8	0.000	0.000	0.002	0.284	101620	15.9	0.042	3	38.4	88.6	6.9	0.032	NA	NA	pg1611_o2nofp.cx10a_c32r128
2500001	0	137	7.6	6314.4	731.1	0.000	0.003	0.003	0.299	40160	15.2	0.016	3	38.4	88.5	7.2	0.038	NA	NA	pg177_o2nofp.cx10a_c32r128
2631580	0	4	0.0	6928.7	804.6	0.000	0.000	0.003	0.313	42080	15.6	0.016	3	38.4	88.5	7.2	0.037	NA	NA	pg181_o2nofp.cx10b_c32r128
l.i1
l.i1: continue load after secondary indexes created with 50 inserts per transaction
Performance metrics for all DBMS, not just the ones listed above. Some are normalized by throughput, others are not. Legend for results is here.
ips	qps	rps	rmbps	wps	wmbps	rpq	rkbpq	wpi	wkbpi	csps	cpups	cspq	cpupq	dbgb1	dbgb2	rss	maxop	p50	p99	tag
384615	0	218	4.0	6347.9	584.7	0.001	0.011	0.017	1.557	268340	55.8	0.698	70	60.9	157.0	57.1	0.295	21127	4146	pg1222_o2nofp.cx10a_c32r128
384615	0	292	2.7	6133.3	567.6	0.001	0.007	0.016	1.511	253909	57.2	0.660	71	60.6	156.6	42.0	0.257	21388	4196	pg1323_o2nofp.cx10a_c32r128
398605	0	390	2.3	6157.7	576.4	0.001	0.006	0.015	1.481	291932	56.1	0.732	68	58.4	154.4	42.9	0.479	22775	4245	pg1420_o2nofp.cx10a_c32r128
395648	0	446	2.1	6113.2	573.0	0.001	0.005	0.015	1.483	286858	55.1	0.725	67	58.6	154.6	47.3	0.562	22298	3996	pg1515_o2nofp.cx10a_c32r128
389484	0	260	1.2	5893.6	559.2	0.001	0.003	0.015	1.470	271406	56.2	0.697	69	58.1	154.2	51.7	0.323	21869	3946	pg1611_o2nofp.cx10a_c32r128
391965	0	270	1.2	5950.7	565.0	0.001	0.003	0.015	1.476	252926	53.7	0.645	66	58.2	154.3	14.7	0.811	22725	3646	pg177_o2nofp.cx10a_c32r128
406091	0	25	0.1	6195.3	587.1	0.000	0.000	0.015	1.480	250964	55.3	0.618	65	58.2	154.3	40.5	1.052	23025	3246	pg181_o2nofp.cx10b_c32r128
l.i2
l.i2: continue load after secondary indexes created with 5 inserts per transaction
Performance metrics for all DBMS, not just the ones listed above. Some are normalized by throughput, others are not. Legend for results is here.
ips	qps	rps	rmbps	wps	wmbps	rpq	rkbpq	wpi	wkbpi	csps	cpups	cspq	cpupq	dbgb1	dbgb2	rss	maxop	p50	p99	tag
106838	0	0	0.0	1697.8	157.8	0.000	0.000	0.016	1.512	400778	57.2	3.751	257	60.1	156.2	25.9	0.118	4385	2576	pg1222_o2nofp.cx10a_c32r128
96946	0	2	0.0	1485.6	135.8	0.000	0.000	0.015	1.435	375633	55.8	3.875	276	59.9	156.0	31.3	0.089	3910	2478	pg1323_o2nofp.cx10a_c32r128
95238	0	5	0.4	1433.6	132.5	0.000	0.004	0.015	1.425	388817	54.0	4.083	272	57.9	154.0	24.0	0.086	4485	3277	pg1420_o2nofp.cx10a_c32r128
107066	0	2	0.0	1601.0	148.4	0.000	0.000	0.015	1.419	417590	56.7	3.900	254	58.0	154.0	29.5	0.091	4700	3323	pg1515_o2nofp.cx10a_c32r128
95831	0	1	0.0	1421.8	132.4	0.000	0.000	0.015	1.414	387079	54.9	4.039	275	57.6	153.7	34.0	0.088	3916	2892	pg1611_o2nofp.cx10a_c32r128
103413	0	0	0.0	1550.3	143.9	0.000	0.000	0.015	1.425	389472	54.6	3.766	253	57.8	153.8	27.2	0.096	4860	3626	pg177_o2nofp.cx10a_c32r128
115741	0	7	0.3	1919.1	178.6	0.000	0.003	0.017	1.580	422970	57.1	3.654	237	57.6	153.7	40.3	0.092	5386	2473	pg181_o2nofp.cx10b_c32r128
qr100.L1
qr100.L1: range queries with 100 insert/s per client
Performance metrics for all DBMS, not just the ones listed above. Some are normalized by throughput, others are not. Legend for results is here.
ips	qps	rps	rmbps	wps	wmbps	rpq	rkbpq	wpi	wkbpi	csps	cpups	cspq	cpupq	dbgb1	dbgb2	rss	maxop	p50	p99	tag
1987	381257	0	0.0	255.9	14.3	0.000	0.000	0.129	7.361	1454336	42.9	3.815	54	60.0	152.1	62.1	0.043	19173	18371	pg1222_o2nofp.cx10a_c32r128
1987	352616	0	0.0	264.1	14.5	0.000	0.000	0.133	7.456	1345170	42.8	3.815	58	59.7	155.8	61.8	0.011	17725	17052	pg1323_o2nofp.cx10a_c32r128
1987	378340	0	0.0	258.7	14.4	0.000	0.000	0.130	7.424	1443298	42.6	3.815	54	57.8	153.9	59.4	0.012	18860	18141	pg1420_o2nofp.cx10a_c32r128
1988	360188	0	0.0	254.3	14.4	0.000	0.000	0.128	7.414	1373572	42.7	3.813	57	57.9	154.0	0.8	0.008	18028	17283	pg1515_o2nofp.cx10a_c32r128
1987	363641	0	0.0	251.5	14.4	0.000	0.000	0.127	7.398	1387050	42.8	3.814	56	57.6	153.7	2.6	0.008	18476	17721	pg1611_o2nofp.cx10a_c32r128
1987	365850	0	0.0	250.1	14.4	0.000	0.000	0.126	7.398	1395304	42.9	3.814	56	57.8	153.8	59.4	0.008	18444	17635	pg177_o2nofp.cx10a_c32r128
1987	367323	0	0.0	240.9	14.7	0.000	0.000	0.121	7.576	1401102	42.8	3.814	56	57.6	148.3	0.9	0.084	18590	17811	pg181_o2nofp.cx10b_c32r128
qp100.L2
qp100.L2: point queries with 100 insert/s per client
Performance metrics for all DBMS, not just the ones listed above. Some are normalized by throughput, others are not. Legend for results is here.
ips	qps	rps	rmbps	wps	wmbps	rpq	rkbpq	wpi	wkbpi	csps	cpups	cspq	cpupq	dbgb1	dbgb2	rss	maxop	p50	p99	tag
1988	197134	0	0.0	376.7	19.7	0.000	0.000	0.190	10.128	760710	41.7	3.859	102	60.1	139.9	49.4	0.020	9961	9749	pg1222_o2nofp.cx10a_c32r128
1987	189507	1	0.0	373.4	19.6	0.000	0.000	0.188	10.092	731515	41.6	3.860	105	59.8	143.7	38.1	0.024	9561	9350	pg1323_o2nofp.cx10a_c32r128
1988	192993	0	0.0	369.1	19.4	0.000	0.000	0.186	10.002	744755	41.8	3.859	104	57.8	141.5	3.2	0.082	9769	9574	pg1420_o2nofp.cx10a_c32r128
1988	189561	4	0.0	363.0	19.4	0.000	0.000	0.183	9.989	731455	41.5	3.859	105	57.9	141.5	28.8	0.018	9561	9366	pg1515_o2nofp.cx10a_c32r128
1987	192349	0	0.0	360.1	19.3	0.000	0.000	0.181	9.949	742282	41.2	3.859	103	57.6	141.4	33.2	0.013	9701	9510	pg1611_o2nofp.cx10a_c32r128
1987	190048	0	0.0	358.9	19.3	0.000	0.000	0.181	9.940	733280	41.4	3.858	105	57.8	141.4	54.0	0.012	9561	9382	pg177_o2nofp.cx10a_c32r128
1987	187489	0	0.0	387.4	18.1	0.000	0.000	0.195	9.343	723486	41.3	3.859	106	57.6	136.1	0.8	0.017	9526	9318	pg181_o2nofp.cx10b_c32r128
qr500.L3
qr500.L3: range queries with 500 insert/s per client
Performance metrics for all DBMS, not just the ones listed above. Some are normalized by throughput, others are not. Legend for results is here.
ips	qps	rps	rmbps	wps	wmbps	rpq	rkbpq	wpi	wkbpi	csps	cpups	cspq	cpupq	dbgb1	dbgb2	rss	maxop	p50	p99	tag
9939	373679	0	0.0	474.4	28.6	0.000	0.000	0.048	2.950	1421488	43.9	3.804	56	60.1	131.4	43.7	0.036	18812	17789	pg1222_o2nofp.cx10a_c32r128
9936	346789	0	0.0	463.5	28.4	0.000	0.000	0.047	2.927	1319537	43.7	3.805	60	59.8	134.4	36.6	0.024	17485	16563	pg1323_o2nofp.cx10a_c32r128
9939	368460	0	0.0	461.8	28.3	0.000	0.000	0.046	2.917	1401824	43.4	3.805	57	57.9	132.2	41.4	0.028	18348	17435	pg1420_o2nofp.cx10a_c32r128
9936	353318	0	0.0	453.9	28.3	0.000	0.000	0.046	2.913	1344411	43.6	3.805	59	57.9	132.3	41.0	0.020	17684	16780	pg1515_o2nofp.cx10a_c32r128
9936	358226	0	0.0	450.9	28.2	0.000	0.000	0.045	2.904	1363028	43.7	3.805	59	57.7	132.1	30.6	0.022	18019	17054	pg1611_o2nofp.cx10a_c32r128
9934	357294	0	0.0	451.8	28.3	0.000	0.000	0.045	2.916	1357596	43.7	3.800	59	57.8	132.2	32.8	0.024	17869	16958	pg177_o2nofp.cx10a_c32r128
9934	360974	0	0.0	418.4	28.8	0.000	0.000	0.042	2.971	1371880	43.7	3.801	58	57.6	128.2	24.9	0.018	18348	17533	pg181_o2nofp.cx10b_c32r128
qp500.L4
qp500.L4: point queries with 500 insert/s per client
Performance metrics for all DBMS, not just the ones listed above. Some are normalized by throughput, others are not. Legend for results is here.
ips	qps	rps	rmbps	wps	wmbps	rpq	rkbpq	wpi	wkbpi	csps	cpups	cspq	cpupq	dbgb1	dbgb2	rss	maxop	p50	p99	tag
9936	196399	0	0.0	360.0	28.3	0.000	0.000	0.036	2.912	757483	42.3	3.857	103	60.1	127.1	23.0	0.016	9829	9529	pg1222_o2nofp.cx10a_c32r128
9936	188208	0	0.0	352.5	28.1	0.000	0.000	0.035	2.900	725951	42.3	3.857	108	59.8	129.3	12.7	0.019	9544	9270	pg1323_o2nofp.cx10a_c32r128
9936	191950	0	0.0	349.8	27.7	0.000	0.000	0.035	2.851	739373	42.5	3.852	106	57.9	127.3	32.9	0.023	9733	9462	pg1420_o2nofp.cx10a_c32r128
9936	188414	0	0.0	344.3	27.8	0.000	0.000	0.035	2.865	726438	42.1	3.856	107	58.0	127.3	42.6	0.020	9556	9285	pg1515_o2nofp.cx10a_c32r128
9936	191676	0	0.0	341.0	27.6	0.000	0.000	0.034	2.843	739021	42.2	3.856	106	57.7	127.2	30.8	0.020	9701	9449	pg1611_o2nofp.cx10a_c32r128
9936	188399	0	0.0	343.6	27.6	0.000	0.000	0.035	2.842	725953	42.1	3.853	107	57.8	127.2	24.2	0.017	9543	9286	pg177_o2nofp.cx10a_c32r128
9936	186654	0	0.0	334.3	27.6	0.000	0.000	0.034	2.846	719348	42.1	3.854	108	57.7	123.9	8.4	0.023	9401	9142	pg181_o2nofp.cx10b_c32r128
qr1000.L5
qr1000.L5: range queries with 1000 insert/s per client
Performance metrics for all DBMS, not just the ones listed above. Some are normalized by throughput, others are not. Legend for results is here.
ips	qps	rps	rmbps	wps	wmbps	rpq	rkbpq	wpi	wkbpi	csps	cpups	cspq	cpupq	dbgb1	dbgb2	rss	maxop	p50	p99	tag
19868	368957	0	0.0	420.4	37.0	0.000	0.000	0.021	1.908	1398532	44.9	3.791	58	60.1	125.1	27.7	0.089	18476	17005	pg1222_o2nofp.cx10a_c32r128
19868	342124	0	0.0	419.1	36.8	0.000	0.000	0.021	1.895	1296674	44.8	3.790	63	59.8	126.9	22.2	0.044	17101	15892	pg1323_o2nofp.cx10a_c32r128
19868	366756	0	0.0	418.3	36.6	0.000	0.000	0.021	1.886	1390456	44.5	3.791	58	57.9	124.8	28.8	0.061	18396	17182	pg1420_o2nofp.cx10a_c32r128
19873	351054	0	0.0	412.7	36.6	0.000	0.000	0.021	1.888	1331615	44.7	3.793	61	58.0	124.9	35.5	0.031	17677	16686	pg1515_o2nofp.cx10a_c32r128
19868	354700	0	0.0	410.9	36.4	0.000	0.000	0.021	1.877	1344231	44.7	3.790	60	57.7	124.7	29.4	0.070	17996	16782	pg1611_o2nofp.cx10a_c32r128
19868	354246	0	0.0	411.6	36.5	0.000	0.000	0.021	1.879	1340857	44.7	3.785	61	57.9	124.8	24.1	0.071	17852	16558	pg177_o2nofp.cx10a_c32r128
19868	353185	0	0.0	407.0	35.8	0.000	0.000	0.020	1.845	1337684	44.7	3.787	61	57.8	122.0	2.5	0.067	17885	16846	pg181_o2nofp.cx10b_c32r128
qp1000.L6
qp1000.L6: point queries with 1000 insert/s per client
Performance metrics for all DBMS, not just the ones listed above. Some are normalized by throughput, others are not. Legend for results is here.
ips	qps	rps	rmbps	wps	wmbps	rpq	rkbpq	wpi	wkbpi	csps	cpups	cspq	cpupq	dbgb1	dbgb2	rss	maxop	p50	p99	tag
19868	194906	2	0.2	413.8	36.0	0.000	0.001	0.021	1.856	750662	43.5	3.851	107	60.0	125.2	25.8	0.104	9865	9494	pg1222_o2nofp.cx10a_c32r128
19868	186676	0	0.0	410.5	35.8	0.000	0.000	0.021	1.847	718710	43.6	3.850	112	59.8	126.8	11.6	0.070	9331	8953	pg1323_o2nofp.cx10a_c32r128
19868	190800	0	0.0	412.2	35.7	0.000	0.000	0.021	1.842	734552	43.5	3.850	109	57.9	124.8	36.8	0.066	9669	9305	pg1420_o2nofp.cx10a_c32r128
19873	186865	0	0.0	406.9	35.7	0.000	0.000	0.020	1.840	718990	43.2	3.848	111	58.0	124.9	21.0	0.074	9510	9126	pg1515_o2nofp.cx10a_c32r128
19868	190167	0	0.0	405.9	35.6	0.000	0.000	0.020	1.835	731437	43.3	3.846	109	57.7	124.7	19.7	0.074	9622	9193	pg1611_o2nofp.cx10a_c32r128
19868	186922	0	0.0	403.1	35.5	0.000	0.000	0.020	1.832	718368	43.2	3.843	111	57.9	124.8	4.4	0.075	9558	9126	pg177_o2nofp.cx10a_c32r128
19868	184865	0	0.0	403.2	35.7	0.000	0.000	0.020	1.840	710473	43.3	3.843	112	57.8	122.5	4.4	0.036	9350	8966	pg181_o2nofp.cx10b_c32r128
l.i0
- l.i0: load without secondary indexes
- Legend for results is here.
- Each entry lists the percentage of responses that fit in that bucket (slower than max time for previous bucket, faster than min time for next bucket).
Insert response time histogram
256us	1ms	4ms	16ms	64ms	256ms	1s	4s	16s	gt	max	tag
0.000	96.059	3.897	0.020	0.004	0.018	0.002	0.000	0.000	0.000	0.389	pg1222_o2nofp.cx10a_c32r128
0.000	94.636	5.326	0.016	0.002	0.018	0.002	0.000	0.000	0.000	0.462	pg1323_o2nofp.cx10a_c32r128
0.000	92.085	7.874	0.015	0.009	0.013	0.004	0.000	0.000	0.000	0.527	pg1420_o2nofp.cx10a_c32r128
0.000	93.852	6.111	0.019	0.001	0.008	0.009	0.000	0.000	0.000	0.842	pg1515_o2nofp.cx10a_c32r128
0.000	93.267	6.702	0.012	0.001	0.011	0.007	0.000	0.000	0.000	0.755	pg1611_o2nofp.cx10a_c32r128
0.000	92.862	7.083	0.037	0.002	0.007	0.009	0.000	0.000	0.000	0.999	pg177_o2nofp.cx10a_c32r128
0.000	95.800	4.161	0.015	0.005	0.012	0.007	0.000	0.000	0.000	0.412	pg181_o2nofp.cx10b_c32r128
l.x
- l.x: create secondary indexes
- Legend for results is here.
- Each entry lists the percentage of responses that fit in that bucket (slower than max time for previous bucket, faster than min time for next bucket).
TODO - determine whether there is data for create index response time
l.i1
- l.i1: continue load after secondary indexes created with 50 inserts per transaction
- Legend for results is here.
- Each entry lists the percentage of responses that fit in that bucket (slower than max time for previous bucket, faster than min time for next bucket).
Insert response time histogram
256us	1ms	4ms	16ms	64ms	256ms	1s	4s	16s	gt	max	tag
0.000	0.787	90.267	8.419	0.525	0.002	nonzero	0.000	0.000	0.000	0.295	pg1222_o2nofp.cx10a_c32r128
0.000	1.134	89.955	8.479	0.430	0.002	nonzero	0.000	0.000	0.000	0.257	pg1323_o2nofp.cx10a_c32r128
0.000	1.499	90.957	7.085	0.457	0.001	nonzero	0.000	0.000	0.000	0.479	pg1420_o2nofp.cx10a_c32r128
0.000	1.053	91.307	7.158	0.479	0.003	nonzero	0.000	0.000	0.000	0.562	pg1515_o2nofp.cx10a_c32r128
0.000	1.733	90.489	7.318	0.458	0.002	nonzero	0.000	0.000	0.000	0.323	pg1611_o2nofp.cx10a_c32r128
0.000	1.780	89.976	7.768	0.472	0.002	0.001	0.000	0.000	0.000	0.811	pg177_o2nofp.cx10a_c32r128
0.000	1.788	90.473	7.262	0.472	0.003	0.001	nonzero	0.000	0.000	1.052	pg181_o2nofp.cx10b_c32r128
Delete response time histogram
256us	1ms	4ms	16ms	64ms	256ms	1s	4s	16s	gt	max	tag
0.000	18.524	78.049	3.172	0.254	0.002	nonzero	0.000	0.000	0.000	0.292	pg1222_o2nofp.cx10a_c32r128
0.000	15.499	80.855	3.453	0.192	0.002	nonzero	0.000	0.000	0.000	0.259	pg1323_o2nofp.cx10a_c32r128
0.000	15.543	81.249	3.002	0.206	0.001	nonzero	0.000	0.000	0.000	0.478	pg1420_o2nofp.cx10a_c32r128
0.000	18.633	78.321	2.840	0.204	0.002	nonzero	0.000	0.000	0.000	0.537	pg1515_o2nofp.cx10a_c32r128
0.000	15.203	80.961	3.635	0.199	0.002	nonzero	0.000	0.000	0.000	0.324	pg1611_o2nofp.cx10a_c32r128
0.000	19.193	77.380	3.217	0.208	0.002	0.001	0.000	0.000	0.000	0.809	pg177_o2nofp.cx10a_c32r128
0.000	19.438	77.351	3.010	0.199	0.002	0.001	0.000	0.000	0.000	0.686	pg181_o2nofp.cx10b_c32r128
l.i2
- l.i2: continue load after secondary indexes created with 5 inserts per transaction
- Legend for results is here.
- Each entry lists the percentage of responses that fit in that bucket (slower than max time for previous bucket, faster than min time for next bucket).
Insert response time histogram
256us	1ms	4ms	16ms	64ms	256ms	1s	4s	16s	gt	max	tag
86.403	12.862	0.713	0.021	nonzero	nonzero	0.000	0.000	0.000	0.000	0.118	pg1222_o2nofp.cx10a_c32r128
86.259	13.141	0.587	0.013	nonzero	nonzero	0.000	0.000	0.000	0.000	0.089	pg1323_o2nofp.cx10a_c32r128
87.534	11.965	0.484	0.017	nonzero	nonzero	0.000	0.000	0.000	0.000	0.086	pg1420_o2nofp.cx10a_c32r128
83.334	15.882	0.755	0.028	nonzero	nonzero	0.000	0.000	0.000	0.000	0.091	pg1515_o2nofp.cx10a_c32r128
84.667	14.786	0.532	0.015	nonzero	nonzero	0.000	0.000	0.000	0.000	0.088	pg1611_o2nofp.cx10a_c32r128
90.919	8.875	0.198	0.009	nonzero	nonzero	0.000	0.000	0.000	0.000	0.096	pg177_o2nofp.cx10a_c32r128
88.676	11.052	0.256	0.016	nonzero	nonzero	0.000	0.000	0.000	0.000	0.092	pg181_o2nofp.cx10b_c32r128
Delete response time histogram
256us	1ms	4ms	16ms	64ms	256ms	1s	4s	16s	gt	max	tag
3.247	57.993	38.740	0.020	nonzero	nonzero	0.000	0.000	0.000	0.000	0.118	pg1222_o2nofp.cx10a_c32r128
2.051	50.409	47.527	0.013	nonzero	nonzero	0.000	0.000	0.000	0.000	0.089	pg1323_o2nofp.cx10a_c32r128
2.058	47.596	50.320	0.025	nonzero	nonzero	0.000	0.000	0.000	0.000	0.087	pg1420_o2nofp.cx10a_c32r128
1.844	56.348	41.774	0.034	nonzero	nonzero	0.000	0.000	0.000	0.000	0.091	pg1515_o2nofp.cx10a_c32r128
1.557	46.737	51.685	0.020	nonzero	nonzero	0.000	0.000	0.000	0.000	0.088	pg1611_o2nofp.cx10a_c32r128
2.349	53.044	44.559	0.048	nonzero	nonzero	0.000	0.000	0.000	0.000	0.096	pg177_o2nofp.cx10a_c32r128
1.902	71.647	26.384	0.067	0.001	nonzero	0.000	0.000	0.000	0.000	0.092	pg181_o2nofp.cx10b_c32r128
qr100.L1
- qr100.L1: range queries with 100 insert/s per client
- Legend for results is here.
- Each entry lists the percentage of responses that fit in that bucket (slower than max time for previous bucket, faster than min time for next bucket).
Query response time histogram
256us	1ms	4ms	16ms	64ms	256ms	1s	4s	16s	gt	max	tag
99.998	0.001	0.001	nonzero	nonzero	0.000	0.000	0.000	0.000	0.000	0.043	pg1222_o2nofp.cx10a_c32r128
99.998	0.001	0.001	nonzero	0.000	0.000	0.000	0.000	0.000	0.000	0.011	pg1323_o2nofp.cx10a_c32r128
99.998	0.001	0.001	nonzero	0.000	0.000	0.000	0.000	0.000	0.000	0.012	pg1420_o2nofp.cx10a_c32r128
99.998	0.001	0.001	nonzero	0.000	0.000	0.000	0.000	0.000	0.000	0.008	pg1515_o2nofp.cx10a_c32r128
99.998	0.001	0.001	nonzero	0.000	0.000	0.000	0.000	0.000	0.000	0.008	pg1611_o2nofp.cx10a_c32r128
99.998	0.001	0.001	nonzero	0.000	0.000	0.000	0.000	0.000	0.000	0.008	pg177_o2nofp.cx10a_c32r128
99.998	0.001	0.001	nonzero	nonzero	nonzero	0.000	0.000	0.000	0.000	0.084	pg181_o2nofp.cx10b_c32r128
Insert response time histogram
256us	1ms	4ms	16ms	64ms	256ms	1s	4s	16s	gt	max	tag
0.000	0.000	99.808	0.174	0.017	0.000	0.000	0.000	0.000	0.000	0.045	pg1222_o2nofp.cx10a_c32r128
0.000	0.000	99.805	0.195	0.000	0.000	0.000	0.000	0.000	0.000	0.010	pg1323_o2nofp.cx10a_c32r128
0.000	0.001	99.823	0.176	0.000	0.000	0.000	0.000	0.000	0.000	0.014	pg1420_o2nofp.cx10a_c32r128
0.000	0.000	99.833	0.167	0.000	0.000	0.000	0.000	0.000	0.000	0.011	pg1515_o2nofp.cx10a_c32r128
0.000	0.001	99.829	0.170	0.000	0.000	0.000	0.000	0.000	0.000	0.010	pg1611_o2nofp.cx10a_c32r128
0.000	0.019	99.828	0.152	0.000	0.000	0.000	0.000	0.000	0.000	0.010	pg177_o2nofp.cx10a_c32r128
0.000	0.144	99.635	0.199	0.021	0.000	0.000	0.000	0.000	0.000	0.023	pg181_o2nofp.cx10b_c32r128
Delete response time histogram
256us	1ms	4ms	16ms	64ms	256ms	1s	4s	16s	gt	max	tag
0.000	50.335	49.621	0.032	0.013	0.000	0.000	0.000	0.000	0.000	0.045	pg1222_o2nofp.cx10a_c32r128
0.000	46.558	53.408	0.033	0.000	0.000	0.000	0.000	0.000	0.000	0.010	pg1323_o2nofp.cx10a_c32r128
0.000	41.471	58.501	0.028	0.000	0.000	0.000	0.000	0.000	0.000	0.008	pg1420_o2nofp.cx10a_c32r128
0.000	46.689	53.295	0.016	0.000	0.000	0.000	0.000	0.000	0.000	0.006	pg1515_o2nofp.cx10a_c32r128
0.000	41.434	58.544	0.022	0.000	0.000	0.000	0.000	0.000	0.000	0.008	pg1611_o2nofp.cx10a_c32r128
0.000	43.464	56.519	0.017	0.000	0.000	0.000	0.000	0.000	0.000	0.007	pg177_o2nofp.cx10a_c32r128
0.000	66.289	33.631	0.073	0.008	0.000	0.000	0.000	0.000	0.000	0.021	pg181_o2nofp.cx10b_c32r128
qp100.L2
- qp100.L2: point queries with 100 insert/s per client
- Legend for results is here.
- Each entry lists the percentage of responses that fit in that bucket (slower than max time for previous bucket, faster than min time for next bucket).
Query response time histogram
256us	1ms	4ms	16ms	64ms	256ms	1s	4s	16s	gt	max	tag
99.995	0.004	0.001	nonzero	nonzero	0.000	0.000	0.000	0.000	0.000	0.020	pg1222_o2nofp.cx10a_c32r128
99.994	0.005	0.001	nonzero	nonzero	0.000	0.000	0.000	0.000	0.000	0.024	pg1323_o2nofp.cx10a_c32r128
99.995	0.004	0.001	nonzero	0.000	nonzero	0.000	0.000	0.000	0.000	0.082	pg1420_o2nofp.cx10a_c32r128
99.995	0.004	0.001	nonzero	nonzero	0.000	0.000	0.000	0.000	0.000	0.018	pg1515_o2nofp.cx10a_c32r128
99.995	0.004	0.001	nonzero	0.000	0.000	0.000	0.000	0.000	0.000	0.013	pg1611_o2nofp.cx10a_c32r128
99.995	0.004	0.001	nonzero	0.000	0.000	0.000	0.000	0.000	0.000	0.012	pg177_o2nofp.cx10a_c32r128
99.995	0.004	0.001	nonzero	nonzero	0.000	0.000	0.000	0.000	0.000	0.017	pg181_o2nofp.cx10b_c32r128
Insert response time histogram
256us	1ms	4ms	16ms	64ms	256ms	1s	4s	16s	gt	max	tag
0.000	0.000	99.659	0.316	0.025	0.000	0.000	0.000	0.000	0.000	0.051	pg1222_o2nofp.cx10a_c32r128
0.000	0.000	99.753	0.242	0.006	0.000	0.000	0.000	0.000	0.000	0.024	pg1323_o2nofp.cx10a_c32r128
0.000	0.000	99.709	0.291	0.000	0.000	0.000	0.000	0.000	0.000	0.009	pg1420_o2nofp.cx10a_c32r128
0.000	0.000	99.779	0.219	0.002	0.000	0.000	0.000	0.000	0.000	0.021	pg1515_o2nofp.cx10a_c32r128
0.000	0.000	99.790	0.210	0.000	0.000	0.000	0.000	0.000	0.000	0.015	pg1611_o2nofp.cx10a_c32r128
0.000	0.000	99.718	0.278	0.004	0.000	0.000	0.000	0.000	0.000	0.024	pg177_o2nofp.cx10a_c32r128
0.000	0.000	99.691	0.276	0.033	0.000	0.000	0.000	0.000	0.000	0.032	pg181_o2nofp.cx10b_c32r128
Delete response time histogram
256us	1ms	4ms	16ms	64ms	256ms	1s	4s	16s	gt	max	tag
0.000	42.325	57.517	0.145	0.013	0.000	0.000	0.000	0.000	0.000	0.051	pg1222_o2nofp.cx10a_c32r128
0.000	39.397	60.484	0.114	0.005	0.000	0.000	0.000	0.000	0.000	0.022	pg1323_o2nofp.cx10a_c32r128
0.000	38.436	61.387	0.177	0.000	0.000	0.000	0.000	0.000	0.000	0.016	pg1420_o2nofp.cx10a_c32r128
0.000	40.301	59.607	0.089	0.003	0.000	0.000	0.000	0.000	0.000	0.019	pg1515_o2nofp.cx10a_c32r128
0.000	38.519	61.380	0.101	0.000	0.000	0.000	0.000	0.000	0.000	0.016	pg1611_o2nofp.cx10a_c32r128
0.000	38.549	61.272	0.175	0.004	0.000	0.000	0.000	0.000	0.000	0.021	pg177_o2nofp.cx10a_c32r128
0.000	51.496	48.325	0.155	0.024	0.000	0.000	0.000	0.000	0.000	0.030	pg181_o2nofp.cx10b_c32r128
qr500.L3
- qr500.L3: range queries with 500 insert/s per client
- Legend for results is here.
- Each entry lists the percentage of responses that fit in that bucket (slower than max time for previous bucket, faster than min time for next bucket).
Query response time histogram
256us	1ms	4ms	16ms	64ms	256ms	1s	4s	16s	gt	max	tag
99.994	0.003	0.003	nonzero	nonzero	0.000	0.000	0.000	0.000	0.000	0.036	pg1222_o2nofp.cx10a_c32r128
99.994	0.003	0.003	nonzero	nonzero	0.000	0.000	0.000	0.000	0.000	0.024	pg1323_o2nofp.cx10a_c32r128
99.994	0.003	0.003	nonzero	nonzero	0.000	0.000	0.000	0.000	0.000	0.028	pg1420_o2nofp.cx10a_c32r128
99.994	0.003	0.003	nonzero	nonzero	0.000	0.000	0.000	0.000	0.000	0.020	pg1515_o2nofp.cx10a_c32r128
99.994	0.003	0.003	nonzero	nonzero	0.000	0.000	0.000	0.000	0.000	0.022	pg1611_o2nofp.cx10a_c32r128
99.994	0.003	0.003	nonzero	nonzero	0.000	0.000	0.000	0.000	0.000	0.024	pg177_o2nofp.cx10a_c32r128
99.995	0.003	0.002	nonzero	nonzero	0.000	0.000	0.000	0.000	0.000	0.018	pg181_o2nofp.cx10b_c32r128
Insert response time histogram
256us	1ms	4ms	16ms	64ms	256ms	1s	4s	16s	gt	max	tag
0.000	9.475	89.944	0.563	0.017	0.000	0.000	0.000	0.000	0.000	0.049	pg1222_o2nofp.cx10a_c32r128
0.000	7.494	91.961	0.535	0.010	0.000	0.000	0.000	0.000	0.000	0.030	pg1323_o2nofp.cx10a_c32r128
0.000	6.891	92.571	0.523	0.014	0.000	0.000	0.000	0.000	0.000	0.035	pg1420_o2nofp.cx10a_c32r128
0.000	5.533	93.936	0.524	0.006	0.000	0.000	0.000	0.000	0.000	0.030	pg1515_o2nofp.cx10a_c32r128
0.000	7.849	91.652	0.488	0.011	0.000	0.000	0.000	0.000	0.000	0.026	pg1611_o2nofp.cx10a_c32r128
0.000	14.823	84.666	0.501	0.010	0.000	0.000	0.000	0.000	0.000	0.027	pg177_o2nofp.cx10a_c32r128
0.000	15.572	83.919	0.497	0.011	0.000	0.000	0.000	0.000	0.000	0.033	pg181_o2nofp.cx10b_c32r128
Delete response time histogram
256us	1ms	4ms	16ms	64ms	256ms	1s	4s	16s	gt	max	tag
0.000	54.019	45.687	0.284	0.010	0.000	0.000	0.000	0.000	0.000	0.040	pg1222_o2nofp.cx10a_c32r128
0.000	46.540	53.158	0.297	0.005	0.000	0.000	0.000	0.000	0.000	0.030	pg1323_o2nofp.cx10a_c32r128
0.000	41.228	58.482	0.284	0.006	0.000	0.000	0.000	0.000	0.000	0.032	pg1420_o2nofp.cx10a_c32r128
0.000	50.263	49.500	0.235	0.002	0.000	0.000	0.000	0.000	0.000	0.023	pg1515_o2nofp.cx10a_c32r128
0.000	41.381	58.350	0.262	0.007	0.000	0.000	0.000	0.000	0.000	0.022	pg1611_o2nofp.cx10a_c32r128
0.000	47.079	52.640	0.276	0.005	0.000	0.000	0.000	0.000	0.000	0.021	pg177_o2nofp.cx10a_c32r128
0.000	72.045	27.693	0.258	0.004	0.000	0.000	0.000	0.000	0.000	0.021	pg181_o2nofp.cx10b_c32r128
qp500.L4
- qp500.L4: point queries with 500 insert/s per client
- Legend for results is here.
- Each entry lists the percentage of responses that fit in that bucket (slower than max time for previous bucket, faster than min time for next bucket).
Query response time histogram
256us	1ms	4ms	16ms	64ms	256ms	1s	4s	16s	gt	max	tag
99.990	0.007	0.003	nonzero	nonzero	0.000	0.000	0.000	0.000	0.000	0.016	pg1222_o2nofp.cx10a_c32r128
99.989	0.008	0.003	nonzero	nonzero	0.000	0.000	0.000	0.000	0.000	0.019	pg1323_o2nofp.cx10a_c32r128
99.989	0.007	0.003	nonzero	nonzero	0.000	0.000	0.000	0.000	0.000	0.023	pg1420_o2nofp.cx10a_c32r128
99.989	0.008	0.003	nonzero	nonzero	0.000	0.000	0.000	0.000	0.000	0.020	pg1515_o2nofp.cx10a_c32r128
99.989	0.007	0.003	nonzero	nonzero	0.000	0.000	0.000	0.000	0.000	0.020	pg1611_o2nofp.cx10a_c32r128
99.989	0.008	0.003	nonzero	nonzero	0.000	0.000	0.000	0.000	0.000	0.017	pg177_o2nofp.cx10a_c32r128
99.988	0.008	0.003	nonzero	nonzero	0.000	0.000	0.000	0.000	0.000	0.023	pg181_o2nofp.cx10b_c32r128
Insert response time histogram
256us	1ms	4ms	16ms	64ms	256ms	1s	4s	16s	gt	max	tag
0.000	8.707	90.937	0.348	0.009	0.000	0.000	0.000	0.000	0.000	0.041	pg1222_o2nofp.cx10a_c32r128
0.000	6.984	92.741	0.267	0.008	0.000	0.000	0.000	0.000	0.000	0.037	pg1323_o2nofp.cx10a_c32r128
0.000	6.942	92.731	0.321	0.006	0.000	0.000	0.000	0.000	0.000	0.060	pg1420_o2nofp.cx10a_c32r128
0.000	3.118	96.598	0.278	0.006	0.000	0.000	0.000	0.000	0.000	0.029	pg1515_o2nofp.cx10a_c32r128
0.000	6.284	93.417	0.295	0.004	0.000	0.000	0.000	0.000	0.000	0.031	pg1611_o2nofp.cx10a_c32r128
0.000	11.990	87.737	0.269	0.004	0.000	0.000	0.000	0.000	0.000	0.028	pg177_o2nofp.cx10a_c32r128
0.000	12.833	86.828	0.332	0.006	0.000	0.000	0.000	0.000	0.000	0.029	pg181_o2nofp.cx10b_c32r128
Delete response time histogram
256us	1ms	4ms	16ms	64ms	256ms	1s	4s	16s	gt	max	tag
0.000	62.651	37.154	0.190	0.005	0.000	0.000	0.000	0.000	0.000	0.039	pg1222_o2nofp.cx10a_c32r128
0.000	56.862	42.994	0.138	0.006	0.000	0.000	0.000	0.000	0.000	0.024	pg1323_o2nofp.cx10a_c32r128
0.000	52.993	46.814	0.188	0.005	0.000	0.000	0.000	0.000	0.000	0.037	pg1420_o2nofp.cx10a_c32r128
0.000	59.682	40.179	0.137	0.003	0.000	0.000	0.000	0.000	0.000	0.024	pg1515_o2nofp.cx10a_c32r128
0.000	53.179	46.666	0.152	0.004	0.000	0.000	0.000	0.000	0.000	0.030	pg1611_o2nofp.cx10a_c32r128
0.000	57.484	42.357	0.157	0.003	0.000	0.000	0.000	0.000	0.000	0.024	pg177_o2nofp.cx10a_c32r128
0.000	60.955	38.849	0.194	0.002	0.000	0.000	0.000	0.000	0.000	0.020	pg181_o2nofp.cx10b_c32r128
qr1000.L5
- qr1000.L5: range queries with 1000 insert/s per client
- Legend for results is here.
- Each entry lists the percentage of responses that fit in that bucket (slower than max time for previous bucket, faster than min time for next bucket).
Query response time histogram
256us	1ms	4ms	16ms	64ms	256ms	1s	4s	16s	gt	max	tag
99.988	0.007	0.005	nonzero	nonzero	nonzero	0.000	0.000	0.000	0.000	0.089	pg1222_o2nofp.cx10a_c32r128
99.988	0.007	0.005	nonzero	nonzero	0.000	0.000	0.000	0.000	0.000	0.044	pg1323_o2nofp.cx10a_c32r128
99.989	0.006	0.004	nonzero	nonzero	0.000	0.000	0.000	0.000	0.000	0.061	pg1420_o2nofp.cx10a_c32r128
99.989	0.007	0.004	nonzero	nonzero	0.000	0.000	0.000	0.000	0.000	0.031	pg1515_o2nofp.cx10a_c32r128
99.989	0.006	0.004	nonzero	nonzero	nonzero	0.000	0.000	0.000	0.000	0.070	pg1611_o2nofp.cx10a_c32r128
99.989	0.007	0.004	nonzero	nonzero	nonzero	0.000	0.000	0.000	0.000	0.071	pg177_o2nofp.cx10a_c32r128
99.990	0.006	0.004	nonzero	nonzero	nonzero	0.000	0.000	0.000	0.000	0.067	pg181_o2nofp.cx10b_c32r128
Insert response time histogram
256us	1ms	4ms	16ms	64ms	256ms	1s	4s	16s	gt	max	tag
0.000	28.415	71.268	0.310	0.006	0.000	0.000	0.000	0.000	0.000	0.036	pg1222_o2nofp.cx10a_c32r128
0.000	27.924	71.762	0.307	0.006	0.000	0.000	0.000	0.000	0.000	0.031	pg1323_o2nofp.cx10a_c32r128
0.000	25.196	74.481	0.316	0.006	0.000	0.000	0.000	0.000	0.000	0.030	pg1420_o2nofp.cx10a_c32r128
0.000	21.359	78.223	0.411	0.007	0.000	0.000	0.000	0.000	0.000	0.033	pg1515_o2nofp.cx10a_c32r128
0.000	27.049	72.598	0.348	0.005	0.000	0.000	0.000	0.000	0.000	0.026	pg1611_o2nofp.cx10a_c32r128
0.000	30.168	69.468	0.355	0.009	0.000	0.000	0.000	0.000	0.000	0.030	pg177_o2nofp.cx10a_c32r128
0.000	38.722	61.033	0.241	0.004	0.000	0.000	0.000	0.000	0.000	0.033	pg181_o2nofp.cx10b_c32r128
Delete response time histogram
256us	1ms	4ms	16ms	64ms	256ms	1s	4s	16s	gt	max	tag
0.000	58.555	41.270	0.170	0.004	0.000	0.000	0.000	0.000	0.000	0.030	pg1222_o2nofp.cx10a_c32r128
0.000	51.936	47.885	0.176	0.003	0.000	0.000	0.000	0.000	0.000	0.037	pg1323_o2nofp.cx10a_c32r128
0.000	47.482	52.335	0.179	0.004	0.000	0.000	0.000	0.000	0.000	0.026	pg1420_o2nofp.cx10a_c32r128
0.000	56.164	43.601	0.231	0.004	0.000	0.000	0.000	0.000	0.000	0.036	pg1515_o2nofp.cx10a_c32r128
0.000	47.785	52.014	0.199	0.002	0.000	0.000	0.000	0.000	0.000	0.027	pg1611_o2nofp.cx10a_c32r128
0.000	52.085	47.651	0.258	0.005	0.000	0.000	0.000	0.000	0.000	0.029	pg177_o2nofp.cx10a_c32r128
0.000	53.410	46.404	0.184	0.002	0.000	0.000	0.000	0.000	0.000	0.038	pg181_o2nofp.cx10b_c32r128
qp1000.L6
- qp1000.L6: point queries with 1000 insert/s per client
- Legend for results is here.
- Each entry lists the percentage of responses that fit in that bucket (slower than max time for previous bucket, faster than min time for next bucket).
Query response time histogram
256us	1ms	4ms	16ms	64ms	256ms	1s	4s	16s	gt	max	tag
99.983	0.012	0.005	nonzero	nonzero	nonzero	0.000	0.000	0.000	0.000	0.104	pg1222_o2nofp.cx10a_c32r128
99.981	0.014	0.005	nonzero	nonzero	nonzero	0.000	0.000	0.000	0.000	0.070	pg1323_o2nofp.cx10a_c32r128
99.982	0.013	0.005	nonzero	nonzero	nonzero	0.000	0.000	0.000	0.000	0.066	pg1420_o2nofp.cx10a_c32r128
99.981	0.014	0.005	nonzero	nonzero	nonzero	0.000	0.000	0.000	0.000	0.074	pg1515_o2nofp.cx10a_c32r128
99.981	0.013	0.005	nonzero	nonzero	nonzero	0.000	0.000	0.000	0.000	0.074	pg1611_o2nofp.cx10a_c32r128
99.981	0.014	0.005	nonzero	nonzero	nonzero	0.000	0.000	0.000	0.000	0.075	pg177_o2nofp.cx10a_c32r128
99.980	0.015	0.005	nonzero	nonzero	0.000	0.000	0.000	0.000	0.000	0.036	pg181_o2nofp.cx10b_c32r128
Insert response time histogram
256us	1ms	4ms	16ms	64ms	256ms	1s	4s	16s	gt	max	tag
0.000	30.559	69.146	0.292	0.003	nonzero	0.000	0.000	0.000	0.000	0.084	pg1222_o2nofp.cx10a_c32r128
0.000	24.834	74.893	0.269	0.004	0.000	0.000	0.000	0.000	0.000	0.035	pg1323_o2nofp.cx10a_c32r128
0.000	27.839	71.890	0.264	0.008	0.000	0.000	0.000	0.000	0.000	0.039	pg1420_o2nofp.cx10a_c32r128
0.000	20.240	79.427	0.328	0.006	nonzero	0.000	0.000	0.000	0.000	0.066	pg1515_o2nofp.cx10a_c32r128
0.000	25.563	74.152	0.278	0.007	0.000	0.000	0.000	0.000	0.000	0.038	pg1611_o2nofp.cx10a_c32r128
0.000	36.617	63.060	0.314	0.010	0.000	0.000	0.000	0.000	0.000	0.047	pg177_o2nofp.cx10a_c32r128
0.000	35.732	64.018	0.241	0.009	0.000	0.000	0.000	0.000	0.000	0.035	pg181_o2nofp.cx10b_c32r128
Delete response time histogram
256us	1ms	4ms	16ms	64ms	256ms	1s	4s	16s	gt	max	tag
0.000	59.099	40.754	0.145	0.002	nonzero	0.000	0.000	0.000	0.000	0.083	pg1222_o2nofp.cx10a_c32r128
0.000	52.037	47.811	0.150	0.003	0.000	0.000	0.000	0.000	0.000	0.025	pg1323_o2nofp.cx10a_c32r128
0.000	47.552	52.274	0.169	0.005	0.000	0.000	0.000	0.000	0.000	0.033	pg1420_o2nofp.cx10a_c32r128
0.000	55.549	44.257	0.191	0.003	nonzero	0.000	0.000	0.000	0.000	0.065	pg1515_o2nofp.cx10a_c32r128
0.000	47.635	52.179	0.182	0.005	0.000	0.000	0.000	0.000	0.000	0.030	pg1611_o2nofp.cx10a_c32r128
0.000	52.510	47.273	0.212	0.005	0.000	0.000	0.000	0.000	0.000	0.037	pg177_o2nofp.cx10a_c32r128
0.000	55.431	44.361	0.204	0.004	0.000	0.000	0.000	0.000	0.000	0.030	pg181_o2nofp.cx10b_c32r128