Introduction
This is a report for the insert benchmark with 200M docs and 20 client(s). It is generated by scripts (bash, awk, sed) and Tufte might not be impressed. An overview of the insert benchmark is here and a short update is here. Below, by DBMS, I mean DBMS+version.config. An example is my8020.c10b40 where my means MySQL, 8020 is version 8.0.20 and c10b40 is the name for the configuration file.
The test server has 48 cores, 128G RAM and 2 NVMe devices using SW RAID. The benchmark was run with 20 clients and there were 1 or 3 connections per client (1 for queries or inserts without rate limits, 1+1 for rate limited inserts+deletes). It uses 20 tables with a table per client. It loads 10M rows per table without secondary indexes, creates 3 secondary indexes per table, then inserts 40m+10m rows per table with a delete per insert to avoid growing the table. It then does 6 read+write tests for 3600s each that do queries as fast as possible with 100,100,500,500,1000,1000 inserts/s and the same for deletes/s per client concurrent with the queries. The database is cached. Clients and the DBMS share one server.
The tested DBMS are:
- ma100624_rel_withdbg.cz12a_c32r128 - MariaDB 10.6.24 with the cz12a_c32r128 config
- ma100624_rel_withdbg.cz12a_cb_c32r128 - MariaDB 10.6.24 with the cz12a_cb_c32r128 config that enables the InnoDB change buffer
- ma101115_rel_withdbg.cz12a_c32r128 - MariaDB 10.11.15 with the cz12a_c32r128 config
- ma110409_rel_withdbg.cz12b_c32r128 - MariaDB 11.4.9 with the cz12b_c32r128 config
- ma110805_rel_withdbg.cz12b_c32r128 - MariaDB 11.8.5 with the cz12b_c32r128 config
- ma120102_rel_withdbg.cz12b_c32r128 - MariaDB 12.1.2 with the cz12b_c32r128 config
- ma120201_rel_withdbg.cz12b_c32r128 - MariaDB 12.2.1 with the cz12b_c32r128 config
Contents
- Summary
- l.i0: load without secondary indexes
- l.x: create secondary indexes
- l.i1: continue load after secondary indexes created with 50 inserts per transaction
- l.i2: continue load after secondary indexes created with 5 inserts per transaction
- qr100.L1: range queries with 100 insert/s per client
- qp100.L2: point queries with 100 insert/s per client
- qr500.L3: range queries with 500 insert/s per client
- qp500.L4: point queries with 500 insert/s per client
- qr1000.L5: range queries with 1000 insert/s per client
- qp1000.L6: point queries with 1000 insert/s per client
Summary
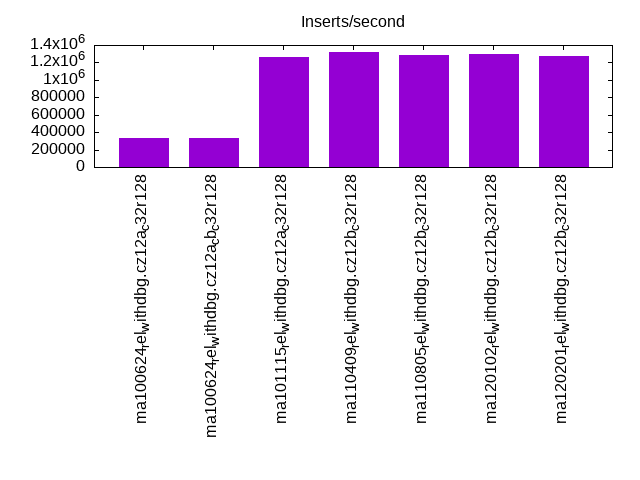
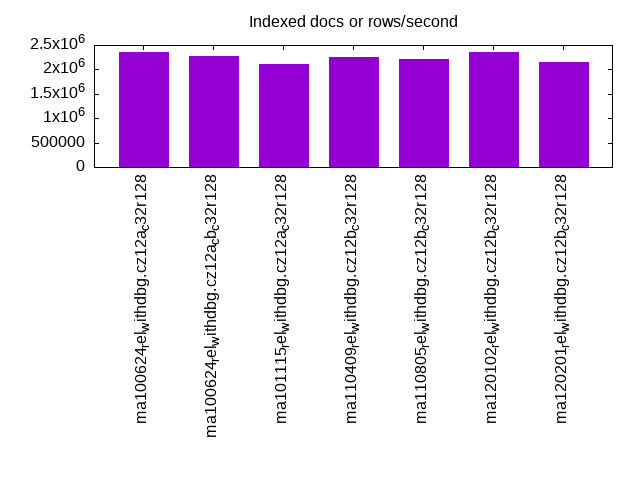
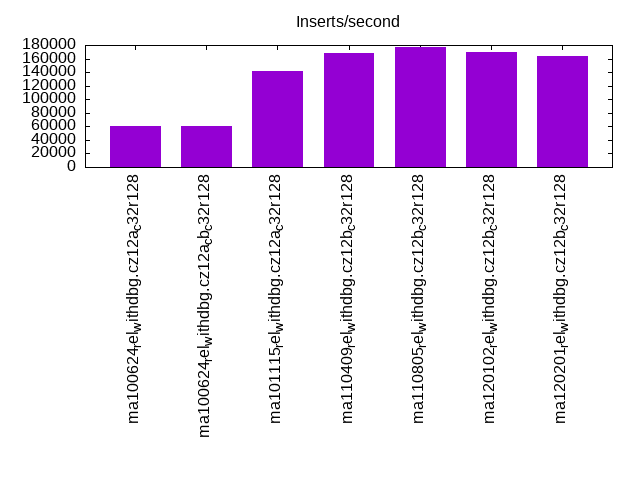
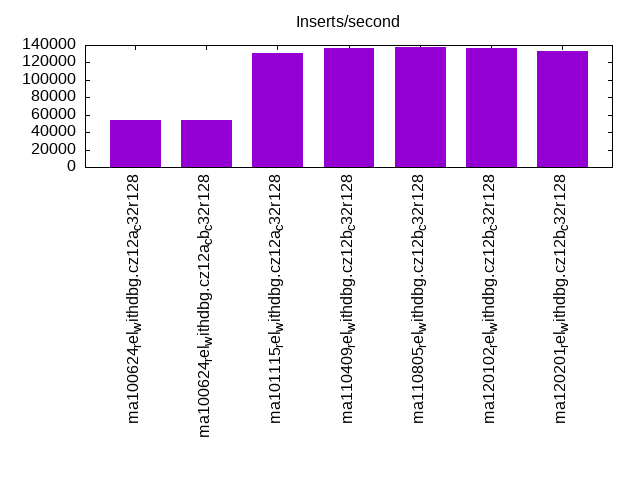
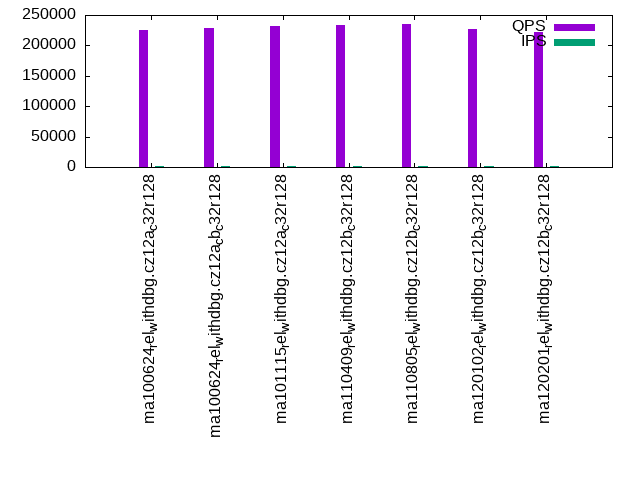
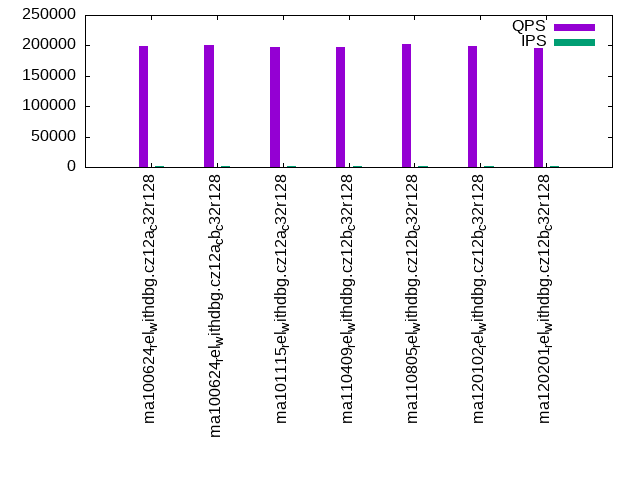
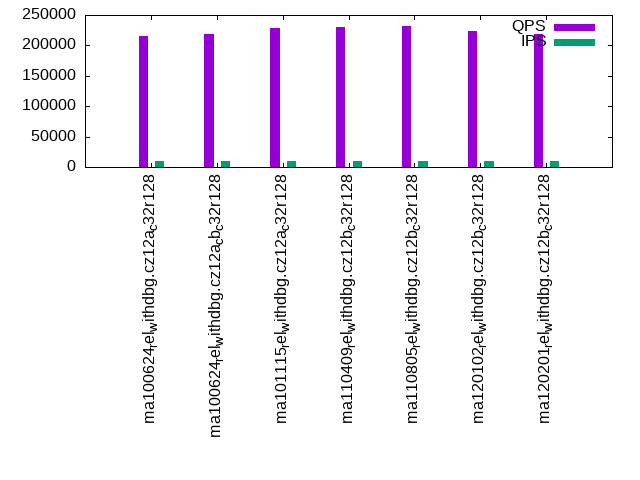
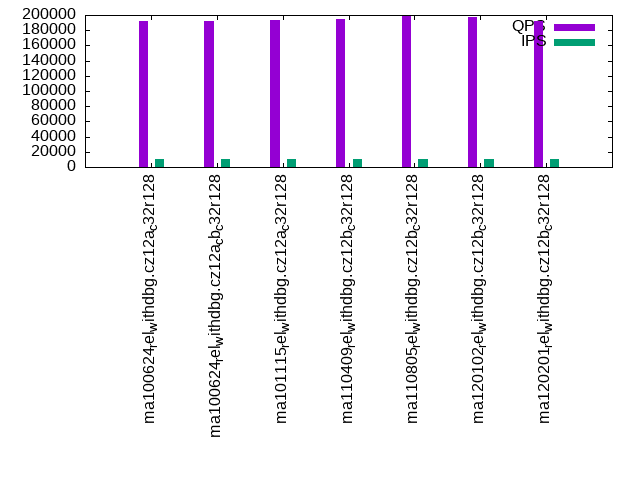
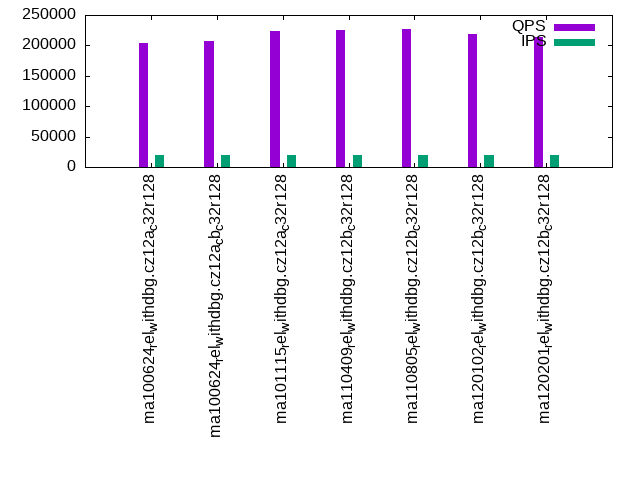
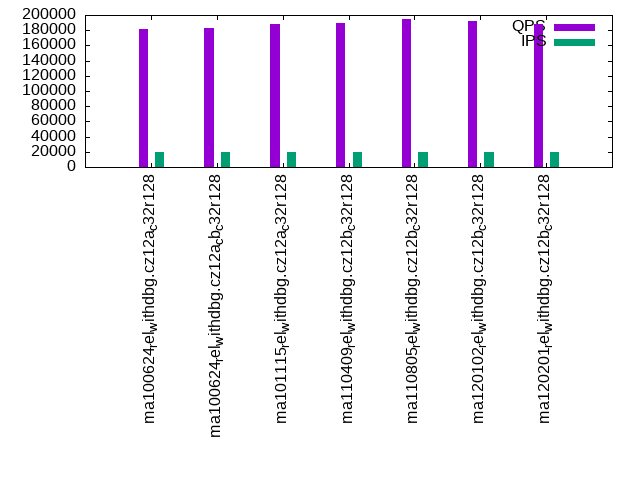
The numbers are inserts/s for l.i0, l.i1 and l.i2, indexed docs (or rows) /s for l.x and queries/s for qr100, qp100 thru qr1000, qp1000" The values are the average rate over the entire test for inserts (IPS) and queries (QPS). The range of values for IPS and QPS is split into 3 parts: bottom 25%, middle 50%, top 25%. Values in the bottom 25% have a red background, values in the top 25% have a green background and values in the middle have no color. A gray background is used for values that can be ignored because the DBMS did not sustain the target insert rate. Red backgrounds are not used when the minimum value is within 80% of the max value.
| dbms | l.i0 | l.x | l.i1 | l.i2 | qr100 | qp100 | qr500 | qp500 | qr1000 | qp1000 |
|---|---|---|---|---|---|---|---|---|---|---|
| ma100624_rel_withdbg.cz12a_c32r128 | 334448 | 2352942 | 60182 | 53981 | 225734 | 199290 | 216133 | 191596 | 204175 | 181478 |
| ma100624_rel_withdbg.cz12a_cb_c32r128 | 335570 | 2272728 | 60173 | 53749 | 228260 | 200344 | 218408 | 192162 | 206653 | 182303 |
| ma101115_rel_withdbg.cz12a_c32r128 | 1257862 | 2105264 | 141618 | 131234 | 232593 | 196794 | 228673 | 193545 | 223060 | 187500 |
| ma110409_rel_withdbg.cz12b_c32r128 | 1324503 | 2247192 | 167961 | 136705 | 232916 | 197088 | 229794 | 194575 | 224560 | 189635 |
| ma110805_rel_withdbg.cz12b_c32r128 | 1290322 | 2222223 | 177502 | 137457 | 236009 | 202155 | 232311 | 199961 | 226998 | 194947 |
| ma120102_rel_withdbg.cz12b_c32r128 | 1298701 | 2352942 | 169960 | 136240 | 226535 | 199363 | 223269 | 196889 | 218810 | 191702 |
| ma120201_rel_withdbg.cz12b_c32r128 | 1273885 | 2150539 | 163499 | 133333 | 221663 | 195092 | 218905 | 192409 | 214165 | 187805 |
This table has relative throughput, throughput for the DBMS relative to the DBMS in the first line, using the absolute throughput from the previous table. Values less than 0.95 have a yellow background. Values greater than 1.05 have a blue background.
| dbms | l.i0 | l.x | l.i1 | l.i2 | qr100 | qp100 | qr500 | qp500 | qr1000 | qp1000 |
|---|---|---|---|---|---|---|---|---|---|---|
| ma100624_rel_withdbg.cz12a_c32r128 | 1.00 | 1.00 | 1.00 | 1.00 | 1.00 | 1.00 | 1.00 | 1.00 | 1.00 | 1.00 |
| ma100624_rel_withdbg.cz12a_cb_c32r128 | 1.00 | 0.97 | 1.00 | 1.00 | 1.01 | 1.01 | 1.01 | 1.00 | 1.01 | 1.00 |
| ma101115_rel_withdbg.cz12a_c32r128 | 3.76 | 0.89 | 2.35 | 2.43 | 1.03 | 0.99 | 1.06 | 1.01 | 1.09 | 1.03 |
| ma110409_rel_withdbg.cz12b_c32r128 | 3.96 | 0.96 | 2.79 | 2.53 | 1.03 | 0.99 | 1.06 | 1.02 | 1.10 | 1.04 |
| ma110805_rel_withdbg.cz12b_c32r128 | 3.86 | 0.94 | 2.95 | 2.55 | 1.05 | 1.01 | 1.07 | 1.04 | 1.11 | 1.07 |
| ma120102_rel_withdbg.cz12b_c32r128 | 3.88 | 1.00 | 2.82 | 2.52 | 1.00 | 1.00 | 1.03 | 1.03 | 1.07 | 1.06 |
| ma120201_rel_withdbg.cz12b_c32r128 | 3.81 | 0.91 | 2.72 | 2.47 | 0.98 | 0.98 | 1.01 | 1.00 | 1.05 | 1.03 |
This lists the average rate of inserts/s for the tests that do inserts concurrent with queries. For such tests the query rate is listed in the table above. The read+write tests are setup so that the insert rate should match the target rate every second. Cells that are not at least 95% of the target have a red background to indicate a failure to satisfy the target.
| dbms | qr100.L1 | qp100.L2 | qr500.L3 | qp500.L4 | qr1000.L5 | qp1000.L6 |
|---|---|---|---|---|---|---|
| ma100624_rel_withdbg.cz12a_c32r128 | 1988 | 1987 | 9936 | 9939 | 19873 | 19878 |
| ma100624_rel_withdbg.cz12a_cb_c32r128 | 1987 | 1987 | 9936 | 9936 | 19878 | 19873 |
| ma101115_rel_withdbg.cz12a_c32r128 | 1987 | 1987 | 9934 | 9934 | 19878 | 19873 |
| ma110409_rel_withdbg.cz12b_c32r128 | 1988 | 1988 | 9939 | 9936 | 19873 | 19873 |
| ma110805_rel_withdbg.cz12b_c32r128 | 1987 | 1987 | 9936 | 9936 | 19873 | 19873 |
| ma120102_rel_withdbg.cz12b_c32r128 | 1988 | 1988 | 9936 | 9936 | 19873 | 19873 |
| ma120201_rel_withdbg.cz12b_c32r128 | 1987 | 1987 | 9939 | 9936 | 19873 | 19873 |
| target | 2000 | 2000 | 10000 | 10000 | 20000 | 20000 |
l.i0
l.i0: load without secondary indexes. Graphs for performance per 1-second interval are here.
Average throughput:
Insert response time histogram: each cell has the percentage of responses that take <= the time in the header and max is the max response time in seconds. For the max column values in the top 25% of the range have a red background and in the bottom 25% of the range have a green background. The red background is not used when the min value is within 80% of the max value.
| dbms | 256us | 1ms | 4ms | 16ms | 64ms | 256ms | 1s | 4s | 16s | gt | max |
|---|---|---|---|---|---|---|---|---|---|---|---|
| ma100624_rel_withdbg.cz12a_c32r128 | 1.255 | 2.465 | 96.189 | 0.009 | 0.082 | 0.209 | |||||
| ma100624_rel_withdbg.cz12a_cb_c32r128 | 1.232 | 2.465 | 96.209 | 0.013 | 0.082 | 0.151 | |||||
| ma101115_rel_withdbg.cz12a_c32r128 | 14.839 | 85.013 | 0.057 | 0.009 | 0.083 | 0.204 | |||||
| ma110409_rel_withdbg.cz12b_c32r128 | 18.133 | 81.696 | 0.075 | 0.015 | 0.081 | 0.201 | |||||
| ma110805_rel_withdbg.cz12b_c32r128 | 16.755 | 83.074 | 0.080 | 0.012 | 0.079 | 0.172 | |||||
| ma120102_rel_withdbg.cz12b_c32r128 | 17.157 | 82.675 | 0.075 | 0.010 | 0.083 | 0.202 | |||||
| ma120201_rel_withdbg.cz12b_c32r128 | 16.564 | 83.259 | 0.084 | 0.014 | 0.078 | 0.001 | 0.312 |
Performance metrics for the DBMS listed above. Some are normalized by throughput, others are not. Legend for results is here.
ips	qps	rps	rmbps	wps	wmbps	rpq	rkbpq	wpi	wkbpi	csps	cpups	cspq	cpupq	dbgb1	dbgb2	rss	maxop	p50	p99	tag
334448	0	0	0.0	1762.8	87.1	0.000	0.000	0.005	0.267	922252	51.7	2.758	74	13.3	114.8	16.0	0.209	17286	14983	ma100624_rel_withdbg.cz12a_c32r128
335570	0	4	0.2	1560.4	84.4	0.000	0.000	0.005	0.258	927799	51.8	2.765	74	13.3	114.9	16.1	0.151	17481	15483	ma100624_rel_withdbg.cz12a_cb_c32r128
1257862	0	2	0.0	4569.9	285.5	0.000	0.000	0.004	0.232	188711	42.9	0.150	16	13.3	114.1	14.4	0.204	73220	62333	ma101115_rel_withdbg.cz12a_c32r128
1324503	0	2	0.0	4618.9	298.7	0.000	0.000	0.003	0.231	201154	44.0	0.152	16	13.3	114.1	15.0	0.201	77916	64250	ma110409_rel_withdbg.cz12b_c32r128
1290322	0	2	0.0	4619.9	292.4	0.000	0.000	0.004	0.232	198974	43.8	0.154	16	13.3	114.1	14.6	0.172	74817	55940	ma110805_rel_withdbg.cz12b_c32r128
1298701	0	2	0.0	4642.4	293.4	0.000	0.000	0.004	0.231	198647	43.3	0.153	16	13.3	114.1	14.7	0.202	75419	55739	ma120102_rel_withdbg.cz12b_c32r128
1273885	0	2	0.0	4601.6	290.8	0.000	0.000	0.004	0.234	198329	43.9	0.156	17	13.3	114.1	14.5	0.312	71521	64031	ma120201_rel_withdbg.cz12b_c32r128
Average values from iostat.
r/s	rkB/s	rrqm/s	%rrqm	r_await	rareq-s	w/s	wkB/s	wrqm/s	%wrqm	w_await	wareq-s	d/s	dkB/s	drqm/s	%drqm	d_await	dareq-s	f/s	f_await	aqu-sz	%util
0.015	0.618	0.087	0.716	0.002	0.344	1661.0	89268.1	111.4	10.38	4.116	85.47	0.000	0.000	0.000	0.000	0.000	0.000	0.000	0.000	4.215	7.333		ma100624_rel_withdbg.cz12a_c32r128
0.602	56.52	0.711	0.483	0.049	2.555	1463.9	86499.4	111.7	10.05	3.196	80.66	0.000	0.000	0.000	0.000	0.000	0.000	0.000	0.000	3.480	7.361		ma100624_rel_withdbg.cz12a_cb_c32r128
0.056	1.600	0.138	2.292	0.035	1.109	4259.0	292387	323.0	10.23	8.291	87.69	0.000	0.000	0.000	0.000	0.000	0.000	0.000	0.000	26.29	21.28		ma101115_rel_withdbg.cz12a_c32r128
0.120	0.853	0.000	0.000	0.117	0.970	4284.0	305944	348.9	10.77	6.596	88.99	0.000	0.000	0.000	0.000	0.000	0.000	0.000	0.000	22.13	21.65		ma110409_rel_withdbg.cz12b_c32r128
0.071	0.284	0.000	0.000	0.097	0.903	4281.5	298688	343.8	10.60	5.570	87.66	0.000	0.000	0.000	0.000	0.000	0.000	0.000	0.000	19.07	20.57		ma110805_rel_withdbg.cz12b_c32r128
0.071	0.310	0.000	0.000	0.091	1.161	4316.9	300505	340.0	10.34	5.611	87.36	0.000	0.000	0.000	0.000	0.000	0.000	0.000	0.000	19.14	20.95		ma120102_rel_withdbg.cz12b_c32r128
0.142	0.568	0.000	0.000	0.218	2.065	4268.2	297833	347.3	10.65	5.634	87.75	0.000	0.000	0.000	0.000	0.000	0.000	0.000	0.000	19.29	20.46		ma120201_rel_withdbg.cz12b_c32r128
l.x
l.x: create secondary indexes.
Average throughput:
Performance metrics for the DBMS listed above. Some are normalized by throughput, others are not. Legend for results is here.
ips	qps	rps	rmbps	wps	wmbps	rpq	rkbpq	wpi	wkbpi	csps	cpups	cspq	cpupq	dbgb1	dbgb2	rss	maxop	p50	p99	tag
2352942	0	1	0.0	16764.1	1619.2	0.000	0.000	0.007	0.705	203802	27.7	0.087	6	28.1	129.6	23.5	0.008	NA	NA	ma100624_rel_withdbg.cz12a_c32r128
2272728	0	2	0.0	17311.9	1619.5	0.000	0.000	0.008	0.730	211861	27.6	0.093	6	28.1	129.8	23.7	0.007	NA	NA	ma100624_rel_withdbg.cz12a_cb_c32r128
2105264	0	2	0.0	17115.9	1471.3	0.000	0.000	0.008	0.716	52165	23.0	0.025	5	28.1	129.0	29.7	0.001	NA	NA	ma101115_rel_withdbg.cz12a_c32r128
2247192	0	2	0.0	17981.2	1551.9	0.000	0.000	0.008	0.707	53493	24.2	0.024	5	28.1	129.0	30.5	0.001	NA	NA	ma110409_rel_withdbg.cz12b_c32r128
2222223	0	2	0.0	18037.4	1551.4	0.000	0.000	0.008	0.715	52730	24.4	0.024	5	28.1	129.0	30.4	0.078	NA	NA	ma110805_rel_withdbg.cz12b_c32r128
2352942	0	2	0.0	18608.8	1636.3	0.000	0.000	0.008	0.712	52815	24.6	0.022	5	28.1	129.0	23.1	0.001	NA	NA	ma120102_rel_withdbg.cz12b_c32r128
2150539	0	2	0.0	17206.1	1472.9	0.000	0.000	0.008	0.701	53106	23.0	0.025	5	28.1	129.0	29.6	0.001	NA	NA	ma120201_rel_withdbg.cz12b_c32r128
Average values from iostat.
r/s	rkB/s	rrqm/s	%rrqm	r_await	rareq-s	w/s	wkB/s	wrqm/s	%wrqm	w_await	wareq-s	d/s	dkB/s	drqm/s	%drqm	d_await	dareq-s	f/s	f_await	aqu-sz	%util
0.624	36.52	0.000	0.000	0.128	23.85	16764.1	1658060	0.000	0.000	10.87	101.8	0.000	0.000	0.000	0.000	0.000	0.000	0.000	0.000	230.4	91.44		ma100624_rel_withdbg.cz12a_c32r128
2.129	9.694	0.000	0.000	0.472	4.036	17311.9	1658337	0.000	0.000	12.07	97.01	0.000	0.000	0.000	0.000	0.000	0.000	0.000	0.000	255.7	93.55		ma100624_rel_withdbg.cz12a_cb_c32r128
2.053	8.632	0.000	0.000	0.378	4.141	17115.9	1506636	0.000	0.000	12.07	83.13	0.000	0.000	0.000	0.000	0.000	0.000	0.000	0.000	243.6	92.53		ma101115_rel_withdbg.cz12a_c32r128
1.900	15.20	0.000	0.000	0.568	6.063	17981.2	1589139	0.000	0.000	10.06	82.00	0.000	0.000	0.000	0.000	0.000	0.000	0.000	0.000	221.4	90.04		ma110409_rel_withdbg.cz12b_c32r128
1.900	9.200	0.000	0.000	2.516	4.054	18037.4	1588588	0.000	0.000	10.82	82.24	0.000	0.000	0.000	0.000	0.000	0.000	0.000	0.000	231.0	91.13		ma110805_rel_withdbg.cz12b_c32r128
2.400	35.91	0.000	0.000	0.935	9.872	18608.8	1675582	0.000	0.000	9.844	83.69	0.000	0.000	0.000	0.000	0.000	0.000	0.000	0.000	222.5	91.22		ma120102_rel_withdbg.cz12b_c32r128
2.242	23.92	0.000	0.000	0.771	7.832	17206.1	1508210	0.000	0.000	13.07	82.69	0.000	0.000	0.000	0.000	0.000	0.000	0.000	0.000	260.2	90.69		ma120201_rel_withdbg.cz12b_c32r128
l.i1
l.i1: continue load after secondary indexes created with 50 inserts per transaction. Graphs for performance per 1-second interval are here.
Average throughput:
Insert response time histogram: each cell has the percentage of responses that take <= the time in the header and max is the max response time in seconds. For the max column values in the top 25% of the range have a red background and in the bottom 25% of the range have a green background. The red background is not used when the min value is within 80% of the max value.
| dbms | 256us | 1ms | 4ms | 16ms | 64ms | 256ms | 1s | 4s | 16s | gt | max |
|---|---|---|---|---|---|---|---|---|---|---|---|
| ma100624_rel_withdbg.cz12a_c32r128 | nonzero | 0.104 | 82.588 | 17.085 | 0.223 | 0.248 | |||||
| ma100624_rel_withdbg.cz12a_cb_c32r128 | 0.061 | 82.785 | 16.929 | 0.224 | nonzero | 0.267 | |||||
| ma101115_rel_withdbg.cz12a_c32r128 | nonzero | 28.095 | 62.701 | 8.957 | 0.247 | nonzero | 0.305 | ||||
| ma110409_rel_withdbg.cz12b_c32r128 | 0.005 | 49.511 | 46.539 | 3.743 | 0.201 | nonzero | 0.413 | ||||
| ma110805_rel_withdbg.cz12b_c32r128 | 0.012 | 59.424 | 37.022 | 3.354 | 0.187 | nonzero | 0.510 | ||||
| ma120102_rel_withdbg.cz12b_c32r128 | 0.003 | 46.466 | 49.750 | 3.605 | 0.176 | nonzero | 0.425 | ||||
| ma120201_rel_withdbg.cz12b_c32r128 | 0.003 | 40.173 | 56.081 | 3.581 | 0.162 | nonzero | 0.454 |
Delete response time histogram: each cell has the percentage of responses that take <= the time in the header and max is the max response time in seconds. For the max column values in the top 25% of the range have a red background and in the bottom 25% of the range have a green background. The red background is not used when the min value is within 80% of the max value.
| dbms | 256us | 1ms | 4ms | 16ms | 64ms | 256ms | 1s | 4s | 16s | gt | max |
|---|---|---|---|---|---|---|---|---|---|---|---|
| ma100624_rel_withdbg.cz12a_c32r128 | nonzero | 0.107 | 83.978 | 15.712 | 0.203 | 0.248 | |||||
| ma100624_rel_withdbg.cz12a_cb_c32r128 | nonzero | 0.068 | 84.220 | 15.511 | 0.200 | nonzero | 0.258 | ||||
| ma101115_rel_withdbg.cz12a_c32r128 | 0.067 | 29.115 | 61.684 | 8.893 | 0.241 | nonzero | 0.297 | ||||
| ma110409_rel_withdbg.cz12b_c32r128 | 0.070 | 40.233 | 55.579 | 3.908 | 0.209 | 0.001 | 0.413 | ||||
| ma110805_rel_withdbg.cz12b_c32r128 | 0.049 | 46.563 | 49.646 | 3.542 | 0.199 | 0.001 | 0.508 | ||||
| ma120102_rel_withdbg.cz12b_c32r128 | 0.018 | 37.832 | 58.184 | 3.783 | 0.183 | nonzero | 0.424 | ||||
| ma120201_rel_withdbg.cz12b_c32r128 | 0.013 | 28.877 | 67.071 | 3.867 | 0.171 | nonzero | 0.453 |
Performance metrics for the DBMS listed above. Some are normalized by throughput, others are not. Legend for results is here.
ips	qps	rps	rmbps	wps	wmbps	rpq	rkbpq	wpi	wkbpi	csps	cpups	cspq	cpupq	dbgb1	dbgb2	rss	maxop	p50	p99	tag
60182	0	1	0.0	8213.1	254.6	0.000	0.000	0.136	4.332	854806	68.3	14.204	545	41.7	143.8	43.8	0.248	2997	2797	ma100624_rel_withdbg.cz12a_c32r128
60173	0	1	0.1	8174.2	254.1	0.000	0.001	0.136	4.325	862667	67.9	14.336	542	41.7	143.9	43.8	0.267	2997	2748	ma100624_rel_withdbg.cz12a_cb_c32r128
141618	0	1	0.0	10277.4	358.4	0.000	0.000	0.073	2.591	236173	56.4	1.668	191	43.4	145.5	45.7	0.305	7092	6093	ma101115_rel_withdbg.cz12a_c32r128
167961	0	1	0.0	10644.1	381.2	0.000	0.000	0.063	2.324	177865	59.8	1.059	171	43.7	145.8	46.0	0.413	8391	7094	ma110409_rel_withdbg.cz12b_c32r128
177502	0	0	0.0	10706.3	388.5	0.000	0.000	0.060	2.241	182078	60.4	1.026	163	43.7	145.9	46.1	0.510	8843	7542	ma110805_rel_withdbg.cz12b_c32r128
169960	0	1	0.0	10657.1	382.7	0.000	0.000	0.063	2.306	181614	61.0	1.069	172	43.7	145.9	46.0	0.425	8491	7242	ma120102_rel_withdbg.cz12b_c32r128
163499	0	1	0.0	10602.9	378.0	0.000	0.000	0.065	2.368	176747	61.8	1.081	181	43.6	145.7	45.9	0.454	8141	6945	ma120201_rel_withdbg.cz12b_c32r128
Average values from iostat.
r/s	rkB/s	rrqm/s	%rrqm	r_await	rareq-s	w/s	wkB/s	wrqm/s	%wrqm	w_await	wareq-s	d/s	dkB/s	drqm/s	%drqm	d_await	dareq-s	f/s	f_await	aqu-sz	%util
0.178	2.498	0.023	0.080	0.025	1.848	8156.3	260793	77.34	1.015	0.199	32.11	0.000	0.000	0.000	0.000	0.000	0.000	0.000	0.000	1.608	11.51		ma100624_rel_withdbg.cz12a_c32r128
0.326	15.51	0.016	0.097	0.035	2.341	8141.7	260323	54.35	0.744	0.212	32.18	0.000	0.000	0.000	0.000	0.000	0.000	0.000	0.000	1.682	11.45		ma100624_rel_withdbg.cz12a_cb_c32r128
0.114	1.395	0.056	0.527	0.032	0.980	10181.1	367036	118.2	1.143	0.486	35.96	0.000	0.000	0.000	0.000	0.000	0.000	0.000	0.000	5.014	16.09		ma101115_rel_withdbg.cz12a_c32r128
0.134	1.753	0.019	0.163	0.049	2.011	10387.8	390386	278.9	2.550	0.600	37.48	0.000	0.000	0.000	0.000	0.000	0.000	0.000	0.000	6.308	18.13		ma110409_rel_withdbg.cz12b_c32r128
0.097	0.996	0.003	0.030	0.036	1.706	10442.3	397917	287.2	2.616	0.617	37.99	0.000	0.000	0.000	0.000	0.000	0.000	0.000	0.000	6.545	18.34		ma110805_rel_withdbg.cz12b_c32r128
0.160	1.561	0.003	0.093	0.066	2.746	10398.7	391941	283.2	2.588	0.591	37.58	0.000	0.000	0.000	0.000	0.000	0.000	0.000	0.000	6.234	18.11		ma120102_rel_withdbg.cz12b_c32r128
0.341	13.55	0.111	0.054	0.069	3.493	10352.5	387195	272.9	2.512	0.584	37.28	0.000	0.000	0.000	0.000	0.000	0.000	0.000	0.000	6.152	18.09		ma120201_rel_withdbg.cz12b_c32r128
l.i2
l.i2: continue load after secondary indexes created with 5 inserts per transaction. Graphs for performance per 1-second interval are here.
Average throughput:
Insert response time histogram: each cell has the percentage of responses that take <= the time in the header and max is the max response time in seconds. For the max column values in the top 25% of the range have a red background and in the bottom 25% of the range have a green background. The red background is not used when the min value is within 80% of the max value.
| dbms | 256us | 1ms | 4ms | 16ms | 64ms | 256ms | 1s | 4s | 16s | gt | max |
|---|---|---|---|---|---|---|---|---|---|---|---|
| ma100624_rel_withdbg.cz12a_c32r128 | 0.009 | 2.208 | 92.656 | 5.017 | 0.100 | 0.010 | 0.169 | ||||
| ma100624_rel_withdbg.cz12a_cb_c32r128 | 0.006 | 2.075 | 92.697 | 5.103 | 0.110 | 0.010 | 0.159 | ||||
| ma101115_rel_withdbg.cz12a_c32r128 | 0.305 | 92.982 | 5.970 | 0.642 | 0.091 | 0.010 | 0.184 | ||||
| ma110409_rel_withdbg.cz12b_c32r128 | 0.304 | 91.470 | 8.137 | 0.054 | 0.025 | 0.010 | 0.189 | ||||
| ma110805_rel_withdbg.cz12b_c32r128 | 0.341 | 91.641 | 7.940 | 0.048 | 0.020 | 0.010 | 0.213 | ||||
| ma120102_rel_withdbg.cz12b_c32r128 | 0.238 | 91.196 | 8.473 | 0.062 | 0.021 | 0.010 | 0.168 | ||||
| ma120201_rel_withdbg.cz12b_c32r128 | 0.248 | 90.059 | 9.601 | 0.060 | 0.022 | 0.010 | 0.183 |
Delete response time histogram: each cell has the percentage of responses that take <= the time in the header and max is the max response time in seconds. For the max column values in the top 25% of the range have a red background and in the bottom 25% of the range have a green background. The red background is not used when the min value is within 80% of the max value.
| dbms | 256us | 1ms | 4ms | 16ms | 64ms | 256ms | 1s | 4s | 16s | gt | max |
|---|---|---|---|---|---|---|---|---|---|---|---|
| ma100624_rel_withdbg.cz12a_c32r128 | 0.011 | 2.522 | 92.357 | 5.000 | 0.099 | 0.010 | 0.169 | ||||
| ma100624_rel_withdbg.cz12a_cb_c32r128 | 0.006 | 2.462 | 92.329 | 5.084 | 0.109 | 0.010 | 0.159 | ||||
| ma101115_rel_withdbg.cz12a_c32r128 | 0.412 | 93.378 | 5.473 | 0.637 | 0.090 | 0.010 | 0.184 | ||||
| ma110409_rel_withdbg.cz12b_c32r128 | 0.292 | 91.534 | 8.085 | 0.054 | 0.025 | 0.010 | 0.189 | ||||
| ma110805_rel_withdbg.cz12b_c32r128 | 0.312 | 91.648 | 7.962 | 0.049 | 0.020 | 0.010 | 0.213 | ||||
| ma120102_rel_withdbg.cz12b_c32r128 | 0.209 | 91.220 | 8.478 | 0.061 | 0.021 | 0.010 | 0.168 | ||||
| ma120201_rel_withdbg.cz12b_c32r128 | 0.203 | 89.996 | 9.709 | 0.060 | 0.022 | 0.010 | 0.183 |
Performance metrics for the DBMS listed above. Some are normalized by throughput, others are not. Legend for results is here.
ips	qps	rps	rmbps	wps	wmbps	rpq	rkbpq	wpi	wkbpi	csps	cpups	cspq	cpupq	dbgb1	dbgb2	rss	maxop	p50	p99	tag
53981	0	1	0.0	6902.2	231.1	0.000	0.000	0.128	4.383	1136000	58.1	21.044	517	41.7	143.8	43.8	0.169	2738	734	ma100624_rel_withdbg.cz12a_c32r128
53749	0	0	0.0	6869.4	230.7	0.000	0.000	0.128	4.395	1139884	58.0	21.208	518	41.7	143.9	43.8	0.159	2727	729	ma100624_rel_withdbg.cz12a_cb_c32r128
131234	0	0	0.0	10582.3	394.6	0.000	0.000	0.081	3.079	928439	58.9	7.075	215	43.4	145.5	45.7	0.184	6733	1309	ma101115_rel_withdbg.cz12a_c32r128
136705	0	0	0.0	10662.2	401.3	0.000	0.000	0.078	3.006	890386	60.6	6.513	213	43.7	145.8	46.1	0.189	6933	2502	ma110409_rel_withdbg.cz12b_c32r128
137457	0	0	0.0	10670.7	402.2	0.000	0.000	0.078	2.996	901523	60.3	6.559	211	43.7	145.9	46.1	0.213	6933	5579	ma110805_rel_withdbg.cz12b_c32r128
136240	0	1	0.0	10668.8	401.3	0.000	0.000	0.078	3.016	903676	60.4	6.633	213	43.7	145.9	46.0	0.168	6892	2432	ma120102_rel_withdbg.cz12b_c32r128
133333	0	1	0.0	10623.9	397.8	0.000	0.000	0.080	3.055	882060	60.1	6.615	216	43.6	145.7	45.9	0.183	6753	4051	ma120201_rel_withdbg.cz12b_c32r128
Average values from iostat.
r/s	rkB/s	rrqm/s	%rrqm	r_await	rareq-s	w/s	wkB/s	wrqm/s	%wrqm	w_await	wareq-s	d/s	dkB/s	drqm/s	%drqm	d_await	dareq-s	f/s	f_await	aqu-sz	%util
0.272	3.171	0.047	0.207	0.038	3.675	6852.1	236697	70.87	1.043	0.229	34.72	0.000	0.000	0.000	0.000	0.000	0.000	0.000	0.000	1.575	10.73		ma100624_rel_withdbg.cz12a_c32r128
0.141	1.581	0.000	0.000	0.025	2.235	6839.8	236314	51.80	0.769	0.234	34.70	0.000	0.000	0.000	0.000	0.000	0.000	0.000	0.000	1.612	10.69		ma100624_rel_withdbg.cz12a_cb_c32r128
0.159	1.036	0.000	0.000	0.010	0.268	10476.1	404168	127.6	1.200	0.445	38.55	0.000	0.000	0.000	0.000	0.000	0.000	0.000	0.000	4.700	16.83		ma101115_rel_withdbg.cz12a_c32r128
0.042	0.479	0.000	0.000	0.034	0.685	10544.8	411052	138.9	1.295	0.502	38.95	0.000	0.000	0.000	0.000	0.000	0.000	0.000	0.000	5.331	18.22		ma110409_rel_withdbg.cz12b_c32r128
0.173	1.193	0.000	0.000	0.026	1.234	10550.2	411932	143.3	1.334	0.455	39.01	0.000	0.000	0.000	0.000	0.000	0.000	0.000	0.000	4.832	17.91		ma110805_rel_withdbg.cz12b_c32r128
0.147	2.059	0.009	0.296	0.059	3.884	10543.7	411042	147.1	1.370	0.464	38.97	0.000	0.000	0.000	0.000	0.000	0.000	0.000	0.000	4.912	17.96		ma120102_rel_withdbg.cz12b_c32r128
0.287	2.443	0.000	0.000	0.075	3.060	10508.0	407394	137.4	1.287	0.488	38.76	0.000	0.000	0.000	0.000	0.000	0.000	0.000	0.000	5.164	17.85		ma120201_rel_withdbg.cz12b_c32r128
qr100.L1
qr100.L1: range queries with 100 insert/s per client. Graphs for performance per 1-second interval are here.
Average throughput:
Query response time histogram: each cell has the percentage of responses that take <= the time in the header and max is the max response time in seconds. For max values in the top 25% of the range have a red background and in the bottom 25% of the range have a green background. The red background is not used when the min value is within 80% of the max value.
| dbms | 256us | 1ms | 4ms | 16ms | 64ms | 256ms | 1s | 4s | 16s | gt | max |
|---|---|---|---|---|---|---|---|---|---|---|---|
| ma100624_rel_withdbg.cz12a_c32r128 | 99.976 | 0.024 | nonzero | nonzero | 0.013 | ||||||
| ma100624_rel_withdbg.cz12a_cb_c32r128 | 99.974 | 0.025 | nonzero | nonzero | 0.013 | ||||||
| ma101115_rel_withdbg.cz12a_c32r128 | 99.993 | 0.005 | 0.002 | nonzero | 0.010 | ||||||
| ma110409_rel_withdbg.cz12b_c32r128 | 99.995 | 0.003 | 0.002 | nonzero | 0.011 | ||||||
| ma110805_rel_withdbg.cz12b_c32r128 | 99.995 | 0.003 | 0.002 | nonzero | 0.012 | ||||||
| ma120102_rel_withdbg.cz12b_c32r128 | 99.995 | 0.003 | 0.002 | nonzero | 0.012 | ||||||
| ma120201_rel_withdbg.cz12b_c32r128 | 99.994 | 0.004 | 0.002 | nonzero | 0.010 |
Insert response time histogram: each cell has the percentage of responses that take <= the time in the header and max is the max response time in seconds. For max values in the top 25% of the range have a red background and in the bottom 25% of the range have a green background. The red background is not used when the min value is within 80% of the max value.
| dbms | 256us | 1ms | 4ms | 16ms | 64ms | 256ms | 1s | 4s | 16s | gt | max |
|---|---|---|---|---|---|---|---|---|---|---|---|
| ma100624_rel_withdbg.cz12a_c32r128 | 0.030 | 19.670 | 79.608 | 0.692 | 0.026 | ||||||
| ma100624_rel_withdbg.cz12a_cb_c32r128 | 8.097 | 90.817 | 1.085 | 0.029 | |||||||
| ma101115_rel_withdbg.cz12a_c32r128 | 0.054 | 99.886 | 0.060 | 0.009 | |||||||
| ma110409_rel_withdbg.cz12b_c32r128 | 0.491 | 99.423 | 0.086 | 0.010 | |||||||
| ma110805_rel_withdbg.cz12b_c32r128 | 2.022 | 97.948 | 0.031 | 0.007 | |||||||
| ma120102_rel_withdbg.cz12b_c32r128 | 3.900 | 96.070 | 0.030 | 0.008 | |||||||
| ma120201_rel_withdbg.cz12b_c32r128 | 2.101 | 97.854 | 0.045 | 0.008 |
Delete response time histogram: each cell has the percentage of responses that take <= the time in the header and max is the max response time in seconds. For max values in the top 25% of the range have a red background and in the bottom 25% of the range have a green background. The red background is not used when the min value is within 80% of the max value.
| dbms | 256us | 1ms | 4ms | 16ms | 64ms | 256ms | 1s | 4s | 16s | gt | max |
|---|---|---|---|---|---|---|---|---|---|---|---|
| ma100624_rel_withdbg.cz12a_c32r128 | 1.866 | 20.646 | 76.993 | 0.495 | 0.024 | ||||||
| ma100624_rel_withdbg.cz12a_cb_c32r128 | 0.008 | 8.471 | 90.648 | 0.874 | 0.028 | ||||||
| ma101115_rel_withdbg.cz12a_c32r128 | 13.148 | 86.819 | 0.033 | 0.008 | |||||||
| ma110409_rel_withdbg.cz12b_c32r128 | 12.842 | 87.120 | 0.037 | 0.011 | |||||||
| ma110805_rel_withdbg.cz12b_c32r128 | 24.532 | 75.440 | 0.028 | 0.008 | |||||||
| ma120102_rel_withdbg.cz12b_c32r128 | 30.441 | 69.547 | 0.013 | 0.007 | |||||||
| ma120201_rel_withdbg.cz12b_c32r128 | 23.930 | 76.049 | 0.021 | 0.007 |
Performance metrics for the DBMS listed above. Some are normalized by throughput, others are not. Legend for results is here.
ips	qps	rps	rmbps	wps	wmbps	rpq	rkbpq	wpi	wkbpi	csps	cpups	cspq	cpupq	dbgb1	dbgb2	rss	maxop	p50	p99	tag
1988	225734	0	0.0	24.4	2.2	0.000	0.000	0.012	1.119	1306355	43.7	5.787	93	41.7	143.8	43.8	0.013	11332	10629	ma100624_rel_withdbg.cz12a_c32r128
1987	228260	0	0.0	22.7	2.1	0.000	0.000	0.011	1.108	1322498	43.7	5.794	92	41.7	143.9	43.8	0.013	11507	10820	ma100624_rel_withdbg.cz12a_cb_c32r128
1987	232593	0	0.0	26.4	2.3	0.000	0.000	0.013	1.178	1331291	43.6	5.724	90	43.4	145.5	45.7	0.010	11747	11111	ma101115_rel_withdbg.cz12a_c32r128
1988	232916	0	0.0	22.4	2.1	0.000	0.000	0.011	1.093	1333590	43.7	5.726	90	43.7	145.8	45.8	0.011	11703	11092	ma110409_rel_withdbg.cz12b_c32r128
1987	236009	0	0.0	22.6	2.1	0.000	0.000	0.011	1.091	1351739	43.7	5.727	89	43.7	145.9	45.8	0.012	11892	11284	ma110805_rel_withdbg.cz12b_c32r128
1988	226535	0	0.0	24.2	2.1	0.000	0.000	0.012	1.097	1297174	43.7	5.726	93	43.7	145.9	45.7	0.012	11364	10836	ma120102_rel_withdbg.cz12b_c32r128
1987	221663	0	0.0	22.9	2.1	0.000	0.000	0.012	1.093	1269563	43.4	5.727	94	43.6	145.7	45.6	0.010	11156	10628	ma120201_rel_withdbg.cz12b_c32r128
Average values from iostat.
r/s	rkB/s	rrqm/s	%rrqm	r_await	rareq-s	w/s	wkB/s	wrqm/s	%wrqm	w_await	wareq-s	d/s	dkB/s	drqm/s	%drqm	d_await	dareq-s	f/s	f_await	aqu-sz	%util
0.067	0.785	0.000	0.000	0.011	1.582	34.35	2271.3	4.630	11.71	0.118	65.81	0.000	0.000	0.000	0.000	0.000	0.000	0.000	0.000	0.002	1.459		ma100624_rel_withdbg.cz12a_c32r128
0.078	0.889	0.014	0.084	0.013	1.552	32.82	2252.6	5.307	13.71	0.117	68.09	0.000	0.000	0.000	0.000	0.000	0.000	0.000	0.000	0.002	1.434		ma100624_rel_withdbg.cz12a_cb_c32r128
0.015	0.151	0.002	0.107	0.001	0.118	36.04	2386.6	4.420	11.60	0.117	69.60	0.000	0.000	0.000	0.000	0.000	0.000	0.000	0.000	0.002	1.432		ma101115_rel_withdbg.cz12a_c32r128
0.014	0.155	0.000	0.000	0.004	0.330	32.20	2219.3	4.431	11.88	0.117	68.37	0.000	0.000	0.000	0.000	0.000	0.000	0.000	0.000	0.002	1.498		ma110409_rel_withdbg.cz12b_c32r128
0.023	0.288	0.000	0.000	0.005	0.737	32.24	2216.1	5.008	13.26	0.119	68.32	0.000	0.000	0.000	0.000	0.000	0.000	0.000	0.000	0.002	1.499		ma110805_rel_withdbg.cz12b_c32r128
0.026	0.339	0.000	0.000	0.008	1.063	34.11	2236.7	6.709	16.49	0.120	65.40	0.000	0.000	0.000	0.000	0.000	0.000	0.000	0.000	0.002	1.516		ma120102_rel_withdbg.cz12b_c32r128
0.044	0.767	0.001	0.115	0.008	1.886	32.60	2218.9	4.683	12.41	0.115	67.65	0.000	0.000	0.000	0.000	0.000	0.000	0.000	0.000	0.002	1.511		ma120201_rel_withdbg.cz12b_c32r128
qp100.L2
qp100.L2: point queries with 100 insert/s per client. Graphs for performance per 1-second interval are here.
Average throughput:
Query response time histogram: each cell has the percentage of responses that take <= the time in the header and max is the max response time in seconds. For max values in the top 25% of the range have a red background and in the bottom 25% of the range have a green background. The red background is not used when the min value is within 80% of the max value.
| dbms | 256us | 1ms | 4ms | 16ms | 64ms | 256ms | 1s | 4s | 16s | gt | max |
|---|---|---|---|---|---|---|---|---|---|---|---|
| ma100624_rel_withdbg.cz12a_c32r128 | 99.977 | 0.022 | nonzero | nonzero | 0.010 | ||||||
| ma100624_rel_withdbg.cz12a_cb_c32r128 | 99.981 | 0.019 | nonzero | nonzero | 0.011 | ||||||
| ma101115_rel_withdbg.cz12a_c32r128 | 99.991 | 0.007 | 0.002 | nonzero | 0.010 | ||||||
| ma110409_rel_withdbg.cz12b_c32r128 | 99.993 | 0.005 | 0.002 | nonzero | 0.011 | ||||||
| ma110805_rel_withdbg.cz12b_c32r128 | 99.993 | 0.005 | 0.002 | nonzero | 0.012 | ||||||
| ma120102_rel_withdbg.cz12b_c32r128 | 99.993 | 0.005 | 0.002 | nonzero | 0.012 | ||||||
| ma120201_rel_withdbg.cz12b_c32r128 | 99.993 | 0.005 | 0.002 | nonzero | 0.010 |
Insert response time histogram: each cell has the percentage of responses that take <= the time in the header and max is the max response time in seconds. For max values in the top 25% of the range have a red background and in the bottom 25% of the range have a green background. The red background is not used when the min value is within 80% of the max value.
| dbms | 256us | 1ms | 4ms | 16ms | 64ms | 256ms | 1s | 4s | 16s | gt | max |
|---|---|---|---|---|---|---|---|---|---|---|---|
| ma100624_rel_withdbg.cz12a_c32r128 | 44.800 | 55.092 | 0.108 | 0.022 | |||||||
| ma100624_rel_withdbg.cz12a_cb_c32r128 | 0.001 | 66.531 | 33.467 | 0.001 | 0.019 | ||||||
| ma101115_rel_withdbg.cz12a_c32r128 | 0.001 | 99.728 | 0.267 | 0.004 | 0.034 | ||||||
| ma110409_rel_withdbg.cz12b_c32r128 | 0.140 | 99.585 | 0.274 | 0.001 | 0.017 | ||||||
| ma110805_rel_withdbg.cz12b_c32r128 | 1.203 | 98.560 | 0.224 | 0.011 | 0.001 | 0.069 | |||||
| ma120102_rel_withdbg.cz12b_c32r128 | 3.843 | 95.969 | 0.169 | 0.017 | 0.002 | 0.098 | |||||
| ma120201_rel_withdbg.cz12b_c32r128 | 2.844 | 96.903 | 0.253 | 0.012 |
Delete response time histogram: each cell has the percentage of responses that take <= the time in the header and max is the max response time in seconds. For max values in the top 25% of the range have a red background and in the bottom 25% of the range have a green background. The red background is not used when the min value is within 80% of the max value.
| dbms | 256us | 1ms | 4ms | 16ms | 64ms | 256ms | 1s | 4s | 16s | gt | max |
|---|---|---|---|---|---|---|---|---|---|---|---|
| ma100624_rel_withdbg.cz12a_c32r128 | 0.160 | 54.083 | 45.698 | 0.058 | 0.021 | ||||||
| ma100624_rel_withdbg.cz12a_cb_c32r128 | 1.474 | 74.044 | 24.482 | 0.001 | 0.016 | ||||||
| ma101115_rel_withdbg.cz12a_c32r128 | 15.751 | 84.049 | 0.199 | 0.002 | 0.031 | ||||||
| ma110409_rel_withdbg.cz12b_c32r128 | 9.446 | 90.334 | 0.220 | 0.009 | |||||||
| ma110805_rel_withdbg.cz12b_c32r128 | 19.312 | 80.519 | 0.165 | 0.003 | 0.001 | 0.083 | |||||
| ma120102_rel_withdbg.cz12b_c32r128 | 34.082 | 65.762 | 0.145 | 0.010 | 0.001 | 0.076 | |||||
| ma120201_rel_withdbg.cz12b_c32r128 | 25.777 | 74.015 | 0.208 | 0.009 |
Performance metrics for the DBMS listed above. Some are normalized by throughput, others are not. Legend for results is here.
ips	qps	rps	rmbps	wps	wmbps	rpq	rkbpq	wpi	wkbpi	csps	cpups	cspq	cpupq	dbgb1	dbgb2	rss	maxop	p50	p99	tag
1987	199290	0	0.0	303.3	9.5	0.000	0.000	0.153	4.888	1168698	43.6	5.864	105	41.7	143.8	43.8	0.010	10037	9545	ma100624_rel_withdbg.cz12a_c32r128
1987	200344	0	0.0	302.0	9.6	0.000	0.000	0.152	4.928	1173042	43.6	5.855	104	41.7	143.9	43.8	0.011	10088	9621	ma100624_rel_withdbg.cz12a_cb_c32r128
1987	196794	0	0.0	304.1	9.6	0.000	0.000	0.153	4.946	1140952	43.0	5.798	105	43.4	145.5	45.7	0.010	9909	9622	ma101115_rel_withdbg.cz12a_c32r128
1988	197088	0	0.0	302.8	9.6	0.000	0.000	0.152	4.950	1141519	43.2	5.792	105	43.7	145.8	45.8	0.011	9925	9496	ma110409_rel_withdbg.cz12b_c32r128
1987	202155	0	0.0	302.4	9.6	0.000	0.000	0.152	4.938	1170104	43.2	5.788	103	43.7	145.9	45.9	0.012	10216	9797	ma110805_rel_withdbg.cz12b_c32r128
1988	199363	1	0.1	305.9	9.8	0.000	0.001	0.154	5.063	1154793	43.1	5.792	104	43.7	145.9	45.7	0.012	10053	9670	ma120102_rel_withdbg.cz12b_c32r128
1987	195092	0	0.0	302.7	9.6	0.000	0.000	0.152	4.961	1130345	43.1	5.794	106	43.6	145.7	45.7	0.010	9797	9398	ma120201_rel_withdbg.cz12b_c32r128
Average values from iostat.
r/s	rkB/s	rrqm/s	%rrqm	r_await	rareq-s	w/s	wkB/s	wrqm/s	%wrqm	w_await	wareq-s	d/s	dkB/s	drqm/s	%drqm	d_await	dareq-s	f/s	f_await	aqu-sz	%util
0.018	0.133	0.000	0.000	0.006	0.469	316.9	9780.1	5.802	10.54	0.104	56.33	0.000	0.000	0.000	0.000	0.000	0.000	0.000	0.000	0.013	1.816		ma100624_rel_withdbg.cz12a_c32r128
0.033	0.652	0.099	0.485	0.006	0.677	316.8	9863.3	5.101	11.63	0.105	60.64	0.000	0.000	0.000	0.000	0.000	0.000	0.000	0.000	0.013	1.747		ma100624_rel_withdbg.cz12a_cb_c32r128
0.001	0.023	0.005	0.125	0.000	0.058	318.8	9896.0	4.824	10.50	0.104	59.93	0.000	0.000	0.000	0.000	0.000	0.000	0.000	0.000	0.014	1.806		ma101115_rel_withdbg.cz12a_c32r128
0.002	0.021	0.000	0.000	0.001	0.094	316.3	9904.5	5.420	10.66	0.106	62.58	0.000	0.000	0.000	0.000	0.000	0.000	0.000	0.000	0.011	1.841		ma110409_rel_withdbg.cz12b_c32r128
0.004	0.041	0.000	0.000	0.001	0.124	317.1	9877.3	5.017	11.44	0.113	62.05	0.000	0.000	0.000	0.000	0.000	0.000	0.000	0.000	0.016	1.907		ma110805_rel_withdbg.cz12b_c32r128
0.173	17.39	0.085	0.327	0.004	0.711	320.4	10137.7	6.795	14.38	0.132	60.81	0.000	0.000	0.000	0.000	0.000	0.000	0.000	0.000	0.022	1.924		ma120102_rel_withdbg.cz12b_c32r128
0.006	0.076	0.000	0.000	0.001	0.248	317.1	9925.0	4.888	11.36	0.109	62.66	0.000	0.000	0.000	0.000	0.000	0.000	0.000	0.000	0.013	1.837		ma120201_rel_withdbg.cz12b_c32r128
qr500.L3
qr500.L3: range queries with 500 insert/s per client. Graphs for performance per 1-second interval are here.
Average throughput:
Query response time histogram: each cell has the percentage of responses that take <= the time in the header and max is the max response time in seconds. For max values in the top 25% of the range have a red background and in the bottom 25% of the range have a green background. The red background is not used when the min value is within 80% of the max value.
| dbms | 256us | 1ms | 4ms | 16ms | 64ms | 256ms | 1s | 4s | 16s | gt | max |
|---|---|---|---|---|---|---|---|---|---|---|---|
| ma100624_rel_withdbg.cz12a_c32r128 | 99.910 | 0.087 | 0.003 | nonzero | nonzero | 0.017 | |||||
| ma100624_rel_withdbg.cz12a_cb_c32r128 | 99.900 | 0.097 | 0.003 | nonzero | nonzero | 0.035 | |||||
| ma101115_rel_withdbg.cz12a_c32r128 | 99.978 | 0.014 | 0.008 | nonzero | nonzero | 0.026 | |||||
| ma110409_rel_withdbg.cz12b_c32r128 | 99.983 | 0.009 | 0.008 | nonzero | 0.015 | ||||||
| ma110805_rel_withdbg.cz12b_c32r128 | 99.983 | 0.009 | 0.008 | nonzero | nonzero | 0.063 | |||||
| ma120102_rel_withdbg.cz12b_c32r128 | 99.982 | 0.010 | 0.007 | nonzero | nonzero | nonzero | 0.075 | ||||
| ma120201_rel_withdbg.cz12b_c32r128 | 99.981 | 0.010 | 0.008 | nonzero | nonzero | 0.018 |
Insert response time histogram: each cell has the percentage of responses that take <= the time in the header and max is the max response time in seconds. For max values in the top 25% of the range have a red background and in the bottom 25% of the range have a green background. The red background is not used when the min value is within 80% of the max value.
| dbms | 256us | 1ms | 4ms | 16ms | 64ms | 256ms | 1s | 4s | 16s | gt | max |
|---|---|---|---|---|---|---|---|---|---|---|---|
| ma100624_rel_withdbg.cz12a_c32r128 | 0.004 | 10.842 | 87.680 | 1.474 | 0.047 | ||||||
| ma100624_rel_withdbg.cz12a_cb_c32r128 | 0.006 | 9.293 | 86.901 | 3.800 | 0.046 | ||||||
| ma101115_rel_withdbg.cz12a_c32r128 | 0.264 | 97.090 | 2.633 | 0.013 | 0.038 | ||||||
| ma110409_rel_withdbg.cz12b_c32r128 | 0.608 | 97.224 | 2.166 | 0.002 | 0.023 | ||||||
| ma110805_rel_withdbg.cz12b_c32r128 | 2.467 | 95.510 | 1.952 | 0.069 | 0.002 | 0.085 | |||||
| ma120102_rel_withdbg.cz12b_c32r128 | 5.474 | 93.113 | 1.339 | 0.069 | 0.005 | 0.083 | |||||
| ma120201_rel_withdbg.cz12b_c32r128 | 2.117 | 96.298 | 1.582 | 0.002 | 0.027 |
Delete response time histogram: each cell has the percentage of responses that take <= the time in the header and max is the max response time in seconds. For max values in the top 25% of the range have a red background and in the bottom 25% of the range have a green background. The red background is not used when the min value is within 80% of the max value.
| dbms | 256us | 1ms | 4ms | 16ms | 64ms | 256ms | 1s | 4s | 16s | gt | max |
|---|---|---|---|---|---|---|---|---|---|---|---|
| ma100624_rel_withdbg.cz12a_c32r128 | 0.067 | 11.975 | 87.035 | 0.924 | 0.042 | ||||||
| ma100624_rel_withdbg.cz12a_cb_c32r128 | 0.075 | 9.979 | 87.329 | 2.618 | 0.044 | ||||||
| ma101115_rel_withdbg.cz12a_c32r128 | 16.229 | 81.962 | 1.801 | 0.008 | 0.037 | ||||||
| ma110409_rel_withdbg.cz12b_c32r128 | 12.870 | 85.432 | 1.697 | 0.001 | 0.023 | ||||||
| ma110805_rel_withdbg.cz12b_c32r128 | 25.390 | 73.074 | 1.494 | 0.041 | 0.001 | 0.081 | |||||
| ma120102_rel_withdbg.cz12b_c32r128 | 35.184 | 63.761 | 1.011 | 0.042 | 0.002 | 0.077 | |||||
| ma120201_rel_withdbg.cz12b_c32r128 | 22.054 | 76.769 | 1.175 | 0.002 | 0.027 |
Performance metrics for the DBMS listed above. Some are normalized by throughput, others are not. Legend for results is here.
ips	qps	rps	rmbps	wps	wmbps	rpq	rkbpq	wpi	wkbpi	csps	cpups	cspq	cpupq	dbgb1	dbgb2	rss	maxop	p50	p99	tag
9936	216133	1	0.0	1011.4	34.3	0.000	0.000	0.102	3.531	1311428	48.2	6.068	107	41.7	143.8	43.7	0.017	10932	10005	ma100624_rel_withdbg.cz12a_c32r128
9936	218408	0	0.0	1004.3	34.2	0.000	0.000	0.101	3.526	1325120	48.5	6.067	107	41.7	143.9	43.7	0.035	11044	10136	ma100624_rel_withdbg.cz12a_cb_c32r128
9934	228673	1	0.1	1014.7	34.7	0.000	0.000	0.102	3.577	1313897	44.7	5.746	94	43.4	145.5	45.6	0.026	11538	10805	ma101115_rel_withdbg.cz12a_c32r128
9939	229794	0	0.0	1014.8	34.5	0.000	0.000	0.102	3.558	1318091	44.7	5.736	93	43.7	145.8	45.8	0.015	11555	10852	ma110409_rel_withdbg.cz12b_c32r128
9936	232311	0	0.0	1013.4	34.6	0.000	0.000	0.102	3.565	1333439	44.7	5.740	92	43.7	145.9	45.9	0.063	11730	10980	ma110805_rel_withdbg.cz12b_c32r128
9936	223269	0	0.0	1013.9	34.6	0.000	0.000	0.102	3.563	1281978	44.7	5.742	96	43.7	145.9	45.7	0.075	11252	10628	ma120102_rel_withdbg.cz12b_c32r128
9939	218905	0	0.0	1013.3	34.5	0.000	0.000	0.102	3.559	1256225	44.5	5.739	98	43.6	145.7	45.7	0.018	11044	10356	ma120201_rel_withdbg.cz12b_c32r128
Average values from iostat.
r/s	rkB/s	rrqm/s	%rrqm	r_await	rareq-s	w/s	wkB/s	wrqm/s	%wrqm	w_await	wareq-s	d/s	dkB/s	drqm/s	%drqm	d_await	dareq-s	f/s	f_await	aqu-sz	%util
0.054	1.217	0.180	0.359	0.007	0.684	1032.6	35218.1	14.31	6.733	0.252	73.96	0.000	0.000	0.000	0.000	0.000	0.000	0.000	0.000	0.087	2.960		ma100624_rel_withdbg.cz12a_c32r128
0.025	0.308	0.021	0.111	0.006	0.548	1028.3	35170.7	11.48	6.934	0.239	77.09	0.000	0.000	0.000	0.000	0.000	0.000	0.000	0.000	0.080	2.920		ma100624_rel_withdbg.cz12a_cb_c32r128
0.074	4.020	0.066	0.285	0.004	0.473	1039.4	35660.8	11.62	6.553	0.254	75.41	0.000	0.000	0.000	0.000	0.000	0.000	0.000	0.000	0.092	2.964		ma101115_rel_withdbg.cz12a_c32r128
0.003	0.035	0.001	0.083	0.001	0.105	1038.5	35499.6	13.88	6.609	0.257	76.38	0.000	0.000	0.000	0.000	0.000	0.000	0.000	0.000	0.082	2.953		ma110409_rel_withdbg.cz12b_c32r128
0.010	0.177	0.028	0.139	0.002	0.186	1040.1	35557.5	11.36	6.514	0.272	75.90	0.000	0.000	0.000	0.000	0.000	0.000	0.000	0.000	0.102	3.238		ma110805_rel_withdbg.cz12b_c32r128
0.005	0.076	0.011	0.244	0.001	0.176	1040.5	35539.9	13.01	7.507	0.270	76.19	0.000	0.000	0.000	0.000	0.000	0.000	0.000	0.000	0.100	3.166		ma120102_rel_withdbg.cz12b_c32r128
0.012	0.143	0.000	0.000	0.004	0.445	1039.2	35515.5	11.26	6.524	0.264	75.81	0.000	0.000	0.000	0.000	0.000	0.000	0.000	0.000	0.089	2.952		ma120201_rel_withdbg.cz12b_c32r128
qp500.L4
qp500.L4: point queries with 500 insert/s per client. Graphs for performance per 1-second interval are here.
Average throughput:
Query response time histogram: each cell has the percentage of responses that take <= the time in the header and max is the max response time in seconds. For max values in the top 25% of the range have a red background and in the bottom 25% of the range have a green background. The red background is not used when the min value is within 80% of the max value.
| dbms | 256us | 1ms | 4ms | 16ms | 64ms | 256ms | 1s | 4s | 16s | gt | max |
|---|---|---|---|---|---|---|---|---|---|---|---|
| ma100624_rel_withdbg.cz12a_c32r128 | 99.900 | 0.097 | 0.003 | nonzero | nonzero | 0.020 | |||||
| ma100624_rel_withdbg.cz12a_cb_c32r128 | 99.886 | 0.110 | 0.003 | nonzero | 0.015 | ||||||
| ma101115_rel_withdbg.cz12a_c32r128 | 99.960 | 0.032 | 0.008 | nonzero | 0.008 | ||||||
| ma110409_rel_withdbg.cz12b_c32r128 | 99.973 | 0.019 | 0.008 | nonzero | 0.015 | ||||||
| ma110805_rel_withdbg.cz12b_c32r128 | 99.975 | 0.017 | 0.008 | nonzero | 0.016 | ||||||
| ma120102_rel_withdbg.cz12b_c32r128 | 99.974 | 0.018 | 0.007 | nonzero | nonzero | 0.017 | |||||
| ma120201_rel_withdbg.cz12b_c32r128 | 99.972 | 0.020 | 0.008 | nonzero | 0.014 |
Insert response time histogram: each cell has the percentage of responses that take <= the time in the header and max is the max response time in seconds. For max values in the top 25% of the range have a red background and in the bottom 25% of the range have a green background. The red background is not used when the min value is within 80% of the max value.
| dbms | 256us | 1ms | 4ms | 16ms | 64ms | 256ms | 1s | 4s | 16s | gt | max |
|---|---|---|---|---|---|---|---|---|---|---|---|
| ma100624_rel_withdbg.cz12a_c32r128 | 0.003 | 10.039 | 88.854 | 1.105 | 0.048 | ||||||
| ma100624_rel_withdbg.cz12a_cb_c32r128 | 0.005 | 8.207 | 89.596 | 2.192 | 0.041 | ||||||
| ma101115_rel_withdbg.cz12a_c32r128 | 0.126 | 94.478 | 5.386 | 0.011 | 0.037 | ||||||
| ma110409_rel_withdbg.cz12b_c32r128 | 0.585 | 96.707 | 2.703 | 0.005 | 0.027 | ||||||
| ma110805_rel_withdbg.cz12b_c32r128 | 1.106 | 96.638 | 2.193 | 0.063 | nonzero | 0.070 | |||||
| ma120102_rel_withdbg.cz12b_c32r128 | 1.967 | 95.870 | 2.100 | 0.063 | 0.062 | ||||||
| ma120201_rel_withdbg.cz12b_c32r128 | 1.494 | 95.335 | 3.166 | 0.005 | 0.028 |
Delete response time histogram: each cell has the percentage of responses that take <= the time in the header and max is the max response time in seconds. For max values in the top 25% of the range have a red background and in the bottom 25% of the range have a green background. The red background is not used when the min value is within 80% of the max value.
| dbms | 256us | 1ms | 4ms | 16ms | 64ms | 256ms | 1s | 4s | 16s | gt | max |
|---|---|---|---|---|---|---|---|---|---|---|---|
| ma100624_rel_withdbg.cz12a_c32r128 | 0.075 | 11.113 | 88.203 | 0.609 | 0.043 | ||||||
| ma100624_rel_withdbg.cz12a_cb_c32r128 | 0.064 | 8.853 | 89.823 | 1.259 | 0.033 | ||||||
| ma101115_rel_withdbg.cz12a_c32r128 | 3.919 | 93.166 | 2.909 | 0.006 | 0.035 | ||||||
| ma110409_rel_withdbg.cz12b_c32r128 | 6.410 | 91.555 | 2.030 | 0.004 | 0.027 | ||||||
| ma110805_rel_withdbg.cz12b_c32r128 | 11.342 | 87.000 | 1.615 | 0.043 | nonzero | 0.079 | |||||
| ma120102_rel_withdbg.cz12b_c32r128 | 14.854 | 83.539 | 1.575 | 0.031 | 0.055 | ||||||
| ma120201_rel_withdbg.cz12b_c32r128 | 13.504 | 84.033 | 2.458 | 0.004 | 0.030 |
Performance metrics for the DBMS listed above. Some are normalized by throughput, others are not. Legend for results is here.
ips	qps	rps	rmbps	wps	wmbps	rpq	rkbpq	wpi	wkbpi	csps	cpups	cspq	cpupq	dbgb1	dbgb2	rss	maxop	p50	p99	tag
9939	191596	0	0.0	1137.5	37.7	0.000	0.000	0.114	3.882	1180861	47.5	6.163	119	41.7	143.8	43.7	0.020	9686	9034	ma100624_rel_withdbg.cz12a_c32r128
9936	192162	0	0.0	1118.0	37.3	0.000	0.000	0.113	3.842	1183749	47.9	6.160	120	41.7	143.9	43.7	0.015	9718	9065	ma100624_rel_withdbg.cz12a_cb_c32r128
9934	193545	0	0.0	1212.7	40.0	0.000	0.000	0.122	4.120	1130007	44.3	5.838	110	43.4	145.5	45.6	0.008	9749	9209	ma101115_rel_withdbg.cz12a_c32r128
9936	194575	0	0.0	1219.7	40.1	0.000	0.000	0.123	4.130	1130483	44.4	5.810	110	43.7	145.8	45.8	0.015	9801	9337	ma110409_rel_withdbg.cz12b_c32r128
9936	199961	0	0.0	1214.8	40.1	0.000	0.000	0.122	4.131	1162070	44.6	5.811	107	43.7	145.9	45.9	0.016	10069	9510	ma110805_rel_withdbg.cz12b_c32r128
9936	196889	0	0.0	1216.8	40.1	0.000	0.000	0.122	4.134	1144469	44.5	5.813	108	43.7	145.9	45.7	0.017	9909	9446	ma120102_rel_withdbg.cz12b_c32r128
9936	192409	0	0.0	1218.7	40.1	0.000	0.000	0.123	4.136	1118343	44.4	5.812	111	43.6	145.7	45.7	0.014	9717	9238	ma120201_rel_withdbg.cz12b_c32r128
Average values from iostat.
r/s	rkB/s	rrqm/s	%rrqm	r_await	rareq-s	w/s	wkB/s	wrqm/s	%wrqm	w_await	wareq-s	d/s	dkB/s	drqm/s	%drqm	d_await	dareq-s	f/s	f_await	aqu-sz	%util
0.026	0.157	0.000	0.000	0.006	0.499	1160.8	38719.0	13.69	4.787	0.195	62.32	0.000	0.000	0.000	0.000	0.000	0.000	0.000	0.000	0.089	3.239		ma100624_rel_withdbg.cz12a_c32r128
0.032	0.245	0.000	0.000	0.006	0.542	1144.7	38315.4	11.26	5.145	0.196	63.91	0.000	0.000	0.000	0.000	0.000	0.000	0.000	0.000	0.086	3.158		ma100624_rel_withdbg.cz12a_cb_c32r128
0.004	0.039	0.004	0.120	0.000	0.097	1242.9	41080.9	10.68	4.545	0.193	60.72	0.000	0.000	0.000	0.000	0.000	0.000	0.000	0.000	0.096	3.299		ma101115_rel_withdbg.cz12a_c32r128
0.145	16.23	0.036	0.119	0.000	0.245	1246.6	41189.1	14.81	4.976	0.193	60.94	0.000	0.000	0.000	0.000	0.000	0.000	0.000	0.000	0.089	3.303		ma110409_rel_withdbg.cz12b_c32r128
0.006	0.048	0.000	0.000	0.001	0.095	1246.1	41198.2	11.52	4.764	0.225	60.52	0.000	0.000	0.000	0.000	0.000	0.000	0.000	0.000	0.113	3.619		ma110805_rel_withdbg.cz12b_c32r128
0.009	0.071	0.000	0.000	0.002	0.172	1247.9	41229.4	12.36	5.076	0.195	61.03	0.000	0.000	0.000	0.000	0.000	0.000	0.000	0.000	0.106	3.550		ma120102_rel_withdbg.cz12b_c32r128
0.017	0.265	0.019	0.096	0.002	0.385	1249.6	41249.4	10.81	4.510	0.207	60.45	0.000	0.000	0.000	0.000	0.000	0.000	0.000	0.000	0.097	3.291		ma120201_rel_withdbg.cz12b_c32r128
qr1000.L5
qr1000.L5: range queries with 1000 insert/s per client. Graphs for performance per 1-second interval are here.
Average throughput:
Query response time histogram: each cell has the percentage of responses that take <= the time in the header and max is the max response time in seconds. For max values in the top 25% of the range have a red background and in the bottom 25% of the range have a green background. The red background is not used when the min value is within 80% of the max value.
| dbms | 256us | 1ms | 4ms | 16ms | 64ms | 256ms | 1s | 4s | 16s | gt | max |
|---|---|---|---|---|---|---|---|---|---|---|---|
| ma100624_rel_withdbg.cz12a_c32r128 | 99.720 | 0.275 | 0.005 | nonzero | nonzero | 0.030 | |||||
| ma100624_rel_withdbg.cz12a_cb_c32r128 | 99.728 | 0.267 | 0.005 | nonzero | nonzero | 0.030 | |||||
| ma101115_rel_withdbg.cz12a_c32r128 | 99.927 | 0.049 | 0.023 | 0.001 | nonzero | 0.040 | |||||
| ma110409_rel_withdbg.cz12b_c32r128 | 99.938 | 0.037 | 0.024 | 0.001 | nonzero | 0.022 | |||||
| ma110805_rel_withdbg.cz12b_c32r128 | 99.935 | 0.039 | 0.025 | 0.001 | nonzero | 0.043 | |||||
| ma120102_rel_withdbg.cz12b_c32r128 | 99.933 | 0.040 | 0.026 | 0.001 | nonzero | 0.059 | |||||
| ma120201_rel_withdbg.cz12b_c32r128 | 99.927 | 0.044 | 0.027 | 0.001 | nonzero | 0.038 |
Insert response time histogram: each cell has the percentage of responses that take <= the time in the header and max is the max response time in seconds. For max values in the top 25% of the range have a red background and in the bottom 25% of the range have a green background. The red background is not used when the min value is within 80% of the max value.
| dbms | 256us | 1ms | 4ms | 16ms | 64ms | 256ms | 1s | 4s | 16s | gt | max |
|---|---|---|---|---|---|---|---|---|---|---|---|
| ma100624_rel_withdbg.cz12a_c32r128 | 0.002 | 2.982 | 90.527 | 6.488 | nonzero | 0.068 | |||||
| ma100624_rel_withdbg.cz12a_cb_c32r128 | 0.002 | 2.988 | 90.964 | 6.046 | nonzero | 0.064 | |||||
| ma101115_rel_withdbg.cz12a_c32r128 | 0.799 | 80.354 | 18.787 | 0.060 | 0.051 | ||||||
| ma110409_rel_withdbg.cz12b_c32r128 | 1.555 | 81.364 | 17.018 | 0.063 | 0.051 | ||||||
| ma110805_rel_withdbg.cz12b_c32r128 | 1.101 | 81.162 | 17.655 | 0.081 | 0.060 | ||||||
| ma120102_rel_withdbg.cz12b_c32r128 | 1.190 | 81.464 | 17.264 | 0.083 | 0.062 | ||||||
| ma120201_rel_withdbg.cz12b_c32r128 | 0.963 | 80.101 | 18.865 | 0.071 | 0.053 |
Delete response time histogram: each cell has the percentage of responses that take <= the time in the header and max is the max response time in seconds. For max values in the top 25% of the range have a red background and in the bottom 25% of the range have a green background. The red background is not used when the min value is within 80% of the max value.
| dbms | 256us | 1ms | 4ms | 16ms | 64ms | 256ms | 1s | 4s | 16s | gt | max |
|---|---|---|---|---|---|---|---|---|---|---|---|
| ma100624_rel_withdbg.cz12a_c32r128 | 0.024 | 2.119 | 93.988 | 3.869 | nonzero | 0.067 | |||||
| ma100624_rel_withdbg.cz12a_cb_c32r128 | 0.018 | 1.956 | 94.594 | 3.432 | 0.054 | ||||||
| ma101115_rel_withdbg.cz12a_c32r128 | 3.598 | 80.874 | 15.475 | 0.053 | 0.051 | ||||||
| ma110409_rel_withdbg.cz12b_c32r128 | 3.895 | 80.085 | 15.963 | 0.057 | 0.051 | ||||||
| ma110805_rel_withdbg.cz12b_c32r128 | 2.660 | 80.401 | 16.867 | 0.071 | 0.054 | ||||||
| ma120102_rel_withdbg.cz12b_c32r128 | 3.139 | 80.428 | 16.361 | 0.072 | 0.062 | ||||||
| ma120201_rel_withdbg.cz12b_c32r128 | 2.233 | 79.536 | 18.163 | 0.068 | 0.051 |
Performance metrics for the DBMS listed above. Some are normalized by throughput, others are not. Legend for results is here.
ips	qps	rps	rmbps	wps	wmbps	rpq	rkbpq	wpi	wkbpi	csps	cpups	cspq	cpupq	dbgb1	dbgb2	rss	maxop	p50	p99	tag
19873	204175	0	0.0	2146.1	71.8	0.000	0.000	0.108	3.701	1304539	54.9	6.389	129	41.7	143.8	43.7	0.030	10310	9398	ma100624_rel_withdbg.cz12a_c32r128
19878	206653	0	0.0	2153.0	72.2	0.000	0.000	0.108	3.717	1317904	54.9	6.377	128	41.7	143.9	43.7	0.030	10421	9366	ma100624_rel_withdbg.cz12a_cb_c32r128
19878	223060	0	0.0	2121.8	71.6	0.000	0.000	0.107	3.686	1286292	46.7	5.767	100	43.4	145.5	45.6	0.040	11284	10389	ma101115_rel_withdbg.cz12a_c32r128
19873	224560	0	0.0	2135.1	71.8	0.000	0.000	0.107	3.698	1287551	46.6	5.734	100	43.7	145.8	45.8	0.022	11363	10581	ma110409_rel_withdbg.cz12b_c32r128
19873	226998	0	0.0	2135.5	72.0	0.000	0.000	0.107	3.709	1302131	46.6	5.736	99	43.7	145.9	45.9	0.043	11476	10665	ma110805_rel_withdbg.cz12b_c32r128
19873	218810	0	0.0	2128.8	71.8	0.000	0.000	0.107	3.700	1255602	46.6	5.738	102	43.7	145.9	45.7	0.059	11061	10313	ma120102_rel_withdbg.cz12b_c32r128
19873	214165	0	0.0	2135.3	71.9	0.000	0.000	0.107	3.706	1228954	46.5	5.738	104	43.6	145.7	45.7	0.038	10836	10133	ma120201_rel_withdbg.cz12b_c32r128
Average values from iostat.
r/s	rkB/s	rrqm/s	%rrqm	r_await	rareq-s	w/s	wkB/s	wrqm/s	%wrqm	w_await	wareq-s	d/s	dkB/s	drqm/s	%drqm	d_await	dareq-s	f/s	f_await	aqu-sz	%util
0.027	0.193	0.000	0.000	0.006	0.439	2147.4	73644.5	24.44	2.123	0.148	42.36	0.000	0.000	0.000	0.000	0.000	0.000	0.000	0.000	0.211	4.947		ma100624_rel_withdbg.cz12a_c32r128
0.056	0.587	0.000	0.000	0.015	1.067	2160.6	73989.7	19.09	1.994	0.174	43.01	0.000	0.000	0.000	0.000	0.000	0.000	0.000	0.000	0.233	4.979		ma100624_rel_withdbg.cz12a_cb_c32r128
0.011	0.118	0.000	0.000	0.003	0.087	2131.5	73374.2	17.90	1.704	0.156	41.18	0.000	0.000	0.000	0.000	0.000	0.000	0.000	0.000	0.223	4.978		ma101115_rel_withdbg.cz12a_c32r128
0.006	0.105	0.000	0.000	0.002	0.349	2137.8	73585.8	23.84	1.853	0.151	40.47	0.000	0.000	0.000	0.000	0.000	0.000	0.000	0.000	0.219	5.114		ma110409_rel_withdbg.cz12b_c32r128
0.005	0.030	0.000	0.000	0.003	0.116	2145.9	73808.1	18.04	1.777	0.176	41.77	0.000	0.000	0.000	0.000	0.000	0.000	0.000	0.000	0.233	5.138		ma110805_rel_withdbg.cz12b_c32r128
0.012	0.099	0.000	0.000	0.003	0.210	2138.4	73623.0	17.16	1.716	0.168	41.46	0.000	0.000	0.000	0.000	0.000	0.000	0.000	0.000	0.239	5.083		ma120102_rel_withdbg.cz12b_c32r128
0.039	0.758	0.004	0.035	0.006	0.728	2144.2	73743.9	17.54	1.747	0.153	41.80	0.000	0.000	0.000	0.000	0.000	0.000	0.000	0.000	0.220	5.091		ma120201_rel_withdbg.cz12b_c32r128
qp1000.L6
qp1000.L6: point queries with 1000 insert/s per client. Graphs for performance per 1-second interval are here.
Average throughput:
Query response time histogram: each cell has the percentage of responses that take <= the time in the header and max is the max response time in seconds. For max values in the top 25% of the range have a red background and in the bottom 25% of the range have a green background. The red background is not used when the min value is within 80% of the max value.
| dbms | 256us | 1ms | 4ms | 16ms | 64ms | 256ms | 1s | 4s | 16s | gt | max |
|---|---|---|---|---|---|---|---|---|---|---|---|
| ma100624_rel_withdbg.cz12a_c32r128 | 99.684 | 0.309 | 0.006 | nonzero | nonzero | 0.034 | |||||
| ma100624_rel_withdbg.cz12a_cb_c32r128 | 99.676 | 0.317 | 0.006 | nonzero | nonzero | 0.036 | |||||
| ma101115_rel_withdbg.cz12a_c32r128 | 99.841 | 0.147 | 0.012 | nonzero | nonzero | 0.023 | |||||
| ma110409_rel_withdbg.cz12b_c32r128 | 99.874 | 0.109 | 0.016 | 0.001 | nonzero | 0.018 | |||||
| ma110805_rel_withdbg.cz12b_c32r128 | 99.892 | 0.093 | 0.015 | 0.001 | nonzero | 0.017 | |||||
| ma120102_rel_withdbg.cz12b_c32r128 | 99.875 | 0.109 | 0.015 | nonzero | nonzero | 0.017 | |||||
| ma120201_rel_withdbg.cz12b_c32r128 | 99.881 | 0.103 | 0.015 | 0.001 | nonzero | 0.017 |
Insert response time histogram: each cell has the percentage of responses that take <= the time in the header and max is the max response time in seconds. For max values in the top 25% of the range have a red background and in the bottom 25% of the range have a green background. The red background is not used when the min value is within 80% of the max value.
| dbms | 256us | 1ms | 4ms | 16ms | 64ms | 256ms | 1s | 4s | 16s | gt | max |
|---|---|---|---|---|---|---|---|---|---|---|---|
| ma100624_rel_withdbg.cz12a_c32r128 | 0.003 | 3.040 | 90.611 | 6.345 | 0.053 | ||||||
| ma100624_rel_withdbg.cz12a_cb_c32r128 | 0.003 | 3.105 | 90.317 | 6.574 | 0.001 | 0.070 | |||||
| ma101115_rel_withdbg.cz12a_c32r128 | 0.041 | 74.903 | 24.993 | 0.063 | 0.056 | ||||||
| ma110409_rel_withdbg.cz12b_c32r128 | 0.122 | 80.198 | 19.612 | 0.068 | 0.053 | ||||||
| ma110805_rel_withdbg.cz12b_c32r128 | 3.496 | 81.048 | 15.398 | 0.058 | 0.053 | ||||||
| ma120102_rel_withdbg.cz12b_c32r128 | 0.434 | 80.535 | 18.966 | 0.065 | 0.064 | ||||||
| ma120201_rel_withdbg.cz12b_c32r128 | 3.806 | 79.263 | 16.871 | 0.060 | 0.057 |
Delete response time histogram: each cell has the percentage of responses that take <= the time in the header and max is the max response time in seconds. For max values in the top 25% of the range have a red background and in the bottom 25% of the range have a green background. The red background is not used when the min value is within 80% of the max value.
| dbms | 256us | 1ms | 4ms | 16ms | 64ms | 256ms | 1s | 4s | 16s | gt | max |
|---|---|---|---|---|---|---|---|---|---|---|---|
| ma100624_rel_withdbg.cz12a_c32r128 | 0.026 | 2.145 | 94.211 | 3.618 | 0.060 | ||||||
| ma100624_rel_withdbg.cz12a_cb_c32r128 | 0.026 | 2.216 | 94.188 | 3.569 | 0.001 | 0.069 | |||||
| ma101115_rel_withdbg.cz12a_c32r128 | 0.149 | 85.328 | 14.472 | 0.051 | 0.060 | ||||||
| ma110409_rel_withdbg.cz12b_c32r128 | 0.410 | 81.991 | 17.538 | 0.062 | 0.044 | ||||||
| ma110805_rel_withdbg.cz12b_c32r128 | 6.841 | 79.180 | 13.927 | 0.052 | 0.052 | ||||||
| ma120102_rel_withdbg.cz12b_c32r128 | 0.827 | 82.057 | 17.056 | 0.060 | 0.063 | ||||||
| ma120201_rel_withdbg.cz12b_c32r128 | 6.258 | 78.349 | 15.336 | 0.057 | 0.058 |
Performance metrics for the DBMS listed above. Some are normalized by throughput, others are not. Legend for results is here.
ips	qps	rps	rmbps	wps	wmbps	rpq	rkbpq	wpi	wkbpi	csps	cpups	cspq	cpupq	dbgb1	dbgb2	rss	maxop	p50	p99	tag
19878	181478	0	0.0	2218.3	73.8	0.000	0.000	0.112	3.804	1182016	54.4	6.513	144	41.7	143.8	43.7	0.034	9174	8471	ma100624_rel_withdbg.cz12a_c32r128
19873	182303	0	0.0	2216.7	74.0	0.000	0.000	0.112	3.811	1189045	54.4	6.522	143	41.7	143.9	43.7	0.036	9206	8487	ma100624_rel_withdbg.cz12a_cb_c32r128
19873	187500	0	0.0	2206.5	73.8	0.000	0.000	0.111	3.804	1122669	46.6	5.988	119	43.4	145.5	45.6	0.023	9465	8742	ma101115_rel_withdbg.cz12a_c32r128
19873	189635	0	0.0	2203.0	73.6	0.000	0.000	0.111	3.790	1107383	46.5	5.840	118	43.7	145.8	45.9	0.018	9590	8998	ma110409_rel_withdbg.cz12b_c32r128
19873	194947	2	0.1	2191.1	73.4	0.000	0.000	0.110	3.780	1137931	46.2	5.837	114	43.7	145.9	45.9	0.017	9861	9222	ma110805_rel_withdbg.cz12b_c32r128
19873	191702	0	0.0	2196.9	73.6	0.000	0.000	0.111	3.791	1120069	46.1	5.843	115	43.7	145.9	45.7	0.017	9653	8998	ma120102_rel_withdbg.cz12b_c32r128
19873	187805	0	0.0	2194.0	73.4	0.000	0.000	0.110	3.783	1097340	46.3	5.843	118	43.6	145.7	45.7	0.017	9478	8921	ma120201_rel_withdbg.cz12b_c32r128
Average values from iostat.
r/s	rkB/s	rrqm/s	%rrqm	r_await	rareq-s	w/s	wkB/s	wrqm/s	%wrqm	w_await	wareq-s	d/s	dkB/s	drqm/s	%drqm	d_await	dareq-s	f/s	f_await	aqu-sz	%util
0.035	0.344	0.007	0.029	0.006	0.175	2216.6	75701.1	24.42	1.662	0.130	38.37	0.000	0.000	0.000	0.000	0.000	0.000	0.000	0.000	0.213	5.101		ma100624_rel_withdbg.cz12a_c32r128
0.068	0.665	0.012	0.295	0.014	1.339	2221.4	75820.5	19.56	1.508	0.151	38.69	0.000	0.000	0.000	0.000	0.000	0.000	0.000	0.000	0.237	5.155		ma100624_rel_withdbg.cz12a_cb_c32r128
0.004	0.038	0.000	0.000	0.000	0.025	2213.0	75672.4	17.83	1.269	0.135	36.94	0.000	0.000	0.000	0.000	0.000	0.000	0.000	0.000	0.250	5.807		ma101115_rel_withdbg.cz12a_c32r128
0.009	0.192	0.035	0.381	0.005	0.326	2204.2	75414.8	25.62	1.600	0.112	36.83	0.000	0.000	0.000	0.000	0.000	0.000	0.000	0.000	0.216	5.535		ma110409_rel_withdbg.cz12b_c32r128
0.298	32.41	0.210	0.249	0.004	0.736	2198.6	75224.3	20.71	1.435	0.119	37.05	0.000	0.000	0.000	0.000	0.000	0.000	0.000	0.000	0.214	5.566		ma110805_rel_withdbg.cz12b_c32r128
0.017	0.115	0.000	0.000	0.003	0.251	2204.9	75432.5	17.70	1.284	0.127	37.26	0.000	0.000	0.000	0.000	0.000	0.000	0.000	0.000	0.227	5.571		ma120102_rel_withdbg.cz12b_c32r128
0.051	0.660	0.073	0.338	0.010	0.762	2202.2	75269.2	17.70	1.248	0.133	36.81	0.000	0.000	0.000	0.000	0.000	0.000	0.000	0.000	0.244	5.541		ma120201_rel_withdbg.cz12b_c32r128
l.i0
l.i0: load without secondary indexes
Performance metrics for all DBMS, not just the ones listed above. Some are normalized by throughput, others are not. Legend for results is here.
ips	qps	rps	rmbps	wps	wmbps	rpq	rkbpq	wpi	wkbpi	csps	cpups	cspq	cpupq	dbgb1	dbgb2	rss	maxop	p50	p99	tag
334448	0	0	0.0	1762.8	87.1	0.000	0.000	0.005	0.267	922252	51.7	2.758	74	13.3	114.8	16.0	0.209	17286	14983	ma100624_rel_withdbg.cz12a_c32r128
335570	0	4	0.2	1560.4	84.4	0.000	0.000	0.005	0.258	927799	51.8	2.765	74	13.3	114.9	16.1	0.151	17481	15483	ma100624_rel_withdbg.cz12a_cb_c32r128
1257862	0	2	0.0	4569.9	285.5	0.000	0.000	0.004	0.232	188711	42.9	0.150	16	13.3	114.1	14.4	0.204	73220	62333	ma101115_rel_withdbg.cz12a_c32r128
1324503	0	2	0.0	4618.9	298.7	0.000	0.000	0.003	0.231	201154	44.0	0.152	16	13.3	114.1	15.0	0.201	77916	64250	ma110409_rel_withdbg.cz12b_c32r128
1290322	0	2	0.0	4619.9	292.4	0.000	0.000	0.004	0.232	198974	43.8	0.154	16	13.3	114.1	14.6	0.172	74817	55940	ma110805_rel_withdbg.cz12b_c32r128
1298701	0	2	0.0	4642.4	293.4	0.000	0.000	0.004	0.231	198647	43.3	0.153	16	13.3	114.1	14.7	0.202	75419	55739	ma120102_rel_withdbg.cz12b_c32r128
1273885	0	2	0.0	4601.6	290.8	0.000	0.000	0.004	0.234	198329	43.9	0.156	17	13.3	114.1	14.5	0.312	71521	64031	ma120201_rel_withdbg.cz12b_c32r128
l.x
l.x: create secondary indexes
Performance metrics for all DBMS, not just the ones listed above. Some are normalized by throughput, others are not. Legend for results is here.
ips	qps	rps	rmbps	wps	wmbps	rpq	rkbpq	wpi	wkbpi	csps	cpups	cspq	cpupq	dbgb1	dbgb2	rss	maxop	p50	p99	tag
2352942	0	1	0.0	16764.1	1619.2	0.000	0.000	0.007	0.705	203802	27.7	0.087	6	28.1	129.6	23.5	0.008	NA	NA	ma100624_rel_withdbg.cz12a_c32r128
2272728	0	2	0.0	17311.9	1619.5	0.000	0.000	0.008	0.730	211861	27.6	0.093	6	28.1	129.8	23.7	0.007	NA	NA	ma100624_rel_withdbg.cz12a_cb_c32r128
2105264	0	2	0.0	17115.9	1471.3	0.000	0.000	0.008	0.716	52165	23.0	0.025	5	28.1	129.0	29.7	0.001	NA	NA	ma101115_rel_withdbg.cz12a_c32r128
2247192	0	2	0.0	17981.2	1551.9	0.000	0.000	0.008	0.707	53493	24.2	0.024	5	28.1	129.0	30.5	0.001	NA	NA	ma110409_rel_withdbg.cz12b_c32r128
2222223	0	2	0.0	18037.4	1551.4	0.000	0.000	0.008	0.715	52730	24.4	0.024	5	28.1	129.0	30.4	0.078	NA	NA	ma110805_rel_withdbg.cz12b_c32r128
2352942	0	2	0.0	18608.8	1636.3	0.000	0.000	0.008	0.712	52815	24.6	0.022	5	28.1	129.0	23.1	0.001	NA	NA	ma120102_rel_withdbg.cz12b_c32r128
2150539	0	2	0.0	17206.1	1472.9	0.000	0.000	0.008	0.701	53106	23.0	0.025	5	28.1	129.0	29.6	0.001	NA	NA	ma120201_rel_withdbg.cz12b_c32r128
l.i1
l.i1: continue load after secondary indexes created with 50 inserts per transaction
Performance metrics for all DBMS, not just the ones listed above. Some are normalized by throughput, others are not. Legend for results is here.
ips	qps	rps	rmbps	wps	wmbps	rpq	rkbpq	wpi	wkbpi	csps	cpups	cspq	cpupq	dbgb1	dbgb2	rss	maxop	p50	p99	tag
60182	0	1	0.0	8213.1	254.6	0.000	0.000	0.136	4.332	854806	68.3	14.204	545	41.7	143.8	43.8	0.248	2997	2797	ma100624_rel_withdbg.cz12a_c32r128
60173	0	1	0.1	8174.2	254.1	0.000	0.001	0.136	4.325	862667	67.9	14.336	542	41.7	143.9	43.8	0.267	2997	2748	ma100624_rel_withdbg.cz12a_cb_c32r128
141618	0	1	0.0	10277.4	358.4	0.000	0.000	0.073	2.591	236173	56.4	1.668	191	43.4	145.5	45.7	0.305	7092	6093	ma101115_rel_withdbg.cz12a_c32r128
167961	0	1	0.0	10644.1	381.2	0.000	0.000	0.063	2.324	177865	59.8	1.059	171	43.7	145.8	46.0	0.413	8391	7094	ma110409_rel_withdbg.cz12b_c32r128
177502	0	0	0.0	10706.3	388.5	0.000	0.000	0.060	2.241	182078	60.4	1.026	163	43.7	145.9	46.1	0.510	8843	7542	ma110805_rel_withdbg.cz12b_c32r128
169960	0	1	0.0	10657.1	382.7	0.000	0.000	0.063	2.306	181614	61.0	1.069	172	43.7	145.9	46.0	0.425	8491	7242	ma120102_rel_withdbg.cz12b_c32r128
163499	0	1	0.0	10602.9	378.0	0.000	0.000	0.065	2.368	176747	61.8	1.081	181	43.6	145.7	45.9	0.454	8141	6945	ma120201_rel_withdbg.cz12b_c32r128
l.i2
l.i2: continue load after secondary indexes created with 5 inserts per transaction
Performance metrics for all DBMS, not just the ones listed above. Some are normalized by throughput, others are not. Legend for results is here.
ips	qps	rps	rmbps	wps	wmbps	rpq	rkbpq	wpi	wkbpi	csps	cpups	cspq	cpupq	dbgb1	dbgb2	rss	maxop	p50	p99	tag
53981	0	1	0.0	6902.2	231.1	0.000	0.000	0.128	4.383	1136000	58.1	21.044	517	41.7	143.8	43.8	0.169	2738	734	ma100624_rel_withdbg.cz12a_c32r128
53749	0	0	0.0	6869.4	230.7	0.000	0.000	0.128	4.395	1139884	58.0	21.208	518	41.7	143.9	43.8	0.159	2727	729	ma100624_rel_withdbg.cz12a_cb_c32r128
131234	0	0	0.0	10582.3	394.6	0.000	0.000	0.081	3.079	928439	58.9	7.075	215	43.4	145.5	45.7	0.184	6733	1309	ma101115_rel_withdbg.cz12a_c32r128
136705	0	0	0.0	10662.2	401.3	0.000	0.000	0.078	3.006	890386	60.6	6.513	213	43.7	145.8	46.1	0.189	6933	2502	ma110409_rel_withdbg.cz12b_c32r128
137457	0	0	0.0	10670.7	402.2	0.000	0.000	0.078	2.996	901523	60.3	6.559	211	43.7	145.9	46.1	0.213	6933	5579	ma110805_rel_withdbg.cz12b_c32r128
136240	0	1	0.0	10668.8	401.3	0.000	0.000	0.078	3.016	903676	60.4	6.633	213	43.7	145.9	46.0	0.168	6892	2432	ma120102_rel_withdbg.cz12b_c32r128
133333	0	1	0.0	10623.9	397.8	0.000	0.000	0.080	3.055	882060	60.1	6.615	216	43.6	145.7	45.9	0.183	6753	4051	ma120201_rel_withdbg.cz12b_c32r128
qr100.L1
qr100.L1: range queries with 100 insert/s per client
Performance metrics for all DBMS, not just the ones listed above. Some are normalized by throughput, others are not. Legend for results is here.
ips	qps	rps	rmbps	wps	wmbps	rpq	rkbpq	wpi	wkbpi	csps	cpups	cspq	cpupq	dbgb1	dbgb2	rss	maxop	p50	p99	tag
1988	225734	0	0.0	24.4	2.2	0.000	0.000	0.012	1.119	1306355	43.7	5.787	93	41.7	143.8	43.8	0.013	11332	10629	ma100624_rel_withdbg.cz12a_c32r128
1987	228260	0	0.0	22.7	2.1	0.000	0.000	0.011	1.108	1322498	43.7	5.794	92	41.7	143.9	43.8	0.013	11507	10820	ma100624_rel_withdbg.cz12a_cb_c32r128
1987	232593	0	0.0	26.4	2.3	0.000	0.000	0.013	1.178	1331291	43.6	5.724	90	43.4	145.5	45.7	0.010	11747	11111	ma101115_rel_withdbg.cz12a_c32r128
1988	232916	0	0.0	22.4	2.1	0.000	0.000	0.011	1.093	1333590	43.7	5.726	90	43.7	145.8	45.8	0.011	11703	11092	ma110409_rel_withdbg.cz12b_c32r128
1987	236009	0	0.0	22.6	2.1	0.000	0.000	0.011	1.091	1351739	43.7	5.727	89	43.7	145.9	45.8	0.012	11892	11284	ma110805_rel_withdbg.cz12b_c32r128
1988	226535	0	0.0	24.2	2.1	0.000	0.000	0.012	1.097	1297174	43.7	5.726	93	43.7	145.9	45.7	0.012	11364	10836	ma120102_rel_withdbg.cz12b_c32r128
1987	221663	0	0.0	22.9	2.1	0.000	0.000	0.012	1.093	1269563	43.4	5.727	94	43.6	145.7	45.6	0.010	11156	10628	ma120201_rel_withdbg.cz12b_c32r128
qp100.L2
qp100.L2: point queries with 100 insert/s per client
Performance metrics for all DBMS, not just the ones listed above. Some are normalized by throughput, others are not. Legend for results is here.
ips	qps	rps	rmbps	wps	wmbps	rpq	rkbpq	wpi	wkbpi	csps	cpups	cspq	cpupq	dbgb1	dbgb2	rss	maxop	p50	p99	tag
1987	199290	0	0.0	303.3	9.5	0.000	0.000	0.153	4.888	1168698	43.6	5.864	105	41.7	143.8	43.8	0.010	10037	9545	ma100624_rel_withdbg.cz12a_c32r128
1987	200344	0	0.0	302.0	9.6	0.000	0.000	0.152	4.928	1173042	43.6	5.855	104	41.7	143.9	43.8	0.011	10088	9621	ma100624_rel_withdbg.cz12a_cb_c32r128
1987	196794	0	0.0	304.1	9.6	0.000	0.000	0.153	4.946	1140952	43.0	5.798	105	43.4	145.5	45.7	0.010	9909	9622	ma101115_rel_withdbg.cz12a_c32r128
1988	197088	0	0.0	302.8	9.6	0.000	0.000	0.152	4.950	1141519	43.2	5.792	105	43.7	145.8	45.8	0.011	9925	9496	ma110409_rel_withdbg.cz12b_c32r128
1987	202155	0	0.0	302.4	9.6	0.000	0.000	0.152	4.938	1170104	43.2	5.788	103	43.7	145.9	45.9	0.012	10216	9797	ma110805_rel_withdbg.cz12b_c32r128
1988	199363	1	0.1	305.9	9.8	0.000	0.001	0.154	5.063	1154793	43.1	5.792	104	43.7	145.9	45.7	0.012	10053	9670	ma120102_rel_withdbg.cz12b_c32r128
1987	195092	0	0.0	302.7	9.6	0.000	0.000	0.152	4.961	1130345	43.1	5.794	106	43.6	145.7	45.7	0.010	9797	9398	ma120201_rel_withdbg.cz12b_c32r128
qr500.L3
qr500.L3: range queries with 500 insert/s per client
Performance metrics for all DBMS, not just the ones listed above. Some are normalized by throughput, others are not. Legend for results is here.
ips	qps	rps	rmbps	wps	wmbps	rpq	rkbpq	wpi	wkbpi	csps	cpups	cspq	cpupq	dbgb1	dbgb2	rss	maxop	p50	p99	tag
9936	216133	1	0.0	1011.4	34.3	0.000	0.000	0.102	3.531	1311428	48.2	6.068	107	41.7	143.8	43.7	0.017	10932	10005	ma100624_rel_withdbg.cz12a_c32r128
9936	218408	0	0.0	1004.3	34.2	0.000	0.000	0.101	3.526	1325120	48.5	6.067	107	41.7	143.9	43.7	0.035	11044	10136	ma100624_rel_withdbg.cz12a_cb_c32r128
9934	228673	1	0.1	1014.7	34.7	0.000	0.000	0.102	3.577	1313897	44.7	5.746	94	43.4	145.5	45.6	0.026	11538	10805	ma101115_rel_withdbg.cz12a_c32r128
9939	229794	0	0.0	1014.8	34.5	0.000	0.000	0.102	3.558	1318091	44.7	5.736	93	43.7	145.8	45.8	0.015	11555	10852	ma110409_rel_withdbg.cz12b_c32r128
9936	232311	0	0.0	1013.4	34.6	0.000	0.000	0.102	3.565	1333439	44.7	5.740	92	43.7	145.9	45.9	0.063	11730	10980	ma110805_rel_withdbg.cz12b_c32r128
9936	223269	0	0.0	1013.9	34.6	0.000	0.000	0.102	3.563	1281978	44.7	5.742	96	43.7	145.9	45.7	0.075	11252	10628	ma120102_rel_withdbg.cz12b_c32r128
9939	218905	0	0.0	1013.3	34.5	0.000	0.000	0.102	3.559	1256225	44.5	5.739	98	43.6	145.7	45.7	0.018	11044	10356	ma120201_rel_withdbg.cz12b_c32r128
qp500.L4
qp500.L4: point queries with 500 insert/s per client
Performance metrics for all DBMS, not just the ones listed above. Some are normalized by throughput, others are not. Legend for results is here.
ips	qps	rps	rmbps	wps	wmbps	rpq	rkbpq	wpi	wkbpi	csps	cpups	cspq	cpupq	dbgb1	dbgb2	rss	maxop	p50	p99	tag
9939	191596	0	0.0	1137.5	37.7	0.000	0.000	0.114	3.882	1180861	47.5	6.163	119	41.7	143.8	43.7	0.020	9686	9034	ma100624_rel_withdbg.cz12a_c32r128
9936	192162	0	0.0	1118.0	37.3	0.000	0.000	0.113	3.842	1183749	47.9	6.160	120	41.7	143.9	43.7	0.015	9718	9065	ma100624_rel_withdbg.cz12a_cb_c32r128
9934	193545	0	0.0	1212.7	40.0	0.000	0.000	0.122	4.120	1130007	44.3	5.838	110	43.4	145.5	45.6	0.008	9749	9209	ma101115_rel_withdbg.cz12a_c32r128
9936	194575	0	0.0	1219.7	40.1	0.000	0.000	0.123	4.130	1130483	44.4	5.810	110	43.7	145.8	45.8	0.015	9801	9337	ma110409_rel_withdbg.cz12b_c32r128
9936	199961	0	0.0	1214.8	40.1	0.000	0.000	0.122	4.131	1162070	44.6	5.811	107	43.7	145.9	45.9	0.016	10069	9510	ma110805_rel_withdbg.cz12b_c32r128
9936	196889	0	0.0	1216.8	40.1	0.000	0.000	0.122	4.134	1144469	44.5	5.813	108	43.7	145.9	45.7	0.017	9909	9446	ma120102_rel_withdbg.cz12b_c32r128
9936	192409	0	0.0	1218.7	40.1	0.000	0.000	0.123	4.136	1118343	44.4	5.812	111	43.6	145.7	45.7	0.014	9717	9238	ma120201_rel_withdbg.cz12b_c32r128
qr1000.L5
qr1000.L5: range queries with 1000 insert/s per client
Performance metrics for all DBMS, not just the ones listed above. Some are normalized by throughput, others are not. Legend for results is here.
ips	qps	rps	rmbps	wps	wmbps	rpq	rkbpq	wpi	wkbpi	csps	cpups	cspq	cpupq	dbgb1	dbgb2	rss	maxop	p50	p99	tag
19873	204175	0	0.0	2146.1	71.8	0.000	0.000	0.108	3.701	1304539	54.9	6.389	129	41.7	143.8	43.7	0.030	10310	9398	ma100624_rel_withdbg.cz12a_c32r128
19878	206653	0	0.0	2153.0	72.2	0.000	0.000	0.108	3.717	1317904	54.9	6.377	128	41.7	143.9	43.7	0.030	10421	9366	ma100624_rel_withdbg.cz12a_cb_c32r128
19878	223060	0	0.0	2121.8	71.6	0.000	0.000	0.107	3.686	1286292	46.7	5.767	100	43.4	145.5	45.6	0.040	11284	10389	ma101115_rel_withdbg.cz12a_c32r128
19873	224560	0	0.0	2135.1	71.8	0.000	0.000	0.107	3.698	1287551	46.6	5.734	100	43.7	145.8	45.8	0.022	11363	10581	ma110409_rel_withdbg.cz12b_c32r128
19873	226998	0	0.0	2135.5	72.0	0.000	0.000	0.107	3.709	1302131	46.6	5.736	99	43.7	145.9	45.9	0.043	11476	10665	ma110805_rel_withdbg.cz12b_c32r128
19873	218810	0	0.0	2128.8	71.8	0.000	0.000	0.107	3.700	1255602	46.6	5.738	102	43.7	145.9	45.7	0.059	11061	10313	ma120102_rel_withdbg.cz12b_c32r128
19873	214165	0	0.0	2135.3	71.9	0.000	0.000	0.107	3.706	1228954	46.5	5.738	104	43.6	145.7	45.7	0.038	10836	10133	ma120201_rel_withdbg.cz12b_c32r128
qp1000.L6
qp1000.L6: point queries with 1000 insert/s per client
Performance metrics for all DBMS, not just the ones listed above. Some are normalized by throughput, others are not. Legend for results is here.
ips	qps	rps	rmbps	wps	wmbps	rpq	rkbpq	wpi	wkbpi	csps	cpups	cspq	cpupq	dbgb1	dbgb2	rss	maxop	p50	p99	tag
19878	181478	0	0.0	2218.3	73.8	0.000	0.000	0.112	3.804	1182016	54.4	6.513	144	41.7	143.8	43.7	0.034	9174	8471	ma100624_rel_withdbg.cz12a_c32r128
19873	182303	0	0.0	2216.7	74.0	0.000	0.000	0.112	3.811	1189045	54.4	6.522	143	41.7	143.9	43.7	0.036	9206	8487	ma100624_rel_withdbg.cz12a_cb_c32r128
19873	187500	0	0.0	2206.5	73.8	0.000	0.000	0.111	3.804	1122669	46.6	5.988	119	43.4	145.5	45.6	0.023	9465	8742	ma101115_rel_withdbg.cz12a_c32r128
19873	189635	0	0.0	2203.0	73.6	0.000	0.000	0.111	3.790	1107383	46.5	5.840	118	43.7	145.8	45.9	0.018	9590	8998	ma110409_rel_withdbg.cz12b_c32r128
19873	194947	2	0.1	2191.1	73.4	0.000	0.000	0.110	3.780	1137931	46.2	5.837	114	43.7	145.9	45.9	0.017	9861	9222	ma110805_rel_withdbg.cz12b_c32r128
19873	191702	0	0.0	2196.9	73.6	0.000	0.000	0.111	3.791	1120069	46.1	5.843	115	43.7	145.9	45.7	0.017	9653	8998	ma120102_rel_withdbg.cz12b_c32r128
19873	187805	0	0.0	2194.0	73.4	0.000	0.000	0.110	3.783	1097340	46.3	5.843	118	43.6	145.7	45.7	0.017	9478	8921	ma120201_rel_withdbg.cz12b_c32r128
l.i0
- l.i0: load without secondary indexes
- Legend for results is here.
- Each entry lists the percentage of responses that fit in that bucket (slower than max time for previous bucket, faster than min time for next bucket).
Insert response time histogram
256us	1ms	4ms	16ms	64ms	256ms	1s	4s	16s	gt	max	tag
0.000	1.255	2.465	96.189	0.009	0.082	0.000	0.000	0.000	0.000	0.209	ma100624_rel_withdbg.cz12a_c32r128
0.000	1.232	2.465	96.209	0.013	0.082	0.000	0.000	0.000	0.000	0.151	ma100624_rel_withdbg.cz12a_cb_c32r128
0.000	14.839	85.013	0.057	0.009	0.083	0.000	0.000	0.000	0.000	0.204	ma101115_rel_withdbg.cz12a_c32r128
0.000	18.133	81.696	0.075	0.015	0.081	0.000	0.000	0.000	0.000	0.201	ma110409_rel_withdbg.cz12b_c32r128
0.000	16.755	83.074	0.080	0.012	0.079	0.000	0.000	0.000	0.000	0.172	ma110805_rel_withdbg.cz12b_c32r128
0.000	17.157	82.675	0.075	0.010	0.083	0.000	0.000	0.000	0.000	0.202	ma120102_rel_withdbg.cz12b_c32r128
0.000	16.564	83.259	0.084	0.014	0.078	0.001	0.000	0.000	0.000	0.312	ma120201_rel_withdbg.cz12b_c32r128
l.x
- l.x: create secondary indexes
- Legend for results is here.
- Each entry lists the percentage of responses that fit in that bucket (slower than max time for previous bucket, faster than min time for next bucket).
TODO - determine whether there is data for create index response time
l.i1
- l.i1: continue load after secondary indexes created with 50 inserts per transaction
- Legend for results is here.
- Each entry lists the percentage of responses that fit in that bucket (slower than max time for previous bucket, faster than min time for next bucket).
Insert response time histogram
256us	1ms	4ms	16ms	64ms	256ms	1s	4s	16s	gt	max	tag
0.000	nonzero	0.104	82.588	17.085	0.223	0.000	0.000	0.000	0.000	0.248	ma100624_rel_withdbg.cz12a_c32r128
0.000	0.000	0.061	82.785	16.929	0.224	nonzero	0.000	0.000	0.000	0.267	ma100624_rel_withdbg.cz12a_cb_c32r128
0.000	nonzero	28.095	62.701	8.957	0.247	nonzero	0.000	0.000	0.000	0.305	ma101115_rel_withdbg.cz12a_c32r128
0.000	0.005	49.511	46.539	3.743	0.201	nonzero	0.000	0.000	0.000	0.413	ma110409_rel_withdbg.cz12b_c32r128
0.000	0.012	59.424	37.022	3.354	0.187	nonzero	0.000	0.000	0.000	0.510	ma110805_rel_withdbg.cz12b_c32r128
0.000	0.003	46.466	49.750	3.605	0.176	nonzero	0.000	0.000	0.000	0.425	ma120102_rel_withdbg.cz12b_c32r128
0.000	0.003	40.173	56.081	3.581	0.162	nonzero	0.000	0.000	0.000	0.454	ma120201_rel_withdbg.cz12b_c32r128
Delete response time histogram
256us	1ms	4ms	16ms	64ms	256ms	1s	4s	16s	gt	max	tag
0.000	nonzero	0.107	83.978	15.712	0.203	0.000	0.000	0.000	0.000	0.248	ma100624_rel_withdbg.cz12a_c32r128
0.000	nonzero	0.068	84.220	15.511	0.200	nonzero	0.000	0.000	0.000	0.258	ma100624_rel_withdbg.cz12a_cb_c32r128
0.000	0.067	29.115	61.684	8.893	0.241	nonzero	0.000	0.000	0.000	0.297	ma101115_rel_withdbg.cz12a_c32r128
0.000	0.070	40.233	55.579	3.908	0.209	0.001	0.000	0.000	0.000	0.413	ma110409_rel_withdbg.cz12b_c32r128
0.000	0.049	46.563	49.646	3.542	0.199	0.001	0.000	0.000	0.000	0.508	ma110805_rel_withdbg.cz12b_c32r128
0.000	0.018	37.832	58.184	3.783	0.183	nonzero	0.000	0.000	0.000	0.424	ma120102_rel_withdbg.cz12b_c32r128
0.000	0.013	28.877	67.071	3.867	0.171	nonzero	0.000	0.000	0.000	0.453	ma120201_rel_withdbg.cz12b_c32r128
l.i2
- l.i2: continue load after secondary indexes created with 5 inserts per transaction
- Legend for results is here.
- Each entry lists the percentage of responses that fit in that bucket (slower than max time for previous bucket, faster than min time for next bucket).
Insert response time histogram
256us	1ms	4ms	16ms	64ms	256ms	1s	4s	16s	gt	max	tag
0.009	2.208	92.656	5.017	0.100	0.010	0.000	0.000	0.000	0.000	0.169	ma100624_rel_withdbg.cz12a_c32r128
0.006	2.075	92.697	5.103	0.110	0.010	0.000	0.000	0.000	0.000	0.159	ma100624_rel_withdbg.cz12a_cb_c32r128
0.305	92.982	5.970	0.642	0.091	0.010	0.000	0.000	0.000	0.000	0.184	ma101115_rel_withdbg.cz12a_c32r128
0.304	91.470	8.137	0.054	0.025	0.010	0.000	0.000	0.000	0.000	0.189	ma110409_rel_withdbg.cz12b_c32r128
0.341	91.641	7.940	0.048	0.020	0.010	0.000	0.000	0.000	0.000	0.213	ma110805_rel_withdbg.cz12b_c32r128
0.238	91.196	8.473	0.062	0.021	0.010	0.000	0.000	0.000	0.000	0.168	ma120102_rel_withdbg.cz12b_c32r128
0.248	90.059	9.601	0.060	0.022	0.010	0.000	0.000	0.000	0.000	0.183	ma120201_rel_withdbg.cz12b_c32r128
Delete response time histogram
256us	1ms	4ms	16ms	64ms	256ms	1s	4s	16s	gt	max	tag
0.011	2.522	92.357	5.000	0.099	0.010	0.000	0.000	0.000	0.000	0.169	ma100624_rel_withdbg.cz12a_c32r128
0.006	2.462	92.329	5.084	0.109	0.010	0.000	0.000	0.000	0.000	0.159	ma100624_rel_withdbg.cz12a_cb_c32r128
0.412	93.378	5.473	0.637	0.090	0.010	0.000	0.000	0.000	0.000	0.184	ma101115_rel_withdbg.cz12a_c32r128
0.292	91.534	8.085	0.054	0.025	0.010	0.000	0.000	0.000	0.000	0.189	ma110409_rel_withdbg.cz12b_c32r128
0.312	91.648	7.962	0.049	0.020	0.010	0.000	0.000	0.000	0.000	0.213	ma110805_rel_withdbg.cz12b_c32r128
0.209	91.220	8.478	0.061	0.021	0.010	0.000	0.000	0.000	0.000	0.168	ma120102_rel_withdbg.cz12b_c32r128
0.203	89.996	9.709	0.060	0.022	0.010	0.000	0.000	0.000	0.000	0.183	ma120201_rel_withdbg.cz12b_c32r128
qr100.L1
- qr100.L1: range queries with 100 insert/s per client
- Legend for results is here.
- Each entry lists the percentage of responses that fit in that bucket (slower than max time for previous bucket, faster than min time for next bucket).
Query response time histogram
256us	1ms	4ms	16ms	64ms	256ms	1s	4s	16s	gt	max	tag
99.976	0.024	nonzero	nonzero	0.000	0.000	0.000	0.000	0.000	0.000	0.013	ma100624_rel_withdbg.cz12a_c32r128
99.974	0.025	nonzero	nonzero	0.000	0.000	0.000	0.000	0.000	0.000	0.013	ma100624_rel_withdbg.cz12a_cb_c32r128
99.993	0.005	0.002	nonzero	0.000	0.000	0.000	0.000	0.000	0.000	0.010	ma101115_rel_withdbg.cz12a_c32r128
99.995	0.003	0.002	nonzero	0.000	0.000	0.000	0.000	0.000	0.000	0.011	ma110409_rel_withdbg.cz12b_c32r128
99.995	0.003	0.002	nonzero	0.000	0.000	0.000	0.000	0.000	0.000	0.012	ma110805_rel_withdbg.cz12b_c32r128
99.995	0.003	0.002	nonzero	0.000	0.000	0.000	0.000	0.000	0.000	0.012	ma120102_rel_withdbg.cz12b_c32r128
99.994	0.004	0.002	nonzero	0.000	0.000	0.000	0.000	0.000	0.000	0.010	ma120201_rel_withdbg.cz12b_c32r128
Insert response time histogram
256us	1ms	4ms	16ms	64ms	256ms	1s	4s	16s	gt	max	tag
0.000	0.030	19.670	79.608	0.692	0.000	0.000	0.000	0.000	0.000	0.026	ma100624_rel_withdbg.cz12a_c32r128
0.000	0.000	8.097	90.817	1.085	0.000	0.000	0.000	0.000	0.000	0.029	ma100624_rel_withdbg.cz12a_cb_c32r128
0.000	0.054	99.886	0.060	0.000	0.000	0.000	0.000	0.000	0.000	0.009	ma101115_rel_withdbg.cz12a_c32r128
0.000	0.491	99.423	0.086	0.000	0.000	0.000	0.000	0.000	0.000	0.010	ma110409_rel_withdbg.cz12b_c32r128
0.000	2.022	97.948	0.031	0.000	0.000	0.000	0.000	0.000	0.000	0.007	ma110805_rel_withdbg.cz12b_c32r128
0.000	3.900	96.070	0.030	0.000	0.000	0.000	0.000	0.000	0.000	0.008	ma120102_rel_withdbg.cz12b_c32r128
0.000	2.101	97.854	0.045	0.000	0.000	0.000	0.000	0.000	0.000	0.008	ma120201_rel_withdbg.cz12b_c32r128
Delete response time histogram
256us	1ms	4ms	16ms	64ms	256ms	1s	4s	16s	gt	max	tag
0.000	1.866	20.646	76.993	0.495	0.000	0.000	0.000	0.000	0.000	0.024	ma100624_rel_withdbg.cz12a_c32r128
0.000	0.008	8.471	90.648	0.874	0.000	0.000	0.000	0.000	0.000	0.028	ma100624_rel_withdbg.cz12a_cb_c32r128
0.000	13.148	86.819	0.033	0.000	0.000	0.000	0.000	0.000	0.000	0.008	ma101115_rel_withdbg.cz12a_c32r128
0.000	12.842	87.120	0.037	0.000	0.000	0.000	0.000	0.000	0.000	0.011	ma110409_rel_withdbg.cz12b_c32r128
0.000	24.532	75.440	0.028	0.000	0.000	0.000	0.000	0.000	0.000	0.008	ma110805_rel_withdbg.cz12b_c32r128
0.000	30.441	69.547	0.013	0.000	0.000	0.000	0.000	0.000	0.000	0.007	ma120102_rel_withdbg.cz12b_c32r128
0.000	23.930	76.049	0.021	0.000	0.000	0.000	0.000	0.000	0.000	0.007	ma120201_rel_withdbg.cz12b_c32r128
qp100.L2
- qp100.L2: point queries with 100 insert/s per client
- Legend for results is here.
- Each entry lists the percentage of responses that fit in that bucket (slower than max time for previous bucket, faster than min time for next bucket).
Query response time histogram
256us	1ms	4ms	16ms	64ms	256ms	1s	4s	16s	gt	max	tag
99.977	0.022	nonzero	nonzero	0.000	0.000	0.000	0.000	0.000	0.000	0.010	ma100624_rel_withdbg.cz12a_c32r128
99.981	0.019	nonzero	nonzero	0.000	0.000	0.000	0.000	0.000	0.000	0.011	ma100624_rel_withdbg.cz12a_cb_c32r128
99.991	0.007	0.002	nonzero	0.000	0.000	0.000	0.000	0.000	0.000	0.010	ma101115_rel_withdbg.cz12a_c32r128
99.993	0.005	0.002	nonzero	0.000	0.000	0.000	0.000	0.000	0.000	0.011	ma110409_rel_withdbg.cz12b_c32r128
99.993	0.005	0.002	nonzero	0.000	0.000	0.000	0.000	0.000	0.000	0.012	ma110805_rel_withdbg.cz12b_c32r128
99.993	0.005	0.002	nonzero	0.000	0.000	0.000	0.000	0.000	0.000	0.012	ma120102_rel_withdbg.cz12b_c32r128
99.993	0.005	0.002	nonzero	0.000	0.000	0.000	0.000	0.000	0.000	0.010	ma120201_rel_withdbg.cz12b_c32r128
Insert response time histogram
256us	1ms	4ms	16ms	64ms	256ms	1s	4s	16s	gt	max	tag
0.000	0.000	44.800	55.092	0.108	0.000	0.000	0.000	0.000	0.000	0.022	ma100624_rel_withdbg.cz12a_c32r128
0.000	0.001	66.531	33.467	0.001	0.000	0.000	0.000	0.000	0.000	0.019	ma100624_rel_withdbg.cz12a_cb_c32r128
0.000	0.001	99.728	0.267	0.004	0.000	0.000	0.000	0.000	0.000	0.034	ma101115_rel_withdbg.cz12a_c32r128
0.000	0.140	99.585	0.274	0.001	0.000	0.000	0.000	0.000	0.000	0.017	ma110409_rel_withdbg.cz12b_c32r128
0.000	1.203	98.560	0.224	0.011	0.001	0.000	0.000	0.000	0.000	0.069	ma110805_rel_withdbg.cz12b_c32r128
0.000	3.843	95.969	0.169	0.017	0.002	0.000	0.000	0.000	0.000	0.098	ma120102_rel_withdbg.cz12b_c32r128
0.000	2.844	96.903	0.253	0.000	0.000	0.000	0.000	0.000	0.000	0.012	ma120201_rel_withdbg.cz12b_c32r128
Delete response time histogram
256us	1ms	4ms	16ms	64ms	256ms	1s	4s	16s	gt	max	tag
0.000	0.160	54.083	45.698	0.058	0.000	0.000	0.000	0.000	0.000	0.021	ma100624_rel_withdbg.cz12a_c32r128
0.000	1.474	74.044	24.482	0.001	0.000	0.000	0.000	0.000	0.000	0.016	ma100624_rel_withdbg.cz12a_cb_c32r128
0.000	15.751	84.049	0.199	0.002	0.000	0.000	0.000	0.000	0.000	0.031	ma101115_rel_withdbg.cz12a_c32r128
0.000	9.446	90.334	0.220	0.000	0.000	0.000	0.000	0.000	0.000	0.009	ma110409_rel_withdbg.cz12b_c32r128
0.000	19.312	80.519	0.165	0.003	0.001	0.000	0.000	0.000	0.000	0.083	ma110805_rel_withdbg.cz12b_c32r128
0.000	34.082	65.762	0.145	0.010	0.001	0.000	0.000	0.000	0.000	0.076	ma120102_rel_withdbg.cz12b_c32r128
0.000	25.777	74.015	0.208	0.000	0.000	0.000	0.000	0.000	0.000	0.009	ma120201_rel_withdbg.cz12b_c32r128
qr500.L3
- qr500.L3: range queries with 500 insert/s per client
- Legend for results is here.
- Each entry lists the percentage of responses that fit in that bucket (slower than max time for previous bucket, faster than min time for next bucket).
Query response time histogram
256us	1ms	4ms	16ms	64ms	256ms	1s	4s	16s	gt	max	tag
99.910	0.087	0.003	nonzero	nonzero	0.000	0.000	0.000	0.000	0.000	0.017	ma100624_rel_withdbg.cz12a_c32r128
99.900	0.097	0.003	nonzero	nonzero	0.000	0.000	0.000	0.000	0.000	0.035	ma100624_rel_withdbg.cz12a_cb_c32r128
99.978	0.014	0.008	nonzero	nonzero	0.000	0.000	0.000	0.000	0.000	0.026	ma101115_rel_withdbg.cz12a_c32r128
99.983	0.009	0.008	nonzero	0.000	0.000	0.000	0.000	0.000	0.000	0.015	ma110409_rel_withdbg.cz12b_c32r128
99.983	0.009	0.008	nonzero	nonzero	0.000	0.000	0.000	0.000	0.000	0.063	ma110805_rel_withdbg.cz12b_c32r128
99.982	0.010	0.007	nonzero	nonzero	nonzero	0.000	0.000	0.000	0.000	0.075	ma120102_rel_withdbg.cz12b_c32r128
99.981	0.010	0.008	nonzero	nonzero	0.000	0.000	0.000	0.000	0.000	0.018	ma120201_rel_withdbg.cz12b_c32r128
Insert response time histogram
256us	1ms	4ms	16ms	64ms	256ms	1s	4s	16s	gt	max	tag
0.000	0.004	10.842	87.680	1.474	0.000	0.000	0.000	0.000	0.000	0.047	ma100624_rel_withdbg.cz12a_c32r128
0.000	0.006	9.293	86.901	3.800	0.000	0.000	0.000	0.000	0.000	0.046	ma100624_rel_withdbg.cz12a_cb_c32r128
0.000	0.264	97.090	2.633	0.013	0.000	0.000	0.000	0.000	0.000	0.038	ma101115_rel_withdbg.cz12a_c32r128
0.000	0.608	97.224	2.166	0.002	0.000	0.000	0.000	0.000	0.000	0.023	ma110409_rel_withdbg.cz12b_c32r128
0.000	2.467	95.510	1.952	0.069	0.002	0.000	0.000	0.000	0.000	0.085	ma110805_rel_withdbg.cz12b_c32r128
0.000	5.474	93.113	1.339	0.069	0.005	0.000	0.000	0.000	0.000	0.083	ma120102_rel_withdbg.cz12b_c32r128
0.000	2.117	96.298	1.582	0.002	0.000	0.000	0.000	0.000	0.000	0.027	ma120201_rel_withdbg.cz12b_c32r128
Delete response time histogram
256us	1ms	4ms	16ms	64ms	256ms	1s	4s	16s	gt	max	tag
0.000	0.067	11.975	87.035	0.924	0.000	0.000	0.000	0.000	0.000	0.042	ma100624_rel_withdbg.cz12a_c32r128
0.000	0.075	9.979	87.329	2.618	0.000	0.000	0.000	0.000	0.000	0.044	ma100624_rel_withdbg.cz12a_cb_c32r128
0.000	16.229	81.962	1.801	0.008	0.000	0.000	0.000	0.000	0.000	0.037	ma101115_rel_withdbg.cz12a_c32r128
0.000	12.870	85.432	1.697	0.001	0.000	0.000	0.000	0.000	0.000	0.023	ma110409_rel_withdbg.cz12b_c32r128
0.000	25.390	73.074	1.494	0.041	0.001	0.000	0.000	0.000	0.000	0.081	ma110805_rel_withdbg.cz12b_c32r128
0.000	35.184	63.761	1.011	0.042	0.002	0.000	0.000	0.000	0.000	0.077	ma120102_rel_withdbg.cz12b_c32r128
0.000	22.054	76.769	1.175	0.002	0.000	0.000	0.000	0.000	0.000	0.027	ma120201_rel_withdbg.cz12b_c32r128
qp500.L4
- qp500.L4: point queries with 500 insert/s per client
- Legend for results is here.
- Each entry lists the percentage of responses that fit in that bucket (slower than max time for previous bucket, faster than min time for next bucket).
Query response time histogram
256us	1ms	4ms	16ms	64ms	256ms	1s	4s	16s	gt	max	tag
99.900	0.097	0.003	nonzero	nonzero	0.000	0.000	0.000	0.000	0.000	0.020	ma100624_rel_withdbg.cz12a_c32r128
99.886	0.110	0.003	nonzero	0.000	0.000	0.000	0.000	0.000	0.000	0.015	ma100624_rel_withdbg.cz12a_cb_c32r128
99.960	0.032	0.008	nonzero	0.000	0.000	0.000	0.000	0.000	0.000	0.008	ma101115_rel_withdbg.cz12a_c32r128
99.973	0.019	0.008	nonzero	0.000	0.000	0.000	0.000	0.000	0.000	0.015	ma110409_rel_withdbg.cz12b_c32r128
99.975	0.017	0.008	nonzero	0.000	0.000	0.000	0.000	0.000	0.000	0.016	ma110805_rel_withdbg.cz12b_c32r128
99.974	0.018	0.007	nonzero	nonzero	0.000	0.000	0.000	0.000	0.000	0.017	ma120102_rel_withdbg.cz12b_c32r128
99.972	0.020	0.008	nonzero	0.000	0.000	0.000	0.000	0.000	0.000	0.014	ma120201_rel_withdbg.cz12b_c32r128
Insert response time histogram
256us	1ms	4ms	16ms	64ms	256ms	1s	4s	16s	gt	max	tag
0.000	0.003	10.039	88.854	1.105	0.000	0.000	0.000	0.000	0.000	0.048	ma100624_rel_withdbg.cz12a_c32r128
0.000	0.005	8.207	89.596	2.192	0.000	0.000	0.000	0.000	0.000	0.041	ma100624_rel_withdbg.cz12a_cb_c32r128
0.000	0.126	94.478	5.386	0.011	0.000	0.000	0.000	0.000	0.000	0.037	ma101115_rel_withdbg.cz12a_c32r128
0.000	0.585	96.707	2.703	0.005	0.000	0.000	0.000	0.000	0.000	0.027	ma110409_rel_withdbg.cz12b_c32r128
0.000	1.106	96.638	2.193	0.063	nonzero	0.000	0.000	0.000	0.000	0.070	ma110805_rel_withdbg.cz12b_c32r128
0.000	1.967	95.870	2.100	0.063	0.000	0.000	0.000	0.000	0.000	0.062	ma120102_rel_withdbg.cz12b_c32r128
0.000	1.494	95.335	3.166	0.005	0.000	0.000	0.000	0.000	0.000	0.028	ma120201_rel_withdbg.cz12b_c32r128
Delete response time histogram
256us	1ms	4ms	16ms	64ms	256ms	1s	4s	16s	gt	max	tag
0.000	0.075	11.113	88.203	0.609	0.000	0.000	0.000	0.000	0.000	0.043	ma100624_rel_withdbg.cz12a_c32r128
0.000	0.064	8.853	89.823	1.259	0.000	0.000	0.000	0.000	0.000	0.033	ma100624_rel_withdbg.cz12a_cb_c32r128
0.000	3.919	93.166	2.909	0.006	0.000	0.000	0.000	0.000	0.000	0.035	ma101115_rel_withdbg.cz12a_c32r128
0.000	6.410	91.555	2.030	0.004	0.000	0.000	0.000	0.000	0.000	0.027	ma110409_rel_withdbg.cz12b_c32r128
0.000	11.342	87.000	1.615	0.043	nonzero	0.000	0.000	0.000	0.000	0.079	ma110805_rel_withdbg.cz12b_c32r128
0.000	14.854	83.539	1.575	0.031	0.000	0.000	0.000	0.000	0.000	0.055	ma120102_rel_withdbg.cz12b_c32r128
0.000	13.504	84.033	2.458	0.004	0.000	0.000	0.000	0.000	0.000	0.030	ma120201_rel_withdbg.cz12b_c32r128
qr1000.L5
- qr1000.L5: range queries with 1000 insert/s per client
- Legend for results is here.
- Each entry lists the percentage of responses that fit in that bucket (slower than max time for previous bucket, faster than min time for next bucket).
Query response time histogram
256us	1ms	4ms	16ms	64ms	256ms	1s	4s	16s	gt	max	tag
99.720	0.275	0.005	nonzero	nonzero	0.000	0.000	0.000	0.000	0.000	0.030	ma100624_rel_withdbg.cz12a_c32r128
99.728	0.267	0.005	nonzero	nonzero	0.000	0.000	0.000	0.000	0.000	0.030	ma100624_rel_withdbg.cz12a_cb_c32r128
99.927	0.049	0.023	0.001	nonzero	0.000	0.000	0.000	0.000	0.000	0.040	ma101115_rel_withdbg.cz12a_c32r128
99.938	0.037	0.024	0.001	nonzero	0.000	0.000	0.000	0.000	0.000	0.022	ma110409_rel_withdbg.cz12b_c32r128
99.935	0.039	0.025	0.001	nonzero	0.000	0.000	0.000	0.000	0.000	0.043	ma110805_rel_withdbg.cz12b_c32r128
99.933	0.040	0.026	0.001	nonzero	0.000	0.000	0.000	0.000	0.000	0.059	ma120102_rel_withdbg.cz12b_c32r128
99.927	0.044	0.027	0.001	nonzero	0.000	0.000	0.000	0.000	0.000	0.038	ma120201_rel_withdbg.cz12b_c32r128
Insert response time histogram
256us	1ms	4ms	16ms	64ms	256ms	1s	4s	16s	gt	max	tag
0.000	0.002	2.982	90.527	6.488	nonzero	0.000	0.000	0.000	0.000	0.068	ma100624_rel_withdbg.cz12a_c32r128
0.000	0.002	2.988	90.964	6.046	nonzero	0.000	0.000	0.000	0.000	0.064	ma100624_rel_withdbg.cz12a_cb_c32r128
0.000	0.799	80.354	18.787	0.060	0.000	0.000	0.000	0.000	0.000	0.051	ma101115_rel_withdbg.cz12a_c32r128
0.000	1.555	81.364	17.018	0.063	0.000	0.000	0.000	0.000	0.000	0.051	ma110409_rel_withdbg.cz12b_c32r128
0.000	1.101	81.162	17.655	0.081	0.000	0.000	0.000	0.000	0.000	0.060	ma110805_rel_withdbg.cz12b_c32r128
0.000	1.190	81.464	17.264	0.083	0.000	0.000	0.000	0.000	0.000	0.062	ma120102_rel_withdbg.cz12b_c32r128
0.000	0.963	80.101	18.865	0.071	0.000	0.000	0.000	0.000	0.000	0.053	ma120201_rel_withdbg.cz12b_c32r128
Delete response time histogram
256us	1ms	4ms	16ms	64ms	256ms	1s	4s	16s	gt	max	tag
0.000	0.024	2.119	93.988	3.869	nonzero	0.000	0.000	0.000	0.000	0.067	ma100624_rel_withdbg.cz12a_c32r128
0.000	0.018	1.956	94.594	3.432	0.000	0.000	0.000	0.000	0.000	0.054	ma100624_rel_withdbg.cz12a_cb_c32r128
0.000	3.598	80.874	15.475	0.053	0.000	0.000	0.000	0.000	0.000	0.051	ma101115_rel_withdbg.cz12a_c32r128
0.000	3.895	80.085	15.963	0.057	0.000	0.000	0.000	0.000	0.000	0.051	ma110409_rel_withdbg.cz12b_c32r128
0.000	2.660	80.401	16.867	0.071	0.000	0.000	0.000	0.000	0.000	0.054	ma110805_rel_withdbg.cz12b_c32r128
0.000	3.139	80.428	16.361	0.072	0.000	0.000	0.000	0.000	0.000	0.062	ma120102_rel_withdbg.cz12b_c32r128
0.000	2.233	79.536	18.163	0.068	0.000	0.000	0.000	0.000	0.000	0.051	ma120201_rel_withdbg.cz12b_c32r128
qp1000.L6
- qp1000.L6: point queries with 1000 insert/s per client
- Legend for results is here.
- Each entry lists the percentage of responses that fit in that bucket (slower than max time for previous bucket, faster than min time for next bucket).
Query response time histogram
256us	1ms	4ms	16ms	64ms	256ms	1s	4s	16s	gt	max	tag
99.684	0.309	0.006	nonzero	nonzero	0.000	0.000	0.000	0.000	0.000	0.034	ma100624_rel_withdbg.cz12a_c32r128
99.676	0.317	0.006	nonzero	nonzero	0.000	0.000	0.000	0.000	0.000	0.036	ma100624_rel_withdbg.cz12a_cb_c32r128
99.841	0.147	0.012	nonzero	nonzero	0.000	0.000	0.000	0.000	0.000	0.023	ma101115_rel_withdbg.cz12a_c32r128
99.874	0.109	0.016	0.001	nonzero	0.000	0.000	0.000	0.000	0.000	0.018	ma110409_rel_withdbg.cz12b_c32r128
99.892	0.093	0.015	0.001	nonzero	0.000	0.000	0.000	0.000	0.000	0.017	ma110805_rel_withdbg.cz12b_c32r128
99.875	0.109	0.015	nonzero	nonzero	0.000	0.000	0.000	0.000	0.000	0.017	ma120102_rel_withdbg.cz12b_c32r128
99.881	0.103	0.015	0.001	nonzero	0.000	0.000	0.000	0.000	0.000	0.017	ma120201_rel_withdbg.cz12b_c32r128
Insert response time histogram
256us	1ms	4ms	16ms	64ms	256ms	1s	4s	16s	gt	max	tag
0.000	0.003	3.040	90.611	6.345	0.000	0.000	0.000	0.000	0.000	0.053	ma100624_rel_withdbg.cz12a_c32r128
0.000	0.003	3.105	90.317	6.574	0.001	0.000	0.000	0.000	0.000	0.070	ma100624_rel_withdbg.cz12a_cb_c32r128
0.000	0.041	74.903	24.993	0.063	0.000	0.000	0.000	0.000	0.000	0.056	ma101115_rel_withdbg.cz12a_c32r128
0.000	0.122	80.198	19.612	0.068	0.000	0.000	0.000	0.000	0.000	0.053	ma110409_rel_withdbg.cz12b_c32r128
0.000	3.496	81.048	15.398	0.058	0.000	0.000	0.000	0.000	0.000	0.053	ma110805_rel_withdbg.cz12b_c32r128
0.000	0.434	80.535	18.966	0.065	0.000	0.000	0.000	0.000	0.000	0.064	ma120102_rel_withdbg.cz12b_c32r128
0.000	3.806	79.263	16.871	0.060	0.000	0.000	0.000	0.000	0.000	0.057	ma120201_rel_withdbg.cz12b_c32r128
Delete response time histogram
256us	1ms	4ms	16ms	64ms	256ms	1s	4s	16s	gt	max	tag
0.000	0.026	2.145	94.211	3.618	0.000	0.000	0.000	0.000	0.000	0.060	ma100624_rel_withdbg.cz12a_c32r128
0.000	0.026	2.216	94.188	3.569	0.001	0.000	0.000	0.000	0.000	0.069	ma100624_rel_withdbg.cz12a_cb_c32r128
0.000	0.149	85.328	14.472	0.051	0.000	0.000	0.000	0.000	0.000	0.060	ma101115_rel_withdbg.cz12a_c32r128
0.000	0.410	81.991	17.538	0.062	0.000	0.000	0.000	0.000	0.000	0.044	ma110409_rel_withdbg.cz12b_c32r128
0.000	6.841	79.180	13.927	0.052	0.000	0.000	0.000	0.000	0.000	0.052	ma110805_rel_withdbg.cz12b_c32r128
0.000	0.827	82.057	17.056	0.060	0.000	0.000	0.000	0.000	0.000	0.063	ma120102_rel_withdbg.cz12b_c32r128
0.000	6.258	78.349	15.336	0.057	0.000	0.000	0.000	0.000	0.000	0.058	ma120201_rel_withdbg.cz12b_c32r128