Introduction
This is a report for the insert benchmark with 120M docs and 12 client(s). It is generated by scripts (bash, awk, sed) and Tufte might not be impressed. An overview of the insert benchmark is here and a short update is here. Below, by DBMS, I mean DBMS+version.config. An example is my8020.c10b40 where my means MySQL, 8020 is version 8.0.20 and c10b40 is the name for the configuration file.
The test server has 32 cores, 128G RAM and 1 NVMe devices. The benchmark was run with 8 clients and there were 1 or 3 connections per client (1 for queries or inserts without rate limits, 1+1 for rate limited inserts+deletes). It uses 8 tables with a table per client. It loads 10M rows per table without secondary indexes, creates 3 secondary indexes per table, then inserts 16m+4m rows per table with a delete per insert to avoid growing the table. It then does 6 read+write tests for 1800s each that do queries as fast as possible with 100,100,500,500,1000,1000 inserts/s and the same for deletes/s per client concurrent with the queries. The database is cached. Clients and the DBMS share one server.
The tested DBMS are:
- pg1222_o2nofp.cx10a_c32r128 - Postgres 12.22 with the cx10a_c32r128 config
- pg1323_o2nofp.cx10a_c32r128 - Postgres 13.23 with the cx10a_c32r128 config
- pg1420_o2nofp.cx10a_c32r128 - Postgres 14.20 with the cx10a_c32r128 config
- pg1515_o2nofp.cx10a_c32r128 - Postgres 15.15 with the cx10a_c32r128 config
- pg1611_o2nofp.cx10a_c32r128 - Postgres 16.11 with the cx10a_c32r128 config
- pg177_o2nofp.cx10a_c32r128 - Postgres 17.7 with the cx10a_c32r128 config
- pg181_o2nofp.cx10b_c32r128 - Postgres 18.1 with the cx10b_c32r128 config that uses io_method=sync
- pg181_o2nofp.cx10b_walsize_c32r128 - Postgres 18.1 with the cx10b_walsize_c32r128 config that uses io_method=sync and adds min_wal_size == max_wal_size
- pg181_o2nofp.cx10b_walsize8G_c32r128 - Postgres 18.1 with the cx10b_walsize_c32r128 config that uses io_method=sync and sets min_wal_size and max_wal_size to 8G
Contents
- Summary
- l.i0: load without secondary indexes
- l.x: create secondary indexes
- l.i1: continue load after secondary indexes created with 50 inserts per transaction
- l.i2: continue load after secondary indexes created with 5 inserts per transaction
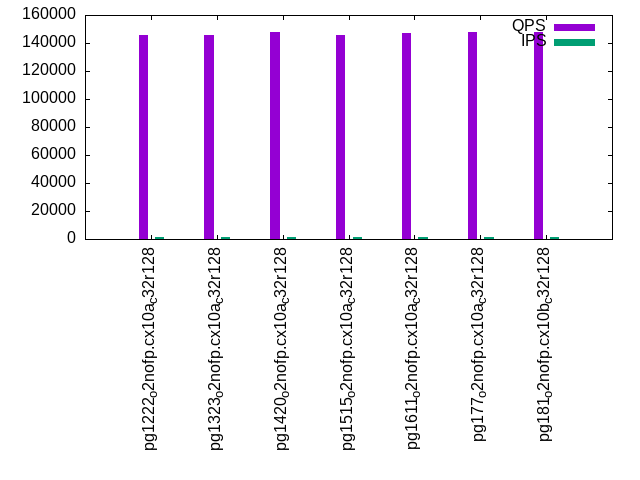
- qr100.L1: range queries with 100 insert/s per client
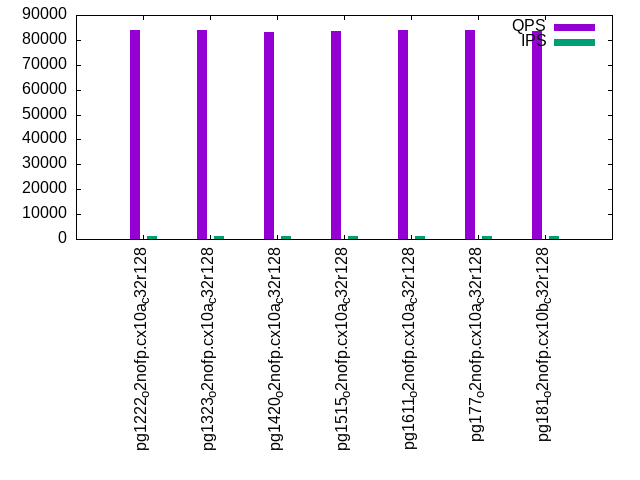
- qp100.L2: point queries with 100 insert/s per client
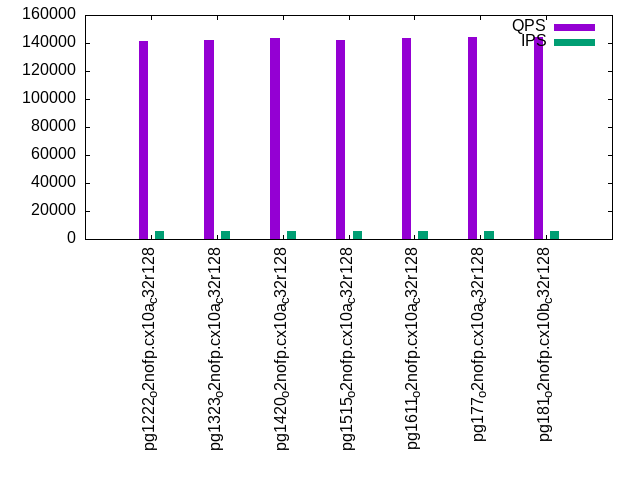
- qr500.L3: range queries with 500 insert/s per client
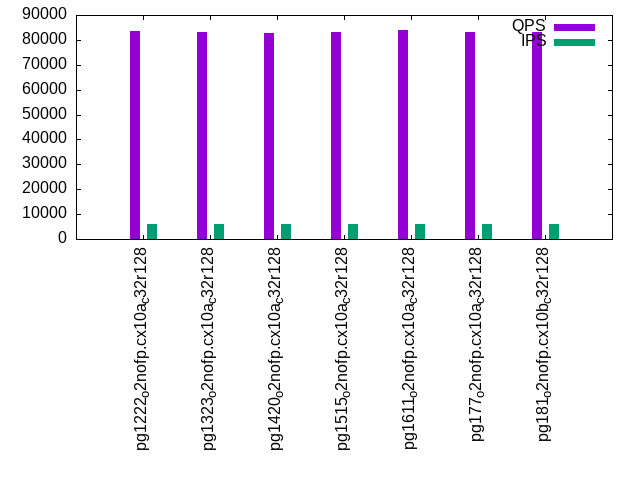
- qp500.L4: point queries with 500 insert/s per client
- qr1000.L5: range queries with 1000 insert/s per client
- qp1000.L6: point queries with 1000 insert/s per client
Summary
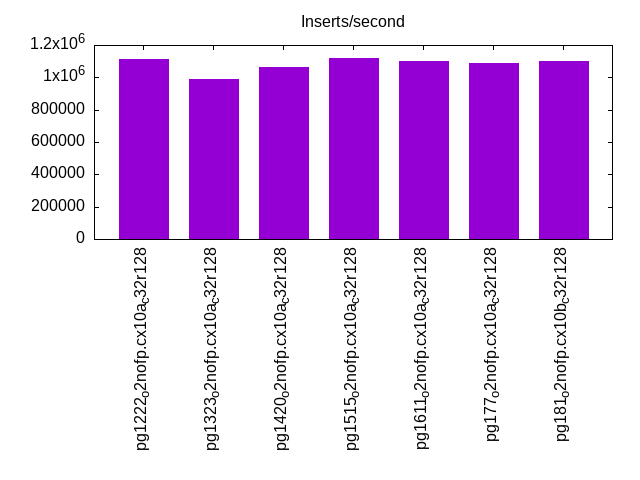
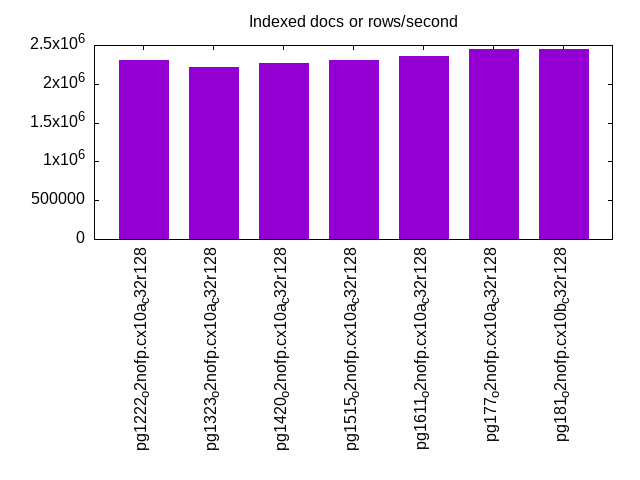
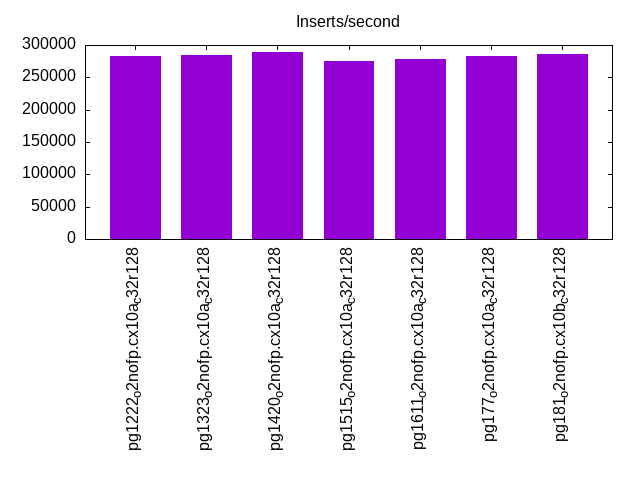
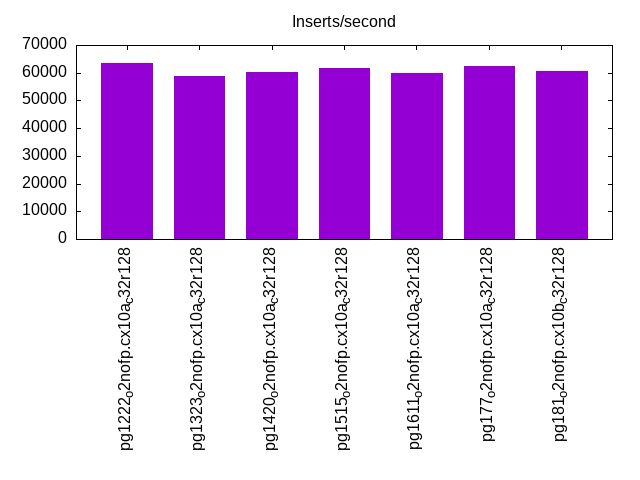
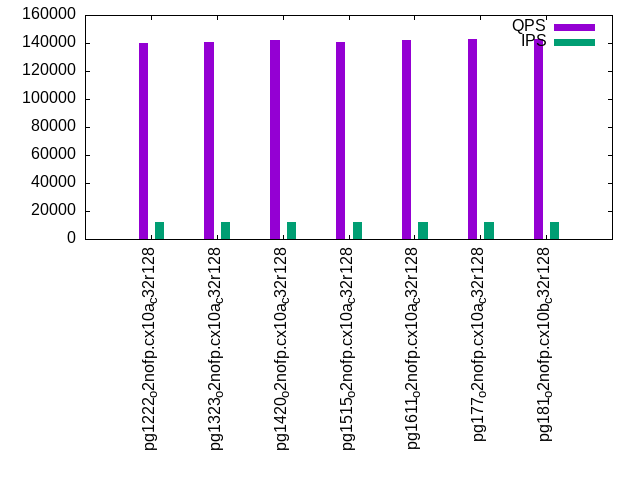
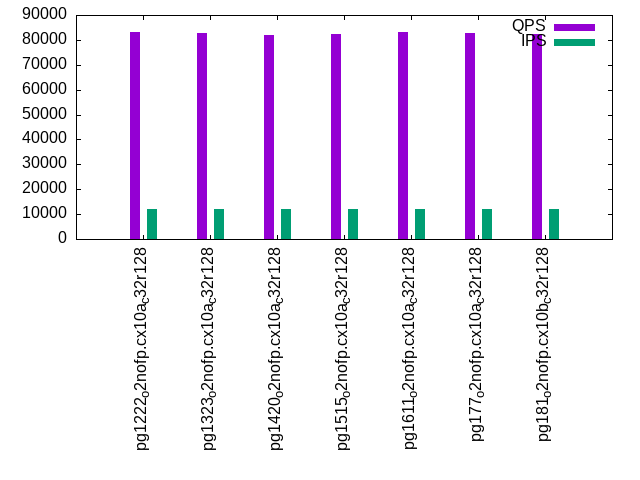
The numbers are inserts/s for l.i0, l.i1 and l.i2, indexed docs (or rows) /s for l.x and queries/s for qr100, qp100 thru qr1000, qp1000" The values are the average rate over the entire test for inserts (IPS) and queries (QPS). The range of values for IPS and QPS is split into 3 parts: bottom 25%, middle 50%, top 25%. Values in the bottom 25% have a red background, values in the top 25% have a green background and values in the middle have no color. A gray background is used for values that can be ignored because the DBMS did not sustain the target insert rate. Red backgrounds are not used when the minimum value is within 80% of the max value.
| dbms | l.i0 | l.x | l.i1 | l.i2 | qr100 | qp100 | qr500 | qp500 | qr1000 | qp1000 |
|---|---|---|---|---|---|---|---|---|---|---|
| pg1222_o2nofp.cx10a_c32r128 | 1111111 | 2307694 | 283604 | 63660 | 145403 | 84167 | 141614 | 83672 | 140003 | 83116 |
| pg1323_o2nofp.cx10a_c32r128 | 991736 | 2222224 | 284024 | 58896 | 145900 | 83804 | 142306 | 83248 | 140701 | 82771 |
| pg1420_o2nofp.cx10a_c32r128 | 1061947 | 2264153 | 288722 | 60226 | 147709 | 83017 | 143579 | 82785 | 142100 | 82164 |
| pg1515_o2nofp.cx10a_c32r128 | 1121495 | 2307694 | 275862 | 61856 | 145769 | 83422 | 141957 | 83123 | 140543 | 82480 |
| pg1611_o2nofp.cx10a_c32r128 | 1100917 | 2352943 | 278665 | 59776 | 147343 | 83928 | 143416 | 83798 | 142041 | 83029 |
| pg177_o2nofp.cx10a_c32r128 | 1090909 | 2448982 | 282353 | 62419 | 147861 | 83776 | 144168 | 83214 | 142705 | 82601 |
| pg181_o2nofp.cx10b_c32r128 | 1100917 | 2448982 | 286140 | 60759 | 147902 | 83614 | 144498 | 83212 | 142783 | 82561 |
| pg181_o2nofp.cx10b_walsize_c32r128 | 937500 | 2033900 | 231604 | 59480 | 146096 | 83630 | 142192 | 83022 | 141182 | 82257 |
| pg181_o2nofp.cx10b_walsize16G_c32r128 | 1081081 | 2926832 | 249351 | 71217 | 147078 | 83619 | 144881 | 83089 | 143163 | 82442 |
This table has relative throughput, throughput for the DBMS relative to the DBMS in the first line, using the absolute throughput from the previous table. Values less than 0.95 have a yellow background. Values greater than 1.05 have a blue background.
| dbms | l.i0 | l.x | l.i1 | l.i2 | qr100 | qp100 | qr500 | qp500 | qr1000 | qp1000 |
|---|---|---|---|---|---|---|---|---|---|---|
| pg1222_o2nofp.cx10a_c32r128 | 1.00 | 1.00 | 1.00 | 1.00 | 1.00 | 1.00 | 1.00 | 1.00 | 1.00 | 1.00 |
| pg1323_o2nofp.cx10a_c32r128 | 0.89 | 0.96 | 1.00 | 0.93 | 1.00 | 1.00 | 1.00 | 0.99 | 1.00 | 1.00 |
| pg1420_o2nofp.cx10a_c32r128 | 0.96 | 0.98 | 1.02 | 0.95 | 1.02 | 0.99 | 1.01 | 0.99 | 1.01 | 0.99 |
| pg1515_o2nofp.cx10a_c32r128 | 1.01 | 1.00 | 0.97 | 0.97 | 1.00 | 0.99 | 1.00 | 0.99 | 1.00 | 0.99 |
| pg1611_o2nofp.cx10a_c32r128 | 0.99 | 1.02 | 0.98 | 0.94 | 1.01 | 1.00 | 1.01 | 1.00 | 1.01 | 1.00 |
| pg177_o2nofp.cx10a_c32r128 | 0.98 | 1.06 | 1.00 | 0.98 | 1.02 | 1.00 | 1.02 | 0.99 | 1.02 | 0.99 |
| pg181_o2nofp.cx10b_c32r128 | 0.99 | 1.06 | 1.01 | 0.95 | 1.02 | 0.99 | 1.02 | 0.99 | 1.02 | 0.99 |
| pg181_o2nofp.cx10b_walsize_c32r128 | 0.84 | 0.88 | 0.82 | 0.93 | 1.00 | 0.99 | 1.00 | 0.99 | 1.01 | 0.99 |
| pg181_o2nofp.cx10b_walsize16G_c32r128 | 0.97 | 1.27 | 0.88 | 1.12 | 1.01 | 0.99 | 1.02 | 0.99 | 1.02 | 0.99 |
This lists the average rate of inserts/s for the tests that do inserts concurrent with queries. For such tests the query rate is listed in the table above. The read+write tests are setup so that the insert rate should match the target rate every second. Cells that are not at least 95% of the target have a red background to indicate a failure to satisfy the target.
| dbms | qr100.L1 | qp100.L2 | qr500.L3 | qp500.L4 | qr1000.L5 | qp1000.L6 |
|---|---|---|---|---|---|---|
| pg1222_o2nofp.cx10a_c32r128 | 1193 | 1193 | 5964 | 5960 | 11920 | 11920 |
| pg1323_o2nofp.cx10a_c32r128 | 1192 | 1192 | 5960 | 5960 | 11920 | 11927 |
| pg1420_o2nofp.cx10a_c32r128 | 1193 | 1193 | 5964 | 5964 | 11920 | 11920 |
| pg1515_o2nofp.cx10a_c32r128 | 1192 | 1192 | 5960 | 5960 | 11920 | 11927 |
| pg1611_o2nofp.cx10a_c32r128 | 1192 | 1192 | 5964 | 5964 | 11927 | 11927 |
| pg177_o2nofp.cx10a_c32r128 | 1193 | 1193 | 5964 | 5964 | 11927 | 11920 |
| pg181_o2nofp.cx10b_c32r128 | 1192 | 1192 | 5964 | 5964 | 11927 | 11927 |
| pg181_o2nofp.cx10b_walsize_c32r128 | 1192 | 1192 | 5960 | 5964 | 11927 | 11927 |
| pg181_o2nofp.cx10b_walsize16G_c32r128 | 1192 | 1193 | 5964 | 5964 | 11927 | 11920 |
| target | 1200 | 1200 | 6000 | 6000 | 12000 | 12000 |
l.i0
l.i0: load without secondary indexes. Graphs for performance per 1-second interval are here.
Average throughput:
Insert response time histogram: each cell has the percentage of responses that take <= the time in the header and max is the max response time in seconds. For the max column values in the top 25% of the range have a red background and in the bottom 25% of the range have a green background. The red background is not used when the min value is within 80% of the max value.
| dbms | 256us | 1ms | 4ms | 16ms | 64ms | 256ms | 1s | 4s | 16s | gt | max |
|---|---|---|---|---|---|---|---|---|---|---|---|
| pg1222_o2nofp.cx10a_c32r128 | 99.191 | 0.807 | 0.001 | 0.006 | |||||||
| pg1323_o2nofp.cx10a_c32r128 | 99.056 | 0.880 | 0.006 | 0.012 | 0.022 | 0.022 | 0.001 | 2.080 | |||
| pg1420_o2nofp.cx10a_c32r128 | 98.457 | 1.542 | 0.001 | 0.006 | |||||||
| pg1515_o2nofp.cx10a_c32r128 | 99.075 | 0.921 | 0.004 | 0.009 | |||||||
| pg1611_o2nofp.cx10a_c32r128 | 99.062 | 0.936 | 0.002 | 0.005 | |||||||
| pg177_o2nofp.cx10a_c32r128 | 98.977 | 1.021 | 0.002 | 0.005 | |||||||
| pg181_o2nofp.cx10b_c32r128 | 98.914 | 1.082 | 0.004 | 0.005 | |||||||
| pg181_o2nofp.cx10b_walsize_c32r128 | 98.840 | 1.084 | 0.011 | 0.014 | 0.025 | 0.024 | 0.003 | 2.119 | |||
| pg181_o2nofp.cx10b_walsize16G_c32r128 | 98.859 | 1.083 | 0.038 | 0.020 | 0.032 |
Performance metrics for the DBMS listed above. Some are normalized by throughput, others are not. Legend for results is here.
ips	qps	rps	rmbps	wps	wmbps	rpq	rkbpq	wpi	wkbpi	csps	cpups	cspq	cpupq	dbgb1	dbgb2	rss	maxop	p50	p99	tag
1111111	0	0	0.0	4029.0	466.5	0.000	0.000	0.004	0.430	122298	48.1	0.110	14	11.5	31.0	5.4	0.006	114287	106988	pg1222_o2nofp.cx10a_c32r128
991736	0	1	0.0	3643.5	422.8	0.000	0.000	0.004	0.437	109430	43.5	0.110	14	11.5	31.1	3.3	2.080	114188	7799	pg1323_o2nofp.cx10a_c32r128
1061947	0	1	0.0	3855.6	444.9	0.000	0.000	0.004	0.429	119093	48.0	0.112	14	11.5	31.1	7.7	0.006	109786	105588	pg1420_o2nofp.cx10a_c32r128
1121495	0	1	0.0	4048.4	468.1	0.000	0.000	0.004	0.427	123418	48.8	0.110	14	11.5	31.1	1.5	0.009	114586	107287	pg1515_o2nofp.cx10a_c32r128
1100917	0	1	0.0	4040.8	467.3	0.000	0.000	0.004	0.435	122999	48.7	0.112	14	11.5	31.1	1.5	0.005	114186	107688	pg1611_o2nofp.cx10a_c32r128
1090909	0	1	0.0	3944.7	455.5	0.000	0.000	0.004	0.428	111362	47.1	0.102	14	11.5	31.1	0.2	0.005	113687	108587	pg177_o2nofp.cx10a_c32r128
1100917	0	2	0.0	3933.7	454.1	0.000	0.000	0.004	0.422	110935	47.3	0.101	14	11.5	31.1	0.2	0.005	112987	106487	pg181_o2nofp.cx10b_c32r128
937500	0	1	0.0	3540.6	410.3	0.000	0.000	0.004	0.448	98729	42.1	0.105	14	11.5	31.1	0.6	2.119	112187	0	pg181_o2nofp.cx10b_walsize_c32r128
1081081	0	1	0.0	4258.0	490.8	0.000	0.000	0.004	0.465	110404	47.4	0.102	14	11.5	27.5	0.2	0.032	113087	94488	pg181_o2nofp.cx10b_walsize16G_c32r128
Average values from iostat.
r/s	rkB/s	rrqm/s	%rrqm	r_await	rareq-s	w/s	wkB/s	wrqm/s	%wrqm	w_await	wareq-s	d/s	dkB/s	drqm/s	%drqm	d_await	dareq-s	f/s	f_await	aqu-sz	%util
0.000	0.000	0.000	0.000	0.000	0.000	4029.0	477691	521.6	11.46	0.382	117.5	5.724	58.02	0.000	0.000	1.236	8.587	175.5	0.414	1.721	22.62		pg1222_o2nofp.cx10a_c32r128
0.592	2.367	0.000	0.000	0.199	3.167	3643.5	432907	466.1	11.15	5.560	118.1	5.600	68.19	0.000	0.000	6.125	9.808	152.4	1.065	11.00	32.82		pg1323_o2nofp.cx10a_c32r128
0.555	2.218	0.000	0.000	0.242	3.273	3855.6	455614	519.0	11.55	0.381	117.1	5.700	55.85	0.000	0.000	1.260	8.591	176.0	0.416	1.635	22.12		pg1420_o2nofp.cx10a_c32r128
1.305	5.219	0.000	0.000	0.289	3.810	4048.4	479380	516.7	11.29	0.374	117.3	1.000	15.12	0.000	0.000	0.902	13.29	182.1	0.414	1.683	22.54		pg1515_o2nofp.cx10a_c32r128
1.181	4.724	0.000	0.000	0.312	3.619	4040.8	478467	516.5	11.36	0.369	117.2	0.943	21.26	0.000	0.000	0.868	21.01	182.2	0.414	1.655	22.58		pg1611_o2nofp.cx10a_c32r128
1.300	5.199	0.000	0.000	0.316	3.636	3944.7	466427	470.1	10.29	0.360	117.3	0.690	9.633	0.000	0.000	0.830	11.72	171.4	0.409	1.568	21.79		pg177_o2nofp.cx10a_c32r128
1.663	6.654	0.000	0.000	0.248	3.636	3933.7	465046	500.8	10.99	0.357	117.3	0.590	18.38	0.000	0.000	0.806	17.49	172.6	0.410	1.543	21.75		pg181_o2nofp.cx10b_c32r128
0.952	3.808	0.000	0.000	1.917	3.520	3540.6	420105	433.8	10.50	8.565	118.1	0.896	20.77	0.000	0.000	2.626	19.20	147.6	1.627	15.26	34.33		pg181_o2nofp.cx10b_walsize_c32r128
1.091	4.364	0.000	0.000	0.172	2.727	4258.0	502597	560.0	9.719	0.306	117.0	1.882	1535.9	0.000	0.000	0.912	270.9	192.4	0.413	1.525	23.81		pg181_o2nofp.cx10b_walsize16G_c32r128
l.x
l.x: create secondary indexes.
Average throughput:
Performance metrics for the DBMS listed above. Some are normalized by throughput, others are not. Legend for results is here.
ips	qps	rps	rmbps	wps	wmbps	rpq	rkbpq	wpi	wkbpi	csps	cpups	cspq	cpupq	dbgb1	dbgb2	rss	maxop	p50	p99	tag
2307694	0	0	0.0	5463.2	668.9	0.000	0.000	0.002	0.297	29036	23.8	0.013	3	23.1	53.1	6.8	0.049	NA	NA	pg1222_o2nofp.cx10a_c32r128
2222224	0	1	0.0	5043.8	618.2	0.000	0.000	0.002	0.285	23090	23.5	0.010	3	23.1	53.2	6.9	0.007	NA	NA	pg1323_o2nofp.cx10a_c32r128
2264153	0	1	0.0	5209.7	637.9	0.000	0.000	0.002	0.289	23042	25.3	0.010	4	23.1	53.2	6.8	0.036	NA	NA	pg1420_o2nofp.cx10a_c32r128
2307694	0	2	0.0	5527.3	677.6	0.000	0.000	0.002	0.301	27925	24.2	0.012	3	23.1	53.2	6.9	0.041	NA	NA	pg1515_o2nofp.cx10a_c32r128
2352943	0	1	0.0	5579.9	684.3	0.000	0.000	0.002	0.298	28507	23.7	0.012	3	23.1	53.2	6.9	0.003	NA	NA	pg1611_o2nofp.cx10a_c32r128
2448982	0	1	0.0	5542.8	679.4	0.000	0.000	0.002	0.284	16422	22.9	0.007	3	23.1	53.1	6.3	0.007	NA	NA	pg177_o2nofp.cx10a_c32r128
2448982	0	0	0.0	5406.2	662.4	0.000	0.000	0.002	0.277	16222	23.4	0.007	3	23.1	53.1	7.0	0.033	NA	NA	pg181_o2nofp.cx10b_c32r128
2033900	0	1	0.0	4572.9	560.6	0.000	0.000	0.002	0.282	15709	19.3	0.008	3	23.1	53.1	7.1	0.024	NA	NA	pg181_o2nofp.cx10b_walsize_c32r128
2926832	0	1	0.0	4553.1	554.8	0.000	0.000	0.002	0.194	4877	27.2	0.002	3	23.1	39.1	7.0	0.003	NA	NA	pg181_o2nofp.cx10b_walsize16G_c32r128
Average values from iostat.
r/s	rkB/s	rrqm/s	%rrqm	r_await	rareq-s	w/s	wkB/s	wrqm/s	%wrqm	w_await	wareq-s	d/s	dkB/s	drqm/s	%drqm	d_await	dareq-s	f/s	f_await	aqu-sz	%util
0.000	0.000	0.000	0.000	0.000	0.000	5463.2	684974	271.5	4.379	0.764	125.0	6.360	121.9	0.000	0.000	1.431	18.64	64.44	0.462	4.545	23.24		pg1222_o2nofp.cx10a_c32r128
0.800	3.200	0.000	0.000	0.254	4.000	5043.8	633074	243.6	5.427	0.830	124.1	4.400	363.0	0.000	0.000	1.456	74.66	60.55	0.447	4.238	21.19		pg1323_o2nofp.cx10a_c32r128
0.880	3.519	0.000	0.000	0.253	3.200	5209.7	653230	270.7	4.795	0.849	125.0	4.699	88.07	0.000	0.000	1.550	16.34	62.70	0.454	4.442	22.02		pg1420_o2nofp.cx10a_c32r128
1.560	6.240	0.000	0.000	0.314	3.600	5527.3	693886	267.4	10.45	0.883	115.2	4.140	67.28	0.000	0.000	1.301	14.72	64.16	0.463	4.563	23.23		pg1515_o2nofp.cx10a_c32r128
0.620	2.480	0.000	0.000	0.530	4.000	5579.9	700730	266.0	4.440	0.813	125.3	3.440	44.48	0.000	0.000	1.378	13.06	63.96	0.465	4.677	23.11		pg1611_o2nofp.cx10a_c32r128
1.340	5.360	0.000	0.000	0.389	4.000	5542.8	695673	269.8	5.133	0.818	124.8	4.980	42314.2	0.000	0.000	1.298	4485.4	64.08	0.460	4.903	22.77		pg177_o2nofp.cx10a_c32r128
0.160	0.640	0.000	0.000	0.750	2.400	5406.2	678337	271.2	5.291	0.829	124.9	4.540	35272.4	0.000	0.000	0.963	4519.6	63.54	0.469	4.562	22.80		pg181_o2nofp.cx10b_c32r128
1.383	5.533	0.000	0.000	3.997	3.667	4572.9	574046	231.1	5.769	6.891	124.1	5.000	66580.2	0.000	0.000	4.599	5958.9	53.13	1.831	12.49	31.69		pg181_o2nofp.cx10b_walsize_c32r128
0.775	3.100	0.000	0.000	0.139	1.500	4553.1	568110	170.5	1.539	0.600	125.5	3.325	9464.6	0.000	0.000	0.931	404.8	60.58	0.440	3.021	21.31		pg181_o2nofp.cx10b_walsize16G_c32r128
l.i1
l.i1: continue load after secondary indexes created with 50 inserts per transaction. Graphs for performance per 1-second interval are here.
Average throughput:
Insert response time histogram: each cell has the percentage of responses that take <= the time in the header and max is the max response time in seconds. For the max column values in the top 25% of the range have a red background and in the bottom 25% of the range have a green background. The red background is not used when the min value is within 80% of the max value.
| dbms | 256us | 1ms | 4ms | 16ms | 64ms | 256ms | 1s | 4s | 16s | gt | max |
|---|---|---|---|---|---|---|---|---|---|---|---|
| pg1222_o2nofp.cx10a_c32r128 | 0.604 | 98.751 | 0.265 | 0.280 | 0.060 | 0.038 | nonzero | 1.077 | |||
| pg1323_o2nofp.cx10a_c32r128 | 0.562 | 98.796 | 0.273 | 0.281 | 0.061 | 0.028 | 0.945 | ||||
| pg1420_o2nofp.cx10a_c32r128 | 0.592 | 98.929 | 0.189 | 0.206 | 0.045 | 0.039 | nonzero | 1.039 | |||
| pg1515_o2nofp.cx10a_c32r128 | 1.374 | 98.112 | 0.188 | 0.236 | 0.051 | 0.038 | 0.728 | ||||
| pg1611_o2nofp.cx10a_c32r128 | 0.941 | 98.496 | 0.230 | 0.243 | 0.056 | 0.033 | 0.616 | ||||
| pg177_o2nofp.cx10a_c32r128 | 1.219 | 98.204 | 0.222 | 0.251 | 0.077 | 0.028 | 0.827 | ||||
| pg181_o2nofp.cx10b_c32r128 | 0.805 | 98.611 | 0.245 | 0.238 | 0.066 | 0.035 | 0.675 | ||||
| pg181_o2nofp.cx10b_walsize_c32r128 | 1.002 | 98.182 | 0.334 | 0.233 | 0.103 | 0.145 | 0.001 | 1.279 | |||
| pg181_o2nofp.cx10b_walsize16G_c32r128 | 1.078 | 95.892 | 1.214 | 1.814 | 0.002 | 0.135 |
Delete response time histogram: each cell has the percentage of responses that take <= the time in the header and max is the max response time in seconds. For the max column values in the top 25% of the range have a red background and in the bottom 25% of the range have a green background. The red background is not used when the min value is within 80% of the max value.
| dbms | 256us | 1ms | 4ms | 16ms | 64ms | 256ms | 1s | 4s | 16s | gt | max |
|---|---|---|---|---|---|---|---|---|---|---|---|
| pg1222_o2nofp.cx10a_c32r128 | 29.717 | 68.922 | 0.992 | 0.268 | 0.060 | 0.040 | nonzero | 1.077 | |||
| pg1323_o2nofp.cx10a_c32r128 | 27.481 | 71.290 | 0.870 | 0.265 | 0.064 | 0.030 | 0.946 | ||||
| pg1420_o2nofp.cx10a_c32r128 | 26.032 | 73.140 | 0.552 | 0.193 | 0.043 | 0.040 | nonzero | 1.039 | |||
| pg1515_o2nofp.cx10a_c32r128 | 25.449 | 73.579 | 0.683 | 0.201 | 0.050 | 0.038 | 0.728 | ||||
| pg1611_o2nofp.cx10a_c32r128 | 26.136 | 72.748 | 0.801 | 0.224 | 0.058 | 0.034 | 0.616 | ||||
| pg177_o2nofp.cx10a_c32r128 | 22.871 | 76.226 | 0.562 | 0.239 | 0.073 | 0.030 | 0.829 | ||||
| pg181_o2nofp.cx10b_c32r128 | 23.501 | 75.672 | 0.502 | 0.226 | 0.062 | 0.035 | 0.674 | ||||
| pg181_o2nofp.cx10b_walsize_c32r128 | 22.866 | 76.045 | 0.604 | 0.233 | 0.105 | 0.147 | 0.001 | 1.279 | |||
| pg181_o2nofp.cx10b_walsize16G_c32r128 | 26.798 | 70.209 | 1.356 | 1.637 | nonzero | 0.135 |
Performance metrics for the DBMS listed above. Some are normalized by throughput, others are not. Legend for results is here.
ips	qps	rps	rmbps	wps	wmbps	rpq	rkbpq	wpi	wkbpi	csps	cpups	cspq	cpupq	dbgb1	dbgb2	rss	maxop	p50	p99	tag
283604	0	0	0.0	3843.5	420.4	0.000	0.000	0.014	1.518	125276	64.2	0.442	72	35.4	131.5	25.1	1.077	31196	2050	pg1222_o2nofp.cx10a_c32r128
284024	0	0	0.0	3812.0	416.2	0.000	0.000	0.013	1.500	123893	65.8	0.436	74	35.0	131.1	24.5	0.945	29795	2250	pg1323_o2nofp.cx10a_c32r128
288722	0	0	0.0	3817.0	411.1	0.000	0.000	0.013	1.458	126885	62.3	0.439	69	33.5	129.5	24.6	1.039	29595	700	pg1420_o2nofp.cx10a_c32r128
275862	0	0	0.0	3632.0	391.3	0.000	0.000	0.013	1.452	124852	60.2	0.453	70	33.5	129.5	27.1	0.728	31196	1800	pg1515_o2nofp.cx10a_c32r128
278665	0	0	0.0	3484.6	390.9	0.000	0.000	0.013	1.436	127684	61.4	0.458	71	33.2	129.2	28.7	0.616	27396	2850	pg1611_o2nofp.cx10a_c32r128
282353	0	1	0.0	3592.0	402.8	0.000	0.000	0.013	1.461	117515	61.1	0.416	69	33.2	129.3	29.4	0.827	28946	850	pg177_o2nofp.cx10a_c32r128
286140	0	0	0.0	3657.3	409.6	0.000	0.000	0.013	1.466	118065	61.9	0.413	69	33.0	129.1	30.1	0.675	28246	900	pg181_o2nofp.cx10b_c32r128
231604	0	0	0.0	3007.8	337.1	0.000	0.000	0.013	1.490	96183	50.6	0.415	70	33.0	129.1	15.1	1.279	22397	500	pg181_o2nofp.cx10b_walsize_c32r128
249351	0	1	0.0	7659.7	858.0	0.000	0.000	0.031	3.523	117578	55.1	0.472	71	32.8	48.9	27.2	0.135	25297	2950	pg181_o2nofp.cx10b_walsize16G_c32r128
Average values from iostat.
r/s	rkB/s	rrqm/s	%rrqm	r_await	rareq-s	w/s	wkB/s	wrqm/s	%wrqm	w_await	wareq-s	d/s	dkB/s	drqm/s	%drqm	d_await	dareq-s	f/s	f_await	aqu-sz	%util
0.006	0.024	0.000	0.000	0.207	0.119	3843.5	430506	319.3	7.016	5.360	111.3	3.970	878.2	0.000	0.000	5.896	152.3	220.7	1.495	11.24	42.60		pg1222_o2nofp.cx10a_c32r128
0.407	1.636	0.001	0.093	0.337	2.197	3812.0	426140	352.7	7.750	4.681	110.9	3.960	546.2	0.000	0.000	5.912	102.7	224.0	1.454	9.839	40.05		pg1323_o2nofp.cx10a_c32r128
0.385	1.540	0.000	0.000	1.153	2.135	3817.0	420935	307.2	6.452	4.716	109.8	3.782	451.6	0.000	0.000	6.812	69.81	250.0	1.509	9.202	40.15		pg1420_o2nofp.cx10a_c32r128
0.483	1.934	0.000	0.000	0.321	2.273	3632.0	400689	283.3	5.978	3.892	110.4	0.237	424.4	0.000	0.000	0.616	372.0	237.7	1.564	8.269	40.65		pg1515_o2nofp.cx10a_c32r128
0.335	1.339	0.000	0.000	0.167	2.087	3484.6	400266	293.4	6.465	4.584	114.3	0.232	264.4	0.000	0.000	0.231	37.23	193.7	1.522	8.283	37.44		pg1611_o2nofp.cx10a_c32r128
0.659	2.635	0.000	0.000	0.419	2.324	3592.0	412484	298.8	6.224	4.650	114.5	0.232	392.9	0.000	0.000	0.361	404.3	193.7	1.790	9.096	39.89		pg177_o2nofp.cx10a_c32r128
0.024	0.096	0.000	0.000	0.049	0.418	3657.3	419452	296.3	6.306	5.198	114.5	0.245	535.6	0.000	0.000	1.203	258.9	194.7	1.777	9.704	40.42		pg181_o2nofp.cx10b_c32r128
0.356	1.430	0.001	0.067	0.364	2.355	3007.8	345161	235.7	6.449	11.80	115.2	0.217	295.6	0.000	0.000	1.349	292.7	158.1	2.803	17.34	49.50		pg181_o2nofp.cx10b_walsize_c32r128
0.706	2.826	0.000	0.000	0.222	2.727	7659.7	878576	721.1	8.840	0.351	114.0	18.24	246905	0.000	0.000	0.433	2814.7	233.0	0.420	2.836	39.07		pg181_o2nofp.cx10b_walsize16G_c32r128
l.i2
l.i2: continue load after secondary indexes created with 5 inserts per transaction. Graphs for performance per 1-second interval are here.
Average throughput:
Insert response time histogram: each cell has the percentage of responses that take <= the time in the header and max is the max response time in seconds. For the max column values in the top 25% of the range have a red background and in the bottom 25% of the range have a green background. The red background is not used when the min value is within 80% of the max value.
| dbms | 256us | 1ms | 4ms | 16ms | 64ms | 256ms | 1s | 4s | 16s | gt | max |
|---|---|---|---|---|---|---|---|---|---|---|---|
| pg1222_o2nofp.cx10a_c32r128 | 35.791 | 64.184 | 0.025 | nonzero | nonzero | 0.047 | |||||
| pg1323_o2nofp.cx10a_c32r128 | 58.214 | 41.763 | 0.022 | nonzero | nonzero | nonzero | 0.093 | ||||
| pg1420_o2nofp.cx10a_c32r128 | 52.774 | 47.223 | 0.003 | nonzero | nonzero | nonzero | 0.091 | ||||
| pg1515_o2nofp.cx10a_c32r128 | 54.595 | 45.402 | 0.003 | nonzero | 0.106 | ||||||
| pg1611_o2nofp.cx10a_c32r128 | 51.325 | 48.670 | 0.004 | 0.001 | 0.001 | nonzero | 0.093 | ||||
| pg177_o2nofp.cx10a_c32r128 | 72.144 | 27.854 | 0.002 | nonzero | nonzero | 0.094 | |||||
| pg181_o2nofp.cx10b_c32r128 | 66.195 | 33.801 | 0.003 | nonzero | nonzero | nonzero | 0.095 | ||||
| pg181_o2nofp.cx10b_walsize_c32r128 | 66.211 | 33.787 | 0.002 | nonzero | nonzero | nonzero | 0.107 | ||||
| pg181_o2nofp.cx10b_walsize16G_c32r128 | 49.940 | 49.987 | 0.047 | 0.026 | nonzero | 0.022 |
Delete response time histogram: each cell has the percentage of responses that take <= the time in the header and max is the max response time in seconds. For the max column values in the top 25% of the range have a red background and in the bottom 25% of the range have a green background. The red background is not used when the min value is within 80% of the max value.
| dbms | 256us | 1ms | 4ms | 16ms | 64ms | 256ms | 1s | 4s | 16s | gt | max |
|---|---|---|---|---|---|---|---|---|---|---|---|
| pg1222_o2nofp.cx10a_c32r128 | 0.141 | 63.744 | 36.102 | 0.012 | 0.001 | 0.048 | |||||
| pg1323_o2nofp.cx10a_c32r128 | 0.179 | 57.633 | 42.184 | 0.004 | 0.001 | nonzero | 0.094 | ||||
| pg1420_o2nofp.cx10a_c32r128 | 0.071 | 57.418 | 42.509 | 0.002 | nonzero | nonzero | 0.091 | ||||
| pg1515_o2nofp.cx10a_c32r128 | 0.088 | 59.905 | 40.004 | 0.002 | nonzero | 0.106 | |||||
| pg1611_o2nofp.cx10a_c32r128 | 0.064 | 56.345 | 43.587 | 0.003 | 0.001 | nonzero | 0.093 | ||||
| pg177_o2nofp.cx10a_c32r128 | 0.123 | 54.087 | 45.790 | nonzero | nonzero | 0.094 | |||||
| pg181_o2nofp.cx10b_c32r128 | 0.013 | 53.814 | 46.172 | 0.001 | nonzero | nonzero | 0.095 | ||||
| pg181_o2nofp.cx10b_walsize_c32r128 | 0.015 | 58.125 | 41.854 | 0.006 | 0.001 | 0.108 | |||||
| pg181_o2nofp.cx10b_walsize16G_c32r128 | 0.015 | 79.476 | 20.467 | 0.042 | 0.014 |
Performance metrics for the DBMS listed above. Some are normalized by throughput, others are not. Legend for results is here.
ips	qps	rps	rmbps	wps	wmbps	rpq	rkbpq	wpi	wkbpi	csps	cpups	cspq	cpupq	dbgb1	dbgb2	rss	maxop	p50	p99	tag
63660	0	0	0.0	600.9	66.2	0.000	0.000	0.009	1.064	271715	57.0	4.268	287	35.5	131.6	8.0	0.047	4389	2955	pg1222_o2nofp.cx10a_c32r128
58896	0	0	0.0	551.1	60.6	0.000	0.000	0.009	1.054	255811	53.3	4.343	290	35.1	131.2	10.2	0.093	4129	2755	pg1323_o2nofp.cx10a_c32r128
60226	0	0	0.0	573.4	63.6	0.000	0.000	0.010	1.081	266223	52.4	4.420	278	33.6	129.7	27.2	0.091	3945	2250	pg1420_o2nofp.cx10a_c32r128
61856	0	0	0.0	594.0	66.2	0.000	0.000	0.010	1.095	272955	52.8	4.413	273	33.5	129.6	2.7	0.106	4814	3655	pg1515_o2nofp.cx10a_c32r128
59776	0	0	0.0	571.5	63.7	0.000	0.000	0.010	1.092	264249	52.5	4.421	281	33.4	129.5	24.1	0.093	3960	2735	pg1611_o2nofp.cx10a_c32r128
62419	0	0	0.0	591.4	65.6	0.000	0.000	0.009	1.076	250304	53.1	4.010	272	33.4	129.5	9.2	0.094	4729	3460	pg177_o2nofp.cx10a_c32r128
60759	0	0	0.0	570.1	63.3	0.000	0.000	0.009	1.067	241471	52.7	3.974	278	33.2	129.3	25.4	0.095	3929	2415	pg181_o2nofp.cx10b_c32r128
59480	0	0	0.0	533.7	59.1	0.000	0.000	0.009	1.017	238100	51.6	4.003	278	33.2	129.3	14.6	0.107	3900	2170	pg181_o2nofp.cx10b_walsize_c32r128
71217	0	0	0.0	6966.5	535.5	0.000	0.000	0.098	7.700	280909	57.0	3.944	256	33.0	49.0	28.0	0.022	5524	2495	pg181_o2nofp.cx10b_walsize16G_c32r128
Average values from iostat.
r/s	rkB/s	rrqm/s	%rrqm	r_await	rareq-s	w/s	wkB/s	wrqm/s	%wrqm	w_await	wareq-s	d/s	dkB/s	drqm/s	%drqm	d_await	dareq-s	f/s	f_await	aqu-sz	%util
0.000	0.000	0.000	0.000	0.000	0.000	600.9	67743.7	18.70	3.180	0.283	112.4	2.667	19.42	0.000	0.000	1.103	7.049	43.47	0.534	0.195	6.564		pg1222_o2nofp.cx10a_c32r128
0.001	0.005	0.000	0.000	0.000	0.025	551.1	62082.2	19.91	3.630	0.272	112.4	2.628	53.42	0.000	0.000	1.039	13.67	40.18	0.521	0.171	5.822		pg1323_o2nofp.cx10a_c32r128
0.000	0.000	0.000	0.000	0.000	0.000	573.4	65109.8	10.60	2.038	0.471	112.9	2.664	85.79	0.000	0.000	1.326	26.08	41.33	0.669	0.432	7.930		pg1420_o2nofp.cx10a_c32r128
0.000	0.000	0.000	0.000	0.000	0.000	594.0	67759.6	8.680	1.678	0.296	113.8	0.025	165.4	0.000	0.000	0.052	242.9	44.01	0.518	0.184	5.919		pg1515_o2nofp.cx10a_c32r128
0.001	0.005	0.000	0.000	0.000	0.025	571.5	65263.0	8.999	1.775	0.494	114.0	0.011	15.04	0.000	0.000	0.031	25.11	41.38	0.612	0.493	6.883		pg1611_o2nofp.cx10a_c32r128
0.000	0.000	0.000	0.000	0.000	0.000	591.4	67138.9	8.476	1.545	0.295	113.5	0.014	49.28	0.000	0.000	0.048	133.3	43.94	0.526	0.199	5.936		pg177_o2nofp.cx10a_c32r128
0.000	0.000	0.000	0.000	0.000	0.000	570.1	64807.8	9.167	1.806	0.378	113.5	0.016	20.58	0.000	0.000	0.043	28.90	41.85	0.557	0.367	6.041		pg181_o2nofp.cx10b_c32r128
0.001	0.005	0.000	0.000	0.000	0.025	533.7	60487.0	7.847	1.586	0.592	113.0	0.004	0.432	0.000	0.000	0.008	0.720	39.55	0.826	0.382	7.106		pg181_o2nofp.cx10b_walsize_c32r128
0.000	0.000	0.000	0.000	0.000	0.000	6966.5	548354	86.46	2.218	0.148	79.03	0.416	4644.2	0.000	0.000	0.373	311.7	232.3	0.458	0.944	29.03		pg181_o2nofp.cx10b_walsize16G_c32r128
qr100.L1
qr100.L1: range queries with 100 insert/s per client. Graphs for performance per 1-second interval are here.
Average throughput:
Query response time histogram: each cell has the percentage of responses that take <= the time in the header and max is the max response time in seconds. For max values in the top 25% of the range have a red background and in the bottom 25% of the range have a green background. The red background is not used when the min value is within 80% of the max value.
| dbms | 256us | 1ms | 4ms | 16ms | 64ms | 256ms | 1s | 4s | 16s | gt | max |
|---|---|---|---|---|---|---|---|---|---|---|---|
| pg1222_o2nofp.cx10a_c32r128 | 99.999 | 0.001 | nonzero | 0.002 | |||||||
| pg1323_o2nofp.cx10a_c32r128 | 99.999 | 0.001 | nonzero | nonzero | 0.004 | ||||||
| pg1420_o2nofp.cx10a_c32r128 | 99.999 | 0.001 | nonzero | nonzero | nonzero | 0.017 | |||||
| pg1515_o2nofp.cx10a_c32r128 | 99.999 | 0.001 | nonzero | 0.003 | |||||||
| pg1611_o2nofp.cx10a_c32r128 | 99.999 | 0.001 | nonzero | 0.003 | |||||||
| pg177_o2nofp.cx10a_c32r128 | 99.999 | 0.001 | nonzero | 0.003 | |||||||
| pg181_o2nofp.cx10b_c32r128 | 99.999 | 0.001 | nonzero | 0.002 | |||||||
| pg181_o2nofp.cx10b_walsize_c32r128 | 99.999 | 0.001 | nonzero | nonzero | 0.013 | ||||||
| pg181_o2nofp.cx10b_walsize16G_c32r128 | 99.999 | 0.001 | nonzero | 0.002 |
Insert response time histogram: each cell has the percentage of responses that take <= the time in the header and max is the max response time in seconds. For max values in the top 25% of the range have a red background and in the bottom 25% of the range have a green background. The red background is not used when the min value is within 80% of the max value.
| dbms | 256us | 1ms | 4ms | 16ms | 64ms | 256ms | 1s | 4s | 16s | gt | max |
|---|---|---|---|---|---|---|---|---|---|---|---|
| pg1222_o2nofp.cx10a_c32r128 | 99.845 | 0.155 | 0.008 | ||||||||
| pg1323_o2nofp.cx10a_c32r128 | 99.852 | 0.148 | 0.008 | ||||||||
| pg1420_o2nofp.cx10a_c32r128 | 99.845 | 0.150 | 0.005 | 0.020 | |||||||
| pg1515_o2nofp.cx10a_c32r128 | 99.836 | 0.164 | 0.008 | ||||||||
| pg1611_o2nofp.cx10a_c32r128 | 99.852 | 0.148 | 0.008 | ||||||||
| pg177_o2nofp.cx10a_c32r128 | 99.840 | 0.160 | 0.008 | ||||||||
| pg181_o2nofp.cx10b_c32r128 | 99.850 | 0.150 | 0.008 | ||||||||
| pg181_o2nofp.cx10b_walsize_c32r128 | 99.852 | 0.146 | 0.002 | 0.016 | |||||||
| pg181_o2nofp.cx10b_walsize16G_c32r128 | 99.856 | 0.144 | 0.008 |
Delete response time histogram: each cell has the percentage of responses that take <= the time in the header and max is the max response time in seconds. For max values in the top 25% of the range have a red background and in the bottom 25% of the range have a green background. The red background is not used when the min value is within 80% of the max value.
| dbms | 256us | 1ms | 4ms | 16ms | 64ms | 256ms | 1s | 4s | 16s | gt | max |
|---|---|---|---|---|---|---|---|---|---|---|---|
| pg1222_o2nofp.cx10a_c32r128 | 68.125 | 31.875 | 0.002 | ||||||||
| pg1323_o2nofp.cx10a_c32r128 | 64.801 | 35.199 | 0.002 | ||||||||
| pg1420_o2nofp.cx10a_c32r128 | 66.836 | 33.164 | 0.002 | ||||||||
| pg1515_o2nofp.cx10a_c32r128 | 66.789 | 33.211 | 0.003 | ||||||||
| pg1611_o2nofp.cx10a_c32r128 | 68.470 | 31.530 | 0.002 | ||||||||
| pg177_o2nofp.cx10a_c32r128 | 65.771 | 34.225 | 0.005 | 0.004 | |||||||
| pg181_o2nofp.cx10b_c32r128 | 65.512 | 34.488 | 0.004 | ||||||||
| pg181_o2nofp.cx10b_walsize_c32r128 | 67.896 | 32.102 | 0.002 | 0.015 | |||||||
| pg181_o2nofp.cx10b_walsize16G_c32r128 | 67.729 | 32.271 | 0.003 |
Performance metrics for the DBMS listed above. Some are normalized by throughput, others are not. Legend for results is here.
ips	qps	rps	rmbps	wps	wmbps	rpq	rkbpq	wpi	wkbpi	csps	cpups	cspq	cpupq	dbgb1	dbgb2	rss	maxop	p50	p99	tag
1193	145403	0	0.0	64.9	5.6	0.000	0.000	0.054	4.848	555557	37.5	3.821	83	35.5	131.6	0.6	0.002	12126	11631	pg1222_o2nofp.cx10a_c32r128
1192	145900	0	0.0	65.0	5.7	0.000	0.000	0.055	4.870	557825	37.6	3.823	82	35.1	131.1	0.5	0.004	12254	12015	pg1323_o2nofp.cx10a_c32r128
1193	147709	0	0.0	65.8	5.8	0.000	0.000	0.055	4.959	564308	37.4	3.820	81	33.6	129.6	0.5	0.017	12286	12078	pg1420_o2nofp.cx10a_c32r128
1192	145769	0	0.0	63.4	5.8	0.000	0.000	0.053	4.943	557144	37.4	3.822	82	33.5	129.6	0.5	0.003	12318	12062	pg1515_o2nofp.cx10a_c32r128
1192	147343	0	0.0	63.3	5.8	0.000	0.000	0.053	4.958	563157	37.3	3.822	81	33.4	129.4	4.9	0.003	12366	12158	pg1611_o2nofp.cx10a_c32r128
1193	147861	0	0.0	63.7	5.8	0.000	0.000	0.053	4.949	564745	37.4	3.819	81	33.4	129.4	0.4	0.003	12462	12238	pg177_o2nofp.cx10a_c32r128
1192	147902	0	0.0	63.8	5.8	0.000	0.000	0.054	4.960	565245	37.3	3.822	81	33.2	129.3	0.5	0.002	12510	12270	pg181_o2nofp.cx10b_c32r128
1192	146096	0	0.0	64.0	5.8	0.000	0.000	0.054	4.970	558324	37.5	3.822	82	33.2	129.3	0.4	0.013	12222	11982	pg181_o2nofp.cx10b_walsize_c32r128
1192	147078	0	0.0	80.1	6.7	0.000	0.000	0.067	5.758	562101	37.5	3.822	82	33.0	49.0	0.5	0.002	12350	12126	pg181_o2nofp.cx10b_walsize16G_c32r128
Average values from iostat.
r/s	rkB/s	rrqm/s	%rrqm	r_await	rareq-s	w/s	wkB/s	wrqm/s	%wrqm	w_await	wareq-s	d/s	dkB/s	drqm/s	%drqm	d_await	dareq-s	f/s	f_await	aqu-sz	%util
0.000	0.000	0.000	0.000	0.000	0.000	64.95	5782.6	4.350	8.601	0.929	86.87	2.000	11.20	0.000	0.000	1.387	5.600	7.260	0.513	0.057	1.905		pg1222_o2nofp.cx10a_c32r128
0.000	0.000	0.000	0.000	0.000	0.000	65.01	5804.5	4.750	9.354	0.818	86.78	2.000	11.20	0.000	0.000	1.272	5.600	7.214	0.463	0.043	1.800		pg1323_o2nofp.cx10a_c32r128
0.001	0.004	0.000	0.000	0.008	0.022	65.85	5914.3	3.475	7.006	0.865	86.93	1.999	11.60	0.000	0.000	1.563	5.799	7.274	0.654	0.045	1.950		pg1420_o2nofp.cx10a_c32r128
0.000	0.000	0.000	0.000	0.000	0.000	63.39	5891.9	0.750	1.500	0.958	91.18	0.001	0.002	0.000	0.000	0.003	0.011	7.133	0.624	0.044	1.677		pg1515_o2nofp.cx10a_c32r128
0.000	0.000	0.000	0.000	0.000	0.000	63.31	5910.4	0.764	1.562	1.292	91.17	0.001	0.002	0.000	0.000	0.003	0.011	7.074	0.734	0.085	1.919		pg1611_o2nofp.cx10a_c32r128
0.000	0.000	0.000	0.000	0.000	0.000	63.73	5902.4	0.692	1.307	1.448	90.34	0.001	0.002	0.000	0.000	0.003	0.011	7.241	0.586	0.080	1.962		pg177_o2nofp.cx10a_c32r128
0.000	0.000	0.000	0.000	0.000	0.000	63.80	5912.4	0.739	1.430	1.399	90.28	0.001	0.002	0.000	0.000	0.003	0.011	7.246	0.633	0.071	1.992		pg181_o2nofp.cx10b_c32r128
0.000	0.000	0.000	0.000	0.000	0.000	63.96	5924.8	0.877	1.776	1.715	90.55	0.001	0.002	0.000	0.000	0.003	0.011	7.154	0.988	0.090	2.276		pg181_o2nofp.cx10b_walsize_c32r128
0.000	0.000	0.000	0.000	0.000	0.000	80.12	6864.1	1.039	2.093	1.284	88.40	0.001	0.002	0.000	0.000	0.003	0.011	7.443	0.485	0.062	2.007		pg181_o2nofp.cx10b_walsize16G_c32r128
qp100.L2
qp100.L2: point queries with 100 insert/s per client. Graphs for performance per 1-second interval are here.
Average throughput:
Query response time histogram: each cell has the percentage of responses that take <= the time in the header and max is the max response time in seconds. For max values in the top 25% of the range have a red background and in the bottom 25% of the range have a green background. The red background is not used when the min value is within 80% of the max value.
| dbms | 256us | 1ms | 4ms | 16ms | 64ms | 256ms | 1s | 4s | 16s | gt | max |
|---|---|---|---|---|---|---|---|---|---|---|---|
| pg1222_o2nofp.cx10a_c32r128 | 99.992 | 0.008 | nonzero | 0.002 | |||||||
| pg1323_o2nofp.cx10a_c32r128 | 99.992 | 0.008 | nonzero | nonzero | 0.015 | ||||||
| pg1420_o2nofp.cx10a_c32r128 | 99.990 | 0.010 | nonzero | 0.003 | |||||||
| pg1515_o2nofp.cx10a_c32r128 | 99.993 | 0.007 | nonzero | 0.002 | |||||||
| pg1611_o2nofp.cx10a_c32r128 | 99.991 | 0.009 | nonzero | 0.002 | |||||||
| pg177_o2nofp.cx10a_c32r128 | 99.992 | 0.007 | nonzero | 0.002 | |||||||
| pg181_o2nofp.cx10b_c32r128 | 99.992 | 0.008 | nonzero | 0.002 | |||||||
| pg181_o2nofp.cx10b_walsize_c32r128 | 99.993 | 0.007 | nonzero | 0.003 | |||||||
| pg181_o2nofp.cx10b_walsize16G_c32r128 | 99.993 | 0.007 | nonzero | 0.003 |
Insert response time histogram: each cell has the percentage of responses that take <= the time in the header and max is the max response time in seconds. For max values in the top 25% of the range have a red background and in the bottom 25% of the range have a green background. The red background is not used when the min value is within 80% of the max value.
| dbms | 256us | 1ms | 4ms | 16ms | 64ms | 256ms | 1s | 4s | 16s | gt | max |
|---|---|---|---|---|---|---|---|---|---|---|---|
| pg1222_o2nofp.cx10a_c32r128 | 99.889 | 0.111 | 0.007 | ||||||||
| pg1323_o2nofp.cx10a_c32r128 | 99.891 | 0.109 | 0.007 | ||||||||
| pg1420_o2nofp.cx10a_c32r128 | 99.889 | 0.111 | 0.008 | ||||||||
| pg1515_o2nofp.cx10a_c32r128 | 99.889 | 0.111 | 0.008 | ||||||||
| pg1611_o2nofp.cx10a_c32r128 | 99.884 | 0.116 | 0.008 | ||||||||
| pg177_o2nofp.cx10a_c32r128 | 99.891 | 0.109 | 0.007 | ||||||||
| pg181_o2nofp.cx10b_c32r128 | 99.875 | 0.125 | 0.008 | ||||||||
| pg181_o2nofp.cx10b_walsize_c32r128 | 99.891 | 0.109 | 0.008 | ||||||||
| pg181_o2nofp.cx10b_walsize16G_c32r128 | 99.861 | 0.139 | 0.016 |
Delete response time histogram: each cell has the percentage of responses that take <= the time in the header and max is the max response time in seconds. For max values in the top 25% of the range have a red background and in the bottom 25% of the range have a green background. The red background is not used when the min value is within 80% of the max value.
| dbms | 256us | 1ms | 4ms | 16ms | 64ms | 256ms | 1s | 4s | 16s | gt | max |
|---|---|---|---|---|---|---|---|---|---|---|---|
| pg1222_o2nofp.cx10a_c32r128 | 22.287 | 77.685 | 0.028 | 0.008 | |||||||
| pg1323_o2nofp.cx10a_c32r128 | 24.935 | 75.037 | 0.028 | 0.008 | |||||||
| pg1420_o2nofp.cx10a_c32r128 | 22.201 | 77.771 | 0.028 | 0.008 | |||||||
| pg1515_o2nofp.cx10a_c32r128 | 18.731 | 81.241 | 0.028 | 0.008 | |||||||
| pg1611_o2nofp.cx10a_c32r128 | 19.183 | 80.787 | 0.030 | 0.008 | |||||||
| pg177_o2nofp.cx10a_c32r128 | 16.294 | 83.678 | 0.028 | 0.007 | |||||||
| pg181_o2nofp.cx10b_c32r128 | 13.699 | 86.273 | 0.028 | 0.008 | |||||||
| pg181_o2nofp.cx10b_walsize_c32r128 | 20.639 | 79.333 | 0.028 | 0.008 | |||||||
| pg181_o2nofp.cx10b_walsize16G_c32r128 | 68.403 | 31.553 | 0.044 | 0.014 |
Performance metrics for the DBMS listed above. Some are normalized by throughput, others are not. Legend for results is here.
ips	qps	rps	rmbps	wps	wmbps	rpq	rkbpq	wpi	wkbpi	csps	cpups	cspq	cpupq	dbgb1	dbgb2	rss	maxop	p50	p99	tag
1193	84167	0	0.0	181.8	11.1	0.000	0.000	0.152	9.549	325462	36.9	3.867	140	35.5	131.1	0.6	0.002	7119	6975	pg1222_o2nofp.cx10a_c32r128
1192	83804	0	0.0	177.8	11.0	0.000	0.000	0.149	9.468	324386	36.8	3.871	141	35.1	130.5	0.5	0.015	6991	6911	pg1323_o2nofp.cx10a_c32r128
1193	83017	0	0.0	170.9	10.8	0.000	0.000	0.143	9.295	320955	36.9	3.866	142	33.6	128.9	0.5	0.003	6959	6879	pg1420_o2nofp.cx10a_c32r128
1192	83422	0	0.0	169.2	10.8	0.000	0.000	0.142	9.288	322635	36.9	3.868	142	33.5	128.8	0.5	0.002	7023	6911	pg1515_o2nofp.cx10a_c32r128
1192	83928	0	0.0	165.7	10.7	0.000	0.000	0.139	9.220	324536	37.0	3.867	141	33.4	128.7	4.5	0.002	7071	6959	pg1611_o2nofp.cx10a_c32r128
1193	83776	0	0.0	166.3	10.8	0.000	0.000	0.139	9.230	323712	36.9	3.864	141	33.4	128.6	0.4	0.002	7055	6911	pg177_o2nofp.cx10a_c32r128
1192	83614	0	0.0	165.1	10.7	0.000	0.000	0.138	9.216	323278	36.9	3.866	141	33.2	128.5	0.5	0.002	7071	6927	pg181_o2nofp.cx10b_c32r128
1192	83630	0	0.0	164.5	10.7	0.000	0.000	0.138	9.194	323325	36.9	3.866	141	33.2	129.3	0.4	0.003	7023	6911	pg181_o2nofp.cx10b_walsize_c32r128
1193	83619	0	0.0	158.9	11.4	0.000	0.000	0.133	9.790	323128	37.0	3.864	142	33.0	49.0	0.5	0.003	6991	6911	pg181_o2nofp.cx10b_walsize16G_c32r128
Average values from iostat.
r/s	rkB/s	rrqm/s	%rrqm	r_await	rareq-s	w/s	wkB/s	wrqm/s	%wrqm	w_await	wareq-s	d/s	dkB/s	drqm/s	%drqm	d_await	dareq-s	f/s	f_await	aqu-sz	%util
0.000	0.000	0.000	0.000	0.000	0.000	181.8	11389.3	6.469	4.368	0.324	63.89	2.028	301.4	0.000	0.000	1.357	30.71	7.629	0.668	0.041	1.639		pg1222_o2nofp.cx10a_c32r128
0.000	0.000	0.000	0.000	0.000	0.000	177.8	11285.3	7.386	5.105	0.362	64.57	2.031	355.5	0.000	0.000	1.342	32.07	7.658	0.628	0.056	1.665		pg1323_o2nofp.cx10a_c32r128
0.001	0.004	0.000	0.000	0.003	0.022	170.9	11085.7	5.662	4.001	0.260	65.89	2.038	437.4	0.000	0.000	1.056	33.82	7.373	0.446	0.032	1.359		pg1420_o2nofp.cx10a_c32r128
0.000	0.000	0.000	0.000	0.000	0.000	169.2	11071.4	3.264	2.049	0.257	66.89	0.040	471.0	0.000	0.000	0.008	33.70	7.571	0.445	0.028	1.168		pg1515_o2nofp.cx10a_c32r128
0.000	0.000	0.000	0.000	0.000	0.000	165.7	10990.1	3.568	2.475	0.275	67.70	0.039	443.9	0.000	0.000	0.008	32.86	7.321	0.446	0.029	1.160		pg1611_o2nofp.cx10a_c32r128
0.000	0.000	0.000	0.000	0.000	0.000	166.3	11008.4	3.261	2.319	0.439	67.59	0.032	470.9	0.000	0.000	0.022	41.32	7.217	0.793	0.041	1.768		pg177_o2nofp.cx10a_c32r128
0.000	0.000	0.000	0.000	0.000	0.000	165.1	10985.8	3.692	2.575	0.343	68.13	0.033	470.9	0.000	0.000	0.006	39.92	6.992	0.537	0.032	1.207		pg181_o2nofp.cx10b_c32r128
0.000	0.000	0.000	0.000	0.000	0.000	164.5	10959.7	3.410	2.470	0.378	68.25	0.002	0.241	0.000	0.000	0.006	0.409	7.109	0.613	0.042	1.370		pg181_o2nofp.cx10b_walsize_c32r128
0.000	0.000	0.000	0.000	0.000	0.000	158.9	11676.1	3.013	2.383	0.887	68.35	0.002	0.241	0.000	0.000	0.006	0.409	6.987	0.486	0.062	1.997		pg181_o2nofp.cx10b_walsize16G_c32r128
qr500.L3
qr500.L3: range queries with 500 insert/s per client. Graphs for performance per 1-second interval are here.
Average throughput:
Query response time histogram: each cell has the percentage of responses that take <= the time in the header and max is the max response time in seconds. For max values in the top 25% of the range have a red background and in the bottom 25% of the range have a green background. The red background is not used when the min value is within 80% of the max value.
| dbms | 256us | 1ms | 4ms | 16ms | 64ms | 256ms | 1s | 4s | 16s | gt | max |
|---|---|---|---|---|---|---|---|---|---|---|---|
| pg1222_o2nofp.cx10a_c32r128 | 99.995 | 0.004 | nonzero | nonzero | nonzero | 0.021 | |||||
| pg1323_o2nofp.cx10a_c32r128 | 99.995 | 0.004 | nonzero | nonzero | nonzero | nonzero | 0.086 | ||||
| pg1420_o2nofp.cx10a_c32r128 | 99.995 | 0.005 | nonzero | nonzero | nonzero | nonzero | 0.173 | ||||
| pg1515_o2nofp.cx10a_c32r128 | 99.995 | 0.004 | nonzero | nonzero | nonzero | 0.021 | |||||
| pg1611_o2nofp.cx10a_c32r128 | 99.995 | 0.004 | nonzero | nonzero | nonzero | 0.022 | |||||
| pg177_o2nofp.cx10a_c32r128 | 99.995 | 0.004 | nonzero | nonzero | nonzero | 0.020 | |||||
| pg181_o2nofp.cx10b_c32r128 | 99.995 | 0.004 | nonzero | nonzero | nonzero | 0.019 | |||||
| pg181_o2nofp.cx10b_walsize_c32r128 | 99.994 | 0.005 | nonzero | 0.001 | nonzero | nonzero | 0.206 | ||||
| pg181_o2nofp.cx10b_walsize16G_c32r128 | 99.997 | 0.003 | nonzero | nonzero | 0.016 |
Insert response time histogram: each cell has the percentage of responses that take <= the time in the header and max is the max response time in seconds. For max values in the top 25% of the range have a red background and in the bottom 25% of the range have a green background. The red background is not used when the min value is within 80% of the max value.
| dbms | 256us | 1ms | 4ms | 16ms | 64ms | 256ms | 1s | 4s | 16s | gt | max |
|---|---|---|---|---|---|---|---|---|---|---|---|
| pg1222_o2nofp.cx10a_c32r128 | 0.013 | 99.347 | 0.552 | 0.088 | 0.026 | ||||||
| pg1323_o2nofp.cx10a_c32r128 | 0.093 | 99.296 | 0.537 | 0.074 | 0.026 | ||||||
| pg1420_o2nofp.cx10a_c32r128 | 0.073 | 98.850 | 0.754 | 0.266 | 0.057 | 0.178 | |||||
| pg1515_o2nofp.cx10a_c32r128 | 0.118 | 99.243 | 0.513 | 0.126 | 0.025 | ||||||
| pg1611_o2nofp.cx10a_c32r128 | 0.108 | 98.969 | 0.773 | 0.150 | 0.027 | ||||||
| pg177_o2nofp.cx10a_c32r128 | 0.435 | 98.854 | 0.610 | 0.101 | 0.033 | ||||||
| pg181_o2nofp.cx10b_c32r128 | 0.269 | 98.617 | 0.956 | 0.159 | 0.041 | ||||||
| pg181_o2nofp.cx10b_walsize_c32r128 | 0.159 | 98.537 | 1.077 | 0.211 | 0.015 | 0.161 | |||||
| pg181_o2nofp.cx10b_walsize16G_c32r128 | 0.157 | 98.925 | 0.905 | 0.013 | 0.025 |
Delete response time histogram: each cell has the percentage of responses that take <= the time in the header and max is the max response time in seconds. For max values in the top 25% of the range have a red background and in the bottom 25% of the range have a green background. The red background is not used when the min value is within 80% of the max value.
| dbms | 256us | 1ms | 4ms | 16ms | 64ms | 256ms | 1s | 4s | 16s | gt | max |
|---|---|---|---|---|---|---|---|---|---|---|---|
| pg1222_o2nofp.cx10a_c32r128 | 53.506 | 46.212 | 0.254 | 0.028 | 0.022 | ||||||
| pg1323_o2nofp.cx10a_c32r128 | 51.739 | 47.987 | 0.252 | 0.023 | 0.022 | ||||||
| pg1420_o2nofp.cx10a_c32r128 | 51.257 | 48.244 | 0.353 | 0.115 | 0.030 | 0.178 | |||||
| pg1515_o2nofp.cx10a_c32r128 | 51.907 | 47.797 | 0.260 | 0.037 | 0.021 | ||||||
| pg1611_o2nofp.cx10a_c32r128 | 50.877 | 48.731 | 0.338 | 0.054 | 0.024 | ||||||
| pg177_o2nofp.cx10a_c32r128 | 51.474 | 48.175 | 0.309 | 0.043 | 0.022 | ||||||
| pg181_o2nofp.cx10b_c32r128 | 47.769 | 51.531 | 0.617 | 0.082 | 0.023 | ||||||
| pg181_o2nofp.cx10b_walsize_c32r128 | 46.146 | 53.031 | 0.695 | 0.112 | 0.016 | 0.210 | |||||
| pg181_o2nofp.cx10b_walsize16G_c32r128 | 71.424 | 28.165 | 0.406 | 0.005 | 0.018 |
Performance metrics for the DBMS listed above. Some are normalized by throughput, others are not. Legend for results is here.
ips	qps	rps	rmbps	wps	wmbps	rpq	rkbpq	wpi	wkbpi	csps	cpups	cspq	cpupq	dbgb1	dbgb2	rss	maxop	p50	p99	tag
5964	141614	0	0.0	288.8	16.0	0.000	0.000	0.048	2.744	542412	38.6	3.830	87	35.5	123.7	14.7	0.021	11807	11359	pg1222_o2nofp.cx10a_c32r128
5960	142306	0	0.0	283.2	15.9	0.000	0.000	0.048	2.729	545442	38.7	3.833	87	35.1	123.1	22.9	0.086	11935	11518	pg1323_o2nofp.cx10a_c32r128
5964	143579	0	0.0	272.9	15.8	0.000	0.000	0.046	2.707	549305	38.5	3.826	86	33.7	121.6	22.4	0.173	12031	11295	pg1420_o2nofp.cx10a_c32r128
5960	141957	0	0.0	271.6	15.7	0.000	0.000	0.046	2.698	543855	38.5	3.831	87	33.6	121.4	20.4	0.021	11886	11454	pg1515_o2nofp.cx10a_c32r128
5964	143416	0	0.0	267.2	15.7	0.000	0.000	0.045	2.691	548658	38.5	3.826	86	33.5	121.3	26.4	0.022	12110	11662	pg1611_o2nofp.cx10a_c32r128
5964	144168	0	0.0	269.2	15.7	0.000	0.000	0.045	2.695	551687	38.5	3.827	85	33.5	121.3	8.7	0.020	12126	11583	pg177_o2nofp.cx10a_c32r128
5964	144498	0	0.0	266.9	15.7	0.000	0.000	0.045	2.691	552566	38.5	3.824	85	33.3	121.1	0.4	0.019	12079	11662	pg181_o2nofp.cx10b_c32r128
5960	142192	0	0.0	265.4	15.6	0.000	0.000	0.045	2.683	543769	38.5	3.824	87	33.3	129.3	0.4	0.206	11902	11406	pg181_o2nofp.cx10b_walsize_c32r128
5964	144881	0	0.0	489.5	44.0	0.000	0.000	0.082	7.548	554534	38.5	3.828	85	33.0	49.1	5.8	0.016	12174	11870	pg181_o2nofp.cx10b_walsize16G_c32r128
Average values from iostat.
r/s	rkB/s	rrqm/s	%rrqm	r_await	rareq-s	w/s	wkB/s	wrqm/s	%wrqm	w_await	wareq-s	d/s	dkB/s	drqm/s	%drqm	d_await	dareq-s	f/s	f_await	aqu-sz	%util
0.000	0.000	0.000	0.000	0.000	0.000	288.8	16365.7	8.997	3.429	0.226	59.07	2.344	4294.5	0.000	0.000	1.115	108.0	9.926	0.439	0.058	1.820		pg1222_o2nofp.cx10a_c32r128
0.000	0.000	0.000	0.000	0.000	0.000	283.2	16263.9	9.962	3.827	0.253	59.37	2.351	4325.1	0.000	0.000	1.224	113.7	9.982	0.509	0.069	1.938		pg1323_o2nofp.cx10a_c32r128
0.000	0.000	0.000	0.000	0.000	0.000	272.9	16143.5	8.129	2.819	0.493	60.82	2.355	4330.9	0.000	0.000	1.283	68.44	9.389	0.578	0.160	2.109		pg1420_o2nofp.cx10a_c32r128
0.001	0.002	0.000	0.000	0.000	0.011	271.6	16083.4	5.714	1.745	0.235	61.07	0.299	4313.2	0.000	0.000	0.014	95.56	10.02	0.441	0.056	1.583		pg1515_o2nofp.cx10a_c32r128
0.000	0.000	0.000	0.000	0.000	0.000	267.2	16049.5	6.126	1.845	0.260	61.76	0.304	4328.7	0.000	0.000	0.019	124.1	9.618	0.527	0.062	1.666		pg1611_o2nofp.cx10a_c32r128
0.000	0.000	0.000	0.000	0.000	0.000	269.2	16073.2	5.799	1.761	0.285	61.32	0.290	4317.9	0.000	0.000	0.030	83.65	9.848	0.442	0.059	1.642		pg177_o2nofp.cx10a_c32r128
0.000	0.000	0.000	0.000	0.000	0.000	266.9	16048.4	5.944	2.084	0.311	61.29	0.291	4317.9	0.000	0.000	0.005	81.70	9.268	0.528	0.069	1.688		pg181_o2nofp.cx10b_c32r128
0.000	0.000	0.000	0.000	0.000	0.000	265.4	15990.6	4.405	1.783	0.579	61.71	0.004	12.04	0.000	0.000	0.012	22.24	9.311	0.703	0.130	1.912		pg181_o2nofp.cx10b_walsize_c32r128
0.000	0.000	0.000	0.000	0.000	0.000	489.5	45009.6	9.760	3.418	0.449	88.50	0.006	0.568	0.000	0.000	0.023	1.790	16.55	0.450	0.122	3.558		pg181_o2nofp.cx10b_walsize16G_c32r128
qp500.L4
qp500.L4: point queries with 500 insert/s per client. Graphs for performance per 1-second interval are here.
Average throughput:
Query response time histogram: each cell has the percentage of responses that take <= the time in the header and max is the max response time in seconds. For max values in the top 25% of the range have a red background and in the bottom 25% of the range have a green background. The red background is not used when the min value is within 80% of the max value.
| dbms | 256us | 1ms | 4ms | 16ms | 64ms | 256ms | 1s | 4s | 16s | gt | max |
|---|---|---|---|---|---|---|---|---|---|---|---|
| pg1222_o2nofp.cx10a_c32r128 | 99.973 | 0.027 | nonzero | nonzero | nonzero | nonzero | 0.143 | ||||
| pg1323_o2nofp.cx10a_c32r128 | 99.979 | 0.021 | nonzero | nonzero | nonzero | nonzero | 0.205 | ||||
| pg1420_o2nofp.cx10a_c32r128 | 99.972 | 0.028 | nonzero | nonzero | 0.016 | ||||||
| pg1515_o2nofp.cx10a_c32r128 | 99.980 | 0.020 | nonzero | nonzero | 0.014 | ||||||
| pg1611_o2nofp.cx10a_c32r128 | 99.976 | 0.024 | nonzero | nonzero | nonzero | nonzero | 0.089 | ||||
| pg177_o2nofp.cx10a_c32r128 | 99.978 | 0.022 | nonzero | nonzero | nonzero | nonzero | 0.102 | ||||
| pg181_o2nofp.cx10b_c32r128 | 99.979 | 0.021 | nonzero | nonzero | nonzero | nonzero | 0.243 | ||||
| pg181_o2nofp.cx10b_walsize_c32r128 | 99.975 | 0.025 | nonzero | nonzero | nonzero | nonzero | 0.168 | ||||
| pg181_o2nofp.cx10b_walsize16G_c32r128 | 99.975 | 0.025 | 0.001 | nonzero | nonzero | nonzero | 0.067 |
Insert response time histogram: each cell has the percentage of responses that take <= the time in the header and max is the max response time in seconds. For max values in the top 25% of the range have a red background and in the bottom 25% of the range have a green background. The red background is not used when the min value is within 80% of the max value.
| dbms | 256us | 1ms | 4ms | 16ms | 64ms | 256ms | 1s | 4s | 16s | gt | max |
|---|---|---|---|---|---|---|---|---|---|---|---|
| pg1222_o2nofp.cx10a_c32r128 | 0.077 | 99.185 | 0.550 | 0.139 | 0.048 | 0.225 | |||||
| pg1323_o2nofp.cx10a_c32r128 | 0.099 | 99.374 | 0.377 | 0.030 | 0.121 | 0.218 | |||||
| pg1420_o2nofp.cx10a_c32r128 | 0.005 | 99.256 | 0.635 | 0.105 | 0.022 | ||||||
| pg1515_o2nofp.cx10a_c32r128 | 0.154 | 99.236 | 0.543 | 0.067 | 0.022 | ||||||
| pg1611_o2nofp.cx10a_c32r128 | 0.180 | 99.076 | 0.596 | 0.148 | 0.025 | ||||||
| pg177_o2nofp.cx10a_c32r128 | 0.108 | 99.075 | 0.700 | 0.117 | 0.022 | ||||||
| pg181_o2nofp.cx10b_c32r128 | 0.114 | 99.072 | 0.601 | 0.132 | 0.081 | 0.239 | |||||
| pg181_o2nofp.cx10b_walsize_c32r128 | 0.096 | 98.867 | 0.777 | 0.220 | 0.039 | 0.186 | |||||
| pg181_o2nofp.cx10b_walsize16G_c32r128 | 0.127 | 97.924 | 1.924 | 0.023 | 0.002 | 0.146 |
Delete response time histogram: each cell has the percentage of responses that take <= the time in the header and max is the max response time in seconds. For max values in the top 25% of the range have a red background and in the bottom 25% of the range have a green background. The red background is not used when the min value is within 80% of the max value.
| dbms | 256us | 1ms | 4ms | 16ms | 64ms | 256ms | 1s | 4s | 16s | gt | max |
|---|---|---|---|---|---|---|---|---|---|---|---|
| pg1222_o2nofp.cx10a_c32r128 | 52.650 | 47.095 | 0.179 | 0.045 | 0.031 | 0.232 | |||||
| pg1323_o2nofp.cx10a_c32r128 | 44.821 | 54.965 | 0.155 | 0.012 | 0.047 | 0.200 | |||||
| pg1420_o2nofp.cx10a_c32r128 | 43.035 | 56.699 | 0.233 | 0.033 | 0.020 | ||||||
| pg1515_o2nofp.cx10a_c32r128 | 44.273 | 55.522 | 0.190 | 0.016 | 0.021 | ||||||
| pg1611_o2nofp.cx10a_c32r128 | 42.888 | 56.859 | 0.210 | 0.044 | 0.024 | ||||||
| pg177_o2nofp.cx10a_c32r128 | 40.851 | 58.863 | 0.262 | 0.024 | 0.020 | ||||||
| pg181_o2nofp.cx10b_c32r128 | 42.500 | 57.010 | 0.368 | 0.063 | 0.059 | 0.214 | |||||
| pg181_o2nofp.cx10b_walsize_c32r128 | 39.593 | 59.825 | 0.460 | 0.093 | 0.029 | 0.185 | |||||
| pg181_o2nofp.cx10b_walsize16G_c32r128 | 78.744 | 20.345 | 0.906 | 0.003 | 0.001 | 0.145 |
Performance metrics for the DBMS listed above. Some are normalized by throughput, others are not. Legend for results is here.
ips	qps	rps	rmbps	wps	wmbps	rpq	rkbpq	wpi	wkbpi	csps	cpups	cspq	cpupq	dbgb1	dbgb2	rss	maxop	p50	p99	tag
5960	83672	0	0.0	171.8	17.3	0.000	0.000	0.029	2.971	324609	38.0	3.880	145	35.6	117.1	23.5	0.143	7023	6879	pg1222_o2nofp.cx10a_c32r128
5960	83248	0	0.0	170.4	17.1	0.000	0.000	0.029	2.939	323485	37.7	3.886	145	35.1	116.6	15.9	0.205	7007	6847	pg1323_o2nofp.cx10a_c32r128
5964	82785	0	0.0	166.6	16.7	0.000	0.000	0.028	2.859	320999	37.9	3.878	147	33.7	115.1	24.7	0.016	6959	6847	pg1420_o2nofp.cx10a_c32r128
5960	83123	0	0.0	164.3	16.6	0.000	0.000	0.028	2.851	322682	37.9	3.882	146	33.7	115.0	22.0	0.014	6975	6847	pg1515_o2nofp.cx10a_c32r128
5964	83798	0	0.0	163.1	16.5	0.000	0.000	0.027	2.831	324860	37.8	3.877	144	33.5	114.9	13.3	0.089	7055	6911	pg1611_o2nofp.cx10a_c32r128
5964	83214	0	0.0	163.9	16.6	0.000	0.000	0.027	2.845	322459	37.6	3.875	145	33.5	114.8	14.4	0.102	6975	6847	pg177_o2nofp.cx10a_c32r128
5964	83212	0	0.0	167.8	16.5	0.000	0.000	0.028	2.839	322605	37.6	3.877	145	33.4	114.7	0.4	0.243	6895	6735	pg181_o2nofp.cx10b_c32r128
5964	83022	0	0.0	167.1	16.5	0.000	0.000	0.028	2.832	321526	37.7	3.873	145	33.4	129.4	0.4	0.168	7007	6863	pg181_o2nofp.cx10b_walsize_c32r128
5964	83089	0	0.0	489.4	46.9	0.000	0.000	0.082	8.058	322157	37.8	3.877	146	33.0	49.1	0.6	0.067	6959	6831	pg181_o2nofp.cx10b_walsize16G_c32r128
Average values from iostat.
r/s	rkB/s	rrqm/s	%rrqm	r_await	rareq-s	w/s	wkB/s	wrqm/s	%wrqm	w_await	wareq-s	d/s	dkB/s	drqm/s	%drqm	d_await	dareq-s	f/s	f_await	aqu-sz	%util
0.000	0.000	0.000	0.000	0.000	0.000	171.8	17707.1	9.534	4.833	0.660	103.2	2.307	3816.0	0.000	0.000	1.631	82.42	9.231	0.762	0.158	2.415		pg1222_o2nofp.cx10a_c32r128
0.000	0.000	0.000	0.000	0.000	0.000	170.4	17518.5	10.58	5.602	0.571	102.9	2.326	3818.6	0.000	0.000	1.611	88.48	9.409	0.671	0.204	2.405		pg1323_o2nofp.cx10a_c32r128
0.001	0.004	0.000	0.000	0.000	0.011	166.6	17052.6	8.233	3.960	0.624	102.8	2.317	3760.7	0.000	0.000	1.422	43.13	9.218	0.678	0.109	2.173		pg1420_o2nofp.cx10a_c32r128
0.000	0.000	0.000	0.000	0.000	0.000	164.3	16994.5	6.337	2.866	0.269	104.0	0.268	3750.4	0.000	0.000	0.019	87.87	9.410	0.443	0.045	1.564		pg1515_o2nofp.cx10a_c32r128
0.002	0.013	0.000	0.000	0.003	0.066	163.1	16883.3	6.549	2.979	0.331	104.2	0.272	3752.5	0.000	0.000	0.019	94.62	9.267	0.564	0.053	1.722		pg1611_o2nofp.cx10a_c32r128
0.000	0.000	0.000	0.000	0.000	0.000	163.9	16968.1	6.279	2.684	0.301	104.0	0.257	3784.3	0.000	0.000	0.014	104.0	9.038	0.442	0.047	1.594		pg177_o2nofp.cx10a_c32r128
0.000	0.000	0.000	0.000	0.000	0.000	167.8	16929.5	6.286	2.609	0.701	101.0	0.256	3738.8	0.000	0.000	0.014	41.44	9.094	0.648	0.177	2.028		pg181_o2nofp.cx10b_c32r128
0.000	0.000	0.000	0.000	0.000	0.000	167.1	16890.2	5.031	2.298	0.514	101.2	0.003	0.331	0.000	0.000	0.011	1.055	9.117	0.683	0.110	1.952		pg181_o2nofp.cx10b_walsize_c32r128
0.000	0.000	0.000	0.000	0.000	0.000	489.4	48052.7	8.663	2.965	0.548	95.33	0.007	0.583	0.000	0.000	0.023	1.018	13.61	0.467	0.146	3.475		pg181_o2nofp.cx10b_walsize16G_c32r128
qr1000.L5
qr1000.L5: range queries with 1000 insert/s per client. Graphs for performance per 1-second interval are here.
Average throughput:
Query response time histogram: each cell has the percentage of responses that take <= the time in the header and max is the max response time in seconds. For max values in the top 25% of the range have a red background and in the bottom 25% of the range have a green background. The red background is not used when the min value is within 80% of the max value.
| dbms | 256us | 1ms | 4ms | 16ms | 64ms | 256ms | 1s | 4s | 16s | gt | max |
|---|---|---|---|---|---|---|---|---|---|---|---|
| pg1222_o2nofp.cx10a_c32r128 | 99.992 | 0.007 | nonzero | nonzero | nonzero | nonzero | 0.159 | ||||
| pg1323_o2nofp.cx10a_c32r128 | 99.992 | 0.007 | nonzero | nonzero | nonzero | nonzero | 0.111 | ||||
| pg1420_o2nofp.cx10a_c32r128 | 99.993 | 0.006 | nonzero | nonzero | nonzero | nonzero | 0.104 | ||||
| pg1515_o2nofp.cx10a_c32r128 | 99.993 | 0.007 | nonzero | nonzero | nonzero | nonzero | 0.102 | ||||
| pg1611_o2nofp.cx10a_c32r128 | 99.993 | 0.006 | nonzero | nonzero | nonzero | nonzero | 0.193 | ||||
| pg177_o2nofp.cx10a_c32r128 | 99.993 | 0.006 | nonzero | nonzero | nonzero | nonzero | 0.134 | ||||
| pg181_o2nofp.cx10b_c32r128 | 99.992 | 0.007 | nonzero | nonzero | nonzero | nonzero | 0.177 | ||||
| pg181_o2nofp.cx10b_walsize_c32r128 | 99.991 | 0.008 | nonzero | 0.001 | nonzero | nonzero | 0.219 | ||||
| pg181_o2nofp.cx10b_walsize16G_c32r128 | 99.988 | 0.009 | 0.002 | 0.002 | nonzero | nonzero | 0.144 |
Insert response time histogram: each cell has the percentage of responses that take <= the time in the header and max is the max response time in seconds. For max values in the top 25% of the range have a red background and in the bottom 25% of the range have a green background. The red background is not used when the min value is within 80% of the max value.
| dbms | 256us | 1ms | 4ms | 16ms | 64ms | 256ms | 1s | 4s | 16s | gt | max |
|---|---|---|---|---|---|---|---|---|---|---|---|
| pg1222_o2nofp.cx10a_c32r128 | 0.137 | 99.247 | 0.565 | 0.051 | 0.055 | ||||||
| pg1323_o2nofp.cx10a_c32r128 | 0.237 | 99.170 | 0.507 | 0.087 | 0.036 | ||||||
| pg1420_o2nofp.cx10a_c32r128 | 0.342 | 99.056 | 0.522 | 0.080 | 0.036 | ||||||
| pg1515_o2nofp.cx10a_c32r128 | 0.487 | 98.857 | 0.558 | 0.098 | 0.025 | ||||||
| pg1611_o2nofp.cx10a_c32r128 | 0.507 | 98.828 | 0.550 | 0.092 | 0.024 | 0.196 | |||||
| pg177_o2nofp.cx10a_c32r128 | 0.863 | 98.484 | 0.556 | 0.084 | 0.013 | 0.136 | |||||
| pg181_o2nofp.cx10b_c32r128 | 0.945 | 98.506 | 0.442 | 0.107 | nonzero | 0.134 | |||||
| pg181_o2nofp.cx10b_walsize_c32r128 | 0.613 | 98.535 | 0.645 | 0.152 | 0.055 | 0.247 | |||||
| pg181_o2nofp.cx10b_walsize16G_c32r128 | 0.884 | 96.302 | 2.731 | 0.082 | 0.026 |
Delete response time histogram: each cell has the percentage of responses that take <= the time in the header and max is the max response time in seconds. For max values in the top 25% of the range have a red background and in the bottom 25% of the range have a green background. The red background is not used when the min value is within 80% of the max value.
| dbms | 256us | 1ms | 4ms | 16ms | 64ms | 256ms | 1s | 4s | 16s | gt | max |
|---|---|---|---|---|---|---|---|---|---|---|---|
| pg1222_o2nofp.cx10a_c32r128 | 54.025 | 45.672 | 0.283 | 0.020 | 0.054 | ||||||
| pg1323_o2nofp.cx10a_c32r128 | 47.336 | 52.377 | 0.253 | 0.035 | 0.022 | ||||||
| pg1420_o2nofp.cx10a_c32r128 | 47.170 | 52.511 | 0.288 | 0.031 | 0.023 | ||||||
| pg1515_o2nofp.cx10a_c32r128 | 46.173 | 53.482 | 0.312 | 0.032 | 0.022 | ||||||
| pg1611_o2nofp.cx10a_c32r128 | 45.862 | 53.809 | 0.287 | 0.035 | 0.006 | 0.194 | |||||
| pg177_o2nofp.cx10a_c32r128 | 44.479 | 55.178 | 0.311 | 0.030 | 0.002 | 0.135 | |||||
| pg181_o2nofp.cx10b_c32r128 | 38.004 | 61.616 | 0.316 | 0.064 | nonzero | 0.133 | |||||
| pg181_o2nofp.cx10b_walsize_c32r128 | 38.924 | 60.592 | 0.382 | 0.072 | 0.031 | 0.239 | |||||
| pg181_o2nofp.cx10b_walsize16G_c32r128 | 73.375 | 25.103 | 1.493 | 0.029 | 0.026 |
Performance metrics for the DBMS listed above. Some are normalized by throughput, others are not. Legend for results is here.
ips	qps	rps	rmbps	wps	wmbps	rpq	rkbpq	wpi	wkbpi	csps	cpups	cspq	cpupq	dbgb1	dbgb2	rss	maxop	p50	p99	tag
11920	140003	0	0.0	210.9	21.7	0.000	0.000	0.018	1.866	536133	39.8	3.829	91	35.5	111.7	16.5	0.159	11694	11279	pg1222_o2nofp.cx10a_c32r128
11920	140701	0	0.0	208.9	21.5	0.000	0.000	0.018	1.846	538957	39.8	3.831	91	35.1	111.3	19.3	0.111	11758	11374	pg1323_o2nofp.cx10a_c32r128
11920	142100	0	0.0	203.3	20.9	0.000	0.000	0.017	1.797	543927	39.7	3.828	89	33.7	109.7	29.4	0.104	11918	11503	pg1420_o2nofp.cx10a_c32r128
11920	140543	0	0.0	201.1	20.9	0.000	0.000	0.017	1.796	537680	39.7	3.826	90	33.7	109.7	26.5	0.102	11727	11279	pg1515_o2nofp.cx10a_c32r128
11927	142041	0	0.0	200.0	20.8	0.000	0.000	0.017	1.784	543185	39.6	3.824	89	33.5	109.5	24.4	0.193	11887	11406	pg1611_o2nofp.cx10a_c32r128
11927	142705	0	0.0	201.0	20.7	0.000	0.000	0.017	1.780	545292	39.6	3.821	89	33.6	109.6	0.6	0.134	12030	11534	pg177_o2nofp.cx10a_c32r128
11927	142783	0	0.0	208.9	21.3	0.000	0.000	0.018	1.831	546000	39.8	3.824	89	33.4	109.5	0.5	0.177	11951	11295	pg181_o2nofp.cx10b_c32r128
11927	141182	0	0.0	205.5	21.1	0.000	0.000	0.017	1.812	539225	39.7	3.819	90	33.4	129.4	10.3	0.219	11871	11454	pg181_o2nofp.cx10b_walsize_c32r128
11927	143163	0	0.0	1013.9	93.1	0.000	0.000	0.085	7.997	548335	39.8	3.830	89	32.8	48.8	0.7	0.144	12014	11532	pg181_o2nofp.cx10b_walsize16G_c32r128
Average values from iostat.
r/s	rkB/s	rrqm/s	%rrqm	r_await	rareq-s	w/s	wkB/s	wrqm/s	%wrqm	w_await	wareq-s	d/s	dkB/s	drqm/s	%drqm	d_await	dareq-s	f/s	f_await	aqu-sz	%util
0.000	0.000	0.000	0.000	0.000	0.000	210.9	22244.1	9.612	3.794	0.278	105.4	2.302	3232.0	0.000	0.000	1.333	122.5	13.43	0.531	0.063	2.352		pg1222_o2nofp.cx10a_c32r128
0.001	0.002	0.000	0.000	0.003	0.011	208.9	22000.0	11.30	4.800	0.345	105.2	2.298	3148.9	0.000	0.000	1.311	87.89	13.35	0.523	0.085	2.389		pg1323_o2nofp.cx10a_c32r128
0.000	0.000	0.000	0.000	0.000	0.000	203.3	21419.7	8.947	3.460	0.288	105.5	2.301	3214.0	0.000	0.000	1.258	67.12	13.41	0.551	0.065	2.328		pg1420_o2nofp.cx10a_c32r128
0.000	0.000	0.000	0.000	0.000	0.000	201.1	21409.5	6.892	2.417	0.213	106.8	0.225	3156.7	0.000	0.000	0.010	147.3	13.35	0.436	0.051	1.865		pg1515_o2nofp.cx10a_c32r128
0.000	0.000	0.000	0.000	0.000	0.000	200.0	21283.6	7.229	2.610	0.481	106.7	0.233	3190.4	0.000	0.000	0.030	219.4	13.16	0.646	0.115	2.360		pg1611_o2nofp.cx10a_c32r128
0.000	0.000	0.000	0.000	0.000	0.000	201.0	21235.3	6.766	2.183	0.490	105.8	0.206	3086.9	0.000	0.000	0.008	41.84	13.47	0.656	0.113	2.397		pg177_o2nofp.cx10a_c32r128
0.001	0.004	0.000	0.000	0.000	0.011	208.9	21835.0	6.996	2.710	0.338	104.2	0.217	3086.2	0.000	0.000	0.088	54.11	13.37	0.549	0.078	2.161		pg181_o2nofp.cx10b_c32r128
0.000	0.000	0.000	0.000	0.000	0.000	205.5	21607.5	5.727	2.202	0.577	105.0	0.005	41.08	0.000	0.000	0.013	85.04	13.45	0.765	0.187	2.646		pg181_o2nofp.cx10b_walsize_c32r128
0.000	0.000	0.000	0.000	0.000	0.000	1013.9	95381.4	17.41	2.825	0.342	92.75	0.038	225.0	0.000	0.000	0.094	215.1	27.21	0.457	0.222	5.671		pg181_o2nofp.cx10b_walsize16G_c32r128
qp1000.L6
qp1000.L6: point queries with 1000 insert/s per client. Graphs for performance per 1-second interval are here.
Average throughput:
Query response time histogram: each cell has the percentage of responses that take <= the time in the header and max is the max response time in seconds. For max values in the top 25% of the range have a red background and in the bottom 25% of the range have a green background. The red background is not used when the min value is within 80% of the max value.
| dbms | 256us | 1ms | 4ms | 16ms | 64ms | 256ms | 1s | 4s | 16s | gt | max |
|---|---|---|---|---|---|---|---|---|---|---|---|
| pg1222_o2nofp.cx10a_c32r128 | 99.947 | 0.053 | nonzero | nonzero | nonzero | nonzero | 0.168 | ||||
| pg1323_o2nofp.cx10a_c32r128 | 99.947 | 0.053 | nonzero | nonzero | nonzero | nonzero | 0.123 | ||||
| pg1420_o2nofp.cx10a_c32r128 | 99.950 | 0.049 | nonzero | nonzero | nonzero | nonzero | 0.108 | ||||
| pg1515_o2nofp.cx10a_c32r128 | 99.954 | 0.046 | nonzero | nonzero | nonzero | nonzero | 0.112 | ||||
| pg1611_o2nofp.cx10a_c32r128 | 99.951 | 0.048 | nonzero | nonzero | nonzero | nonzero | 0.111 | ||||
| pg177_o2nofp.cx10a_c32r128 | 99.956 | 0.043 | nonzero | nonzero | nonzero | nonzero | 0.119 | ||||
| pg181_o2nofp.cx10b_c32r128 | 99.954 | 0.045 | nonzero | nonzero | nonzero | nonzero | 0.119 | ||||
| pg181_o2nofp.cx10b_walsize_c32r128 | 99.953 | 0.047 | nonzero | nonzero | nonzero | nonzero | 0.250 | ||||
| pg181_o2nofp.cx10b_walsize16G_c32r128 | 99.946 | 0.052 | 0.001 | 0.001 | nonzero | nonzero | 0.124 |
Insert response time histogram: each cell has the percentage of responses that take <= the time in the header and max is the max response time in seconds. For max values in the top 25% of the range have a red background and in the bottom 25% of the range have a green background. The red background is not used when the min value is within 80% of the max value.
| dbms | 256us | 1ms | 4ms | 16ms | 64ms | 256ms | 1s | 4s | 16s | gt | max |
|---|---|---|---|---|---|---|---|---|---|---|---|
| pg1222_o2nofp.cx10a_c32r128 | 0.263 | 99.107 | 0.554 | 0.071 | 0.006 | 0.147 | |||||
| pg1323_o2nofp.cx10a_c32r128 | 0.414 | 99.020 | 0.452 | 0.102 | 0.012 | 0.131 | |||||
| pg1420_o2nofp.cx10a_c32r128 | 0.503 | 98.880 | 0.508 | 0.108 | nonzero | 0.109 | |||||
| pg1515_o2nofp.cx10a_c32r128 | 0.431 | 98.931 | 0.533 | 0.105 | 0.034 | ||||||
| pg1611_o2nofp.cx10a_c32r128 | 0.571 | 98.825 | 0.492 | 0.111 | 0.028 | ||||||
| pg177_o2nofp.cx10a_c32r128 | 0.665 | 98.707 | 0.464 | 0.160 | 0.005 | 0.094 | |||||
| pg181_o2nofp.cx10b_c32r128 | 0.578 | 98.895 | 0.415 | 0.112 | 0.040 | ||||||
| pg181_o2nofp.cx10b_walsize_c32r128 | 0.327 | 98.987 | 0.444 | 0.142 | 0.100 | nonzero | 0.406 | ||||
| pg181_o2nofp.cx10b_walsize16G_c32r128 | 0.587 | 96.497 | 2.844 | 0.072 | 0.030 |
Delete response time histogram: each cell has the percentage of responses that take <= the time in the header and max is the max response time in seconds. For max values in the top 25% of the range have a red background and in the bottom 25% of the range have a green background. The red background is not used when the min value is within 80% of the max value.
| dbms | 256us | 1ms | 4ms | 16ms | 64ms | 256ms | 1s | 4s | 16s | gt | max |
|---|---|---|---|---|---|---|---|---|---|---|---|
| pg1222_o2nofp.cx10a_c32r128 | 57.066 | 42.456 | 0.424 | 0.051 | 0.003 | 0.147 | |||||
| pg1323_o2nofp.cx10a_c32r128 | 50.209 | 49.313 | 0.395 | 0.073 | 0.011 | 0.132 | |||||
| pg1420_o2nofp.cx10a_c32r128 | 50.683 | 48.740 | 0.499 | 0.078 | nonzero | 0.108 | |||||
| pg1515_o2nofp.cx10a_c32r128 | 49.848 | 49.593 | 0.477 | 0.083 | 0.027 | ||||||
| pg1611_o2nofp.cx10a_c32r128 | 49.423 | 50.041 | 0.452 | 0.084 | 0.025 | ||||||
| pg177_o2nofp.cx10a_c32r128 | 48.900 | 50.432 | 0.518 | 0.145 | 0.004 | 0.093 | |||||
| pg181_o2nofp.cx10b_c32r128 | 39.789 | 59.755 | 0.385 | 0.071 | 0.039 | ||||||
| pg181_o2nofp.cx10b_walsize_c32r128 | 39.443 | 59.956 | 0.408 | 0.105 | 0.088 | 0.251 | |||||
| pg181_o2nofp.cx10b_walsize16G_c32r128 | 73.622 | 25.050 | 1.309 | 0.019 | 0.027 |
Performance metrics for the DBMS listed above. Some are normalized by throughput, others are not. Legend for results is here.
ips	qps	rps	rmbps	wps	wmbps	rpq	rkbpq	wpi	wkbpi	csps	cpups	cspq	cpupq	dbgb1	dbgb2	rss	maxop	p50	p99	tag
11920	83116	0	0.0	212.6	22.2	0.000	0.000	0.018	1.904	323254	39.1	3.889	151	35.2	107.8	1.1	0.168	6991	6751	pg1222_o2nofp.cx10a_c32r128
11927	82771	0	0.0	211.5	22.0	0.000	0.000	0.018	1.889	322120	39.2	3.892	152	34.8	107.3	6.6	0.123	6927	6703	pg1323_o2nofp.cx10a_c32r128
11920	82164	0	0.0	207.5	21.5	0.000	0.000	0.017	1.848	320170	38.9	3.897	152	33.6	106.0	23.2	0.108	6927	6719	pg1420_o2nofp.cx10a_c32r128
11927	82480	0	0.0	205.1	21.5	0.000	0.000	0.017	1.846	320422	39.0	3.885	151	33.6	105.9	17.8	0.112	6911	6703	pg1515_o2nofp.cx10a_c32r128
11927	83029	0	0.0	204.9	21.4	0.000	0.000	0.017	1.833	322640	39.1	3.886	151	33.4	105.8	5.8	0.111	6991	6719	pg1611_o2nofp.cx10a_c32r128
11920	82601	0	0.0	205.1	21.4	0.000	0.000	0.017	1.841	321099	38.8	3.887	150	33.4	105.8	3.8	0.119	6991	6815	pg177_o2nofp.cx10a_c32r128
11927	82561	0	0.0	202.2	21.0	0.000	0.000	0.017	1.804	320836	38.9	3.886	151	33.2	105.7	13.6	0.119	6943	6717	pg181_o2nofp.cx10b_c32r128
11927	82257	0	0.0	203.5	21.1	0.000	0.000	0.017	1.815	319360	38.9	3.882	151	33.2	129.3	4.6	0.250	6927	6431	pg181_o2nofp.cx10b_walsize_c32r128
11920	82442	0	0.0	937.4	85.4	0.000	0.000	0.079	7.334	320741	39.0	3.891	151	32.7	48.7	8.0	0.124	6911	6671	pg181_o2nofp.cx10b_walsize16G_c32r128
Average values from iostat.
r/s	rkB/s	rrqm/s	%rrqm	r_await	rareq-s	w/s	wkB/s	wrqm/s	%wrqm	w_await	wareq-s	d/s	dkB/s	drqm/s	%drqm	d_await	dareq-s	f/s	f_await	aqu-sz	%util
0.000	0.000	0.000	0.000	0.000	0.000	212.6	22700.2	9.781	4.074	0.417	105.5	2.270	2334.9	0.000	0.000	1.433	102.2	13.29	0.574	0.150	2.772		pg1222_o2nofp.cx10a_c32r128
0.002	0.009	0.000	0.000	0.001	0.011	211.5	22535.0	11.66	5.142	0.356	105.0	2.269	2353.7	0.000	0.000	1.267	114.6	13.29	0.548	0.120	2.593		pg1323_o2nofp.cx10a_c32r128
0.000	0.000	0.000	0.000	0.000	0.000	207.5	22031.4	9.368	3.749	0.328	104.7	2.255	2217.0	0.000	0.000	1.240	69.65	13.15	0.523	0.087	2.398		pg1420_o2nofp.cx10a_c32r128
0.000	0.000	0.000	0.000	0.000	0.000	205.1	22014.0	7.407	2.535	0.369	106.1	0.172	2238.5	0.000	0.000	0.064	416.0	13.09	0.552	0.112	2.342		pg1515_o2nofp.cx10a_c32r128
0.002	0.013	0.000	0.000	0.000	0.044	204.9	21864.2	7.621	2.763	0.301	105.7	0.170	2219.1	0.000	0.000	0.023	268.2	13.35	0.533	0.064	2.082		pg1611_o2nofp.cx10a_c32r128
0.000	0.000	0.000	0.000	0.000	0.000	205.1	21943.3	7.276	2.472	0.402	105.6	0.152	2284.5	0.000	0.000	0.028	269.1	13.02	0.549	0.102	2.169		pg177_o2nofp.cx10a_c32r128
0.000	0.000	0.000	0.000	0.000	0.000	202.2	21516.1	7.578	2.636	0.394	105.5	0.157	2249.5	0.000	0.000	0.051	310.2	12.89	0.570	0.080	2.203		pg181_o2nofp.cx10b_c32r128
0.000	0.000	0.000	0.000	0.000	0.000	203.5	21653.2	6.930	2.523	0.890	105.8	0.022	178.7	0.000	0.000	0.069	275.0	12.94	0.907	0.371	3.118		pg181_o2nofp.cx10b_walsize_c32r128
0.000	0.000	0.000	0.000	0.000	0.000	937.4	87430.7	17.09	3.005	0.372	91.83	0.027	110.6	0.000	0.000	0.089	95.27	24.95	0.459	0.210	5.226		pg181_o2nofp.cx10b_walsize16G_c32r128
l.i0
l.i0: load without secondary indexes
Performance metrics for all DBMS, not just the ones listed above. Some are normalized by throughput, others are not. Legend for results is here.
ips	qps	rps	rmbps	wps	wmbps	rpq	rkbpq	wpi	wkbpi	csps	cpups	cspq	cpupq	dbgb1	dbgb2	rss	maxop	p50	p99	tag
1111111	0	0	0.0	4029.0	466.5	0.000	0.000	0.004	0.430	122298	48.1	0.110	14	11.5	31.0	5.4	0.006	114287	106988	pg1222_o2nofp.cx10a_c32r128
991736	0	1	0.0	3643.5	422.8	0.000	0.000	0.004	0.437	109430	43.5	0.110	14	11.5	31.1	3.3	2.080	114188	7799	pg1323_o2nofp.cx10a_c32r128
1061947	0	1	0.0	3855.6	444.9	0.000	0.000	0.004	0.429	119093	48.0	0.112	14	11.5	31.1	7.7	0.006	109786	105588	pg1420_o2nofp.cx10a_c32r128
1121495	0	1	0.0	4048.4	468.1	0.000	0.000	0.004	0.427	123418	48.8	0.110	14	11.5	31.1	1.5	0.009	114586	107287	pg1515_o2nofp.cx10a_c32r128
1100917	0	1	0.0	4040.8	467.3	0.000	0.000	0.004	0.435	122999	48.7	0.112	14	11.5	31.1	1.5	0.005	114186	107688	pg1611_o2nofp.cx10a_c32r128
1090909	0	1	0.0	3944.7	455.5	0.000	0.000	0.004	0.428	111362	47.1	0.102	14	11.5	31.1	0.2	0.005	113687	108587	pg177_o2nofp.cx10a_c32r128
1100917	0	2	0.0	3933.7	454.1	0.000	0.000	0.004	0.422	110935	47.3	0.101	14	11.5	31.1	0.2	0.005	112987	106487	pg181_o2nofp.cx10b_c32r128
937500	0	1	0.0	3540.6	410.3	0.000	0.000	0.004	0.448	98729	42.1	0.105	14	11.5	31.1	0.6	2.119	112187	0	pg181_o2nofp.cx10b_walsize_c32r128
1081081	0	1	0.0	4258.0	490.8	0.000	0.000	0.004	0.465	110404	47.4	0.102	14	11.5	27.5	0.2	0.032	113087	94488	pg181_o2nofp.cx10b_walsize16G_c32r128
l.x
l.x: create secondary indexes
Performance metrics for all DBMS, not just the ones listed above. Some are normalized by throughput, others are not. Legend for results is here.
ips	qps	rps	rmbps	wps	wmbps	rpq	rkbpq	wpi	wkbpi	csps	cpups	cspq	cpupq	dbgb1	dbgb2	rss	maxop	p50	p99	tag
2307694	0	0	0.0	5463.2	668.9	0.000	0.000	0.002	0.297	29036	23.8	0.013	3	23.1	53.1	6.8	0.049	NA	NA	pg1222_o2nofp.cx10a_c32r128
2222224	0	1	0.0	5043.8	618.2	0.000	0.000	0.002	0.285	23090	23.5	0.010	3	23.1	53.2	6.9	0.007	NA	NA	pg1323_o2nofp.cx10a_c32r128
2264153	0	1	0.0	5209.7	637.9	0.000	0.000	0.002	0.289	23042	25.3	0.010	4	23.1	53.2	6.8	0.036	NA	NA	pg1420_o2nofp.cx10a_c32r128
2307694	0	2	0.0	5527.3	677.6	0.000	0.000	0.002	0.301	27925	24.2	0.012	3	23.1	53.2	6.9	0.041	NA	NA	pg1515_o2nofp.cx10a_c32r128
2352943	0	1	0.0	5579.9	684.3	0.000	0.000	0.002	0.298	28507	23.7	0.012	3	23.1	53.2	6.9	0.003	NA	NA	pg1611_o2nofp.cx10a_c32r128
2448982	0	1	0.0	5542.8	679.4	0.000	0.000	0.002	0.284	16422	22.9	0.007	3	23.1	53.1	6.3	0.007	NA	NA	pg177_o2nofp.cx10a_c32r128
2448982	0	0	0.0	5406.2	662.4	0.000	0.000	0.002	0.277	16222	23.4	0.007	3	23.1	53.1	7.0	0.033	NA	NA	pg181_o2nofp.cx10b_c32r128
2033900	0	1	0.0	4572.9	560.6	0.000	0.000	0.002	0.282	15709	19.3	0.008	3	23.1	53.1	7.1	0.024	NA	NA	pg181_o2nofp.cx10b_walsize_c32r128
2926832	0	1	0.0	4553.1	554.8	0.000	0.000	0.002	0.194	4877	27.2	0.002	3	23.1	39.1	7.0	0.003	NA	NA	pg181_o2nofp.cx10b_walsize16G_c32r128
l.i1
l.i1: continue load after secondary indexes created with 50 inserts per transaction
Performance metrics for all DBMS, not just the ones listed above. Some are normalized by throughput, others are not. Legend for results is here.
ips	qps	rps	rmbps	wps	wmbps	rpq	rkbpq	wpi	wkbpi	csps	cpups	cspq	cpupq	dbgb1	dbgb2	rss	maxop	p50	p99	tag
283604	0	0	0.0	3843.5	420.4	0.000	0.000	0.014	1.518	125276	64.2	0.442	72	35.4	131.5	25.1	1.077	31196	2050	pg1222_o2nofp.cx10a_c32r128
284024	0	0	0.0	3812.0	416.2	0.000	0.000	0.013	1.500	123893	65.8	0.436	74	35.0	131.1	24.5	0.945	29795	2250	pg1323_o2nofp.cx10a_c32r128
288722	0	0	0.0	3817.0	411.1	0.000	0.000	0.013	1.458	126885	62.3	0.439	69	33.5	129.5	24.6	1.039	29595	700	pg1420_o2nofp.cx10a_c32r128
275862	0	0	0.0	3632.0	391.3	0.000	0.000	0.013	1.452	124852	60.2	0.453	70	33.5	129.5	27.1	0.728	31196	1800	pg1515_o2nofp.cx10a_c32r128
278665	0	0	0.0	3484.6	390.9	0.000	0.000	0.013	1.436	127684	61.4	0.458	71	33.2	129.2	28.7	0.616	27396	2850	pg1611_o2nofp.cx10a_c32r128
282353	0	1	0.0	3592.0	402.8	0.000	0.000	0.013	1.461	117515	61.1	0.416	69	33.2	129.3	29.4	0.827	28946	850	pg177_o2nofp.cx10a_c32r128
286140	0	0	0.0	3657.3	409.6	0.000	0.000	0.013	1.466	118065	61.9	0.413	69	33.0	129.1	30.1	0.675	28246	900	pg181_o2nofp.cx10b_c32r128
231604	0	0	0.0	3007.8	337.1	0.000	0.000	0.013	1.490	96183	50.6	0.415	70	33.0	129.1	15.1	1.279	22397	500	pg181_o2nofp.cx10b_walsize_c32r128
249351	0	1	0.0	7659.7	858.0	0.000	0.000	0.031	3.523	117578	55.1	0.472	71	32.8	48.9	27.2	0.135	25297	2950	pg181_o2nofp.cx10b_walsize16G_c32r128
l.i2
l.i2: continue load after secondary indexes created with 5 inserts per transaction
Performance metrics for all DBMS, not just the ones listed above. Some are normalized by throughput, others are not. Legend for results is here.
ips	qps	rps	rmbps	wps	wmbps	rpq	rkbpq	wpi	wkbpi	csps	cpups	cspq	cpupq	dbgb1	dbgb2	rss	maxop	p50	p99	tag
63660	0	0	0.0	600.9	66.2	0.000	0.000	0.009	1.064	271715	57.0	4.268	287	35.5	131.6	8.0	0.047	4389	2955	pg1222_o2nofp.cx10a_c32r128
58896	0	0	0.0	551.1	60.6	0.000	0.000	0.009	1.054	255811	53.3	4.343	290	35.1	131.2	10.2	0.093	4129	2755	pg1323_o2nofp.cx10a_c32r128
60226	0	0	0.0	573.4	63.6	0.000	0.000	0.010	1.081	266223	52.4	4.420	278	33.6	129.7	27.2	0.091	3945	2250	pg1420_o2nofp.cx10a_c32r128
61856	0	0	0.0	594.0	66.2	0.000	0.000	0.010	1.095	272955	52.8	4.413	273	33.5	129.6	2.7	0.106	4814	3655	pg1515_o2nofp.cx10a_c32r128
59776	0	0	0.0	571.5	63.7	0.000	0.000	0.010	1.092	264249	52.5	4.421	281	33.4	129.5	24.1	0.093	3960	2735	pg1611_o2nofp.cx10a_c32r128
62419	0	0	0.0	591.4	65.6	0.000	0.000	0.009	1.076	250304	53.1	4.010	272	33.4	129.5	9.2	0.094	4729	3460	pg177_o2nofp.cx10a_c32r128
60759	0	0	0.0	570.1	63.3	0.000	0.000	0.009	1.067	241471	52.7	3.974	278	33.2	129.3	25.4	0.095	3929	2415	pg181_o2nofp.cx10b_c32r128
59480	0	0	0.0	533.7	59.1	0.000	0.000	0.009	1.017	238100	51.6	4.003	278	33.2	129.3	14.6	0.107	3900	2170	pg181_o2nofp.cx10b_walsize_c32r128
71217	0	0	0.0	6966.5	535.5	0.000	0.000	0.098	7.700	280909	57.0	3.944	256	33.0	49.0	28.0	0.022	5524	2495	pg181_o2nofp.cx10b_walsize16G_c32r128
qr100.L1
qr100.L1: range queries with 100 insert/s per client
Performance metrics for all DBMS, not just the ones listed above. Some are normalized by throughput, others are not. Legend for results is here.
ips	qps	rps	rmbps	wps	wmbps	rpq	rkbpq	wpi	wkbpi	csps	cpups	cspq	cpupq	dbgb1	dbgb2	rss	maxop	p50	p99	tag
1193	145403	0	0.0	64.9	5.6	0.000	0.000	0.054	4.848	555557	37.5	3.821	83	35.5	131.6	0.6	0.002	12126	11631	pg1222_o2nofp.cx10a_c32r128
1192	145900	0	0.0	65.0	5.7	0.000	0.000	0.055	4.870	557825	37.6	3.823	82	35.1	131.1	0.5	0.004	12254	12015	pg1323_o2nofp.cx10a_c32r128
1193	147709	0	0.0	65.8	5.8	0.000	0.000	0.055	4.959	564308	37.4	3.820	81	33.6	129.6	0.5	0.017	12286	12078	pg1420_o2nofp.cx10a_c32r128
1192	145769	0	0.0	63.4	5.8	0.000	0.000	0.053	4.943	557144	37.4	3.822	82	33.5	129.6	0.5	0.003	12318	12062	pg1515_o2nofp.cx10a_c32r128
1192	147343	0	0.0	63.3	5.8	0.000	0.000	0.053	4.958	563157	37.3	3.822	81	33.4	129.4	4.9	0.003	12366	12158	pg1611_o2nofp.cx10a_c32r128
1193	147861	0	0.0	63.7	5.8	0.000	0.000	0.053	4.949	564745	37.4	3.819	81	33.4	129.4	0.4	0.003	12462	12238	pg177_o2nofp.cx10a_c32r128
1192	147902	0	0.0	63.8	5.8	0.000	0.000	0.054	4.960	565245	37.3	3.822	81	33.2	129.3	0.5	0.002	12510	12270	pg181_o2nofp.cx10b_c32r128
1192	146096	0	0.0	64.0	5.8	0.000	0.000	0.054	4.970	558324	37.5	3.822	82	33.2	129.3	0.4	0.013	12222	11982	pg181_o2nofp.cx10b_walsize_c32r128
1192	147078	0	0.0	80.1	6.7	0.000	0.000	0.067	5.758	562101	37.5	3.822	82	33.0	49.0	0.5	0.002	12350	12126	pg181_o2nofp.cx10b_walsize16G_c32r128
qp100.L2
qp100.L2: point queries with 100 insert/s per client
Performance metrics for all DBMS, not just the ones listed above. Some are normalized by throughput, others are not. Legend for results is here.
ips	qps	rps	rmbps	wps	wmbps	rpq	rkbpq	wpi	wkbpi	csps	cpups	cspq	cpupq	dbgb1	dbgb2	rss	maxop	p50	p99	tag
1193	84167	0	0.0	181.8	11.1	0.000	0.000	0.152	9.549	325462	36.9	3.867	140	35.5	131.1	0.6	0.002	7119	6975	pg1222_o2nofp.cx10a_c32r128
1192	83804	0	0.0	177.8	11.0	0.000	0.000	0.149	9.468	324386	36.8	3.871	141	35.1	130.5	0.5	0.015	6991	6911	pg1323_o2nofp.cx10a_c32r128
1193	83017	0	0.0	170.9	10.8	0.000	0.000	0.143	9.295	320955	36.9	3.866	142	33.6	128.9	0.5	0.003	6959	6879	pg1420_o2nofp.cx10a_c32r128
1192	83422	0	0.0	169.2	10.8	0.000	0.000	0.142	9.288	322635	36.9	3.868	142	33.5	128.8	0.5	0.002	7023	6911	pg1515_o2nofp.cx10a_c32r128
1192	83928	0	0.0	165.7	10.7	0.000	0.000	0.139	9.220	324536	37.0	3.867	141	33.4	128.7	4.5	0.002	7071	6959	pg1611_o2nofp.cx10a_c32r128
1193	83776	0	0.0	166.3	10.8	0.000	0.000	0.139	9.230	323712	36.9	3.864	141	33.4	128.6	0.4	0.002	7055	6911	pg177_o2nofp.cx10a_c32r128
1192	83614	0	0.0	165.1	10.7	0.000	0.000	0.138	9.216	323278	36.9	3.866	141	33.2	128.5	0.5	0.002	7071	6927	pg181_o2nofp.cx10b_c32r128
1192	83630	0	0.0	164.5	10.7	0.000	0.000	0.138	9.194	323325	36.9	3.866	141	33.2	129.3	0.4	0.003	7023	6911	pg181_o2nofp.cx10b_walsize_c32r128
1193	83619	0	0.0	158.9	11.4	0.000	0.000	0.133	9.790	323128	37.0	3.864	142	33.0	49.0	0.5	0.003	6991	6911	pg181_o2nofp.cx10b_walsize16G_c32r128
qr500.L3
qr500.L3: range queries with 500 insert/s per client
Performance metrics for all DBMS, not just the ones listed above. Some are normalized by throughput, others are not. Legend for results is here.
ips	qps	rps	rmbps	wps	wmbps	rpq	rkbpq	wpi	wkbpi	csps	cpups	cspq	cpupq	dbgb1	dbgb2	rss	maxop	p50	p99	tag
5964	141614	0	0.0	288.8	16.0	0.000	0.000	0.048	2.744	542412	38.6	3.830	87	35.5	123.7	14.7	0.021	11807	11359	pg1222_o2nofp.cx10a_c32r128
5960	142306	0	0.0	283.2	15.9	0.000	0.000	0.048	2.729	545442	38.7	3.833	87	35.1	123.1	22.9	0.086	11935	11518	pg1323_o2nofp.cx10a_c32r128
5964	143579	0	0.0	272.9	15.8	0.000	0.000	0.046	2.707	549305	38.5	3.826	86	33.7	121.6	22.4	0.173	12031	11295	pg1420_o2nofp.cx10a_c32r128
5960	141957	0	0.0	271.6	15.7	0.000	0.000	0.046	2.698	543855	38.5	3.831	87	33.6	121.4	20.4	0.021	11886	11454	pg1515_o2nofp.cx10a_c32r128
5964	143416	0	0.0	267.2	15.7	0.000	0.000	0.045	2.691	548658	38.5	3.826	86	33.5	121.3	26.4	0.022	12110	11662	pg1611_o2nofp.cx10a_c32r128
5964	144168	0	0.0	269.2	15.7	0.000	0.000	0.045	2.695	551687	38.5	3.827	85	33.5	121.3	8.7	0.020	12126	11583	pg177_o2nofp.cx10a_c32r128
5964	144498	0	0.0	266.9	15.7	0.000	0.000	0.045	2.691	552566	38.5	3.824	85	33.3	121.1	0.4	0.019	12079	11662	pg181_o2nofp.cx10b_c32r128
5960	142192	0	0.0	265.4	15.6	0.000	0.000	0.045	2.683	543769	38.5	3.824	87	33.3	129.3	0.4	0.206	11902	11406	pg181_o2nofp.cx10b_walsize_c32r128
5964	144881	0	0.0	489.5	44.0	0.000	0.000	0.082	7.548	554534	38.5	3.828	85	33.0	49.1	5.8	0.016	12174	11870	pg181_o2nofp.cx10b_walsize16G_c32r128
qp500.L4
qp500.L4: point queries with 500 insert/s per client
Performance metrics for all DBMS, not just the ones listed above. Some are normalized by throughput, others are not. Legend for results is here.
ips	qps	rps	rmbps	wps	wmbps	rpq	rkbpq	wpi	wkbpi	csps	cpups	cspq	cpupq	dbgb1	dbgb2	rss	maxop	p50	p99	tag
5960	83672	0	0.0	171.8	17.3	0.000	0.000	0.029	2.971	324609	38.0	3.880	145	35.6	117.1	23.5	0.143	7023	6879	pg1222_o2nofp.cx10a_c32r128
5960	83248	0	0.0	170.4	17.1	0.000	0.000	0.029	2.939	323485	37.7	3.886	145	35.1	116.6	15.9	0.205	7007	6847	pg1323_o2nofp.cx10a_c32r128
5964	82785	0	0.0	166.6	16.7	0.000	0.000	0.028	2.859	320999	37.9	3.878	147	33.7	115.1	24.7	0.016	6959	6847	pg1420_o2nofp.cx10a_c32r128
5960	83123	0	0.0	164.3	16.6	0.000	0.000	0.028	2.851	322682	37.9	3.882	146	33.7	115.0	22.0	0.014	6975	6847	pg1515_o2nofp.cx10a_c32r128
5964	83798	0	0.0	163.1	16.5	0.000	0.000	0.027	2.831	324860	37.8	3.877	144	33.5	114.9	13.3	0.089	7055	6911	pg1611_o2nofp.cx10a_c32r128
5964	83214	0	0.0	163.9	16.6	0.000	0.000	0.027	2.845	322459	37.6	3.875	145	33.5	114.8	14.4	0.102	6975	6847	pg177_o2nofp.cx10a_c32r128
5964	83212	0	0.0	167.8	16.5	0.000	0.000	0.028	2.839	322605	37.6	3.877	145	33.4	114.7	0.4	0.243	6895	6735	pg181_o2nofp.cx10b_c32r128
5964	83022	0	0.0	167.1	16.5	0.000	0.000	0.028	2.832	321526	37.7	3.873	145	33.4	129.4	0.4	0.168	7007	6863	pg181_o2nofp.cx10b_walsize_c32r128
5964	83089	0	0.0	489.4	46.9	0.000	0.000	0.082	8.058	322157	37.8	3.877	146	33.0	49.1	0.6	0.067	6959	6831	pg181_o2nofp.cx10b_walsize16G_c32r128
qr1000.L5
qr1000.L5: range queries with 1000 insert/s per client
Performance metrics for all DBMS, not just the ones listed above. Some are normalized by throughput, others are not. Legend for results is here.
ips	qps	rps	rmbps	wps	wmbps	rpq	rkbpq	wpi	wkbpi	csps	cpups	cspq	cpupq	dbgb1	dbgb2	rss	maxop	p50	p99	tag
11920	140003	0	0.0	210.9	21.7	0.000	0.000	0.018	1.866	536133	39.8	3.829	91	35.5	111.7	16.5	0.159	11694	11279	pg1222_o2nofp.cx10a_c32r128
11920	140701	0	0.0	208.9	21.5	0.000	0.000	0.018	1.846	538957	39.8	3.831	91	35.1	111.3	19.3	0.111	11758	11374	pg1323_o2nofp.cx10a_c32r128
11920	142100	0	0.0	203.3	20.9	0.000	0.000	0.017	1.797	543927	39.7	3.828	89	33.7	109.7	29.4	0.104	11918	11503	pg1420_o2nofp.cx10a_c32r128
11920	140543	0	0.0	201.1	20.9	0.000	0.000	0.017	1.796	537680	39.7	3.826	90	33.7	109.7	26.5	0.102	11727	11279	pg1515_o2nofp.cx10a_c32r128
11927	142041	0	0.0	200.0	20.8	0.000	0.000	0.017	1.784	543185	39.6	3.824	89	33.5	109.5	24.4	0.193	11887	11406	pg1611_o2nofp.cx10a_c32r128
11927	142705	0	0.0	201.0	20.7	0.000	0.000	0.017	1.780	545292	39.6	3.821	89	33.6	109.6	0.6	0.134	12030	11534	pg177_o2nofp.cx10a_c32r128
11927	142783	0	0.0	208.9	21.3	0.000	0.000	0.018	1.831	546000	39.8	3.824	89	33.4	109.5	0.5	0.177	11951	11295	pg181_o2nofp.cx10b_c32r128
11927	141182	0	0.0	205.5	21.1	0.000	0.000	0.017	1.812	539225	39.7	3.819	90	33.4	129.4	10.3	0.219	11871	11454	pg181_o2nofp.cx10b_walsize_c32r128
11927	143163	0	0.0	1013.9	93.1	0.000	0.000	0.085	7.997	548335	39.8	3.830	89	32.8	48.8	0.7	0.144	12014	11532	pg181_o2nofp.cx10b_walsize16G_c32r128
qp1000.L6
qp1000.L6: point queries with 1000 insert/s per client
Performance metrics for all DBMS, not just the ones listed above. Some are normalized by throughput, others are not. Legend for results is here.
ips	qps	rps	rmbps	wps	wmbps	rpq	rkbpq	wpi	wkbpi	csps	cpups	cspq	cpupq	dbgb1	dbgb2	rss	maxop	p50	p99	tag
11920	83116	0	0.0	212.6	22.2	0.000	0.000	0.018	1.904	323254	39.1	3.889	151	35.2	107.8	1.1	0.168	6991	6751	pg1222_o2nofp.cx10a_c32r128
11927	82771	0	0.0	211.5	22.0	0.000	0.000	0.018	1.889	322120	39.2	3.892	152	34.8	107.3	6.6	0.123	6927	6703	pg1323_o2nofp.cx10a_c32r128
11920	82164	0	0.0	207.5	21.5	0.000	0.000	0.017	1.848	320170	38.9	3.897	152	33.6	106.0	23.2	0.108	6927	6719	pg1420_o2nofp.cx10a_c32r128
11927	82480	0	0.0	205.1	21.5	0.000	0.000	0.017	1.846	320422	39.0	3.885	151	33.6	105.9	17.8	0.112	6911	6703	pg1515_o2nofp.cx10a_c32r128
11927	83029	0	0.0	204.9	21.4	0.000	0.000	0.017	1.833	322640	39.1	3.886	151	33.4	105.8	5.8	0.111	6991	6719	pg1611_o2nofp.cx10a_c32r128
11920	82601	0	0.0	205.1	21.4	0.000	0.000	0.017	1.841	321099	38.8	3.887	150	33.4	105.8	3.8	0.119	6991	6815	pg177_o2nofp.cx10a_c32r128
11927	82561	0	0.0	202.2	21.0	0.000	0.000	0.017	1.804	320836	38.9	3.886	151	33.2	105.7	13.6	0.119	6943	6717	pg181_o2nofp.cx10b_c32r128
11927	82257	0	0.0	203.5	21.1	0.000	0.000	0.017	1.815	319360	38.9	3.882	151	33.2	129.3	4.6	0.250	6927	6431	pg181_o2nofp.cx10b_walsize_c32r128
11920	82442	0	0.0	937.4	85.4	0.000	0.000	0.079	7.334	320741	39.0	3.891	151	32.7	48.7	8.0	0.124	6911	6671	pg181_o2nofp.cx10b_walsize16G_c32r128
l.i0
- l.i0: load without secondary indexes
- Legend for results is here.
- Each entry lists the percentage of responses that fit in that bucket (slower than max time for previous bucket, faster than min time for next bucket).
Insert response time histogram
256us	1ms	4ms	16ms	64ms	256ms	1s	4s	16s	gt	max	tag
0.000	99.191	0.807	0.001	0.000	0.000	0.000	0.000	0.000	0.000	0.006	pg1222_o2nofp.cx10a_c32r128
0.000	99.056	0.880	0.006	0.012	0.022	0.022	0.001	0.000	0.000	2.080	pg1323_o2nofp.cx10a_c32r128
0.000	98.457	1.542	0.001	0.000	0.000	0.000	0.000	0.000	0.000	0.006	pg1420_o2nofp.cx10a_c32r128
0.000	99.075	0.921	0.004	0.000	0.000	0.000	0.000	0.000	0.000	0.009	pg1515_o2nofp.cx10a_c32r128
0.000	99.062	0.936	0.002	0.000	0.000	0.000	0.000	0.000	0.000	0.005	pg1611_o2nofp.cx10a_c32r128
0.000	98.977	1.021	0.002	0.000	0.000	0.000	0.000	0.000	0.000	0.005	pg177_o2nofp.cx10a_c32r128
0.000	98.914	1.082	0.004	0.000	0.000	0.000	0.000	0.000	0.000	0.005	pg181_o2nofp.cx10b_c32r128
0.000	98.840	1.084	0.011	0.014	0.025	0.024	0.003	0.000	0.000	2.119	pg181_o2nofp.cx10b_walsize_c32r128
0.000	98.859	1.083	0.038	0.020	0.000	0.000	0.000	0.000	0.000	0.032	pg181_o2nofp.cx10b_walsize16G_c32r128
l.x
- l.x: create secondary indexes
- Legend for results is here.
- Each entry lists the percentage of responses that fit in that bucket (slower than max time for previous bucket, faster than min time for next bucket).
TODO - determine whether there is data for create index response time
l.i1
- l.i1: continue load after secondary indexes created with 50 inserts per transaction
- Legend for results is here.
- Each entry lists the percentage of responses that fit in that bucket (slower than max time for previous bucket, faster than min time for next bucket).
Insert response time histogram
256us	1ms	4ms	16ms	64ms	256ms	1s	4s	16s	gt	max	tag
0.000	0.604	98.751	0.265	0.280	0.060	0.038	nonzero	0.000	0.000	1.077	pg1222_o2nofp.cx10a_c32r128
0.000	0.562	98.796	0.273	0.281	0.061	0.028	0.000	0.000	0.000	0.945	pg1323_o2nofp.cx10a_c32r128
0.000	0.592	98.929	0.189	0.206	0.045	0.039	nonzero	0.000	0.000	1.039	pg1420_o2nofp.cx10a_c32r128
0.000	1.374	98.112	0.188	0.236	0.051	0.038	0.000	0.000	0.000	0.728	pg1515_o2nofp.cx10a_c32r128
0.000	0.941	98.496	0.230	0.243	0.056	0.033	0.000	0.000	0.000	0.616	pg1611_o2nofp.cx10a_c32r128
0.000	1.219	98.204	0.222	0.251	0.077	0.028	0.000	0.000	0.000	0.827	pg177_o2nofp.cx10a_c32r128
0.000	0.805	98.611	0.245	0.238	0.066	0.035	0.000	0.000	0.000	0.675	pg181_o2nofp.cx10b_c32r128
0.000	1.002	98.182	0.334	0.233	0.103	0.145	0.001	0.000	0.000	1.279	pg181_o2nofp.cx10b_walsize_c32r128
0.000	1.078	95.892	1.214	1.814	0.002	0.000	0.000	0.000	0.000	0.135	pg181_o2nofp.cx10b_walsize16G_c32r128
Delete response time histogram
256us	1ms	4ms	16ms	64ms	256ms	1s	4s	16s	gt	max	tag
0.000	29.717	68.922	0.992	0.268	0.060	0.040	nonzero	0.000	0.000	1.077	pg1222_o2nofp.cx10a_c32r128
0.000	27.481	71.290	0.870	0.265	0.064	0.030	0.000	0.000	0.000	0.946	pg1323_o2nofp.cx10a_c32r128
0.000	26.032	73.140	0.552	0.193	0.043	0.040	nonzero	0.000	0.000	1.039	pg1420_o2nofp.cx10a_c32r128
0.000	25.449	73.579	0.683	0.201	0.050	0.038	0.000	0.000	0.000	0.728	pg1515_o2nofp.cx10a_c32r128
0.000	26.136	72.748	0.801	0.224	0.058	0.034	0.000	0.000	0.000	0.616	pg1611_o2nofp.cx10a_c32r128
0.000	22.871	76.226	0.562	0.239	0.073	0.030	0.000	0.000	0.000	0.829	pg177_o2nofp.cx10a_c32r128
0.000	23.501	75.672	0.502	0.226	0.062	0.035	0.000	0.000	0.000	0.674	pg181_o2nofp.cx10b_c32r128
0.000	22.866	76.045	0.604	0.233	0.105	0.147	0.001	0.000	0.000	1.279	pg181_o2nofp.cx10b_walsize_c32r128
0.000	26.798	70.209	1.356	1.637	nonzero	0.000	0.000	0.000	0.000	0.135	pg181_o2nofp.cx10b_walsize16G_c32r128
l.i2
- l.i2: continue load after secondary indexes created with 5 inserts per transaction
- Legend for results is here.
- Each entry lists the percentage of responses that fit in that bucket (slower than max time for previous bucket, faster than min time for next bucket).
Insert response time histogram
256us	1ms	4ms	16ms	64ms	256ms	1s	4s	16s	gt	max	tag
35.791	64.184	0.025	nonzero	nonzero	0.000	0.000	0.000	0.000	0.000	0.047	pg1222_o2nofp.cx10a_c32r128
58.214	41.763	0.022	nonzero	nonzero	nonzero	0.000	0.000	0.000	0.000	0.093	pg1323_o2nofp.cx10a_c32r128
52.774	47.223	0.003	nonzero	nonzero	nonzero	0.000	0.000	0.000	0.000	0.091	pg1420_o2nofp.cx10a_c32r128
54.595	45.402	0.003	0.000	0.000	nonzero	0.000	0.000	0.000	0.000	0.106	pg1515_o2nofp.cx10a_c32r128
51.325	48.670	0.004	0.001	0.001	nonzero	0.000	0.000	0.000	0.000	0.093	pg1611_o2nofp.cx10a_c32r128
72.144	27.854	0.002	nonzero	0.000	nonzero	0.000	0.000	0.000	0.000	0.094	pg177_o2nofp.cx10a_c32r128
66.195	33.801	0.003	nonzero	nonzero	nonzero	0.000	0.000	0.000	0.000	0.095	pg181_o2nofp.cx10b_c32r128
66.211	33.787	0.002	nonzero	nonzero	nonzero	0.000	0.000	0.000	0.000	0.107	pg181_o2nofp.cx10b_walsize_c32r128
49.940	49.987	0.047	0.026	nonzero	0.000	0.000	0.000	0.000	0.000	0.022	pg181_o2nofp.cx10b_walsize16G_c32r128
Delete response time histogram
256us	1ms	4ms	16ms	64ms	256ms	1s	4s	16s	gt	max	tag
0.141	63.744	36.102	0.012	0.001	0.000	0.000	0.000	0.000	0.000	0.048	pg1222_o2nofp.cx10a_c32r128
0.179	57.633	42.184	0.004	0.001	nonzero	0.000	0.000	0.000	0.000	0.094	pg1323_o2nofp.cx10a_c32r128
0.071	57.418	42.509	0.002	nonzero	nonzero	0.000	0.000	0.000	0.000	0.091	pg1420_o2nofp.cx10a_c32r128
0.088	59.905	40.004	0.002	0.000	nonzero	0.000	0.000	0.000	0.000	0.106	pg1515_o2nofp.cx10a_c32r128
0.064	56.345	43.587	0.003	0.001	nonzero	0.000	0.000	0.000	0.000	0.093	pg1611_o2nofp.cx10a_c32r128
0.123	54.087	45.790	nonzero	0.000	nonzero	0.000	0.000	0.000	0.000	0.094	pg177_o2nofp.cx10a_c32r128
0.013	53.814	46.172	0.001	nonzero	nonzero	0.000	0.000	0.000	0.000	0.095	pg181_o2nofp.cx10b_c32r128
0.015	58.125	41.854	0.006	0.000	0.001	0.000	0.000	0.000	0.000	0.108	pg181_o2nofp.cx10b_walsize_c32r128
0.015	79.476	20.467	0.042	0.000	0.000	0.000	0.000	0.000	0.000	0.014	pg181_o2nofp.cx10b_walsize16G_c32r128
qr100.L1
- qr100.L1: range queries with 100 insert/s per client
- Legend for results is here.
- Each entry lists the percentage of responses that fit in that bucket (slower than max time for previous bucket, faster than min time for next bucket).
Query response time histogram
256us	1ms	4ms	16ms	64ms	256ms	1s	4s	16s	gt	max	tag
99.999	0.001	nonzero	0.000	0.000	0.000	0.000	0.000	0.000	0.000	0.002	pg1222_o2nofp.cx10a_c32r128
99.999	0.001	nonzero	nonzero	0.000	0.000	0.000	0.000	0.000	0.000	0.004	pg1323_o2nofp.cx10a_c32r128
99.999	0.001	nonzero	nonzero	nonzero	0.000	0.000	0.000	0.000	0.000	0.017	pg1420_o2nofp.cx10a_c32r128
99.999	0.001	nonzero	0.000	0.000	0.000	0.000	0.000	0.000	0.000	0.003	pg1515_o2nofp.cx10a_c32r128
99.999	0.001	nonzero	0.000	0.000	0.000	0.000	0.000	0.000	0.000	0.003	pg1611_o2nofp.cx10a_c32r128
99.999	0.001	nonzero	0.000	0.000	0.000	0.000	0.000	0.000	0.000	0.003	pg177_o2nofp.cx10a_c32r128
99.999	0.001	nonzero	0.000	0.000	0.000	0.000	0.000	0.000	0.000	0.002	pg181_o2nofp.cx10b_c32r128
99.999	0.001	nonzero	nonzero	0.000	0.000	0.000	0.000	0.000	0.000	0.013	pg181_o2nofp.cx10b_walsize_c32r128
99.999	0.001	nonzero	0.000	0.000	0.000	0.000	0.000	0.000	0.000	0.002	pg181_o2nofp.cx10b_walsize16G_c32r128
Insert response time histogram
256us	1ms	4ms	16ms	64ms	256ms	1s	4s	16s	gt	max	tag
0.000	0.000	99.845	0.155	0.000	0.000	0.000	0.000	0.000	0.000	0.008	pg1222_o2nofp.cx10a_c32r128
0.000	0.000	99.852	0.148	0.000	0.000	0.000	0.000	0.000	0.000	0.008	pg1323_o2nofp.cx10a_c32r128
0.000	0.000	99.845	0.150	0.005	0.000	0.000	0.000	0.000	0.000	0.020	pg1420_o2nofp.cx10a_c32r128
0.000	0.000	99.836	0.164	0.000	0.000	0.000	0.000	0.000	0.000	0.008	pg1515_o2nofp.cx10a_c32r128
0.000	0.000	99.852	0.148	0.000	0.000	0.000	0.000	0.000	0.000	0.008	pg1611_o2nofp.cx10a_c32r128
0.000	0.000	99.840	0.160	0.000	0.000	0.000	0.000	0.000	0.000	0.008	pg177_o2nofp.cx10a_c32r128
0.000	0.000	99.850	0.150	0.000	0.000	0.000	0.000	0.000	0.000	0.008	pg181_o2nofp.cx10b_c32r128
0.000	0.000	99.852	0.146	0.002	0.000	0.000	0.000	0.000	0.000	0.016	pg181_o2nofp.cx10b_walsize_c32r128
0.000	0.000	99.856	0.144	0.000	0.000	0.000	0.000	0.000	0.000	0.008	pg181_o2nofp.cx10b_walsize16G_c32r128
Delete response time histogram
256us	1ms	4ms	16ms	64ms	256ms	1s	4s	16s	gt	max	tag
0.000	68.125	31.875	0.000	0.000	0.000	0.000	0.000	0.000	0.000	0.002	pg1222_o2nofp.cx10a_c32r128
0.000	64.801	35.199	0.000	0.000	0.000	0.000	0.000	0.000	0.000	0.002	pg1323_o2nofp.cx10a_c32r128
0.000	66.836	33.164	0.000	0.000	0.000	0.000	0.000	0.000	0.000	0.002	pg1420_o2nofp.cx10a_c32r128
0.000	66.789	33.211	0.000	0.000	0.000	0.000	0.000	0.000	0.000	0.003	pg1515_o2nofp.cx10a_c32r128
0.000	68.470	31.530	0.000	0.000	0.000	0.000	0.000	0.000	0.000	0.002	pg1611_o2nofp.cx10a_c32r128
0.000	65.771	34.225	0.005	0.000	0.000	0.000	0.000	0.000	0.000	0.004	pg177_o2nofp.cx10a_c32r128
0.000	65.512	34.488	0.000	0.000	0.000	0.000	0.000	0.000	0.000	0.004	pg181_o2nofp.cx10b_c32r128
0.000	67.896	32.102	0.002	0.000	0.000	0.000	0.000	0.000	0.000	0.015	pg181_o2nofp.cx10b_walsize_c32r128
0.000	67.729	32.271	0.000	0.000	0.000	0.000	0.000	0.000	0.000	0.003	pg181_o2nofp.cx10b_walsize16G_c32r128
qp100.L2
- qp100.L2: point queries with 100 insert/s per client
- Legend for results is here.
- Each entry lists the percentage of responses that fit in that bucket (slower than max time for previous bucket, faster than min time for next bucket).
Query response time histogram
256us	1ms	4ms	16ms	64ms	256ms	1s	4s	16s	gt	max	tag
99.992	0.008	nonzero	0.000	0.000	0.000	0.000	0.000	0.000	0.000	0.002	pg1222_o2nofp.cx10a_c32r128
99.992	0.008	nonzero	nonzero	0.000	0.000	0.000	0.000	0.000	0.000	0.015	pg1323_o2nofp.cx10a_c32r128
99.990	0.010	nonzero	0.000	0.000	0.000	0.000	0.000	0.000	0.000	0.003	pg1420_o2nofp.cx10a_c32r128
99.993	0.007	nonzero	0.000	0.000	0.000	0.000	0.000	0.000	0.000	0.002	pg1515_o2nofp.cx10a_c32r128
99.991	0.009	nonzero	0.000	0.000	0.000	0.000	0.000	0.000	0.000	0.002	pg1611_o2nofp.cx10a_c32r128
99.992	0.007	nonzero	0.000	0.000	0.000	0.000	0.000	0.000	0.000	0.002	pg177_o2nofp.cx10a_c32r128
99.992	0.008	nonzero	0.000	0.000	0.000	0.000	0.000	0.000	0.000	0.002	pg181_o2nofp.cx10b_c32r128
99.993	0.007	nonzero	0.000	0.000	0.000	0.000	0.000	0.000	0.000	0.003	pg181_o2nofp.cx10b_walsize_c32r128
99.993	0.007	nonzero	0.000	0.000	0.000	0.000	0.000	0.000	0.000	0.003	pg181_o2nofp.cx10b_walsize16G_c32r128
Insert response time histogram
256us	1ms	4ms	16ms	64ms	256ms	1s	4s	16s	gt	max	tag
0.000	0.000	99.889	0.111	0.000	0.000	0.000	0.000	0.000	0.000	0.007	pg1222_o2nofp.cx10a_c32r128
0.000	0.000	99.891	0.109	0.000	0.000	0.000	0.000	0.000	0.000	0.007	pg1323_o2nofp.cx10a_c32r128
0.000	0.000	99.889	0.111	0.000	0.000	0.000	0.000	0.000	0.000	0.008	pg1420_o2nofp.cx10a_c32r128
0.000	0.000	99.889	0.111	0.000	0.000	0.000	0.000	0.000	0.000	0.008	pg1515_o2nofp.cx10a_c32r128
0.000	0.000	99.884	0.116	0.000	0.000	0.000	0.000	0.000	0.000	0.008	pg1611_o2nofp.cx10a_c32r128
0.000	0.000	99.891	0.109	0.000	0.000	0.000	0.000	0.000	0.000	0.007	pg177_o2nofp.cx10a_c32r128
0.000	0.000	99.875	0.125	0.000	0.000	0.000	0.000	0.000	0.000	0.008	pg181_o2nofp.cx10b_c32r128
0.000	0.000	99.891	0.109	0.000	0.000	0.000	0.000	0.000	0.000	0.008	pg181_o2nofp.cx10b_walsize_c32r128
0.000	0.000	99.861	0.139	0.000	0.000	0.000	0.000	0.000	0.000	0.016	pg181_o2nofp.cx10b_walsize16G_c32r128
Delete response time histogram
256us	1ms	4ms	16ms	64ms	256ms	1s	4s	16s	gt	max	tag
0.000	22.287	77.685	0.028	0.000	0.000	0.000	0.000	0.000	0.000	0.008	pg1222_o2nofp.cx10a_c32r128
0.000	24.935	75.037	0.028	0.000	0.000	0.000	0.000	0.000	0.000	0.008	pg1323_o2nofp.cx10a_c32r128
0.000	22.201	77.771	0.028	0.000	0.000	0.000	0.000	0.000	0.000	0.008	pg1420_o2nofp.cx10a_c32r128
0.000	18.731	81.241	0.028	0.000	0.000	0.000	0.000	0.000	0.000	0.008	pg1515_o2nofp.cx10a_c32r128
0.000	19.183	80.787	0.030	0.000	0.000	0.000	0.000	0.000	0.000	0.008	pg1611_o2nofp.cx10a_c32r128
0.000	16.294	83.678	0.028	0.000	0.000	0.000	0.000	0.000	0.000	0.007	pg177_o2nofp.cx10a_c32r128
0.000	13.699	86.273	0.028	0.000	0.000	0.000	0.000	0.000	0.000	0.008	pg181_o2nofp.cx10b_c32r128
0.000	20.639	79.333	0.028	0.000	0.000	0.000	0.000	0.000	0.000	0.008	pg181_o2nofp.cx10b_walsize_c32r128
0.000	68.403	31.553	0.044	0.000	0.000	0.000	0.000	0.000	0.000	0.014	pg181_o2nofp.cx10b_walsize16G_c32r128
qr500.L3
- qr500.L3: range queries with 500 insert/s per client
- Legend for results is here.
- Each entry lists the percentage of responses that fit in that bucket (slower than max time for previous bucket, faster than min time for next bucket).
Query response time histogram
256us	1ms	4ms	16ms	64ms	256ms	1s	4s	16s	gt	max	tag
99.995	0.004	nonzero	nonzero	nonzero	0.000	0.000	0.000	0.000	0.000	0.021	pg1222_o2nofp.cx10a_c32r128
99.995	0.004	nonzero	nonzero	nonzero	nonzero	0.000	0.000	0.000	0.000	0.086	pg1323_o2nofp.cx10a_c32r128
99.995	0.005	nonzero	nonzero	nonzero	nonzero	0.000	0.000	0.000	0.000	0.173	pg1420_o2nofp.cx10a_c32r128
99.995	0.004	nonzero	nonzero	nonzero	0.000	0.000	0.000	0.000	0.000	0.021	pg1515_o2nofp.cx10a_c32r128
99.995	0.004	nonzero	nonzero	nonzero	0.000	0.000	0.000	0.000	0.000	0.022	pg1611_o2nofp.cx10a_c32r128
99.995	0.004	nonzero	nonzero	nonzero	0.000	0.000	0.000	0.000	0.000	0.020	pg177_o2nofp.cx10a_c32r128
99.995	0.004	nonzero	nonzero	nonzero	0.000	0.000	0.000	0.000	0.000	0.019	pg181_o2nofp.cx10b_c32r128
99.994	0.005	nonzero	0.001	nonzero	nonzero	0.000	0.000	0.000	0.000	0.206	pg181_o2nofp.cx10b_walsize_c32r128
99.997	0.003	nonzero	nonzero	0.000	0.000	0.000	0.000	0.000	0.000	0.016	pg181_o2nofp.cx10b_walsize16G_c32r128
Insert response time histogram
256us	1ms	4ms	16ms	64ms	256ms	1s	4s	16s	gt	max	tag
0.000	0.013	99.347	0.552	0.088	0.000	0.000	0.000	0.000	0.000	0.026	pg1222_o2nofp.cx10a_c32r128
0.000	0.093	99.296	0.537	0.074	0.000	0.000	0.000	0.000	0.000	0.026	pg1323_o2nofp.cx10a_c32r128
0.000	0.073	98.850	0.754	0.266	0.057	0.000	0.000	0.000	0.000	0.178	pg1420_o2nofp.cx10a_c32r128
0.000	0.118	99.243	0.513	0.126	0.000	0.000	0.000	0.000	0.000	0.025	pg1515_o2nofp.cx10a_c32r128
0.000	0.108	98.969	0.773	0.150	0.000	0.000	0.000	0.000	0.000	0.027	pg1611_o2nofp.cx10a_c32r128
0.000	0.435	98.854	0.610	0.101	0.000	0.000	0.000	0.000	0.000	0.033	pg177_o2nofp.cx10a_c32r128
0.000	0.269	98.617	0.956	0.159	0.000	0.000	0.000	0.000	0.000	0.041	pg181_o2nofp.cx10b_c32r128
0.000	0.159	98.537	1.077	0.211	0.015	0.000	0.000	0.000	0.000	0.161	pg181_o2nofp.cx10b_walsize_c32r128
0.000	0.157	98.925	0.905	0.013	0.000	0.000	0.000	0.000	0.000	0.025	pg181_o2nofp.cx10b_walsize16G_c32r128
Delete response time histogram
256us	1ms	4ms	16ms	64ms	256ms	1s	4s	16s	gt	max	tag
0.000	53.506	46.212	0.254	0.028	0.000	0.000	0.000	0.000	0.000	0.022	pg1222_o2nofp.cx10a_c32r128
0.000	51.739	47.987	0.252	0.023	0.000	0.000	0.000	0.000	0.000	0.022	pg1323_o2nofp.cx10a_c32r128
0.000	51.257	48.244	0.353	0.115	0.030	0.000	0.000	0.000	0.000	0.178	pg1420_o2nofp.cx10a_c32r128
0.000	51.907	47.797	0.260	0.037	0.000	0.000	0.000	0.000	0.000	0.021	pg1515_o2nofp.cx10a_c32r128
0.000	50.877	48.731	0.338	0.054	0.000	0.000	0.000	0.000	0.000	0.024	pg1611_o2nofp.cx10a_c32r128
0.000	51.474	48.175	0.309	0.043	0.000	0.000	0.000	0.000	0.000	0.022	pg177_o2nofp.cx10a_c32r128
0.000	47.769	51.531	0.617	0.082	0.000	0.000	0.000	0.000	0.000	0.023	pg181_o2nofp.cx10b_c32r128
0.000	46.146	53.031	0.695	0.112	0.016	0.000	0.000	0.000	0.000	0.210	pg181_o2nofp.cx10b_walsize_c32r128
0.000	71.424	28.165	0.406	0.005	0.000	0.000	0.000	0.000	0.000	0.018	pg181_o2nofp.cx10b_walsize16G_c32r128
qp500.L4
- qp500.L4: point queries with 500 insert/s per client
- Legend for results is here.
- Each entry lists the percentage of responses that fit in that bucket (slower than max time for previous bucket, faster than min time for next bucket).
Query response time histogram
256us	1ms	4ms	16ms	64ms	256ms	1s	4s	16s	gt	max	tag
99.973	0.027	nonzero	nonzero	nonzero	nonzero	0.000	0.000	0.000	0.000	0.143	pg1222_o2nofp.cx10a_c32r128
99.979	0.021	nonzero	nonzero	nonzero	nonzero	0.000	0.000	0.000	0.000	0.205	pg1323_o2nofp.cx10a_c32r128
99.972	0.028	nonzero	nonzero	0.000	0.000	0.000	0.000	0.000	0.000	0.016	pg1420_o2nofp.cx10a_c32r128
99.980	0.020	nonzero	nonzero	0.000	0.000	0.000	0.000	0.000	0.000	0.014	pg1515_o2nofp.cx10a_c32r128
99.976	0.024	nonzero	nonzero	nonzero	nonzero	0.000	0.000	0.000	0.000	0.089	pg1611_o2nofp.cx10a_c32r128
99.978	0.022	nonzero	nonzero	nonzero	nonzero	0.000	0.000	0.000	0.000	0.102	pg177_o2nofp.cx10a_c32r128
99.979	0.021	nonzero	nonzero	nonzero	nonzero	0.000	0.000	0.000	0.000	0.243	pg181_o2nofp.cx10b_c32r128
99.975	0.025	nonzero	nonzero	nonzero	nonzero	0.000	0.000	0.000	0.000	0.168	pg181_o2nofp.cx10b_walsize_c32r128
99.975	0.025	0.001	nonzero	nonzero	nonzero	0.000	0.000	0.000	0.000	0.067	pg181_o2nofp.cx10b_walsize16G_c32r128
Insert response time histogram
256us	1ms	4ms	16ms	64ms	256ms	1s	4s	16s	gt	max	tag
0.000	0.077	99.185	0.550	0.139	0.048	0.000	0.000	0.000	0.000	0.225	pg1222_o2nofp.cx10a_c32r128
0.000	0.099	99.374	0.377	0.030	0.121	0.000	0.000	0.000	0.000	0.218	pg1323_o2nofp.cx10a_c32r128
0.000	0.005	99.256	0.635	0.105	0.000	0.000	0.000	0.000	0.000	0.022	pg1420_o2nofp.cx10a_c32r128
0.000	0.154	99.236	0.543	0.067	0.000	0.000	0.000	0.000	0.000	0.022	pg1515_o2nofp.cx10a_c32r128
0.000	0.180	99.076	0.596	0.148	0.000	0.000	0.000	0.000	0.000	0.025	pg1611_o2nofp.cx10a_c32r128
0.000	0.108	99.075	0.700	0.117	0.000	0.000	0.000	0.000	0.000	0.022	pg177_o2nofp.cx10a_c32r128
0.000	0.114	99.072	0.601	0.132	0.081	0.000	0.000	0.000	0.000	0.239	pg181_o2nofp.cx10b_c32r128
0.000	0.096	98.867	0.777	0.220	0.039	0.000	0.000	0.000	0.000	0.186	pg181_o2nofp.cx10b_walsize_c32r128
0.000	0.127	97.924	1.924	0.023	0.002	0.000	0.000	0.000	0.000	0.146	pg181_o2nofp.cx10b_walsize16G_c32r128
Delete response time histogram
256us	1ms	4ms	16ms	64ms	256ms	1s	4s	16s	gt	max	tag
0.000	52.650	47.095	0.179	0.045	0.031	0.000	0.000	0.000	0.000	0.232	pg1222_o2nofp.cx10a_c32r128
0.000	44.821	54.965	0.155	0.012	0.047	0.000	0.000	0.000	0.000	0.200	pg1323_o2nofp.cx10a_c32r128
0.000	43.035	56.699	0.233	0.033	0.000	0.000	0.000	0.000	0.000	0.020	pg1420_o2nofp.cx10a_c32r128
0.000	44.273	55.522	0.190	0.016	0.000	0.000	0.000	0.000	0.000	0.021	pg1515_o2nofp.cx10a_c32r128
0.000	42.888	56.859	0.210	0.044	0.000	0.000	0.000	0.000	0.000	0.024	pg1611_o2nofp.cx10a_c32r128
0.000	40.851	58.863	0.262	0.024	0.000	0.000	0.000	0.000	0.000	0.020	pg177_o2nofp.cx10a_c32r128
0.000	42.500	57.010	0.368	0.063	0.059	0.000	0.000	0.000	0.000	0.214	pg181_o2nofp.cx10b_c32r128
0.000	39.593	59.825	0.460	0.093	0.029	0.000	0.000	0.000	0.000	0.185	pg181_o2nofp.cx10b_walsize_c32r128
0.000	78.744	20.345	0.906	0.003	0.001	0.000	0.000	0.000	0.000	0.145	pg181_o2nofp.cx10b_walsize16G_c32r128
qr1000.L5
- qr1000.L5: range queries with 1000 insert/s per client
- Legend for results is here.
- Each entry lists the percentage of responses that fit in that bucket (slower than max time for previous bucket, faster than min time for next bucket).
Query response time histogram
256us	1ms	4ms	16ms	64ms	256ms	1s	4s	16s	gt	max	tag
99.992	0.007	nonzero	nonzero	nonzero	nonzero	0.000	0.000	0.000	0.000	0.159	pg1222_o2nofp.cx10a_c32r128
99.992	0.007	nonzero	nonzero	nonzero	nonzero	0.000	0.000	0.000	0.000	0.111	pg1323_o2nofp.cx10a_c32r128
99.993	0.006	nonzero	nonzero	nonzero	nonzero	0.000	0.000	0.000	0.000	0.104	pg1420_o2nofp.cx10a_c32r128
99.993	0.007	nonzero	nonzero	nonzero	nonzero	0.000	0.000	0.000	0.000	0.102	pg1515_o2nofp.cx10a_c32r128
99.993	0.006	nonzero	nonzero	nonzero	nonzero	0.000	0.000	0.000	0.000	0.193	pg1611_o2nofp.cx10a_c32r128
99.993	0.006	nonzero	nonzero	nonzero	nonzero	0.000	0.000	0.000	0.000	0.134	pg177_o2nofp.cx10a_c32r128
99.992	0.007	nonzero	nonzero	nonzero	nonzero	0.000	0.000	0.000	0.000	0.177	pg181_o2nofp.cx10b_c32r128
99.991	0.008	nonzero	0.001	nonzero	nonzero	0.000	0.000	0.000	0.000	0.219	pg181_o2nofp.cx10b_walsize_c32r128
99.988	0.009	0.002	0.002	nonzero	nonzero	0.000	0.000	0.000	0.000	0.144	pg181_o2nofp.cx10b_walsize16G_c32r128
Insert response time histogram
256us	1ms	4ms	16ms	64ms	256ms	1s	4s	16s	gt	max	tag
0.000	0.137	99.247	0.565	0.051	0.000	0.000	0.000	0.000	0.000	0.055	pg1222_o2nofp.cx10a_c32r128
0.000	0.237	99.170	0.507	0.087	0.000	0.000	0.000	0.000	0.000	0.036	pg1323_o2nofp.cx10a_c32r128
0.000	0.342	99.056	0.522	0.080	0.000	0.000	0.000	0.000	0.000	0.036	pg1420_o2nofp.cx10a_c32r128
0.000	0.487	98.857	0.558	0.098	0.000	0.000	0.000	0.000	0.000	0.025	pg1515_o2nofp.cx10a_c32r128
0.000	0.507	98.828	0.550	0.092	0.024	0.000	0.000	0.000	0.000	0.196	pg1611_o2nofp.cx10a_c32r128
0.000	0.863	98.484	0.556	0.084	0.013	0.000	0.000	0.000	0.000	0.136	pg177_o2nofp.cx10a_c32r128
0.000	0.945	98.506	0.442	0.107	nonzero	0.000	0.000	0.000	0.000	0.134	pg181_o2nofp.cx10b_c32r128
0.000	0.613	98.535	0.645	0.152	0.055	0.000	0.000	0.000	0.000	0.247	pg181_o2nofp.cx10b_walsize_c32r128
0.000	0.884	96.302	2.731	0.082	0.000	0.000	0.000	0.000	0.000	0.026	pg181_o2nofp.cx10b_walsize16G_c32r128
Delete response time histogram
256us	1ms	4ms	16ms	64ms	256ms	1s	4s	16s	gt	max	tag
0.000	54.025	45.672	0.283	0.020	0.000	0.000	0.000	0.000	0.000	0.054	pg1222_o2nofp.cx10a_c32r128
0.000	47.336	52.377	0.253	0.035	0.000	0.000	0.000	0.000	0.000	0.022	pg1323_o2nofp.cx10a_c32r128
0.000	47.170	52.511	0.288	0.031	0.000	0.000	0.000	0.000	0.000	0.023	pg1420_o2nofp.cx10a_c32r128
0.000	46.173	53.482	0.312	0.032	0.000	0.000	0.000	0.000	0.000	0.022	pg1515_o2nofp.cx10a_c32r128
0.000	45.862	53.809	0.287	0.035	0.006	0.000	0.000	0.000	0.000	0.194	pg1611_o2nofp.cx10a_c32r128
0.000	44.479	55.178	0.311	0.030	0.002	0.000	0.000	0.000	0.000	0.135	pg177_o2nofp.cx10a_c32r128
0.000	38.004	61.616	0.316	0.064	nonzero	0.000	0.000	0.000	0.000	0.133	pg181_o2nofp.cx10b_c32r128
0.000	38.924	60.592	0.382	0.072	0.031	0.000	0.000	0.000	0.000	0.239	pg181_o2nofp.cx10b_walsize_c32r128
0.000	73.375	25.103	1.493	0.029	0.000	0.000	0.000	0.000	0.000	0.026	pg181_o2nofp.cx10b_walsize16G_c32r128
qp1000.L6
- qp1000.L6: point queries with 1000 insert/s per client
- Legend for results is here.
- Each entry lists the percentage of responses that fit in that bucket (slower than max time for previous bucket, faster than min time for next bucket).
Query response time histogram
256us	1ms	4ms	16ms	64ms	256ms	1s	4s	16s	gt	max	tag
99.947	0.053	nonzero	nonzero	nonzero	nonzero	0.000	0.000	0.000	0.000	0.168	pg1222_o2nofp.cx10a_c32r128
99.947	0.053	nonzero	nonzero	nonzero	nonzero	0.000	0.000	0.000	0.000	0.123	pg1323_o2nofp.cx10a_c32r128
99.950	0.049	nonzero	nonzero	nonzero	nonzero	0.000	0.000	0.000	0.000	0.108	pg1420_o2nofp.cx10a_c32r128
99.954	0.046	nonzero	nonzero	nonzero	nonzero	0.000	0.000	0.000	0.000	0.112	pg1515_o2nofp.cx10a_c32r128
99.951	0.048	nonzero	nonzero	nonzero	nonzero	0.000	0.000	0.000	0.000	0.111	pg1611_o2nofp.cx10a_c32r128
99.956	0.043	nonzero	nonzero	nonzero	nonzero	0.000	0.000	0.000	0.000	0.119	pg177_o2nofp.cx10a_c32r128
99.954	0.045	nonzero	nonzero	nonzero	nonzero	0.000	0.000	0.000	0.000	0.119	pg181_o2nofp.cx10b_c32r128
99.953	0.047	nonzero	nonzero	nonzero	nonzero	0.000	0.000	0.000	0.000	0.250	pg181_o2nofp.cx10b_walsize_c32r128
99.946	0.052	0.001	0.001	nonzero	nonzero	0.000	0.000	0.000	0.000	0.124	pg181_o2nofp.cx10b_walsize16G_c32r128
Insert response time histogram
256us	1ms	4ms	16ms	64ms	256ms	1s	4s	16s	gt	max	tag
0.000	0.263	99.107	0.554	0.071	0.006	0.000	0.000	0.000	0.000	0.147	pg1222_o2nofp.cx10a_c32r128
0.000	0.414	99.020	0.452	0.102	0.012	0.000	0.000	0.000	0.000	0.131	pg1323_o2nofp.cx10a_c32r128
0.000	0.503	98.880	0.508	0.108	nonzero	0.000	0.000	0.000	0.000	0.109	pg1420_o2nofp.cx10a_c32r128
0.000	0.431	98.931	0.533	0.105	0.000	0.000	0.000	0.000	0.000	0.034	pg1515_o2nofp.cx10a_c32r128
0.000	0.571	98.825	0.492	0.111	0.000	0.000	0.000	0.000	0.000	0.028	pg1611_o2nofp.cx10a_c32r128
0.000	0.665	98.707	0.464	0.160	0.005	0.000	0.000	0.000	0.000	0.094	pg177_o2nofp.cx10a_c32r128
0.000	0.578	98.895	0.415	0.112	0.000	0.000	0.000	0.000	0.000	0.040	pg181_o2nofp.cx10b_c32r128
0.000	0.327	98.987	0.444	0.142	0.100	nonzero	0.000	0.000	0.000	0.406	pg181_o2nofp.cx10b_walsize_c32r128
0.000	0.587	96.497	2.844	0.072	0.000	0.000	0.000	0.000	0.000	0.030	pg181_o2nofp.cx10b_walsize16G_c32r128
Delete response time histogram
256us	1ms	4ms	16ms	64ms	256ms	1s	4s	16s	gt	max	tag
0.000	57.066	42.456	0.424	0.051	0.003	0.000	0.000	0.000	0.000	0.147	pg1222_o2nofp.cx10a_c32r128
0.000	50.209	49.313	0.395	0.073	0.011	0.000	0.000	0.000	0.000	0.132	pg1323_o2nofp.cx10a_c32r128
0.000	50.683	48.740	0.499	0.078	nonzero	0.000	0.000	0.000	0.000	0.108	pg1420_o2nofp.cx10a_c32r128
0.000	49.848	49.593	0.477	0.083	0.000	0.000	0.000	0.000	0.000	0.027	pg1515_o2nofp.cx10a_c32r128
0.000	49.423	50.041	0.452	0.084	0.000	0.000	0.000	0.000	0.000	0.025	pg1611_o2nofp.cx10a_c32r128
0.000	48.900	50.432	0.518	0.145	0.004	0.000	0.000	0.000	0.000	0.093	pg177_o2nofp.cx10a_c32r128
0.000	39.789	59.755	0.385	0.071	0.000	0.000	0.000	0.000	0.000	0.039	pg181_o2nofp.cx10b_c32r128
0.000	39.443	59.956	0.408	0.105	0.088	0.000	0.000	0.000	0.000	0.251	pg181_o2nofp.cx10b_walsize_c32r128
0.000	73.622	25.050	1.309	0.019	0.000	0.000	0.000	0.000	0.000	0.027	pg181_o2nofp.cx10b_walsize16G_c32r128