Introduction
This is a report for the insert benchmark with 120M docs and 12 client(s). It is generated by scripts (bash, awk, sed) and Tufte might not be impressed. An overview of the insert benchmark is here and a short update is here. Below, by DBMS, I mean DBMS+version.config. An example is my8020.c10b40 where my means MySQL, 8020 is version 8.0.20 and c10b40 is the name for the configuration file.
The test server has 32 cores, 128G RAM and 1 NVMe devices. The benchmark was run with 8 clients and there were 1 or 3 connections per client (1 for queries or inserts without rate limits, 1+1 for rate limited inserts+deletes). It uses 8 tables with a table per client. It loads 10M rows per table without secondary indexes, creates 3 secondary indexes per table, then inserts 16m+4m rows per table with a delete per insert to avoid growing the table. It then does 6 read+write tests for 1800s each that do queries as fast as possible with 100,100,500,500,1000,1000 inserts/s and the same for deletes/s per client concurrent with the queries. The database is cached. Clients and the DBMS share one server.
The tested DBMS are:
- my8407_rel_o2nofp.cz12a_c32r128 - MySQL 8.4.7 with the cz12a_c32r128 config
- my8407_rel_o2nofp.cz12a_c32r128 - MySQL 8.4.7 with the cz12a_nocb_c32r128 config that disables the InnoDB change buffer
- pg181_o2nofp.cx10b_c32r128 - Postgres 18.1 with the cx10b_c3r128 config
Contents
- Summary
- l.i0: load without secondary indexes
- l.x: create secondary indexes
- l.i1: continue load after secondary indexes created with 50 inserts per transaction
- l.i2: continue load after secondary indexes created with 5 inserts per transaction
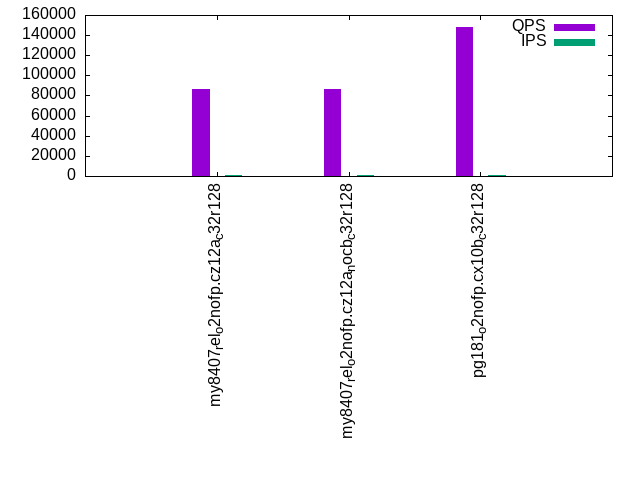
- qr100.L1: range queries with 100 insert/s per client
- qp100.L2: point queries with 100 insert/s per client
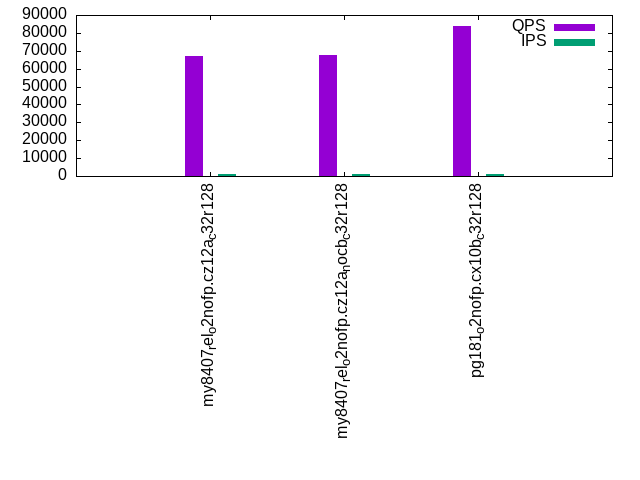
- qr500.L3: range queries with 500 insert/s per client
- qp500.L4: point queries with 500 insert/s per client
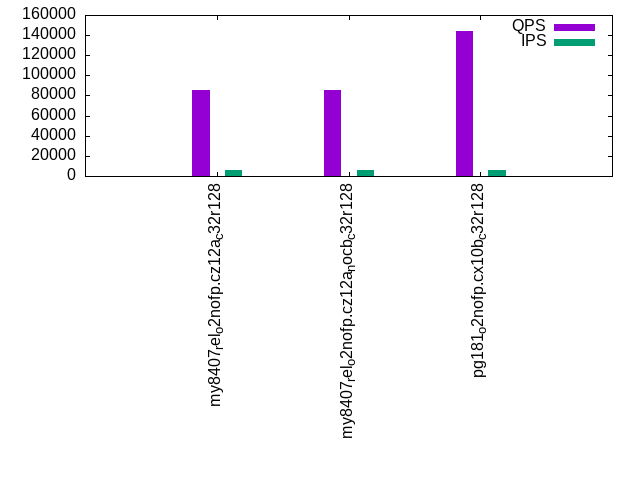
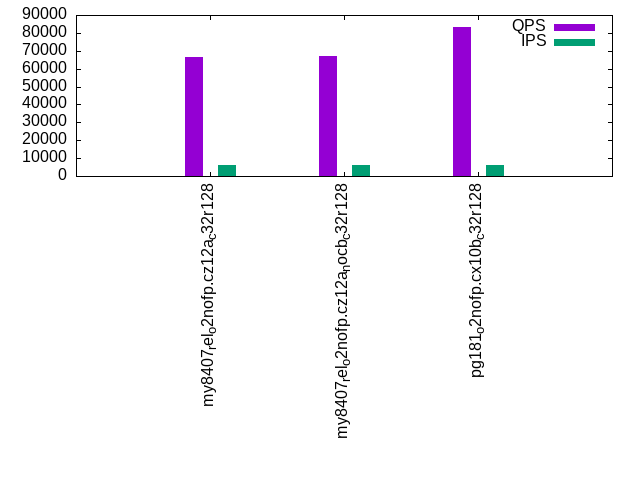
- qr1000.L5: range queries with 1000 insert/s per client
- qp1000.L6: point queries with 1000 insert/s per client
Summary
The numbers are inserts/s for l.i0, l.i1 and l.i2, indexed docs (or rows) /s for l.x and queries/s for qr100, qp100 thru qr1000, qp1000" The values are the average rate over the entire test for inserts (IPS) and queries (QPS). The range of values for IPS and QPS is split into 3 parts: bottom 25%, middle 50%, top 25%. Values in the bottom 25% have a red background, values in the top 25% have a green background and values in the middle have no color. A gray background is used for values that can be ignored because the DBMS did not sustain the target insert rate. Red backgrounds are not used when the minimum value is within 80% of the max value.
| dbms | l.i0 | l.x | l.i1 | l.i2 | qr100 | qp100 | qr500 | qp500 | qr1000 | qp1000 |
|---|---|---|---|---|---|---|---|---|---|---|
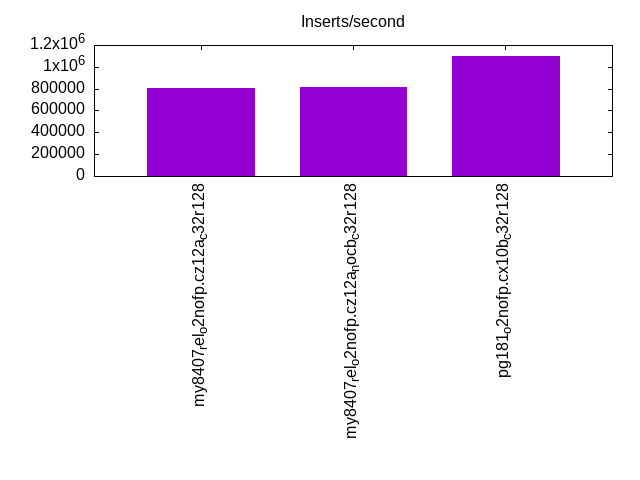
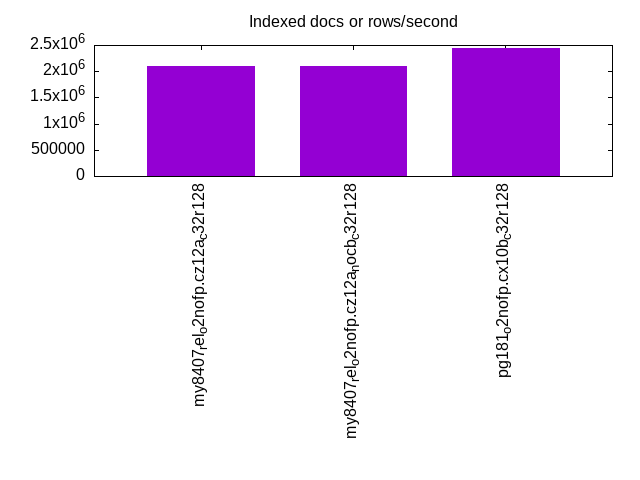
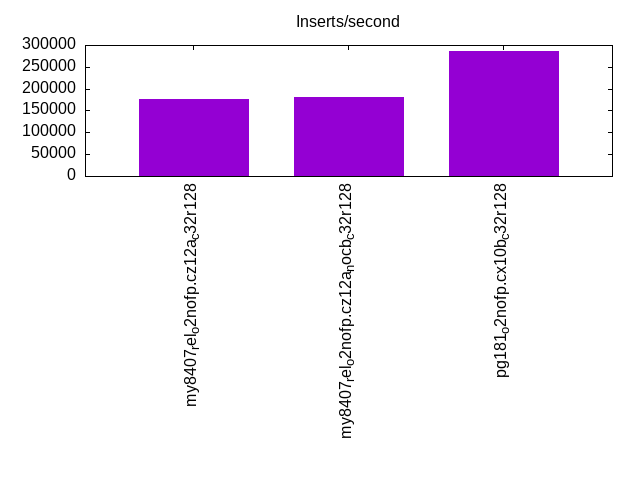
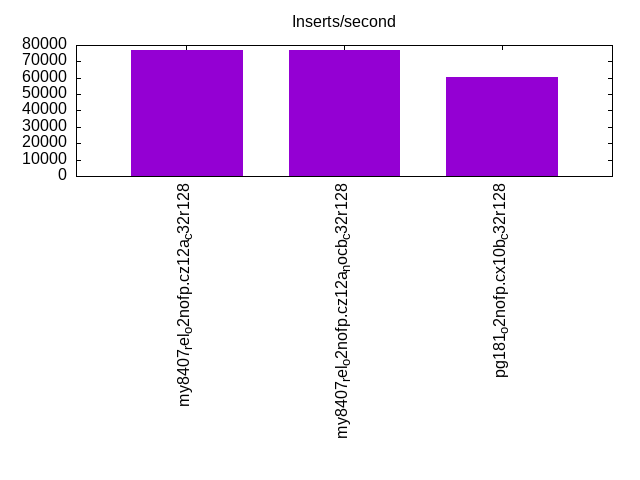
| my8407_rel_o2nofp.cz12a_c32r128 | 805369 | 2105265 | 177122 | 77046 | 86349 | 66900 | 85754 | 66270 | 84533 | 65565 |
| my8407_rel_o2nofp.cz12a_nocb_c32r128 | 816326 | 2105265 | 180451 | 77046 | 86367 | 67455 | 85753 | 66856 | 84646 | 66022 |
| pg181_o2nofp.cx10b_c32r128 | 1100917 | 2448982 | 286140 | 60759 | 147902 | 83614 | 144498 | 83212 | 142783 | 82561 |
This table has relative throughput, throughput for the DBMS relative to the DBMS in the first line, using the absolute throughput from the previous table. Values less than 0.95 have a yellow background. Values greater than 1.05 have a blue background.
| dbms | l.i0 | l.x | l.i1 | l.i2 | qr100 | qp100 | qr500 | qp500 | qr1000 | qp1000 |
|---|---|---|---|---|---|---|---|---|---|---|
| my8407_rel_o2nofp.cz12a_c32r128 | 1.00 | 1.00 | 1.00 | 1.00 | 1.00 | 1.00 | 1.00 | 1.00 | 1.00 | 1.00 |
| my8407_rel_o2nofp.cz12a_nocb_c32r128 | 1.01 | 1.00 | 1.02 | 1.00 | 1.00 | 1.01 | 1.00 | 1.01 | 1.00 | 1.01 |
| pg181_o2nofp.cx10b_c32r128 | 1.37 | 1.16 | 1.62 | 0.79 | 1.71 | 1.25 | 1.69 | 1.26 | 1.69 | 1.26 |
This lists the average rate of inserts/s for the tests that do inserts concurrent with queries. For such tests the query rate is listed in the table above. The read+write tests are setup so that the insert rate should match the target rate every second. Cells that are not at least 95% of the target have a red background to indicate a failure to satisfy the target.
| dbms | qr100.L1 | qp100.L2 | qr500.L3 | qp500.L4 | qr1000.L5 | qp1000.L6 |
|---|---|---|---|---|---|---|
| my8407_rel_o2nofp.cz12a_c32r128 | 1193 | 1192 | 5960 | 5964 | 11927 | 11927 |
| my8407_rel_o2nofp.cz12a_nocb_c32r128 | 1193 | 1193 | 5964 | 5960 | 11920 | 11927 |
| pg181_o2nofp.cx10b_c32r128 | 1192 | 1192 | 5964 | 5964 | 11927 | 11927 |
| target | 1200 | 1200 | 6000 | 6000 | 12000 | 12000 |
l.i0
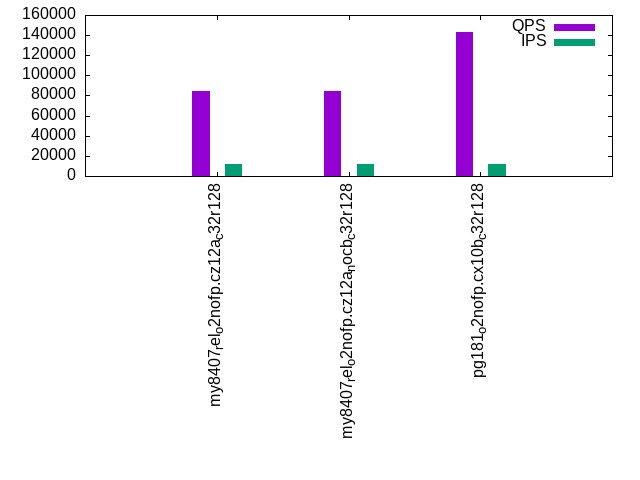
l.i0: load without secondary indexes. Graphs for performance per 1-second interval are here.
Average throughput:
Insert response time histogram: each cell has the percentage of responses that take <= the time in the header and max is the max response time in seconds. For the max column values in the top 25% of the range have a red background and in the bottom 25% of the range have a green background. The red background is not used when the min value is within 80% of the max value.
| dbms | 256us | 1ms | 4ms | 16ms | 64ms | 256ms | 1s | 4s | 16s | gt | max |
|---|---|---|---|---|---|---|---|---|---|---|---|
| my8407_rel_o2nofp.cz12a_c32r128 | 0.139 | 99.765 | 0.070 | 0.004 | 0.021 | 0.165 | |||||
| my8407_rel_o2nofp.cz12a_nocb_c32r128 | 0.221 | 99.686 | 0.068 | 0.004 | 0.021 | 0.160 | |||||
| pg181_o2nofp.cx10b_c32r128 | 98.914 | 1.082 | 0.004 | 0.005 |
Performance metrics for the DBMS listed above. Some are normalized by throughput, others are not. Legend for results is here.
ips	qps	rps	rmbps	wps	wmbps	rpq	rkbpq	wpi	wkbpi	csps	cpups	cspq	cpupq	dbgb1	dbgb2	rss	maxop	p50	p99	tag
805369	0	1	0.0	2672.4	224.1	0.000	0.000	0.003	0.285	136973	46.1	0.170	18	8.0	114.2	16.5	0.165	78091	67591	my8407_rel_o2nofp.cz12a_c32r128
816326	0	1	0.0	2690.5	229.2	0.000	0.000	0.003	0.287	141105	47.2	0.173	19	8.0	114.2	16.5	0.160	78790	66892	my8407_rel_o2nofp.cz12a_nocb_c32r128
1100917	0	2	0.0	3933.7	454.1	0.000	0.000	0.004	0.422	110935	47.3	0.101	14	11.5	31.1	0.2	0.005	112987	106487	pg181_o2nofp.cx10b_c32r128
Average values from iostat.
r/s	rkB/s	rrqm/s	%rrqm	r_await	rareq-s	w/s	wkB/s	wrqm/s	%wrqm	w_await	wareq-s	d/s	dkB/s	drqm/s	%drqm	d_await	dareq-s	f/s	f_await	aqu-sz	%util
0.680	3.120	0.000	0.000	0.575	4.560	2672.4	229528	131.7	6.475	0.674	90.24	1.233	36.35	0.000	0.000	1.028	24.49	23.40	0.485	1.839	9.752		my8407_rel_o2nofp.cz12a_c32r128
0.752	3.421	0.000	0.000	0.492	4.560	2690.5	234663	133.8	6.570	0.676	91.83	1.193	18.92	0.000	0.000	0.885	13.25	23.99	0.488	1.782	9.936		my8407_rel_o2nofp.cz12a_nocb_c32r128
1.663	6.654	0.000	0.000	0.248	3.636	3933.7	465046	500.8	10.99	0.357	117.3	0.590	18.38	0.000	0.000	0.806	17.49	172.6	0.410	1.543	21.75		pg181_o2nofp.cx10b_c32r128
l.x
l.x: create secondary indexes.
Average throughput:
Performance metrics for the DBMS listed above. Some are normalized by throughput, others are not. Legend for results is here.
ips	qps	rps	rmbps	wps	wmbps	rpq	rkbpq	wpi	wkbpi	csps	cpups	cspq	cpupq	dbgb1	dbgb2	rss	maxop	p50	p99	tag
2105265	0	50	1.3	66028.0	2509.9	0.000	0.001	0.031	1.221	95406	73.8	0.045	11	18.2	124.4	16.9	0.004	NA	NA	my8407_rel_o2nofp.cz12a_c32r128
2105265	0	54	1.6	65301.5	2498.6	0.000	0.001	0.031	1.215	95937	73.6	0.046	11	18.2	124.4	16.9	0.007	NA	NA	my8407_rel_o2nofp.cz12a_nocb_c32r128
2448982	0	0	0.0	5406.2	662.4	0.000	0.000	0.002	0.277	16222	23.4	0.007	3	23.1	53.1	7.0	0.033	NA	NA	pg181_o2nofp.cx10b_c32r128
Average values from iostat.
r/s	rkB/s	rrqm/s	%rrqm	r_await	rareq-s	w/s	wkB/s	wrqm/s	%wrqm	w_await	wareq-s	d/s	dkB/s	drqm/s	%drqm	d_await	dareq-s	f/s	f_await	aqu-sz	%util
49.49	1297.2	0.000	0.000	0.356	26.18	66028.0	2570177	710.2	1.529	0.460	43.80	108.0	354673	0.000	0.000	1.854	2798.4	46.50	0.660	26.04	84.61		my8407_rel_o2nofp.cz12a_c32r128
54.12	1667.3	0.000	0.000	0.396	30.31	65301.5	2558597	712.6	1.525	0.396	44.09	117.9	354767	0.000	0.000	1.731	2617.5	46.89	0.625	21.67	84.59		my8407_rel_o2nofp.cz12a_nocb_c32r128
0.160	0.640	0.000	0.000	0.750	2.400	5406.2	678337	271.2	5.291	0.829	124.9	4.540	35272.4	0.000	0.000	0.963	4519.6	63.54	0.469	4.562	22.80		pg181_o2nofp.cx10b_c32r128
l.i1
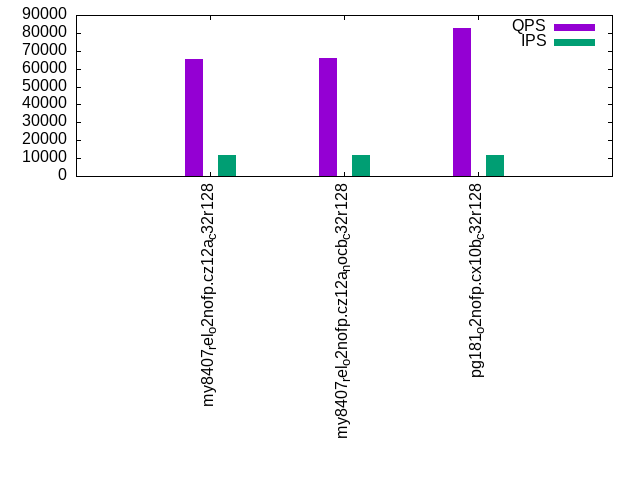
l.i1: continue load after secondary indexes created with 50 inserts per transaction. Graphs for performance per 1-second interval are here.
Average throughput:
Insert response time histogram: each cell has the percentage of responses that take <= the time in the header and max is the max response time in seconds. For the max column values in the top 25% of the range have a red background and in the bottom 25% of the range have a green background. The red background is not used when the min value is within 80% of the max value.
| dbms | 256us | 1ms | 4ms | 16ms | 64ms | 256ms | 1s | 4s | 16s | gt | max |
|---|---|---|---|---|---|---|---|---|---|---|---|
| my8407_rel_o2nofp.cz12a_c32r128 | 88.031 | 11.647 | 0.227 | 0.082 | 0.012 | 0.001 | 2.097 | ||||
| my8407_rel_o2nofp.cz12a_nocb_c32r128 | 88.515 | 11.209 | 0.178 | 0.084 | 0.014 | nonzero | 1.059 | ||||
| pg181_o2nofp.cx10b_c32r128 | 0.805 | 98.611 | 0.245 | 0.238 | 0.066 | 0.035 | 0.675 |
Delete response time histogram: each cell has the percentage of responses that take <= the time in the header and max is the max response time in seconds. For the max column values in the top 25% of the range have a red background and in the bottom 25% of the range have a green background. The red background is not used when the min value is within 80% of the max value.
| dbms | 256us | 1ms | 4ms | 16ms | 64ms | 256ms | 1s | 4s | 16s | gt | max |
|---|---|---|---|---|---|---|---|---|---|---|---|
| my8407_rel_o2nofp.cz12a_c32r128 | 0.007 | 88.343 | 11.335 | 0.214 | 0.088 | 0.013 | 0.001 | 2.038 | |||
| my8407_rel_o2nofp.cz12a_nocb_c32r128 | 0.011 | 88.763 | 10.997 | 0.132 | 0.080 | 0.015 | nonzero | 1.068 | |||
| pg181_o2nofp.cx10b_c32r128 | 23.501 | 75.672 | 0.502 | 0.226 | 0.062 | 0.035 | 0.674 |
Performance metrics for the DBMS listed above. Some are normalized by throughput, others are not. Legend for results is here.
ips	qps	rps	rmbps	wps	wmbps	rpq	rkbpq	wpi	wkbpi	csps	cpups	cspq	cpupq	dbgb1	dbgb2	rss	maxop	p50	p99	tag
177122	0	536	8.4	7462.9	327.1	0.003	0.048	0.042	1.891	208813	67.5	1.179	122	31.0	158.6	44.1	2.097	18148	2650	my8407_rel_o2nofp.cz12a_c32r128
180451	0	546	8.5	7518.2	330.0	0.003	0.048	0.042	1.872	211025	67.0	1.169	119	31.0	159.5	44.7	1.059	18548	2850	my8407_rel_o2nofp.cz12a_nocb_c32r128
286140	0	0	0.0	3657.3	409.6	0.000	0.000	0.013	1.466	118065	61.9	0.413	69	33.0	129.1	30.1	0.675	28246	900	pg181_o2nofp.cx10b_c32r128
Average values from iostat.
r/s	rkB/s	rrqm/s	%rrqm	r_await	rareq-s	w/s	wkB/s	wrqm/s	%wrqm	w_await	wareq-s	d/s	dkB/s	drqm/s	%drqm	d_await	dareq-s	f/s	f_await	aqu-sz	%util
536.0	8573.8	0.000	0.000	1.361	10.18	7462.9	334977	89.88	1.162	4.974	45.59	0.649	6741.9	0.000	0.000	1.360	442.6	20.37	1.765	33.54	23.70		my8407_rel_o2nofp.cz12a_c32r128
546.0	8732.9	0.000	0.000	0.919	10.25	7518.2	337879	91.99	1.177	4.644	45.73	0.727	6925.8	0.000	0.000	1.239	485.4	20.32	1.843	32.66	24.80		my8407_rel_o2nofp.cz12a_nocb_c32r128
0.024	0.096	0.000	0.000	0.049	0.418	3657.3	419452	296.3	6.306	5.198	114.5	0.245	535.6	0.000	0.000	1.203	258.9	194.7	1.777	9.704	40.42		pg181_o2nofp.cx10b_c32r128
l.i2
l.i2: continue load after secondary indexes created with 5 inserts per transaction. Graphs for performance per 1-second interval are here.
Average throughput:
Insert response time histogram: each cell has the percentage of responses that take <= the time in the header and max is the max response time in seconds. For the max column values in the top 25% of the range have a red background and in the bottom 25% of the range have a green background. The red background is not used when the min value is within 80% of the max value.
| dbms | 256us | 1ms | 4ms | 16ms | 64ms | 256ms | 1s | 4s | 16s | gt | max |
|---|---|---|---|---|---|---|---|---|---|---|---|
| my8407_rel_o2nofp.cz12a_c32r128 | 0.011 | 90.832 | 8.466 | 0.671 | 0.011 | 0.007 | 0.001 | 0.530 | |||
| my8407_rel_o2nofp.cz12a_nocb_c32r128 | 0.035 | 91.057 | 8.165 | 0.721 | 0.013 | 0.008 | 0.002 | 0.941 | |||
| pg181_o2nofp.cx10b_c32r128 | 66.195 | 33.801 | 0.003 | nonzero | nonzero | nonzero | 0.095 |
Delete response time histogram: each cell has the percentage of responses that take <= the time in the header and max is the max response time in seconds. For the max column values in the top 25% of the range have a red background and in the bottom 25% of the range have a green background. The red background is not used when the min value is within 80% of the max value.
| dbms | 256us | 1ms | 4ms | 16ms | 64ms | 256ms | 1s | 4s | 16s | gt | max |
|---|---|---|---|---|---|---|---|---|---|---|---|
| my8407_rel_o2nofp.cz12a_c32r128 | 0.016 | 91.464 | 7.870 | 0.632 | 0.010 | 0.007 | 0.002 | 0.541 | |||
| my8407_rel_o2nofp.cz12a_nocb_c32r128 | 0.049 | 91.645 | 7.603 | 0.683 | 0.011 | 0.007 | 0.002 | 0.938 | |||
| pg181_o2nofp.cx10b_c32r128 | 0.013 | 53.814 | 46.172 | 0.001 | nonzero | nonzero | 0.095 |
Performance metrics for the DBMS listed above. Some are normalized by throughput, others are not. Legend for results is here.
ips	qps	rps	rmbps	wps	wmbps	rpq	rkbpq	wpi	wkbpi	csps	cpups	cspq	cpupq	dbgb1	dbgb2	rss	maxop	p50	p99	tag
77046	0	0	0.0	5934.3	252.5	0.000	0.000	0.077	3.356	416881	66.8	5.411	277	31.0	166.3	44.1	0.530	7499	1120	my8407_rel_o2nofp.cz12a_c32r128
77046	0	0	0.0	5910.1	252.0	0.000	0.000	0.077	3.350	416948	66.1	5.412	275	31.0	165.7	44.9	0.941	7569	1125	my8407_rel_o2nofp.cz12a_nocb_c32r128
60759	0	0	0.0	570.1	63.3	0.000	0.000	0.009	1.067	241471	52.7	3.974	278	33.2	129.3	25.4	0.095	3929	2415	pg181_o2nofp.cx10b_c32r128
Average values from iostat.
r/s	rkB/s	rrqm/s	%rrqm	r_await	rareq-s	w/s	wkB/s	wrqm/s	%wrqm	w_await	wareq-s	d/s	dkB/s	drqm/s	%drqm	d_await	dareq-s	f/s	f_await	aqu-sz	%util
0.084	0.335	0.000	0.000	0.880	1.226	5934.3	258554	4.721	0.078	4.921	43.58	0.381	3344.7	0.000	0.000	1.141	316.6	12.87	1.972	29.07	15.80		my8407_rel_o2nofp.cz12a_c32r128
0.123	0.490	0.000	0.000	0.892	1.419	5910.1	258082	4.868	0.081	5.165	43.72	0.513	6174.5	0.000	0.000	1.973	766.1	13.00	2.168	30.68	16.16		my8407_rel_o2nofp.cz12a_nocb_c32r128
0.000	0.000	0.000	0.000	0.000	0.000	570.1	64807.8	9.167	1.806	0.378	113.5	0.016	20.58	0.000	0.000	0.043	28.90	41.85	0.557	0.367	6.041		pg181_o2nofp.cx10b_c32r128
qr100.L1
qr100.L1: range queries with 100 insert/s per client. Graphs for performance per 1-second interval are here.
Average throughput:
Query response time histogram: each cell has the percentage of responses that take <= the time in the header and max is the max response time in seconds. For max values in the top 25% of the range have a red background and in the bottom 25% of the range have a green background. The red background is not used when the min value is within 80% of the max value.
| dbms | 256us | 1ms | 4ms | 16ms | 64ms | 256ms | 1s | 4s | 16s | gt | max |
|---|---|---|---|---|---|---|---|---|---|---|---|
| my8407_rel_o2nofp.cz12a_c32r128 | 99.988 | 0.012 | nonzero | nonzero | nonzero | nonzero | 0.111 | ||||
| my8407_rel_o2nofp.cz12a_nocb_c32r128 | 99.987 | 0.013 | nonzero | nonzero | 0.004 | ||||||
| pg181_o2nofp.cx10b_c32r128 | 99.999 | 0.001 | nonzero | 0.002 |
Insert response time histogram: each cell has the percentage of responses that take <= the time in the header and max is the max response time in seconds. For max values in the top 25% of the range have a red background and in the bottom 25% of the range have a green background. The red background is not used when the min value is within 80% of the max value.
| dbms | 256us | 1ms | 4ms | 16ms | 64ms | 256ms | 1s | 4s | 16s | gt | max |
|---|---|---|---|---|---|---|---|---|---|---|---|
| my8407_rel_o2nofp.cz12a_c32r128 | 99.181 | 0.743 | 0.037 | 0.039 | 0.152 | ||||||
| my8407_rel_o2nofp.cz12a_nocb_c32r128 | 98.859 | 1.141 | 0.014 | ||||||||
| pg181_o2nofp.cx10b_c32r128 | 99.850 | 0.150 | 0.008 |
Delete response time histogram: each cell has the percentage of responses that take <= the time in the header and max is the max response time in seconds. For max values in the top 25% of the range have a red background and in the bottom 25% of the range have a green background. The red background is not used when the min value is within 80% of the max value.
| dbms | 256us | 1ms | 4ms | 16ms | 64ms | 256ms | 1s | 4s | 16s | gt | max |
|---|---|---|---|---|---|---|---|---|---|---|---|
| my8407_rel_o2nofp.cz12a_c32r128 | 0.005 | 99.255 | 0.678 | 0.032 | 0.030 | 0.168 | |||||
| my8407_rel_o2nofp.cz12a_nocb_c32r128 | 0.021 | 98.926 | 1.051 | 0.002 | 0.017 | ||||||
| pg181_o2nofp.cx10b_c32r128 | 65.512 | 34.488 | 0.004 |
Performance metrics for the DBMS listed above. Some are normalized by throughput, others are not. Legend for results is here.
ips	qps	rps	rmbps	wps	wmbps	rpq	rkbpq	wpi	wkbpi	csps	cpups	cspq	cpupq	dbgb1	dbgb2	rss	maxop	p50	p99	tag
1193	86349	0	0.0	1394.3	39.6	0.000	0.000	1.169	33.986	499119	38.8	5.780	144	31.0	166.5	44.1	0.111	7199	7119	my8407_rel_o2nofp.cz12a_c32r128
1193	86367	0	0.0	1333.5	37.9	0.000	0.000	1.118	32.533	499108	39.0	5.779	144	31.0	165.9	44.9	0.004	7279	7199	my8407_rel_o2nofp.cz12a_nocb_c32r128
1192	147902	0	0.0	63.8	5.8	0.000	0.000	0.054	4.960	565245	37.3	3.822	81	33.2	129.3	0.5	0.002	12510	12270	pg181_o2nofp.cx10b_c32r128
Average values from iostat.
r/s	rkB/s	rrqm/s	%rrqm	r_await	rareq-s	w/s	wkB/s	wrqm/s	%wrqm	w_await	wareq-s	d/s	dkB/s	drqm/s	%drqm	d_await	dareq-s	f/s	f_await	aqu-sz	%util
0.000	0.000	0.000	0.000	0.000	0.000	1394.3	40534.5	1.341	0.377	0.598	30.91	0.011	0.137	0.000	0.000	0.065	0.409	2.318	0.566	1.216	6.236		my8407_rel_o2nofp.cz12a_c32r128
0.002	0.007	0.000	0.000	0.017	0.033	1333.5	38802.0	1.375	0.431	0.613	31.19	0.024	0.095	0.000	0.000	0.139	0.453	2.168	0.639	0.978	9.892		my8407_rel_o2nofp.cz12a_nocb_c32r128
0.000	0.000	0.000	0.000	0.000	0.000	63.80	5912.4	0.739	1.430	1.399	90.28	0.001	0.002	0.000	0.000	0.003	0.011	7.246	0.633	0.071	1.992		pg181_o2nofp.cx10b_c32r128
qp100.L2
qp100.L2: point queries with 100 insert/s per client. Graphs for performance per 1-second interval are here.
Average throughput:
Query response time histogram: each cell has the percentage of responses that take <= the time in the header and max is the max response time in seconds. For max values in the top 25% of the range have a red background and in the bottom 25% of the range have a green background. The red background is not used when the min value is within 80% of the max value.
| dbms | 256us | 1ms | 4ms | 16ms | 64ms | 256ms | 1s | 4s | 16s | gt | max |
|---|---|---|---|---|---|---|---|---|---|---|---|
| my8407_rel_o2nofp.cz12a_c32r128 | 99.958 | 0.042 | nonzero | nonzero | 0.004 | ||||||
| my8407_rel_o2nofp.cz12a_nocb_c32r128 | 99.961 | 0.039 | nonzero | 0.003 | |||||||
| pg181_o2nofp.cx10b_c32r128 | 99.992 | 0.008 | nonzero | 0.002 |
Insert response time histogram: each cell has the percentage of responses that take <= the time in the header and max is the max response time in seconds. For max values in the top 25% of the range have a red background and in the bottom 25% of the range have a green background. The red background is not used when the min value is within 80% of the max value.
| dbms | 256us | 1ms | 4ms | 16ms | 64ms | 256ms | 1s | 4s | 16s | gt | max |
|---|---|---|---|---|---|---|---|---|---|---|---|
| my8407_rel_o2nofp.cz12a_c32r128 | 99.123 | 0.877 | 0.016 | ||||||||
| my8407_rel_o2nofp.cz12a_nocb_c32r128 | 99.988 | 0.012 | 0.012 | ||||||||
| pg181_o2nofp.cx10b_c32r128 | 99.875 | 0.125 | 0.008 |
Delete response time histogram: each cell has the percentage of responses that take <= the time in the header and max is the max response time in seconds. For max values in the top 25% of the range have a red background and in the bottom 25% of the range have a green background. The red background is not used when the min value is within 80% of the max value.
| dbms | 256us | 1ms | 4ms | 16ms | 64ms | 256ms | 1s | 4s | 16s | gt | max |
|---|---|---|---|---|---|---|---|---|---|---|---|
| my8407_rel_o2nofp.cz12a_c32r128 | 99.132 | 0.868 | 0.013 | ||||||||
| my8407_rel_o2nofp.cz12a_nocb_c32r128 | 99.993 | 0.007 | 0.014 | ||||||||
| pg181_o2nofp.cx10b_c32r128 | 13.699 | 86.273 | 0.028 | 0.008 |
Performance metrics for the DBMS listed above. Some are normalized by throughput, others are not. Legend for results is here.
ips	qps	rps	rmbps	wps	wmbps	rpq	rkbpq	wpi	wkbpi	csps	cpups	cspq	cpupq	dbgb1	dbgb2	rss	maxop	p50	p99	tag
1192	66900	0	0.0	127.5	4.4	0.000	0.000	0.107	3.773	389156	38.0	5.817	182	31.0	166.7	44.1	0.004	5599	5551	my8407_rel_o2nofp.cz12a_c32r128
1193	67455	0	0.0	135.0	4.6	0.000	0.000	0.113	3.962	392267	38.5	5.815	183	31.0	166.2	44.9	0.003	5663	5599	my8407_rel_o2nofp.cz12a_nocb_c32r128
1192	83614	0	0.0	165.1	10.7	0.000	0.000	0.138	9.216	323278	36.9	3.866	141	33.2	128.5	0.5	0.002	7071	6927	pg181_o2nofp.cx10b_c32r128
Average values from iostat.
r/s	rkB/s	rrqm/s	%rrqm	r_await	rareq-s	w/s	wkB/s	wrqm/s	%wrqm	w_await	wareq-s	d/s	dkB/s	drqm/s	%drqm	d_await	dareq-s	f/s	f_await	aqu-sz	%util
0.001	0.002	0.000	0.000	0.008	0.011	127.5	4497.3	1.378	1.081	0.461	35.30	0.010	0.042	0.000	0.000	0.047	0.188	2.036	0.770	0.062	2.138		my8407_rel_o2nofp.cz12a_c32r128
0.001	0.004	0.000	0.000	0.011	0.022	135.0	4725.5	1.351	1.004	0.344	35.02	0.011	0.044	0.000	0.000	0.046	0.188	2.433	0.502	0.048	10.83		my8407_rel_o2nofp.cz12a_nocb_c32r128
0.000	0.000	0.000	0.000	0.000	0.000	165.1	10985.8	3.692	2.575	0.343	68.13	0.033	470.9	0.000	0.000	0.006	39.92	6.992	0.537	0.032	1.207		pg181_o2nofp.cx10b_c32r128
qr500.L3
qr500.L3: range queries with 500 insert/s per client. Graphs for performance per 1-second interval are here.
Average throughput:
Query response time histogram: each cell has the percentage of responses that take <= the time in the header and max is the max response time in seconds. For max values in the top 25% of the range have a red background and in the bottom 25% of the range have a green background. The red background is not used when the min value is within 80% of the max value.
| dbms | 256us | 1ms | 4ms | 16ms | 64ms | 256ms | 1s | 4s | 16s | gt | max |
|---|---|---|---|---|---|---|---|---|---|---|---|
| my8407_rel_o2nofp.cz12a_c32r128 | 99.974 | 0.026 | nonzero | 0.004 | |||||||
| my8407_rel_o2nofp.cz12a_nocb_c32r128 | 99.975 | 0.025 | nonzero | 0.003 | |||||||
| pg181_o2nofp.cx10b_c32r128 | 99.995 | 0.004 | nonzero | nonzero | nonzero | 0.019 |
Insert response time histogram: each cell has the percentage of responses that take <= the time in the header and max is the max response time in seconds. For max values in the top 25% of the range have a red background and in the bottom 25% of the range have a green background. The red background is not used when the min value is within 80% of the max value.
| dbms | 256us | 1ms | 4ms | 16ms | 64ms | 256ms | 1s | 4s | 16s | gt | max |
|---|---|---|---|---|---|---|---|---|---|---|---|
| my8407_rel_o2nofp.cz12a_c32r128 | 99.623 | 0.372 | 0.005 | 0.021 | |||||||
| my8407_rel_o2nofp.cz12a_nocb_c32r128 | 99.662 | 0.334 | 0.003 | 0.020 | |||||||
| pg181_o2nofp.cx10b_c32r128 | 0.269 | 98.617 | 0.956 | 0.159 | 0.041 |
Delete response time histogram: each cell has the percentage of responses that take <= the time in the header and max is the max response time in seconds. For max values in the top 25% of the range have a red background and in the bottom 25% of the range have a green background. The red background is not used when the min value is within 80% of the max value.
| dbms | 256us | 1ms | 4ms | 16ms | 64ms | 256ms | 1s | 4s | 16s | gt | max |
|---|---|---|---|---|---|---|---|---|---|---|---|
| my8407_rel_o2nofp.cz12a_c32r128 | 99.732 | 0.265 | 0.003 | 0.019 | |||||||
| my8407_rel_o2nofp.cz12a_nocb_c32r128 | 0.006 | 99.759 | 0.232 | 0.002 | 0.019 | ||||||
| pg181_o2nofp.cx10b_c32r128 | 47.769 | 51.531 | 0.617 | 0.082 | 0.023 |
Performance metrics for the DBMS listed above. Some are normalized by throughput, others are not. Legend for results is here.
ips	qps	rps	rmbps	wps	wmbps	rpq	rkbpq	wpi	wkbpi	csps	cpups	cspq	cpupq	dbgb1	dbgb2	rss	maxop	p50	p99	tag
5960	85754	0	0.0	567.3	20.8	0.000	0.000	0.095	3.570	495664	40.8	5.780	152	31.0	167.8	44.1	0.004	7183	7119	my8407_rel_o2nofp.cz12a_c32r128
5964	85753	0	0.0	565.1	20.7	0.000	0.000	0.095	3.553	495830	40.8	5.782	152	31.0	167.2	44.9	0.003	7183	7119	my8407_rel_o2nofp.cz12a_nocb_c32r128
5964	144498	0	0.0	266.9	15.7	0.000	0.000	0.045	2.691	552566	38.5	3.824	85	33.3	121.1	0.4	0.019	12079	11662	pg181_o2nofp.cx10b_c32r128
Average values from iostat.
r/s	rkB/s	rrqm/s	%rrqm	r_await	rareq-s	w/s	wkB/s	wrqm/s	%wrqm	w_await	wareq-s	d/s	dkB/s	drqm/s	%drqm	d_await	dareq-s	f/s	f_await	aqu-sz	%util
0.003	0.013	0.000	0.000	0.010	0.055	567.3	21276.6	1.522	0.337	1.119	39.80	0.059	2.276	0.000	0.000	0.286	5.702	2.540	0.848	0.606	2.317		my8407_rel_o2nofp.cz12a_c32r128
0.006	0.022	0.000	0.000	0.022	0.099	565.1	21186.6	1.506	0.333	0.931	39.69	0.076	5.635	0.000	0.000	0.196	6.275	2.607	0.684	0.601	1.566		my8407_rel_o2nofp.cz12a_nocb_c32r128
0.000	0.000	0.000	0.000	0.000	0.000	266.9	16048.4	5.944	2.084	0.311	61.29	0.291	4317.9	0.000	0.000	0.005	81.70	9.268	0.528	0.069	1.688		pg181_o2nofp.cx10b_c32r128
qp500.L4
qp500.L4: point queries with 500 insert/s per client. Graphs for performance per 1-second interval are here.
Average throughput:
Query response time histogram: each cell has the percentage of responses that take <= the time in the header and max is the max response time in seconds. For max values in the top 25% of the range have a red background and in the bottom 25% of the range have a green background. The red background is not used when the min value is within 80% of the max value.
| dbms | 256us | 1ms | 4ms | 16ms | 64ms | 256ms | 1s | 4s | 16s | gt | max |
|---|---|---|---|---|---|---|---|---|---|---|---|
| my8407_rel_o2nofp.cz12a_c32r128 | 99.856 | 0.143 | nonzero | 0.002 | |||||||
| my8407_rel_o2nofp.cz12a_nocb_c32r128 | 99.863 | 0.136 | nonzero | 0.003 | |||||||
| pg181_o2nofp.cx10b_c32r128 | 99.979 | 0.021 | nonzero | nonzero | nonzero | nonzero | 0.243 |
Insert response time histogram: each cell has the percentage of responses that take <= the time in the header and max is the max response time in seconds. For max values in the top 25% of the range have a red background and in the bottom 25% of the range have a green background. The red background is not used when the min value is within 80% of the max value.
| dbms | 256us | 1ms | 4ms | 16ms | 64ms | 256ms | 1s | 4s | 16s | gt | max |
|---|---|---|---|---|---|---|---|---|---|---|---|
| my8407_rel_o2nofp.cz12a_c32r128 | 99.894 | 0.104 | 0.003 | 0.023 | |||||||
| my8407_rel_o2nofp.cz12a_nocb_c32r128 | 99.753 | 0.241 | 0.006 | 0.023 | |||||||
| pg181_o2nofp.cx10b_c32r128 | 0.114 | 99.072 | 0.601 | 0.132 | 0.081 | 0.239 |
Delete response time histogram: each cell has the percentage of responses that take <= the time in the header and max is the max response time in seconds. For max values in the top 25% of the range have a red background and in the bottom 25% of the range have a green background. The red background is not used when the min value is within 80% of the max value.
| dbms | 256us | 1ms | 4ms | 16ms | 64ms | 256ms | 1s | 4s | 16s | gt | max |
|---|---|---|---|---|---|---|---|---|---|---|---|
| my8407_rel_o2nofp.cz12a_c32r128 | 99.927 | 0.069 | 0.004 | 0.026 | |||||||
| my8407_rel_o2nofp.cz12a_nocb_c32r128 | 99.855 | 0.140 | 0.005 | 0.025 | |||||||
| pg181_o2nofp.cx10b_c32r128 | 42.500 | 57.010 | 0.368 | 0.063 | 0.059 | 0.214 |
Performance metrics for the DBMS listed above. Some are normalized by throughput, others are not. Legend for results is here.
ips	qps	rps	rmbps	wps	wmbps	rpq	rkbpq	wpi	wkbpi	csps	cpups	cspq	cpupq	dbgb1	dbgb2	rss	maxop	p50	p99	tag
5964	66270	0	0.0	625.6	22.4	0.000	0.000	0.105	3.847	388866	39.5	5.868	191	31.0	168.9	44.1	0.002	5551	5487	my8407_rel_o2nofp.cz12a_c32r128
5960	66856	0	0.0	632.2	22.6	0.000	0.000	0.106	3.884	392473	39.9	5.870	191	31.0	168.3	44.9	0.003	5599	5551	my8407_rel_o2nofp.cz12a_nocb_c32r128
5964	83212	0	0.0	167.8	16.5	0.000	0.000	0.028	2.839	322605	37.6	3.877	145	33.4	114.7	0.4	0.243	6895	6735	pg181_o2nofp.cx10b_c32r128
Average values from iostat.
r/s	rkB/s	rrqm/s	%rrqm	r_await	rareq-s	w/s	wkB/s	wrqm/s	%wrqm	w_await	wareq-s	d/s	dkB/s	drqm/s	%drqm	d_await	dareq-s	f/s	f_await	aqu-sz	%util
0.004	0.018	0.000	0.000	0.017	0.077	625.6	22941.4	1.685	0.288	0.622	37.32	0.050	1.752	0.000	0.000	0.152	4.250	2.512	0.534	0.392	2.964		my8407_rel_o2nofp.cz12a_c32r128
0.003	0.011	0.000	0.000	0.015	0.044	632.2	23150.7	1.632	0.277	0.737	37.27	0.081	6.895	0.000	0.000	0.227	8.698	2.536	0.643	0.480	2.717		my8407_rel_o2nofp.cz12a_nocb_c32r128
0.000	0.000	0.000	0.000	0.000	0.000	167.8	16929.5	6.286	2.609	0.701	101.0	0.256	3738.8	0.000	0.000	0.014	41.44	9.094	0.648	0.177	2.028		pg181_o2nofp.cx10b_c32r128
qr1000.L5
qr1000.L5: range queries with 1000 insert/s per client. Graphs for performance per 1-second interval are here.
Average throughput:
Query response time histogram: each cell has the percentage of responses that take <= the time in the header and max is the max response time in seconds. For max values in the top 25% of the range have a red background and in the bottom 25% of the range have a green background. The red background is not used when the min value is within 80% of the max value.
| dbms | 256us | 1ms | 4ms | 16ms | 64ms | 256ms | 1s | 4s | 16s | gt | max |
|---|---|---|---|---|---|---|---|---|---|---|---|
| my8407_rel_o2nofp.cz12a_c32r128 | 99.935 | 0.064 | 0.001 | nonzero | 0.007 | ||||||
| my8407_rel_o2nofp.cz12a_nocb_c32r128 | 99.929 | 0.069 | 0.002 | nonzero | nonzero | nonzero | 0.166 | ||||
| pg181_o2nofp.cx10b_c32r128 | 99.992 | 0.007 | nonzero | nonzero | nonzero | nonzero | 0.177 |
Insert response time histogram: each cell has the percentage of responses that take <= the time in the header and max is the max response time in seconds. For max values in the top 25% of the range have a red background and in the bottom 25% of the range have a green background. The red background is not used when the min value is within 80% of the max value.
| dbms | 256us | 1ms | 4ms | 16ms | 64ms | 256ms | 1s | 4s | 16s | gt | max |
|---|---|---|---|---|---|---|---|---|---|---|---|
| my8407_rel_o2nofp.cz12a_c32r128 | 99.507 | 0.481 | 0.011 | nonzero | 0.066 | ||||||
| my8407_rel_o2nofp.cz12a_nocb_c32r128 | 99.344 | 0.549 | 0.061 | 0.047 | 0.199 | ||||||
| pg181_o2nofp.cx10b_c32r128 | 0.945 | 98.506 | 0.442 | 0.107 | nonzero | 0.134 |
Delete response time histogram: each cell has the percentage of responses that take <= the time in the header and max is the max response time in seconds. For max values in the top 25% of the range have a red background and in the bottom 25% of the range have a green background. The red background is not used when the min value is within 80% of the max value.
| dbms | 256us | 1ms | 4ms | 16ms | 64ms | 256ms | 1s | 4s | 16s | gt | max |
|---|---|---|---|---|---|---|---|---|---|---|---|
| my8407_rel_o2nofp.cz12a_c32r128 | nonzero | 99.751 | 0.240 | 0.009 | 0.056 | ||||||
| my8407_rel_o2nofp.cz12a_nocb_c32r128 | 0.010 | 99.563 | 0.342 | 0.048 | 0.037 | 0.194 | |||||
| pg181_o2nofp.cx10b_c32r128 | 38.004 | 61.616 | 0.316 | 0.064 | nonzero | 0.133 |
Performance metrics for the DBMS listed above. Some are normalized by throughput, others are not. Legend for results is here.
ips	qps	rps	rmbps	wps	wmbps	rpq	rkbpq	wpi	wkbpi	csps	cpups	cspq	cpupq	dbgb1	dbgb2	rss	maxop	p50	p99	tag
11927	84533	0	0.0	1022.5	38.8	0.000	0.000	0.086	3.329	490053	42.7	5.797	162	31.0	171.0	44.1	0.007	7087	7023	my8407_rel_o2nofp.cz12a_c32r128
11920	84646	0	0.0	1025.4	38.8	0.000	0.000	0.086	3.336	491290	42.7	5.804	161	31.0	170.4	44.9	0.166	7135	6959	my8407_rel_o2nofp.cz12a_nocb_c32r128
11927	142783	0	0.0	208.9	21.3	0.000	0.000	0.018	1.831	546000	39.8	3.824	89	33.4	109.5	0.5	0.177	11951	11295	pg181_o2nofp.cx10b_c32r128
Average values from iostat.
r/s	rkB/s	rrqm/s	%rrqm	r_await	rareq-s	w/s	wkB/s	wrqm/s	%wrqm	w_await	wareq-s	d/s	dkB/s	drqm/s	%drqm	d_await	dareq-s	f/s	f_await	aqu-sz	%util
0.005	0.020	0.000	0.000	0.054	0.088	1022.5	39704.8	1.803	0.179	1.192	39.00	0.072	3.308	0.000	0.000	0.264	6.807	2.831	0.782	1.153	1.890		my8407_rel_o2nofp.cz12a_c32r128
0.008	0.031	0.000	0.000	0.028	0.155	1025.4	39765.9	1.784	0.179	1.193	38.95	0.099	7.882	0.000	0.000	0.386	8.636	3.647	0.946	1.268	2.470		my8407_rel_o2nofp.cz12a_nocb_c32r128
0.001	0.004	0.000	0.000	0.000	0.011	208.9	21835.0	6.996	2.710	0.338	104.2	0.217	3086.2	0.000	0.000	0.088	54.11	13.37	0.549	0.078	2.161		pg181_o2nofp.cx10b_c32r128
qp1000.L6
qp1000.L6: point queries with 1000 insert/s per client. Graphs for performance per 1-second interval are here.
Average throughput:
Query response time histogram: each cell has the percentage of responses that take <= the time in the header and max is the max response time in seconds. For max values in the top 25% of the range have a red background and in the bottom 25% of the range have a green background. The red background is not used when the min value is within 80% of the max value.
| dbms | 256us | 1ms | 4ms | 16ms | 64ms | 256ms | 1s | 4s | 16s | gt | max |
|---|---|---|---|---|---|---|---|---|---|---|---|
| my8407_rel_o2nofp.cz12a_c32r128 | 99.662 | 0.336 | 0.002 | nonzero | 0.009 | ||||||
| my8407_rel_o2nofp.cz12a_nocb_c32r128 | 99.676 | 0.322 | 0.002 | nonzero | 0.005 | ||||||
| pg181_o2nofp.cx10b_c32r128 | 99.954 | 0.045 | nonzero | nonzero | nonzero | nonzero | 0.119 |
Insert response time histogram: each cell has the percentage of responses that take <= the time in the header and max is the max response time in seconds. For max values in the top 25% of the range have a red background and in the bottom 25% of the range have a green background. The red background is not used when the min value is within 80% of the max value.
| dbms | 256us | 1ms | 4ms | 16ms | 64ms | 256ms | 1s | 4s | 16s | gt | max |
|---|---|---|---|---|---|---|---|---|---|---|---|
| my8407_rel_o2nofp.cz12a_c32r128 | 99.611 | 0.376 | 0.013 | nonzero | 0.072 | ||||||
| my8407_rel_o2nofp.cz12a_nocb_c32r128 | 99.340 | 0.651 | 0.009 | nonzero | 0.065 | ||||||
| pg181_o2nofp.cx10b_c32r128 | 0.578 | 98.895 | 0.415 | 0.112 | 0.040 |
Delete response time histogram: each cell has the percentage of responses that take <= the time in the header and max is the max response time in seconds. For max values in the top 25% of the range have a red background and in the bottom 25% of the range have a green background. The red background is not used when the min value is within 80% of the max value.
| dbms | 256us | 1ms | 4ms | 16ms | 64ms | 256ms | 1s | 4s | 16s | gt | max |
|---|---|---|---|---|---|---|---|---|---|---|---|
| my8407_rel_o2nofp.cz12a_c32r128 | nonzero | 99.814 | 0.175 | 0.010 | 0.058 | ||||||
| my8407_rel_o2nofp.cz12a_nocb_c32r128 | 0.001 | 99.631 | 0.360 | 0.007 | nonzero | 0.064 | |||||
| pg181_o2nofp.cx10b_c32r128 | 39.789 | 59.755 | 0.385 | 0.071 | 0.039 |
Performance metrics for the DBMS listed above. Some are normalized by throughput, others are not. Legend for results is here.
ips	qps	rps	rmbps	wps	wmbps	rpq	rkbpq	wpi	wkbpi	csps	cpups	cspq	cpupq	dbgb1	dbgb2	rss	maxop	p50	p99	tag
11927	65565	0	0.0	1083.9	40.6	0.000	0.000	0.091	3.482	387497	42.7	5.910	208	31.0	173.1	44.1	0.009	5487	5423	my8407_rel_o2nofp.cz12a_c32r128
11927	66022	0	0.0	1084.6	40.5	0.000	0.000	0.091	3.478	389416	42.4	5.898	206	31.0	172.5	44.9	0.005	5519	5471	my8407_rel_o2nofp.cz12a_nocb_c32r128
11927	82561	0	0.0	202.2	21.0	0.000	0.000	0.017	1.804	320836	38.9	3.886	151	33.2	105.7	13.6	0.119	6943	6717	pg181_o2nofp.cx10b_c32r128
Average values from iostat.
r/s	rkB/s	rrqm/s	%rrqm	r_await	rareq-s	w/s	wkB/s	wrqm/s	%wrqm	w_await	wareq-s	d/s	dkB/s	drqm/s	%drqm	d_await	dareq-s	f/s	f_await	aqu-sz	%util
0.008	0.033	0.000	0.000	0.033	0.166	1083.9	41527.1	1.747	0.160	0.644	38.28	0.059	3.324	0.000	0.000	0.224	8.439	2.654	0.590	0.700	1.881		my8407_rel_o2nofp.cz12a_c32r128
0.010	0.042	0.000	0.000	0.050	0.199	1084.6	41479.3	1.734	0.158	0.609	38.20	0.113	9.596	0.000	0.000	0.152	10.25	2.655	0.468	0.661	1.750		my8407_rel_o2nofp.cz12a_nocb_c32r128
0.000	0.000	0.000	0.000	0.000	0.000	202.2	21516.1	7.578	2.636	0.394	105.5	0.157	2249.5	0.000	0.000	0.051	310.2	12.89	0.570	0.080	2.203		pg181_o2nofp.cx10b_c32r128
l.i0
l.i0: load without secondary indexes
Performance metrics for all DBMS, not just the ones listed above. Some are normalized by throughput, others are not. Legend for results is here.
ips	qps	rps	rmbps	wps	wmbps	rpq	rkbpq	wpi	wkbpi	csps	cpups	cspq	cpupq	dbgb1	dbgb2	rss	maxop	p50	p99	tag
805369	0	1	0.0	2672.4	224.1	0.000	0.000	0.003	0.285	136973	46.1	0.170	18	8.0	114.2	16.5	0.165	78091	67591	my8407_rel_o2nofp.cz12a_c32r128
816326	0	1	0.0	2690.5	229.2	0.000	0.000	0.003	0.287	141105	47.2	0.173	19	8.0	114.2	16.5	0.160	78790	66892	my8407_rel_o2nofp.cz12a_nocb_c32r128
1100917	0	2	0.0	3933.7	454.1	0.000	0.000	0.004	0.422	110935	47.3	0.101	14	11.5	31.1	0.2	0.005	112987	106487	pg181_o2nofp.cx10b_c32r128
l.x
l.x: create secondary indexes
Performance metrics for all DBMS, not just the ones listed above. Some are normalized by throughput, others are not. Legend for results is here.
ips	qps	rps	rmbps	wps	wmbps	rpq	rkbpq	wpi	wkbpi	csps	cpups	cspq	cpupq	dbgb1	dbgb2	rss	maxop	p50	p99	tag
2105265	0	50	1.3	66028.0	2509.9	0.000	0.001	0.031	1.221	95406	73.8	0.045	11	18.2	124.4	16.9	0.004	NA	NA	my8407_rel_o2nofp.cz12a_c32r128
2105265	0	54	1.6	65301.5	2498.6	0.000	0.001	0.031	1.215	95937	73.6	0.046	11	18.2	124.4	16.9	0.007	NA	NA	my8407_rel_o2nofp.cz12a_nocb_c32r128
2448982	0	0	0.0	5406.2	662.4	0.000	0.000	0.002	0.277	16222	23.4	0.007	3	23.1	53.1	7.0	0.033	NA	NA	pg181_o2nofp.cx10b_c32r128
l.i1
l.i1: continue load after secondary indexes created with 50 inserts per transaction
Performance metrics for all DBMS, not just the ones listed above. Some are normalized by throughput, others are not. Legend for results is here.
ips	qps	rps	rmbps	wps	wmbps	rpq	rkbpq	wpi	wkbpi	csps	cpups	cspq	cpupq	dbgb1	dbgb2	rss	maxop	p50	p99	tag
177122	0	536	8.4	7462.9	327.1	0.003	0.048	0.042	1.891	208813	67.5	1.179	122	31.0	158.6	44.1	2.097	18148	2650	my8407_rel_o2nofp.cz12a_c32r128
180451	0	546	8.5	7518.2	330.0	0.003	0.048	0.042	1.872	211025	67.0	1.169	119	31.0	159.5	44.7	1.059	18548	2850	my8407_rel_o2nofp.cz12a_nocb_c32r128
286140	0	0	0.0	3657.3	409.6	0.000	0.000	0.013	1.466	118065	61.9	0.413	69	33.0	129.1	30.1	0.675	28246	900	pg181_o2nofp.cx10b_c32r128
l.i2
l.i2: continue load after secondary indexes created with 5 inserts per transaction
Performance metrics for all DBMS, not just the ones listed above. Some are normalized by throughput, others are not. Legend for results is here.
ips	qps	rps	rmbps	wps	wmbps	rpq	rkbpq	wpi	wkbpi	csps	cpups	cspq	cpupq	dbgb1	dbgb2	rss	maxop	p50	p99	tag
77046	0	0	0.0	5934.3	252.5	0.000	0.000	0.077	3.356	416881	66.8	5.411	277	31.0	166.3	44.1	0.530	7499	1120	my8407_rel_o2nofp.cz12a_c32r128
77046	0	0	0.0	5910.1	252.0	0.000	0.000	0.077	3.350	416948	66.1	5.412	275	31.0	165.7	44.9	0.941	7569	1125	my8407_rel_o2nofp.cz12a_nocb_c32r128
60759	0	0	0.0	570.1	63.3	0.000	0.000	0.009	1.067	241471	52.7	3.974	278	33.2	129.3	25.4	0.095	3929	2415	pg181_o2nofp.cx10b_c32r128
qr100.L1
qr100.L1: range queries with 100 insert/s per client
Performance metrics for all DBMS, not just the ones listed above. Some are normalized by throughput, others are not. Legend for results is here.
ips	qps	rps	rmbps	wps	wmbps	rpq	rkbpq	wpi	wkbpi	csps	cpups	cspq	cpupq	dbgb1	dbgb2	rss	maxop	p50	p99	tag
1193	86349	0	0.0	1394.3	39.6	0.000	0.000	1.169	33.986	499119	38.8	5.780	144	31.0	166.5	44.1	0.111	7199	7119	my8407_rel_o2nofp.cz12a_c32r128
1193	86367	0	0.0	1333.5	37.9	0.000	0.000	1.118	32.533	499108	39.0	5.779	144	31.0	165.9	44.9	0.004	7279	7199	my8407_rel_o2nofp.cz12a_nocb_c32r128
1192	147902	0	0.0	63.8	5.8	0.000	0.000	0.054	4.960	565245	37.3	3.822	81	33.2	129.3	0.5	0.002	12510	12270	pg181_o2nofp.cx10b_c32r128
qp100.L2
qp100.L2: point queries with 100 insert/s per client
Performance metrics for all DBMS, not just the ones listed above. Some are normalized by throughput, others are not. Legend for results is here.
ips	qps	rps	rmbps	wps	wmbps	rpq	rkbpq	wpi	wkbpi	csps	cpups	cspq	cpupq	dbgb1	dbgb2	rss	maxop	p50	p99	tag
1192	66900	0	0.0	127.5	4.4	0.000	0.000	0.107	3.773	389156	38.0	5.817	182	31.0	166.7	44.1	0.004	5599	5551	my8407_rel_o2nofp.cz12a_c32r128
1193	67455	0	0.0	135.0	4.6	0.000	0.000	0.113	3.962	392267	38.5	5.815	183	31.0	166.2	44.9	0.003	5663	5599	my8407_rel_o2nofp.cz12a_nocb_c32r128
1192	83614	0	0.0	165.1	10.7	0.000	0.000	0.138	9.216	323278	36.9	3.866	141	33.2	128.5	0.5	0.002	7071	6927	pg181_o2nofp.cx10b_c32r128
qr500.L3
qr500.L3: range queries with 500 insert/s per client
Performance metrics for all DBMS, not just the ones listed above. Some are normalized by throughput, others are not. Legend for results is here.
ips	qps	rps	rmbps	wps	wmbps	rpq	rkbpq	wpi	wkbpi	csps	cpups	cspq	cpupq	dbgb1	dbgb2	rss	maxop	p50	p99	tag
5960	85754	0	0.0	567.3	20.8	0.000	0.000	0.095	3.570	495664	40.8	5.780	152	31.0	167.8	44.1	0.004	7183	7119	my8407_rel_o2nofp.cz12a_c32r128
5964	85753	0	0.0	565.1	20.7	0.000	0.000	0.095	3.553	495830	40.8	5.782	152	31.0	167.2	44.9	0.003	7183	7119	my8407_rel_o2nofp.cz12a_nocb_c32r128
5964	144498	0	0.0	266.9	15.7	0.000	0.000	0.045	2.691	552566	38.5	3.824	85	33.3	121.1	0.4	0.019	12079	11662	pg181_o2nofp.cx10b_c32r128
qp500.L4
qp500.L4: point queries with 500 insert/s per client
Performance metrics for all DBMS, not just the ones listed above. Some are normalized by throughput, others are not. Legend for results is here.
ips	qps	rps	rmbps	wps	wmbps	rpq	rkbpq	wpi	wkbpi	csps	cpups	cspq	cpupq	dbgb1	dbgb2	rss	maxop	p50	p99	tag
5964	66270	0	0.0	625.6	22.4	0.000	0.000	0.105	3.847	388866	39.5	5.868	191	31.0	168.9	44.1	0.002	5551	5487	my8407_rel_o2nofp.cz12a_c32r128
5960	66856	0	0.0	632.2	22.6	0.000	0.000	0.106	3.884	392473	39.9	5.870	191	31.0	168.3	44.9	0.003	5599	5551	my8407_rel_o2nofp.cz12a_nocb_c32r128
5964	83212	0	0.0	167.8	16.5	0.000	0.000	0.028	2.839	322605	37.6	3.877	145	33.4	114.7	0.4	0.243	6895	6735	pg181_o2nofp.cx10b_c32r128
qr1000.L5
qr1000.L5: range queries with 1000 insert/s per client
Performance metrics for all DBMS, not just the ones listed above. Some are normalized by throughput, others are not. Legend for results is here.
ips	qps	rps	rmbps	wps	wmbps	rpq	rkbpq	wpi	wkbpi	csps	cpups	cspq	cpupq	dbgb1	dbgb2	rss	maxop	p50	p99	tag
11927	84533	0	0.0	1022.5	38.8	0.000	0.000	0.086	3.329	490053	42.7	5.797	162	31.0	171.0	44.1	0.007	7087	7023	my8407_rel_o2nofp.cz12a_c32r128
11920	84646	0	0.0	1025.4	38.8	0.000	0.000	0.086	3.336	491290	42.7	5.804	161	31.0	170.4	44.9	0.166	7135	6959	my8407_rel_o2nofp.cz12a_nocb_c32r128
11927	142783	0	0.0	208.9	21.3	0.000	0.000	0.018	1.831	546000	39.8	3.824	89	33.4	109.5	0.5	0.177	11951	11295	pg181_o2nofp.cx10b_c32r128
qp1000.L6
qp1000.L6: point queries with 1000 insert/s per client
Performance metrics for all DBMS, not just the ones listed above. Some are normalized by throughput, others are not. Legend for results is here.
ips	qps	rps	rmbps	wps	wmbps	rpq	rkbpq	wpi	wkbpi	csps	cpups	cspq	cpupq	dbgb1	dbgb2	rss	maxop	p50	p99	tag
11927	65565	0	0.0	1083.9	40.6	0.000	0.000	0.091	3.482	387497	42.7	5.910	208	31.0	173.1	44.1	0.009	5487	5423	my8407_rel_o2nofp.cz12a_c32r128
11927	66022	0	0.0	1084.6	40.5	0.000	0.000	0.091	3.478	389416	42.4	5.898	206	31.0	172.5	44.9	0.005	5519	5471	my8407_rel_o2nofp.cz12a_nocb_c32r128
11927	82561	0	0.0	202.2	21.0	0.000	0.000	0.017	1.804	320836	38.9	3.886	151	33.2	105.7	13.6	0.119	6943	6717	pg181_o2nofp.cx10b_c32r128
l.i0
- l.i0: load without secondary indexes
- Legend for results is here.
- Each entry lists the percentage of responses that fit in that bucket (slower than max time for previous bucket, faster than min time for next bucket).
Insert response time histogram
256us	1ms	4ms	16ms	64ms	256ms	1s	4s	16s	gt	max	tag
0.000	0.139	99.765	0.070	0.004	0.021	0.000	0.000	0.000	0.000	0.165	my8407_rel_o2nofp.cz12a_c32r128
0.000	0.221	99.686	0.068	0.004	0.021	0.000	0.000	0.000	0.000	0.160	my8407_rel_o2nofp.cz12a_nocb_c32r128
0.000	98.914	1.082	0.004	0.000	0.000	0.000	0.000	0.000	0.000	0.005	pg181_o2nofp.cx10b_c32r128
l.x
- l.x: create secondary indexes
- Legend for results is here.
- Each entry lists the percentage of responses that fit in that bucket (slower than max time for previous bucket, faster than min time for next bucket).
TODO - determine whether there is data for create index response time
l.i1
- l.i1: continue load after secondary indexes created with 50 inserts per transaction
- Legend for results is here.
- Each entry lists the percentage of responses that fit in that bucket (slower than max time for previous bucket, faster than min time for next bucket).
Insert response time histogram
256us	1ms	4ms	16ms	64ms	256ms	1s	4s	16s	gt	max	tag
0.000	0.000	88.031	11.647	0.227	0.082	0.012	0.001	0.000	0.000	2.097	my8407_rel_o2nofp.cz12a_c32r128
0.000	0.000	88.515	11.209	0.178	0.084	0.014	nonzero	0.000	0.000	1.059	my8407_rel_o2nofp.cz12a_nocb_c32r128
0.000	0.805	98.611	0.245	0.238	0.066	0.035	0.000	0.000	0.000	0.675	pg181_o2nofp.cx10b_c32r128
Delete response time histogram
256us	1ms	4ms	16ms	64ms	256ms	1s	4s	16s	gt	max	tag
0.000	0.007	88.343	11.335	0.214	0.088	0.013	0.001	0.000	0.000	2.038	my8407_rel_o2nofp.cz12a_c32r128
0.000	0.011	88.763	10.997	0.132	0.080	0.015	nonzero	0.000	0.000	1.068	my8407_rel_o2nofp.cz12a_nocb_c32r128
0.000	23.501	75.672	0.502	0.226	0.062	0.035	0.000	0.000	0.000	0.674	pg181_o2nofp.cx10b_c32r128
l.i2
- l.i2: continue load after secondary indexes created with 5 inserts per transaction
- Legend for results is here.
- Each entry lists the percentage of responses that fit in that bucket (slower than max time for previous bucket, faster than min time for next bucket).
Insert response time histogram
256us	1ms	4ms	16ms	64ms	256ms	1s	4s	16s	gt	max	tag
0.011	90.832	8.466	0.671	0.011	0.007	0.001	0.000	0.000	0.000	0.530	my8407_rel_o2nofp.cz12a_c32r128
0.035	91.057	8.165	0.721	0.013	0.008	0.002	0.000	0.000	0.000	0.941	my8407_rel_o2nofp.cz12a_nocb_c32r128
66.195	33.801	0.003	nonzero	nonzero	nonzero	0.000	0.000	0.000	0.000	0.095	pg181_o2nofp.cx10b_c32r128
Delete response time histogram
256us	1ms	4ms	16ms	64ms	256ms	1s	4s	16s	gt	max	tag
0.016	91.464	7.870	0.632	0.010	0.007	0.002	0.000	0.000	0.000	0.541	my8407_rel_o2nofp.cz12a_c32r128
0.049	91.645	7.603	0.683	0.011	0.007	0.002	0.000	0.000	0.000	0.938	my8407_rel_o2nofp.cz12a_nocb_c32r128
0.013	53.814	46.172	0.001	nonzero	nonzero	0.000	0.000	0.000	0.000	0.095	pg181_o2nofp.cx10b_c32r128
qr100.L1
- qr100.L1: range queries with 100 insert/s per client
- Legend for results is here.
- Each entry lists the percentage of responses that fit in that bucket (slower than max time for previous bucket, faster than min time for next bucket).
Query response time histogram
256us	1ms	4ms	16ms	64ms	256ms	1s	4s	16s	gt	max	tag
99.988	0.012	nonzero	nonzero	nonzero	nonzero	0.000	0.000	0.000	0.000	0.111	my8407_rel_o2nofp.cz12a_c32r128
99.987	0.013	nonzero	nonzero	0.000	0.000	0.000	0.000	0.000	0.000	0.004	my8407_rel_o2nofp.cz12a_nocb_c32r128
99.999	0.001	nonzero	0.000	0.000	0.000	0.000	0.000	0.000	0.000	0.002	pg181_o2nofp.cx10b_c32r128
Insert response time histogram
256us	1ms	4ms	16ms	64ms	256ms	1s	4s	16s	gt	max	tag
0.000	0.000	99.181	0.743	0.037	0.039	0.000	0.000	0.000	0.000	0.152	my8407_rel_o2nofp.cz12a_c32r128
0.000	0.000	98.859	1.141	0.000	0.000	0.000	0.000	0.000	0.000	0.014	my8407_rel_o2nofp.cz12a_nocb_c32r128
0.000	0.000	99.850	0.150	0.000	0.000	0.000	0.000	0.000	0.000	0.008	pg181_o2nofp.cx10b_c32r128
Delete response time histogram
256us	1ms	4ms	16ms	64ms	256ms	1s	4s	16s	gt	max	tag
0.000	0.005	99.255	0.678	0.032	0.030	0.000	0.000	0.000	0.000	0.168	my8407_rel_o2nofp.cz12a_c32r128
0.000	0.021	98.926	1.051	0.002	0.000	0.000	0.000	0.000	0.000	0.017	my8407_rel_o2nofp.cz12a_nocb_c32r128
0.000	65.512	34.488	0.000	0.000	0.000	0.000	0.000	0.000	0.000	0.004	pg181_o2nofp.cx10b_c32r128
qp100.L2
- qp100.L2: point queries with 100 insert/s per client
- Legend for results is here.
- Each entry lists the percentage of responses that fit in that bucket (slower than max time for previous bucket, faster than min time for next bucket).
Query response time histogram
256us	1ms	4ms	16ms	64ms	256ms	1s	4s	16s	gt	max	tag
99.958	0.042	nonzero	nonzero	0.000	0.000	0.000	0.000	0.000	0.000	0.004	my8407_rel_o2nofp.cz12a_c32r128
99.961	0.039	nonzero	0.000	0.000	0.000	0.000	0.000	0.000	0.000	0.003	my8407_rel_o2nofp.cz12a_nocb_c32r128
99.992	0.008	nonzero	0.000	0.000	0.000	0.000	0.000	0.000	0.000	0.002	pg181_o2nofp.cx10b_c32r128
Insert response time histogram
256us	1ms	4ms	16ms	64ms	256ms	1s	4s	16s	gt	max	tag
0.000	0.000	99.123	0.877	0.000	0.000	0.000	0.000	0.000	0.000	0.016	my8407_rel_o2nofp.cz12a_c32r128
0.000	0.000	99.988	0.012	0.000	0.000	0.000	0.000	0.000	0.000	0.012	my8407_rel_o2nofp.cz12a_nocb_c32r128
0.000	0.000	99.875	0.125	0.000	0.000	0.000	0.000	0.000	0.000	0.008	pg181_o2nofp.cx10b_c32r128
Delete response time histogram
256us	1ms	4ms	16ms	64ms	256ms	1s	4s	16s	gt	max	tag
0.000	0.000	99.132	0.868	0.000	0.000	0.000	0.000	0.000	0.000	0.013	my8407_rel_o2nofp.cz12a_c32r128
0.000	0.000	99.993	0.007	0.000	0.000	0.000	0.000	0.000	0.000	0.014	my8407_rel_o2nofp.cz12a_nocb_c32r128
0.000	13.699	86.273	0.028	0.000	0.000	0.000	0.000	0.000	0.000	0.008	pg181_o2nofp.cx10b_c32r128
qr500.L3
- qr500.L3: range queries with 500 insert/s per client
- Legend for results is here.
- Each entry lists the percentage of responses that fit in that bucket (slower than max time for previous bucket, faster than min time for next bucket).
Query response time histogram
256us	1ms	4ms	16ms	64ms	256ms	1s	4s	16s	gt	max	tag
99.974	0.026	nonzero	0.000	0.000	0.000	0.000	0.000	0.000	0.000	0.004	my8407_rel_o2nofp.cz12a_c32r128
99.975	0.025	nonzero	0.000	0.000	0.000	0.000	0.000	0.000	0.000	0.003	my8407_rel_o2nofp.cz12a_nocb_c32r128
99.995	0.004	nonzero	nonzero	nonzero	0.000	0.000	0.000	0.000	0.000	0.019	pg181_o2nofp.cx10b_c32r128
Insert response time histogram
256us	1ms	4ms	16ms	64ms	256ms	1s	4s	16s	gt	max	tag
0.000	0.000	99.623	0.372	0.005	0.000	0.000	0.000	0.000	0.000	0.021	my8407_rel_o2nofp.cz12a_c32r128
0.000	0.000	99.662	0.334	0.003	0.000	0.000	0.000	0.000	0.000	0.020	my8407_rel_o2nofp.cz12a_nocb_c32r128
0.000	0.269	98.617	0.956	0.159	0.000	0.000	0.000	0.000	0.000	0.041	pg181_o2nofp.cx10b_c32r128
Delete response time histogram
256us	1ms	4ms	16ms	64ms	256ms	1s	4s	16s	gt	max	tag
0.000	0.000	99.732	0.265	0.003	0.000	0.000	0.000	0.000	0.000	0.019	my8407_rel_o2nofp.cz12a_c32r128
0.000	0.006	99.759	0.232	0.002	0.000	0.000	0.000	0.000	0.000	0.019	my8407_rel_o2nofp.cz12a_nocb_c32r128
0.000	47.769	51.531	0.617	0.082	0.000	0.000	0.000	0.000	0.000	0.023	pg181_o2nofp.cx10b_c32r128
qp500.L4
- qp500.L4: point queries with 500 insert/s per client
- Legend for results is here.
- Each entry lists the percentage of responses that fit in that bucket (slower than max time for previous bucket, faster than min time for next bucket).
Query response time histogram
256us	1ms	4ms	16ms	64ms	256ms	1s	4s	16s	gt	max	tag
99.856	0.143	nonzero	0.000	0.000	0.000	0.000	0.000	0.000	0.000	0.002	my8407_rel_o2nofp.cz12a_c32r128
99.863	0.136	nonzero	0.000	0.000	0.000	0.000	0.000	0.000	0.000	0.003	my8407_rel_o2nofp.cz12a_nocb_c32r128
99.979	0.021	nonzero	nonzero	nonzero	nonzero	0.000	0.000	0.000	0.000	0.243	pg181_o2nofp.cx10b_c32r128
Insert response time histogram
256us	1ms	4ms	16ms	64ms	256ms	1s	4s	16s	gt	max	tag
0.000	0.000	99.894	0.104	0.003	0.000	0.000	0.000	0.000	0.000	0.023	my8407_rel_o2nofp.cz12a_c32r128
0.000	0.000	99.753	0.241	0.006	0.000	0.000	0.000	0.000	0.000	0.023	my8407_rel_o2nofp.cz12a_nocb_c32r128
0.000	0.114	99.072	0.601	0.132	0.081	0.000	0.000	0.000	0.000	0.239	pg181_o2nofp.cx10b_c32r128
Delete response time histogram
256us	1ms	4ms	16ms	64ms	256ms	1s	4s	16s	gt	max	tag
0.000	0.000	99.927	0.069	0.004	0.000	0.000	0.000	0.000	0.000	0.026	my8407_rel_o2nofp.cz12a_c32r128
0.000	0.000	99.855	0.140	0.005	0.000	0.000	0.000	0.000	0.000	0.025	my8407_rel_o2nofp.cz12a_nocb_c32r128
0.000	42.500	57.010	0.368	0.063	0.059	0.000	0.000	0.000	0.000	0.214	pg181_o2nofp.cx10b_c32r128
qr1000.L5
- qr1000.L5: range queries with 1000 insert/s per client
- Legend for results is here.
- Each entry lists the percentage of responses that fit in that bucket (slower than max time for previous bucket, faster than min time for next bucket).
Query response time histogram
256us	1ms	4ms	16ms	64ms	256ms	1s	4s	16s	gt	max	tag
99.935	0.064	0.001	nonzero	0.000	0.000	0.000	0.000	0.000	0.000	0.007	my8407_rel_o2nofp.cz12a_c32r128
99.929	0.069	0.002	nonzero	nonzero	nonzero	0.000	0.000	0.000	0.000	0.166	my8407_rel_o2nofp.cz12a_nocb_c32r128
99.992	0.007	nonzero	nonzero	nonzero	nonzero	0.000	0.000	0.000	0.000	0.177	pg181_o2nofp.cx10b_c32r128
Insert response time histogram
256us	1ms	4ms	16ms	64ms	256ms	1s	4s	16s	gt	max	tag
0.000	0.000	99.507	0.481	0.011	nonzero	0.000	0.000	0.000	0.000	0.066	my8407_rel_o2nofp.cz12a_c32r128
0.000	0.000	99.344	0.549	0.061	0.047	0.000	0.000	0.000	0.000	0.199	my8407_rel_o2nofp.cz12a_nocb_c32r128
0.000	0.945	98.506	0.442	0.107	nonzero	0.000	0.000	0.000	0.000	0.134	pg181_o2nofp.cx10b_c32r128
Delete response time histogram
256us	1ms	4ms	16ms	64ms	256ms	1s	4s	16s	gt	max	tag
0.000	nonzero	99.751	0.240	0.009	0.000	0.000	0.000	0.000	0.000	0.056	my8407_rel_o2nofp.cz12a_c32r128
0.000	0.010	99.563	0.342	0.048	0.037	0.000	0.000	0.000	0.000	0.194	my8407_rel_o2nofp.cz12a_nocb_c32r128
0.000	38.004	61.616	0.316	0.064	nonzero	0.000	0.000	0.000	0.000	0.133	pg181_o2nofp.cx10b_c32r128
qp1000.L6
- qp1000.L6: point queries with 1000 insert/s per client
- Legend for results is here.
- Each entry lists the percentage of responses that fit in that bucket (slower than max time for previous bucket, faster than min time for next bucket).
Query response time histogram
256us	1ms	4ms	16ms	64ms	256ms	1s	4s	16s	gt	max	tag
99.662	0.336	0.002	nonzero	0.000	0.000	0.000	0.000	0.000	0.000	0.009	my8407_rel_o2nofp.cz12a_c32r128
99.676	0.322	0.002	nonzero	0.000	0.000	0.000	0.000	0.000	0.000	0.005	my8407_rel_o2nofp.cz12a_nocb_c32r128
99.954	0.045	nonzero	nonzero	nonzero	nonzero	0.000	0.000	0.000	0.000	0.119	pg181_o2nofp.cx10b_c32r128
Insert response time histogram
256us	1ms	4ms	16ms	64ms	256ms	1s	4s	16s	gt	max	tag
0.000	0.000	99.611	0.376	0.013	nonzero	0.000	0.000	0.000	0.000	0.072	my8407_rel_o2nofp.cz12a_c32r128
0.000	0.000	99.340	0.651	0.009	nonzero	0.000	0.000	0.000	0.000	0.065	my8407_rel_o2nofp.cz12a_nocb_c32r128
0.000	0.578	98.895	0.415	0.112	0.000	0.000	0.000	0.000	0.000	0.040	pg181_o2nofp.cx10b_c32r128
Delete response time histogram
256us	1ms	4ms	16ms	64ms	256ms	1s	4s	16s	gt	max	tag
0.000	nonzero	99.814	0.175	0.010	0.000	0.000	0.000	0.000	0.000	0.058	my8407_rel_o2nofp.cz12a_c32r128
0.000	0.001	99.631	0.360	0.007	nonzero	0.000	0.000	0.000	0.000	0.064	my8407_rel_o2nofp.cz12a_nocb_c32r128
0.000	39.789	59.755	0.385	0.071	0.000	0.000	0.000	0.000	0.000	0.039	pg181_o2nofp.cx10b_c32r128