Introduction
This is a report for the insert benchmark with 120M docs and 12 client(s). It is generated by scripts (bash, awk, sed) and Tufte might not be impressed. An overview of the insert benchmark is here and a short update is here. Below, by DBMS, I mean DBMS+version.config. An example is my8020.c10b40 where my means MySQL, 8020 is version 8.0.20 and c10b40 is the name for the configuration file.
The test server has 32 cores, 128G RAM and 1 NVMe devices. The benchmark was run with 8 clients and there were 1 or 3 connections per client (1 for queries or inserts without rate limits, 1+1 for rate limited inserts+deletes). It uses 8 tables with a table per client. It loads 10M rows per table without secondary indexes, creates 3 secondary indexes per table, then inserts 16m+4m rows per table with a delete per insert to avoid growing the table. It then does 6 read+write tests for 1800s each that do queries as fast as possible with 100,100,500,500,1000,1000 inserts/s and the same for deletes/s per client concurrent with the queries. The database is cached. Clients and the DBMS share one server.
The tested DBMS are:
- my5651_rel_o2nofp.cz12a_c32r128 - MySQL 5.6.51 with the cz12a_c32r128 config
- my5744_rel_o2nofp.cz12a_c32r128 - MySQL 5.7.44 with the cz12a_c32r128 config
- my8044_rel_o2nofp.cz12a_c32r128 - MySQL 8.0.44 with the cz12a_c32r128 config
- my8407_rel_o2nofp.cz12a_c32r128 - MySQL 8.4.7 with the cz12a_c32r128 config
- my9400_rel_o2nofp.cz12a_c32r128 - MySQL 9.4.0 with the cz12a_c32r128 config
- my9500_rel_o2nofp.cz12a_c32r128 - MySQL 9.5.0 with the cz12a_c32r128 config
- my9500_rel_o2nofp.cz13a_c32r128 - MySQL 9.5.0 with the cz13a_c32r128 config
Contents
- Summary
- l.i0: load without secondary indexes
- l.x: create secondary indexes
- l.i1: continue load after secondary indexes created with 50 inserts per transaction
- l.i2: continue load after secondary indexes created with 5 inserts per transaction
- qr100.L1: range queries with 100 insert/s per client
- qp100.L2: point queries with 100 insert/s per client
- qr500.L3: range queries with 500 insert/s per client
- qp500.L4: point queries with 500 insert/s per client
- qr1000.L5: range queries with 1000 insert/s per client
- qp1000.L6: point queries with 1000 insert/s per client
Summary
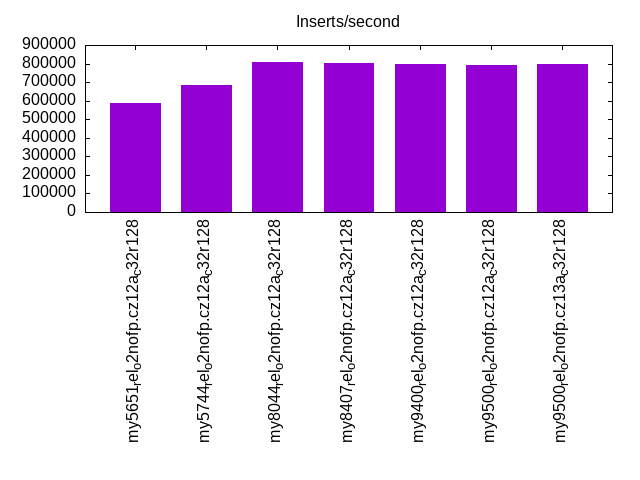
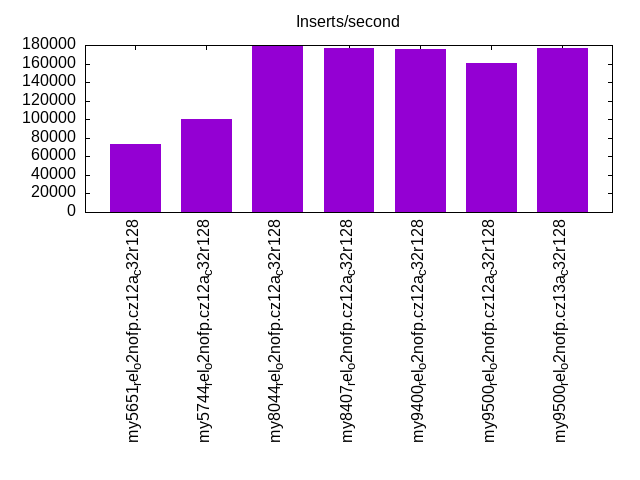
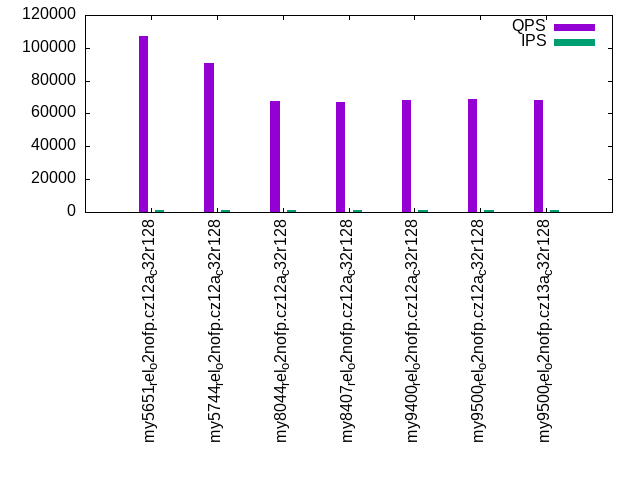
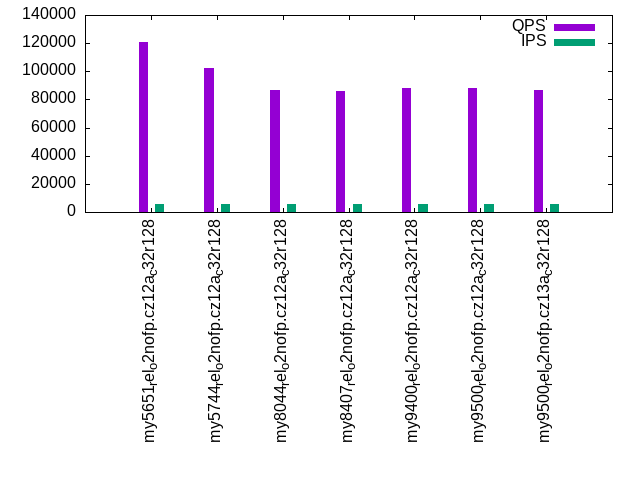
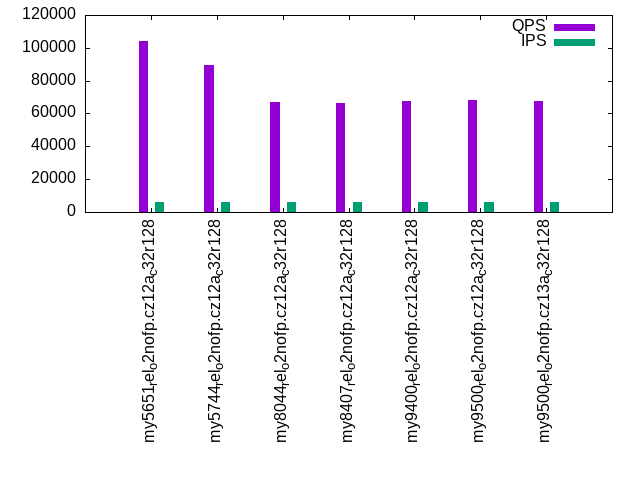
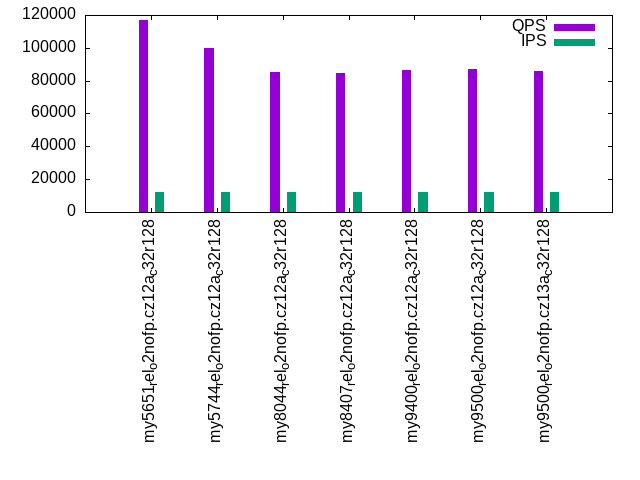
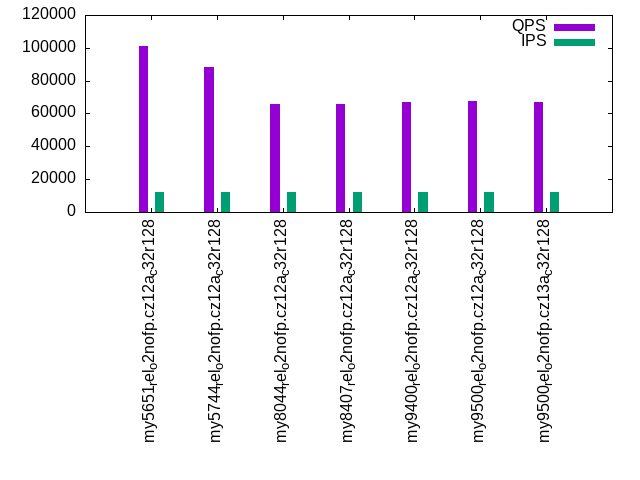
The numbers are inserts/s for l.i0, l.i1 and l.i2, indexed docs (or rows) /s for l.x and queries/s for qr100, qp100 thru qr1000, qp1000" The values are the average rate over the entire test for inserts (IPS) and queries (QPS). The range of values for IPS and QPS is split into 3 parts: bottom 25%, middle 50%, top 25%. Values in the bottom 25% have a red background, values in the top 25% have a green background and values in the middle have no color. A gray background is used for values that can be ignored because the DBMS did not sustain the target insert rate. Red backgrounds are not used when the minimum value is within 80% of the max value.
| dbms | l.i0 | l.x | l.i1 | l.i2 | qr100 | qp100 | qr500 | qp500 | qr1000 | qp1000 |
|---|---|---|---|---|---|---|---|---|---|---|
| my5651_rel_o2nofp.cz12a_c32r128 | 588235 | 434783 | 73310 | 40336 | 124089 | 106971 | 121066 | 104368 | 116670 | 101387 |
| my5744_rel_o2nofp.cz12a_c32r128 | 681818 | 1764707 | 100734 | 65217 | 103047 | 90742 | 102065 | 89651 | 100142 | 88393 |
| my8044_rel_o2nofp.cz12a_c32r128 | 810811 | 2033900 | 178439 | 77295 | 87431 | 67597 | 86728 | 66919 | 85365 | 66041 |
| my8407_rel_o2nofp.cz12a_c32r128 | 805369 | 2105265 | 177122 | 77046 | 86349 | 66900 | 85754 | 66270 | 84533 | 65565 |
| my9400_rel_o2nofp.cz12a_c32r128 | 800000 | 2068967 | 176147 | 76190 | 88604 | 68507 | 87881 | 67858 | 86671 | 66970 |
| my9500_rel_o2nofp.cz12a_c32r128 | 794702 | 2105265 | 160535 | 80537 | 88822 | 68808 | 88253 | 68080 | 86993 | 67396 |
| my9500_rel_o2nofp.cz13a_c32r128 | 800000 | 2105265 | 176633 | 76433 | 87362 | 68255 | 86846 | 67708 | 85600 | 66827 |
This table has relative throughput, throughput for the DBMS relative to the DBMS in the first line, using the absolute throughput from the previous table. Values less than 0.95 have a yellow background. Values greater than 1.05 have a blue background.
| dbms | l.i0 | l.x | l.i1 | l.i2 | qr100 | qp100 | qr500 | qp500 | qr1000 | qp1000 |
|---|---|---|---|---|---|---|---|---|---|---|
| my5651_rel_o2nofp.cz12a_c32r128 | 1.00 | 1.00 | 1.00 | 1.00 | 1.00 | 1.00 | 1.00 | 1.00 | 1.00 | 1.00 |
| my5744_rel_o2nofp.cz12a_c32r128 | 1.16 | 4.06 | 1.37 | 1.62 | 0.83 | 0.85 | 0.84 | 0.86 | 0.86 | 0.87 |
| my8044_rel_o2nofp.cz12a_c32r128 | 1.38 | 4.68 | 2.43 | 1.92 | 0.70 | 0.63 | 0.72 | 0.64 | 0.73 | 0.65 |
| my8407_rel_o2nofp.cz12a_c32r128 | 1.37 | 4.84 | 2.42 | 1.91 | 0.70 | 0.63 | 0.71 | 0.63 | 0.72 | 0.65 |
| my9400_rel_o2nofp.cz12a_c32r128 | 1.36 | 4.76 | 2.40 | 1.89 | 0.71 | 0.64 | 0.73 | 0.65 | 0.74 | 0.66 |
| my9500_rel_o2nofp.cz12a_c32r128 | 1.35 | 4.84 | 2.19 | 2.00 | 0.72 | 0.64 | 0.73 | 0.65 | 0.75 | 0.66 |
| my9500_rel_o2nofp.cz13a_c32r128 | 1.36 | 4.84 | 2.41 | 1.89 | 0.70 | 0.64 | 0.72 | 0.65 | 0.73 | 0.66 |
This lists the average rate of inserts/s for the tests that do inserts concurrent with queries. For such tests the query rate is listed in the table above. The read+write tests are setup so that the insert rate should match the target rate every second. Cells that are not at least 95% of the target have a red background to indicate a failure to satisfy the target.
| dbms | qr100.L1 | qp100.L2 | qr500.L3 | qp500.L4 | qr1000.L5 | qp1000.L6 |
|---|---|---|---|---|---|---|
| my5651_rel_o2nofp.cz12a_c32r128 | 1193 | 1193 | 5960 | 5960 | 11927 | 11920 |
| my5744_rel_o2nofp.cz12a_c32r128 | 1192 | 1193 | 5964 | 5964 | 11927 | 11927 |
| my8044_rel_o2nofp.cz12a_c32r128 | 1193 | 1193 | 5960 | 5964 | 11927 | 11920 |
| my8407_rel_o2nofp.cz12a_c32r128 | 1193 | 1192 | 5960 | 5964 | 11927 | 11927 |
| my9400_rel_o2nofp.cz12a_c32r128 | 1192 | 1192 | 5964 | 5964 | 11920 | 11920 |
| my9500_rel_o2nofp.cz12a_c32r128 | 1193 | 1193 | 5964 | 5960 | 11920 | 11927 |
| my9500_rel_o2nofp.cz13a_c32r128 | 1192 | 1193 | 5964 | 5964 | 11920 | 11920 |
| target | 1200 | 1200 | 6000 | 6000 | 12000 | 12000 |
l.i0
l.i0: load without secondary indexes. Graphs for performance per 1-second interval are here.
Average throughput:
Insert response time histogram: each cell has the percentage of responses that take <= the time in the header and max is the max response time in seconds. For the max column values in the top 25% of the range have a red background and in the bottom 25% of the range have a green background. The red background is not used when the min value is within 80% of the max value.
| dbms | 256us | 1ms | 4ms | 16ms | 64ms | 256ms | 1s | 4s | 16s | gt | max |
|---|---|---|---|---|---|---|---|---|---|---|---|
| my5651_rel_o2nofp.cz12a_c32r128 | 5.149 | 94.604 | 0.063 | 0.164 | 0.020 | 0.183 | |||||
| my5744_rel_o2nofp.cz12a_c32r128 | 4.318 | 95.507 | 0.148 | 0.006 | 0.021 | 0.148 | |||||
| my8044_rel_o2nofp.cz12a_c32r128 | 0.330 | 99.576 | 0.070 | 0.003 | 0.021 | 0.162 | |||||
| my8407_rel_o2nofp.cz12a_c32r128 | 0.139 | 99.765 | 0.070 | 0.004 | 0.021 | 0.165 | |||||
| my9400_rel_o2nofp.cz12a_c32r128 | 0.432 | 99.473 | 0.070 | 0.004 | 0.021 | 0.162 | |||||
| my9500_rel_o2nofp.cz12a_c32r128 | 0.114 | 99.760 | 0.099 | 0.005 | 0.022 | 0.165 | |||||
| my9500_rel_o2nofp.cz13a_c32r128 | 0.180 | 99.715 | 0.075 | 0.007 | 0.022 | 0.168 |
Performance metrics for the DBMS listed above. Some are normalized by throughput, others are not. Legend for results is here.
ips	qps	rps	rmbps	wps	wmbps	rpq	rkbpq	wpi	wkbpi	csps	cpups	cspq	cpupq	dbgb1	dbgb2	rss	maxop	p50	p99	tag
588235	0	0	0.0	1479.3	144.1	0.000	0.000	0.003	0.251	70945	40.5	0.121	22	8.0	108.5	15.0	0.183	50994	42695	my5651_rel_o2nofp.cz12a_c32r128
681818	0	0	0.0	2172.5	181.4	0.000	0.000	0.003	0.272	83139	41.9	0.122	20	8.0	108.5	16.3	0.148	62392	53093	my5744_rel_o2nofp.cz12a_c32r128
810811	0	1	0.0	2689.5	229.2	0.000	0.000	0.003	0.289	139911	47.0	0.173	19	8.0	108.6	16.5	0.162	78990	69192	my8044_rel_o2nofp.cz12a_c32r128
805369	0	1	0.0	2672.4	224.1	0.000	0.000	0.003	0.285	136973	46.1	0.170	18	8.0	114.2	16.5	0.165	78091	67591	my8407_rel_o2nofp.cz12a_c32r128
800000	0	0	0.0	2660.2	223.8	0.000	0.000	0.003	0.286	136631	45.7	0.171	18	8.0	114.2	16.5	0.162	78289	67192	my9400_rel_o2nofp.cz12a_c32r128
794702	0	1	0.0	2673.0	225.8	0.000	0.000	0.003	0.291	145325	46.8	0.183	19	8.0	114.2	16.6	0.165	77391	67191	my9500_rel_o2nofp.cz12a_c32r128
800000	0	1	0.0	2672.2	224.2	0.000	0.000	0.003	0.287	136076	45.9	0.170	18	8.0	114.2	16.7	0.168	78491	66892	my9500_rel_o2nofp.cz13a_c32r128
Average values from iostat.
r/s	rkB/s	rrqm/s	%rrqm	r_await	rareq-s	w/s	wkB/s	wrqm/s	%wrqm	w_await	wareq-s	d/s	dkB/s	drqm/s	%drqm	d_await	dareq-s	f/s	f_await	aqu-sz	%util
0.717	3.366	0.000	0.000	0.547	4.841	2689.5	234673	132.2	6.452	0.643	92.25	1.097	18.54	0.000	0.000	0.984	16.76	23.72	0.484	1.723	9.978		my8044_rel_o2nofp.cz12a_c32r128
0.680	3.120	0.000	0.000	0.575	4.560	2672.4	229528	131.7	6.475	0.674	90.24	1.233	36.35	0.000	0.000	1.028	24.49	23.40	0.485	1.839	9.752		my8407_rel_o2nofp.cz12a_c32r128
0.720	3.680	0.000	0.000	0.552	5.267	2673.0	231227	129.9	6.371	0.605	90.98	0.793	24.69	0.000	0.000	0.983	23.40	23.61	0.485	1.592	9.837		my9500_rel_o2nofp.cz12a_c32r128
0.720	3.360	0.000	0.000	0.759	4.433	2672.2	229541	130.9	6.536	0.670	90.39	1.493	9631.9	0.000	0.000	1.076	4897.2	23.30	0.483	1.853	9.829		my9500_rel_o2nofp.cz13a_c32r128
l.x
l.x: create secondary indexes.
Average throughput:

Performance metrics for the DBMS listed above. Some are normalized by throughput, others are not. Legend for results is here.
ips	qps	rps	rmbps	wps	wmbps	rpq	rkbpq	wpi	wkbpi	csps	cpups	cspq	cpupq	dbgb1	dbgb2	rss	maxop	p50	p99	tag
434783	0	0	0.0	10249.1	503.1	0.000	0.000	0.024	1.185	24790	31.2	0.057	23	16.7	117.2	23.9	0.001	NA	NA	my5651_rel_o2nofp.cz12a_c32r128
1764707	0	0	0.0	29014.1	1529.7	0.000	0.000	0.016	0.888	167293	34.0	0.095	6	18.2	118.8	24.3	0.018	NA	NA	my5744_rel_o2nofp.cz12a_c32r128
2033900	0	54	1.6	63224.8	2465.6	0.000	0.001	0.031	1.241	89008	74.1	0.044	12	18.2	118.8	16.8	0.007	NA	NA	my8044_rel_o2nofp.cz12a_c32r128
2105265	0	50	1.3	66028.0	2509.9	0.000	0.001	0.031	1.221	95406	73.8	0.045	11	18.2	124.4	16.9	0.004	NA	NA	my8407_rel_o2nofp.cz12a_c32r128
2068967	0	48	1.4	64874.8	2491.9	0.000	0.001	0.031	1.233	95514	72.4	0.046	11	18.2	124.4	16.8	0.004	NA	NA	my9400_rel_o2nofp.cz12a_c32r128
2105265	0	47	1.2	66840.0	2522.4	0.000	0.001	0.032	1.227	98125	72.6	0.047	11	18.2	124.4	17.1	0.011	NA	NA	my9500_rel_o2nofp.cz12a_c32r128
2105265	0	50	1.4	65118.9	2496.7	0.000	0.001	0.031	1.214	93632	71.5	0.044	11	18.2	124.4	17.1	0.005	NA	NA	my9500_rel_o2nofp.cz13a_c32r128
Average values from iostat.
r/s	rkB/s	rrqm/s	%rrqm	r_await	rareq-s	w/s	wkB/s	wrqm/s	%wrqm	w_await	wareq-s	d/s	dkB/s	drqm/s	%drqm	d_await	dareq-s	f/s	f_await	aqu-sz	%util
53.72	1662.2	0.000	0.000	0.439	30.91	63224.8	2524744	701.0	1.555	0.483	45.03	119.3	350217	0.018	0.029	1.860	2551.0	46.42	0.710	25.45	84.43		my8044_rel_o2nofp.cz12a_c32r128
49.49	1297.2	0.000	0.000	0.356	26.18	66028.0	2570177	710.2	1.529	0.460	43.80	108.0	354673	0.000	0.000	1.854	2798.4	46.50	0.660	26.04	84.61		my8407_rel_o2nofp.cz12a_c32r128
46.84	1195.4	0.000	0.000	0.308	27.07	66840.0	2582925	735.7	1.550	0.480	43.29	114.9	354756	0.018	0.014	1.850	2708.9	46.73	0.836	27.79	84.73		my9500_rel_o2nofp.cz12a_c32r128
50.41	1467.8	0.000	0.000	0.329	28.48	65118.9	2556648	722.7	1.502	0.456	43.36	125.4	354224	0.000	0.000	1.740	2561.9	46.64	0.763	25.94	85.03		my9500_rel_o2nofp.cz13a_c32r128
l.i1
l.i1: continue load after secondary indexes created with 50 inserts per transaction. Graphs for performance per 1-second interval are here.
Average throughput:
Insert response time histogram: each cell has the percentage of responses that take <= the time in the header and max is the max response time in seconds. For the max column values in the top 25% of the range have a red background and in the bottom 25% of the range have a green background. The red background is not used when the min value is within 80% of the max value.
| dbms | 256us | 1ms | 4ms | 16ms | 64ms | 256ms | 1s | 4s | 16s | gt | max |
|---|---|---|---|---|---|---|---|---|---|---|---|
| my5651_rel_o2nofp.cz12a_c32r128 | nonzero | 0.547 | 97.278 | 1.780 | 0.339 | 0.053 | 0.002 | nonzero | 7.892 | ||
| my5744_rel_o2nofp.cz12a_c32r128 | 0.012 | 12.447 | 86.949 | 0.206 | 0.132 | 0.247 | 0.007 | nonzero | 5.749 | ||
| my8044_rel_o2nofp.cz12a_c32r128 | 87.969 | 11.741 | 0.209 | 0.069 | 0.010 | 0.001 | 2.050 | ||||
| my8407_rel_o2nofp.cz12a_c32r128 | 88.031 | 11.647 | 0.227 | 0.082 | 0.012 | 0.001 | 2.097 | ||||
| my9400_rel_o2nofp.cz12a_c32r128 | 88.017 | 11.669 | 0.220 | 0.081 | 0.013 | nonzero | 1.410 | ||||
| my9500_rel_o2nofp.cz12a_c32r128 | 83.209 | 16.449 | 0.241 | 0.084 | 0.016 | 0.001 | 1.373 | ||||
| my9500_rel_o2nofp.cz13a_c32r128 | 88.145 | 11.529 | 0.228 | 0.082 | 0.015 | 0.001 | 1.653 |
Delete response time histogram: each cell has the percentage of responses that take <= the time in the header and max is the max response time in seconds. For the max column values in the top 25% of the range have a red background and in the bottom 25% of the range have a green background. The red background is not used when the min value is within 80% of the max value.
| dbms | 256us | 1ms | 4ms | 16ms | 64ms | 256ms | 1s | 4s | 16s | gt | max |
|---|---|---|---|---|---|---|---|---|---|---|---|
| my5651_rel_o2nofp.cz12a_c32r128 | 0.002 | 1.249 | 96.748 | 1.640 | 0.311 | 0.049 | 0.002 | nonzero | 4.268 | ||
| my5744_rel_o2nofp.cz12a_c32r128 | 0.082 | 17.660 | 81.710 | 0.182 | 0.144 | 0.218 | 0.004 | nonzero | 5.766 | ||
| my8044_rel_o2nofp.cz12a_c32r128 | 0.005 | 88.257 | 11.455 | 0.196 | 0.075 | 0.009 | 0.001 | 2.050 | |||
| my8407_rel_o2nofp.cz12a_c32r128 | 0.007 | 88.343 | 11.335 | 0.214 | 0.088 | 0.013 | 0.001 | 2.038 | |||
| my9400_rel_o2nofp.cz12a_c32r128 | 0.011 | 88.371 | 11.326 | 0.199 | 0.080 | 0.013 | nonzero | 1.305 | |||
| my9500_rel_o2nofp.cz12a_c32r128 | 0.019 | 83.677 | 16.076 | 0.152 | 0.064 | 0.013 | 0.001 | 1.322 | |||
| my9500_rel_o2nofp.cz13a_c32r128 | 0.015 | 88.461 | 11.198 | 0.222 | 0.087 | 0.016 | 0.001 | 1.471 |
Performance metrics for the DBMS listed above. Some are normalized by throughput, others are not. Legend for results is here.
ips	qps	rps	rmbps	wps	wmbps	rpq	rkbpq	wpi	wkbpi	csps	cpups	cspq	cpupq	dbgb1	dbgb2	rss	maxop	p50	p99	tag
73310	0	1232	4.8	3521.7	150.4	0.017	0.067	0.048	2.101	110840	73.5	1.512	321	30.2	132.2	37.8	7.892	6549	200	my5651_rel_o2nofp.cz12a_c32r128
100734	0	0	0.0	4495.2	186.7	0.000	0.000	0.045	1.898	47808	76.4	0.475	243	30.7	132.7	39.3	5.749	9995	0	my5744_rel_o2nofp.cz12a_c32r128
178439	0	538	8.4	7422.6	325.0	0.003	0.048	0.042	1.865	208681	68.5	1.169	123	31.0	134.4	43.1	2.050	18248	2800	my8044_rel_o2nofp.cz12a_c32r128
177122	0	536	8.4	7462.9	327.1	0.003	0.048	0.042	1.891	208813	67.5	1.179	122	31.0	158.6	44.1	2.097	18148	2650	my8407_rel_o2nofp.cz12a_c32r128
176147	0	531	8.3	7378.9	322.2	0.003	0.048	0.042	1.873	207188	67.4	1.176	122	31.0	158.9	43.1	1.410	17893	3100	my9400_rel_o2nofp.cz12a_c32r128
160535	0	484	7.6	7264.3	316.9	0.003	0.048	0.045	2.022	226896	63.3	1.413	126	29.3	155.6	38.2	1.373	15288	2200	my9500_rel_o2nofp.cz12a_c32r128
176633	0	534	8.3	7427.1	324.9	0.003	0.048	0.042	1.883	206553	67.1	1.169	122	31.0	158.0	44.4	1.653	17948	2000	my9500_rel_o2nofp.cz13a_c32r128
Average values from iostat.
r/s	rkB/s	rrqm/s	%rrqm	r_await	rareq-s	w/s	wkB/s	wrqm/s	%wrqm	w_await	wareq-s	d/s	dkB/s	drqm/s	%drqm	d_await	dareq-s	f/s	f_await	aqu-sz	%util
538.5	8613.7	0.000	0.000	0.701	9.924	7422.6	332750	81.41	1.056	4.940	45.55	0.581	4876.4	0.000	0.000	1.657	337.2	20.40	1.849	30.89	22.63		my8044_rel_o2nofp.cz12a_c32r128
536.0	8573.8	0.000	0.000	1.361	10.18	7462.9	334977	89.88	1.162	4.974	45.59	0.649	6741.9	0.000	0.000	1.360	442.6	20.37	1.765	33.54	23.70		my8407_rel_o2nofp.cz12a_c32r128
484.4	7748.4	0.000	0.000	1.598	9.930	7264.3	324533	69.24	0.922	5.345	45.35	0.370	24.66	0.000	0.000	1.517	20.42	18.70	2.000	36.34	22.90		my9500_rel_o2nofp.cz12a_c32r128
533.6	8534.4	0.000	0.000	2.549	10.29	7427.1	332667	76.02	0.998	5.161	45.48	0.669	6742.2	0.000	0.000	1.336	555.2	19.72	1.887	35.22	24.22		my9500_rel_o2nofp.cz13a_c32r128
l.i2
l.i2: continue load after secondary indexes created with 5 inserts per transaction. Graphs for performance per 1-second interval are here.
Average throughput:

Insert response time histogram: each cell has the percentage of responses that take <= the time in the header and max is the max response time in seconds. For the max column values in the top 25% of the range have a red background and in the bottom 25% of the range have a green background. The red background is not used when the min value is within 80% of the max value.
| dbms | 256us | 1ms | 4ms | 16ms | 64ms | 256ms | 1s | 4s | 16s | gt | max |
|---|---|---|---|---|---|---|---|---|---|---|---|
| my5651_rel_o2nofp.cz12a_c32r128 | 0.059 | 30.596 | 68.493 | 0.287 | 0.556 | 0.008 | 0.239 | ||||
| my5744_rel_o2nofp.cz12a_c32r128 | 0.135 | 86.626 | 12.783 | 0.033 | 0.417 | 0.006 | 0.001 | nonzero | 1.226 | ||
| my8044_rel_o2nofp.cz12a_c32r128 | 0.049 | 90.888 | 8.322 | 0.721 | 0.012 | 0.008 | 0.001 | 0.472 | |||
| my8407_rel_o2nofp.cz12a_c32r128 | 0.011 | 90.832 | 8.466 | 0.671 | 0.011 | 0.007 | 0.001 | 0.530 | |||
| my9400_rel_o2nofp.cz12a_c32r128 | 0.062 | 90.685 | 8.483 | 0.747 | 0.012 | 0.008 | 0.001 | 0.863 | |||
| my9500_rel_o2nofp.cz12a_c32r128 | 0.022 | 92.944 | 6.483 | 0.527 | 0.014 | 0.009 | 0.002 | 0.925 | |||
| my9500_rel_o2nofp.cz13a_c32r128 | 0.043 | 90.768 | 8.455 | 0.711 | 0.013 | 0.008 | 0.002 | 0.917 |
Delete response time histogram: each cell has the percentage of responses that take <= the time in the header and max is the max response time in seconds. For the max column values in the top 25% of the range have a red background and in the bottom 25% of the range have a green background. The red background is not used when the min value is within 80% of the max value.
| dbms | 256us | 1ms | 4ms | 16ms | 64ms | 256ms | 1s | 4s | 16s | gt | max |
|---|---|---|---|---|---|---|---|---|---|---|---|
| my5651_rel_o2nofp.cz12a_c32r128 | 0.066 | 31.657 | 67.428 | 0.286 | 0.556 | 0.008 | 0.239 | ||||
| my5744_rel_o2nofp.cz12a_c32r128 | 0.122 | 83.900 | 15.521 | 0.034 | 0.417 | 0.006 | 0.001 | nonzero | 1.226 | ||
| my8044_rel_o2nofp.cz12a_c32r128 | 0.063 | 91.539 | 7.694 | 0.684 | 0.011 | 0.008 | 0.001 | 0.485 | |||
| my8407_rel_o2nofp.cz12a_c32r128 | 0.016 | 91.464 | 7.870 | 0.632 | 0.010 | 0.007 | 0.002 | 0.541 | |||
| my9400_rel_o2nofp.cz12a_c32r128 | 0.090 | 91.283 | 7.899 | 0.709 | 0.010 | 0.008 | 0.001 | 0.876 | |||
| my9500_rel_o2nofp.cz12a_c32r128 | 0.051 | 93.246 | 6.189 | 0.492 | 0.012 | 0.009 | 0.002 | 0.927 | |||
| my9500_rel_o2nofp.cz13a_c32r128 | 0.046 | 91.412 | 7.849 | 0.673 | 0.011 | 0.008 | 0.002 | 0.919 |
Performance metrics for the DBMS listed above. Some are normalized by throughput, others are not. Legend for results is here.
ips	qps	rps	rmbps	wps	wmbps	rpq	rkbpq	wpi	wkbpi	csps	cpups	cspq	cpupq	dbgb1	dbgb2	rss	maxop	p50	p99	tag
40336	0	5558	21.7	3232.3	131.6	0.138	0.551	0.080	3.340	276703	67.6	6.860	536	30.2	132.2	38.0	0.239	3685	165	my5651_rel_o2nofp.cz12a_c32r128
65217	0	0	0.0	5030.0	209.1	0.000	0.000	0.077	3.284	282521	67.5	4.332	331	30.7	132.7	39.8	1.226	6284	180	my5744_rel_o2nofp.cz12a_c32r128
77295	0	0	0.0	5889.1	251.6	0.000	0.000	0.076	3.333	415098	66.8	5.370	277	31.0	132.0	43.1	0.472	7519	1130	my8044_rel_o2nofp.cz12a_c32r128
77046	0	0	0.0	5934.3	252.5	0.000	0.000	0.077	3.356	416881	66.8	5.411	277	31.0	166.3	44.1	0.530	7499	1120	my8407_rel_o2nofp.cz12a_c32r128
76190	0	0	0.0	5845.0	249.0	0.000	0.000	0.077	3.347	410083	65.4	5.382	275	31.0	165.6	43.2	0.863	7493	1095	my9400_rel_o2nofp.cz12a_c32r128
80537	0	0	0.0	6022.8	261.5	0.000	0.000	0.075	3.325	443544	67.8	5.507	269	29.3	164.8	38.5	0.925	7539	1090	my9500_rel_o2nofp.cz12a_c32r128
76433	0	0	0.0	5883.2	250.6	0.000	0.000	0.077	3.357	416022	66.4	5.443	278	31.0	165.8	44.4	0.917	7444	1120	my9500_rel_o2nofp.cz13a_c32r128
Average values from iostat.
r/s	rkB/s	rrqm/s	%rrqm	r_await	rareq-s	w/s	wkB/s	wrqm/s	%wrqm	w_await	wareq-s	d/s	dkB/s	drqm/s	%drqm	d_await	dareq-s	f/s	f_await	aqu-sz	%util
0.061	0.245	0.000	0.000	0.294	0.968	5889.1	257614	4.824	0.082	4.380	43.79	0.568	5136.7	0.000	0.000	0.753	436.0	13.18	1.758	25.79	14.66		my8044_rel_o2nofp.cz12a_c32r128
0.084	0.335	0.000	0.000	0.880	1.226	5934.3	258554	4.721	0.078	4.921	43.58	0.381	3344.7	0.000	0.000	1.141	316.6	12.87	1.972	29.07	15.80		my8407_rel_o2nofp.cz12a_c32r128
0.116	0.464	0.000	0.000	1.789	1.244	6022.8	267786	4.034	0.066	5.870	44.48	0.318	23.66	0.000	0.000	1.151	22.78	13.01	2.248	35.13	17.55		my9500_rel_o2nofp.cz12a_c32r128
0.074	0.294	0.000	0.000	0.627	1.024	5883.2	256608	4.482	0.076	5.137	43.68	0.306	3321.7	0.000	0.000	0.882	397.4	13.08	2.028	30.00	16.52		my9500_rel_o2nofp.cz13a_c32r128
qr100.L1
qr100.L1: range queries with 100 insert/s per client. Graphs for performance per 1-second interval are here.
Average throughput:

Query response time histogram: each cell has the percentage of responses that take <= the time in the header and max is the max response time in seconds. For max values in the top 25% of the range have a red background and in the bottom 25% of the range have a green background. The red background is not used when the min value is within 80% of the max value.
| dbms | 256us | 1ms | 4ms | 16ms | 64ms | 256ms | 1s | 4s | 16s | gt | max |
|---|---|---|---|---|---|---|---|---|---|---|---|
| my5651_rel_o2nofp.cz12a_c32r128 | 99.980 | 0.009 | 0.011 | nonzero | 0.007 | ||||||
| my5744_rel_o2nofp.cz12a_c32r128 | 99.995 | 0.005 | nonzero | nonzero | nonzero | 0.024 | |||||
| my8044_rel_o2nofp.cz12a_c32r128 | 99.988 | 0.012 | nonzero | 0.002 | |||||||
| my8407_rel_o2nofp.cz12a_c32r128 | 99.988 | 0.012 | nonzero | nonzero | nonzero | nonzero | 0.111 | ||||
| my9400_rel_o2nofp.cz12a_c32r128 | 99.989 | 0.011 | nonzero | nonzero | nonzero | nonzero | 0.215 | ||||
| my9500_rel_o2nofp.cz12a_c32r128 | 99.987 | 0.013 | nonzero | nonzero | 0.005 | ||||||
| my9500_rel_o2nofp.cz13a_c32r128 | 99.988 | 0.012 | nonzero | 0.003 |
Insert response time histogram: each cell has the percentage of responses that take <= the time in the header and max is the max response time in seconds. For max values in the top 25% of the range have a red background and in the bottom 25% of the range have a green background. The red background is not used when the min value is within 80% of the max value.
| dbms | 256us | 1ms | 4ms | 16ms | 64ms | 256ms | 1s | 4s | 16s | gt | max |
|---|---|---|---|---|---|---|---|---|---|---|---|
| my5651_rel_o2nofp.cz12a_c32r128 | 96.007 | 3.993 | 0.012 | ||||||||
| my5744_rel_o2nofp.cz12a_c32r128 | 99.609 | 0.387 | 0.005 | 0.020 | |||||||
| my8044_rel_o2nofp.cz12a_c32r128 | 99.231 | 0.766 | 0.002 | 0.020 | |||||||
| my8407_rel_o2nofp.cz12a_c32r128 | 99.181 | 0.743 | 0.037 | 0.039 | 0.152 | ||||||
| my9400_rel_o2nofp.cz12a_c32r128 | 99.190 | 0.229 | 0.338 | 0.231 | 0.012 | 0.349 | |||||
| my9500_rel_o2nofp.cz12a_c32r128 | 99.435 | 0.562 | 0.002 | 0.017 | |||||||
| my9500_rel_o2nofp.cz13a_c32r128 | 99.081 | 0.917 | 0.002 | 0.017 |
Delete response time histogram: each cell has the percentage of responses that take <= the time in the header and max is the max response time in seconds. For max values in the top 25% of the range have a red background and in the bottom 25% of the range have a green background. The red background is not used when the min value is within 80% of the max value.
| dbms | 256us | 1ms | 4ms | 16ms | 64ms | 256ms | 1s | 4s | 16s | gt | max |
|---|---|---|---|---|---|---|---|---|---|---|---|
| my5651_rel_o2nofp.cz12a_c32r128 | 4.477 | 92.755 | 2.769 | 0.013 | |||||||
| my5744_rel_o2nofp.cz12a_c32r128 | 3.405 | 96.287 | 0.306 | 0.002 | 0.038 | ||||||
| my8044_rel_o2nofp.cz12a_c32r128 | 0.005 | 99.252 | 0.741 | 0.002 | 0.018 | ||||||
| my8407_rel_o2nofp.cz12a_c32r128 | 0.005 | 99.255 | 0.678 | 0.032 | 0.030 | 0.168 | |||||
| my9400_rel_o2nofp.cz12a_c32r128 | 0.002 | 99.257 | 0.218 | 0.278 | 0.241 | 0.005 | 0.344 | ||||
| my9500_rel_o2nofp.cz12a_c32r128 | 99.521 | 0.477 | 0.002 | 0.019 | |||||||
| my9500_rel_o2nofp.cz13a_c32r128 | 0.005 | 99.100 | 0.894 | 0.002 | 0.019 |
Performance metrics for the DBMS listed above. Some are normalized by throughput, others are not. Legend for results is here.
ips	qps	rps	rmbps	wps	wmbps	rpq	rkbpq	wpi	wkbpi	csps	cpups	cspq	cpupq	dbgb1	dbgb2	rss	maxop	p50	p99	tag
1193	124089	37	0.1	3826.9	107.0	0.000	0.001	3.209	91.880	712210	39.1	5.739	101	30.2	132.2	38.0	0.007	10399	10143	my5651_rel_o2nofp.cz12a_c32r128
1192	103047	0	0.0	1437.2	40.6	0.000	0.000	1.206	34.898	591672	39.3	5.742	122	30.7	132.7	39.8	0.024	8671	8559	my5744_rel_o2nofp.cz12a_c32r128
1193	87431	0	0.0	1446.6	41.0	0.000	0.000	1.213	35.236	505409	38.9	5.781	142	31.0	132.0	43.1	0.002	7327	7231	my8044_rel_o2nofp.cz12a_c32r128
1193	86349	0	0.0	1394.3	39.6	0.000	0.000	1.169	33.986	499119	38.8	5.780	144	31.0	166.5	44.1	0.111	7199	7119	my8407_rel_o2nofp.cz12a_c32r128
1192	88604	0	0.0	1415.8	40.2	0.000	0.000	1.188	34.504	512226	38.9	5.781	140	31.0	165.9	43.2	0.215	7439	7327	my9400_rel_o2nofp.cz12a_c32r128
1193	88822	0	0.0	1428.9	40.5	0.000	0.000	1.198	34.813	513198	38.9	5.778	140	29.3	165.0	38.6	0.005	7407	7311	my9500_rel_o2nofp.cz12a_c32r128
1192	87362	0	0.0	1493.5	42.3	0.000	0.000	1.253	36.368	505179	39.0	5.783	143	31.0	166.0	44.4	0.003	7359	7279	my9500_rel_o2nofp.cz13a_c32r128
Average values from iostat.
r/s	rkB/s	rrqm/s	%rrqm	r_await	rareq-s	w/s	wkB/s	wrqm/s	%wrqm	w_await	wareq-s	d/s	dkB/s	drqm/s	%drqm	d_await	dareq-s	f/s	f_await	aqu-sz	%util
0.000	0.000	0.000	0.000	0.000	0.000	1446.6	42026.4	1.122	0.271	0.700	30.55	0.013	0.060	0.000	0.000	0.069	0.265	2.566	0.850	2.057	2.122		my8044_rel_o2nofp.cz12a_c32r128
0.000	0.000	0.000	0.000	0.000	0.000	1394.3	40534.5	1.341	0.377	0.598	30.91	0.011	0.137	0.000	0.000	0.065	0.409	2.318	0.566	1.216	6.236		my8407_rel_o2nofp.cz12a_c32r128
0.001	0.004	0.000	0.000	0.017	0.022	1428.9	41521.6	1.154	0.263	1.175	30.46	0.014	0.716	0.000	0.000	0.133	3.462	2.516	0.933	2.485	2.469		my9500_rel_o2nofp.cz12a_c32r128
0.002	0.007	0.000	0.000	0.000	0.022	1493.5	43350.9	1.143	0.305	1.128	30.79	0.012	0.049	0.000	0.000	0.072	0.221	2.362	0.888	3.211	3.223		my9500_rel_o2nofp.cz13a_c32r128
qp100.L2
qp100.L2: point queries with 100 insert/s per client. Graphs for performance per 1-second interval are here.
Average throughput:
Query response time histogram: each cell has the percentage of responses that take <= the time in the header and max is the max response time in seconds. For max values in the top 25% of the range have a red background and in the bottom 25% of the range have a green background. The red background is not used when the min value is within 80% of the max value.
| dbms | 256us | 1ms | 4ms | 16ms | 64ms | 256ms | 1s | 4s | 16s | gt | max |
|---|---|---|---|---|---|---|---|---|---|---|---|
| my5651_rel_o2nofp.cz12a_c32r128 | 99.957 | 0.029 | 0.014 | 0.004 | |||||||
| my5744_rel_o2nofp.cz12a_c32r128 | 99.985 | 0.015 | nonzero | 0.002 | |||||||
| my8044_rel_o2nofp.cz12a_c32r128 | 99.958 | 0.042 | nonzero | 0.002 | |||||||
| my8407_rel_o2nofp.cz12a_c32r128 | 99.958 | 0.042 | nonzero | nonzero | 0.004 | ||||||
| my9400_rel_o2nofp.cz12a_c32r128 | 99.956 | 0.044 | nonzero | 0.004 | |||||||
| my9500_rel_o2nofp.cz12a_c32r128 | 99.961 | 0.039 | nonzero | 0.003 | |||||||
| my9500_rel_o2nofp.cz13a_c32r128 | 99.960 | 0.039 | nonzero | 0.003 |
Insert response time histogram: each cell has the percentage of responses that take <= the time in the header and max is the max response time in seconds. For max values in the top 25% of the range have a red background and in the bottom 25% of the range have a green background. The red background is not used when the min value is within 80% of the max value.
| dbms | 256us | 1ms | 4ms | 16ms | 64ms | 256ms | 1s | 4s | 16s | gt | max |
|---|---|---|---|---|---|---|---|---|---|---|---|
| my5651_rel_o2nofp.cz12a_c32r128 | 94.215 | 5.785 | 0.007 | ||||||||
| my5744_rel_o2nofp.cz12a_c32r128 | 99.998 | 0.002 | 0.004 | ||||||||
| my8044_rel_o2nofp.cz12a_c32r128 | 98.965 | 1.035 | 0.005 | ||||||||
| my8407_rel_o2nofp.cz12a_c32r128 | 99.123 | 0.877 | 0.016 | ||||||||
| my9400_rel_o2nofp.cz12a_c32r128 | 98.676 | 1.324 | 0.015 | ||||||||
| my9500_rel_o2nofp.cz12a_c32r128 | 98.998 | 0.993 | 0.009 | 0.022 | |||||||
| my9500_rel_o2nofp.cz13a_c32r128 | 99.301 | 0.694 | 0.005 | 0.019 |
Delete response time histogram: each cell has the percentage of responses that take <= the time in the header and max is the max response time in seconds. For max values in the top 25% of the range have a red background and in the bottom 25% of the range have a green background. The red background is not used when the min value is within 80% of the max value.
| dbms | 256us | 1ms | 4ms | 16ms | 64ms | 256ms | 1s | 4s | 16s | gt | max |
|---|---|---|---|---|---|---|---|---|---|---|---|
| my5651_rel_o2nofp.cz12a_c32r128 | 1.282 | 95.282 | 3.435 | 0.006 | |||||||
| my5744_rel_o2nofp.cz12a_c32r128 | 1.259 | 98.738 | 0.002 | 0.004 | |||||||
| my8044_rel_o2nofp.cz12a_c32r128 | 98.977 | 1.023 | 0.005 | ||||||||
| my8407_rel_o2nofp.cz12a_c32r128 | 99.132 | 0.868 | 0.013 | ||||||||
| my9400_rel_o2nofp.cz12a_c32r128 | 98.715 | 1.282 | 0.002 | 0.017 | |||||||
| my9500_rel_o2nofp.cz12a_c32r128 | 99.030 | 0.961 | 0.009 | 0.018 | |||||||
| my9500_rel_o2nofp.cz13a_c32r128 | 99.347 | 0.648 | 0.005 | 0.020 |
Performance metrics for the DBMS listed above. Some are normalized by throughput, others are not. Legend for results is here.
ips	qps	rps	rmbps	wps	wmbps	rpq	rkbpq	wpi	wkbpi	csps	cpups	cspq	cpupq	dbgb1	dbgb2	rss	maxop	p50	p99	tag
1193	106971	38	0.1	16.9	1.4	0.000	0.001	0.014	1.205	619294	38.0	5.789	114	30.2	132.2	38.0	0.004	8927	8783	my5651_rel_o2nofp.cz12a_c32r128
1193	90742	0	0.0	120.2	4.1	0.000	0.000	0.101	3.504	525488	38.9	5.791	137	30.7	132.7	39.8	0.002	7615	7535	my5744_rel_o2nofp.cz12a_c32r128
1193	67597	0	0.0	119.2	4.1	0.000	0.000	0.100	3.541	392995	38.1	5.814	180	31.0	132.0	43.1	0.002	5647	5583	my8044_rel_o2nofp.cz12a_c32r128
1192	66900	0	0.0	127.5	4.4	0.000	0.000	0.107	3.773	389156	38.0	5.817	182	31.0	166.7	44.1	0.004	5599	5551	my8407_rel_o2nofp.cz12a_c32r128
1192	68507	0	0.0	136.2	4.7	0.000	0.000	0.114	4.004	398400	38.2	5.815	178	31.0	166.1	43.2	0.004	5743	5695	my9400_rel_o2nofp.cz12a_c32r128
1193	68808	0	0.0	105.4	3.8	0.000	0.000	0.088	3.279	399983	38.1	5.813	177	29.3	165.2	38.6	0.003	5775	5711	my9500_rel_o2nofp.cz12a_c32r128
1193	68255	0	0.0	114.9	4.0	0.000	0.000	0.096	3.426	396756	38.5	5.813	180	31.0	166.3	44.4	0.003	5711	5647	my9500_rel_o2nofp.cz13a_c32r128
Average values from iostat.
r/s	rkB/s	rrqm/s	%rrqm	r_await	rareq-s	w/s	wkB/s	wrqm/s	%wrqm	w_await	wareq-s	d/s	dkB/s	drqm/s	%drqm	d_await	dareq-s	f/s	f_await	aqu-sz	%util
0.000	0.000	0.000	0.000	0.000	0.000	119.2	4223.6	1.080	0.929	0.402	35.73	0.006	0.024	0.000	0.000	0.030	0.122	2.466	0.536	0.048	4.767		my8044_rel_o2nofp.cz12a_c32r128
0.001	0.002	0.000	0.000	0.008	0.011	127.5	4497.3	1.378	1.081	0.461	35.30	0.010	0.042	0.000	0.000	0.047	0.188	2.036	0.770	0.062	2.138		my8407_rel_o2nofp.cz12a_c32r128
0.002	0.009	0.000	0.000	0.008	0.033	105.4	3910.5	1.181	1.167	0.429	37.61	0.023	1.242	0.000	0.000	0.107	6.092	2.493	0.543	0.047	4.336		my9500_rel_o2nofp.cz12a_c32r128
0.001	0.002	0.000	0.000	0.008	0.011	114.9	4085.8	1.119	0.970	0.448	35.55	0.020	0.082	0.000	0.000	0.099	0.387	2.328	0.506	0.053	10.10		my9500_rel_o2nofp.cz13a_c32r128
qr500.L3
qr500.L3: range queries with 500 insert/s per client. Graphs for performance per 1-second interval are here.
Average throughput:
Query response time histogram: each cell has the percentage of responses that take <= the time in the header and max is the max response time in seconds. For max values in the top 25% of the range have a red background and in the bottom 25% of the range have a green background. The red background is not used when the min value is within 80% of the max value.
| dbms | 256us | 1ms | 4ms | 16ms | 64ms | 256ms | 1s | 4s | 16s | gt | max |
|---|---|---|---|---|---|---|---|---|---|---|---|
| my5651_rel_o2nofp.cz12a_c32r128 | 99.892 | 0.092 | 0.015 | 0.001 | 0.007 | ||||||
| my5744_rel_o2nofp.cz12a_c32r128 | 99.988 | 0.011 | nonzero | nonzero | 0.004 | ||||||
| my8044_rel_o2nofp.cz12a_c32r128 | 99.978 | 0.021 | nonzero | 0.003 | |||||||
| my8407_rel_o2nofp.cz12a_c32r128 | 99.974 | 0.026 | nonzero | 0.004 | |||||||
| my9400_rel_o2nofp.cz12a_c32r128 | 99.977 | 0.023 | nonzero | 0.003 | |||||||
| my9500_rel_o2nofp.cz12a_c32r128 | 99.979 | 0.020 | nonzero | nonzero | 0.085 | ||||||
| my9500_rel_o2nofp.cz13a_c32r128 | 99.977 | 0.023 | nonzero | nonzero | nonzero | nonzero | 0.101 |
Insert response time histogram: each cell has the percentage of responses that take <= the time in the header and max is the max response time in seconds. For max values in the top 25% of the range have a red background and in the bottom 25% of the range have a green background. The red background is not used when the min value is within 80% of the max value.
| dbms | 256us | 1ms | 4ms | 16ms | 64ms | 256ms | 1s | 4s | 16s | gt | max |
|---|---|---|---|---|---|---|---|---|---|---|---|
| my5651_rel_o2nofp.cz12a_c32r128 | 0.003 | 73.542 | 26.444 | 0.011 | 0.023 | ||||||
| my5744_rel_o2nofp.cz12a_c32r128 | nonzero | 99.661 | 0.334 | 0.005 | 0.024 | ||||||
| my8044_rel_o2nofp.cz12a_c32r128 | 99.903 | 0.088 | 0.008 | nonzero | 0.066 | ||||||
| my8407_rel_o2nofp.cz12a_c32r128 | 99.623 | 0.372 | 0.005 | 0.021 | |||||||
| my9400_rel_o2nofp.cz12a_c32r128 | 99.656 | 0.340 | 0.003 | 0.022 | |||||||
| my9500_rel_o2nofp.cz12a_c32r128 | 99.654 | 0.333 | 0.013 | 0.029 | |||||||
| my9500_rel_o2nofp.cz13a_c32r128 | 99.938 | 0.033 | 0.022 | 0.007 | 0.137 |
Delete response time histogram: each cell has the percentage of responses that take <= the time in the header and max is the max response time in seconds. For max values in the top 25% of the range have a red background and in the bottom 25% of the range have a green background. The red background is not used when the min value is within 80% of the max value.
| dbms | 256us | 1ms | 4ms | 16ms | 64ms | 256ms | 1s | 4s | 16s | gt | max |
|---|---|---|---|---|---|---|---|---|---|---|---|
| my5651_rel_o2nofp.cz12a_c32r128 | 0.046 | 81.539 | 18.409 | 0.006 | 0.024 | ||||||
| my5744_rel_o2nofp.cz12a_c32r128 | 0.303 | 99.548 | 0.144 | 0.005 | 0.024 | ||||||
| my8044_rel_o2nofp.cz12a_c32r128 | 99.929 | 0.063 | 0.007 | nonzero | 0.064 | ||||||
| my8407_rel_o2nofp.cz12a_c32r128 | 99.732 | 0.265 | 0.003 | 0.019 | |||||||
| my9400_rel_o2nofp.cz12a_c32r128 | 0.007 | 99.773 | 0.216 | 0.004 | 0.024 | ||||||
| my9500_rel_o2nofp.cz12a_c32r128 | nonzero | 99.771 | 0.217 | 0.012 | 0.031 | ||||||
| my9500_rel_o2nofp.cz13a_c32r128 | 0.001 | 99.958 | 0.022 | 0.014 | 0.005 | 0.123 |
Performance metrics for the DBMS listed above. Some are normalized by throughput, others are not. Legend for results is here.
ips	qps	rps	rmbps	wps	wmbps	rpq	rkbpq	wpi	wkbpi	csps	cpups	cspq	cpupq	dbgb1	dbgb2	rss	maxop	p50	p99	tag
5960	121066	176	0.7	954.2	31.4	0.001	0.006	0.160	5.390	692345	41.8	5.719	110	30.2	132.2	38.1	0.007	10110	9903	my5651_rel_o2nofp.cz12a_c32r128
5964	102065	0	0.0	555.6	20.3	0.000	0.000	0.093	3.483	585184	41.4	5.733	130	30.7	132.7	39.9	0.004	8607	8479	my5744_rel_o2nofp.cz12a_c32r128
5960	86728	0	0.0	576.2	21.0	0.000	0.000	0.097	3.611	501690	40.6	5.785	150	31.0	132.0	43.1	0.003	7263	7199	my8044_rel_o2nofp.cz12a_c32r128
5960	85754	0	0.0	567.3	20.8	0.000	0.000	0.095	3.570	495664	40.8	5.780	152	31.0	167.8	44.1	0.004	7183	7119	my8407_rel_o2nofp.cz12a_c32r128
5964	87881	0	0.0	594.0	21.5	0.000	0.000	0.100	3.698	508097	40.4	5.782	147	31.0	167.1	43.2	0.003	7359	7295	my9400_rel_o2nofp.cz12a_c32r128
5964	88253	0	0.0	583.1	21.2	0.000	0.000	0.098	3.647	510113	40.1	5.780	145	29.3	166.3	38.6	0.085	7423	7343	my9500_rel_o2nofp.cz12a_c32r128
5964	86846	0	0.0	588.3	21.3	0.000	0.000	0.099	3.665	501711	40.8	5.777	150	31.0	167.3	44.4	0.101	7263	7199	my9500_rel_o2nofp.cz13a_c32r128
Average values from iostat.
r/s	rkB/s	rrqm/s	%rrqm	r_await	rareq-s	w/s	wkB/s	wrqm/s	%wrqm	w_await	wareq-s	d/s	dkB/s	drqm/s	%drqm	d_await	dareq-s	f/s	f_await	aqu-sz	%util
0.002	0.009	0.000	0.000	0.011	0.044	576.2	21521.5	1.183	0.269	0.739	39.60	0.023	0.270	0.000	0.000	0.077	0.915	2.535	0.645	0.408	2.040		my8044_rel_o2nofp.cz12a_c32r128
0.003	0.013	0.000	0.000	0.010	0.055	567.3	21276.6	1.522	0.337	1.119	39.80	0.059	2.276	0.000	0.000	0.286	5.702	2.540	0.848	0.606	2.317		my8407_rel_o2nofp.cz12a_c32r128
0.003	0.013	0.000	0.000	0.011	0.066	583.1	21748.6	1.277	0.262	0.698	39.06	0.047	7.096	0.000	0.000	0.148	19.19	3.112	0.698	0.403	1.192		my9500_rel_o2nofp.cz12a_c32r128
0.003	0.011	0.000	0.000	0.003	0.055	588.3	21855.0	1.175	0.239	0.676	38.58	0.060	0.606	0.000	0.000	0.366	1.164	2.530	0.628	0.370	2.671		my9500_rel_o2nofp.cz13a_c32r128
qp500.L4
qp500.L4: point queries with 500 insert/s per client. Graphs for performance per 1-second interval are here.
Average throughput:
Query response time histogram: each cell has the percentage of responses that take <= the time in the header and max is the max response time in seconds. For max values in the top 25% of the range have a red background and in the bottom 25% of the range have a green background. The red background is not used when the min value is within 80% of the max value.
| dbms | 256us | 1ms | 4ms | 16ms | 64ms | 256ms | 1s | 4s | 16s | gt | max |
|---|---|---|---|---|---|---|---|---|---|---|---|
| my5651_rel_o2nofp.cz12a_c32r128 | 99.860 | 0.125 | 0.015 | nonzero | 0.008 | ||||||
| my5744_rel_o2nofp.cz12a_c32r128 | 99.960 | 0.040 | nonzero | nonzero | nonzero | 0.022 | |||||
| my8044_rel_o2nofp.cz12a_c32r128 | 99.878 | 0.122 | nonzero | 0.002 | |||||||
| my8407_rel_o2nofp.cz12a_c32r128 | 99.856 | 0.143 | nonzero | 0.002 | |||||||
| my9400_rel_o2nofp.cz12a_c32r128 | 99.841 | 0.158 | 0.001 | nonzero | 0.005 | ||||||
| my9500_rel_o2nofp.cz12a_c32r128 | 99.878 | 0.121 | nonzero | 0.004 | |||||||
| my9500_rel_o2nofp.cz13a_c32r128 | 99.876 | 0.124 | nonzero | 0.002 |
Insert response time histogram: each cell has the percentage of responses that take <= the time in the header and max is the max response time in seconds. For max values in the top 25% of the range have a red background and in the bottom 25% of the range have a green background. The red background is not used when the min value is within 80% of the max value.
| dbms | 256us | 1ms | 4ms | 16ms | 64ms | 256ms | 1s | 4s | 16s | gt | max |
|---|---|---|---|---|---|---|---|---|---|---|---|
| my5651_rel_o2nofp.cz12a_c32r128 | 0.003 | 75.660 | 24.294 | 0.016 | 0.018 | 0.009 | 0.703 | ||||
| my5744_rel_o2nofp.cz12a_c32r128 | 99.612 | 0.377 | 0.006 | 0.006 | 0.142 | ||||||
| my8044_rel_o2nofp.cz12a_c32r128 | 99.779 | 0.219 | 0.003 | 0.028 | |||||||
| my8407_rel_o2nofp.cz12a_c32r128 | 99.894 | 0.104 | 0.003 | 0.023 | |||||||
| my9400_rel_o2nofp.cz12a_c32r128 | 99.356 | 0.633 | 0.011 | 0.026 | |||||||
| my9500_rel_o2nofp.cz12a_c32r128 | 99.483 | 0.500 | 0.016 | 0.061 | |||||||
| my9500_rel_o2nofp.cz13a_c32r128 | 99.823 | 0.169 | 0.008 | 0.029 |
Delete response time histogram: each cell has the percentage of responses that take <= the time in the header and max is the max response time in seconds. For max values in the top 25% of the range have a red background and in the bottom 25% of the range have a green background. The red background is not used when the min value is within 80% of the max value.
| dbms | 256us | 1ms | 4ms | 16ms | 64ms | 256ms | 1s | 4s | 16s | gt | max |
|---|---|---|---|---|---|---|---|---|---|---|---|
| my5651_rel_o2nofp.cz12a_c32r128 | 0.049 | 83.956 | 15.962 | 0.010 | 0.015 | 0.008 | 0.709 | ||||
| my5744_rel_o2nofp.cz12a_c32r128 | 1.634 | 98.186 | 0.172 | 0.004 | 0.004 | 0.141 | |||||
| my8044_rel_o2nofp.cz12a_c32r128 | 99.829 | 0.168 | 0.003 | 0.021 | |||||||
| my8407_rel_o2nofp.cz12a_c32r128 | 99.927 | 0.069 | 0.004 | 0.026 | |||||||
| my9400_rel_o2nofp.cz12a_c32r128 | 99.662 | 0.332 | 0.006 | 0.024 | |||||||
| my9500_rel_o2nofp.cz12a_c32r128 | 99.649 | 0.337 | 0.014 | 0.060 | |||||||
| my9500_rel_o2nofp.cz13a_c32r128 | 99.862 | 0.131 | 0.007 | 0.024 |
Performance metrics for the DBMS listed above. Some are normalized by throughput, others are not. Legend for results is here.
ips	qps	rps	rmbps	wps	wmbps	rpq	rkbpq	wpi	wkbpi	csps	cpups	cspq	cpupq	dbgb1	dbgb2	rss	maxop	p50	p99	tag
5960	104368	183	0.7	2406.9	71.6	0.002	0.007	0.404	12.297	604467	41.2	5.792	126	30.2	132.2	38.1	0.008	8719	8511	my5651_rel_o2nofp.cz12a_c32r128
5964	89651	0	0.0	603.1	21.6	0.000	0.000	0.101	3.710	519451	40.9	5.794	146	30.7	132.7	39.9	0.022	7535	7407	my5744_rel_o2nofp.cz12a_c32r128
5964	66919	0	0.0	632.4	22.6	0.000	0.000	0.106	3.878	392660	39.7	5.868	190	31.0	132.0	43.1	0.002	5599	5535	my8044_rel_o2nofp.cz12a_c32r128
5964	66270	0	0.0	625.6	22.4	0.000	0.000	0.105	3.847	388866	39.5	5.868	191	31.0	168.9	44.1	0.002	5551	5487	my8407_rel_o2nofp.cz12a_c32r128
5964	67858	0	0.0	645.9	22.9	0.000	0.000	0.108	3.938	397182	39.8	5.853	188	31.0	168.2	43.2	0.005	5695	5631	my9400_rel_o2nofp.cz12a_c32r128
5960	68080	0	0.0	635.8	22.8	0.000	0.000	0.107	3.912	399199	39.9	5.864	188	29.3	167.4	38.7	0.004	5711	5647	my9500_rel_o2nofp.cz12a_c32r128
5964	67708	0	0.0	638.6	22.8	0.000	0.000	0.107	3.910	397112	39.9	5.865	189	31.0	168.4	44.4	0.002	5663	5615	my9500_rel_o2nofp.cz13a_c32r128
Average values from iostat.
r/s	rkB/s	rrqm/s	%rrqm	r_await	rareq-s	w/s	wkB/s	wrqm/s	%wrqm	w_await	wareq-s	d/s	dkB/s	drqm/s	%drqm	d_await	dareq-s	f/s	f_await	aqu-sz	%util
0.002	0.007	0.000	0.000	0.008	0.033	632.4	23124.4	1.311	0.223	0.552	37.11	0.048	0.482	0.000	0.000	0.130	1.276	2.517	0.559	0.346	2.756		my8044_rel_o2nofp.cz12a_c32r128
0.004	0.018	0.000	0.000	0.017	0.077	625.6	22941.4	1.685	0.288	0.622	37.32	0.050	1.752	0.000	0.000	0.152	4.250	2.512	0.534	0.392	2.964		my8407_rel_o2nofp.cz12a_c32r128
0.007	0.029	0.000	0.000	0.041	0.122	635.8	23316.6	1.561	0.252	0.716	37.03	0.044	5.622	0.000	0.000	0.161	16.38	2.616	0.650	0.439	1.639		my9500_rel_o2nofp.cz12a_c32r128
0.004	0.018	0.000	0.000	0.022	0.077	638.6	23319.2	1.080	0.176	0.845	36.84	0.061	0.614	0.000	0.000	0.159	1.232	2.572	0.769	0.535	1.651		my9500_rel_o2nofp.cz13a_c32r128
qr1000.L5
qr1000.L5: range queries with 1000 insert/s per client. Graphs for performance per 1-second interval are here.
Average throughput:
Query response time histogram: each cell has the percentage of responses that take <= the time in the header and max is the max response time in seconds. For max values in the top 25% of the range have a red background and in the bottom 25% of the range have a green background. The red background is not used when the min value is within 80% of the max value.
| dbms | 256us | 1ms | 4ms | 16ms | 64ms | 256ms | 1s | 4s | 16s | gt | max |
|---|---|---|---|---|---|---|---|---|---|---|---|
| my5651_rel_o2nofp.cz12a_c32r128 | 99.698 | 0.275 | 0.025 | 0.002 | nonzero | nonzero | nonzero | 0.629 | |||
| my5744_rel_o2nofp.cz12a_c32r128 | 99.969 | 0.029 | 0.002 | nonzero | nonzero | nonzero | 0.100 | ||||
| my8044_rel_o2nofp.cz12a_c32r128 | 99.943 | 0.056 | 0.001 | nonzero | 0.005 | ||||||
| my8407_rel_o2nofp.cz12a_c32r128 | 99.935 | 0.064 | 0.001 | nonzero | 0.007 | ||||||
| my9400_rel_o2nofp.cz12a_c32r128 | 99.936 | 0.063 | 0.002 | nonzero | 0.006 | ||||||
| my9500_rel_o2nofp.cz12a_c32r128 | 99.954 | 0.046 | nonzero | nonzero | nonzero | 0.048 | |||||
| my9500_rel_o2nofp.cz13a_c32r128 | 99.941 | 0.058 | 0.001 | nonzero | 0.004 |
Insert response time histogram: each cell has the percentage of responses that take <= the time in the header and max is the max response time in seconds. For max values in the top 25% of the range have a red background and in the bottom 25% of the range have a green background. The red background is not used when the min value is within 80% of the max value.
| dbms | 256us | 1ms | 4ms | 16ms | 64ms | 256ms | 1s | 4s | 16s | gt | max |
|---|---|---|---|---|---|---|---|---|---|---|---|
| my5651_rel_o2nofp.cz12a_c32r128 | 0.013 | 51.075 | 48.802 | 0.080 | 0.018 | 0.012 | 0.654 | ||||
| my5744_rel_o2nofp.cz12a_c32r128 | nonzero | 98.669 | 1.322 | 0.006 | 0.003 | 0.400 | |||||
| my8044_rel_o2nofp.cz12a_c32r128 | 99.775 | 0.213 | 0.012 | 0.056 | |||||||
| my8407_rel_o2nofp.cz12a_c32r128 | 99.507 | 0.481 | 0.011 | nonzero | 0.066 | ||||||
| my9400_rel_o2nofp.cz12a_c32r128 | 99.603 | 0.383 | 0.014 | 0.030 | |||||||
| my9500_rel_o2nofp.cz12a_c32r128 | 99.886 | 0.100 | 0.013 | 0.001 | 0.081 | ||||||
| my9500_rel_o2nofp.cz13a_c32r128 | 99.779 | 0.210 | 0.011 | 0.039 |
Delete response time histogram: each cell has the percentage of responses that take <= the time in the header and max is the max response time in seconds. For max values in the top 25% of the range have a red background and in the bottom 25% of the range have a green background. The red background is not used when the min value is within 80% of the max value.
| dbms | 256us | 1ms | 4ms | 16ms | 64ms | 256ms | 1s | 4s | 16s | gt | max |
|---|---|---|---|---|---|---|---|---|---|---|---|
| my5651_rel_o2nofp.cz12a_c32r128 | 0.032 | 62.646 | 37.237 | 0.059 | 0.015 | 0.011 | 0.790 | ||||
| my5744_rel_o2nofp.cz12a_c32r128 | 0.750 | 98.176 | 1.066 | 0.005 | 0.003 | 0.400 | |||||
| my8044_rel_o2nofp.cz12a_c32r128 | 0.002 | 99.884 | 0.103 | 0.011 | 0.056 | ||||||
| my8407_rel_o2nofp.cz12a_c32r128 | nonzero | 99.751 | 0.240 | 0.009 | 0.056 | ||||||
| my9400_rel_o2nofp.cz12a_c32r128 | nonzero | 99.792 | 0.197 | 0.011 | 0.031 | ||||||
| my9500_rel_o2nofp.cz12a_c32r128 | nonzero | 99.952 | 0.036 | 0.011 | 0.001 | 0.078 | |||||
| my9500_rel_o2nofp.cz13a_c32r128 | 99.897 | 0.095 | 0.009 | 0.038 |
Performance metrics for the DBMS listed above. Some are normalized by throughput, others are not. Legend for results is here.
ips	qps	rps	rmbps	wps	wmbps	rpq	rkbpq	wpi	wkbpi	csps	cpups	cspq	cpupq	dbgb1	dbgb2	rss	maxop	p50	p99	tag
11927	116670	358	1.4	1547.0	52.9	0.003	0.012	0.130	4.540	664509	45.8	5.696	126	30.2	132.2	38.2	0.629	9759	9503	my5651_rel_o2nofp.cz12a_c32r128
11927	100142	0	0.0	1001.0	37.8	0.000	0.000	0.084	3.248	572429	44.3	5.716	142	30.7	132.7	40.0	0.100	8431	8239	my5744_rel_o2nofp.cz12a_c32r128
11927	85365	0	0.0	1045.4	39.4	0.000	0.000	0.088	3.384	495270	42.7	5.802	160	31.0	132.0	43.1	0.005	7167	7087	my8044_rel_o2nofp.cz12a_c32r128
11927	84533	0	0.0	1022.5	38.8	0.000	0.000	0.086	3.329	490053	42.7	5.797	162	31.0	171.0	44.1	0.007	7087	7023	my8407_rel_o2nofp.cz12a_c32r128
11920	86671	0	0.0	1021.7	38.8	0.000	0.000	0.086	3.332	501745	42.7	5.789	158	31.0	170.3	43.2	0.006	7247	7183	my9400_rel_o2nofp.cz12a_c32r128
11920	86993	0	0.0	1037.4	39.3	0.000	0.000	0.087	3.375	506089	42.7	5.818	157	29.3	169.5	38.8	0.048	7343	7247	my9500_rel_o2nofp.cz12a_c32r128
11920	85600	0	0.0	1027.9	39.0	0.000	0.000	0.086	3.346	497092	42.7	5.807	160	31.0	170.5	44.4	0.004	7167	7102	my9500_rel_o2nofp.cz13a_c32r128
Average values from iostat.
r/s	rkB/s	rrqm/s	%rrqm	r_await	rareq-s	w/s	wkB/s	wrqm/s	%wrqm	w_await	wareq-s	d/s	dkB/s	drqm/s	%drqm	d_await	dareq-s	f/s	f_await	aqu-sz	%util
0.004	0.015	0.000	0.000	0.014	0.077	1045.4	40359.5	1.556	0.151	0.837	38.74	0.045	0.471	0.000	0.000	0.111	0.907	2.601	0.733	0.865	2.222		my8044_rel_o2nofp.cz12a_c32r128
0.005	0.020	0.000	0.000	0.054	0.088	1022.5	39704.8	1.803	0.179	1.192	39.00	0.072	3.308	0.000	0.000	0.264	6.807	2.831	0.782	1.153	1.890		my8407_rel_o2nofp.cz12a_c32r128
0.010	0.040	0.000	0.000	0.041	0.199	1037.4	40229.9	1.659	0.164	0.813	38.95	0.072	13.95	0.000	0.000	0.171	32.09	2.577	0.606	0.831	2.019		my9500_rel_o2nofp.cz12a_c32r128
0.006	0.024	0.000	0.000	0.014	0.122	1027.9	39888.4	1.287	0.128	0.939	39.00	0.084	1.138	0.000	0.000	0.159	1.858	2.635	0.664	0.976	1.979		my9500_rel_o2nofp.cz13a_c32r128
qp1000.L6
qp1000.L6: point queries with 1000 insert/s per client. Graphs for performance per 1-second interval are here.
Average throughput:
Query response time histogram: each cell has the percentage of responses that take <= the time in the header and max is the max response time in seconds. For max values in the top 25% of the range have a red background and in the bottom 25% of the range have a green background. The red background is not used when the min value is within 80% of the max value.
| dbms | 256us | 1ms | 4ms | 16ms | 64ms | 256ms | 1s | 4s | 16s | gt | max |
|---|---|---|---|---|---|---|---|---|---|---|---|
| my5651_rel_o2nofp.cz12a_c32r128 | 99.706 | 0.273 | 0.020 | 0.001 | nonzero | 0.017 | |||||
| my5744_rel_o2nofp.cz12a_c32r128 | 99.919 | 0.079 | 0.002 | nonzero | 0.007 | ||||||
| my8044_rel_o2nofp.cz12a_c32r128 | 99.691 | 0.307 | 0.002 | nonzero | 0.006 | ||||||
| my8407_rel_o2nofp.cz12a_c32r128 | 99.662 | 0.336 | 0.002 | nonzero | 0.009 | ||||||
| my9400_rel_o2nofp.cz12a_c32r128 | 99.684 | 0.314 | 0.001 | nonzero | 0.004 | ||||||
| my9500_rel_o2nofp.cz12a_c32r128 | 99.754 | 0.245 | 0.001 | nonzero | 0.005 | ||||||
| my9500_rel_o2nofp.cz13a_c32r128 | 99.717 | 0.282 | 0.001 | nonzero | 0.006 |
Insert response time histogram: each cell has the percentage of responses that take <= the time in the header and max is the max response time in seconds. For max values in the top 25% of the range have a red background and in the bottom 25% of the range have a green background. The red background is not used when the min value is within 80% of the max value.
| dbms | 256us | 1ms | 4ms | 16ms | 64ms | 256ms | 1s | 4s | 16s | gt | max |
|---|---|---|---|---|---|---|---|---|---|---|---|
| my5651_rel_o2nofp.cz12a_c32r128 | 0.073 | 68.102 | 31.663 | 0.155 | 0.006 | 0.001 | 0.727 | ||||
| my5744_rel_o2nofp.cz12a_c32r128 | 0.001 | 98.634 | 1.356 | 0.009 | 0.052 | ||||||
| my8044_rel_o2nofp.cz12a_c32r128 | 99.571 | 0.419 | 0.010 | 0.032 | |||||||
| my8407_rel_o2nofp.cz12a_c32r128 | 99.611 | 0.376 | 0.013 | nonzero | 0.072 | ||||||
| my9400_rel_o2nofp.cz12a_c32r128 | 99.731 | 0.257 | 0.012 | 0.057 | |||||||
| my9500_rel_o2nofp.cz12a_c32r128 | 99.674 | 0.314 | 0.013 | 0.042 | |||||||
| my9500_rel_o2nofp.cz13a_c32r128 | 99.642 | 0.343 | 0.015 | nonzero | 0.074 |
Delete response time histogram: each cell has the percentage of responses that take <= the time in the header and max is the max response time in seconds. For max values in the top 25% of the range have a red background and in the bottom 25% of the range have a green background. The red background is not used when the min value is within 80% of the max value.
| dbms | 256us | 1ms | 4ms | 16ms | 64ms | 256ms | 1s | 4s | 16s | gt | max |
|---|---|---|---|---|---|---|---|---|---|---|---|
| my5651_rel_o2nofp.cz12a_c32r128 | 0.677 | 76.117 | 23.066 | 0.133 | 0.006 | 0.001 | 0.727 | ||||
| my5744_rel_o2nofp.cz12a_c32r128 | 1.163 | 97.759 | 1.069 | 0.009 | 0.051 | ||||||
| my8044_rel_o2nofp.cz12a_c32r128 | nonzero | 99.773 | 0.218 | 0.008 | 0.036 | ||||||
| my8407_rel_o2nofp.cz12a_c32r128 | nonzero | 99.814 | 0.175 | 0.010 | 0.058 | ||||||
| my9400_rel_o2nofp.cz12a_c32r128 | 99.876 | 0.113 | 0.010 | 0.057 | |||||||
| my9500_rel_o2nofp.cz12a_c32r128 | nonzero | 99.809 | 0.179 | 0.011 | 0.035 | ||||||
| my9500_rel_o2nofp.cz13a_c32r128 | 99.837 | 0.150 | 0.012 | nonzero | 0.073 |
Performance metrics for the DBMS listed above. Some are normalized by throughput, others are not. Legend for results is here.
ips	qps	rps	rmbps	wps	wmbps	rpq	rkbpq	wpi	wkbpi	csps	cpups	cspq	cpupq	dbgb1	dbgb2	rss	maxop	p50	p99	tag
11920	101387	288	1.1	1637.2	55.4	0.003	0.011	0.137	4.761	584893	45.2	5.769	143	30.2	132.2	38.2	0.017	8511	8287	my5651_rel_o2nofp.cz12a_c32r128
11927	88393	0	0.0	1047.5	39.2	0.000	0.000	0.088	3.362	511078	43.7	5.782	158	30.7	132.7	40.1	0.007	7407	7215	my5744_rel_o2nofp.cz12a_c32r128
11920	66041	0	0.0	1078.9	40.4	0.000	0.000	0.091	3.474	389873	42.6	5.904	206	31.0	132.0	43.1	0.006	5551	5487	my8044_rel_o2nofp.cz12a_c32r128
11927	65565	0	0.0	1083.9	40.6	0.000	0.000	0.091	3.482	387497	42.7	5.910	208	31.0	173.1	44.1	0.009	5487	5423	my8407_rel_o2nofp.cz12a_c32r128
11920	66970	0	0.0	1079.9	40.4	0.000	0.000	0.091	3.473	395143	42.5	5.900	203	31.0	172.4	43.2	0.004	5615	5551	my9400_rel_o2nofp.cz12a_c32r128
11927	67396	0	0.0	1089.3	40.7	0.000	0.000	0.091	3.492	397922	41.9	5.904	199	29.3	171.6	38.9	0.005	5679	5615	my9500_rel_o2nofp.cz12a_c32r128
11920	66827	0	0.0	1085.5	40.6	0.000	0.000	0.091	3.488	395155	42.7	5.913	204	31.0	172.6	44.4	0.006	5647	5567	my9500_rel_o2nofp.cz13a_c32r128
Average values from iostat.
r/s	rkB/s	rrqm/s	%rrqm	r_await	rareq-s	w/s	wkB/s	wrqm/s	%wrqm	w_await	wareq-s	d/s	dkB/s	drqm/s	%drqm	d_await	dareq-s	f/s	f_await	aqu-sz	%util
0.003	0.013	0.000	0.000	0.019	0.066	1078.9	41413.8	1.356	0.124	0.624	38.35	0.056	0.641	0.000	0.000	0.150	1.489	2.612	0.480	0.675	1.749		my8044_rel_o2nofp.cz12a_c32r128
0.008	0.033	0.000	0.000	0.033	0.166	1083.9	41527.1	1.747	0.160	0.644	38.28	0.059	3.324	0.000	0.000	0.224	8.439	2.654	0.590	0.700	1.881		my8407_rel_o2nofp.cz12a_c32r128
0.007	0.029	0.000	0.000	0.044	0.144	1089.3	41648.2	1.597	0.145	0.736	38.20	0.057	11.81	0.000	0.000	0.175	32.79	3.531	0.581	0.803	1.573		my9500_rel_o2nofp.cz12a_c32r128
0.009	0.035	0.000	0.000	0.014	0.166	1085.5	41580.3	1.537	0.140	0.718	38.26	0.078	1.006	0.000	0.000	0.227	1.726	2.614	0.613	0.780	2.411		my9500_rel_o2nofp.cz13a_c32r128
l.i0
l.i0: load without secondary indexes
Performance metrics for all DBMS, not just the ones listed above. Some are normalized by throughput, others are not. Legend for results is here.
ips	qps	rps	rmbps	wps	wmbps	rpq	rkbpq	wpi	wkbpi	csps	cpups	cspq	cpupq	dbgb1	dbgb2	rss	maxop	p50	p99	tag
588235	0	0	0.0	1479.3	144.1	0.000	0.000	0.003	0.251	70945	40.5	0.121	22	8.0	108.5	15.0	0.183	50994	42695	my5651_rel_o2nofp.cz12a_c32r128
681818	0	0	0.0	2172.5	181.4	0.000	0.000	0.003	0.272	83139	41.9	0.122	20	8.0	108.5	16.3	0.148	62392	53093	my5744_rel_o2nofp.cz12a_c32r128
810811	0	1	0.0	2689.5	229.2	0.000	0.000	0.003	0.289	139911	47.0	0.173	19	8.0	108.6	16.5	0.162	78990	69192	my8044_rel_o2nofp.cz12a_c32r128
805369	0	1	0.0	2672.4	224.1	0.000	0.000	0.003	0.285	136973	46.1	0.170	18	8.0	114.2	16.5	0.165	78091	67591	my8407_rel_o2nofp.cz12a_c32r128
800000	0	0	0.0	2660.2	223.8	0.000	0.000	0.003	0.286	136631	45.7	0.171	18	8.0	114.2	16.5	0.162	78289	67192	my9400_rel_o2nofp.cz12a_c32r128
794702	0	1	0.0	2673.0	225.8	0.000	0.000	0.003	0.291	145325	46.8	0.183	19	8.0	114.2	16.6	0.165	77391	67191	my9500_rel_o2nofp.cz12a_c32r128
800000	0	1	0.0	2672.2	224.2	0.000	0.000	0.003	0.287	136076	45.9	0.170	18	8.0	114.2	16.7	0.168	78491	66892	my9500_rel_o2nofp.cz13a_c32r128
l.x
l.x: create secondary indexes
Performance metrics for all DBMS, not just the ones listed above. Some are normalized by throughput, others are not. Legend for results is here.
ips	qps	rps	rmbps	wps	wmbps	rpq	rkbpq	wpi	wkbpi	csps	cpups	cspq	cpupq	dbgb1	dbgb2	rss	maxop	p50	p99	tag
434783	0	0	0.0	10249.1	503.1	0.000	0.000	0.024	1.185	24790	31.2	0.057	23	16.7	117.2	23.9	0.001	NA	NA	my5651_rel_o2nofp.cz12a_c32r128
1764707	0	0	0.0	29014.1	1529.7	0.000	0.000	0.016	0.888	167293	34.0	0.095	6	18.2	118.8	24.3	0.018	NA	NA	my5744_rel_o2nofp.cz12a_c32r128
2033900	0	54	1.6	63224.8	2465.6	0.000	0.001	0.031	1.241	89008	74.1	0.044	12	18.2	118.8	16.8	0.007	NA	NA	my8044_rel_o2nofp.cz12a_c32r128
2105265	0	50	1.3	66028.0	2509.9	0.000	0.001	0.031	1.221	95406	73.8	0.045	11	18.2	124.4	16.9	0.004	NA	NA	my8407_rel_o2nofp.cz12a_c32r128
2068967	0	48	1.4	64874.8	2491.9	0.000	0.001	0.031	1.233	95514	72.4	0.046	11	18.2	124.4	16.8	0.004	NA	NA	my9400_rel_o2nofp.cz12a_c32r128
2105265	0	47	1.2	66840.0	2522.4	0.000	0.001	0.032	1.227	98125	72.6	0.047	11	18.2	124.4	17.1	0.011	NA	NA	my9500_rel_o2nofp.cz12a_c32r128
2105265	0	50	1.4	65118.9	2496.7	0.000	0.001	0.031	1.214	93632	71.5	0.044	11	18.2	124.4	17.1	0.005	NA	NA	my9500_rel_o2nofp.cz13a_c32r128
l.i1
l.i1: continue load after secondary indexes created with 50 inserts per transaction
Performance metrics for all DBMS, not just the ones listed above. Some are normalized by throughput, others are not. Legend for results is here.
ips	qps	rps	rmbps	wps	wmbps	rpq	rkbpq	wpi	wkbpi	csps	cpups	cspq	cpupq	dbgb1	dbgb2	rss	maxop	p50	p99	tag
73310	0	1232	4.8	3521.7	150.4	0.017	0.067	0.048	2.101	110840	73.5	1.512	321	30.2	132.2	37.8	7.892	6549	200	my5651_rel_o2nofp.cz12a_c32r128
100734	0	0	0.0	4495.2	186.7	0.000	0.000	0.045	1.898	47808	76.4	0.475	243	30.7	132.7	39.3	5.749	9995	0	my5744_rel_o2nofp.cz12a_c32r128
178439	0	538	8.4	7422.6	325.0	0.003	0.048	0.042	1.865	208681	68.5	1.169	123	31.0	134.4	43.1	2.050	18248	2800	my8044_rel_o2nofp.cz12a_c32r128
177122	0	536	8.4	7462.9	327.1	0.003	0.048	0.042	1.891	208813	67.5	1.179	122	31.0	158.6	44.1	2.097	18148	2650	my8407_rel_o2nofp.cz12a_c32r128
176147	0	531	8.3	7378.9	322.2	0.003	0.048	0.042	1.873	207188	67.4	1.176	122	31.0	158.9	43.1	1.410	17893	3100	my9400_rel_o2nofp.cz12a_c32r128
160535	0	484	7.6	7264.3	316.9	0.003	0.048	0.045	2.022	226896	63.3	1.413	126	29.3	155.6	38.2	1.373	15288	2200	my9500_rel_o2nofp.cz12a_c32r128
176633	0	534	8.3	7427.1	324.9	0.003	0.048	0.042	1.883	206553	67.1	1.169	122	31.0	158.0	44.4	1.653	17948	2000	my9500_rel_o2nofp.cz13a_c32r128
l.i2
l.i2: continue load after secondary indexes created with 5 inserts per transaction
Performance metrics for all DBMS, not just the ones listed above. Some are normalized by throughput, others are not. Legend for results is here.
ips	qps	rps	rmbps	wps	wmbps	rpq	rkbpq	wpi	wkbpi	csps	cpups	cspq	cpupq	dbgb1	dbgb2	rss	maxop	p50	p99	tag
40336	0	5558	21.7	3232.3	131.6	0.138	0.551	0.080	3.340	276703	67.6	6.860	536	30.2	132.2	38.0	0.239	3685	165	my5651_rel_o2nofp.cz12a_c32r128
65217	0	0	0.0	5030.0	209.1	0.000	0.000	0.077	3.284	282521	67.5	4.332	331	30.7	132.7	39.8	1.226	6284	180	my5744_rel_o2nofp.cz12a_c32r128
77295	0	0	0.0	5889.1	251.6	0.000	0.000	0.076	3.333	415098	66.8	5.370	277	31.0	132.0	43.1	0.472	7519	1130	my8044_rel_o2nofp.cz12a_c32r128
77046	0	0	0.0	5934.3	252.5	0.000	0.000	0.077	3.356	416881	66.8	5.411	277	31.0	166.3	44.1	0.530	7499	1120	my8407_rel_o2nofp.cz12a_c32r128
76190	0	0	0.0	5845.0	249.0	0.000	0.000	0.077	3.347	410083	65.4	5.382	275	31.0	165.6	43.2	0.863	7493	1095	my9400_rel_o2nofp.cz12a_c32r128
80537	0	0	0.0	6022.8	261.5	0.000	0.000	0.075	3.325	443544	67.8	5.507	269	29.3	164.8	38.5	0.925	7539	1090	my9500_rel_o2nofp.cz12a_c32r128
76433	0	0	0.0	5883.2	250.6	0.000	0.000	0.077	3.357	416022	66.4	5.443	278	31.0	165.8	44.4	0.917	7444	1120	my9500_rel_o2nofp.cz13a_c32r128
qr100.L1
qr100.L1: range queries with 100 insert/s per client
Performance metrics for all DBMS, not just the ones listed above. Some are normalized by throughput, others are not. Legend for results is here.
ips	qps	rps	rmbps	wps	wmbps	rpq	rkbpq	wpi	wkbpi	csps	cpups	cspq	cpupq	dbgb1	dbgb2	rss	maxop	p50	p99	tag
1193	124089	37	0.1	3826.9	107.0	0.000	0.001	3.209	91.880	712210	39.1	5.739	101	30.2	132.2	38.0	0.007	10399	10143	my5651_rel_o2nofp.cz12a_c32r128
1192	103047	0	0.0	1437.2	40.6	0.000	0.000	1.206	34.898	591672	39.3	5.742	122	30.7	132.7	39.8	0.024	8671	8559	my5744_rel_o2nofp.cz12a_c32r128
1193	87431	0	0.0	1446.6	41.0	0.000	0.000	1.213	35.236	505409	38.9	5.781	142	31.0	132.0	43.1	0.002	7327	7231	my8044_rel_o2nofp.cz12a_c32r128
1193	86349	0	0.0	1394.3	39.6	0.000	0.000	1.169	33.986	499119	38.8	5.780	144	31.0	166.5	44.1	0.111	7199	7119	my8407_rel_o2nofp.cz12a_c32r128
1192	88604	0	0.0	1415.8	40.2	0.000	0.000	1.188	34.504	512226	38.9	5.781	140	31.0	165.9	43.2	0.215	7439	7327	my9400_rel_o2nofp.cz12a_c32r128
1193	88822	0	0.0	1428.9	40.5	0.000	0.000	1.198	34.813	513198	38.9	5.778	140	29.3	165.0	38.6	0.005	7407	7311	my9500_rel_o2nofp.cz12a_c32r128
1192	87362	0	0.0	1493.5	42.3	0.000	0.000	1.253	36.368	505179	39.0	5.783	143	31.0	166.0	44.4	0.003	7359	7279	my9500_rel_o2nofp.cz13a_c32r128
qp100.L2
qp100.L2: point queries with 100 insert/s per client
Performance metrics for all DBMS, not just the ones listed above. Some are normalized by throughput, others are not. Legend for results is here.
ips	qps	rps	rmbps	wps	wmbps	rpq	rkbpq	wpi	wkbpi	csps	cpups	cspq	cpupq	dbgb1	dbgb2	rss	maxop	p50	p99	tag
1193	106971	38	0.1	16.9	1.4	0.000	0.001	0.014	1.205	619294	38.0	5.789	114	30.2	132.2	38.0	0.004	8927	8783	my5651_rel_o2nofp.cz12a_c32r128
1193	90742	0	0.0	120.2	4.1	0.000	0.000	0.101	3.504	525488	38.9	5.791	137	30.7	132.7	39.8	0.002	7615	7535	my5744_rel_o2nofp.cz12a_c32r128
1193	67597	0	0.0	119.2	4.1	0.000	0.000	0.100	3.541	392995	38.1	5.814	180	31.0	132.0	43.1	0.002	5647	5583	my8044_rel_o2nofp.cz12a_c32r128
1192	66900	0	0.0	127.5	4.4	0.000	0.000	0.107	3.773	389156	38.0	5.817	182	31.0	166.7	44.1	0.004	5599	5551	my8407_rel_o2nofp.cz12a_c32r128
1192	68507	0	0.0	136.2	4.7	0.000	0.000	0.114	4.004	398400	38.2	5.815	178	31.0	166.1	43.2	0.004	5743	5695	my9400_rel_o2nofp.cz12a_c32r128
1193	68808	0	0.0	105.4	3.8	0.000	0.000	0.088	3.279	399983	38.1	5.813	177	29.3	165.2	38.6	0.003	5775	5711	my9500_rel_o2nofp.cz12a_c32r128
1193	68255	0	0.0	114.9	4.0	0.000	0.000	0.096	3.426	396756	38.5	5.813	180	31.0	166.3	44.4	0.003	5711	5647	my9500_rel_o2nofp.cz13a_c32r128
qr500.L3
qr500.L3: range queries with 500 insert/s per client
Performance metrics for all DBMS, not just the ones listed above. Some are normalized by throughput, others are not. Legend for results is here.
ips	qps	rps	rmbps	wps	wmbps	rpq	rkbpq	wpi	wkbpi	csps	cpups	cspq	cpupq	dbgb1	dbgb2	rss	maxop	p50	p99	tag
5960	121066	176	0.7	954.2	31.4	0.001	0.006	0.160	5.390	692345	41.8	5.719	110	30.2	132.2	38.1	0.007	10110	9903	my5651_rel_o2nofp.cz12a_c32r128
5964	102065	0	0.0	555.6	20.3	0.000	0.000	0.093	3.483	585184	41.4	5.733	130	30.7	132.7	39.9	0.004	8607	8479	my5744_rel_o2nofp.cz12a_c32r128
5960	86728	0	0.0	576.2	21.0	0.000	0.000	0.097	3.611	501690	40.6	5.785	150	31.0	132.0	43.1	0.003	7263	7199	my8044_rel_o2nofp.cz12a_c32r128
5960	85754	0	0.0	567.3	20.8	0.000	0.000	0.095	3.570	495664	40.8	5.780	152	31.0	167.8	44.1	0.004	7183	7119	my8407_rel_o2nofp.cz12a_c32r128
5964	87881	0	0.0	594.0	21.5	0.000	0.000	0.100	3.698	508097	40.4	5.782	147	31.0	167.1	43.2	0.003	7359	7295	my9400_rel_o2nofp.cz12a_c32r128
5964	88253	0	0.0	583.1	21.2	0.000	0.000	0.098	3.647	510113	40.1	5.780	145	29.3	166.3	38.6	0.085	7423	7343	my9500_rel_o2nofp.cz12a_c32r128
5964	86846	0	0.0	588.3	21.3	0.000	0.000	0.099	3.665	501711	40.8	5.777	150	31.0	167.3	44.4	0.101	7263	7199	my9500_rel_o2nofp.cz13a_c32r128
qp500.L4
qp500.L4: point queries with 500 insert/s per client
Performance metrics for all DBMS, not just the ones listed above. Some are normalized by throughput, others are not. Legend for results is here.
ips	qps	rps	rmbps	wps	wmbps	rpq	rkbpq	wpi	wkbpi	csps	cpups	cspq	cpupq	dbgb1	dbgb2	rss	maxop	p50	p99	tag
5960	104368	183	0.7	2406.9	71.6	0.002	0.007	0.404	12.297	604467	41.2	5.792	126	30.2	132.2	38.1	0.008	8719	8511	my5651_rel_o2nofp.cz12a_c32r128
5964	89651	0	0.0	603.1	21.6	0.000	0.000	0.101	3.710	519451	40.9	5.794	146	30.7	132.7	39.9	0.022	7535	7407	my5744_rel_o2nofp.cz12a_c32r128
5964	66919	0	0.0	632.4	22.6	0.000	0.000	0.106	3.878	392660	39.7	5.868	190	31.0	132.0	43.1	0.002	5599	5535	my8044_rel_o2nofp.cz12a_c32r128
5964	66270	0	0.0	625.6	22.4	0.000	0.000	0.105	3.847	388866	39.5	5.868	191	31.0	168.9	44.1	0.002	5551	5487	my8407_rel_o2nofp.cz12a_c32r128
5964	67858	0	0.0	645.9	22.9	0.000	0.000	0.108	3.938	397182	39.8	5.853	188	31.0	168.2	43.2	0.005	5695	5631	my9400_rel_o2nofp.cz12a_c32r128
5960	68080	0	0.0	635.8	22.8	0.000	0.000	0.107	3.912	399199	39.9	5.864	188	29.3	167.4	38.7	0.004	5711	5647	my9500_rel_o2nofp.cz12a_c32r128
5964	67708	0	0.0	638.6	22.8	0.000	0.000	0.107	3.910	397112	39.9	5.865	189	31.0	168.4	44.4	0.002	5663	5615	my9500_rel_o2nofp.cz13a_c32r128
qr1000.L5
qr1000.L5: range queries with 1000 insert/s per client
Performance metrics for all DBMS, not just the ones listed above. Some are normalized by throughput, others are not. Legend for results is here.
ips	qps	rps	rmbps	wps	wmbps	rpq	rkbpq	wpi	wkbpi	csps	cpups	cspq	cpupq	dbgb1	dbgb2	rss	maxop	p50	p99	tag
11927	116670	358	1.4	1547.0	52.9	0.003	0.012	0.130	4.540	664509	45.8	5.696	126	30.2	132.2	38.2	0.629	9759	9503	my5651_rel_o2nofp.cz12a_c32r128
11927	100142	0	0.0	1001.0	37.8	0.000	0.000	0.084	3.248	572429	44.3	5.716	142	30.7	132.7	40.0	0.100	8431	8239	my5744_rel_o2nofp.cz12a_c32r128
11927	85365	0	0.0	1045.4	39.4	0.000	0.000	0.088	3.384	495270	42.7	5.802	160	31.0	132.0	43.1	0.005	7167	7087	my8044_rel_o2nofp.cz12a_c32r128
11927	84533	0	0.0	1022.5	38.8	0.000	0.000	0.086	3.329	490053	42.7	5.797	162	31.0	171.0	44.1	0.007	7087	7023	my8407_rel_o2nofp.cz12a_c32r128
11920	86671	0	0.0	1021.7	38.8	0.000	0.000	0.086	3.332	501745	42.7	5.789	158	31.0	170.3	43.2	0.006	7247	7183	my9400_rel_o2nofp.cz12a_c32r128
11920	86993	0	0.0	1037.4	39.3	0.000	0.000	0.087	3.375	506089	42.7	5.818	157	29.3	169.5	38.8	0.048	7343	7247	my9500_rel_o2nofp.cz12a_c32r128
11920	85600	0	0.0	1027.9	39.0	0.000	0.000	0.086	3.346	497092	42.7	5.807	160	31.0	170.5	44.4	0.004	7167	7102	my9500_rel_o2nofp.cz13a_c32r128
qp1000.L6
qp1000.L6: point queries with 1000 insert/s per client
Performance metrics for all DBMS, not just the ones listed above. Some are normalized by throughput, others are not. Legend for results is here.
ips	qps	rps	rmbps	wps	wmbps	rpq	rkbpq	wpi	wkbpi	csps	cpups	cspq	cpupq	dbgb1	dbgb2	rss	maxop	p50	p99	tag
11920	101387	288	1.1	1637.2	55.4	0.003	0.011	0.137	4.761	584893	45.2	5.769	143	30.2	132.2	38.2	0.017	8511	8287	my5651_rel_o2nofp.cz12a_c32r128
11927	88393	0	0.0	1047.5	39.2	0.000	0.000	0.088	3.362	511078	43.7	5.782	158	30.7	132.7	40.1	0.007	7407	7215	my5744_rel_o2nofp.cz12a_c32r128
11920	66041	0	0.0	1078.9	40.4	0.000	0.000	0.091	3.474	389873	42.6	5.904	206	31.0	132.0	43.1	0.006	5551	5487	my8044_rel_o2nofp.cz12a_c32r128
11927	65565	0	0.0	1083.9	40.6	0.000	0.000	0.091	3.482	387497	42.7	5.910	208	31.0	173.1	44.1	0.009	5487	5423	my8407_rel_o2nofp.cz12a_c32r128
11920	66970	0	0.0	1079.9	40.4	0.000	0.000	0.091	3.473	395143	42.5	5.900	203	31.0	172.4	43.2	0.004	5615	5551	my9400_rel_o2nofp.cz12a_c32r128
11927	67396	0	0.0	1089.3	40.7	0.000	0.000	0.091	3.492	397922	41.9	5.904	199	29.3	171.6	38.9	0.005	5679	5615	my9500_rel_o2nofp.cz12a_c32r128
11920	66827	0	0.0	1085.5	40.6	0.000	0.000	0.091	3.488	395155	42.7	5.913	204	31.0	172.6	44.4	0.006	5647	5567	my9500_rel_o2nofp.cz13a_c32r128
l.i0
- l.i0: load without secondary indexes
- Legend for results is here.
- Each entry lists the percentage of responses that fit in that bucket (slower than max time for previous bucket, faster than min time for next bucket).
Insert response time histogram
256us	1ms	4ms	16ms	64ms	256ms	1s	4s	16s	gt	max	tag
0.000	5.149	94.604	0.063	0.164	0.020	0.000	0.000	0.000	0.000	0.183	my5651_rel_o2nofp.cz12a_c32r128
0.000	4.318	95.507	0.148	0.006	0.021	0.000	0.000	0.000	0.000	0.148	my5744_rel_o2nofp.cz12a_c32r128
0.000	0.330	99.576	0.070	0.003	0.021	0.000	0.000	0.000	0.000	0.162	my8044_rel_o2nofp.cz12a_c32r128
0.000	0.139	99.765	0.070	0.004	0.021	0.000	0.000	0.000	0.000	0.165	my8407_rel_o2nofp.cz12a_c32r128
0.000	0.432	99.473	0.070	0.004	0.021	0.000	0.000	0.000	0.000	0.162	my9400_rel_o2nofp.cz12a_c32r128
0.000	0.114	99.760	0.099	0.005	0.022	0.000	0.000	0.000	0.000	0.165	my9500_rel_o2nofp.cz12a_c32r128
0.000	0.180	99.715	0.075	0.007	0.022	0.000	0.000	0.000	0.000	0.168	my9500_rel_o2nofp.cz13a_c32r128
l.x
- l.x: create secondary indexes
- Legend for results is here.
- Each entry lists the percentage of responses that fit in that bucket (slower than max time for previous bucket, faster than min time for next bucket).
TODO - determine whether there is data for create index response time
l.i1
- l.i1: continue load after secondary indexes created with 50 inserts per transaction
- Legend for results is here.
- Each entry lists the percentage of responses that fit in that bucket (slower than max time for previous bucket, faster than min time for next bucket).
Insert response time histogram
256us	1ms	4ms	16ms	64ms	256ms	1s	4s	16s	gt	max	tag
0.000	nonzero	0.547	97.278	1.780	0.339	0.053	0.002	nonzero	0.000	7.892	my5651_rel_o2nofp.cz12a_c32r128
0.000	0.012	12.447	86.949	0.206	0.132	0.247	0.007	nonzero	0.000	5.749	my5744_rel_o2nofp.cz12a_c32r128
0.000	0.000	87.969	11.741	0.209	0.069	0.010	0.001	0.000	0.000	2.050	my8044_rel_o2nofp.cz12a_c32r128
0.000	0.000	88.031	11.647	0.227	0.082	0.012	0.001	0.000	0.000	2.097	my8407_rel_o2nofp.cz12a_c32r128
0.000	0.000	88.017	11.669	0.220	0.081	0.013	nonzero	0.000	0.000	1.410	my9400_rel_o2nofp.cz12a_c32r128
0.000	0.000	83.209	16.449	0.241	0.084	0.016	0.001	0.000	0.000	1.373	my9500_rel_o2nofp.cz12a_c32r128
0.000	0.000	88.145	11.529	0.228	0.082	0.015	0.001	0.000	0.000	1.653	my9500_rel_o2nofp.cz13a_c32r128
Delete response time histogram
256us	1ms	4ms	16ms	64ms	256ms	1s	4s	16s	gt	max	tag
0.000	0.002	1.249	96.748	1.640	0.311	0.049	0.002	nonzero	0.000	4.268	my5651_rel_o2nofp.cz12a_c32r128
0.000	0.082	17.660	81.710	0.182	0.144	0.218	0.004	nonzero	0.000	5.766	my5744_rel_o2nofp.cz12a_c32r128
0.000	0.005	88.257	11.455	0.196	0.075	0.009	0.001	0.000	0.000	2.050	my8044_rel_o2nofp.cz12a_c32r128
0.000	0.007	88.343	11.335	0.214	0.088	0.013	0.001	0.000	0.000	2.038	my8407_rel_o2nofp.cz12a_c32r128
0.000	0.011	88.371	11.326	0.199	0.080	0.013	nonzero	0.000	0.000	1.305	my9400_rel_o2nofp.cz12a_c32r128
0.000	0.019	83.677	16.076	0.152	0.064	0.013	0.001	0.000	0.000	1.322	my9500_rel_o2nofp.cz12a_c32r128
0.000	0.015	88.461	11.198	0.222	0.087	0.016	0.001	0.000	0.000	1.471	my9500_rel_o2nofp.cz13a_c32r128
l.i2
- l.i2: continue load after secondary indexes created with 5 inserts per transaction
- Legend for results is here.
- Each entry lists the percentage of responses that fit in that bucket (slower than max time for previous bucket, faster than min time for next bucket).
Insert response time histogram
256us	1ms	4ms	16ms	64ms	256ms	1s	4s	16s	gt	max	tag
0.059	30.596	68.493	0.287	0.556	0.008	0.000	0.000	0.000	0.000	0.239	my5651_rel_o2nofp.cz12a_c32r128
0.135	86.626	12.783	0.033	0.417	0.006	0.001	nonzero	0.000	0.000	1.226	my5744_rel_o2nofp.cz12a_c32r128
0.049	90.888	8.322	0.721	0.012	0.008	0.001	0.000	0.000	0.000	0.472	my8044_rel_o2nofp.cz12a_c32r128
0.011	90.832	8.466	0.671	0.011	0.007	0.001	0.000	0.000	0.000	0.530	my8407_rel_o2nofp.cz12a_c32r128
0.062	90.685	8.483	0.747	0.012	0.008	0.001	0.000	0.000	0.000	0.863	my9400_rel_o2nofp.cz12a_c32r128
0.022	92.944	6.483	0.527	0.014	0.009	0.002	0.000	0.000	0.000	0.925	my9500_rel_o2nofp.cz12a_c32r128
0.043	90.768	8.455	0.711	0.013	0.008	0.002	0.000	0.000	0.000	0.917	my9500_rel_o2nofp.cz13a_c32r128
Delete response time histogram
256us	1ms	4ms	16ms	64ms	256ms	1s	4s	16s	gt	max	tag
0.066	31.657	67.428	0.286	0.556	0.008	0.000	0.000	0.000	0.000	0.239	my5651_rel_o2nofp.cz12a_c32r128
0.122	83.900	15.521	0.034	0.417	0.006	0.001	nonzero	0.000	0.000	1.226	my5744_rel_o2nofp.cz12a_c32r128
0.063	91.539	7.694	0.684	0.011	0.008	0.001	0.000	0.000	0.000	0.485	my8044_rel_o2nofp.cz12a_c32r128
0.016	91.464	7.870	0.632	0.010	0.007	0.002	0.000	0.000	0.000	0.541	my8407_rel_o2nofp.cz12a_c32r128
0.090	91.283	7.899	0.709	0.010	0.008	0.001	0.000	0.000	0.000	0.876	my9400_rel_o2nofp.cz12a_c32r128
0.051	93.246	6.189	0.492	0.012	0.009	0.002	0.000	0.000	0.000	0.927	my9500_rel_o2nofp.cz12a_c32r128
0.046	91.412	7.849	0.673	0.011	0.008	0.002	0.000	0.000	0.000	0.919	my9500_rel_o2nofp.cz13a_c32r128
qr100.L1
- qr100.L1: range queries with 100 insert/s per client
- Legend for results is here.
- Each entry lists the percentage of responses that fit in that bucket (slower than max time for previous bucket, faster than min time for next bucket).
Query response time histogram
256us	1ms	4ms	16ms	64ms	256ms	1s	4s	16s	gt	max	tag
99.980	0.009	0.011	nonzero	0.000	0.000	0.000	0.000	0.000	0.000	0.007	my5651_rel_o2nofp.cz12a_c32r128
99.995	0.005	nonzero	nonzero	nonzero	0.000	0.000	0.000	0.000	0.000	0.024	my5744_rel_o2nofp.cz12a_c32r128
99.988	0.012	nonzero	0.000	0.000	0.000	0.000	0.000	0.000	0.000	0.002	my8044_rel_o2nofp.cz12a_c32r128
99.988	0.012	nonzero	nonzero	nonzero	nonzero	0.000	0.000	0.000	0.000	0.111	my8407_rel_o2nofp.cz12a_c32r128
99.989	0.011	nonzero	nonzero	nonzero	nonzero	0.000	0.000	0.000	0.000	0.215	my9400_rel_o2nofp.cz12a_c32r128
99.987	0.013	nonzero	nonzero	0.000	0.000	0.000	0.000	0.000	0.000	0.005	my9500_rel_o2nofp.cz12a_c32r128
99.988	0.012	nonzero	0.000	0.000	0.000	0.000	0.000	0.000	0.000	0.003	my9500_rel_o2nofp.cz13a_c32r128
Insert response time histogram
256us	1ms	4ms	16ms	64ms	256ms	1s	4s	16s	gt	max	tag
0.000	0.000	96.007	3.993	0.000	0.000	0.000	0.000	0.000	0.000	0.012	my5651_rel_o2nofp.cz12a_c32r128
0.000	0.000	99.609	0.387	0.005	0.000	0.000	0.000	0.000	0.000	0.020	my5744_rel_o2nofp.cz12a_c32r128
0.000	0.000	99.231	0.766	0.002	0.000	0.000	0.000	0.000	0.000	0.020	my8044_rel_o2nofp.cz12a_c32r128
0.000	0.000	99.181	0.743	0.037	0.039	0.000	0.000	0.000	0.000	0.152	my8407_rel_o2nofp.cz12a_c32r128
0.000	0.000	99.190	0.229	0.338	0.231	0.012	0.000	0.000	0.000	0.349	my9400_rel_o2nofp.cz12a_c32r128
0.000	0.000	99.435	0.562	0.002	0.000	0.000	0.000	0.000	0.000	0.017	my9500_rel_o2nofp.cz12a_c32r128
0.000	0.000	99.081	0.917	0.002	0.000	0.000	0.000	0.000	0.000	0.017	my9500_rel_o2nofp.cz13a_c32r128
Delete response time histogram
256us	1ms	4ms	16ms	64ms	256ms	1s	4s	16s	gt	max	tag
0.000	4.477	92.755	2.769	0.000	0.000	0.000	0.000	0.000	0.000	0.013	my5651_rel_o2nofp.cz12a_c32r128
0.000	3.405	96.287	0.306	0.002	0.000	0.000	0.000	0.000	0.000	0.038	my5744_rel_o2nofp.cz12a_c32r128
0.000	0.005	99.252	0.741	0.002	0.000	0.000	0.000	0.000	0.000	0.018	my8044_rel_o2nofp.cz12a_c32r128
0.000	0.005	99.255	0.678	0.032	0.030	0.000	0.000	0.000	0.000	0.168	my8407_rel_o2nofp.cz12a_c32r128
0.000	0.002	99.257	0.218	0.278	0.241	0.005	0.000	0.000	0.000	0.344	my9400_rel_o2nofp.cz12a_c32r128
0.000	0.000	99.521	0.477	0.002	0.000	0.000	0.000	0.000	0.000	0.019	my9500_rel_o2nofp.cz12a_c32r128
0.000	0.005	99.100	0.894	0.002	0.000	0.000	0.000	0.000	0.000	0.019	my9500_rel_o2nofp.cz13a_c32r128
qp100.L2
- qp100.L2: point queries with 100 insert/s per client
- Legend for results is here.
- Each entry lists the percentage of responses that fit in that bucket (slower than max time for previous bucket, faster than min time for next bucket).
Query response time histogram
256us	1ms	4ms	16ms	64ms	256ms	1s	4s	16s	gt	max	tag
99.957	0.029	0.014	0.000	0.000	0.000	0.000	0.000	0.000	0.000	0.004	my5651_rel_o2nofp.cz12a_c32r128
99.985	0.015	nonzero	0.000	0.000	0.000	0.000	0.000	0.000	0.000	0.002	my5744_rel_o2nofp.cz12a_c32r128
99.958	0.042	nonzero	0.000	0.000	0.000	0.000	0.000	0.000	0.000	0.002	my8044_rel_o2nofp.cz12a_c32r128
99.958	0.042	nonzero	nonzero	0.000	0.000	0.000	0.000	0.000	0.000	0.004	my8407_rel_o2nofp.cz12a_c32r128
99.956	0.044	nonzero	0.000	0.000	0.000	0.000	0.000	0.000	0.000	0.004	my9400_rel_o2nofp.cz12a_c32r128
99.961	0.039	nonzero	0.000	0.000	0.000	0.000	0.000	0.000	0.000	0.003	my9500_rel_o2nofp.cz12a_c32r128
99.960	0.039	nonzero	0.000	0.000	0.000	0.000	0.000	0.000	0.000	0.003	my9500_rel_o2nofp.cz13a_c32r128
Insert response time histogram
256us	1ms	4ms	16ms	64ms	256ms	1s	4s	16s	gt	max	tag
0.000	0.000	94.215	5.785	0.000	0.000	0.000	0.000	0.000	0.000	0.007	my5651_rel_o2nofp.cz12a_c32r128
0.000	0.000	99.998	0.002	0.000	0.000	0.000	0.000	0.000	0.000	0.004	my5744_rel_o2nofp.cz12a_c32r128
0.000	0.000	98.965	1.035	0.000	0.000	0.000	0.000	0.000	0.000	0.005	my8044_rel_o2nofp.cz12a_c32r128
0.000	0.000	99.123	0.877	0.000	0.000	0.000	0.000	0.000	0.000	0.016	my8407_rel_o2nofp.cz12a_c32r128
0.000	0.000	98.676	1.324	0.000	0.000	0.000	0.000	0.000	0.000	0.015	my9400_rel_o2nofp.cz12a_c32r128
0.000	0.000	98.998	0.993	0.009	0.000	0.000	0.000	0.000	0.000	0.022	my9500_rel_o2nofp.cz12a_c32r128
0.000	0.000	99.301	0.694	0.005	0.000	0.000	0.000	0.000	0.000	0.019	my9500_rel_o2nofp.cz13a_c32r128
Delete response time histogram
256us	1ms	4ms	16ms	64ms	256ms	1s	4s	16s	gt	max	tag
0.000	1.282	95.282	3.435	0.000	0.000	0.000	0.000	0.000	0.000	0.006	my5651_rel_o2nofp.cz12a_c32r128
0.000	1.259	98.738	0.002	0.000	0.000	0.000	0.000	0.000	0.000	0.004	my5744_rel_o2nofp.cz12a_c32r128
0.000	0.000	98.977	1.023	0.000	0.000	0.000	0.000	0.000	0.000	0.005	my8044_rel_o2nofp.cz12a_c32r128
0.000	0.000	99.132	0.868	0.000	0.000	0.000	0.000	0.000	0.000	0.013	my8407_rel_o2nofp.cz12a_c32r128
0.000	0.000	98.715	1.282	0.002	0.000	0.000	0.000	0.000	0.000	0.017	my9400_rel_o2nofp.cz12a_c32r128
0.000	0.000	99.030	0.961	0.009	0.000	0.000	0.000	0.000	0.000	0.018	my9500_rel_o2nofp.cz12a_c32r128
0.000	0.000	99.347	0.648	0.005	0.000	0.000	0.000	0.000	0.000	0.020	my9500_rel_o2nofp.cz13a_c32r128
qr500.L3
- qr500.L3: range queries with 500 insert/s per client
- Legend for results is here.
- Each entry lists the percentage of responses that fit in that bucket (slower than max time for previous bucket, faster than min time for next bucket).
Query response time histogram
256us	1ms	4ms	16ms	64ms	256ms	1s	4s	16s	gt	max	tag
99.892	0.092	0.015	0.001	0.000	0.000	0.000	0.000	0.000	0.000	0.007	my5651_rel_o2nofp.cz12a_c32r128
99.988	0.011	nonzero	nonzero	0.000	0.000	0.000	0.000	0.000	0.000	0.004	my5744_rel_o2nofp.cz12a_c32r128
99.978	0.021	nonzero	0.000	0.000	0.000	0.000	0.000	0.000	0.000	0.003	my8044_rel_o2nofp.cz12a_c32r128
99.974	0.026	nonzero	0.000	0.000	0.000	0.000	0.000	0.000	0.000	0.004	my8407_rel_o2nofp.cz12a_c32r128
99.977	0.023	nonzero	0.000	0.000	0.000	0.000	0.000	0.000	0.000	0.003	my9400_rel_o2nofp.cz12a_c32r128
99.979	0.020	nonzero	0.000	0.000	nonzero	0.000	0.000	0.000	0.000	0.085	my9500_rel_o2nofp.cz12a_c32r128
99.977	0.023	nonzero	nonzero	nonzero	nonzero	0.000	0.000	0.000	0.000	0.101	my9500_rel_o2nofp.cz13a_c32r128
Insert response time histogram
256us	1ms	4ms	16ms	64ms	256ms	1s	4s	16s	gt	max	tag
0.000	0.003	73.542	26.444	0.011	0.000	0.000	0.000	0.000	0.000	0.023	my5651_rel_o2nofp.cz12a_c32r128
0.000	nonzero	99.661	0.334	0.005	0.000	0.000	0.000	0.000	0.000	0.024	my5744_rel_o2nofp.cz12a_c32r128
0.000	0.000	99.903	0.088	0.008	nonzero	0.000	0.000	0.000	0.000	0.066	my8044_rel_o2nofp.cz12a_c32r128
0.000	0.000	99.623	0.372	0.005	0.000	0.000	0.000	0.000	0.000	0.021	my8407_rel_o2nofp.cz12a_c32r128
0.000	0.000	99.656	0.340	0.003	0.000	0.000	0.000	0.000	0.000	0.022	my9400_rel_o2nofp.cz12a_c32r128
0.000	0.000	99.654	0.333	0.013	0.000	0.000	0.000	0.000	0.000	0.029	my9500_rel_o2nofp.cz12a_c32r128
0.000	0.000	99.938	0.033	0.022	0.007	0.000	0.000	0.000	0.000	0.137	my9500_rel_o2nofp.cz13a_c32r128
Delete response time histogram
256us	1ms	4ms	16ms	64ms	256ms	1s	4s	16s	gt	max	tag
0.000	0.046	81.539	18.409	0.006	0.000	0.000	0.000	0.000	0.000	0.024	my5651_rel_o2nofp.cz12a_c32r128
0.000	0.303	99.548	0.144	0.005	0.000	0.000	0.000	0.000	0.000	0.024	my5744_rel_o2nofp.cz12a_c32r128
0.000	0.000	99.929	0.063	0.007	nonzero	0.000	0.000	0.000	0.000	0.064	my8044_rel_o2nofp.cz12a_c32r128
0.000	0.000	99.732	0.265	0.003	0.000	0.000	0.000	0.000	0.000	0.019	my8407_rel_o2nofp.cz12a_c32r128
0.000	0.007	99.773	0.216	0.004	0.000	0.000	0.000	0.000	0.000	0.024	my9400_rel_o2nofp.cz12a_c32r128
0.000	nonzero	99.771	0.217	0.012	0.000	0.000	0.000	0.000	0.000	0.031	my9500_rel_o2nofp.cz12a_c32r128
0.000	0.001	99.958	0.022	0.014	0.005	0.000	0.000	0.000	0.000	0.123	my9500_rel_o2nofp.cz13a_c32r128
qp500.L4
- qp500.L4: point queries with 500 insert/s per client
- Legend for results is here.
- Each entry lists the percentage of responses that fit in that bucket (slower than max time for previous bucket, faster than min time for next bucket).
Query response time histogram
256us	1ms	4ms	16ms	64ms	256ms	1s	4s	16s	gt	max	tag
99.860	0.125	0.015	nonzero	0.000	0.000	0.000	0.000	0.000	0.000	0.008	my5651_rel_o2nofp.cz12a_c32r128
99.960	0.040	nonzero	nonzero	nonzero	0.000	0.000	0.000	0.000	0.000	0.022	my5744_rel_o2nofp.cz12a_c32r128
99.878	0.122	nonzero	0.000	0.000	0.000	0.000	0.000	0.000	0.000	0.002	my8044_rel_o2nofp.cz12a_c32r128
99.856	0.143	nonzero	0.000	0.000	0.000	0.000	0.000	0.000	0.000	0.002	my8407_rel_o2nofp.cz12a_c32r128
99.841	0.158	0.001	nonzero	0.000	0.000	0.000	0.000	0.000	0.000	0.005	my9400_rel_o2nofp.cz12a_c32r128
99.878	0.121	nonzero	0.000	0.000	0.000	0.000	0.000	0.000	0.000	0.004	my9500_rel_o2nofp.cz12a_c32r128
99.876	0.124	nonzero	0.000	0.000	0.000	0.000	0.000	0.000	0.000	0.002	my9500_rel_o2nofp.cz13a_c32r128
Insert response time histogram
256us	1ms	4ms	16ms	64ms	256ms	1s	4s	16s	gt	max	tag
0.000	0.003	75.660	24.294	0.016	0.018	0.009	0.000	0.000	0.000	0.703	my5651_rel_o2nofp.cz12a_c32r128
0.000	0.000	99.612	0.377	0.006	0.006	0.000	0.000	0.000	0.000	0.142	my5744_rel_o2nofp.cz12a_c32r128
0.000	0.000	99.779	0.219	0.003	0.000	0.000	0.000	0.000	0.000	0.028	my8044_rel_o2nofp.cz12a_c32r128
0.000	0.000	99.894	0.104	0.003	0.000	0.000	0.000	0.000	0.000	0.023	my8407_rel_o2nofp.cz12a_c32r128
0.000	0.000	99.356	0.633	0.011	0.000	0.000	0.000	0.000	0.000	0.026	my9400_rel_o2nofp.cz12a_c32r128
0.000	0.000	99.483	0.500	0.016	0.000	0.000	0.000	0.000	0.000	0.061	my9500_rel_o2nofp.cz12a_c32r128
0.000	0.000	99.823	0.169	0.008	0.000	0.000	0.000	0.000	0.000	0.029	my9500_rel_o2nofp.cz13a_c32r128
Delete response time histogram
256us	1ms	4ms	16ms	64ms	256ms	1s	4s	16s	gt	max	tag
0.000	0.049	83.956	15.962	0.010	0.015	0.008	0.000	0.000	0.000	0.709	my5651_rel_o2nofp.cz12a_c32r128
0.000	1.634	98.186	0.172	0.004	0.004	0.000	0.000	0.000	0.000	0.141	my5744_rel_o2nofp.cz12a_c32r128
0.000	0.000	99.829	0.168	0.003	0.000	0.000	0.000	0.000	0.000	0.021	my8044_rel_o2nofp.cz12a_c32r128
0.000	0.000	99.927	0.069	0.004	0.000	0.000	0.000	0.000	0.000	0.026	my8407_rel_o2nofp.cz12a_c32r128
0.000	0.000	99.662	0.332	0.006	0.000	0.000	0.000	0.000	0.000	0.024	my9400_rel_o2nofp.cz12a_c32r128
0.000	0.000	99.649	0.337	0.014	0.000	0.000	0.000	0.000	0.000	0.060	my9500_rel_o2nofp.cz12a_c32r128
0.000	0.000	99.862	0.131	0.007	0.000	0.000	0.000	0.000	0.000	0.024	my9500_rel_o2nofp.cz13a_c32r128
qr1000.L5
- qr1000.L5: range queries with 1000 insert/s per client
- Legend for results is here.
- Each entry lists the percentage of responses that fit in that bucket (slower than max time for previous bucket, faster than min time for next bucket).
Query response time histogram
256us	1ms	4ms	16ms	64ms	256ms	1s	4s	16s	gt	max	tag
99.698	0.275	0.025	0.002	nonzero	nonzero	nonzero	0.000	0.000	0.000	0.629	my5651_rel_o2nofp.cz12a_c32r128
99.969	0.029	0.002	nonzero	nonzero	nonzero	0.000	0.000	0.000	0.000	0.100	my5744_rel_o2nofp.cz12a_c32r128
99.943	0.056	0.001	nonzero	0.000	0.000	0.000	0.000	0.000	0.000	0.005	my8044_rel_o2nofp.cz12a_c32r128
99.935	0.064	0.001	nonzero	0.000	0.000	0.000	0.000	0.000	0.000	0.007	my8407_rel_o2nofp.cz12a_c32r128
99.936	0.063	0.002	nonzero	0.000	0.000	0.000	0.000	0.000	0.000	0.006	my9400_rel_o2nofp.cz12a_c32r128
99.954	0.046	nonzero	nonzero	nonzero	0.000	0.000	0.000	0.000	0.000	0.048	my9500_rel_o2nofp.cz12a_c32r128
99.941	0.058	0.001	nonzero	0.000	0.000	0.000	0.000	0.000	0.000	0.004	my9500_rel_o2nofp.cz13a_c32r128
Insert response time histogram
256us	1ms	4ms	16ms	64ms	256ms	1s	4s	16s	gt	max	tag
0.000	0.013	51.075	48.802	0.080	0.018	0.012	0.000	0.000	0.000	0.654	my5651_rel_o2nofp.cz12a_c32r128
0.000	nonzero	98.669	1.322	0.006	0.000	0.003	0.000	0.000	0.000	0.400	my5744_rel_o2nofp.cz12a_c32r128
0.000	0.000	99.775	0.213	0.012	0.000	0.000	0.000	0.000	0.000	0.056	my8044_rel_o2nofp.cz12a_c32r128
0.000	0.000	99.507	0.481	0.011	nonzero	0.000	0.000	0.000	0.000	0.066	my8407_rel_o2nofp.cz12a_c32r128
0.000	0.000	99.603	0.383	0.014	0.000	0.000	0.000	0.000	0.000	0.030	my9400_rel_o2nofp.cz12a_c32r128
0.000	0.000	99.886	0.100	0.013	0.001	0.000	0.000	0.000	0.000	0.081	my9500_rel_o2nofp.cz12a_c32r128
0.000	0.000	99.779	0.210	0.011	0.000	0.000	0.000	0.000	0.000	0.039	my9500_rel_o2nofp.cz13a_c32r128
Delete response time histogram
256us	1ms	4ms	16ms	64ms	256ms	1s	4s	16s	gt	max	tag
0.000	0.032	62.646	37.237	0.059	0.015	0.011	0.000	0.000	0.000	0.790	my5651_rel_o2nofp.cz12a_c32r128
0.000	0.750	98.176	1.066	0.005	0.000	0.003	0.000	0.000	0.000	0.400	my5744_rel_o2nofp.cz12a_c32r128
0.000	0.002	99.884	0.103	0.011	0.000	0.000	0.000	0.000	0.000	0.056	my8044_rel_o2nofp.cz12a_c32r128
0.000	nonzero	99.751	0.240	0.009	0.000	0.000	0.000	0.000	0.000	0.056	my8407_rel_o2nofp.cz12a_c32r128
0.000	nonzero	99.792	0.197	0.011	0.000	0.000	0.000	0.000	0.000	0.031	my9400_rel_o2nofp.cz12a_c32r128
0.000	nonzero	99.952	0.036	0.011	0.001	0.000	0.000	0.000	0.000	0.078	my9500_rel_o2nofp.cz12a_c32r128
0.000	0.000	99.897	0.095	0.009	0.000	0.000	0.000	0.000	0.000	0.038	my9500_rel_o2nofp.cz13a_c32r128
qp1000.L6
- qp1000.L6: point queries with 1000 insert/s per client
- Legend for results is here.
- Each entry lists the percentage of responses that fit in that bucket (slower than max time for previous bucket, faster than min time for next bucket).
Query response time histogram
256us	1ms	4ms	16ms	64ms	256ms	1s	4s	16s	gt	max	tag
99.706	0.273	0.020	0.001	nonzero	0.000	0.000	0.000	0.000	0.000	0.017	my5651_rel_o2nofp.cz12a_c32r128
99.919	0.079	0.002	nonzero	0.000	0.000	0.000	0.000	0.000	0.000	0.007	my5744_rel_o2nofp.cz12a_c32r128
99.691	0.307	0.002	nonzero	0.000	0.000	0.000	0.000	0.000	0.000	0.006	my8044_rel_o2nofp.cz12a_c32r128
99.662	0.336	0.002	nonzero	0.000	0.000	0.000	0.000	0.000	0.000	0.009	my8407_rel_o2nofp.cz12a_c32r128
99.684	0.314	0.001	nonzero	0.000	0.000	0.000	0.000	0.000	0.000	0.004	my9400_rel_o2nofp.cz12a_c32r128
99.754	0.245	0.001	nonzero	0.000	0.000	0.000	0.000	0.000	0.000	0.005	my9500_rel_o2nofp.cz12a_c32r128
99.717	0.282	0.001	nonzero	0.000	0.000	0.000	0.000	0.000	0.000	0.006	my9500_rel_o2nofp.cz13a_c32r128
Insert response time histogram
256us	1ms	4ms	16ms	64ms	256ms	1s	4s	16s	gt	max	tag
0.000	0.073	68.102	31.663	0.155	0.006	0.001	0.000	0.000	0.000	0.727	my5651_rel_o2nofp.cz12a_c32r128
0.000	0.001	98.634	1.356	0.009	0.000	0.000	0.000	0.000	0.000	0.052	my5744_rel_o2nofp.cz12a_c32r128
0.000	0.000	99.571	0.419	0.010	0.000	0.000	0.000	0.000	0.000	0.032	my8044_rel_o2nofp.cz12a_c32r128
0.000	0.000	99.611	0.376	0.013	nonzero	0.000	0.000	0.000	0.000	0.072	my8407_rel_o2nofp.cz12a_c32r128
0.000	0.000	99.731	0.257	0.012	0.000	0.000	0.000	0.000	0.000	0.057	my9400_rel_o2nofp.cz12a_c32r128
0.000	0.000	99.674	0.314	0.013	0.000	0.000	0.000	0.000	0.000	0.042	my9500_rel_o2nofp.cz12a_c32r128
0.000	0.000	99.642	0.343	0.015	nonzero	0.000	0.000	0.000	0.000	0.074	my9500_rel_o2nofp.cz13a_c32r128
Delete response time histogram
256us	1ms	4ms	16ms	64ms	256ms	1s	4s	16s	gt	max	tag
0.000	0.677	76.117	23.066	0.133	0.006	0.001	0.000	0.000	0.000	0.727	my5651_rel_o2nofp.cz12a_c32r128
0.000	1.163	97.759	1.069	0.009	0.000	0.000	0.000	0.000	0.000	0.051	my5744_rel_o2nofp.cz12a_c32r128
0.000	nonzero	99.773	0.218	0.008	0.000	0.000	0.000	0.000	0.000	0.036	my8044_rel_o2nofp.cz12a_c32r128
0.000	nonzero	99.814	0.175	0.010	0.000	0.000	0.000	0.000	0.000	0.058	my8407_rel_o2nofp.cz12a_c32r128
0.000	0.000	99.876	0.113	0.010	0.000	0.000	0.000	0.000	0.000	0.057	my9400_rel_o2nofp.cz12a_c32r128
0.000	nonzero	99.809	0.179	0.011	0.000	0.000	0.000	0.000	0.000	0.035	my9500_rel_o2nofp.cz12a_c32r128
0.000	0.000	99.837	0.150	0.012	nonzero	0.000	0.000	0.000	0.000	0.073	my9500_rel_o2nofp.cz13a_c32r128