Introduction
This is a report for the insert benchmark with 2000M docs and 8 client(s). It is generated by scripts (bash, awk, sed) and Tufte might not be impressed. An overview of the insert benchmark is here and a short update is here. Below, by DBMS, I mean DBMS+version.config. An example is my8020.c10b40 where my means MySQL, 8020 is version 8.0.20 and c10b40 is the name for the configuration file.
The test server has 24 cores, 2 sockets, 64G RAM and 1 NVMe devices. The benchmark was run with 8 clients and there were 1 or 3 connections per client (1 for queries or inserts without rate limits, 1+1 for rate limited inserts+deletes). It uses 8 tables with a table per client. It loads 250M rows per table without secondary indexes, creates 3 secondary indexes per table, then inserts 4m+1m rows per table with a delete per insert to avoid growing the table. It then does 6 read+write tests for 1800s each that do queries as fast as possible with 100,100,500,500,1000,1000 inserts/s and the same for deletes/s per client concurrent with the queries. The database is larger than RAM and most tests are IO-bound except for the range query (qr*) tests that frequently have a cached working set. Clients and the DBMS share one server.
The tested DBMS are:
- my8407_rel_o2nofp.cz12a_c24r64 - MySQL 8.4.7 with the cz12a_c24r64 config
- my8407_rel_o2nofp.cz12a_nocb_c24r64 - MySQL 8.4.7 with the cz12a_nocb_c24r64 config that disabled the InnoDB change buffer
- pg181_o2nofp.cx10b_c24r64 - Postgres 18.1 with the cx10b_24r64 config
Contents
- Summary
- l.i0: load without secondary indexes
- l.x: create secondary indexes
- l.i1: continue load after secondary indexes created with 50 inserts per transaction
- l.i2: continue load after secondary indexes created with 5 inserts per transaction
- qr100.L1: range queries with 100 insert/s per client
- qp100.L2: point queries with 100 insert/s per client
- qr500.L3: range queries with 500 insert/s per client
- qp500.L4: point queries with 500 insert/s per client
- qr1000.L5: range queries with 1000 insert/s per client
- qp1000.L6: point queries with 1000 insert/s per client
Summary
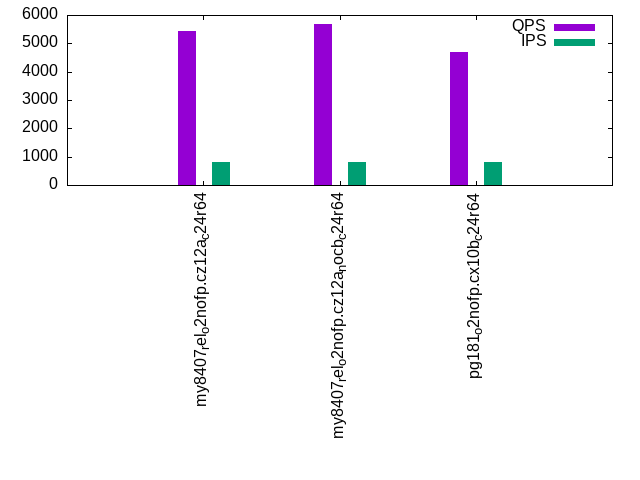
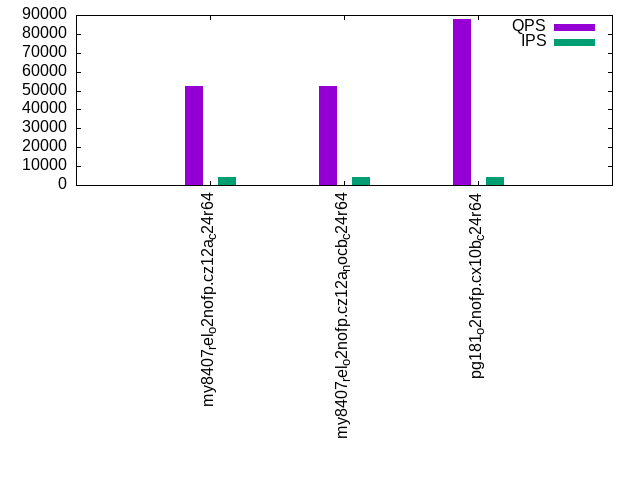
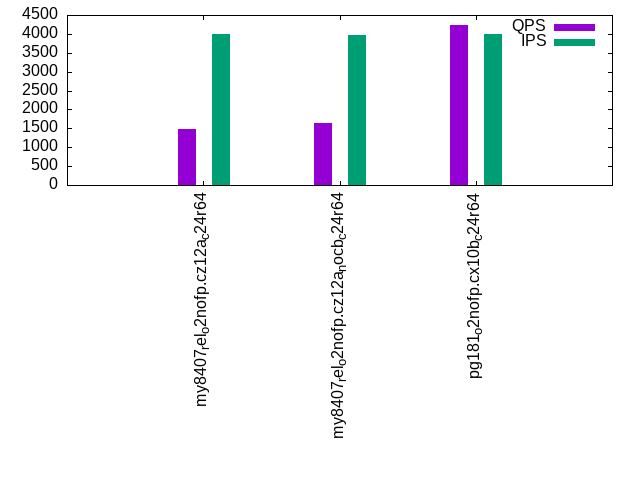
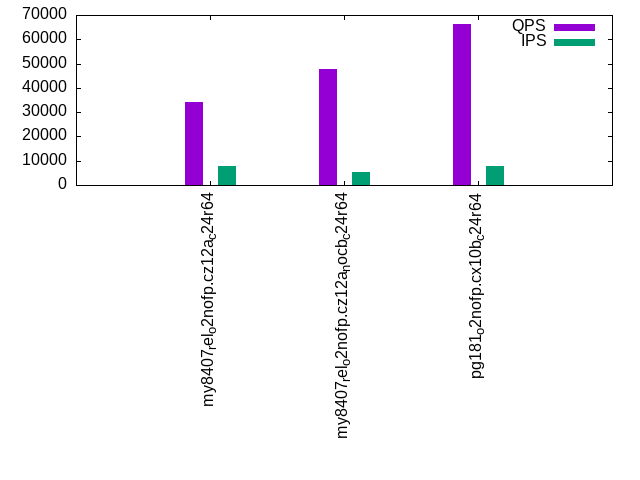
The numbers are inserts/s for l.i0, l.i1 and l.i2, indexed docs (or rows) /s for l.x and queries/s for qr100, qp100 thru qr1000, qp1000" The values are the average rate over the entire test for inserts (IPS) and queries (QPS). The range of values for IPS and QPS is split into 3 parts: bottom 25%, middle 50%, top 25%. Values in the bottom 25% have a red background, values in the top 25% have a green background and values in the middle have no color. A gray background is used for values that can be ignored because the DBMS did not sustain the target insert rate. Red backgrounds are not used when the minimum value is within 80% of the max value.
| dbms | l.i0 | l.x | l.i1 | l.i2 | qr100 | qp100 | qr500 | qp500 | qr1000 | qp1000 |
|---|---|---|---|---|---|---|---|---|---|---|
| my8407_rel_o2nofp.cz12a_c24r64 | 485084 | 557880 | 7039 | 1732 | 59437 | 5434 | 52443 | 1484 | 34162 | 1519 |
| my8407_rel_o2nofp.cz12a_nocb_c24r64 | 471365 | 540248 | 3801 | 4352 | 59136 | 5673 | 52590 | 1650 | 47868 | 926 |
| pg181_o2nofp.cx10b_c24r64 | 752729 | 1356852 | 13457 | 1338 | 98949 | 4679 | 87743 | 4232 | 66129 | 3599 |
This table has relative throughput, throughput for the DBMS relative to the DBMS in the first line, using the absolute throughput from the previous table. Values less than 0.95 have a yellow background. Values greater than 1.05 have a blue background.
| dbms | l.i0 | l.x | l.i1 | l.i2 | qr100 | qp100 | qr500 | qp500 | qr1000 | qp1000 |
|---|---|---|---|---|---|---|---|---|---|---|
| my8407_rel_o2nofp.cz12a_c24r64 | 1.00 | 1.00 | 1.00 | 1.00 | 1.00 | 1.00 | 1.00 | 1.00 | 1.00 | 1.00 |
| my8407_rel_o2nofp.cz12a_nocb_c24r64 | 0.97 | 0.97 | 0.54 | 2.51 | 0.99 | 1.04 | 1.00 | 1.11 | 1.40 | 0.61 |
| pg181_o2nofp.cx10b_c24r64 | 1.55 | 2.43 | 1.91 | 0.77 | 1.66 | 0.86 | 1.67 | 2.85 | 1.94 | 2.37 |
This lists the average rate of inserts/s for the tests that do inserts concurrent with queries. For such tests the query rate is listed in the table above. The read+write tests are setup so that the insert rate should match the target rate every second. Cells that are not at least 95% of the target have a red background to indicate a failure to satisfy the target.
| dbms | qr100.L1 | qp100.L2 | qr500.L3 | qp500.L4 | qr1000.L5 | qp1000.L6 |
|---|---|---|---|---|---|---|
| my8407_rel_o2nofp.cz12a_c24r64 | 796 | 797 | 3984 | 3984 | 7960 | 7951 |
| my8407_rel_o2nofp.cz12a_nocb_c24r64 | 796 | 797 | 3984 | 3982 | 5152 | 4810 |
| pg181_o2nofp.cx10b_c24r64 | 796 | 796 | 3984 | 3984 | 7969 | 7965 |
| target | 800 | 800 | 4000 | 4000 | 8000 | 8000 |
l.i0
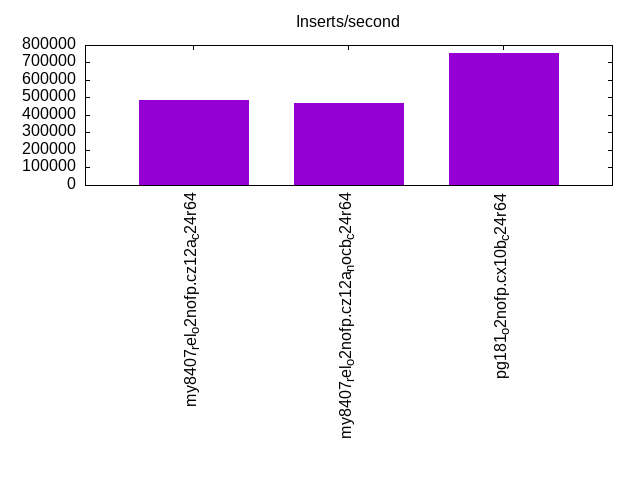
l.i0: load without secondary indexes. Graphs for performance per 1-second interval are here.
Average throughput:
Insert response time histogram: each cell has the percentage of responses that take <= the time in the header and max is the max response time in seconds. For the max column values in the top 25% of the range have a red background and in the bottom 25% of the range have a green background. The red background is not used when the min value is within 80% of the max value.
| dbms | 256us | 1ms | 4ms | 16ms | 64ms | 256ms | 1s | 4s | 16s | gt | max |
|---|---|---|---|---|---|---|---|---|---|---|---|
| my8407_rel_o2nofp.cz12a_c24r64 | 99.700 | 0.222 | 0.063 | 0.014 | 0.002 | 0.281 | |||||
| my8407_rel_o2nofp.cz12a_nocb_c24r64 | 99.697 | 0.229 | 0.059 | 0.014 | 0.002 | 0.277 | |||||
| pg181_o2nofp.cx10b_c24r64 | 25.879 | 74.086 | 0.026 | 0.008 | nonzero | nonzero | 0.444 |
Performance metrics for the DBMS listed above. Some are normalized by throughput, others are not. Legend for results is here.
ips	qps	rps	rmbps	wps	wmbps	rpq	rkbpq	wpi	wkbpi	csps	cpups	cspq	cpupq	dbgb1	dbgb2	rss	maxop	p50	p99	tag
485084	0	1	0.0	3262.7	181.3	0.000	0.000	0.007	0.383	94996	46.9	0.196	23	131.1	274.6	48.7	0.281	63292	42795	my8407_rel_o2nofp.cz12a_c24r64
471365	0	1	0.0	3166.8	176.1	0.000	0.000	0.007	0.382	93007	47.0	0.197	24	131.1	274.6	47.8	0.277	60793	42093	my8407_rel_o2nofp.cz12a_nocb_c24r64
752729	0	543	4.5	2699.7	301.9	0.001	0.006	0.004	0.411	74366	52.2	0.099	17	191.4	255.4	47.5	0.444	95788	83485	pg181_o2nofp.cx10b_c24r64
Average values from iostat.
r/s	rkB/s	rrqm/s	%rrqm	r_await	rareq-s	w/s	wkB/s	wrqm/s	%wrqm	w_await	wareq-s	d/s	dkB/s	drqm/s	%drqm	d_await	dareq-s	f/s	f_await	aqu-sz	%util
0.947	9.890	0.000	0.000	3.024	5.618	3262.7	185629	59.39	1.903	8.165	57.33	0.404	3.106	0.000	0.000	0.134	3.333	0.000	0.000	27.02	12.19		my8407_rel_o2nofp.cz12a_c24r64
1.005	10.05	0.000	0.000	2.513	5.614	3166.8	180281	57.84	1.908	7.990	57.39	0.329	2.994	0.000	0.000	0.127	3.932	0.000	0.000	25.62	11.85		my8407_rel_o2nofp.cz12a_nocb_c24r64
542.7	4650.1	0.044	0.272	0.807	4.648	2699.7	309127	115.3	3.341	2.814	117.6	0.297	198.8	0.000	0.000	0.082	78.35	0.000	0.000	8.605	16.96		pg181_o2nofp.cx10b_c24r64
l.x
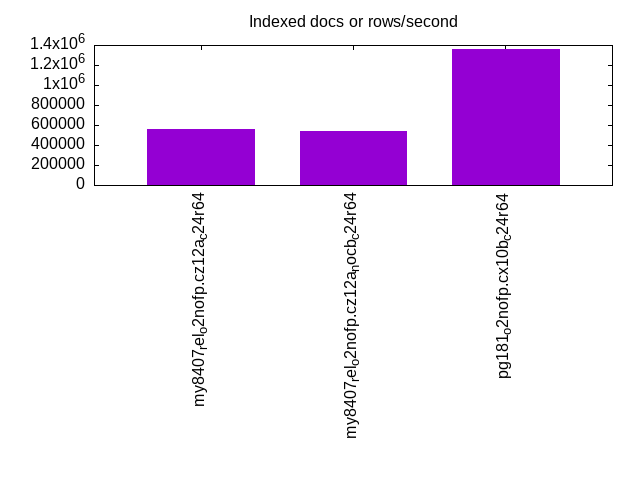
l.x: create secondary indexes.
Average throughput:
Performance metrics for the DBMS listed above. Some are normalized by throughput, others are not. Legend for results is here.
ips	qps	rps	rmbps	wps	wmbps	rpq	rkbpq	wpi	wkbpi	csps	cpups	cspq	cpupq	dbgb1	dbgb2	rss	maxop	p50	p99	tag
557880	0	7597	732.8	17195.2	816.4	0.014	1.345	0.031	1.499	47035	38.4	0.084	17	301.8	445.2	47.7	0.003	NA	NA	my8407_rel_o2nofp.cz12a_c24r64
540248	0	7349	708.5	16634.9	790.7	0.014	1.343	0.031	1.499	46806	37.2	0.087	17	301.8	445.2	48.1	0.045	NA	NA	my8407_rel_o2nofp.cz12a_nocb_c24r64
1356852	0	7388	380.1	3150.0	385.3	0.005	0.287	0.002	0.291	20692	25.7	0.015	5	384.2	448.3	24.4	0.003	NA	NA	pg181_o2nofp.cx10b_c24r64
Average values from iostat.
r/s	rkB/s	rrqm/s	%rrqm	r_await	rareq-s	w/s	wkB/s	wrqm/s	%wrqm	w_await	wareq-s	d/s	dkB/s	drqm/s	%drqm	d_await	dareq-s	f/s	f_await	aqu-sz	%util
7597.0	750373	0.000	0.000	1.025	115.6	17195.2	835992	111.4	0.690	17.18	73.27	11.04	90250.6	0.000	0.000	0.095	920.8	0.000	0.000	194.5	98.55		my8407_rel_o2nofp.cz12a_c24r64
7348.9	725481	0.000	0.000	1.066	116.6	16634.9	809718	109.5	0.675	17.92	73.25	10.55	87446.4	0.000	0.000	0.091	930.3	0.000	0.000	196.3	98.61		my8407_rel_o2nofp.cz12a_nocb_c24r64
7387.9	389271	0.052	0.001	0.279	74.71	3150.0	394535	58.06	2.360	14.70	123.9	3.482	98580.5	0.000	0.000	0.280	1597.2	0.000	0.000	48.64	55.66		pg181_o2nofp.cx10b_c24r64
l.i1
l.i1: continue load after secondary indexes created with 50 inserts per transaction. Graphs for performance per 1-second interval are here.
Average throughput:

Insert response time histogram: each cell has the percentage of responses that take <= the time in the header and max is the max response time in seconds. For the max column values in the top 25% of the range have a red background and in the bottom 25% of the range have a green background. The red background is not used when the min value is within 80% of the max value.
| dbms | 256us | 1ms | 4ms | 16ms | 64ms | 256ms | 1s | 4s | 16s | gt | max |
|---|---|---|---|---|---|---|---|---|---|---|---|
| my8407_rel_o2nofp.cz12a_c24r64 | 0.008 | 25.345 | 43.386 | 30.698 | 0.563 | 0.787 | |||||
| my8407_rel_o2nofp.cz12a_nocb_c24r64 | 0.338 | 11.355 | 87.948 | 0.360 | 0.575 | ||||||
| pg181_o2nofp.cx10b_c24r64 | 78.647 | 21.016 | 0.290 | 0.048 | nonzero | 2.409 |
Delete response time histogram: each cell has the percentage of responses that take <= the time in the header and max is the max response time in seconds. For the max column values in the top 25% of the range have a red background and in the bottom 25% of the range have a green background. The red background is not used when the min value is within 80% of the max value.
| dbms | 256us | 1ms | 4ms | 16ms | 64ms | 256ms | 1s | 4s | 16s | gt | max |
|---|---|---|---|---|---|---|---|---|---|---|---|
| my8407_rel_o2nofp.cz12a_c24r64 | 27.798 | 57.065 | 13.238 | 1.830 | 0.070 | 0.755 | |||||
| my8407_rel_o2nofp.cz12a_nocb_c24r64 | 6.438 | 37.432 | 56.121 | 0.009 | 0.340 | ||||||
| pg181_o2nofp.cx10b_c24r64 | 0.779 | 6.533 | 19.977 | 72.702 | 0.009 | 0.251 |
Performance metrics for the DBMS listed above. Some are normalized by throughput, others are not. Legend for results is here.
ips	qps	rps	rmbps	wps	wmbps	rpq	rkbpq	wpi	wkbpi	csps	cpups	cspq	cpupq	dbgb1	dbgb2	rss	maxop	p50	p99	tag
7039	0	15240	238.1	22142.1	659.1	2.165	34.641	3.146	95.886	138214	20.1	19.635	685	405.8	560.7	48.5	0.787	800	250	my8407_rel_o2nofp.cz12a_c24r64
3801	0	18268	285.4	23992.4	689.7	4.806	76.891	6.312	185.804	152877	14.4	40.217	909	359.9	506.5	48.7	0.575	500	300	my8407_rel_o2nofp.cz12a_nocb_c24r64
13457	0	17245	138.6	20272.2	340.2	1.282	10.548	1.506	25.891	42912	31.6	3.189	564	389.4	453.5	48.5	2.409	2050	700	pg181_o2nofp.cx10b_c24r64
Average values from iostat.
r/s	rkB/s	rrqm/s	%rrqm	r_await	rareq-s	w/s	wkB/s	wrqm/s	%wrqm	w_await	wareq-s	d/s	dkB/s	drqm/s	%drqm	d_await	dareq-s	f/s	f_await	aqu-sz	%util
15240.2	243841	0.000	0.000	1.024	16.00	22142.1	674952	51.51	0.270	15.44	30.79	0.013	0.602	0.000	0.000	0.017	2.099	0.000	0.000	358.1	99.50		my8407_rel_o2nofp.cz12a_c24r64
18267.8	292284	0.001	0.000	0.899	16.00	23992.4	706297	15.14	0.088	15.63	29.62	0.022	0.207	0.000	0.000	0.073	0.939	0.000	0.000	391.5	99.99		my8407_rel_o2nofp.cz12a_nocb_c24r64
17245.1	141946	0.208	0.001	0.125	8.258	20272.2	348399	92.38	0.535	0.539	19.82	0.352	4975.5	0.000	0.000	0.021	156.7	0.000	0.000	16.30	77.30		pg181_o2nofp.cx10b_c24r64
l.i2
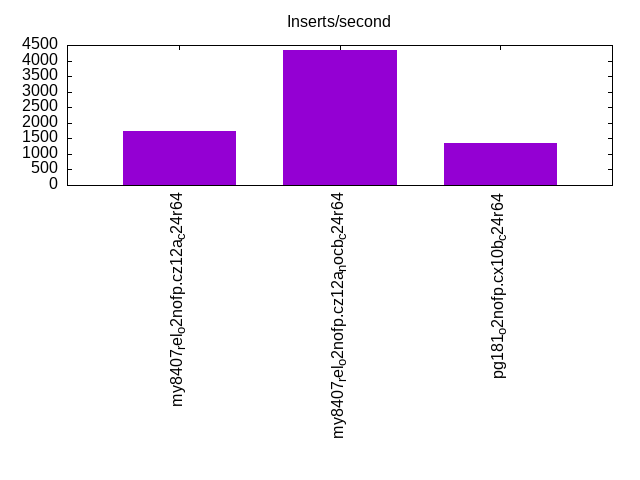
l.i2: continue load after secondary indexes created with 5 inserts per transaction. Graphs for performance per 1-second interval are here.
Average throughput:
Insert response time histogram: each cell has the percentage of responses that take <= the time in the header and max is the max response time in seconds. For the max column values in the top 25% of the range have a red background and in the bottom 25% of the range have a green background. The red background is not used when the min value is within 80% of the max value.
| dbms | 256us | 1ms | 4ms | 16ms | 64ms | 256ms | 1s | 4s | 16s | gt | max |
|---|---|---|---|---|---|---|---|---|---|---|---|
| my8407_rel_o2nofp.cz12a_c24r64 | 3.421 | 7.497 | 37.050 | 49.074 | 2.957 | 0.001 | 0.730 | ||||
| my8407_rel_o2nofp.cz12a_nocb_c24r64 | 0.064 | 14.735 | 76.549 | 8.510 | 0.142 | 0.001 | 0.479 | ||||
| pg181_o2nofp.cx10b_c24r64 | 13.469 | 86.530 | 0.001 | 0.006 |
Delete response time histogram: each cell has the percentage of responses that take <= the time in the header and max is the max response time in seconds. For the max column values in the top 25% of the range have a red background and in the bottom 25% of the range have a green background. The red background is not used when the min value is within 80% of the max value.
| dbms | 256us | 1ms | 4ms | 16ms | 64ms | 256ms | 1s | 4s | 16s | gt | max |
|---|---|---|---|---|---|---|---|---|---|---|---|
| my8407_rel_o2nofp.cz12a_c24r64 | 3.674 | 14.657 | 36.820 | 43.285 | 1.564 | 0.001 | 0.735 | ||||
| my8407_rel_o2nofp.cz12a_nocb_c24r64 | 0.264 | 21.748 | 72.699 | 5.236 | 0.053 | 0.001 | 0.480 | ||||
| pg181_o2nofp.cx10b_c24r64 | 99.999 | 0.001 | 0.160 |
Performance metrics for the DBMS listed above. Some are normalized by throughput, others are not. Legend for results is here.
ips	qps	rps	rmbps	wps	wmbps	rpq	rkbpq	wpi	wkbpi	csps	cpups	cspq	cpupq	dbgb1	dbgb2	rss	maxop	p50	p99	tag
1732	0	16043	250.7	20832.9	589.2	9.265	148.241	12.031	348.455	141637	15.8	81.796	2190	405.8	562.5	48.5	0.730	135	85	my8407_rel_o2nofp.cz12a_c24r64
4352	0	18992	296.7	24513.8	692.4	4.363	69.815	5.632	162.909	190691	20.0	43.812	1103	359.9	508.1	48.7	0.479	545	425	my8407_rel_o2nofp.cz12a_nocb_c24r64
1338	0	1684	13.5	2314.9	36.0	1.259	10.312	1.730	27.533	9906	32.4	7.405	5813	390.8	454.8	48.5	0.006	170	150	pg181_o2nofp.cx10b_c24r64
Average values from iostat.
r/s	rkB/s	rrqm/s	%rrqm	r_await	rareq-s	w/s	wkB/s	wrqm/s	%wrqm	w_await	wareq-s	d/s	dkB/s	drqm/s	%drqm	d_await	dareq-s	f/s	f_await	aqu-sz	%util
16043.4	256695	0.000	0.000	0.745	16.00	20832.9	603384	6.000	0.029	15.21	28.96	0.021	0.119	0.000	0.000	0.076	0.501	0.000	0.000	328.8	99.09		my8407_rel_o2nofp.cz12a_c24r64
18992.0	303872	0.000	0.000	0.928	16.00	24513.8	709059	2.281	0.011	15.63	28.93	0.041	0.327	0.000	0.000	0.150	1.330	0.000	0.000	400.6	99.98		my8407_rel_o2nofp.cz12a_nocb_c24r64
1684.1	13794.8	0.001	0.000	0.087	8.181	2314.9	36831.5	12.59	0.470	0.051	16.12	0.015	0.267	0.000	0.000	0.015	0.501	0.000	0.000	0.263	16.08		pg181_o2nofp.cx10b_c24r64
qr100.L1
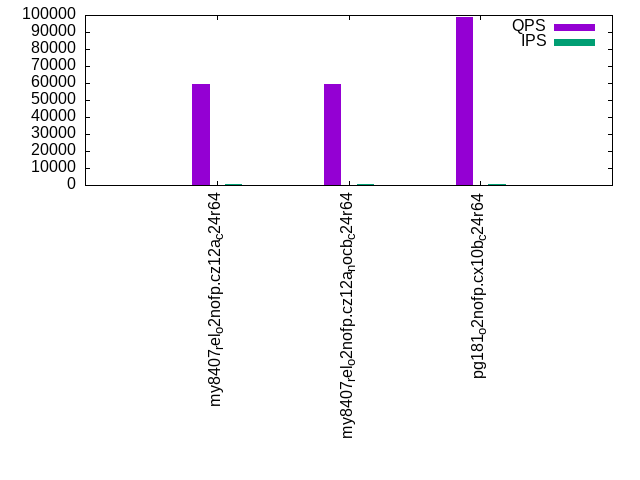
qr100.L1: range queries with 100 insert/s per client. Graphs for performance per 1-second interval are here.
Average throughput:
Query response time histogram: each cell has the percentage of responses that take <= the time in the header and max is the max response time in seconds. For max values in the top 25% of the range have a red background and in the bottom 25% of the range have a green background. The red background is not used when the min value is within 80% of the max value.
| dbms | 256us | 1ms | 4ms | 16ms | 64ms | 256ms | 1s | 4s | 16s | gt | max |
|---|---|---|---|---|---|---|---|---|---|---|---|
| my8407_rel_o2nofp.cz12a_c24r64 | 99.871 | 0.126 | 0.002 | nonzero | nonzero | 0.062 | |||||
| my8407_rel_o2nofp.cz12a_nocb_c24r64 | 99.870 | 0.129 | 0.001 | nonzero | nonzero | 0.028 | |||||
| pg181_o2nofp.cx10b_c24r64 | 99.994 | 0.006 | nonzero | 0.003 |
Insert response time histogram: each cell has the percentage of responses that take <= the time in the header and max is the max response time in seconds. For max values in the top 25% of the range have a red background and in the bottom 25% of the range have a green background. The red background is not used when the min value is within 80% of the max value.
| dbms | 256us | 1ms | 4ms | 16ms | 64ms | 256ms | 1s | 4s | 16s | gt | max |
|---|---|---|---|---|---|---|---|---|---|---|---|
| my8407_rel_o2nofp.cz12a_c24r64 | 52.226 | 41.094 | 6.681 | 0.181 | |||||||
| my8407_rel_o2nofp.cz12a_nocb_c24r64 | 49.330 | 50.670 | 0.053 | ||||||||
| pg181_o2nofp.cx10b_c24r64 | 99.819 | 0.181 | 0.021 |
Delete response time histogram: each cell has the percentage of responses that take <= the time in the header and max is the max response time in seconds. For max values in the top 25% of the range have a red background and in the bottom 25% of the range have a green background. The red background is not used when the min value is within 80% of the max value.
| dbms | 256us | 1ms | 4ms | 16ms | 64ms | 256ms | 1s | 4s | 16s | gt | max |
|---|---|---|---|---|---|---|---|---|---|---|---|
| my8407_rel_o2nofp.cz12a_c24r64 | 94.802 | 2.163 | 2.882 | 0.153 | 0.130 | ||||||
| my8407_rel_o2nofp.cz12a_nocb_c24r64 | 80.139 | 19.861 | 0.048 | ||||||||
| pg181_o2nofp.cx10b_c24r64 | 19.719 | 80.260 | 0.021 | 0.005 |
Performance metrics for the DBMS listed above. Some are normalized by throughput, others are not. Legend for results is here.
ips	qps	rps	rmbps	wps	wmbps	rpq	rkbpq	wpi	wkbpi	csps	cpups	cspq	cpupq	dbgb1	dbgb2	rss	maxop	p50	p99	tag
796	59437	3758	58.7	4117.7	117.2	0.063	1.012	5.170	150.758	362638	36.2	6.101	146	405.8	562.6	48.5	0.062	7503	6831	my8407_rel_o2nofp.cz12a_c24r64
796	59136	3492	54.6	3593.5	102.0	0.059	0.945	4.512	131.130	356326	35.9	6.026	146	359.9	508.2	48.7	0.028	7487	6751	my8407_rel_o2nofp.cz12a_nocb_c24r64
796	98949	1070	8.8	538.6	15.1	0.011	0.091	0.676	19.449	380488	33.5	3.845	81	390.8	454.9	48.6	0.003	12414	11838	pg181_o2nofp.cx10b_c24r64
Average values from iostat.
r/s	rkB/s	rrqm/s	%rrqm	r_await	rareq-s	w/s	wkB/s	wrqm/s	%wrqm	w_await	wareq-s	d/s	dkB/s	drqm/s	%drqm	d_await	dareq-s	f/s	f_await	aqu-sz	%util
3758.2	60130.9	0.000	0.000	0.320	16.00	4117.7	120064	2.158	0.056	10.82	29.27	0.003	0.013	0.000	0.000	0.006	0.066	0.000	0.000	47.66	20.83		my8407_rel_o2nofp.cz12a_c24r64
3492.1	55873.1	0.000	0.000	0.133	16.00	3593.5	104432	1.554	0.049	8.068	29.17	0.006	0.049	0.000	0.000	0.066	0.244	0.000	0.000	31.40	19.23		my8407_rel_o2nofp.cz12a_nocb_c24r64
1069.5	9033.6	0.000	0.000	0.099	8.440	538.6	15489.6	4.613	1.882	0.140	54.77	0.001	0.002	0.000	0.000	0.000	0.011	0.000	0.000	0.146	4.289		pg181_o2nofp.cx10b_c24r64
qp100.L2
qp100.L2: point queries with 100 insert/s per client. Graphs for performance per 1-second interval are here.
Average throughput:
Query response time histogram: each cell has the percentage of responses that take <= the time in the header and max is the max response time in seconds. For max values in the top 25% of the range have a red background and in the bottom 25% of the range have a green background. The red background is not used when the min value is within 80% of the max value.
| dbms | 256us | 1ms | 4ms | 16ms | 64ms | 256ms | 1s | 4s | 16s | gt | max |
|---|---|---|---|---|---|---|---|---|---|---|---|
| my8407_rel_o2nofp.cz12a_c24r64 | 0.001 | 18.703 | 78.122 | 3.066 | 0.109 | nonzero | 0.104 | ||||
| my8407_rel_o2nofp.cz12a_nocb_c24r64 | 0.001 | 19.846 | 77.920 | 2.114 | 0.119 | nonzero | 0.072 | ||||
| pg181_o2nofp.cx10b_c24r64 | 1.205 | 98.488 | 0.275 | 0.024 | 0.008 | nonzero | 0.668 |
Insert response time histogram: each cell has the percentage of responses that take <= the time in the header and max is the max response time in seconds. For max values in the top 25% of the range have a red background and in the bottom 25% of the range have a green background. The red background is not used when the min value is within 80% of the max value.
| dbms | 256us | 1ms | 4ms | 16ms | 64ms | 256ms | 1s | 4s | 16s | gt | max |
|---|---|---|---|---|---|---|---|---|---|---|---|
| my8407_rel_o2nofp.cz12a_c24r64 | 33.465 | 63.556 | 2.979 | 0.134 | |||||||
| my8407_rel_o2nofp.cz12a_nocb_c24r64 | 0.385 | 95.174 | 4.441 | 0.166 | |||||||
| pg181_o2nofp.cx10b_c24r64 | 58.885 | 40.517 | 0.500 | 0.097 | 0.341 |
Delete response time histogram: each cell has the percentage of responses that take <= the time in the header and max is the max response time in seconds. For max values in the top 25% of the range have a red background and in the bottom 25% of the range have a green background. The red background is not used when the min value is within 80% of the max value.
| dbms | 256us | 1ms | 4ms | 16ms | 64ms | 256ms | 1s | 4s | 16s | gt | max |
|---|---|---|---|---|---|---|---|---|---|---|---|
| my8407_rel_o2nofp.cz12a_c24r64 | 93.410 | 6.160 | 0.431 | 0.052 | |||||||
| my8407_rel_o2nofp.cz12a_nocb_c24r64 | 11.226 | 87.069 | 1.705 | 0.138 | |||||||
| pg181_o2nofp.cx10b_c24r64 | 65.656 | 34.253 | 0.083 | 0.007 | 0.075 |
Performance metrics for the DBMS listed above. Some are normalized by throughput, others are not. Legend for results is here.
ips	qps	rps	rmbps	wps	wmbps	rpq	rkbpq	wpi	wkbpi	csps	cpups	cspq	cpupq	dbgb1	dbgb2	rss	maxop	p50	p99	tag
797	5434	43934	686.5	7440.4	208.0	8.085	129.353	9.337	267.254	145505	13.1	26.775	579	405.8	562.7	48.4	0.104	720	256	my8407_rel_o2nofp.cz12a_c24r64
797	5673	45406	709.5	7027.2	195.7	8.004	128.070	8.818	251.488	146588	13.0	25.841	550	359.9	508.4	48.7	0.072	736	272	my8407_rel_o2nofp.cz12a_nocb_c24r64
796	4679	64656	505.5	2677.2	31.2	13.819	110.621	3.362	40.149	144145	12.2	30.807	626	390.9	454.7	48.6	0.668	608	288	pg181_o2nofp.cx10b_c24r64
Average values from iostat.
r/s	rkB/s	rrqm/s	%rrqm	r_await	rareq-s	w/s	wkB/s	wrqm/s	%wrqm	w_await	wareq-s	d/s	dkB/s	drqm/s	%drqm	d_await	dareq-s	f/s	f_await	aqu-sz	%util
43934.0	702943	0.000	0.000	0.175	16.00	7440.4	212975	1.941	0.028	10.92	28.65	0.008	0.038	0.000	0.000	0.011	0.151	0.000	0.000	90.46	99.96		my8407_rel_o2nofp.cz12a_c24r64
45405.6	726490	0.000	0.000	0.143	16.00	7027.2	200411	2.212	0.034	9.552	28.54	0.015	0.120	0.000	0.000	0.020	0.554	0.000	0.000	75.79	99.96		my8407_rel_o2nofp.cz12a_nocb_c24r64
64655.8	517584	0.002	0.000	0.080	8.006	2677.2	31974.3	8.634	0.445	0.031	13.77	0.011	136.3	0.000	0.000	0.001	35.88	0.000	0.000	5.428	98.94		pg181_o2nofp.cx10b_c24r64
qr500.L3
qr500.L3: range queries with 500 insert/s per client. Graphs for performance per 1-second interval are here.
Average throughput:
Query response time histogram: each cell has the percentage of responses that take <= the time in the header and max is the max response time in seconds. For max values in the top 25% of the range have a red background and in the bottom 25% of the range have a green background. The red background is not used when the min value is within 80% of the max value.
| dbms | 256us | 1ms | 4ms | 16ms | 64ms | 256ms | 1s | 4s | 16s | gt | max |
|---|---|---|---|---|---|---|---|---|---|---|---|
| my8407_rel_o2nofp.cz12a_c24r64 | 99.257 | 0.711 | 0.023 | 0.005 | 0.004 | nonzero | 0.105 | ||||
| my8407_rel_o2nofp.cz12a_nocb_c24r64 | 98.970 | 1.003 | 0.019 | 0.006 | 0.002 | nonzero | 0.077 | ||||
| pg181_o2nofp.cx10b_c24r64 | 99.895 | 0.104 | 0.001 | nonzero | nonzero | 0.048 |
Insert response time histogram: each cell has the percentage of responses that take <= the time in the header and max is the max response time in seconds. For max values in the top 25% of the range have a red background and in the bottom 25% of the range have a green background. The red background is not used when the min value is within 80% of the max value.
| dbms | 256us | 1ms | 4ms | 16ms | 64ms | 256ms | 1s | 4s | 16s | gt | max |
|---|---|---|---|---|---|---|---|---|---|---|---|
| my8407_rel_o2nofp.cz12a_c24r64 | 32.505 | 46.732 | 20.731 | 0.033 | 0.307 | ||||||
| my8407_rel_o2nofp.cz12a_nocb_c24r64 | 9.017 | 61.985 | 28.998 | 0.212 | |||||||
| pg181_o2nofp.cx10b_c24r64 | 80.472 | 19.528 | 0.063 |
Delete response time histogram: each cell has the percentage of responses that take <= the time in the header and max is the max response time in seconds. For max values in the top 25% of the range have a red background and in the bottom 25% of the range have a green background. The red background is not used when the min value is within 80% of the max value.
| dbms | 256us | 1ms | 4ms | 16ms | 64ms | 256ms | 1s | 4s | 16s | gt | max |
|---|---|---|---|---|---|---|---|---|---|---|---|
| my8407_rel_o2nofp.cz12a_c24r64 | 89.079 | 6.316 | 3.889 | 0.716 | 0.244 | ||||||
| my8407_rel_o2nofp.cz12a_nocb_c24r64 | 35.766 | 52.785 | 11.449 | 0.181 | |||||||
| pg181_o2nofp.cx10b_c24r64 | 0.513 | 70.298 | 29.189 | 0.061 |
Performance metrics for the DBMS listed above. Some are normalized by throughput, others are not. Legend for results is here.
ips	qps	rps	rmbps	wps	wmbps	rpq	rkbpq	wpi	wkbpi	csps	cpups	cspq	cpupq	dbgb1	dbgb2	rss	maxop	p50	p99	tag
3984	52443	17097	267.1	20625.3	585.2	0.326	5.216	5.176	150.392	414666	47.4	7.907	217	405.8	563.4	48.4	0.105	6575	6111	my8407_rel_o2nofp.cz12a_c24r64
3984	52590	17620	275.3	21116.4	595.3	0.335	5.361	5.300	152.999	410363	46.6	7.803	213	359.9	509.1	48.7	0.077	6623	6191	my8407_rel_o2nofp.cz12a_nocb_c24r64
3984	87743	5751	46.5	5281.4	91.8	0.066	0.543	1.325	23.597	342485	39.9	3.903	109	391.1	455.2	47.8	0.048	10926	10142	pg181_o2nofp.cx10b_c24r64
Average values from iostat.
r/s	rkB/s	rrqm/s	%rrqm	r_await	rareq-s	w/s	wkB/s	wrqm/s	%wrqm	w_await	wareq-s	d/s	dkB/s	drqm/s	%drqm	d_await	dareq-s	f/s	f_await	aqu-sz	%util
17096.9	273551	0.000	0.000	0.713	16.00	20625.3	599238	6.422	0.031	13.99	29.14	0.036	0.164	0.000	0.000	0.107	0.659	0.000	0.000	303.0	93.18		my8407_rel_o2nofp.cz12a_c24r64
17619.7	281915	0.000	0.000	0.448	16.00	21116.4	609626	1.983	0.012	12.15	28.94	0.034	0.275	0.000	0.000	0.102	1.241	0.000	0.000	266.9	81.47		my8407_rel_o2nofp.cz12a_nocb_c24r64
5750.7	47617.0	0.000	0.000	0.116	8.268	5281.4	94022.9	21.99	0.555	0.308	30.27	0.095	1407.2	0.000	0.000	0.002	57.15	0.000	0.000	2.528	18.95		pg181_o2nofp.cx10b_c24r64
qp500.L4
qp500.L4: point queries with 500 insert/s per client. Graphs for performance per 1-second interval are here.
Average throughput:
Query response time histogram: each cell has the percentage of responses that take <= the time in the header and max is the max response time in seconds. For max values in the top 25% of the range have a red background and in the bottom 25% of the range have a green background. The red background is not used when the min value is within 80% of the max value.
| dbms | 256us | 1ms | 4ms | 16ms | 64ms | 256ms | 1s | 4s | 16s | gt | max |
|---|---|---|---|---|---|---|---|---|---|---|---|
| my8407_rel_o2nofp.cz12a_c24r64 | 0.042 | 47.146 | 49.998 | 2.808 | 0.004 | 0.106 | |||||
| my8407_rel_o2nofp.cz12a_nocb_c24r64 | 0.172 | 48.485 | 48.395 | 2.936 | 0.012 | 0.115 | |||||
| pg181_o2nofp.cx10b_c24r64 | 0.491 | 99.181 | 0.328 | 0.016 |
Insert response time histogram: each cell has the percentage of responses that take <= the time in the header and max is the max response time in seconds. For max values in the top 25% of the range have a red background and in the bottom 25% of the range have a green background. The red background is not used when the min value is within 80% of the max value.
| dbms | 256us | 1ms | 4ms | 16ms | 64ms | 256ms | 1s | 4s | 16s | gt | max |
|---|---|---|---|---|---|---|---|---|---|---|---|
| my8407_rel_o2nofp.cz12a_c24r64 | 14.489 | 69.046 | 16.465 | 0.255 | |||||||
| my8407_rel_o2nofp.cz12a_nocb_c24r64 | 1.368 | 47.817 | 50.812 | 0.003 | 0.284 | ||||||
| pg181_o2nofp.cx10b_c24r64 | 21.614 | 78.384 | 0.002 | 0.089 |
Delete response time histogram: each cell has the percentage of responses that take <= the time in the header and max is the max response time in seconds. For max values in the top 25% of the range have a red background and in the bottom 25% of the range have a green background. The red background is not used when the min value is within 80% of the max value.
| dbms | 256us | 1ms | 4ms | 16ms | 64ms | 256ms | 1s | 4s | 16s | gt | max |
|---|---|---|---|---|---|---|---|---|---|---|---|
| my8407_rel_o2nofp.cz12a_c24r64 | 88.525 | 8.731 | 2.651 | 0.094 | 0.124 | ||||||
| my8407_rel_o2nofp.cz12a_nocb_c24r64 | 12.644 | 64.956 | 22.400 | 0.001 | 0.259 | ||||||
| pg181_o2nofp.cx10b_c24r64 | 0.060 | 99.934 | 0.006 | 0.084 |
Performance metrics for the DBMS listed above. Some are normalized by throughput, others are not. Legend for results is here.
ips	qps	rps	rmbps	wps	wmbps	rpq	rkbpq	wpi	wkbpi	csps	cpups	cspq	cpupq	dbgb1	dbgb2	rss	maxop	p50	p99	tag
3984	1484	31932	498.9	22623.1	635.7	21.514	344.229	5.678	163.381	166872	17.6	112.432	2846	405.8	564.2	48.4	0.106	192	112	my8407_rel_o2nofp.cz12a_c24r64
3982	1650	34295	535.9	23604.2	660.8	20.786	332.580	5.927	169.910	180151	17.2	109.189	2502	359.9	509.8	48.7	0.115	208	96	my8407_rel_o2nofp.cz12a_nocb_c24r64
3984	4232	66934	524.6	9733.7	125.4	15.817	126.947	2.443	32.223	146952	22.6	34.726	1282	391.4	455.4	48.0	0.016	528	368	pg181_o2nofp.cx10b_c24r64
Average values from iostat.
r/s	rkB/s	rrqm/s	%rrqm	r_await	rareq-s	w/s	wkB/s	wrqm/s	%wrqm	w_await	wareq-s	d/s	dkB/s	drqm/s	%drqm	d_await	dareq-s	f/s	f_await	aqu-sz	%util
31931.6	510905	0.000	0.000	0.654	16.00	22623.1	650993	3.040	0.013	13.75	28.78	0.035	0.157	0.000	0.000	0.135	0.663	0.000	0.000	331.8	99.99		my8407_rel_o2nofp.cz12a_c24r64
34295.2	548723	0.000	0.000	0.493	16.00	23604.2	676634	2.598	0.011	12.65	28.67	0.033	0.177	0.000	0.000	0.159	0.811	0.000	0.000	315.5	99.98		my8407_rel_o2nofp.cz12a_nocb_c24r64
66933.7	537214	0.167	0.000	0.094	8.027	9733.7	128392	30.52	0.256	0.102	13.66	0.007	36.58	0.000	0.000	0.007	45.86	0.000	0.000	7.935	99.94		pg181_o2nofp.cx10b_c24r64
qr1000.L5
qr1000.L5: range queries with 1000 insert/s per client. Graphs for performance per 1-second interval are here.
Average throughput:
Query response time histogram: each cell has the percentage of responses that take <= the time in the header and max is the max response time in seconds. For max values in the top 25% of the range have a red background and in the bottom 25% of the range have a green background. The red background is not used when the min value is within 80% of the max value.
| dbms | 256us | 1ms | 4ms | 16ms | 64ms | 256ms | 1s | 4s | 16s | gt | max |
|---|---|---|---|---|---|---|---|---|---|---|---|
| my8407_rel_o2nofp.cz12a_c24r64 | 85.291 | 12.789 | 1.815 | 0.070 | 0.034 | nonzero | 0.161 | ||||
| my8407_rel_o2nofp.cz12a_nocb_c24r64 | 98.564 | 1.363 | 0.050 | 0.017 | 0.006 | nonzero | 0.109 | ||||
| pg181_o2nofp.cx10b_c24r64 | 98.662 | 1.333 | 0.004 | 0.001 | nonzero | nonzero | nonzero | 0.280 |
Insert response time histogram: each cell has the percentage of responses that take <= the time in the header and max is the max response time in seconds. For max values in the top 25% of the range have a red background and in the bottom 25% of the range have a green background. The red background is not used when the min value is within 80% of the max value.
| dbms | 256us | 1ms | 4ms | 16ms | 64ms | 256ms | 1s | 4s | 16s | gt | max |
|---|---|---|---|---|---|---|---|---|---|---|---|
| my8407_rel_o2nofp.cz12a_c24r64 | 26.023 | 60.640 | 13.308 | 0.029 | 0.306 | ||||||
| my8407_rel_o2nofp.cz12a_nocb_c24r64 | 0.469 | 35.090 | 64.439 | 0.003 | 0.296 | ||||||
| pg181_o2nofp.cx10b_c24r64 | 70.907 | 29.091 | 0.002 | 0.072 |
Delete response time histogram: each cell has the percentage of responses that take <= the time in the header and max is the max response time in seconds. For max values in the top 25% of the range have a red background and in the bottom 25% of the range have a green background. The red background is not used when the min value is within 80% of the max value.
| dbms | 256us | 1ms | 4ms | 16ms | 64ms | 256ms | 1s | 4s | 16s | gt | max |
|---|---|---|---|---|---|---|---|---|---|---|---|
| my8407_rel_o2nofp.cz12a_c24r64 | 56.599 | 37.033 | 5.738 | 0.631 | 0.199 | ||||||
| my8407_rel_o2nofp.cz12a_nocb_c24r64 | 1.986 | 63.188 | 34.826 | nonzero | 0.267 | ||||||
| pg181_o2nofp.cx10b_c24r64 | 0.037 | 99.960 | 0.003 | 0.124 |
Performance metrics for the DBMS listed above. Some are normalized by throughput, others are not. Legend for results is here.
ips	qps	rps	rmbps	wps	wmbps	rpq	rkbpq	wpi	wkbpi	csps	cpups	cspq	cpupq	dbgb1	dbgb2	rss	maxop	p50	p99	tag
7960	34162	17580	274.7	24045.4	681.9	0.515	8.234	3.021	87.715	321452	49.2	9.410	346	405.8	565.6	48.4	0.161	4607	2528	my8407_rel_o2nofp.cz12a_c24r64
5152	47868	21831	341.1	27703.8	777.5	0.456	7.297	5.377	154.537	425431	50.3	8.888	252	359.9	511.2	48.7	0.109	5983	5375	my8407_rel_o2nofp.cz12a_nocb_c24r64
7969	66129	10909	89.5	12447.3	197.9	0.165	1.386	1.562	25.427	261421	56.9	3.953	207	392.5	456.6	48.6	0.280	8367	7519	pg181_o2nofp.cx10b_c24r64
Average values from iostat.
r/s	rkB/s	rrqm/s	%rrqm	r_await	rareq-s	w/s	wkB/s	wrqm/s	%wrqm	w_await	wareq-s	d/s	dkB/s	drqm/s	%drqm	d_await	dareq-s	f/s	f_await	aqu-sz	%util
17580.0	281279	0.000	0.000	0.928	16.00	24045.4	698223	6.731	0.028	14.22	29.04	0.043	0.204	0.000	0.000	0.185	0.739	0.000	0.000	358.2	99.66		my8407_rel_o2nofp.cz12a_c24r64
21831.3	349300	0.000	0.000	0.809	16.00	27703.8	796177	2.234	0.010	13.55	28.74	0.038	0.175	0.000	0.000	0.118	0.675	0.000	0.000	392.9	99.81		my8407_rel_o2nofp.cz12a_nocb_c24r64
10908.6	91655.0	0.001	0.000	0.122	8.368	12447.3	202624	47.57	0.409	0.378	18.00	0.013	27.78	0.000	0.000	0.009	38.85	0.000	0.000	6.371	41.32		pg181_o2nofp.cx10b_c24r64
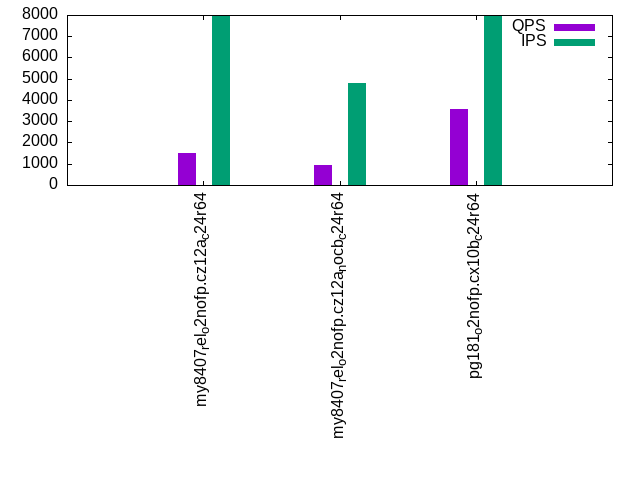
qp1000.L6
qp1000.L6: point queries with 1000 insert/s per client. Graphs for performance per 1-second interval are here.
Average throughput:
Query response time histogram: each cell has the percentage of responses that take <= the time in the header and max is the max response time in seconds. For max values in the top 25% of the range have a red background and in the bottom 25% of the range have a green background. The red background is not used when the min value is within 80% of the max value.
| dbms | 256us | 1ms | 4ms | 16ms | 64ms | 256ms | 1s | 4s | 16s | gt | max |
|---|---|---|---|---|---|---|---|---|---|---|---|
| my8407_rel_o2nofp.cz12a_c24r64 | 0.014 | 49.633 | 47.609 | 2.742 | 0.003 | 0.121 | |||||
| my8407_rel_o2nofp.cz12a_nocb_c24r64 | 0.002 | 8.891 | 82.647 | 8.329 | 0.131 | 0.156 | |||||
| pg181_o2nofp.cx10b_c24r64 | 0.097 | 98.439 | 1.464 | 0.014 |
Insert response time histogram: each cell has the percentage of responses that take <= the time in the header and max is the max response time in seconds. For max values in the top 25% of the range have a red background and in the bottom 25% of the range have a green background. The red background is not used when the min value is within 80% of the max value.
| dbms | 256us | 1ms | 4ms | 16ms | 64ms | 256ms | 1s | 4s | 16s | gt | max |
|---|---|---|---|---|---|---|---|---|---|---|---|
| my8407_rel_o2nofp.cz12a_c24r64 | 25.931 | 65.212 | 8.852 | 0.005 | 0.338 | ||||||
| my8407_rel_o2nofp.cz12a_nocb_c24r64 | 0.384 | 32.131 | 67.371 | 0.113 | 0.516 | ||||||
| pg181_o2nofp.cx10b_c24r64 | 26.950 | 73.050 | 0.051 |
Delete response time histogram: each cell has the percentage of responses that take <= the time in the header and max is the max response time in seconds. For max values in the top 25% of the range have a red background and in the bottom 25% of the range have a green background. The red background is not used when the min value is within 80% of the max value.
| dbms | 256us | 1ms | 4ms | 16ms | 64ms | 256ms | 1s | 4s | 16s | gt | max |
|---|---|---|---|---|---|---|---|---|---|---|---|
| my8407_rel_o2nofp.cz12a_c24r64 | 3.352 | 88.716 | 7.441 | 0.491 | 0.196 | ||||||
| my8407_rel_o2nofp.cz12a_nocb_c24r64 | 2.484 | 63.781 | 33.725 | 0.010 | 0.443 | ||||||
| pg181_o2nofp.cx10b_c24r64 | 99.997 | 0.003 | 0.170 |
Performance metrics for the DBMS listed above. Some are normalized by throughput, others are not. Legend for results is here.
ips	qps	rps	rmbps	wps	wmbps	rpq	rkbpq	wpi	wkbpi	csps	cpups	cspq	cpupq	dbgb1	dbgb2	rss	maxop	p50	p99	tag
7951	1519	31440	491.3	22318.0	632.0	20.702	331.231	2.807	81.392	173024	26.1	113.929	4125	405.8	567.0	48.4	0.121	192	112	my8407_rel_o2nofp.cz12a_c24r64
4810	926	30313	473.6	26431.8	736.0	32.743	523.887	5.496	156.692	178860	18.2	193.195	4718	359.9	512.7	48.7	0.156	112	80	my8407_rel_o2nofp.cz12a_nocb_c24r64
7965	3599	67735	533.0	17164.0	236.2	18.819	151.638	2.155	30.372	149852	40.8	41.635	2721	394.3	458.3	48.6	0.014	448	320	pg181_o2nofp.cx10b_c24r64
Average values from iostat.
r/s	rkB/s	rrqm/s	%rrqm	r_await	rareq-s	w/s	wkB/s	wrqm/s	%wrqm	w_await	wareq-s	d/s	dkB/s	drqm/s	%drqm	d_await	dareq-s	f/s	f_await	aqu-sz	%util
31440.0	503040	0.000	0.000	0.599	16.00	22318.0	647182	3.341	0.014	13.85	29.00	0.043	0.208	0.000	0.000	0.089	0.751	0.000	0.000	327.6	100.00		my8407_rel_o2nofp.cz12a_c24r64
30313.4	485014	0.000	0.000	0.694	16.00	26431.8	753624	2.234	0.010	13.58	28.51	0.032	0.372	0.000	0.000	0.112	1.689	0.000	0.000	380.1	99.93		my8407_rel_o2nofp.cz12a_nocb_c24r64
67734.9	545775	0.000	0.000	0.112	8.057	17164.0	241898	59.99	0.299	0.280	14.28	0.024	64.29	0.000	0.000	0.017	65.63	0.000	0.000	13.13	99.96		pg181_o2nofp.cx10b_c24r64
l.i0
l.i0: load without secondary indexes
Performance metrics for all DBMS, not just the ones listed above. Some are normalized by throughput, others are not. Legend for results is here.
ips	qps	rps	rmbps	wps	wmbps	rpq	rkbpq	wpi	wkbpi	csps	cpups	cspq	cpupq	dbgb1	dbgb2	rss	maxop	p50	p99	tag
485084	0	1	0.0	3262.7	181.3	0.000	0.000	0.007	0.383	94996	46.9	0.196	23	131.1	274.6	48.7	0.281	63292	42795	my8407_rel_o2nofp.cz12a_c24r64
471365	0	1	0.0	3166.8	176.1	0.000	0.000	0.007	0.382	93007	47.0	0.197	24	131.1	274.6	47.8	0.277	60793	42093	my8407_rel_o2nofp.cz12a_nocb_c24r64
752729	0	543	4.5	2699.7	301.9	0.001	0.006	0.004	0.411	74366	52.2	0.099	17	191.4	255.4	47.5	0.444	95788	83485	pg181_o2nofp.cx10b_c24r64
l.x
l.x: create secondary indexes
Performance metrics for all DBMS, not just the ones listed above. Some are normalized by throughput, others are not. Legend for results is here.
ips	qps	rps	rmbps	wps	wmbps	rpq	rkbpq	wpi	wkbpi	csps	cpups	cspq	cpupq	dbgb1	dbgb2	rss	maxop	p50	p99	tag
557880	0	7597	732.8	17195.2	816.4	0.014	1.345	0.031	1.499	47035	38.4	0.084	17	301.8	445.2	47.7	0.003	NA	NA	my8407_rel_o2nofp.cz12a_c24r64
540248	0	7349	708.5	16634.9	790.7	0.014	1.343	0.031	1.499	46806	37.2	0.087	17	301.8	445.2	48.1	0.045	NA	NA	my8407_rel_o2nofp.cz12a_nocb_c24r64
1356852	0	7388	380.1	3150.0	385.3	0.005	0.287	0.002	0.291	20692	25.7	0.015	5	384.2	448.3	24.4	0.003	NA	NA	pg181_o2nofp.cx10b_c24r64
l.i1
l.i1: continue load after secondary indexes created with 50 inserts per transaction
Performance metrics for all DBMS, not just the ones listed above. Some are normalized by throughput, others are not. Legend for results is here.
ips	qps	rps	rmbps	wps	wmbps	rpq	rkbpq	wpi	wkbpi	csps	cpups	cspq	cpupq	dbgb1	dbgb2	rss	maxop	p50	p99	tag
7039	0	15240	238.1	22142.1	659.1	2.165	34.641	3.146	95.886	138214	20.1	19.635	685	405.8	560.7	48.5	0.787	800	250	my8407_rel_o2nofp.cz12a_c24r64
3801	0	18268	285.4	23992.4	689.7	4.806	76.891	6.312	185.804	152877	14.4	40.217	909	359.9	506.5	48.7	0.575	500	300	my8407_rel_o2nofp.cz12a_nocb_c24r64
13457	0	17245	138.6	20272.2	340.2	1.282	10.548	1.506	25.891	42912	31.6	3.189	564	389.4	453.5	48.5	2.409	2050	700	pg181_o2nofp.cx10b_c24r64
l.i2
l.i2: continue load after secondary indexes created with 5 inserts per transaction
Performance metrics for all DBMS, not just the ones listed above. Some are normalized by throughput, others are not. Legend for results is here.
ips	qps	rps	rmbps	wps	wmbps	rpq	rkbpq	wpi	wkbpi	csps	cpups	cspq	cpupq	dbgb1	dbgb2	rss	maxop	p50	p99	tag
1732	0	16043	250.7	20832.9	589.2	9.265	148.241	12.031	348.455	141637	15.8	81.796	2190	405.8	562.5	48.5	0.730	135	85	my8407_rel_o2nofp.cz12a_c24r64
4352	0	18992	296.7	24513.8	692.4	4.363	69.815	5.632	162.909	190691	20.0	43.812	1103	359.9	508.1	48.7	0.479	545	425	my8407_rel_o2nofp.cz12a_nocb_c24r64
1338	0	1684	13.5	2314.9	36.0	1.259	10.312	1.730	27.533	9906	32.4	7.405	5813	390.8	454.8	48.5	0.006	170	150	pg181_o2nofp.cx10b_c24r64
qr100.L1
qr100.L1: range queries with 100 insert/s per client
Performance metrics for all DBMS, not just the ones listed above. Some are normalized by throughput, others are not. Legend for results is here.
ips	qps	rps	rmbps	wps	wmbps	rpq	rkbpq	wpi	wkbpi	csps	cpups	cspq	cpupq	dbgb1	dbgb2	rss	maxop	p50	p99	tag
796	59437	3758	58.7	4117.7	117.2	0.063	1.012	5.170	150.758	362638	36.2	6.101	146	405.8	562.6	48.5	0.062	7503	6831	my8407_rel_o2nofp.cz12a_c24r64
796	59136	3492	54.6	3593.5	102.0	0.059	0.945	4.512	131.130	356326	35.9	6.026	146	359.9	508.2	48.7	0.028	7487	6751	my8407_rel_o2nofp.cz12a_nocb_c24r64
796	98949	1070	8.8	538.6	15.1	0.011	0.091	0.676	19.449	380488	33.5	3.845	81	390.8	454.9	48.6	0.003	12414	11838	pg181_o2nofp.cx10b_c24r64
qp100.L2
qp100.L2: point queries with 100 insert/s per client
Performance metrics for all DBMS, not just the ones listed above. Some are normalized by throughput, others are not. Legend for results is here.
ips	qps	rps	rmbps	wps	wmbps	rpq	rkbpq	wpi	wkbpi	csps	cpups	cspq	cpupq	dbgb1	dbgb2	rss	maxop	p50	p99	tag
797	5434	43934	686.5	7440.4	208.0	8.085	129.353	9.337	267.254	145505	13.1	26.775	579	405.8	562.7	48.4	0.104	720	256	my8407_rel_o2nofp.cz12a_c24r64
797	5673	45406	709.5	7027.2	195.7	8.004	128.070	8.818	251.488	146588	13.0	25.841	550	359.9	508.4	48.7	0.072	736	272	my8407_rel_o2nofp.cz12a_nocb_c24r64
796	4679	64656	505.5	2677.2	31.2	13.819	110.621	3.362	40.149	144145	12.2	30.807	626	390.9	454.7	48.6	0.668	608	288	pg181_o2nofp.cx10b_c24r64
qr500.L3
qr500.L3: range queries with 500 insert/s per client
Performance metrics for all DBMS, not just the ones listed above. Some are normalized by throughput, others are not. Legend for results is here.
ips	qps	rps	rmbps	wps	wmbps	rpq	rkbpq	wpi	wkbpi	csps	cpups	cspq	cpupq	dbgb1	dbgb2	rss	maxop	p50	p99	tag
3984	52443	17097	267.1	20625.3	585.2	0.326	5.216	5.176	150.392	414666	47.4	7.907	217	405.8	563.4	48.4	0.105	6575	6111	my8407_rel_o2nofp.cz12a_c24r64
3984	52590	17620	275.3	21116.4	595.3	0.335	5.361	5.300	152.999	410363	46.6	7.803	213	359.9	509.1	48.7	0.077	6623	6191	my8407_rel_o2nofp.cz12a_nocb_c24r64
3984	87743	5751	46.5	5281.4	91.8	0.066	0.543	1.325	23.597	342485	39.9	3.903	109	391.1	455.2	47.8	0.048	10926	10142	pg181_o2nofp.cx10b_c24r64
qp500.L4
qp500.L4: point queries with 500 insert/s per client
Performance metrics for all DBMS, not just the ones listed above. Some are normalized by throughput, others are not. Legend for results is here.
ips	qps	rps	rmbps	wps	wmbps	rpq	rkbpq	wpi	wkbpi	csps	cpups	cspq	cpupq	dbgb1	dbgb2	rss	maxop	p50	p99	tag
3984	1484	31932	498.9	22623.1	635.7	21.514	344.229	5.678	163.381	166872	17.6	112.432	2846	405.8	564.2	48.4	0.106	192	112	my8407_rel_o2nofp.cz12a_c24r64
3982	1650	34295	535.9	23604.2	660.8	20.786	332.580	5.927	169.910	180151	17.2	109.189	2502	359.9	509.8	48.7	0.115	208	96	my8407_rel_o2nofp.cz12a_nocb_c24r64
3984	4232	66934	524.6	9733.7	125.4	15.817	126.947	2.443	32.223	146952	22.6	34.726	1282	391.4	455.4	48.0	0.016	528	368	pg181_o2nofp.cx10b_c24r64
qr1000.L5
qr1000.L5: range queries with 1000 insert/s per client
Performance metrics for all DBMS, not just the ones listed above. Some are normalized by throughput, others are not. Legend for results is here.
ips	qps	rps	rmbps	wps	wmbps	rpq	rkbpq	wpi	wkbpi	csps	cpups	cspq	cpupq	dbgb1	dbgb2	rss	maxop	p50	p99	tag
7960	34162	17580	274.7	24045.4	681.9	0.515	8.234	3.021	87.715	321452	49.2	9.410	346	405.8	565.6	48.4	0.161	4607	2528	my8407_rel_o2nofp.cz12a_c24r64
5152	47868	21831	341.1	27703.8	777.5	0.456	7.297	5.377	154.537	425431	50.3	8.888	252	359.9	511.2	48.7	0.109	5983	5375	my8407_rel_o2nofp.cz12a_nocb_c24r64
7969	66129	10909	89.5	12447.3	197.9	0.165	1.386	1.562	25.427	261421	56.9	3.953	207	392.5	456.6	48.6	0.280	8367	7519	pg181_o2nofp.cx10b_c24r64
qp1000.L6
qp1000.L6: point queries with 1000 insert/s per client
Performance metrics for all DBMS, not just the ones listed above. Some are normalized by throughput, others are not. Legend for results is here.
ips	qps	rps	rmbps	wps	wmbps	rpq	rkbpq	wpi	wkbpi	csps	cpups	cspq	cpupq	dbgb1	dbgb2	rss	maxop	p50	p99	tag
7951	1519	31440	491.3	22318.0	632.0	20.702	331.231	2.807	81.392	173024	26.1	113.929	4125	405.8	567.0	48.4	0.121	192	112	my8407_rel_o2nofp.cz12a_c24r64
4810	926	30313	473.6	26431.8	736.0	32.743	523.887	5.496	156.692	178860	18.2	193.195	4718	359.9	512.7	48.7	0.156	112	80	my8407_rel_o2nofp.cz12a_nocb_c24r64
7965	3599	67735	533.0	17164.0	236.2	18.819	151.638	2.155	30.372	149852	40.8	41.635	2721	394.3	458.3	48.6	0.014	448	320	pg181_o2nofp.cx10b_c24r64
l.i0
- l.i0: load without secondary indexes
- Legend for results is here.
- Each entry lists the percentage of responses that fit in that bucket (slower than max time for previous bucket, faster than min time for next bucket).
Insert response time histogram
256us	1ms	4ms	16ms	64ms	256ms	1s	4s	16s	gt	max	tag
0.000	0.000	99.700	0.222	0.063	0.014	0.002	0.000	0.000	0.000	0.281	my8407_rel_o2nofp.cz12a_c24r64
0.000	0.000	99.697	0.229	0.059	0.014	0.002	0.000	0.000	0.000	0.277	my8407_rel_o2nofp.cz12a_nocb_c24r64
0.000	25.879	74.086	0.026	0.008	nonzero	nonzero	0.000	0.000	0.000	0.444	pg181_o2nofp.cx10b_c24r64
l.x
- l.x: create secondary indexes
- Legend for results is here.
- Each entry lists the percentage of responses that fit in that bucket (slower than max time for previous bucket, faster than min time for next bucket).
TODO - determine whether there is data for create index response time
l.i1
- l.i1: continue load after secondary indexes created with 50 inserts per transaction
- Legend for results is here.
- Each entry lists the percentage of responses that fit in that bucket (slower than max time for previous bucket, faster than min time for next bucket).
Insert response time histogram
256us	1ms	4ms	16ms	64ms	256ms	1s	4s	16s	gt	max	tag
0.000	0.000	0.008	25.345	43.386	30.698	0.563	0.000	0.000	0.000	0.787	my8407_rel_o2nofp.cz12a_c24r64
0.000	0.000	0.000	0.338	11.355	87.948	0.360	0.000	0.000	0.000	0.575	my8407_rel_o2nofp.cz12a_nocb_c24r64
0.000	0.000	0.000	78.647	21.016	0.290	0.048	nonzero	0.000	0.000	2.409	pg181_o2nofp.cx10b_c24r64
Delete response time histogram
256us	1ms	4ms	16ms	64ms	256ms	1s	4s	16s	gt	max	tag
0.000	0.000	27.798	57.065	13.238	1.830	0.070	0.000	0.000	0.000	0.755	my8407_rel_o2nofp.cz12a_c24r64
0.000	0.000	0.000	6.438	37.432	56.121	0.009	0.000	0.000	0.000	0.340	my8407_rel_o2nofp.cz12a_nocb_c24r64
0.000	0.779	6.533	19.977	72.702	0.009	0.000	0.000	0.000	0.000	0.251	pg181_o2nofp.cx10b_c24r64
l.i2
- l.i2: continue load after secondary indexes created with 5 inserts per transaction
- Legend for results is here.
- Each entry lists the percentage of responses that fit in that bucket (slower than max time for previous bucket, faster than min time for next bucket).
Insert response time histogram
256us	1ms	4ms	16ms	64ms	256ms	1s	4s	16s	gt	max	tag
0.000	3.421	7.497	37.050	49.074	2.957	0.001	0.000	0.000	0.000	0.730	my8407_rel_o2nofp.cz12a_c24r64
0.000	0.064	14.735	76.549	8.510	0.142	0.001	0.000	0.000	0.000	0.479	my8407_rel_o2nofp.cz12a_nocb_c24r64
0.000	13.469	86.530	0.001	0.000	0.000	0.000	0.000	0.000	0.000	0.006	pg181_o2nofp.cx10b_c24r64
Delete response time histogram
256us	1ms	4ms	16ms	64ms	256ms	1s	4s	16s	gt	max	tag
0.000	3.674	14.657	36.820	43.285	1.564	0.001	0.000	0.000	0.000	0.735	my8407_rel_o2nofp.cz12a_c24r64
0.000	0.264	21.748	72.699	5.236	0.053	0.001	0.000	0.000	0.000	0.480	my8407_rel_o2nofp.cz12a_nocb_c24r64
0.000	0.000	0.000	0.000	99.999	0.001	0.000	0.000	0.000	0.000	0.160	pg181_o2nofp.cx10b_c24r64
qr100.L1
- qr100.L1: range queries with 100 insert/s per client
- Legend for results is here.
- Each entry lists the percentage of responses that fit in that bucket (slower than max time for previous bucket, faster than min time for next bucket).
Query response time histogram
256us	1ms	4ms	16ms	64ms	256ms	1s	4s	16s	gt	max	tag
99.871	0.126	0.002	nonzero	nonzero	0.000	0.000	0.000	0.000	0.000	0.062	my8407_rel_o2nofp.cz12a_c24r64
99.870	0.129	0.001	nonzero	nonzero	0.000	0.000	0.000	0.000	0.000	0.028	my8407_rel_o2nofp.cz12a_nocb_c24r64
99.994	0.006	nonzero	0.000	0.000	0.000	0.000	0.000	0.000	0.000	0.003	pg181_o2nofp.cx10b_c24r64
Insert response time histogram
256us	1ms	4ms	16ms	64ms	256ms	1s	4s	16s	gt	max	tag
0.000	0.000	0.000	52.226	41.094	6.681	0.000	0.000	0.000	0.000	0.181	my8407_rel_o2nofp.cz12a_c24r64
0.000	0.000	0.000	49.330	50.670	0.000	0.000	0.000	0.000	0.000	0.053	my8407_rel_o2nofp.cz12a_nocb_c24r64
0.000	0.000	0.000	99.819	0.181	0.000	0.000	0.000	0.000	0.000	0.021	pg181_o2nofp.cx10b_c24r64
Delete response time histogram
256us	1ms	4ms	16ms	64ms	256ms	1s	4s	16s	gt	max	tag
0.000	0.000	94.802	2.163	2.882	0.153	0.000	0.000	0.000	0.000	0.130	my8407_rel_o2nofp.cz12a_c24r64
0.000	0.000	0.000	80.139	19.861	0.000	0.000	0.000	0.000	0.000	0.048	my8407_rel_o2nofp.cz12a_nocb_c24r64
0.000	19.719	80.260	0.021	0.000	0.000	0.000	0.000	0.000	0.000	0.005	pg181_o2nofp.cx10b_c24r64
qp100.L2
- qp100.L2: point queries with 100 insert/s per client
- Legend for results is here.
- Each entry lists the percentage of responses that fit in that bucket (slower than max time for previous bucket, faster than min time for next bucket).
Query response time histogram
256us	1ms	4ms	16ms	64ms	256ms	1s	4s	16s	gt	max	tag
0.001	18.703	78.122	3.066	0.109	nonzero	0.000	0.000	0.000	0.000	0.104	my8407_rel_o2nofp.cz12a_c24r64
0.001	19.846	77.920	2.114	0.119	nonzero	0.000	0.000	0.000	0.000	0.072	my8407_rel_o2nofp.cz12a_nocb_c24r64
0.000	1.205	98.488	0.275	0.024	0.008	nonzero	0.000	0.000	0.000	0.668	pg181_o2nofp.cx10b_c24r64
Insert response time histogram
256us	1ms	4ms	16ms	64ms	256ms	1s	4s	16s	gt	max	tag
0.000	0.000	0.000	33.465	63.556	2.979	0.000	0.000	0.000	0.000	0.134	my8407_rel_o2nofp.cz12a_c24r64
0.000	0.000	0.000	0.385	95.174	4.441	0.000	0.000	0.000	0.000	0.166	my8407_rel_o2nofp.cz12a_nocb_c24r64
0.000	0.000	0.000	58.885	40.517	0.500	0.097	0.000	0.000	0.000	0.341	pg181_o2nofp.cx10b_c24r64
Delete response time histogram
256us	1ms	4ms	16ms	64ms	256ms	1s	4s	16s	gt	max	tag
0.000	0.000	93.410	6.160	0.431	0.000	0.000	0.000	0.000	0.000	0.052	my8407_rel_o2nofp.cz12a_c24r64
0.000	0.000	0.000	11.226	87.069	1.705	0.000	0.000	0.000	0.000	0.138	my8407_rel_o2nofp.cz12a_nocb_c24r64
0.000	0.000	65.656	34.253	0.083	0.007	0.000	0.000	0.000	0.000	0.075	pg181_o2nofp.cx10b_c24r64
qr500.L3
- qr500.L3: range queries with 500 insert/s per client
- Legend for results is here.
- Each entry lists the percentage of responses that fit in that bucket (slower than max time for previous bucket, faster than min time for next bucket).
Query response time histogram
256us	1ms	4ms	16ms	64ms	256ms	1s	4s	16s	gt	max	tag
99.257	0.711	0.023	0.005	0.004	nonzero	0.000	0.000	0.000	0.000	0.105	my8407_rel_o2nofp.cz12a_c24r64
98.970	1.003	0.019	0.006	0.002	nonzero	0.000	0.000	0.000	0.000	0.077	my8407_rel_o2nofp.cz12a_nocb_c24r64
99.895	0.104	0.001	nonzero	nonzero	0.000	0.000	0.000	0.000	0.000	0.048	pg181_o2nofp.cx10b_c24r64
Insert response time histogram
256us	1ms	4ms	16ms	64ms	256ms	1s	4s	16s	gt	max	tag
0.000	0.000	0.000	32.505	46.732	20.731	0.033	0.000	0.000	0.000	0.307	my8407_rel_o2nofp.cz12a_c24r64
0.000	0.000	0.000	9.017	61.985	28.998	0.000	0.000	0.000	0.000	0.212	my8407_rel_o2nofp.cz12a_nocb_c24r64
0.000	0.000	0.000	80.472	19.528	0.000	0.000	0.000	0.000	0.000	0.063	pg181_o2nofp.cx10b_c24r64
Delete response time histogram
256us	1ms	4ms	16ms	64ms	256ms	1s	4s	16s	gt	max	tag
0.000	0.000	89.079	6.316	3.889	0.716	0.000	0.000	0.000	0.000	0.244	my8407_rel_o2nofp.cz12a_c24r64
0.000	0.000	0.000	35.766	52.785	11.449	0.000	0.000	0.000	0.000	0.181	my8407_rel_o2nofp.cz12a_nocb_c24r64
0.000	0.000	0.513	70.298	29.189	0.000	0.000	0.000	0.000	0.000	0.061	pg181_o2nofp.cx10b_c24r64
qp500.L4
- qp500.L4: point queries with 500 insert/s per client
- Legend for results is here.
- Each entry lists the percentage of responses that fit in that bucket (slower than max time for previous bucket, faster than min time for next bucket).
Query response time histogram
256us	1ms	4ms	16ms	64ms	256ms	1s	4s	16s	gt	max	tag
0.000	0.042	47.146	49.998	2.808	0.004	0.000	0.000	0.000	0.000	0.106	my8407_rel_o2nofp.cz12a_c24r64
0.000	0.172	48.485	48.395	2.936	0.012	0.000	0.000	0.000	0.000	0.115	my8407_rel_o2nofp.cz12a_nocb_c24r64
0.000	0.491	99.181	0.328	0.000	0.000	0.000	0.000	0.000	0.000	0.016	pg181_o2nofp.cx10b_c24r64
Insert response time histogram
256us	1ms	4ms	16ms	64ms	256ms	1s	4s	16s	gt	max	tag
0.000	0.000	0.000	14.489	69.046	16.465	0.000	0.000	0.000	0.000	0.255	my8407_rel_o2nofp.cz12a_c24r64
0.000	0.000	0.000	1.368	47.817	50.812	0.003	0.000	0.000	0.000	0.284	my8407_rel_o2nofp.cz12a_nocb_c24r64
0.000	0.000	0.000	21.614	78.384	0.002	0.000	0.000	0.000	0.000	0.089	pg181_o2nofp.cx10b_c24r64
Delete response time histogram
256us	1ms	4ms	16ms	64ms	256ms	1s	4s	16s	gt	max	tag
0.000	0.000	88.525	8.731	2.651	0.094	0.000	0.000	0.000	0.000	0.124	my8407_rel_o2nofp.cz12a_c24r64
0.000	0.000	0.000	12.644	64.956	22.400	0.001	0.000	0.000	0.000	0.259	my8407_rel_o2nofp.cz12a_nocb_c24r64
0.000	0.000	0.000	0.060	99.934	0.006	0.000	0.000	0.000	0.000	0.084	pg181_o2nofp.cx10b_c24r64
qr1000.L5
- qr1000.L5: range queries with 1000 insert/s per client
- Legend for results is here.
- Each entry lists the percentage of responses that fit in that bucket (slower than max time for previous bucket, faster than min time for next bucket).
Query response time histogram
256us	1ms	4ms	16ms	64ms	256ms	1s	4s	16s	gt	max	tag
85.291	12.789	1.815	0.070	0.034	nonzero	0.000	0.000	0.000	0.000	0.161	my8407_rel_o2nofp.cz12a_c24r64
98.564	1.363	0.050	0.017	0.006	nonzero	0.000	0.000	0.000	0.000	0.109	my8407_rel_o2nofp.cz12a_nocb_c24r64
98.662	1.333	0.004	0.001	nonzero	nonzero	nonzero	0.000	0.000	0.000	0.280	pg181_o2nofp.cx10b_c24r64
Insert response time histogram
256us	1ms	4ms	16ms	64ms	256ms	1s	4s	16s	gt	max	tag
0.000	0.000	0.000	26.023	60.640	13.308	0.029	0.000	0.000	0.000	0.306	my8407_rel_o2nofp.cz12a_c24r64
0.000	0.000	0.000	0.469	35.090	64.439	0.003	0.000	0.000	0.000	0.296	my8407_rel_o2nofp.cz12a_nocb_c24r64
0.000	0.000	0.000	70.907	29.091	0.002	0.000	0.000	0.000	0.000	0.072	pg181_o2nofp.cx10b_c24r64
Delete response time histogram
256us	1ms	4ms	16ms	64ms	256ms	1s	4s	16s	gt	max	tag
0.000	0.000	56.599	37.033	5.738	0.631	0.000	0.000	0.000	0.000	0.199	my8407_rel_o2nofp.cz12a_c24r64
0.000	0.000	0.000	1.986	63.188	34.826	nonzero	0.000	0.000	0.000	0.267	my8407_rel_o2nofp.cz12a_nocb_c24r64
0.000	0.000	0.000	0.037	99.960	0.003	0.000	0.000	0.000	0.000	0.124	pg181_o2nofp.cx10b_c24r64
qp1000.L6
- qp1000.L6: point queries with 1000 insert/s per client
- Legend for results is here.
- Each entry lists the percentage of responses that fit in that bucket (slower than max time for previous bucket, faster than min time for next bucket).
Query response time histogram
256us	1ms	4ms	16ms	64ms	256ms	1s	4s	16s	gt	max	tag
0.000	0.014	49.633	47.609	2.742	0.003	0.000	0.000	0.000	0.000	0.121	my8407_rel_o2nofp.cz12a_c24r64
0.000	0.002	8.891	82.647	8.329	0.131	0.000	0.000	0.000	0.000	0.156	my8407_rel_o2nofp.cz12a_nocb_c24r64
0.000	0.097	98.439	1.464	0.000	0.000	0.000	0.000	0.000	0.000	0.014	pg181_o2nofp.cx10b_c24r64
Insert response time histogram
256us	1ms	4ms	16ms	64ms	256ms	1s	4s	16s	gt	max	tag
0.000	0.000	0.000	25.931	65.212	8.852	0.005	0.000	0.000	0.000	0.338	my8407_rel_o2nofp.cz12a_c24r64
0.000	0.000	0.000	0.384	32.131	67.371	0.113	0.000	0.000	0.000	0.516	my8407_rel_o2nofp.cz12a_nocb_c24r64
0.000	0.000	0.000	26.950	73.050	0.000	0.000	0.000	0.000	0.000	0.051	pg181_o2nofp.cx10b_c24r64
Delete response time histogram
256us	1ms	4ms	16ms	64ms	256ms	1s	4s	16s	gt	max	tag
0.000	0.000	3.352	88.716	7.441	0.491	0.000	0.000	0.000	0.000	0.196	my8407_rel_o2nofp.cz12a_c24r64
0.000	0.000	0.000	2.484	63.781	33.725	0.010	0.000	0.000	0.000	0.443	my8407_rel_o2nofp.cz12a_nocb_c24r64
0.000	0.000	0.000	0.000	99.997	0.003	0.000	0.000	0.000	0.000	0.170	pg181_o2nofp.cx10b_c24r64