Introduction
This is a report for the insert benchmark with 4000M docs and 20 client(s). It is generated by scripts (bash, awk, sed) and Tufte might not be impressed. An overview of the insert benchmark is here and a short update is here. Below, by DBMS, I mean DBMS+version.config. An example is my8020.c10b40 where my means MySQL, 8020 is version 8.0.20 and c10b40 is the name for the configuration file.
The test server has 48 cores, 128G RAM and 2 NVMe devices setup with SW RAID. The benchmark was run with 20 clients and there were 1 or 3 connections per client (1 for queries or inserts without rate limits, 1+1 for rate limited inserts+deletes). It uses 12 tables with a table per client. It loads 10M rows per table without secondary indexes, creates 3 secondary indexes per table, then inserts 40m+10m rows per table with a delete per insert to avoid growing the table. It then does 6 read+write tests for 3600s each that do queries as fast as possible with 100,100,500,500,1000,1000 inserts/s and the same for deletes/s per client concurrent with the queries. The database is larger than RAM and most tests are IO-bound except for the range query (qr*) tests that frequently have a cached working set. Clients and the DBMS share one server.
The tested DBMS are:
- pg1222_o2nofp.cx10a_c32r128 - Postgres 12.22 with the cx10a_c32r128 config
- pg1323_o2nofp.cx10a_c32r128 - Postgres 13.23 with the cx10a_c32r128 config
- pg1420_o2nofp.cx10a_c32r128 - Postgres 14.20 with the cx10a_c32r128 config
- pg1515_o2nofp.cx10a_c32r128 - Postgres 15.15 with the cx10a_c32r128 config
- pg1611_o2nofp.cx10a_c32r128 - Postgres 16.11 with the cx10a_c32r128 config
- pg177_o2nofp.cx10a_c32r128 - Postgres 17.7 with the cx10a_c32r128 config
- pg181_o2nofp.cx10b_c32r128 - Postgres 18.1 with the cx10b_c32r128 config that uses io_method=sync
Contents
- Summary
- l.i0: load without secondary indexes
- l.x: create secondary indexes
- l.i1: continue load after secondary indexes created with 50 inserts per transaction
- l.i2: continue load after secondary indexes created with 5 inserts per transaction
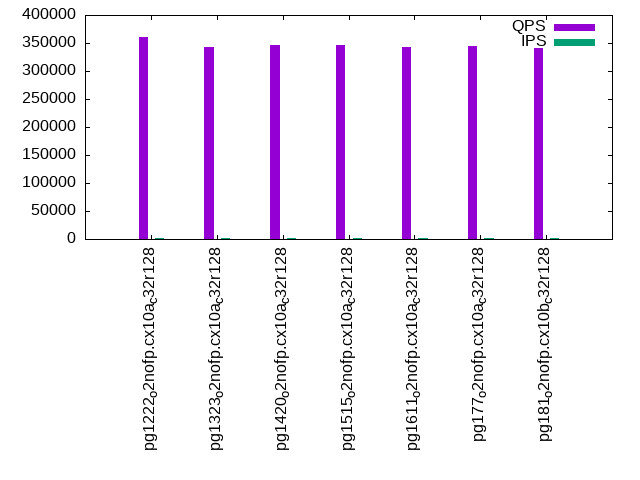
- qr100.L1: range queries with 100 insert/s per client
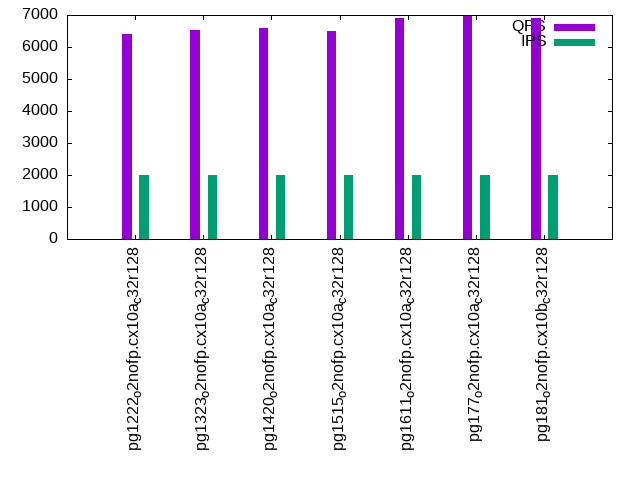
- qp100.L2: point queries with 100 insert/s per client
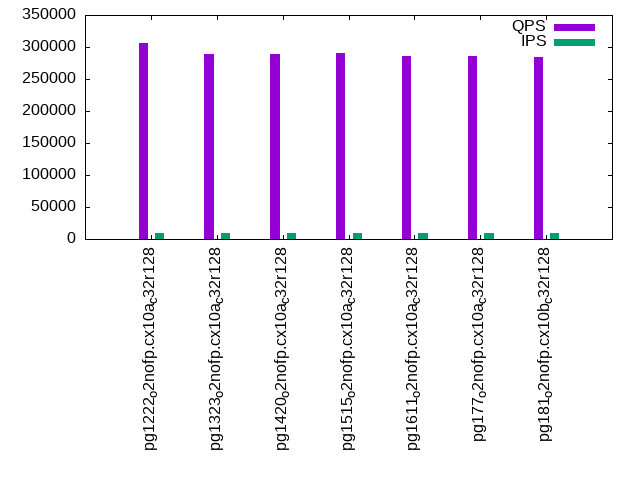
- qr500.L3: range queries with 500 insert/s per client
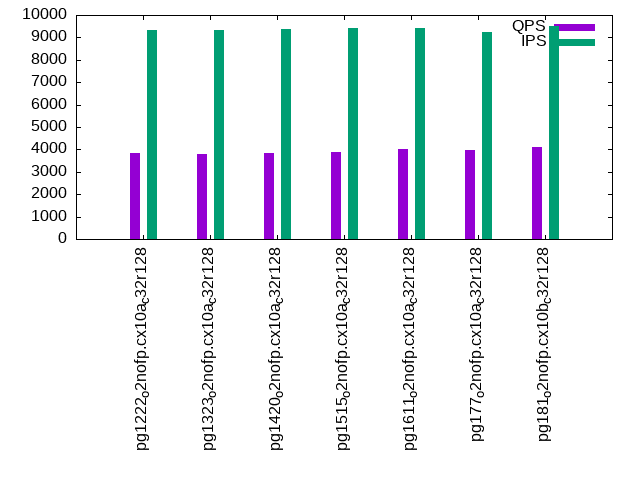
- qp500.L4: point queries with 500 insert/s per client
- qr1000.L5: range queries with 1000 insert/s per client
- qp1000.L6: point queries with 1000 insert/s per client
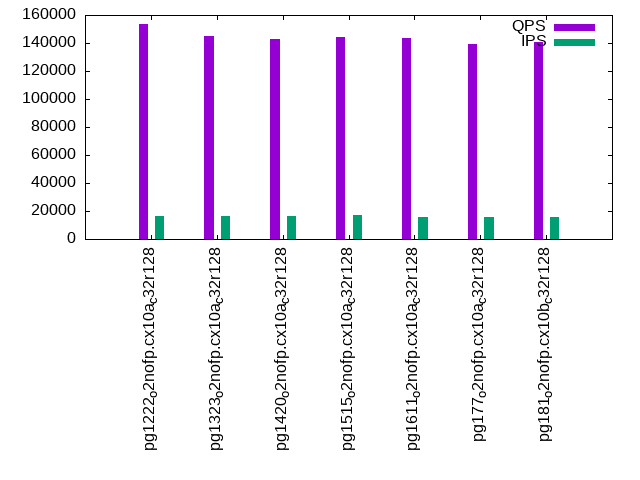
Summary
The numbers are inserts/s for l.i0, l.i1 and l.i2, indexed docs (or rows) /s for l.x and queries/s for qr100, qp100 thru qr1000, qp1000" The values are the average rate over the entire test for inserts (IPS) and queries (QPS). The range of values for IPS and QPS is split into 3 parts: bottom 25%, middle 50%, top 25%. Values in the bottom 25% have a red background, values in the top 25% have a green background and values in the middle have no color. A gray background is used for values that can be ignored because the DBMS did not sustain the target insert rate. Red backgrounds are not used when the minimum value is within 80% of the max value.
| dbms | l.i0 | l.x | l.i1 | l.i2 | qr100 | qp100 | qr500 | qp500 | qr1000 | qp1000 |
|---|---|---|---|---|---|---|---|---|---|---|
| pg1222_o2nofp.cx10a_c32r128 | 2058672 | 2147075 | 22529 | 3184 | 361060 | 6398 | 306152 | 3826 | 153763 | 1989 |
| pg1323_o2nofp.cx10a_c32r128 | 2025316 | 2735978 | 20450 | 3372 | 343541 | 6540 | 289408 | 3816 | 144708 | 1959 |
| pg1420_o2nofp.cx10a_c32r128 | 1986097 | 2793296 | 22051 | 2869 | 346912 | 6591 | 289071 | 3847 | 142684 | 1964 |
| pg1515_o2nofp.cx10a_c32r128 | 1993024 | 2647254 | 22087 | 2896 | 345942 | 6490 | 290091 | 3887 | 144307 | 1945 |
| pg1611_o2nofp.cx10a_c32r128 | 2002002 | 2791347 | 22057 | 2597 | 343245 | 6901 | 285527 | 4039 | 143551 | 2052 |
| pg177_o2nofp.cx10a_c32r128 | 2027369 | 3341688 | 22415 | 2437 | 344865 | 6972 | 286298 | 3963 | 139108 | 2090 |
| pg181_o2nofp.cx10b_c32r128 | 2073613 | 3319502 | 22516 | 2486 | 341583 | 6905 | 283872 | 4087 | 140474 | 2294 |
This table has relative throughput, throughput for the DBMS relative to the DBMS in the first line, using the absolute throughput from the previous table. Values less than 0.95 have a yellow background. Values greater than 1.05 have a blue background.
| dbms | l.i0 | l.x | l.i1 | l.i2 | qr100 | qp100 | qr500 | qp500 | qr1000 | qp1000 |
|---|---|---|---|---|---|---|---|---|---|---|
| pg1222_o2nofp.cx10a_c32r128 | 1.00 | 1.00 | 1.00 | 1.00 | 1.00 | 1.00 | 1.00 | 1.00 | 1.00 | 1.00 |
| pg1323_o2nofp.cx10a_c32r128 | 0.98 | 1.27 | 0.91 | 1.06 | 0.95 | 1.02 | 0.95 | 1.00 | 0.94 | 0.98 |
| pg1420_o2nofp.cx10a_c32r128 | 0.96 | 1.30 | 0.98 | 0.90 | 0.96 | 1.03 | 0.94 | 1.01 | 0.93 | 0.99 |
| pg1515_o2nofp.cx10a_c32r128 | 0.97 | 1.23 | 0.98 | 0.91 | 0.96 | 1.01 | 0.95 | 1.02 | 0.94 | 0.98 |
| pg1611_o2nofp.cx10a_c32r128 | 0.97 | 1.30 | 0.98 | 0.82 | 0.95 | 1.08 | 0.93 | 1.06 | 0.93 | 1.03 |
| pg177_o2nofp.cx10a_c32r128 | 0.98 | 1.56 | 0.99 | 0.77 | 0.96 | 1.09 | 0.94 | 1.04 | 0.90 | 1.05 |
| pg181_o2nofp.cx10b_c32r128 | 1.01 | 1.55 | 1.00 | 0.78 | 0.95 | 1.08 | 0.93 | 1.07 | 0.91 | 1.15 |
This lists the average rate of inserts/s for the tests that do inserts concurrent with queries. For such tests the query rate is listed in the table above. The read+write tests are setup so that the insert rate should match the target rate every second. Cells that are not at least 95% of the target have a red background to indicate a failure to satisfy the target.
| dbms | qr100.L1 | qp100.L2 | qr500.L3 | qp500.L4 | qr1000.L5 | qp1000.L6 |
|---|---|---|---|---|---|---|
| pg1222_o2nofp.cx10a_c32r128 | 1988 | 1987 | 9885 | 9317 | 16725 | 15003 |
| pg1323_o2nofp.cx10a_c32r128 | 1987 | 1987 | 9860 | 9343 | 16536 | 14688 |
| pg1420_o2nofp.cx10a_c32r128 | 1987 | 1987 | 9885 | 9353 | 16371 | 14736 |
| pg1515_o2nofp.cx10a_c32r128 | 1987 | 1987 | 9874 | 9409 | 17013 | 14703 |
| pg1611_o2nofp.cx10a_c32r128 | 1987 | 1987 | 9896 | 9426 | 15940 | 13284 |
| pg177_o2nofp.cx10a_c32r128 | 1987 | 1987 | 9912 | 9259 | 15731 | 13425 |
| pg181_o2nofp.cx10b_c32r128 | 1987 | 1987 | 9904 | 9501 | 15873 | 14165 |
| target | 2000 | 2000 | 10000 | 10000 | 20000 | 20000 |
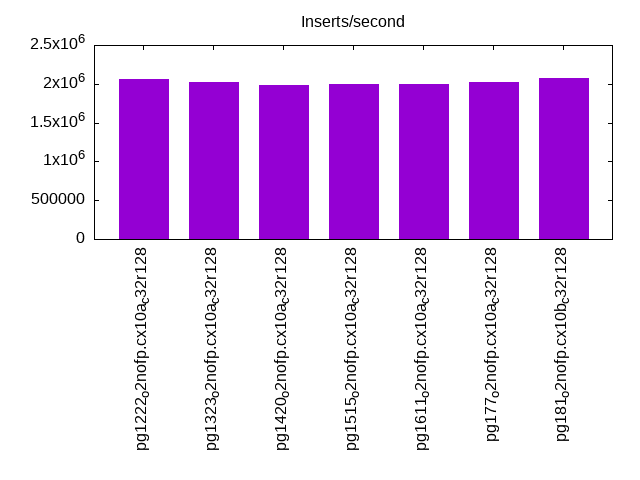
l.i0
l.i0: load without secondary indexes. Graphs for performance per 1-second interval are here.
Average throughput:
Insert response time histogram: each cell has the percentage of responses that take <= the time in the header and max is the max response time in seconds. For the max column values in the top 25% of the range have a red background and in the bottom 25% of the range have a green background. The red background is not used when the min value is within 80% of the max value.
| dbms | 256us | 1ms | 4ms | 16ms | 64ms | 256ms | 1s | 4s | 16s | gt | max |
|---|---|---|---|---|---|---|---|---|---|---|---|
| pg1222_o2nofp.cx10a_c32r128 | 92.765 | 7.009 | 0.120 | 0.087 | 0.013 | 0.006 | nonzero | 1.959 | |||
| pg1323_o2nofp.cx10a_c32r128 | 91.437 | 8.272 | 0.180 | 0.094 | 0.010 | 0.006 | nonzero | 1.652 | |||
| pg1420_o2nofp.cx10a_c32r128 | 89.116 | 10.611 | 0.189 | 0.064 | 0.014 | 0.007 | nonzero | 1.363 | |||
| pg1515_o2nofp.cx10a_c32r128 | 89.254 | 10.490 | 0.167 | 0.066 | 0.016 | 0.006 | nonzero | 2.379 | |||
| pg1611_o2nofp.cx10a_c32r128 | 89.419 | 10.364 | 0.133 | 0.062 | 0.016 | 0.006 | nonzero | 2.629 | |||
| pg177_o2nofp.cx10a_c32r128 | 90.038 | 9.704 | 0.171 | 0.063 | 0.017 | 0.006 | 0.727 | ||||
| pg181_o2nofp.cx10b_c32r128 | 92.951 | 6.739 | 0.213 | 0.072 | 0.020 | 0.006 | nonzero | 1.418 |
Performance metrics for the DBMS listed above. Some are normalized by throughput, others are not. Legend for results is here.
ips	qps	rps	rmbps	wps	wmbps	rpq	rkbpq	wpi	wkbpi	csps	cpups	cspq	cpupq	dbgb1	dbgb2	rss	maxop	p50	p99	tag
2058672	0	1862	15.0	11362.7	825.7	0.001	0.007	0.006	0.411	341356	59.1	0.166	14	382.7	478.8	5.3	1.959	110739	41654	pg1222_o2nofp.cx10a_c32r128
2025316	0	1758	14.2	9083.3	814.2	0.001	0.007	0.004	0.412	349922	58.4	0.173	14	382.7	478.8	9.2	1.652	111080	34561	pg1323_o2nofp.cx10a_c32r128
1986097	0	1685	13.2	8347.8	793.0	0.001	0.007	0.004	0.409	342492	57.6	0.172	14	382.7	478.8	16.2	1.363	109111	32578	pg1420_o2nofp.cx10a_c32r128
1993024	0	1651	12.9	8351.0	794.8	0.001	0.007	0.004	0.408	373442	57.1	0.187	14	382.7	478.8	6.9	2.379	109080	28569	pg1515_o2nofp.cx10a_c32r128
2002002	0	1720	13.5	8413.8	801.9	0.001	0.007	0.004	0.410	367875	57.6	0.184	14	382.7	478.8	16.4	2.629	108782	27770	pg1611_o2nofp.cx10a_c32r128
2027369	0	1723	13.8	8487.2	809.4	0.001	0.007	0.004	0.409	381907	57.5	0.188	14	382.7	478.8	96.9	0.727	109497	35764	pg177_o2nofp.cx10a_c32r128
2073613	0	1742	13.9	8657.6	825.3	0.001	0.007	0.004	0.408	355147	57.7	0.171	13	382.7	478.8	96.6	1.418	113475	34861	pg181_o2nofp.cx10b_c32r128
Average values from iostat.
r/s	rkB/s	rrqm/s	%rrqm	r_await	rareq-s	w/s	wkB/s	wrqm/s	%wrqm	w_await	wareq-s	d/s	dkB/s	drqm/s	%drqm	d_await	dareq-s	f/s	f_await	aqu-sz	%util
115.6	1099.9	82.24	3.683	0.165	7.078	10177.3	847333	1632.6	11.45	1.856	87.07	0.000	0.000	0.000	0.000	0.000	0.000	0.000	0.000	19.93	93.38		pg1222_o2nofp.cx10a_c32r128
211.9	1750.0	68.21	11.87	0.175	6.902	7903.1	836203	1807.7	15.07	1.702	106.6	0.000	0.000	0.000	0.000	0.000	0.000	0.000	0.000	14.74	92.66		pg1323_o2nofp.cx10a_c32r128
873.5	7267.9	167.3	11.89	0.171	6.833	7708.8	815377	1483.6	13.05	1.962	107.1	0.000	0.000	0.000	0.000	0.000	0.000	0.000	0.000	16.80	93.81		pg1420_o2nofp.cx10a_c32r128
797.5	6373.6	37.95	7.970	0.147	5.597	7701.2	815499	1065.5	10.25	1.786	107.0	0.000	0.000	0.000	0.000	0.000	0.000	0.000	0.000	15.18	93.63		pg1515_o2nofp.cx10a_c32r128
850.3	6796.2	62.01	6.617	0.130	7.044	7749.3	823189	1168.1	11.20	2.108	107.3	0.000	0.000	0.000	0.000	0.000	0.000	0.000	0.000	18.15	94.09		pg1611_o2nofp.cx10a_c32r128
849.5	7022.8	77.74	11.98	0.163	6.721	7811.4	830916	1190.5	11.12	2.171	107.6	0.000	0.000	0.000	0.000	0.000	0.000	0.000	0.000	18.70	93.79		pg177_o2nofp.cx10a_c32r128
844.6	6976.2	78.61	8.431	0.150	6.672	7964.9	847424	1274.8	11.85	2.395	107.5	0.000	0.000	0.000	0.000	0.000	0.000	0.000	0.000	20.92	93.36		pg181_o2nofp.cx10b_c32r128
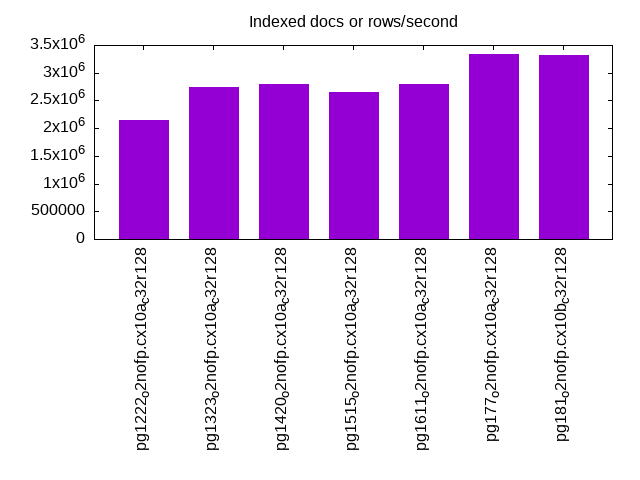
l.x
l.x: create secondary indexes.
Average throughput:
Performance metrics for the DBMS listed above. Some are normalized by throughput, others are not. Legend for results is here.
ips	qps	rps	rmbps	wps	wmbps	rpq	rkbpq	wpi	wkbpi	csps	cpups	cspq	cpupq	dbgb1	dbgb2	rss	maxop	p50	p99	tag
2147075	0	10892	684.1	10874.2	860.0	0.005	0.326	0.005	0.410	180712	18.5	0.084	4	768.8	864.8	50.2	0.076	NA	NA	pg1222_o2nofp.cx10a_c32r128
2735978	0	13859	871.3	7189.3	786.1	0.005	0.326	0.003	0.294	151779	21.5	0.055	4	768.4	864.5	42.4	0.012	NA	NA	pg1323_o2nofp.cx10a_c32r128
2793296	0	14150	889.6	7250.1	802.9	0.005	0.326	0.003	0.294	153521	21.4	0.055	4	768.4	863.6	43.6	0.011	NA	NA	pg1420_o2nofp.cx10a_c32r128
2647254	0	14701	933.5	7686.3	844.8	0.006	0.361	0.003	0.327	147306	20.2	0.056	4	768.4	864.5	52.3	0.009	NA	NA	pg1515_o2nofp.cx10a_c32r128
2791347	0	14091	889.6	7391.2	803.2	0.005	0.326	0.003	0.295	154340	20.9	0.055	4	768.4	864.5	30.7	0.008	NA	NA	pg1611_o2nofp.cx10a_c32r128
3341688	0	10927	1063.8	8618.3	956.0	0.003	0.326	0.003	0.293	87188	23.3	0.026	3	768.4	863.9	31.5	0.133	NA	NA	pg177_o2nofp.cx10a_c32r128
3319502	0	10833	1055.0	8557.4	948.8	0.003	0.325	0.003	0.293	87846	23.1	0.026	3	768.4	863.7	21.6	0.003	NA	NA	pg181_o2nofp.cx10b_c32r128
Average values from iostat.
r/s	rkB/s	rrqm/s	%rrqm	r_await	rareq-s	w/s	wkB/s	wrqm/s	%wrqm	w_await	wareq-s	d/s	dkB/s	drqm/s	%drqm	d_await	dareq-s	f/s	f_await	aqu-sz	%util
5368.8	327116	344.1	2.535	0.325	62.67	10372.3	889128	2650.3	14.99	4.077	102.4	0.000	0.000	0.000	0.000	0.000	0.000	0.000	0.000	32.08	94.54		pg1222_o2nofp.cx10a_c32r128
6650.9	417855	178.2	1.209	0.354	64.11	6674.8	809798	1740.2	14.49	6.074	122.3	0.000	0.000	0.000	0.000	0.000	0.000	0.000	0.000	41.94	94.00		pg1323_o2nofp.cx10a_c32r128
6730.5	429305	82.96	0.576	0.355	64.67	6664.2	824720	1233.5	13.43	6.249	123.8	0.000	0.000	0.000	0.000	0.000	0.000	0.000	0.000	43.56	93.61		pg1420_o2nofp.cx10a_c32r128
7372.6	466859	260.7	1.152	0.377	65.90	7234.8	871172	1967.5	13.70	6.566	121.8	0.000	0.000	0.000	0.000	0.000	0.000	0.000	0.000	51.66	89.30		pg1515_o2nofp.cx10a_c32r128
6950.4	432685	239.9	1.145	0.356	64.61	7246.6	829694	1938.5	13.52	6.037	119.7	0.000	0.000	0.000	0.000	0.000	0.000	0.000	0.000	44.72	90.72		pg1611_o2nofp.cx10a_c32r128
5351.0	519017	534.5	1.883	0.447	90.11	8342.3	986718	2235.5	13.37	6.523	120.9	0.000	0.000	0.000	0.000	0.000	0.000	0.000	0.000	54.58	94.45		pg177_o2nofp.cx10a_c32r128
5349.4	516377	525.7	2.601	0.441	89.35	8682.5	981762	2424.2	13.03	6.206	119.2	0.000	0.000	0.000	0.000	0.000	0.000	0.000	0.000	52.44	93.69		pg181_o2nofp.cx10b_c32r128
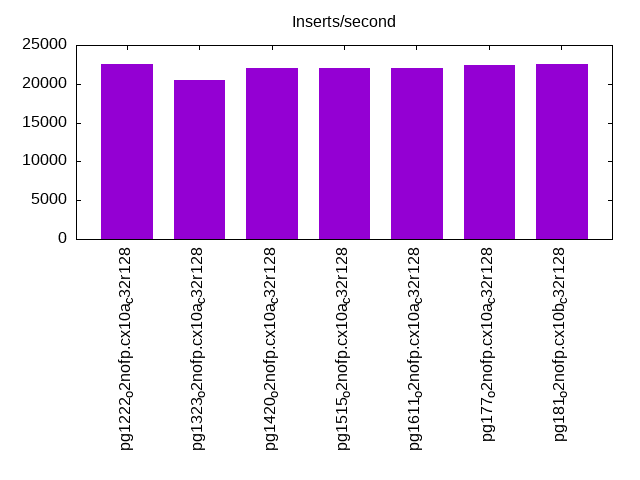
l.i1
l.i1: continue load after secondary indexes created with 50 inserts per transaction. Graphs for performance per 1-second interval are here.
Average throughput:
Insert response time histogram: each cell has the percentage of responses that take <= the time in the header and max is the max response time in seconds. For the max column values in the top 25% of the range have a red background and in the bottom 25% of the range have a green background. The red background is not used when the min value is within 80% of the max value.
| dbms | 256us | 1ms | 4ms | 16ms | 64ms | 256ms | 1s | 4s | 16s | gt | max |
|---|---|---|---|---|---|---|---|---|---|---|---|
| pg1222_o2nofp.cx10a_c32r128 | 22.876 | 57.736 | 19.178 | 0.085 | 0.124 | 0.001 | 5.877 | ||||
| pg1323_o2nofp.cx10a_c32r128 | 19.451 | 55.797 | 24.538 | 0.118 | 0.095 | nonzero | 5.523 | ||||
| pg1420_o2nofp.cx10a_c32r128 | 19.997 | 59.692 | 20.104 | 0.095 | 0.111 | nonzero | 4.978 | ||||
| pg1515_o2nofp.cx10a_c32r128 | 19.375 | 60.516 | 19.873 | 0.117 | 0.118 | 3.629 | |||||
| pg1611_o2nofp.cx10a_c32r128 | 18.921 | 61.478 | 19.413 | 0.075 | 0.112 | 0.001 | 6.370 | ||||
| pg177_o2nofp.cx10a_c32r128 | 18.034 | 62.821 | 18.962 | 0.068 | 0.115 | 3.726 | |||||
| pg181_o2nofp.cx10b_c32r128 | 17.824 | 63.748 | 18.247 | 0.071 | 0.109 | 3.704 |
Delete response time histogram: each cell has the percentage of responses that take <= the time in the header and max is the max response time in seconds. For the max column values in the top 25% of the range have a red background and in the bottom 25% of the range have a green background. The red background is not used when the min value is within 80% of the max value.
| dbms | 256us | 1ms | 4ms | 16ms | 64ms | 256ms | 1s | 4s | 16s | gt | max |
|---|---|---|---|---|---|---|---|---|---|---|---|
| pg1222_o2nofp.cx10a_c32r128 | 2.680 | 10.086 | 30.731 | 51.763 | 4.662 | 0.026 | 0.052 | 3.195 | |||
| pg1323_o2nofp.cx10a_c32r128 | 2.370 | 12.834 | 30.928 | 47.000 | 6.764 | 0.055 | 0.049 | 2.995 | |||
| pg1420_o2nofp.cx10a_c32r128 | 2.325 | 9.038 | 25.230 | 57.952 | 5.355 | 0.039 | 0.060 | 2.373 | |||
| pg1515_o2nofp.cx10a_c32r128 | 2.531 | 9.403 | 23.180 | 59.318 | 5.462 | 0.046 | 0.060 | 2.908 | |||
| pg1611_o2nofp.cx10a_c32r128 | 2.223 | 7.785 | 21.627 | 62.077 | 6.188 | 0.034 | 0.065 | 3.093 | |||
| pg177_o2nofp.cx10a_c32r128 | 2.448 | 8.465 | 22.136 | 61.393 | 5.470 | 0.023 | 0.066 | 2.375 | |||
| pg181_o2nofp.cx10b_c32r128 | 2.378 | 8.485 | 25.995 | 57.834 | 5.218 | 0.032 | 0.057 | 2.344 |
Performance metrics for the DBMS listed above. Some are normalized by throughput, others are not. Legend for results is here.
ips	qps	rps	rmbps	wps	wmbps	rpq	rkbpq	wpi	wkbpi	csps	cpups	cspq	cpupq	dbgb1	dbgb2	rss	maxop	p50	p99	tag
22529	0	28467	225.7	32764.7	717.3	1.264	10.258	1.454	32.602	81793	29.8	3.631	635	781.9	879.1	83.4	5.877	1049	0	pg1222_o2nofp.cx10a_c32r128
20450	0	26684	250.7	31136.4	703.6	1.305	12.555	1.523	35.233	76294	27.8	3.731	653	781.3	941.0	3.3	5.523	949	0	pg1323_o2nofp.cx10a_c32r128
22051	0	27883	223.1	32376.4	723.4	1.264	10.363	1.468	33.593	79608	30.8	3.610	670	781.5	918.6	1.8	4.978	1050	0	pg1420_o2nofp.cx10a_c32r128
22087	0	28008	224.5	32052.8	721.4	1.268	10.406	1.451	33.445	81204	31.5	3.677	685	781.5	907.1	1.8	3.629	1049	0	pg1515_o2nofp.cx10a_c32r128
22057	0	28003	224.0	32258.8	718.8	1.270	10.401	1.463	33.371	77491	32.1	3.513	699	781.5	877.6	2.1	6.370	1099	0	pg1611_o2nofp.cx10a_c32r128
22415	0	28352	226.2	32701.9	727.1	1.265	10.335	1.459	33.218	78485	31.0	3.501	664	781.5	877.6	76.8	3.726	1099	0	pg177_o2nofp.cx10a_c32r128
22516	0	28523	226.9	33601.6	731.6	1.267	10.317	1.492	33.272	78927	31.0	3.505	661	781.5	877.6	82.1	3.704	1099	0	pg181_o2nofp.cx10b_c32r128
Average values from iostat.
r/s	rkB/s	rrqm/s	%rrqm	r_await	rareq-s	w/s	wkB/s	wrqm/s	%wrqm	w_await	wareq-s	d/s	dkB/s	drqm/s	%drqm	d_await	dareq-s	f/s	f_await	aqu-sz	%util
15812.7	124189	1579.0	9.669	0.108	7.825	40251.1	772968	2136.6	5.426	0.218	21.54	0.000	0.000	0.000	0.000	0.000	0.000	0.000	0.000	10.62	89.41		pg1222_o2nofp.cx10a_c32r128
14932.9	137064	1696.7	9.893	0.119	9.337	37535.1	757474	2846.2	6.917	0.265	22.37	0.000	0.000	0.000	0.000	0.000	0.000	0.000	0.000	11.94	87.92		pg1323_o2nofp.cx10a_c32r128
15546.5	123175	1483.2	9.251	0.113	7.913	39927.3	778170	1809.4	4.668	0.273	22.10	0.000	0.000	0.000	0.000	0.000	0.000	0.000	0.000	12.86	89.86		pg1420_o2nofp.cx10a_c32r128
15707.9	124159	1525.1	9.085	0.114	7.919	39699.2	777437	2038.6	5.001	0.271	21.17	0.000	0.000	0.000	0.000	0.000	0.000	0.000	0.000	12.80	89.52		pg1515_o2nofp.cx10a_c32r128
15347.6	122745	1513.3	9.471	0.113	7.997	39282.4	771126	1749.0	4.689	0.267	22.23	0.000	0.000	0.000	0.000	0.000	0.000	0.000	0.000	12.58	88.99		pg1611_o2nofp.cx10a_c32r128
15476.4	123347	1479.7	9.248	0.114	7.958	39647.4	779361	1749.0	4.711	0.279	22.23	0.000	0.000	0.000	0.000	0.000	0.000	0.000	0.000	13.07	89.35		pg177_o2nofp.cx10a_c32r128
15591.5	123926	1498.2	9.120	0.113	7.935	39940.0	783728	2307.6	5.788	0.263	21.47	0.000	0.000	0.000	0.000	0.000	0.000	0.000	0.000	12.57	89.46		pg181_o2nofp.cx10b_c32r128
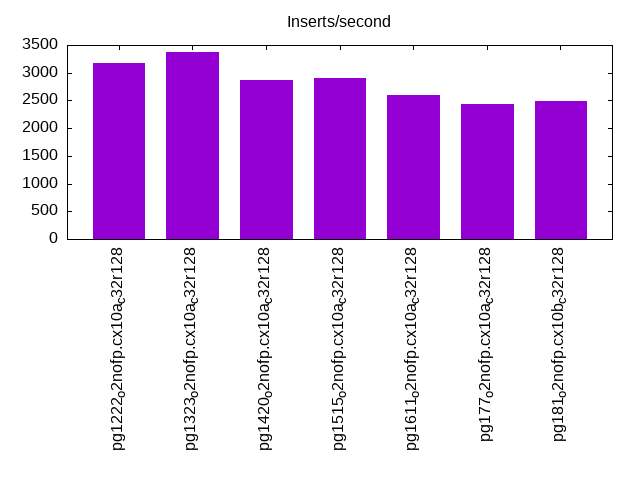
l.i2
l.i2: continue load after secondary indexes created with 5 inserts per transaction. Graphs for performance per 1-second interval are here.
Average throughput:
Insert response time histogram: each cell has the percentage of responses that take <= the time in the header and max is the max response time in seconds. For the max column values in the top 25% of the range have a red background and in the bottom 25% of the range have a green background. The red background is not used when the min value is within 80% of the max value.
| dbms | 256us | 1ms | 4ms | 16ms | 64ms | 256ms | 1s | 4s | 16s | gt | max |
|---|---|---|---|---|---|---|---|---|---|---|---|
| pg1222_o2nofp.cx10a_c32r128 | nonzero | 38.455 | 60.817 | 0.262 | 0.277 | 0.045 | 0.101 | 0.043 | nonzero | 4.410 | |
| pg1323_o2nofp.cx10a_c32r128 | 0.124 | 42.876 | 55.647 | 0.329 | 0.931 | 0.033 | 0.050 | 0.010 | nonzero | 4.482 | |
| pg1420_o2nofp.cx10a_c32r128 | 0.004 | 31.347 | 67.951 | 0.308 | 0.219 | 0.042 | 0.099 | 0.030 | nonzero | 5.714 | |
| pg1515_o2nofp.cx10a_c32r128 | 0.198 | 37.098 | 61.732 | 0.330 | 0.548 | 0.025 | 0.048 | 0.021 | nonzero | 4.810 | |
| pg1611_o2nofp.cx10a_c32r128 | 0.057 | 36.232 | 63.293 | 0.047 | 0.266 | 0.023 | 0.058 | 0.023 | nonzero | 4.646 | |
| pg177_o2nofp.cx10a_c32r128 | 0.042 | 33.708 | 65.620 | 0.115 | 0.383 | 0.031 | 0.069 | 0.032 | nonzero | 5.933 | |
| pg181_o2nofp.cx10b_c32r128 | 0.030 | 38.329 | 61.337 | 0.048 | 0.168 | 0.022 | 0.049 | 0.018 | 3.923 |
Delete response time histogram: each cell has the percentage of responses that take <= the time in the header and max is the max response time in seconds. For the max column values in the top 25% of the range have a red background and in the bottom 25% of the range have a green background. The red background is not used when the min value is within 80% of the max value.
| dbms | 256us | 1ms | 4ms | 16ms | 64ms | 256ms | 1s | 4s | 16s | gt | max |
|---|---|---|---|---|---|---|---|---|---|---|---|
| pg1222_o2nofp.cx10a_c32r128 | 8.443 | 91.553 | 0.002 | 0.002 | 0.001 | 2.114 | |||||
| pg1323_o2nofp.cx10a_c32r128 | 0.067 | 2.597 | 15.046 | 26.014 | 56.266 | 0.003 | 0.006 | nonzero | 1.422 | ||
| pg1420_o2nofp.cx10a_c32r128 | 0.044 | 1.157 | 0.017 | 6.782 | 91.995 | 0.003 | 0.002 | nonzero | 2.767 | ||
| pg1515_o2nofp.cx10a_c32r128 | 0.179 | 4.950 | 5.544 | 2.556 | 86.764 | 0.003 | 0.003 | nonzero | 3.166 | ||
| pg1611_o2nofp.cx10a_c32r128 | 0.109 | 2.408 | 1.236 | 0.112 | 96.130 | 0.004 | 0.001 | nonzero | 2.276 | ||
| pg177_o2nofp.cx10a_c32r128 | 0.186 | 2.335 | 1.438 | 0.208 | 95.830 | 0.002 | 0.001 | 0.001 | 3.436 | ||
| pg181_o2nofp.cx10b_c32r128 | 0.015 | 0.842 | 2.794 | 0.429 | 95.915 | 0.003 | 0.001 | 0.001 | 2.399 |
Performance metrics for the DBMS listed above. Some are normalized by throughput, others are not. Legend for results is here.
ips	qps	rps	rmbps	wps	wmbps	rpq	rkbpq	wpi	wkbpi	csps	cpups	cspq	cpupq	dbgb1	dbgb2	rss	maxop	p50	p99	tag
3184	0	3917	31.2	6237.0	97.9	1.230	10.023	1.959	31.497	26400	31.5	8.292	4749	785.2	881.3	84.1	4.410	265	0	pg1222_o2nofp.cx10a_c32r128
3372	0	4102	43.9	6308.6	107.1	1.216	13.334	1.871	32.520	27038	23.9	8.018	3402	784.2	880.2	7.8	4.482	265	125	pg1323_o2nofp.cx10a_c32r128
2869	0	3582	31.3	5623.7	86.7	1.249	11.171	1.960	30.939	24162	29.2	8.423	4886	784.9	880.9	3.7	5.714	135	70	pg1420_o2nofp.cx10a_c32r128
2896	0	3650	37.3	5703.6	90.9	1.260	13.201	1.969	32.157	23768	26.4	8.207	4376	784.8	880.8	35.5	4.810	145	80	pg1515_o2nofp.cx10a_c32r128
2597	0	3292	31.1	5103.3	82.1	1.267	12.269	1.965	32.371	21414	29.4	8.244	5433	784.8	880.9	3.9	4.646	125	80	pg1611_o2nofp.cx10a_c32r128
2437	0	3185	32.7	5175.5	82.1	1.307	13.725	2.124	34.513	18779	25.4	7.707	5004	784.8	880.9	80.9	5.933	215	40	pg177_o2nofp.cx10a_c32r128
2486	0	3070	26.4	4602.2	73.3	1.235	10.872	1.851	30.206	18816	30.5	7.570	5890	784.8	880.8	72.4	3.923	115	100	pg181_o2nofp.cx10b_c32r128
Average values from iostat.
r/s	rkB/s	rrqm/s	%rrqm	r_await	rareq-s	w/s	wkB/s	wrqm/s	%wrqm	w_await	wareq-s	d/s	dkB/s	drqm/s	%drqm	d_await	dareq-s	f/s	f_await	aqu-sz	%util
1012.6	7792.4	75.02	5.857	0.083	7.892	7413.3	105641	170.8	2.045	0.044	14.79	0.000	0.000	0.000	0.000	0.000	0.000	0.000	0.000	0.480	66.88		pg1222_o2nofp.cx10a_c32r128
1316.3	15888.4	110.9	8.296	0.087	8.866	7630.6	115673	185.1	2.569	0.050	15.42	0.000	0.000	0.000	0.000	0.000	0.000	0.000	0.000	0.806	60.61		pg1323_o2nofp.cx10a_c32r128
936.8	8922.3	65.87	7.427	0.084	8.307	6836.5	94266.2	174.3	2.658	0.048	14.69	0.000	0.000	0.000	0.000	0.000	0.000	0.000	0.000	0.438	63.63		pg1420_o2nofp.cx10a_c32r128
1043.1	12992.7	82.08	8.519	0.086	8.870	6932.6	98680.9	164.5	2.488	0.053	15.26	0.000	0.000	0.000	0.000	0.000	0.000	0.000	0.000	0.554	60.09		pg1515_o2nofp.cx10a_c32r128
842.1	9521.0	88.64	12.10	0.085	8.508	6260.4	89281.1	145.7	2.284	0.051	15.41	0.000	0.000	0.000	0.000	0.000	0.000	0.000	0.000	0.459	61.59		pg1611_o2nofp.cx10a_c32r128
911.6	11670.3	80.42	13.00	0.086	9.054	6300.8	89003.3	107.6	1.753	0.051	15.40	0.000	0.000	0.000	0.000	0.000	0.000	0.000	0.000	0.486	55.75		pg177_o2nofp.cx10a_c32r128
707.7	6592.0	71.94	9.446	0.082	8.051	5601.2	79593.7	144.3	3.055	0.053	16.23	0.000	0.000	0.000	0.000	0.000	0.000	0.000	0.000	0.372	60.42		pg181_o2nofp.cx10b_c32r128
qr100.L1
qr100.L1: range queries with 100 insert/s per client. Graphs for performance per 1-second interval are here.
Average throughput:
Query response time histogram: each cell has the percentage of responses that take <= the time in the header and max is the max response time in seconds. For max values in the top 25% of the range have a red background and in the bottom 25% of the range have a green background. The red background is not used when the min value is within 80% of the max value.
| dbms | 256us | 1ms | 4ms | 16ms | 64ms | 256ms | 1s | 4s | 16s | gt | max |
|---|---|---|---|---|---|---|---|---|---|---|---|
| pg1222_o2nofp.cx10a_c32r128 | 99.995 | 0.004 | 0.001 | nonzero | nonzero | nonzero | nonzero | 0.601 | |||
| pg1323_o2nofp.cx10a_c32r128 | 99.995 | 0.005 | 0.001 | nonzero | nonzero | nonzero | nonzero | 0.732 | |||
| pg1420_o2nofp.cx10a_c32r128 | 99.995 | 0.004 | 0.001 | nonzero | nonzero | nonzero | nonzero | 0.271 | |||
| pg1515_o2nofp.cx10a_c32r128 | 99.995 | 0.004 | 0.001 | nonzero | nonzero | 0.083 | |||||
| pg1611_o2nofp.cx10a_c32r128 | 99.995 | 0.004 | 0.001 | nonzero | nonzero | nonzero | nonzero | 0.804 | |||
| pg177_o2nofp.cx10a_c32r128 | 99.995 | 0.004 | 0.001 | nonzero | nonzero | nonzero | nonzero | 0.353 | |||
| pg181_o2nofp.cx10b_c32r128 | 99.995 | 0.004 | 0.001 | nonzero | nonzero | nonzero | nonzero | 0.809 |
Insert response time histogram: each cell has the percentage of responses that take <= the time in the header and max is the max response time in seconds. For max values in the top 25% of the range have a red background and in the bottom 25% of the range have a green background. The red background is not used when the min value is within 80% of the max value.
| dbms | 256us | 1ms | 4ms | 16ms | 64ms | 256ms | 1s | 4s | 16s | gt | max |
|---|---|---|---|---|---|---|---|---|---|---|---|
| pg1222_o2nofp.cx10a_c32r128 | 90.944 | 8.803 | 0.120 | 0.125 | 0.008 | 1.349 | |||||
| pg1323_o2nofp.cx10a_c32r128 | 93.187 | 6.615 | 0.068 | 0.130 | 0.998 | ||||||
| pg1420_o2nofp.cx10a_c32r128 | 91.556 | 8.307 | 0.081 | 0.056 | 0.744 | ||||||
| pg1515_o2nofp.cx10a_c32r128 | 90.610 | 9.242 | 0.109 | 0.038 | 0.627 | ||||||
| pg1611_o2nofp.cx10a_c32r128 | 98.945 | 0.947 | 0.050 | 0.058 | 0.996 | ||||||
| pg177_o2nofp.cx10a_c32r128 | 98.469 | 1.416 | 0.048 | 0.061 | 0.006 | 1.116 | |||||
| pg181_o2nofp.cx10b_c32r128 | 98.326 | 1.520 | 0.099 | 0.053 | 0.001 | 1.394 |
Delete response time histogram: each cell has the percentage of responses that take <= the time in the header and max is the max response time in seconds. For max values in the top 25% of the range have a red background and in the bottom 25% of the range have a green background. The red background is not used when the min value is within 80% of the max value.
| dbms | 256us | 1ms | 4ms | 16ms | 64ms | 256ms | 1s | 4s | 16s | gt | max |
|---|---|---|---|---|---|---|---|---|---|---|---|
| pg1222_o2nofp.cx10a_c32r128 | 24.111 | 74.769 | 1.113 | 0.002 | 0.003 | 0.001 | 0.457 | ||||
| pg1323_o2nofp.cx10a_c32r128 | 21.687 | 75.902 | 2.405 | 0.001 | 0.006 | 0.765 | |||||
| pg1420_o2nofp.cx10a_c32r128 | 21.057 | 76.553 | 2.385 | 0.001 | 0.001 | 0.003 | 0.430 | ||||
| pg1515_o2nofp.cx10a_c32r128 | 23.320 | 74.820 | 1.855 | 0.001 | 0.004 | 0.197 | |||||
| pg1611_o2nofp.cx10a_c32r128 | 21.185 | 75.297 | 3.516 | 0.001 | 0.001 | 0.220 | |||||
| pg177_o2nofp.cx10a_c32r128 | 21.790 | 73.509 | 4.698 | 0.002 | 0.001 | 0.001 | 0.385 | ||||
| pg181_o2nofp.cx10b_c32r128 | 22.555 | 74.951 | 2.487 | 0.003 | 0.004 | 0.198 |
Performance metrics for the DBMS listed above. Some are normalized by throughput, others are not. Legend for results is here.
ips	qps	rps	rmbps	wps	wmbps	rpq	rkbpq	wpi	wkbpi	csps	cpups	cspq	cpupq	dbgb1	dbgb2	rss	maxop	p50	p99	tag
1988	361060	2612	21.0	2501.3	46.3	0.007	0.059	1.258	23.854	1379050	43.8	3.819	58	785.8	881.9	96.8	0.601	18332	17613	pg1222_o2nofp.cx10a_c32r128
1987	343541	2595	21.0	2572.3	47.0	0.008	0.062	1.294	24.203	1312310	43.7	3.820	61	784.5	880.5	95.2	0.732	17245	16558	pg1323_o2nofp.cx10a_c32r128
1987	346912	2605	20.9	2577.2	47.0	0.008	0.062	1.297	24.193	1325098	43.7	3.820	60	785.1	881.1	95.7	0.271	17197	16414	pg1420_o2nofp.cx10a_c32r128
1987	345942	2598	20.9	2558.8	46.9	0.008	0.062	1.288	24.148	1321464	43.7	3.820	61	785.1	881.1	96.2	0.083	17571	16798	pg1515_o2nofp.cx10a_c32r128
1987	343245	2683	21.5	2663.9	47.5	0.008	0.064	1.340	24.471	1310599	43.6	3.818	61	785.1	881.1	94.3	0.804	17373	16612	pg1611_o2nofp.cx10a_c32r128
1987	344865	2687	21.6	2697.4	47.8	0.008	0.064	1.357	24.630	1316668	43.6	3.818	61	785.0	881.1	95.1	0.353	17165	16318	pg177_o2nofp.cx10a_c32r128
1987	341583	2628	21.1	2411.8	45.8	0.008	0.063	1.214	23.592	1304597	43.6	3.819	61	785.0	881.0	96.1	0.809	16932	16111	pg181_o2nofp.cx10b_c32r128
Average values from iostat.
r/s	rkB/s	rrqm/s	%rrqm	r_await	rareq-s	w/s	wkB/s	wrqm/s	%wrqm	w_await	wareq-s	d/s	dkB/s	drqm/s	%drqm	d_await	dareq-s	f/s	f_await	aqu-sz	%util
1314.3	10391.9	76.62	4.669	0.094	7.912	3243.1	51636.0	322.1	19.13	0.072	28.73	0.000	0.000	0.000	0.000	0.000	0.000	0.000	0.000	0.299	17.62		pg1222_o2nofp.cx10a_c32r128
1263.8	10166.1	93.35	6.405	0.095	8.050	3287.9	51949.9	253.5	14.44	0.073	24.85	0.000	0.000	0.000	0.000	0.000	0.000	0.000	0.000	0.292	17.54		pg1323_o2nofp.cx10a_c32r128
1300.8	10360.6	83.97	5.584	0.096	7.970	3268.1	51887.2	274.0	15.55	0.077	26.97	0.000	0.000	0.000	0.000	0.000	0.000	0.000	0.000	0.305	17.34		pg1420_o2nofp.cx10a_c32r128
1299.5	10314.8	87.97	5.807	0.095	7.946	3294.2	52086.9	296.8	15.81	0.070	27.44	0.000	0.000	0.000	0.000	0.000	0.000	0.000	0.000	0.299	17.11		pg1515_o2nofp.cx10a_c32r128
1286.9	10347.7	84.70	5.948	0.094	8.035	3316.7	52028.4	201.4	11.62	0.082	22.92	0.000	0.000	0.000	0.000	0.000	0.000	0.000	0.000	0.311	16.93		pg1611_o2nofp.cx10a_c32r128
1288.4	10397.1	80.72	5.461	0.095	8.067	3306.6	52247.6	226.7	14.08	0.079	24.56	0.000	0.000	0.000	0.000	0.000	0.000	0.000	0.000	0.287	17.15		pg177_o2nofp.cx10a_c32r128
1276.6	10288.3	94.64	6.422	0.094	8.065	3124.9	50794.4	297.3	17.03	0.112	26.86	0.000	0.000	0.000	0.000	0.000	0.000	0.000	0.000	0.375	19.33		pg181_o2nofp.cx10b_c32r128
qp100.L2
qp100.L2: point queries with 100 insert/s per client. Graphs for performance per 1-second interval are here.
Average throughput:
Query response time histogram: each cell has the percentage of responses that take <= the time in the header and max is the max response time in seconds. For max values in the top 25% of the range have a red background and in the bottom 25% of the range have a green background. The red background is not used when the min value is within 80% of the max value.
| dbms | 256us | 1ms | 4ms | 16ms | 64ms | 256ms | 1s | 4s | 16s | gt | max |
|---|---|---|---|---|---|---|---|---|---|---|---|
| pg1222_o2nofp.cx10a_c32r128 | nonzero | 2.390 | 93.810 | 0.707 | 2.958 | 0.075 | 0.043 | 0.017 | 0.002 | 6.091 | |
| pg1323_o2nofp.cx10a_c32r128 | 2.231 | 94.087 | 0.624 | 2.916 | 0.079 | 0.048 | 0.015 | 0.001 | 5.458 | ||
| pg1420_o2nofp.cx10a_c32r128 | nonzero | 2.313 | 94.083 | 0.620 | 2.841 | 0.075 | 0.051 | 0.016 | 0.001 | 4.923 | |
| pg1515_o2nofp.cx10a_c32r128 | nonzero | 2.234 | 94.105 | 0.661 | 2.853 | 0.077 | 0.052 | 0.015 | 0.001 | 5.773 | |
| pg1611_o2nofp.cx10a_c32r128 | nonzero | 2.328 | 94.392 | 0.230 | 2.915 | 0.082 | 0.042 | 0.010 | 0.001 | 5.460 | |
| pg177_o2nofp.cx10a_c32r128 | nonzero | 2.230 | 94.436 | 0.242 | 2.976 | 0.073 | 0.032 | 0.011 | 0.001 | 6.693 | |
| pg181_o2nofp.cx10b_c32r128 | nonzero | 2.137 | 94.545 | 0.249 | 2.937 | 0.082 | 0.039 | 0.010 | 0.001 | 5.375 |
Insert response time histogram: each cell has the percentage of responses that take <= the time in the header and max is the max response time in seconds. For max values in the top 25% of the range have a red background and in the bottom 25% of the range have a green background. The red background is not used when the min value is within 80% of the max value.
| dbms | 256us | 1ms | 4ms | 16ms | 64ms | 256ms | 1s | 4s | 16s | gt | max |
|---|---|---|---|---|---|---|---|---|---|---|---|
| pg1222_o2nofp.cx10a_c32r128 | 63.540 | 33.156 | 1.148 | 0.955 | 1.124 | 0.078 | 6.055 | ||||
| pg1323_o2nofp.cx10a_c32r128 | 64.952 | 31.942 | 1.122 | 0.978 | 0.974 | 0.032 | 5.215 | ||||
| pg1420_o2nofp.cx10a_c32r128 | 62.825 | 34.117 | 1.115 | 1.003 | 0.910 | 0.030 | 4.594 | ||||
| pg1515_o2nofp.cx10a_c32r128 | 63.890 | 32.699 | 1.188 | 1.133 | 1.023 | 0.067 | 5.127 | ||||
| pg1611_o2nofp.cx10a_c32r128 | 66.511 | 31.162 | 0.985 | 0.651 | 0.669 | 0.021 | 4.779 | ||||
| pg177_o2nofp.cx10a_c32r128 | 66.153 | 31.394 | 0.919 | 0.739 | 0.776 | 0.019 | 6.736 | ||||
| pg181_o2nofp.cx10b_c32r128 | 64.983 | 32.685 | 0.991 | 0.615 | 0.699 | 0.027 | 5.303 |
Delete response time histogram: each cell has the percentage of responses that take <= the time in the header and max is the max response time in seconds. For max values in the top 25% of the range have a red background and in the bottom 25% of the range have a green background. The red background is not used when the min value is within 80% of the max value.
| dbms | 256us | 1ms | 4ms | 16ms | 64ms | 256ms | 1s | 4s | 16s | gt | max |
|---|---|---|---|---|---|---|---|---|---|---|---|
| pg1222_o2nofp.cx10a_c32r128 | 55.915 | 39.570 | 4.401 | 0.028 | 0.033 | 0.051 | 0.001 | 4.255 | |||
| pg1323_o2nofp.cx10a_c32r128 | 50.146 | 45.094 | 4.665 | 0.019 | 0.040 | 0.036 | 0.001 | 4.470 | |||
| pg1420_o2nofp.cx10a_c32r128 | 46.623 | 48.293 | 4.974 | 0.017 | 0.051 | 0.040 | 0.001 | 4.540 | |||
| pg1515_o2nofp.cx10a_c32r128 | 53.537 | 41.418 | 4.903 | 0.022 | 0.080 | 0.037 | 0.003 | 4.915 | |||
| pg1611_o2nofp.cx10a_c32r128 | 43.539 | 51.183 | 5.243 | 0.014 | 0.013 | 0.008 | 3.417 | ||||
| pg177_o2nofp.cx10a_c32r128 | 43.327 | 52.190 | 4.435 | 0.007 | 0.019 | 0.022 | 3.640 | ||||
| pg181_o2nofp.cx10b_c32r128 | 47.122 | 48.034 | 4.805 | 0.009 | 0.014 | 0.015 | 0.001 | 4.221 |
Performance metrics for the DBMS listed above. Some are normalized by throughput, others are not. Legend for results is here.
ips	qps	rps	rmbps	wps	wmbps	rpq	rkbpq	wpi	wkbpi	csps	cpups	cspq	cpupq	dbgb1	dbgb2	rss	maxop	p50	p99	tag
1987	6398	90413	708.9	5391.8	66.9	14.131	113.456	2.714	34.476	202195	20.8	31.601	1560	786.5	882.5	88.0	6.091	368	0	pg1222_o2nofp.cx10a_c32r128
1987	6540	92252	723.6	5342.0	66.6	14.107	113.299	2.688	34.316	206193	21.2	31.530	1556	784.8	880.9	28.4	5.458	368	0	pg1323_o2nofp.cx10a_c32r128
1987	6591	92930	729.1	5319.8	66.5	14.099	113.281	2.677	34.276	207581	20.9	31.495	1522	785.3	881.4	88.1	4.923	368	0	pg1420_o2nofp.cx10a_c32r128
1987	6490	91586	718.3	5314.7	66.4	14.113	113.347	2.674	34.236	204566	20.5	31.523	1516	785.4	881.4	87.7	5.773	368	0	pg1515_o2nofp.cx10a_c32r128
1987	6901	97024	761.0	5259.9	66.0	14.060	112.923	2.647	33.991	216372	22.3	31.356	1551	785.3	881.3	87.9	5.460	384	0	pg1611_o2nofp.cx10a_c32r128
1987	6972	97991	768.6	5233.2	65.7	14.055	112.885	2.634	33.883	218411	22.5	31.327	1549	785.2	881.3	88.3	6.693	384	0	pg177_o2nofp.cx10a_c32r128
1987	6905	97068	761.3	5479.1	67.6	14.058	112.905	2.757	34.838	216543	22.5	31.362	1564	785.1	881.2	86.7	5.375	384	0	pg181_o2nofp.cx10b_c32r128
Average values from iostat.
r/s	rkB/s	rrqm/s	%rrqm	r_await	rareq-s	w/s	wkB/s	wrqm/s	%wrqm	w_await	wareq-s	d/s	dkB/s	drqm/s	%drqm	d_await	dareq-s	f/s	f_await	aqu-sz	%util
43527.2	349536	404.4	0.951	0.080	8.030	5987.7	80925.8	2514.8	32.02	0.083	15.05	0.000	0.000	0.000	0.000	0.000	0.000	0.000	0.000	4.013	76.26		pg1222_o2nofp.cx10a_c32r128
44407.7	356714	357.8	0.847	0.080	8.032	5887.3	79706.5	2334.4	30.82	0.068	14.86	0.000	0.000	0.000	0.000	0.000	0.000	0.000	0.000	4.004	77.74		pg1323_o2nofp.cx10a_c32r128
44687.3	359015	338.1	0.786	0.080	8.034	5870.9	78986.9	2168.9	29.23	0.070	14.74	0.000	0.000	0.000	0.000	0.000	0.000	0.000	0.000	4.042	78.63		pg1420_o2nofp.cx10a_c32r128
44040.1	353706	362.2	0.858	0.080	8.031	5910.9	79501.8	2272.3	30.38	0.070	14.95	0.000	0.000	0.000	0.000	0.000	0.000	0.000	0.000	4.001	77.60		pg1515_o2nofp.cx10a_c32r128
46877.8	376717	514.3	1.123	0.080	8.036	6065.7	82625.7	2965.1	35.89	0.074	15.21	0.000	0.000	0.000	0.000	0.000	0.000	0.000	0.000	4.261	80.08		pg1611_o2nofp.cx10a_c32r128
47476.3	381503	571.6	1.234	0.080	8.035	6175.7	83284.8	3052.4	35.81	0.082	14.83	0.000	0.000	0.000	0.000	0.000	0.000	0.000	0.000	4.355	79.66		pg177_o2nofp.cx10a_c32r128
46889.6	376711	530.0	1.173	0.080	8.033	6397.0	84650.4	2940.7	35.17	0.083	14.80	0.000	0.000	0.000	0.000	0.000	0.000	0.000	0.000	4.379	80.29		pg181_o2nofp.cx10b_c32r128
qr500.L3
qr500.L3: range queries with 500 insert/s per client. Graphs for performance per 1-second interval are here.
Average throughput:
Query response time histogram: each cell has the percentage of responses that take <= the time in the header and max is the max response time in seconds. For max values in the top 25% of the range have a red background and in the bottom 25% of the range have a green background. The red background is not used when the min value is within 80% of the max value.
| dbms | 256us | 1ms | 4ms | 16ms | 64ms | 256ms | 1s | 4s | 16s | gt | max |
|---|---|---|---|---|---|---|---|---|---|---|---|
| pg1222_o2nofp.cx10a_c32r128 | 99.969 | 0.025 | 0.004 | 0.001 | 0.001 | nonzero | nonzero | nonzero | 3.220 | ||
| pg1323_o2nofp.cx10a_c32r128 | 99.964 | 0.029 | 0.005 | 0.001 | 0.001 | nonzero | nonzero | nonzero | 3.037 | ||
| pg1420_o2nofp.cx10a_c32r128 | 99.962 | 0.031 | 0.005 | 0.001 | 0.002 | nonzero | nonzero | nonzero | 3.641 | ||
| pg1515_o2nofp.cx10a_c32r128 | 99.961 | 0.031 | 0.005 | 0.001 | 0.002 | nonzero | nonzero | nonzero | nonzero | 5.466 | |
| pg1611_o2nofp.cx10a_c32r128 | 99.966 | 0.027 | 0.004 | 0.001 | 0.001 | nonzero | nonzero | nonzero | 2.717 | ||
| pg177_o2nofp.cx10a_c32r128 | 99.968 | 0.025 | 0.005 | 0.001 | 0.001 | nonzero | nonzero | nonzero | 3.332 | ||
| pg181_o2nofp.cx10b_c32r128 | 99.967 | 0.026 | 0.005 | 0.001 | 0.001 | nonzero | nonzero | nonzero | 3.403 |
Insert response time histogram: each cell has the percentage of responses that take <= the time in the header and max is the max response time in seconds. For max values in the top 25% of the range have a red background and in the bottom 25% of the range have a green background. The red background is not used when the min value is within 80% of the max value.
| dbms | 256us | 1ms | 4ms | 16ms | 64ms | 256ms | 1s | 4s | 16s | gt | max |
|---|---|---|---|---|---|---|---|---|---|---|---|
| pg1222_o2nofp.cx10a_c32r128 | 78.547 | 20.351 | 0.635 | 0.330 | 0.135 | 0.002 | 4.488 | ||||
| pg1323_o2nofp.cx10a_c32r128 | 76.439 | 22.467 | 0.641 | 0.311 | 0.140 | 0.002 | 4.559 | ||||
| pg1420_o2nofp.cx10a_c32r128 | 75.705 | 23.059 | 0.763 | 0.351 | 0.122 | 3.748 | |||||
| pg1515_o2nofp.cx10a_c32r128 | 74.761 | 24.048 | 0.721 | 0.347 | 0.119 | 0.004 | 5.558 | ||||
| pg1611_o2nofp.cx10a_c32r128 | 82.143 | 17.000 | 0.562 | 0.223 | 0.069 | 0.002 | 4.831 | ||||
| pg177_o2nofp.cx10a_c32r128 | 83.535 | 15.676 | 0.474 | 0.244 | 0.071 | 3.722 | |||||
| pg181_o2nofp.cx10b_c32r128 | 82.975 | 16.299 | 0.459 | 0.218 | 0.046 | 0.003 | 6.631 |
Delete response time histogram: each cell has the percentage of responses that take <= the time in the header and max is the max response time in seconds. For max values in the top 25% of the range have a red background and in the bottom 25% of the range have a green background. The red background is not used when the min value is within 80% of the max value.
| dbms | 256us | 1ms | 4ms | 16ms | 64ms | 256ms | 1s | 4s | 16s | gt | max |
|---|---|---|---|---|---|---|---|---|---|---|---|
| pg1222_o2nofp.cx10a_c32r128 | 5.695 | 88.957 | 5.302 | 0.020 | 0.016 | 0.010 | nonzero | 4.088 | |||
| pg1323_o2nofp.cx10a_c32r128 | 1.280 | 92.331 | 6.337 | 0.025 | 0.015 | 0.011 | 3.848 | ||||
| pg1420_o2nofp.cx10a_c32r128 | 0.125 | 89.337 | 10.470 | 0.037 | 0.023 | 0.009 | 3.728 | ||||
| pg1515_o2nofp.cx10a_c32r128 | 3.510 | 85.061 | 11.365 | 0.032 | 0.021 | 0.011 | 0.001 | 4.973 | |||
| pg1611_o2nofp.cx10a_c32r128 | 0.053 | 84.997 | 14.920 | 0.020 | 0.005 | 0.004 | 3.536 | ||||
| pg177_o2nofp.cx10a_c32r128 | 1.987 | 85.642 | 12.347 | 0.019 | 0.004 | 0.002 | 2.526 | ||||
| pg181_o2nofp.cx10b_c32r128 | 2.172 | 85.362 | 12.447 | 0.014 | 0.004 | 0.002 | nonzero | 5.657 |
Performance metrics for the DBMS listed above. Some are normalized by throughput, others are not. Legend for results is here.
ips	qps	rps	rmbps	wps	wmbps	rpq	rkbpq	wpi	wkbpi	csps	cpups	cspq	cpupq	dbgb1	dbgb2	rss	maxop	p50	p99	tag
9885	306152	13172	105.5	16057.9	257.6	0.043	0.353	1.625	26.683	1143574	51.5	3.735	81	789.6	885.7	89.2	3.220	15453	13222	pg1222_o2nofp.cx10a_c32r128
9860	289408	13131	105.4	16016.6	256.5	0.045	0.373	1.624	26.633	1079837	51.7	3.731	86	787.4	883.4	89.0	3.037	14502	12450	pg1323_o2nofp.cx10a_c32r128
9885	289071	13180	106.3	15994.1	256.5	0.046	0.376	1.618	26.570	1075179	52.3	3.719	87	786.6	882.6	88.7	3.641	14496	12137	pg1420_o2nofp.cx10a_c32r128
9874	290091	13157	106.0	15970.4	256.3	0.045	0.374	1.617	26.576	1076201	52.2	3.710	86	786.9	882.9	88.4	5.466	14694	12391	pg1515_o2nofp.cx10a_c32r128
9896	285527	13186	106.4	16001.0	256.7	0.046	0.382	1.617	26.560	1054556	52.9	3.693	89	786.4	882.5	86.2	2.717	14400	12418	pg1611_o2nofp.cx10a_c32r128
9912	286298	13218	106.7	16032.6	257.3	0.046	0.382	1.618	26.577	1060941	52.6	3.706	88	786.2	882.3	86.6	3.332	14336	12387	pg177_o2nofp.cx10a_c32r128
9904	283872	13202	106.5	16030.1	256.9	0.047	0.384	1.619	26.566	1051452	52.6	3.704	89	786.2	882.3	85.9	3.403	14209	12115	pg181_o2nofp.cx10b_c32r128
Average values from iostat.
r/s	rkB/s	rrqm/s	%rrqm	r_await	rareq-s	w/s	wkB/s	wrqm/s	%wrqm	w_await	wareq-s	d/s	dkB/s	drqm/s	%drqm	d_await	dareq-s	f/s	f_await	aqu-sz	%util
5749.2	46061.6	216.4	3.455	0.097	8.001	17633.3	274481	1109.7	7.139	0.050	17.41	0.000	0.000	0.000	0.000	0.000	0.000	0.000	0.000	1.282	66.67		pg1222_o2nofp.cx10a_c32r128
5836.8	46604.2	228.5	3.602	0.098	7.978	17935.4	274264	999.1	6.497	0.049	17.02	0.000	0.000	0.000	0.000	0.000	0.000	0.000	0.000	1.323	67.13		pg1323_o2nofp.cx10a_c32r128
5937.7	47469.9	273.7	4.262	0.098	7.984	18012.4	275356	1165.9	7.415	0.051	17.00	0.000	0.000	0.000	0.000	0.000	0.000	0.000	0.000	1.361	65.85		pg1420_o2nofp.cx10a_c32r128
6110.5	48800.0	272.1	4.051	0.098	7.977	18040.0	274886	1054.2	6.698	0.051	17.03	0.000	0.000	0.000	0.000	0.000	0.000	0.000	0.000	1.378	61.77		pg1515_o2nofp.cx10a_c32r128
6036.6	48304.5	335.2	5.183	0.096	7.994	18690.3	276869	824.9	5.669	0.055	16.90	0.000	0.000	0.000	0.000	0.000	0.000	0.000	0.000	1.446	66.29		pg1611_o2nofp.cx10a_c32r128
5913.7	47332.3	305.3	4.753	0.093	7.994	18830.7	277362	689.9	4.669	0.055	16.38	0.000	0.000	0.000	0.000	0.000	0.000	0.000	0.000	1.436	70.81		pg177_o2nofp.cx10a_c32r128
5945.0	47600.9	313.9	4.791	0.095	7.986	18699.9	276841	771.4	5.177	0.058	16.62	0.000	0.000	0.000	0.000	0.000	0.000	0.000	0.000	1.460	67.11		pg181_o2nofp.cx10b_c32r128
qp500.L4
qp500.L4: point queries with 500 insert/s per client. Graphs for performance per 1-second interval are here.
Average throughput:
Query response time histogram: each cell has the percentage of responses that take <= the time in the header and max is the max response time in seconds. For max values in the top 25% of the range have a red background and in the bottom 25% of the range have a green background. The red background is not used when the min value is within 80% of the max value.
| dbms | 256us | 1ms | 4ms | 16ms | 64ms | 256ms | 1s | 4s | 16s | gt | max |
|---|---|---|---|---|---|---|---|---|---|---|---|
| pg1222_o2nofp.cx10a_c32r128 | 0.102 | 90.621 | 3.499 | 5.647 | 0.085 | 0.026 | 0.014 | 0.005 | 9.381 | ||
| pg1323_o2nofp.cx10a_c32r128 | 0.092 | 90.557 | 3.534 | 5.690 | 0.084 | 0.023 | 0.013 | 0.006 | 8.396 | ||
| pg1420_o2nofp.cx10a_c32r128 | 0.096 | 90.822 | 3.337 | 5.616 | 0.083 | 0.026 | 0.014 | 0.005 | 11.496 | ||
| pg1515_o2nofp.cx10a_c32r128 | 0.096 | 90.690 | 3.465 | 5.623 | 0.086 | 0.022 | 0.014 | 0.004 | 11.402 | ||
| pg1611_o2nofp.cx10a_c32r128 | 0.104 | 92.040 | 2.072 | 5.673 | 0.070 | 0.023 | 0.013 | 0.004 | 9.823 | ||
| pg177_o2nofp.cx10a_c32r128 | 0.104 | 91.970 | 2.130 | 5.688 | 0.069 | 0.020 | 0.012 | 0.006 | 10.202 | ||
| pg181_o2nofp.cx10b_c32r128 | 0.093 | 91.885 | 2.185 | 5.728 | 0.070 | 0.023 | 0.012 | 0.004 | 8.719 |
Insert response time histogram: each cell has the percentage of responses that take <= the time in the header and max is the max response time in seconds. For max values in the top 25% of the range have a red background and in the bottom 25% of the range have a green background. The red background is not used when the min value is within 80% of the max value.
| dbms | 256us | 1ms | 4ms | 16ms | 64ms | 256ms | 1s | 4s | 16s | gt | max |
|---|---|---|---|---|---|---|---|---|---|---|---|
| pg1222_o2nofp.cx10a_c32r128 | 25.300 | 69.276 | 4.678 | 0.377 | 0.269 | 0.099 | 9.354 | ||||
| pg1323_o2nofp.cx10a_c32r128 | 25.881 | 68.584 | 4.873 | 0.316 | 0.243 | 0.103 | 8.380 | ||||
| pg1420_o2nofp.cx10a_c32r128 | 27.020 | 67.582 | 4.651 | 0.387 | 0.263 | 0.098 | 11.714 | ||||
| pg1515_o2nofp.cx10a_c32r128 | 25.948 | 68.565 | 4.821 | 0.332 | 0.257 | 0.077 | 11.244 | ||||
| pg1611_o2nofp.cx10a_c32r128 | 27.979 | 68.340 | 3.030 | 0.315 | 0.260 | 0.076 | 9.649 | ||||
| pg177_o2nofp.cx10a_c32r128 | 27.721 | 68.431 | 3.201 | 0.289 | 0.239 | 0.120 | 11.004 | ||||
| pg181_o2nofp.cx10b_c32r128 | 28.193 | 68.421 | 2.743 | 0.338 | 0.241 | 0.064 | 8.867 |
Delete response time histogram: each cell has the percentage of responses that take <= the time in the header and max is the max response time in seconds. For max values in the top 25% of the range have a red background and in the bottom 25% of the range have a green background. The red background is not used when the min value is within 80% of the max value.
| dbms | 256us | 1ms | 4ms | 16ms | 64ms | 256ms | 1s | 4s | 16s | gt | max |
|---|---|---|---|---|---|---|---|---|---|---|---|
| pg1222_o2nofp.cx10a_c32r128 | 49.879 | 49.646 | 0.201 | 0.194 | 0.066 | 0.014 | 8.869 | ||||
| pg1323_o2nofp.cx10a_c32r128 | 41.408 | 58.147 | 0.210 | 0.142 | 0.060 | 0.033 | 7.632 | ||||
| pg1420_o2nofp.cx10a_c32r128 | 37.732 | 61.764 | 0.221 | 0.192 | 0.072 | 0.018 | 8.708 | ||||
| pg1515_o2nofp.cx10a_c32r128 | 43.819 | 55.768 | 0.198 | 0.146 | 0.063 | 0.005 | 9.184 | ||||
| pg1611_o2nofp.cx10a_c32r128 | 28.759 | 70.805 | 0.213 | 0.143 | 0.067 | 0.012 | 7.183 | ||||
| pg177_o2nofp.cx10a_c32r128 | 26.146 | 73.442 | 0.203 | 0.137 | 0.058 | 0.014 | 7.882 | ||||
| pg181_o2nofp.cx10b_c32r128 | 34.238 | 65.364 | 0.188 | 0.147 | 0.050 | 0.013 | 7.340 |
Performance metrics for the DBMS listed above. Some are normalized by throughput, others are not. Legend for results is here.
ips	qps	rps	rmbps	wps	wmbps	rpq	rkbpq	wpi	wkbpi	csps	cpups	cspq	cpupq	dbgb1	dbgb2	rss	maxop	p50	p99	tag
9317	3826	73438	576.2	20030.0	277.3	19.195	154.209	2.150	30.479	177481	37.4	46.389	4692	792.8	888.9	89.2	9.381	208	0	pg1222_o2nofp.cx10a_c32r128
9343	3816	73424	576.1	20036.5	278.5	19.241	154.602	2.144	30.523	177091	38.1	46.409	4793	790.7	886.7	50.1	8.396	208	0	pg1323_o2nofp.cx10a_c32r128
9353	3847	73805	579.1	20040.8	278.8	19.187	154.164	2.143	30.529	176749	38.1	45.948	4754	789.7	885.8	48.1	11.496	208	0	pg1420_o2nofp.cx10a_c32r128
9409	3887	74532	584.8	20031.5	279.9	19.175	154.067	2.129	30.461	179013	38.2	46.054	4717	789.9	886.0	48.0	11.402	208	0	pg1515_o2nofp.cx10a_c32r128
9426	4039	76654	601.4	20116.2	280.6	18.978	152.472	2.134	30.479	179943	39.7	44.550	4718	789.5	885.5	41.5	9.823	224	0	pg1611_o2nofp.cx10a_c32r128
9259	3963	75210	590.1	19729.9	275.5	18.978	152.475	2.131	30.473	176203	39.0	44.463	4724	789.2	885.2	33.5	10.202	224	0	pg177_o2nofp.cx10a_c32r128
9501	4087	77495	608.2	20343.0	283.3	18.962	152.379	2.141	30.535	182461	39.6	44.645	4651	789.3	885.3	38.2	8.719	224	0	pg181_o2nofp.cx10b_c32r128
Average values from iostat.
r/s	rkB/s	rrqm/s	%rrqm	r_await	rareq-s	w/s	wkB/s	wrqm/s	%wrqm	w_await	wareq-s	d/s	dkB/s	drqm/s	%drqm	d_await	dareq-s	f/s	f_await	aqu-sz	%util
38320.8	301104	2007.4	5.045	0.104	7.866	27433.4	331665	4525.2	15.89	0.148	12.85	0.000	0.000	0.000	0.000	0.000	0.000	0.000	0.000	8.368	74.25		pg1222_o2nofp.cx10a_c32r128
38299.2	301242	2098.1	5.371	0.105	7.909	27570.2	333670	4590.2	16.11	0.146	12.87	0.000	0.000	0.000	0.000	0.000	0.000	0.000	0.000	8.421	74.68		pg1323_o2nofp.cx10a_c32r128
38303.6	302033	2035.0	5.252	0.105	7.828	26722.9	331752	4874.4	17.48	0.145	13.22	0.000	0.000	0.000	0.000	0.000	0.000	0.000	0.000	8.294	73.93		pg1420_o2nofp.cx10a_c32r128
38723.7	304796	2035.8	5.053	0.104	7.877	27264.0	333805	4567.3	16.19	0.146	13.01	0.000	0.000	0.000	0.000	0.000	0.000	0.000	0.000	8.412	74.64		pg1515_o2nofp.cx10a_c32r128
40426.9	320540	3183.6	7.393	0.107	7.951	29390.8	350863	6617.0	20.16	0.160	12.77	0.000	0.000	0.000	0.000	0.000	0.000	0.000	0.000	9.391	72.95		pg1611_o2nofp.cx10a_c32r128
39764.5	314631	3037.8	7.276	0.108	7.939	29321.5	343923	5854.3	18.33	0.160	12.51	0.000	0.000	0.000	0.000	0.000	0.000	0.000	0.000	9.262	71.80		pg177_o2nofp.cx10a_c32r128
41127.6	325135	3180.8	7.272	0.107	7.902	30235.2	355101	6358.5	18.89	0.163	12.35	0.000	0.000	0.000	0.000	0.000	0.000	0.000	0.000	9.632	74.02		pg181_o2nofp.cx10b_c32r128
qr1000.L5
qr1000.L5: range queries with 1000 insert/s per client. Graphs for performance per 1-second interval are here.
Average throughput:
Query response time histogram: each cell has the percentage of responses that take <= the time in the header and max is the max response time in seconds. For max values in the top 25% of the range have a red background and in the bottom 25% of the range have a green background. The red background is not used when the min value is within 80% of the max value.
| dbms | 256us | 1ms | 4ms | 16ms | 64ms | 256ms | 1s | 4s | 16s | gt | max |
|---|---|---|---|---|---|---|---|---|---|---|---|
| pg1222_o2nofp.cx10a_c32r128 | 98.619 | 1.158 | 0.092 | 0.091 | 0.039 | 0.001 | nonzero | nonzero | nonzero | 5.984 | |
| pg1323_o2nofp.cx10a_c32r128 | 98.398 | 1.364 | 0.098 | 0.097 | 0.042 | 0.001 | nonzero | nonzero | 2.348 | ||
| pg1420_o2nofp.cx10a_c32r128 | 98.252 | 1.501 | 0.103 | 0.101 | 0.042 | 0.001 | nonzero | nonzero | nonzero | 11.111 | |
| pg1515_o2nofp.cx10a_c32r128 | 98.332 | 1.423 | 0.103 | 0.099 | 0.041 | 0.001 | nonzero | nonzero | 2.121 | ||
| pg1611_o2nofp.cx10a_c32r128 | 98.767 | 1.052 | 0.053 | 0.079 | 0.047 | 0.002 | nonzero | nonzero | 2.651 | ||
| pg177_o2nofp.cx10a_c32r128 | 98.683 | 1.130 | 0.054 | 0.081 | 0.050 | 0.002 | nonzero | nonzero | 2.434 | ||
| pg181_o2nofp.cx10b_c32r128 | 98.764 | 1.054 | 0.053 | 0.080 | 0.047 | 0.002 | nonzero | nonzero | 2.005 |
Insert response time histogram: each cell has the percentage of responses that take <= the time in the header and max is the max response time in seconds. For max values in the top 25% of the range have a red background and in the bottom 25% of the range have a green background. The red background is not used when the min value is within 80% of the max value.
| dbms | 256us | 1ms | 4ms | 16ms | 64ms | 256ms | 1s | 4s | 16s | gt | max |
|---|---|---|---|---|---|---|---|---|---|---|---|
| pg1222_o2nofp.cx10a_c32r128 | 25.531 | 45.646 | 28.459 | 0.220 | 0.134 | 0.011 | 13.090 | ||||
| pg1323_o2nofp.cx10a_c32r128 | 25.638 | 44.639 | 29.347 | 0.225 | 0.144 | 0.008 | 11.768 | ||||
| pg1420_o2nofp.cx10a_c32r128 | 20.565 | 46.403 | 32.653 | 0.208 | 0.164 | 0.007 | 13.108 | ||||
| pg1515_o2nofp.cx10a_c32r128 | 24.201 | 46.435 | 29.025 | 0.200 | 0.135 | 0.004 | 8.609 | ||||
| pg1611_o2nofp.cx10a_c32r128 | 21.138 | 42.966 | 35.432 | 0.332 | 0.129 | 0.003 | 6.886 | ||||
| pg177_o2nofp.cx10a_c32r128 | 20.535 | 43.295 | 35.678 | 0.340 | 0.147 | 0.004 | 9.128 | ||||
| pg181_o2nofp.cx10b_c32r128 | 20.430 | 43.824 | 35.294 | 0.293 | 0.157 | 0.003 | 6.156 |
Delete response time histogram: each cell has the percentage of responses that take <= the time in the header and max is the max response time in seconds. For max values in the top 25% of the range have a red background and in the bottom 25% of the range have a green background. The red background is not used when the min value is within 80% of the max value.
| dbms | 256us | 1ms | 4ms | 16ms | 64ms | 256ms | 1s | 4s | 16s | gt | max |
|---|---|---|---|---|---|---|---|---|---|---|---|
| pg1222_o2nofp.cx10a_c32r128 | 0.031 | 84.292 | 15.540 | 0.056 | 0.081 | nonzero | 4.190 | ||||
| pg1323_o2nofp.cx10a_c32r128 | 0.021 | 82.453 | 17.362 | 0.078 | 0.086 | nonzero | 7.195 | ||||
| pg1420_o2nofp.cx10a_c32r128 | 0.008 | 82.757 | 17.077 | 0.070 | 0.088 | nonzero | 4.057 | ||||
| pg1515_o2nofp.cx10a_c32r128 | 0.008 | 84.357 | 15.485 | 0.064 | 0.086 | nonzero | 5.142 | ||||
| pg1611_o2nofp.cx10a_c32r128 | 0.003 | 79.918 | 19.906 | 0.099 | 0.074 | nonzero | 6.141 | ||||
| pg177_o2nofp.cx10a_c32r128 | nonzero | 79.211 | 20.618 | 0.082 | 0.089 | 2.692 | |||||
| pg181_o2nofp.cx10b_c32r128 | 0.001 | 80.854 | 18.986 | 0.060 | 0.098 | nonzero | 4.137 |
Performance metrics for the DBMS listed above. Some are normalized by throughput, others are not. Legend for results is here.
ips	qps	rps	rmbps	wps	wmbps	rpq	rkbpq	wpi	wkbpi	csps	cpups	cspq	cpupq	dbgb1	dbgb2	rss	maxop	p50	p99	tag
16725	153763	22162	176.7	26085.6	545.8	0.144	1.177	1.560	33.416	452179	70.8	2.941	221	803.6	936.8	85.8	5.984	7819	575	pg1222_o2nofp.cx10a_c32r128
16536	144708	21919	174.6	25758.2	542.8	0.151	1.236	1.558	33.614	421741	71.6	2.914	237	801.9	897.9	86.4	2.348	7495	416	pg1323_o2nofp.cx10a_c32r128
16371	142684	21678	172.8	25379.1	541.9	0.152	1.240	1.550	33.893	413941	72.7	2.901	245	800.5	939.8	82.2	11.111	7304	479	pg1420_o2nofp.cx10a_c32r128
17013	144307	22550	179.7	26157.2	557.7	0.156	1.275	1.537	33.568	418861	72.3	2.903	240	800.7	896.8	85.8	2.121	7383	527	pg1515_o2nofp.cx10a_c32r128
15940	143551	21127	168.3	24629.8	526.2	0.147	1.201	1.545	33.802	398119	74.1	2.773	248	800.2	937.4	81.6	2.651	7416	1087	pg1611_o2nofp.cx10a_c32r128
15731	139108	20851	166.1	24376.8	519.3	0.150	1.223	1.550	33.803	387623	73.4	2.787	253	799.9	896.0	82.1	2.434	7259	681	pg177_o2nofp.cx10a_c32r128
15873	140474	21089	170.1	25054.6	530.0	0.150	1.240	1.578	34.193	395970	72.7	2.819	248	800.1	945.2	79.0	2.005	7272	608	pg181_o2nofp.cx10b_c32r128
Average values from iostat.
r/s	rkB/s	rrqm/s	%rrqm	r_await	rareq-s	w/s	wkB/s	wrqm/s	%wrqm	w_await	wareq-s	d/s	dkB/s	drqm/s	%drqm	d_await	dareq-s	f/s	f_await	aqu-sz	%util
10491.7	83455.7	178.8	1.318	0.100	7.929	28205.3	572020	1172.4	4.713	0.138	21.82	0.000	0.000	0.000	0.000	0.000	0.000	0.000	0.000	5.285	86.88		pg1222_o2nofp.cx10a_c32r128
10463.1	82987.8	232.0	1.886	0.100	7.910	28240.0	570279	1126.0	4.672	0.140	21.77	0.000	0.000	0.000	0.000	0.000	0.000	0.000	0.000	5.377	86.99		pg1323_o2nofp.cx10a_c32r128
11145.9	87037.5	637.6	5.398	0.103	7.771	30200.7	578267	1033.4	3.811	0.153	20.45	0.000	0.000	0.000	0.000	0.000	0.000	0.000	0.000	6.057	86.87		pg1420_o2nofp.cx10a_c32r128
10771.8	85473.4	240.1	1.862	0.102	7.908	28896.4	585794	939.6	3.543	0.143	21.85	0.000	0.000	0.000	0.000	0.000	0.000	0.000	0.000	5.554	87.54		pg1515_o2nofp.cx10a_c32r128
11018.4	87010.2	1048.5	8.873	0.106	7.868	30472.1	566400	1061.7	3.702	0.152	19.70	0.000	0.000	0.000	0.000	0.000	0.000	0.000	0.000	6.111	87.44		pg1611_o2nofp.cx10a_c32r128
10804.2	85341.4	987.1	8.597	0.106	7.865	29863.7	557988	1077.6	3.806	0.149	19.83	0.000	0.000	0.000	0.000	0.000	0.000	0.000	0.000	5.895	87.01		pg177_o2nofp.cx10a_c32r128
11004.8	88080.2	1014.5	8.521	0.107	8.058	30383.7	569672	1405.3	4.758	0.153	19.83	0.000	0.000	0.000	0.000	0.000	0.000	0.000	0.000	6.116	87.42		pg181_o2nofp.cx10b_c32r128
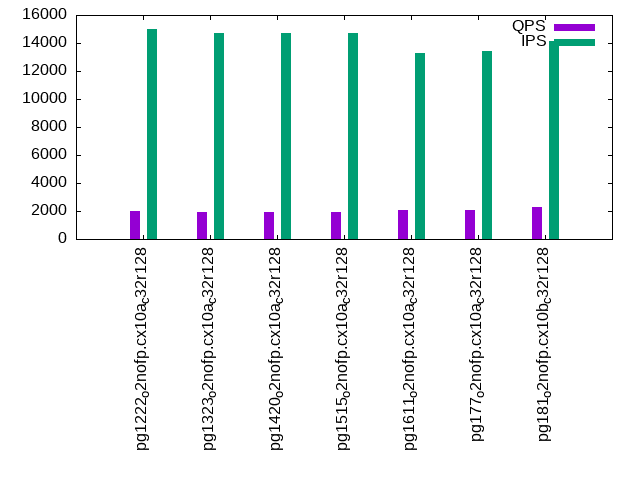
qp1000.L6
qp1000.L6: point queries with 1000 insert/s per client. Graphs for performance per 1-second interval are here.
Average throughput:
Query response time histogram: each cell has the percentage of responses that take <= the time in the header and max is the max response time in seconds. For max values in the top 25% of the range have a red background and in the bottom 25% of the range have a green background. The red background is not used when the min value is within 80% of the max value.
| dbms | 256us | 1ms | 4ms | 16ms | 64ms | 256ms | 1s | 4s | 16s | gt | max |
|---|---|---|---|---|---|---|---|---|---|---|---|
| pg1222_o2nofp.cx10a_c32r128 | 0.002 | 63.080 | 24.033 | 11.303 | 1.490 | 0.075 | 0.015 | 0.003 | 12.000 | ||
| pg1323_o2nofp.cx10a_c32r128 | 0.002 | 62.795 | 24.281 | 11.166 | 1.664 | 0.071 | 0.018 | 0.004 | 9.960 | ||
| pg1420_o2nofp.cx10a_c32r128 | 0.002 | 62.379 | 24.622 | 11.393 | 1.519 | 0.067 | 0.015 | 0.003 | 12.315 | ||
| pg1515_o2nofp.cx10a_c32r128 | 0.002 | 63.008 | 23.851 | 11.494 | 1.556 | 0.064 | 0.022 | 0.003 | 11.475 | ||
| pg1611_o2nofp.cx10a_c32r128 | 0.007 | 64.221 | 23.025 | 11.336 | 1.325 | 0.068 | 0.015 | 0.003 | 11.372 | ||
| pg177_o2nofp.cx10a_c32r128 | 0.008 | 64.568 | 22.830 | 11.232 | 1.282 | 0.066 | 0.011 | 0.003 | 11.953 | ||
| pg181_o2nofp.cx10b_c32r128 | 0.006 | 65.821 | 22.667 | 10.842 | 0.584 | 0.067 | 0.011 | 0.001 | 12.076 |
Insert response time histogram: each cell has the percentage of responses that take <= the time in the header and max is the max response time in seconds. For max values in the top 25% of the range have a red background and in the bottom 25% of the range have a green background. The red background is not used when the min value is within 80% of the max value.
| dbms | 256us | 1ms | 4ms | 16ms | 64ms | 256ms | 1s | 4s | 16s | gt | max |
|---|---|---|---|---|---|---|---|---|---|---|---|
| pg1222_o2nofp.cx10a_c32r128 | 7.144 | 51.841 | 40.211 | 0.667 | 0.119 | 0.017 | 11.950 | ||||
| pg1323_o2nofp.cx10a_c32r128 | 7.466 | 51.256 | 40.444 | 0.676 | 0.134 | 0.024 | 9.914 | ||||
| pg1420_o2nofp.cx10a_c32r128 | 6.950 | 52.015 | 40.232 | 0.666 | 0.118 | 0.020 | 12.569 | ||||
| pg1515_o2nofp.cx10a_c32r128 | 7.477 | 50.868 | 40.823 | 0.647 | 0.166 | 0.019 | 13.275 | ||||
| pg1611_o2nofp.cx10a_c32r128 | 6.307 | 44.745 | 47.798 | 0.993 | 0.136 | 0.021 | 11.650 | ||||
| pg177_o2nofp.cx10a_c32r128 | 6.408 | 45.447 | 47.038 | 0.973 | 0.111 | 0.022 | 12.420 | ||||
| pg181_o2nofp.cx10b_c32r128 | 5.345 | 49.892 | 43.808 | 0.812 | 0.131 | 0.012 | 12.151 |
Delete response time histogram: each cell has the percentage of responses that take <= the time in the header and max is the max response time in seconds. For max values in the top 25% of the range have a red background and in the bottom 25% of the range have a green background. The red background is not used when the min value is within 80% of the max value.
| dbms | 256us | 1ms | 4ms | 16ms | 64ms | 256ms | 1s | 4s | 16s | gt | max |
|---|---|---|---|---|---|---|---|---|---|---|---|
| pg1222_o2nofp.cx10a_c32r128 | 0.106 | 5.309 | 8.460 | 70.922 | 14.873 | 0.280 | 0.049 | nonzero | 9.445 | ||
| pg1323_o2nofp.cx10a_c32r128 | 0.078 | 4.985 | 8.578 | 68.570 | 17.408 | 0.302 | 0.077 | 0.002 | 8.510 | ||
| pg1420_o2nofp.cx10a_c32r128 | 0.103 | 6.472 | 8.232 | 69.054 | 15.795 | 0.281 | 0.062 | nonzero | 9.740 | ||
| pg1515_o2nofp.cx10a_c32r128 | 0.125 | 7.064 | 8.238 | 68.970 | 15.271 | 0.247 | 0.084 | 0.001 | 11.155 | ||
| pg1611_o2nofp.cx10a_c32r128 | 0.752 | 8.794 | 16.202 | 60.969 | 12.933 | 0.280 | 0.068 | 0.001 | 10.843 | ||
| pg177_o2nofp.cx10a_c32r128 | 0.686 | 7.954 | 17.505 | 60.474 | 13.049 | 0.278 | 0.053 | 0.001 | 10.503 | ||
| pg181_o2nofp.cx10b_c32r128 | 0.229 | 9.510 | 25.815 | 56.610 | 7.563 | 0.231 | 0.041 | 0.001 | 12.067 |
Performance metrics for the DBMS listed above. Some are normalized by throughput, others are not. Legend for results is here.
ips	qps	rps	rmbps	wps	wmbps	rpq	rkbpq	wpi	wkbpi	csps	cpups	cspq	cpupq	dbgb1	dbgb2	rss	maxop	p50	p99	tag
15003	1989	58162	503.9	31199.0	495.6	29.245	259.459	2.080	33.825	142504	68.4	71.653	16508	816.1	912.2	11.0	12.000	112	0	pg1222_o2nofp.cx10a_c32r128
14688	1959	57159	494.5	30095.5	482.2	29.182	258.500	2.049	33.620	140552	69.2	71.758	16958	814.5	910.5	4.8	9.960	112	0	pg1323_o2nofp.cx10a_c32r128
14736	1964	57380	502.1	30078.6	489.5	29.218	261.792	2.041	34.014	142481	68.5	72.550	16742	812.8	908.9	15.2	12.315	112	0	pg1420_o2nofp.cx10a_c32r128
14703	1945	57049	499.7	30000.7	491.7	29.331	263.055	2.040	34.248	140611	68.2	72.294	16831	813.0	909.1	15.3	11.475	112	0	pg1515_o2nofp.cx10a_c32r128
13284	2052	56723	532.8	27891.6	481.6	27.646	265.919	2.100	37.120	131488	67.0	64.084	15674	810.2	906.3	8.4	11.372	112	0	pg1611_o2nofp.cx10a_c32r128
13425	2090	57522	539.7	28140.0	487.6	27.521	264.410	2.096	37.188	133254	66.9	63.755	15364	809.7	905.7	45.8	11.953	112	0	pg177_o2nofp.cx10a_c32r128
14165	2294	62553	574.4	30208.8	522.5	27.269	256.399	2.133	37.775	145155	62.9	63.279	13162	805.5	901.5	44.8	12.076	112	0	pg181_o2nofp.cx10b_c32r128
Average values from iostat.
r/s	rkB/s	rrqm/s	%rrqm	r_await	rareq-s	w/s	wkB/s	wrqm/s	%wrqm	w_await	wareq-s	d/s	dkB/s	drqm/s	%drqm	d_await	dareq-s	f/s	f_await	aqu-sz	%util
29879.1	255460	1222.6	3.948	0.124	8.679	38572.5	543455	1624.5	4.443	0.182	14.68	0.000	0.000	0.000	0.000	0.000	0.000	0.000	0.000	11.03	88.15		pg1222_o2nofp.cx10a_c32r128
29574.7	251795	1231.7	4.204	0.123	8.657	38115.3	531203	1331.0	3.852	0.181	14.57	0.000	0.000	0.000	0.000	0.000	0.000	0.000	0.000	10.88	88.70		pg1323_o2nofp.cx10a_c32r128
29771.6	256197	1336.0	4.308	0.126	8.782	39006.5	540610	920.0	2.725	0.183	14.48	0.000	0.000	0.000	0.000	0.000	0.000	0.000	0.000	11.18	87.60		pg1420_o2nofp.cx10a_c32r128
29485.0	254855	1271.6	4.130	0.126	8.730	38211.5	539816	863.1	2.584	0.186	14.70	0.000	0.000	0.000	0.000	0.000	0.000	0.000	0.000	11.26	86.98		pg1515_o2nofp.cx10a_c32r128
30290.9	281733	2878.8	8.717	0.131	9.357	40502.9	547393	963.4	2.717	0.210	14.08	0.000	0.000	0.000	0.000	0.000	0.000	0.000	0.000	12.63	88.08		pg1611_o2nofp.cx10a_c32r128
30662.5	285271	2833.1	8.467	0.132	9.338	40516.6	552560	951.7	2.690	0.213	14.21	0.000	0.000	0.000	0.000	0.000	0.000	0.000	0.000	12.78	87.80		pg177_o2nofp.cx10a_c32r128
33388.1	304216	3096.3	8.694	0.135	9.191	42894.1	591299	1366.4	3.263	0.231	14.29	0.000	0.000	0.000	0.000	0.000	0.000	0.000	0.000	14.50	87.58		pg181_o2nofp.cx10b_c32r128
l.i0
l.i0: load without secondary indexes
Performance metrics for all DBMS, not just the ones listed above. Some are normalized by throughput, others are not. Legend for results is here.
ips	qps	rps	rmbps	wps	wmbps	rpq	rkbpq	wpi	wkbpi	csps	cpups	cspq	cpupq	dbgb1	dbgb2	rss	maxop	p50	p99	tag
2058672	0	1862	15.0	11362.7	825.7	0.001	0.007	0.006	0.411	341356	59.1	0.166	14	382.7	478.8	5.3	1.959	110739	41654	pg1222_o2nofp.cx10a_c32r128
2025316	0	1758	14.2	9083.3	814.2	0.001	0.007	0.004	0.412	349922	58.4	0.173	14	382.7	478.8	9.2	1.652	111080	34561	pg1323_o2nofp.cx10a_c32r128
1986097	0	1685	13.2	8347.8	793.0	0.001	0.007	0.004	0.409	342492	57.6	0.172	14	382.7	478.8	16.2	1.363	109111	32578	pg1420_o2nofp.cx10a_c32r128
1993024	0	1651	12.9	8351.0	794.8	0.001	0.007	0.004	0.408	373442	57.1	0.187	14	382.7	478.8	6.9	2.379	109080	28569	pg1515_o2nofp.cx10a_c32r128
2002002	0	1720	13.5	8413.8	801.9	0.001	0.007	0.004	0.410	367875	57.6	0.184	14	382.7	478.8	16.4	2.629	108782	27770	pg1611_o2nofp.cx10a_c32r128
2027369	0	1723	13.8	8487.2	809.4	0.001	0.007	0.004	0.409	381907	57.5	0.188	14	382.7	478.8	96.9	0.727	109497	35764	pg177_o2nofp.cx10a_c32r128
2073613	0	1742	13.9	8657.6	825.3	0.001	0.007	0.004	0.408	355147	57.7	0.171	13	382.7	478.8	96.6	1.418	113475	34861	pg181_o2nofp.cx10b_c32r128
l.x
l.x: create secondary indexes
Performance metrics for all DBMS, not just the ones listed above. Some are normalized by throughput, others are not. Legend for results is here.
ips	qps	rps	rmbps	wps	wmbps	rpq	rkbpq	wpi	wkbpi	csps	cpups	cspq	cpupq	dbgb1	dbgb2	rss	maxop	p50	p99	tag
2147075	0	10892	684.1	10874.2	860.0	0.005	0.326	0.005	0.410	180712	18.5	0.084	4	768.8	864.8	50.2	0.076	NA	NA	pg1222_o2nofp.cx10a_c32r128
2735978	0	13859	871.3	7189.3	786.1	0.005	0.326	0.003	0.294	151779	21.5	0.055	4	768.4	864.5	42.4	0.012	NA	NA	pg1323_o2nofp.cx10a_c32r128
2793296	0	14150	889.6	7250.1	802.9	0.005	0.326	0.003	0.294	153521	21.4	0.055	4	768.4	863.6	43.6	0.011	NA	NA	pg1420_o2nofp.cx10a_c32r128
2647254	0	14701	933.5	7686.3	844.8	0.006	0.361	0.003	0.327	147306	20.2	0.056	4	768.4	864.5	52.3	0.009	NA	NA	pg1515_o2nofp.cx10a_c32r128
2791347	0	14091	889.6	7391.2	803.2	0.005	0.326	0.003	0.295	154340	20.9	0.055	4	768.4	864.5	30.7	0.008	NA	NA	pg1611_o2nofp.cx10a_c32r128
3341688	0	10927	1063.8	8618.3	956.0	0.003	0.326	0.003	0.293	87188	23.3	0.026	3	768.4	863.9	31.5	0.133	NA	NA	pg177_o2nofp.cx10a_c32r128
3319502	0	10833	1055.0	8557.4	948.8	0.003	0.325	0.003	0.293	87846	23.1	0.026	3	768.4	863.7	21.6	0.003	NA	NA	pg181_o2nofp.cx10b_c32r128
l.i1
l.i1: continue load after secondary indexes created with 50 inserts per transaction
Performance metrics for all DBMS, not just the ones listed above. Some are normalized by throughput, others are not. Legend for results is here.
ips	qps	rps	rmbps	wps	wmbps	rpq	rkbpq	wpi	wkbpi	csps	cpups	cspq	cpupq	dbgb1	dbgb2	rss	maxop	p50	p99	tag
22529	0	28467	225.7	32764.7	717.3	1.264	10.258	1.454	32.602	81793	29.8	3.631	635	781.9	879.1	83.4	5.877	1049	0	pg1222_o2nofp.cx10a_c32r128
20450	0	26684	250.7	31136.4	703.6	1.305	12.555	1.523	35.233	76294	27.8	3.731	653	781.3	941.0	3.3	5.523	949	0	pg1323_o2nofp.cx10a_c32r128
22051	0	27883	223.1	32376.4	723.4	1.264	10.363	1.468	33.593	79608	30.8	3.610	670	781.5	918.6	1.8	4.978	1050	0	pg1420_o2nofp.cx10a_c32r128
22087	0	28008	224.5	32052.8	721.4	1.268	10.406	1.451	33.445	81204	31.5	3.677	685	781.5	907.1	1.8	3.629	1049	0	pg1515_o2nofp.cx10a_c32r128
22057	0	28003	224.0	32258.8	718.8	1.270	10.401	1.463	33.371	77491	32.1	3.513	699	781.5	877.6	2.1	6.370	1099	0	pg1611_o2nofp.cx10a_c32r128
22415	0	28352	226.2	32701.9	727.1	1.265	10.335	1.459	33.218	78485	31.0	3.501	664	781.5	877.6	76.8	3.726	1099	0	pg177_o2nofp.cx10a_c32r128
22516	0	28523	226.9	33601.6	731.6	1.267	10.317	1.492	33.272	78927	31.0	3.505	661	781.5	877.6	82.1	3.704	1099	0	pg181_o2nofp.cx10b_c32r128
l.i2
l.i2: continue load after secondary indexes created with 5 inserts per transaction
Performance metrics for all DBMS, not just the ones listed above. Some are normalized by throughput, others are not. Legend for results is here.
ips	qps	rps	rmbps	wps	wmbps	rpq	rkbpq	wpi	wkbpi	csps	cpups	cspq	cpupq	dbgb1	dbgb2	rss	maxop	p50	p99	tag
3184	0	3917	31.2	6237.0	97.9	1.230	10.023	1.959	31.497	26400	31.5	8.292	4749	785.2	881.3	84.1	4.410	265	0	pg1222_o2nofp.cx10a_c32r128
3372	0	4102	43.9	6308.6	107.1	1.216	13.334	1.871	32.520	27038	23.9	8.018	3402	784.2	880.2	7.8	4.482	265	125	pg1323_o2nofp.cx10a_c32r128
2869	0	3582	31.3	5623.7	86.7	1.249	11.171	1.960	30.939	24162	29.2	8.423	4886	784.9	880.9	3.7	5.714	135	70	pg1420_o2nofp.cx10a_c32r128
2896	0	3650	37.3	5703.6	90.9	1.260	13.201	1.969	32.157	23768	26.4	8.207	4376	784.8	880.8	35.5	4.810	145	80	pg1515_o2nofp.cx10a_c32r128
2597	0	3292	31.1	5103.3	82.1	1.267	12.269	1.965	32.371	21414	29.4	8.244	5433	784.8	880.9	3.9	4.646	125	80	pg1611_o2nofp.cx10a_c32r128
2437	0	3185	32.7	5175.5	82.1	1.307	13.725	2.124	34.513	18779	25.4	7.707	5004	784.8	880.9	80.9	5.933	215	40	pg177_o2nofp.cx10a_c32r128
2486	0	3070	26.4	4602.2	73.3	1.235	10.872	1.851	30.206	18816	30.5	7.570	5890	784.8	880.8	72.4	3.923	115	100	pg181_o2nofp.cx10b_c32r128
qr100.L1
qr100.L1: range queries with 100 insert/s per client
Performance metrics for all DBMS, not just the ones listed above. Some are normalized by throughput, others are not. Legend for results is here.
ips	qps	rps	rmbps	wps	wmbps	rpq	rkbpq	wpi	wkbpi	csps	cpups	cspq	cpupq	dbgb1	dbgb2	rss	maxop	p50	p99	tag
1988	361060	2612	21.0	2501.3	46.3	0.007	0.059	1.258	23.854	1379050	43.8	3.819	58	785.8	881.9	96.8	0.601	18332	17613	pg1222_o2nofp.cx10a_c32r128
1987	343541	2595	21.0	2572.3	47.0	0.008	0.062	1.294	24.203	1312310	43.7	3.820	61	784.5	880.5	95.2	0.732	17245	16558	pg1323_o2nofp.cx10a_c32r128
1987	346912	2605	20.9	2577.2	47.0	0.008	0.062	1.297	24.193	1325098	43.7	3.820	60	785.1	881.1	95.7	0.271	17197	16414	pg1420_o2nofp.cx10a_c32r128
1987	345942	2598	20.9	2558.8	46.9	0.008	0.062	1.288	24.148	1321464	43.7	3.820	61	785.1	881.1	96.2	0.083	17571	16798	pg1515_o2nofp.cx10a_c32r128
1987	343245	2683	21.5	2663.9	47.5	0.008	0.064	1.340	24.471	1310599	43.6	3.818	61	785.1	881.1	94.3	0.804	17373	16612	pg1611_o2nofp.cx10a_c32r128
1987	344865	2687	21.6	2697.4	47.8	0.008	0.064	1.357	24.630	1316668	43.6	3.818	61	785.0	881.1	95.1	0.353	17165	16318	pg177_o2nofp.cx10a_c32r128
1987	341583	2628	21.1	2411.8	45.8	0.008	0.063	1.214	23.592	1304597	43.6	3.819	61	785.0	881.0	96.1	0.809	16932	16111	pg181_o2nofp.cx10b_c32r128
qp100.L2
qp100.L2: point queries with 100 insert/s per client
Performance metrics for all DBMS, not just the ones listed above. Some are normalized by throughput, others are not. Legend for results is here.
ips	qps	rps	rmbps	wps	wmbps	rpq	rkbpq	wpi	wkbpi	csps	cpups	cspq	cpupq	dbgb1	dbgb2	rss	maxop	p50	p99	tag
1987	6398	90413	708.9	5391.8	66.9	14.131	113.456	2.714	34.476	202195	20.8	31.601	1560	786.5	882.5	88.0	6.091	368	0	pg1222_o2nofp.cx10a_c32r128
1987	6540	92252	723.6	5342.0	66.6	14.107	113.299	2.688	34.316	206193	21.2	31.530	1556	784.8	880.9	28.4	5.458	368	0	pg1323_o2nofp.cx10a_c32r128
1987	6591	92930	729.1	5319.8	66.5	14.099	113.281	2.677	34.276	207581	20.9	31.495	1522	785.3	881.4	88.1	4.923	368	0	pg1420_o2nofp.cx10a_c32r128
1987	6490	91586	718.3	5314.7	66.4	14.113	113.347	2.674	34.236	204566	20.5	31.523	1516	785.4	881.4	87.7	5.773	368	0	pg1515_o2nofp.cx10a_c32r128
1987	6901	97024	761.0	5259.9	66.0	14.060	112.923	2.647	33.991	216372	22.3	31.356	1551	785.3	881.3	87.9	5.460	384	0	pg1611_o2nofp.cx10a_c32r128
1987	6972	97991	768.6	5233.2	65.7	14.055	112.885	2.634	33.883	218411	22.5	31.327	1549	785.2	881.3	88.3	6.693	384	0	pg177_o2nofp.cx10a_c32r128
1987	6905	97068	761.3	5479.1	67.6	14.058	112.905	2.757	34.838	216543	22.5	31.362	1564	785.1	881.2	86.7	5.375	384	0	pg181_o2nofp.cx10b_c32r128
qr500.L3
qr500.L3: range queries with 500 insert/s per client
Performance metrics for all DBMS, not just the ones listed above. Some are normalized by throughput, others are not. Legend for results is here.
ips	qps	rps	rmbps	wps	wmbps	rpq	rkbpq	wpi	wkbpi	csps	cpups	cspq	cpupq	dbgb1	dbgb2	rss	maxop	p50	p99	tag
9885	306152	13172	105.5	16057.9	257.6	0.043	0.353	1.625	26.683	1143574	51.5	3.735	81	789.6	885.7	89.2	3.220	15453	13222	pg1222_o2nofp.cx10a_c32r128
9860	289408	13131	105.4	16016.6	256.5	0.045	0.373	1.624	26.633	1079837	51.7	3.731	86	787.4	883.4	89.0	3.037	14502	12450	pg1323_o2nofp.cx10a_c32r128
9885	289071	13180	106.3	15994.1	256.5	0.046	0.376	1.618	26.570	1075179	52.3	3.719	87	786.6	882.6	88.7	3.641	14496	12137	pg1420_o2nofp.cx10a_c32r128
9874	290091	13157	106.0	15970.4	256.3	0.045	0.374	1.617	26.576	1076201	52.2	3.710	86	786.9	882.9	88.4	5.466	14694	12391	pg1515_o2nofp.cx10a_c32r128
9896	285527	13186	106.4	16001.0	256.7	0.046	0.382	1.617	26.560	1054556	52.9	3.693	89	786.4	882.5	86.2	2.717	14400	12418	pg1611_o2nofp.cx10a_c32r128
9912	286298	13218	106.7	16032.6	257.3	0.046	0.382	1.618	26.577	1060941	52.6	3.706	88	786.2	882.3	86.6	3.332	14336	12387	pg177_o2nofp.cx10a_c32r128
9904	283872	13202	106.5	16030.1	256.9	0.047	0.384	1.619	26.566	1051452	52.6	3.704	89	786.2	882.3	85.9	3.403	14209	12115	pg181_o2nofp.cx10b_c32r128
qp500.L4
qp500.L4: point queries with 500 insert/s per client
Performance metrics for all DBMS, not just the ones listed above. Some are normalized by throughput, others are not. Legend for results is here.
ips	qps	rps	rmbps	wps	wmbps	rpq	rkbpq	wpi	wkbpi	csps	cpups	cspq	cpupq	dbgb1	dbgb2	rss	maxop	p50	p99	tag
9317	3826	73438	576.2	20030.0	277.3	19.195	154.209	2.150	30.479	177481	37.4	46.389	4692	792.8	888.9	89.2	9.381	208	0	pg1222_o2nofp.cx10a_c32r128
9343	3816	73424	576.1	20036.5	278.5	19.241	154.602	2.144	30.523	177091	38.1	46.409	4793	790.7	886.7	50.1	8.396	208	0	pg1323_o2nofp.cx10a_c32r128
9353	3847	73805	579.1	20040.8	278.8	19.187	154.164	2.143	30.529	176749	38.1	45.948	4754	789.7	885.8	48.1	11.496	208	0	pg1420_o2nofp.cx10a_c32r128
9409	3887	74532	584.8	20031.5	279.9	19.175	154.067	2.129	30.461	179013	38.2	46.054	4717	789.9	886.0	48.0	11.402	208	0	pg1515_o2nofp.cx10a_c32r128
9426	4039	76654	601.4	20116.2	280.6	18.978	152.472	2.134	30.479	179943	39.7	44.550	4718	789.5	885.5	41.5	9.823	224	0	pg1611_o2nofp.cx10a_c32r128
9259	3963	75210	590.1	19729.9	275.5	18.978	152.475	2.131	30.473	176203	39.0	44.463	4724	789.2	885.2	33.5	10.202	224	0	pg177_o2nofp.cx10a_c32r128
9501	4087	77495	608.2	20343.0	283.3	18.962	152.379	2.141	30.535	182461	39.6	44.645	4651	789.3	885.3	38.2	8.719	224	0	pg181_o2nofp.cx10b_c32r128
qr1000.L5
qr1000.L5: range queries with 1000 insert/s per client
Performance metrics for all DBMS, not just the ones listed above. Some are normalized by throughput, others are not. Legend for results is here.
ips	qps	rps	rmbps	wps	wmbps	rpq	rkbpq	wpi	wkbpi	csps	cpups	cspq	cpupq	dbgb1	dbgb2	rss	maxop	p50	p99	tag
16725	153763	22162	176.7	26085.6	545.8	0.144	1.177	1.560	33.416	452179	70.8	2.941	221	803.6	936.8	85.8	5.984	7819	575	pg1222_o2nofp.cx10a_c32r128
16536	144708	21919	174.6	25758.2	542.8	0.151	1.236	1.558	33.614	421741	71.6	2.914	237	801.9	897.9	86.4	2.348	7495	416	pg1323_o2nofp.cx10a_c32r128
16371	142684	21678	172.8	25379.1	541.9	0.152	1.240	1.550	33.893	413941	72.7	2.901	245	800.5	939.8	82.2	11.111	7304	479	pg1420_o2nofp.cx10a_c32r128
17013	144307	22550	179.7	26157.2	557.7	0.156	1.275	1.537	33.568	418861	72.3	2.903	240	800.7	896.8	85.8	2.121	7383	527	pg1515_o2nofp.cx10a_c32r128
15940	143551	21127	168.3	24629.8	526.2	0.147	1.201	1.545	33.802	398119	74.1	2.773	248	800.2	937.4	81.6	2.651	7416	1087	pg1611_o2nofp.cx10a_c32r128
15731	139108	20851	166.1	24376.8	519.3	0.150	1.223	1.550	33.803	387623	73.4	2.787	253	799.9	896.0	82.1	2.434	7259	681	pg177_o2nofp.cx10a_c32r128
15873	140474	21089	170.1	25054.6	530.0	0.150	1.240	1.578	34.193	395970	72.7	2.819	248	800.1	945.2	79.0	2.005	7272	608	pg181_o2nofp.cx10b_c32r128
qp1000.L6
qp1000.L6: point queries with 1000 insert/s per client
Performance metrics for all DBMS, not just the ones listed above. Some are normalized by throughput, others are not. Legend for results is here.
ips	qps	rps	rmbps	wps	wmbps	rpq	rkbpq	wpi	wkbpi	csps	cpups	cspq	cpupq	dbgb1	dbgb2	rss	maxop	p50	p99	tag
15003	1989	58162	503.9	31199.0	495.6	29.245	259.459	2.080	33.825	142504	68.4	71.653	16508	816.1	912.2	11.0	12.000	112	0	pg1222_o2nofp.cx10a_c32r128
14688	1959	57159	494.5	30095.5	482.2	29.182	258.500	2.049	33.620	140552	69.2	71.758	16958	814.5	910.5	4.8	9.960	112	0	pg1323_o2nofp.cx10a_c32r128
14736	1964	57380	502.1	30078.6	489.5	29.218	261.792	2.041	34.014	142481	68.5	72.550	16742	812.8	908.9	15.2	12.315	112	0	pg1420_o2nofp.cx10a_c32r128
14703	1945	57049	499.7	30000.7	491.7	29.331	263.055	2.040	34.248	140611	68.2	72.294	16831	813.0	909.1	15.3	11.475	112	0	pg1515_o2nofp.cx10a_c32r128
13284	2052	56723	532.8	27891.6	481.6	27.646	265.919	2.100	37.120	131488	67.0	64.084	15674	810.2	906.3	8.4	11.372	112	0	pg1611_o2nofp.cx10a_c32r128
13425	2090	57522	539.7	28140.0	487.6	27.521	264.410	2.096	37.188	133254	66.9	63.755	15364	809.7	905.7	45.8	11.953	112	0	pg177_o2nofp.cx10a_c32r128
14165	2294	62553	574.4	30208.8	522.5	27.269	256.399	2.133	37.775	145155	62.9	63.279	13162	805.5	901.5	44.8	12.076	112	0	pg181_o2nofp.cx10b_c32r128
l.i0
- l.i0: load without secondary indexes
- Legend for results is here.
- Each entry lists the percentage of responses that fit in that bucket (slower than max time for previous bucket, faster than min time for next bucket).
Insert response time histogram
256us	1ms	4ms	16ms	64ms	256ms	1s	4s	16s	gt	max	tag
0.000	92.765	7.009	0.120	0.087	0.013	0.006	nonzero	0.000	0.000	1.959	pg1222_o2nofp.cx10a_c32r128
0.000	91.437	8.272	0.180	0.094	0.010	0.006	nonzero	0.000	0.000	1.652	pg1323_o2nofp.cx10a_c32r128
0.000	89.116	10.611	0.189	0.064	0.014	0.007	nonzero	0.000	0.000	1.363	pg1420_o2nofp.cx10a_c32r128
0.000	89.254	10.490	0.167	0.066	0.016	0.006	nonzero	0.000	0.000	2.379	pg1515_o2nofp.cx10a_c32r128
0.000	89.419	10.364	0.133	0.062	0.016	0.006	nonzero	0.000	0.000	2.629	pg1611_o2nofp.cx10a_c32r128
0.000	90.038	9.704	0.171	0.063	0.017	0.006	0.000	0.000	0.000	0.727	pg177_o2nofp.cx10a_c32r128
0.000	92.951	6.739	0.213	0.072	0.020	0.006	nonzero	0.000	0.000	1.418	pg181_o2nofp.cx10b_c32r128
l.x
- l.x: create secondary indexes
- Legend for results is here.
- Each entry lists the percentage of responses that fit in that bucket (slower than max time for previous bucket, faster than min time for next bucket).
TODO - determine whether there is data for create index response time
l.i1
- l.i1: continue load after secondary indexes created with 50 inserts per transaction
- Legend for results is here.
- Each entry lists the percentage of responses that fit in that bucket (slower than max time for previous bucket, faster than min time for next bucket).
Insert response time histogram
256us	1ms	4ms	16ms	64ms	256ms	1s	4s	16s	gt	max	tag
0.000	0.000	0.000	22.876	57.736	19.178	0.085	0.124	0.001	0.000	5.877	pg1222_o2nofp.cx10a_c32r128
0.000	0.000	0.000	19.451	55.797	24.538	0.118	0.095	nonzero	0.000	5.523	pg1323_o2nofp.cx10a_c32r128
0.000	0.000	0.000	19.997	59.692	20.104	0.095	0.111	nonzero	0.000	4.978	pg1420_o2nofp.cx10a_c32r128
0.000	0.000	0.000	19.375	60.516	19.873	0.117	0.118	0.000	0.000	3.629	pg1515_o2nofp.cx10a_c32r128
0.000	0.000	0.000	18.921	61.478	19.413	0.075	0.112	0.001	0.000	6.370	pg1611_o2nofp.cx10a_c32r128
0.000	0.000	0.000	18.034	62.821	18.962	0.068	0.115	0.000	0.000	3.726	pg177_o2nofp.cx10a_c32r128
0.000	0.000	0.000	17.824	63.748	18.247	0.071	0.109	0.000	0.000	3.704	pg181_o2nofp.cx10b_c32r128
Delete response time histogram
256us	1ms	4ms	16ms	64ms	256ms	1s	4s	16s	gt	max	tag
0.000	2.680	10.086	30.731	51.763	4.662	0.026	0.052	0.000	0.000	3.195	pg1222_o2nofp.cx10a_c32r128
0.000	2.370	12.834	30.928	47.000	6.764	0.055	0.049	0.000	0.000	2.995	pg1323_o2nofp.cx10a_c32r128
0.000	2.325	9.038	25.230	57.952	5.355	0.039	0.060	0.000	0.000	2.373	pg1420_o2nofp.cx10a_c32r128
0.000	2.531	9.403	23.180	59.318	5.462	0.046	0.060	0.000	0.000	2.908	pg1515_o2nofp.cx10a_c32r128
0.000	2.223	7.785	21.627	62.077	6.188	0.034	0.065	0.000	0.000	3.093	pg1611_o2nofp.cx10a_c32r128
0.000	2.448	8.465	22.136	61.393	5.470	0.023	0.066	0.000	0.000	2.375	pg177_o2nofp.cx10a_c32r128
0.000	2.378	8.485	25.995	57.834	5.218	0.032	0.057	0.000	0.000	2.344	pg181_o2nofp.cx10b_c32r128
l.i2
- l.i2: continue load after secondary indexes created with 5 inserts per transaction
- Legend for results is here.
- Each entry lists the percentage of responses that fit in that bucket (slower than max time for previous bucket, faster than min time for next bucket).
Insert response time histogram
256us	1ms	4ms	16ms	64ms	256ms	1s	4s	16s	gt	max	tag
nonzero	38.455	60.817	0.262	0.277	0.045	0.101	0.043	nonzero	0.000	4.410	pg1222_o2nofp.cx10a_c32r128
0.124	42.876	55.647	0.329	0.931	0.033	0.050	0.010	nonzero	0.000	4.482	pg1323_o2nofp.cx10a_c32r128
0.004	31.347	67.951	0.308	0.219	0.042	0.099	0.030	nonzero	0.000	5.714	pg1420_o2nofp.cx10a_c32r128
0.198	37.098	61.732	0.330	0.548	0.025	0.048	0.021	nonzero	0.000	4.810	pg1515_o2nofp.cx10a_c32r128
0.057	36.232	63.293	0.047	0.266	0.023	0.058	0.023	nonzero	0.000	4.646	pg1611_o2nofp.cx10a_c32r128
0.042	33.708	65.620	0.115	0.383	0.031	0.069	0.032	nonzero	0.000	5.933	pg177_o2nofp.cx10a_c32r128
0.030	38.329	61.337	0.048	0.168	0.022	0.049	0.018	0.000	0.000	3.923	pg181_o2nofp.cx10b_c32r128
Delete response time histogram
256us	1ms	4ms	16ms	64ms	256ms	1s	4s	16s	gt	max	tag
0.000	0.000	0.000	8.443	91.553	0.002	0.002	0.001	0.000	0.000	2.114	pg1222_o2nofp.cx10a_c32r128
0.067	2.597	15.046	26.014	56.266	0.003	0.006	nonzero	0.000	0.000	1.422	pg1323_o2nofp.cx10a_c32r128
0.044	1.157	0.017	6.782	91.995	0.003	0.002	nonzero	0.000	0.000	2.767	pg1420_o2nofp.cx10a_c32r128
0.179	4.950	5.544	2.556	86.764	0.003	0.003	nonzero	0.000	0.000	3.166	pg1515_o2nofp.cx10a_c32r128
0.109	2.408	1.236	0.112	96.130	0.004	0.001	nonzero	0.000	0.000	2.276	pg1611_o2nofp.cx10a_c32r128
0.186	2.335	1.438	0.208	95.830	0.002	0.001	0.001	0.000	0.000	3.436	pg177_o2nofp.cx10a_c32r128
0.015	0.842	2.794	0.429	95.915	0.003	0.001	0.001	0.000	0.000	2.399	pg181_o2nofp.cx10b_c32r128
qr100.L1
- qr100.L1: range queries with 100 insert/s per client
- Legend for results is here.
- Each entry lists the percentage of responses that fit in that bucket (slower than max time for previous bucket, faster than min time for next bucket).
Query response time histogram
256us	1ms	4ms	16ms	64ms	256ms	1s	4s	16s	gt	max	tag
99.995	0.004	0.001	nonzero	nonzero	nonzero	nonzero	0.000	0.000	0.000	0.601	pg1222_o2nofp.cx10a_c32r128
99.995	0.005	0.001	nonzero	nonzero	nonzero	nonzero	0.000	0.000	0.000	0.732	pg1323_o2nofp.cx10a_c32r128
99.995	0.004	0.001	nonzero	nonzero	nonzero	nonzero	0.000	0.000	0.000	0.271	pg1420_o2nofp.cx10a_c32r128
99.995	0.004	0.001	nonzero	0.000	nonzero	0.000	0.000	0.000	0.000	0.083	pg1515_o2nofp.cx10a_c32r128
99.995	0.004	0.001	nonzero	nonzero	nonzero	nonzero	0.000	0.000	0.000	0.804	pg1611_o2nofp.cx10a_c32r128
99.995	0.004	0.001	nonzero	nonzero	nonzero	nonzero	0.000	0.000	0.000	0.353	pg177_o2nofp.cx10a_c32r128
99.995	0.004	0.001	nonzero	nonzero	nonzero	nonzero	0.000	0.000	0.000	0.809	pg181_o2nofp.cx10b_c32r128
Insert response time histogram
256us	1ms	4ms	16ms	64ms	256ms	1s	4s	16s	gt	max	tag
0.000	0.000	0.000	90.944	8.803	0.120	0.125	0.008	0.000	0.000	1.349	pg1222_o2nofp.cx10a_c32r128
0.000	0.000	0.000	93.187	6.615	0.068	0.130	0.000	0.000	0.000	0.998	pg1323_o2nofp.cx10a_c32r128
0.000	0.000	0.000	91.556	8.307	0.081	0.056	0.000	0.000	0.000	0.744	pg1420_o2nofp.cx10a_c32r128
0.000	0.000	0.000	90.610	9.242	0.109	0.038	0.000	0.000	0.000	0.627	pg1515_o2nofp.cx10a_c32r128
0.000	0.000	0.000	98.945	0.947	0.050	0.058	0.000	0.000	0.000	0.996	pg1611_o2nofp.cx10a_c32r128
0.000	0.000	0.000	98.469	1.416	0.048	0.061	0.006	0.000	0.000	1.116	pg177_o2nofp.cx10a_c32r128
0.000	0.000	0.000	98.326	1.520	0.099	0.053	0.001	0.000	0.000	1.394	pg181_o2nofp.cx10b_c32r128
Delete response time histogram
256us	1ms	4ms	16ms	64ms	256ms	1s	4s	16s	gt	max	tag
0.000	24.111	74.769	1.113	0.002	0.003	0.001	0.000	0.000	0.000	0.457	pg1222_o2nofp.cx10a_c32r128
0.000	21.687	75.902	2.405	0.000	0.001	0.006	0.000	0.000	0.000	0.765	pg1323_o2nofp.cx10a_c32r128
0.000	21.057	76.553	2.385	0.001	0.001	0.003	0.000	0.000	0.000	0.430	pg1420_o2nofp.cx10a_c32r128
0.000	23.320	74.820	1.855	0.001	0.004	0.000	0.000	0.000	0.000	0.197	pg1515_o2nofp.cx10a_c32r128
0.000	21.185	75.297	3.516	0.001	0.001	0.000	0.000	0.000	0.000	0.220	pg1611_o2nofp.cx10a_c32r128
0.000	21.790	73.509	4.698	0.002	0.001	0.001	0.000	0.000	0.000	0.385	pg177_o2nofp.cx10a_c32r128
0.000	22.555	74.951	2.487	0.003	0.004	0.000	0.000	0.000	0.000	0.198	pg181_o2nofp.cx10b_c32r128
qp100.L2
- qp100.L2: point queries with 100 insert/s per client
- Legend for results is here.
- Each entry lists the percentage of responses that fit in that bucket (slower than max time for previous bucket, faster than min time for next bucket).
Query response time histogram
256us	1ms	4ms	16ms	64ms	256ms	1s	4s	16s	gt	max	tag
nonzero	2.390	93.810	0.707	2.958	0.075	0.043	0.017	0.002	0.000	6.091	pg1222_o2nofp.cx10a_c32r128
0.000	2.231	94.087	0.624	2.916	0.079	0.048	0.015	0.001	0.000	5.458	pg1323_o2nofp.cx10a_c32r128
nonzero	2.313	94.083	0.620	2.841	0.075	0.051	0.016	0.001	0.000	4.923	pg1420_o2nofp.cx10a_c32r128
nonzero	2.234	94.105	0.661	2.853	0.077	0.052	0.015	0.001	0.000	5.773	pg1515_o2nofp.cx10a_c32r128
nonzero	2.328	94.392	0.230	2.915	0.082	0.042	0.010	0.001	0.000	5.460	pg1611_o2nofp.cx10a_c32r128
nonzero	2.230	94.436	0.242	2.976	0.073	0.032	0.011	0.001	0.000	6.693	pg177_o2nofp.cx10a_c32r128
nonzero	2.137	94.545	0.249	2.937	0.082	0.039	0.010	0.001	0.000	5.375	pg181_o2nofp.cx10b_c32r128
Insert response time histogram
256us	1ms	4ms	16ms	64ms	256ms	1s	4s	16s	gt	max	tag
0.000	0.000	0.000	63.540	33.156	1.148	0.955	1.124	0.078	0.000	6.055	pg1222_o2nofp.cx10a_c32r128
0.000	0.000	0.000	64.952	31.942	1.122	0.978	0.974	0.032	0.000	5.215	pg1323_o2nofp.cx10a_c32r128
0.000	0.000	0.000	62.825	34.117	1.115	1.003	0.910	0.030	0.000	4.594	pg1420_o2nofp.cx10a_c32r128
0.000	0.000	0.000	63.890	32.699	1.188	1.133	1.023	0.067	0.000	5.127	pg1515_o2nofp.cx10a_c32r128
0.000	0.000	0.000	66.511	31.162	0.985	0.651	0.669	0.021	0.000	4.779	pg1611_o2nofp.cx10a_c32r128
0.000	0.000	0.000	66.153	31.394	0.919	0.739	0.776	0.019	0.000	6.736	pg177_o2nofp.cx10a_c32r128
0.000	0.000	0.000	64.983	32.685	0.991	0.615	0.699	0.027	0.000	5.303	pg181_o2nofp.cx10b_c32r128
Delete response time histogram
256us	1ms	4ms	16ms	64ms	256ms	1s	4s	16s	gt	max	tag
0.000	0.000	55.915	39.570	4.401	0.028	0.033	0.051	0.001	0.000	4.255	pg1222_o2nofp.cx10a_c32r128
0.000	0.000	50.146	45.094	4.665	0.019	0.040	0.036	0.001	0.000	4.470	pg1323_o2nofp.cx10a_c32r128
0.000	0.000	46.623	48.293	4.974	0.017	0.051	0.040	0.001	0.000	4.540	pg1420_o2nofp.cx10a_c32r128
0.000	0.000	53.537	41.418	4.903	0.022	0.080	0.037	0.003	0.000	4.915	pg1515_o2nofp.cx10a_c32r128
0.000	0.000	43.539	51.183	5.243	0.014	0.013	0.008	0.000	0.000	3.417	pg1611_o2nofp.cx10a_c32r128
0.000	0.000	43.327	52.190	4.435	0.007	0.019	0.022	0.000	0.000	3.640	pg177_o2nofp.cx10a_c32r128
0.000	0.000	47.122	48.034	4.805	0.009	0.014	0.015	0.001	0.000	4.221	pg181_o2nofp.cx10b_c32r128
qr500.L3
- qr500.L3: range queries with 500 insert/s per client
- Legend for results is here.
- Each entry lists the percentage of responses that fit in that bucket (slower than max time for previous bucket, faster than min time for next bucket).
Query response time histogram
256us	1ms	4ms	16ms	64ms	256ms	1s	4s	16s	gt	max	tag
99.969	0.025	0.004	0.001	0.001	nonzero	nonzero	nonzero	0.000	0.000	3.220	pg1222_o2nofp.cx10a_c32r128
99.964	0.029	0.005	0.001	0.001	nonzero	nonzero	nonzero	0.000	0.000	3.037	pg1323_o2nofp.cx10a_c32r128
99.962	0.031	0.005	0.001	0.002	nonzero	nonzero	nonzero	0.000	0.000	3.641	pg1420_o2nofp.cx10a_c32r128
99.961	0.031	0.005	0.001	0.002	nonzero	nonzero	nonzero	nonzero	0.000	5.466	pg1515_o2nofp.cx10a_c32r128
99.966	0.027	0.004	0.001	0.001	nonzero	nonzero	nonzero	0.000	0.000	2.717	pg1611_o2nofp.cx10a_c32r128
99.968	0.025	0.005	0.001	0.001	nonzero	nonzero	nonzero	0.000	0.000	3.332	pg177_o2nofp.cx10a_c32r128
99.967	0.026	0.005	0.001	0.001	nonzero	nonzero	nonzero	0.000	0.000	3.403	pg181_o2nofp.cx10b_c32r128
Insert response time histogram
256us	1ms	4ms	16ms	64ms	256ms	1s	4s	16s	gt	max	tag
0.000	0.000	0.000	78.547	20.351	0.635	0.330	0.135	0.002	0.000	4.488	pg1222_o2nofp.cx10a_c32r128
0.000	0.000	0.000	76.439	22.467	0.641	0.311	0.140	0.002	0.000	4.559	pg1323_o2nofp.cx10a_c32r128
0.000	0.000	0.000	75.705	23.059	0.763	0.351	0.122	0.000	0.000	3.748	pg1420_o2nofp.cx10a_c32r128
0.000	0.000	0.000	74.761	24.048	0.721	0.347	0.119	0.004	0.000	5.558	pg1515_o2nofp.cx10a_c32r128
0.000	0.000	0.000	82.143	17.000	0.562	0.223	0.069	0.002	0.000	4.831	pg1611_o2nofp.cx10a_c32r128
0.000	0.000	0.000	83.535	15.676	0.474	0.244	0.071	0.000	0.000	3.722	pg177_o2nofp.cx10a_c32r128
0.000	0.000	0.000	82.975	16.299	0.459	0.218	0.046	0.003	0.000	6.631	pg181_o2nofp.cx10b_c32r128
Delete response time histogram
256us	1ms	4ms	16ms	64ms	256ms	1s	4s	16s	gt	max	tag
0.000	0.000	5.695	88.957	5.302	0.020	0.016	0.010	nonzero	0.000	4.088	pg1222_o2nofp.cx10a_c32r128
0.000	0.000	1.280	92.331	6.337	0.025	0.015	0.011	0.000	0.000	3.848	pg1323_o2nofp.cx10a_c32r128
0.000	0.000	0.125	89.337	10.470	0.037	0.023	0.009	0.000	0.000	3.728	pg1420_o2nofp.cx10a_c32r128
0.000	0.000	3.510	85.061	11.365	0.032	0.021	0.011	0.001	0.000	4.973	pg1515_o2nofp.cx10a_c32r128
0.000	0.000	0.053	84.997	14.920	0.020	0.005	0.004	0.000	0.000	3.536	pg1611_o2nofp.cx10a_c32r128
0.000	0.000	1.987	85.642	12.347	0.019	0.004	0.002	0.000	0.000	2.526	pg177_o2nofp.cx10a_c32r128
0.000	0.000	2.172	85.362	12.447	0.014	0.004	0.002	nonzero	0.000	5.657	pg181_o2nofp.cx10b_c32r128
qp500.L4
- qp500.L4: point queries with 500 insert/s per client
- Legend for results is here.
- Each entry lists the percentage of responses that fit in that bucket (slower than max time for previous bucket, faster than min time for next bucket).
Query response time histogram
256us	1ms	4ms	16ms	64ms	256ms	1s	4s	16s	gt	max	tag
0.000	0.102	90.621	3.499	5.647	0.085	0.026	0.014	0.005	0.000	9.381	pg1222_o2nofp.cx10a_c32r128
0.000	0.092	90.557	3.534	5.690	0.084	0.023	0.013	0.006	0.000	8.396	pg1323_o2nofp.cx10a_c32r128
0.000	0.096	90.822	3.337	5.616	0.083	0.026	0.014	0.005	0.000	11.496	pg1420_o2nofp.cx10a_c32r128
0.000	0.096	90.690	3.465	5.623	0.086	0.022	0.014	0.004	0.000	11.402	pg1515_o2nofp.cx10a_c32r128
0.000	0.104	92.040	2.072	5.673	0.070	0.023	0.013	0.004	0.000	9.823	pg1611_o2nofp.cx10a_c32r128
0.000	0.104	91.970	2.130	5.688	0.069	0.020	0.012	0.006	0.000	10.202	pg177_o2nofp.cx10a_c32r128
0.000	0.093	91.885	2.185	5.728	0.070	0.023	0.012	0.004	0.000	8.719	pg181_o2nofp.cx10b_c32r128
Insert response time histogram
256us	1ms	4ms	16ms	64ms	256ms	1s	4s	16s	gt	max	tag
0.000	0.000	0.000	25.300	69.276	4.678	0.377	0.269	0.099	0.000	9.354	pg1222_o2nofp.cx10a_c32r128
0.000	0.000	0.000	25.881	68.584	4.873	0.316	0.243	0.103	0.000	8.380	pg1323_o2nofp.cx10a_c32r128
0.000	0.000	0.000	27.020	67.582	4.651	0.387	0.263	0.098	0.000	11.714	pg1420_o2nofp.cx10a_c32r128
0.000	0.000	0.000	25.948	68.565	4.821	0.332	0.257	0.077	0.000	11.244	pg1515_o2nofp.cx10a_c32r128
0.000	0.000	0.000	27.979	68.340	3.030	0.315	0.260	0.076	0.000	9.649	pg1611_o2nofp.cx10a_c32r128
0.000	0.000	0.000	27.721	68.431	3.201	0.289	0.239	0.120	0.000	11.004	pg177_o2nofp.cx10a_c32r128
0.000	0.000	0.000	28.193	68.421	2.743	0.338	0.241	0.064	0.000	8.867	pg181_o2nofp.cx10b_c32r128
Delete response time histogram
256us	1ms	4ms	16ms	64ms	256ms	1s	4s	16s	gt	max	tag
0.000	0.000	0.000	49.879	49.646	0.201	0.194	0.066	0.014	0.000	8.869	pg1222_o2nofp.cx10a_c32r128
0.000	0.000	0.000	41.408	58.147	0.210	0.142	0.060	0.033	0.000	7.632	pg1323_o2nofp.cx10a_c32r128
0.000	0.000	0.000	37.732	61.764	0.221	0.192	0.072	0.018	0.000	8.708	pg1420_o2nofp.cx10a_c32r128
0.000	0.000	0.000	43.819	55.768	0.198	0.146	0.063	0.005	0.000	9.184	pg1515_o2nofp.cx10a_c32r128
0.000	0.000	0.000	28.759	70.805	0.213	0.143	0.067	0.012	0.000	7.183	pg1611_o2nofp.cx10a_c32r128
0.000	0.000	0.000	26.146	73.442	0.203	0.137	0.058	0.014	0.000	7.882	pg177_o2nofp.cx10a_c32r128
0.000	0.000	0.000	34.238	65.364	0.188	0.147	0.050	0.013	0.000	7.340	pg181_o2nofp.cx10b_c32r128
qr1000.L5
- qr1000.L5: range queries with 1000 insert/s per client
- Legend for results is here.
- Each entry lists the percentage of responses that fit in that bucket (slower than max time for previous bucket, faster than min time for next bucket).
Query response time histogram
256us	1ms	4ms	16ms	64ms	256ms	1s	4s	16s	gt	max	tag
98.619	1.158	0.092	0.091	0.039	0.001	nonzero	nonzero	nonzero	0.000	5.984	pg1222_o2nofp.cx10a_c32r128
98.398	1.364	0.098	0.097	0.042	0.001	nonzero	nonzero	0.000	0.000	2.348	pg1323_o2nofp.cx10a_c32r128
98.252	1.501	0.103	0.101	0.042	0.001	nonzero	nonzero	nonzero	0.000	11.111	pg1420_o2nofp.cx10a_c32r128
98.332	1.423	0.103	0.099	0.041	0.001	nonzero	nonzero	0.000	0.000	2.121	pg1515_o2nofp.cx10a_c32r128
98.767	1.052	0.053	0.079	0.047	0.002	nonzero	nonzero	0.000	0.000	2.651	pg1611_o2nofp.cx10a_c32r128
98.683	1.130	0.054	0.081	0.050	0.002	nonzero	nonzero	0.000	0.000	2.434	pg177_o2nofp.cx10a_c32r128
98.764	1.054	0.053	0.080	0.047	0.002	nonzero	nonzero	0.000	0.000	2.005	pg181_o2nofp.cx10b_c32r128
Insert response time histogram
256us	1ms	4ms	16ms	64ms	256ms	1s	4s	16s	gt	max	tag
0.000	0.000	0.000	25.531	45.646	28.459	0.220	0.134	0.011	0.000	13.090	pg1222_o2nofp.cx10a_c32r128
0.000	0.000	0.000	25.638	44.639	29.347	0.225	0.144	0.008	0.000	11.768	pg1323_o2nofp.cx10a_c32r128
0.000	0.000	0.000	20.565	46.403	32.653	0.208	0.164	0.007	0.000	13.108	pg1420_o2nofp.cx10a_c32r128
0.000	0.000	0.000	24.201	46.435	29.025	0.200	0.135	0.004	0.000	8.609	pg1515_o2nofp.cx10a_c32r128
0.000	0.000	0.000	21.138	42.966	35.432	0.332	0.129	0.003	0.000	6.886	pg1611_o2nofp.cx10a_c32r128
0.000	0.000	0.000	20.535	43.295	35.678	0.340	0.147	0.004	0.000	9.128	pg177_o2nofp.cx10a_c32r128
0.000	0.000	0.000	20.430	43.824	35.294	0.293	0.157	0.003	0.000	6.156	pg181_o2nofp.cx10b_c32r128
Delete response time histogram
256us	1ms	4ms	16ms	64ms	256ms	1s	4s	16s	gt	max	tag
0.000	0.000	0.000	0.031	84.292	15.540	0.056	0.081	nonzero	0.000	4.190	pg1222_o2nofp.cx10a_c32r128
0.000	0.000	0.000	0.021	82.453	17.362	0.078	0.086	nonzero	0.000	7.195	pg1323_o2nofp.cx10a_c32r128
0.000	0.000	0.000	0.008	82.757	17.077	0.070	0.088	nonzero	0.000	4.057	pg1420_o2nofp.cx10a_c32r128
0.000	0.000	0.000	0.008	84.357	15.485	0.064	0.086	nonzero	0.000	5.142	pg1515_o2nofp.cx10a_c32r128
0.000	0.000	0.000	0.003	79.918	19.906	0.099	0.074	nonzero	0.000	6.141	pg1611_o2nofp.cx10a_c32r128
0.000	0.000	0.000	nonzero	79.211	20.618	0.082	0.089	0.000	0.000	2.692	pg177_o2nofp.cx10a_c32r128
0.000	0.000	0.000	0.001	80.854	18.986	0.060	0.098	nonzero	0.000	4.137	pg181_o2nofp.cx10b_c32r128
qp1000.L6
- qp1000.L6: point queries with 1000 insert/s per client
- Legend for results is here.
- Each entry lists the percentage of responses that fit in that bucket (slower than max time for previous bucket, faster than min time for next bucket).
Query response time histogram
256us	1ms	4ms	16ms	64ms	256ms	1s	4s	16s	gt	max	tag
0.000	0.002	63.080	24.033	11.303	1.490	0.075	0.015	0.003	0.000	12.000	pg1222_o2nofp.cx10a_c32r128
0.000	0.002	62.795	24.281	11.166	1.664	0.071	0.018	0.004	0.000	9.960	pg1323_o2nofp.cx10a_c32r128
0.000	0.002	62.379	24.622	11.393	1.519	0.067	0.015	0.003	0.000	12.315	pg1420_o2nofp.cx10a_c32r128
0.000	0.002	63.008	23.851	11.494	1.556	0.064	0.022	0.003	0.000	11.475	pg1515_o2nofp.cx10a_c32r128
0.000	0.007	64.221	23.025	11.336	1.325	0.068	0.015	0.003	0.000	11.372	pg1611_o2nofp.cx10a_c32r128
0.000	0.008	64.568	22.830	11.232	1.282	0.066	0.011	0.003	0.000	11.953	pg177_o2nofp.cx10a_c32r128
0.000	0.006	65.821	22.667	10.842	0.584	0.067	0.011	0.001	0.000	12.076	pg181_o2nofp.cx10b_c32r128
Insert response time histogram
256us	1ms	4ms	16ms	64ms	256ms	1s	4s	16s	gt	max	tag
0.000	0.000	0.000	7.144	51.841	40.211	0.667	0.119	0.017	0.000	11.950	pg1222_o2nofp.cx10a_c32r128
0.000	0.000	0.000	7.466	51.256	40.444	0.676	0.134	0.024	0.000	9.914	pg1323_o2nofp.cx10a_c32r128
0.000	0.000	0.000	6.950	52.015	40.232	0.666	0.118	0.020	0.000	12.569	pg1420_o2nofp.cx10a_c32r128
0.000	0.000	0.000	7.477	50.868	40.823	0.647	0.166	0.019	0.000	13.275	pg1515_o2nofp.cx10a_c32r128
0.000	0.000	0.000	6.307	44.745	47.798	0.993	0.136	0.021	0.000	11.650	pg1611_o2nofp.cx10a_c32r128
0.000	0.000	0.000	6.408	45.447	47.038	0.973	0.111	0.022	0.000	12.420	pg177_o2nofp.cx10a_c32r128
0.000	0.000	0.000	5.345	49.892	43.808	0.812	0.131	0.012	0.000	12.151	pg181_o2nofp.cx10b_c32r128
Delete response time histogram
256us	1ms	4ms	16ms	64ms	256ms	1s	4s	16s	gt	max	tag
0.000	0.106	5.309	8.460	70.922	14.873	0.280	0.049	nonzero	0.000	9.445	pg1222_o2nofp.cx10a_c32r128
0.000	0.078	4.985	8.578	68.570	17.408	0.302	0.077	0.002	0.000	8.510	pg1323_o2nofp.cx10a_c32r128
0.000	0.103	6.472	8.232	69.054	15.795	0.281	0.062	nonzero	0.000	9.740	pg1420_o2nofp.cx10a_c32r128
0.000	0.125	7.064	8.238	68.970	15.271	0.247	0.084	0.001	0.000	11.155	pg1515_o2nofp.cx10a_c32r128
0.000	0.752	8.794	16.202	60.969	12.933	0.280	0.068	0.001	0.000	10.843	pg1611_o2nofp.cx10a_c32r128
0.000	0.686	7.954	17.505	60.474	13.049	0.278	0.053	0.001	0.000	10.503	pg177_o2nofp.cx10a_c32r128
0.000	0.229	9.510	25.815	56.610	7.563	0.231	0.041	0.001	0.000	12.067	pg181_o2nofp.cx10b_c32r128