Introduction
This is a report for the insert benchmark with 3600M docs and 12 client(s). It is generated by scripts (bash, awk, sed) and Tufte might not be impressed. An overview of the insert benchmark is here and a short update is here. Below, by DBMS, I mean DBMS+version.config. An example is my8020.c10b40 where my means MySQL, 8020 is version 8.0.20 and c10b40 is the name for the configuration file.
The test server has 32 cores, 128G RAM and 1 NVMe devices. The benchmark was run with 8 clients and there were 1 or 3 connections per client (1 for queries or inserts without rate limits, 1+1 for rate limited inserts+deletes). It uses 8 tables with a table per client. It loads 300M rows per table without secondary indexes, creates 3 secondary indexes per table, then inserts 4m+1m rows per table with a delete per insert to avoid growing the table. It then does 6 read+write tests for 1800s each that do queries as fast as possible with 100,100,500,500,1000,1000 inserts/s and the same for deletes/s per client concurrent with the queries. The database is larger than RAM and most tests are IO-bound except for the range query (qr*) tests that frequently have a cached working set. Clients and the DBMS share one server.
The tested DBMS are:
- my8407_rel_o2nofp.cz12a_c32r128 - MySQL 8.4.7 with the cz12a_c32r128 config
- my8407_rel_o2nofp.cz12a_c32r128 - MySQL 8.4.7 with the cz12a_nocb_c32r128 config that disables the InnoDB change buffer
- pg181_o2nofp.cx10b_c32r128 - Postgres 18.1 with the cx10b_c3r128 config
Contents
- Summary
- l.i0: load without secondary indexes
- l.x: create secondary indexes
- l.i1: continue load after secondary indexes created with 50 inserts per transaction
- l.i2: continue load after secondary indexes created with 5 inserts per transaction
- qr100.L1: range queries with 100 insert/s per client
- qp100.L2: point queries with 100 insert/s per client
- qr500.L3: range queries with 500 insert/s per client
- qp500.L4: point queries with 500 insert/s per client
- qr1000.L5: range queries with 1000 insert/s per client
- qp1000.L6: point queries with 1000 insert/s per client
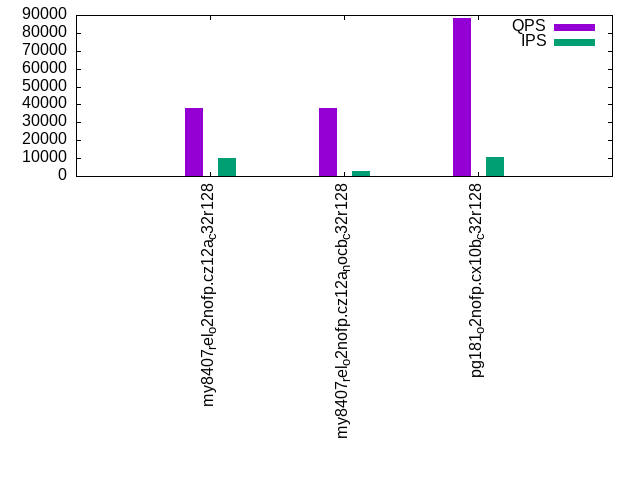
Summary
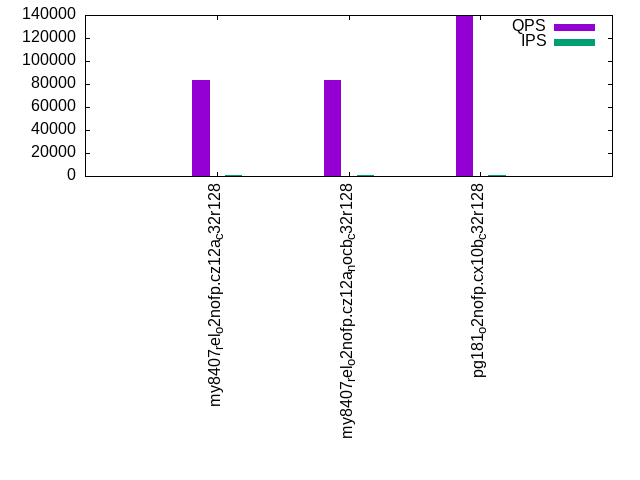
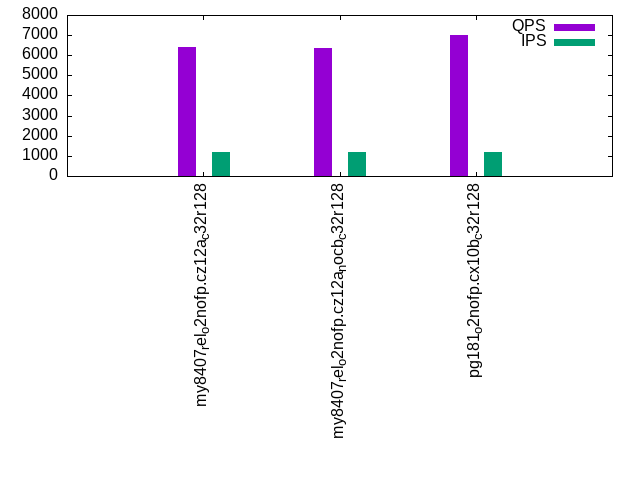
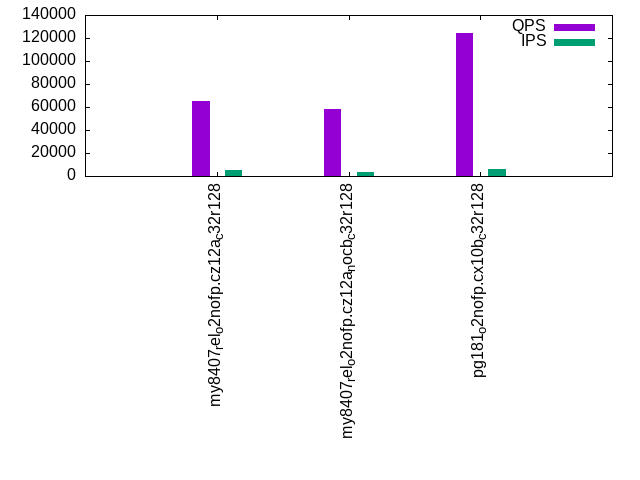
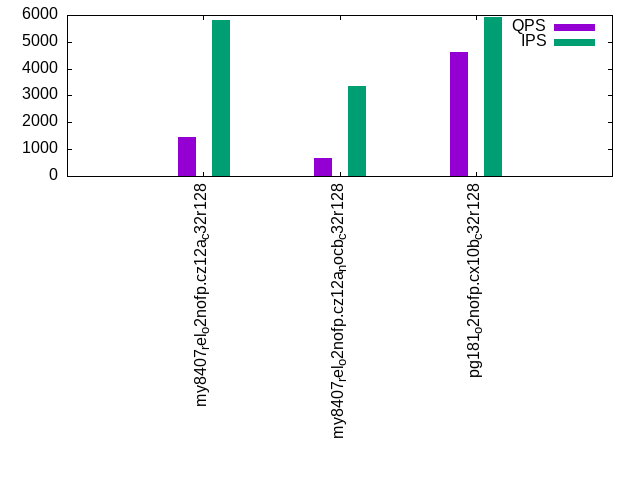
The numbers are inserts/s for l.i0, l.i1 and l.i2, indexed docs (or rows) /s for l.x and queries/s for qr100, qp100 thru qr1000, qp1000" The values are the average rate over the entire test for inserts (IPS) and queries (QPS). The range of values for IPS and QPS is split into 3 parts: bottom 25%, middle 50%, top 25%. Values in the bottom 25% have a red background, values in the top 25% have a green background and values in the middle have no color. A gray background is used for values that can be ignored because the DBMS did not sustain the target insert rate. Red backgrounds are not used when the minimum value is within 80% of the max value.
| dbms | l.i0 | l.x | l.i1 | l.i2 | qr100 | qp100 | qr500 | qp500 | qr1000 | qp1000 |
|---|---|---|---|---|---|---|---|---|---|---|
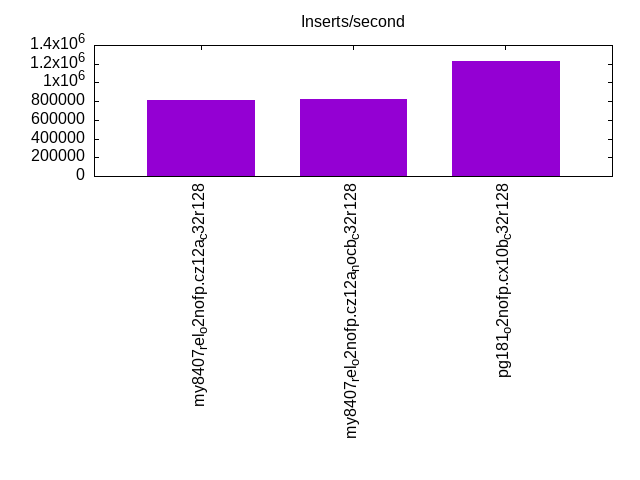
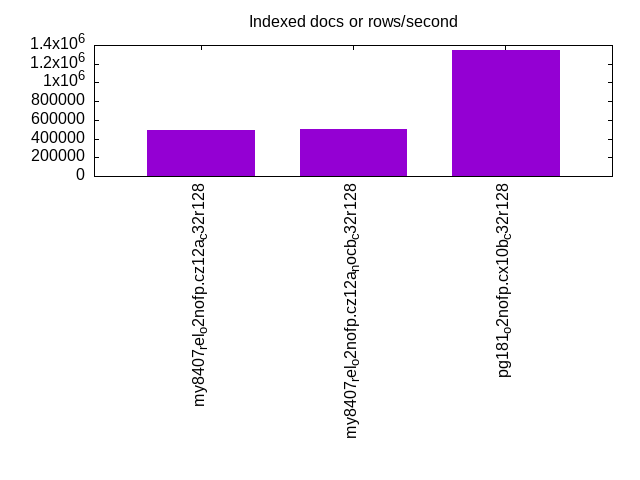
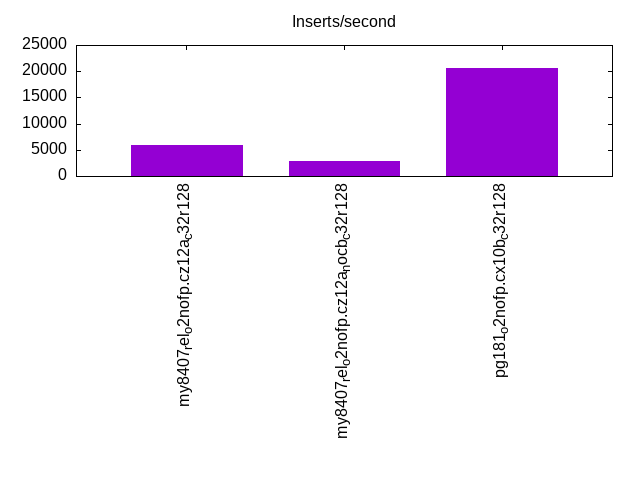
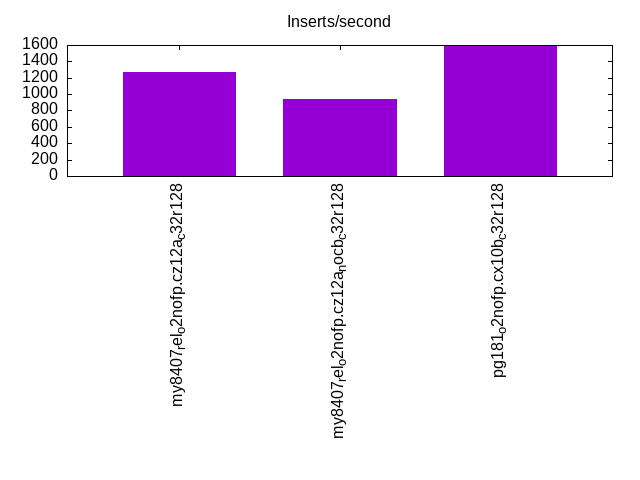
| my8407_rel_o2nofp.cz12a_c32r128 | 808444 | 491803 | 5859 | 1269 | 83544 | 6414 | 65214 | 1467 | 38162 | 1799 |
| my8407_rel_o2nofp.cz12a_nocb_c32r128 | 817996 | 507185 | 2790 | 939 | 83854 | 6382 | 58623 | 674 | 37978 | 1258 |
| pg181_o2nofp.cx10b_c32r128 | 1232877 | 1351351 | 20601 | 1598 | 139408 | 7024 | 124342 | 4603 | 88467 | 2600 |
This table has relative throughput, throughput for the DBMS relative to the DBMS in the first line, using the absolute throughput from the previous table. Values less than 0.95 have a yellow background. Values greater than 1.05 have a blue background.
| dbms | l.i0 | l.x | l.i1 | l.i2 | qr100 | qp100 | qr500 | qp500 | qr1000 | qp1000 |
|---|---|---|---|---|---|---|---|---|---|---|
| my8407_rel_o2nofp.cz12a_c32r128 | 1.00 | 1.00 | 1.00 | 1.00 | 1.00 | 1.00 | 1.00 | 1.00 | 1.00 | 1.00 |
| my8407_rel_o2nofp.cz12a_nocb_c32r128 | 1.01 | 1.03 | 0.48 | 0.74 | 1.00 | 1.00 | 0.90 | 0.46 | 1.00 | 0.70 |
| pg181_o2nofp.cx10b_c32r128 | 1.52 | 2.75 | 3.52 | 1.26 | 1.67 | 1.10 | 1.91 | 3.14 | 2.32 | 1.45 |
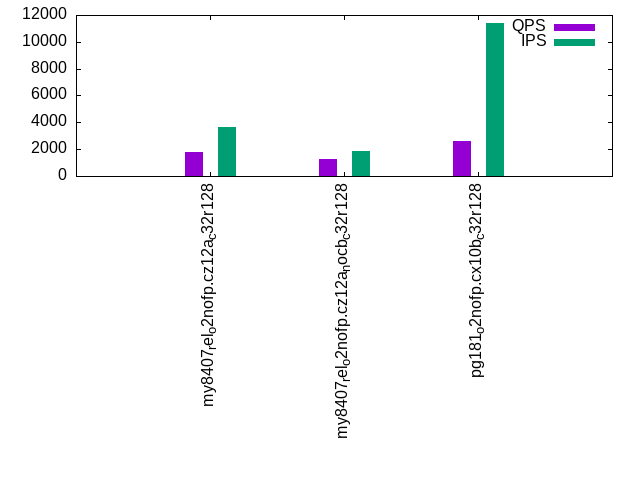
This lists the average rate of inserts/s for the tests that do inserts concurrent with queries. For such tests the query rate is listed in the table above. The read+write tests are setup so that the insert rate should match the target rate every second. Cells that are not at least 95% of the target have a red background to indicate a failure to satisfy the target.
| dbms | qr100.L1 | qp100.L2 | qr500.L3 | qp500.L4 | qr1000.L5 | qp1000.L6 |
|---|---|---|---|---|---|---|
| my8407_rel_o2nofp.cz12a_c32r128 | 1193 | 1192 | 5622 | 5800 | 9954 | 3659 |
| my8407_rel_o2nofp.cz12a_nocb_c32r128 | 1193 | 1193 | 3662 | 3361 | 2819 | 1833 |
| pg181_o2nofp.cx10b_c32r128 | 1192 | 1192 | 5944 | 5937 | 10578 | 11380 |
| target | 1200 | 1200 | 6000 | 6000 | 12000 | 12000 |
l.i0
l.i0: load without secondary indexes. Graphs for performance per 1-second interval are here.
Average throughput:
Insert response time histogram: each cell has the percentage of responses that take <= the time in the header and max is the max response time in seconds. For the max column values in the top 25% of the range have a red background and in the bottom 25% of the range have a green background. The red background is not used when the min value is within 80% of the max value.
| dbms | 256us | 1ms | 4ms | 16ms | 64ms | 256ms | 1s | 4s | 16s | gt | max |
|---|---|---|---|---|---|---|---|---|---|---|---|
| my8407_rel_o2nofp.cz12a_c32r128 | 0.013 | 99.789 | 0.070 | 0.061 | 0.047 | 0.017 | 0.003 | 3.564 | |||
| my8407_rel_o2nofp.cz12a_nocb_c32r128 | 0.010 | 99.791 | 0.075 | 0.059 | 0.048 | 0.015 | 0.002 | 1.977 | |||
| pg181_o2nofp.cx10b_c32r128 | 98.378 | 1.445 | 0.095 | 0.055 | 0.021 | 0.006 | 0.001 | 1.767 |
Performance metrics for the DBMS listed above. Some are normalized by throughput, others are not. Legend for results is here.
ips	qps	rps	rmbps	wps	wmbps	rpq	rkbpq	wpi	wkbpi	csps	cpups	cspq	cpupq	dbgb1	dbgb2	rss	maxop	p50	p99	tag
808444	0	1	0.0	5376.7	300.5	0.000	0.000	0.007	0.381	144068	46.8	0.178	19	235.9	503.7	108.7	3.564	74791	5499	my8407_rel_o2nofp.cz12a_c32r128
817996	0	1	0.0	5445.1	304.2	0.000	0.000	0.007	0.381	146214	47.6	0.179	19	235.9	503.7	108.7	1.977	75391	13298	my8407_rel_o2nofp.cz12a_nocb_c32r128
1232877	0	636	5.0	4557.1	493.8	0.001	0.004	0.004	0.410	124047	54.3	0.101	14	344.4	440.5	97.2	1.767	113286	7799	pg181_o2nofp.cx10b_c32r128
Average values from iostat.
r/s	rkB/s	rrqm/s	%rrqm	r_await	rareq-s	w/s	wkB/s	wrqm/s	%wrqm	w_await	wareq-s	d/s	dkB/s	drqm/s	%drqm	d_await	dareq-s	f/s	f_await	aqu-sz	%util
1.209	10.90	0.003	0.056	4.579	5.221	5376.7	307694	93.40	1.821	14.44	57.94	1.271	28.02	0.000	0.000	5.610	16.94	16.98	4.207	70.80	34.20		my8407_rel_o2nofp.cz12a_c32r128
1.287	11.01	0.000	0.000	3.542	5.223	5445.1	311512	94.67	1.819	11.68	57.80	1.607	12.34	0.000	0.000	4.532	5.940	17.31	3.534	62.30	32.44		my8407_rel_o2nofp.cz12a_nocb_c32r128
636.0	5167.7	0.007	0.076	0.883	4.002	4557.1	505656	503.0	6.549	4.007	112.5	0.534	1039.5	0.000	0.000	1.374	165.0	226.2	1.375	11.12	44.03		pg181_o2nofp.cx10b_c32r128
l.x
l.x: create secondary indexes.
Average throughput:
Performance metrics for the DBMS listed above. Some are normalized by throughput, others are not. Legend for results is here.
ips	qps	rps	rmbps	wps	wmbps	rpq	rkbpq	wpi	wkbpi	csps	cpups	cspq	cpupq	dbgb1	dbgb2	rss	maxop	p50	p99	tag
491803	0	6606	643.9	15345.5	720.8	0.013	1.341	0.031	1.501	73922	26.7	0.150	17	543.1	810.9	109.0	0.002	NA	NA	my8407_rel_o2nofp.cz12a_c32r128
507185	0	6811	663.8	15822.2	743.2	0.013	1.340	0.031	1.501	60523	25.6	0.119	16	543.1	810.9	109.0	0.005	NA	NA	my8407_rel_o2nofp.cz12a_nocb_c32r128
1351351	0	3817	475.1	3705.7	433.1	0.003	0.360	0.003	0.328	19725	16.3	0.015	4	691.5	787.6	53.5	0.003	NA	NA	pg181_o2nofp.cx10b_c32r128
Average values from iostat.
r/s	rkB/s	rrqm/s	%rrqm	r_await	rareq-s	w/s	wkB/s	wrqm/s	%wrqm	w_await	wareq-s	d/s	dkB/s	drqm/s	%drqm	d_await	dareq-s	f/s	f_await	aqu-sz	%util
6605.9	659306	0.001	0.000	4.810	110.9	15345.5	738077	99.24	0.715	19.05	71.20	9.952	79560.2	0.001	0.001	0.853	759.2	8.696	27.29	138.4	95.82		my8407_rel_o2nofp.cz12a_c32r128
6811.0	679725	0.000	0.000	6.203	113.1	15822.2	761043	107.4	0.889	21.39	73.37	10.25	82086.6	0.000	0.000	0.889	915.8	8.728	29.62	141.7	97.09		my8407_rel_o2nofp.cz12a_nocb_c32r128
3816.8	486533	0.002	0.000	0.743	127.5	3705.7	443485	91.81	1.789	33.99	123.0	3.549	121704	0.000	0.000	14.35	2725.3	32.33	9.429	67.17	89.82		pg181_o2nofp.cx10b_c32r128
l.i1
l.i1: continue load after secondary indexes created with 50 inserts per transaction. Graphs for performance per 1-second interval are here.
Average throughput:
Insert response time histogram: each cell has the percentage of responses that take <= the time in the header and max is the max response time in seconds. For the max column values in the top 25% of the range have a red background and in the bottom 25% of the range have a green background. The red background is not used when the min value is within 80% of the max value.
| dbms | 256us | 1ms | 4ms | 16ms | 64ms | 256ms | 1s | 4s | 16s | gt | max |
|---|---|---|---|---|---|---|---|---|---|---|---|
| my8407_rel_o2nofp.cz12a_c32r128 | 0.443 | 19.491 | 34.311 | 39.620 | 5.685 | 0.293 | 0.157 | 11.448 | |||
| my8407_rel_o2nofp.cz12a_nocb_c32r128 | 0.010 | 6.569 | 72.228 | 20.397 | 0.527 | 0.268 | 11.138 | ||||
| pg181_o2nofp.cx10b_c32r128 | 25.833 | 70.584 | 3.541 | 0.025 | 0.017 | 3.066 |
Delete response time histogram: each cell has the percentage of responses that take <= the time in the header and max is the max response time in seconds. For the max column values in the top 25% of the range have a red background and in the bottom 25% of the range have a green background. The red background is not used when the min value is within 80% of the max value.
| dbms | 256us | 1ms | 4ms | 16ms | 64ms | 256ms | 1s | 4s | 16s | gt | max |
|---|---|---|---|---|---|---|---|---|---|---|---|
| my8407_rel_o2nofp.cz12a_c32r128 | 39.140 | 24.349 | 20.267 | 15.574 | 0.545 | 0.106 | 0.018 | 9.182 | |||
| my8407_rel_o2nofp.cz12a_nocb_c32r128 | 0.263 | 21.516 | 65.362 | 12.300 | 0.420 | 0.140 | 10.910 | ||||
| pg181_o2nofp.cx10b_c32r128 | 2.059 | 10.632 | 27.269 | 59.731 | 0.281 | 0.012 | 0.015 | 2.389 |
Performance metrics for the DBMS listed above. Some are normalized by throughput, others are not. Legend for results is here.
ips	qps	rps	rmbps	wps	wmbps	rpq	rkbpq	wpi	wkbpi	csps	cpups	cspq	cpupq	dbgb1	dbgb2	rss	maxop	p50	p99	tag
5859	0	10470	163.6	15649.3	470.1	1.787	28.591	2.671	82.159	104559	9.9	17.845	541	735.2	1020.9	108.9	11.448	400	0	my8407_rel_o2nofp.cz12a_c32r128
2790	0	11995	187.4	15804.4	449.0	4.299	68.784	5.664	164.770	96164	5.8	34.465	665	727.0	1002.0	108.9	11.138	250	0	my8407_rel_o2nofp.cz12a_nocb_c32r128
20601	0	24994	200.1	30940.8	527.7	1.213	9.948	1.502	26.230	58462	30.1	2.838	468	699.4	795.4	97.2	3.066	1800	400	pg181_o2nofp.cx10b_c32r128
Average values from iostat.
r/s	rkB/s	rrqm/s	%rrqm	r_await	rareq-s	w/s	wkB/s	wrqm/s	%wrqm	w_await	wareq-s	d/s	dkB/s	drqm/s	%drqm	d_await	dareq-s	f/s	f_await	aqu-sz	%util
10470.2	167521	0.000	0.000	6.167	16.00	15649.3	481392	48.69	0.344	58.07	31.07	0.012	0.341	0.000	0.000	1.312	1.237	12.53	39.77	383.9	99.86		my8407_rel_o2nofp.cz12a_c32r128
11995.1	191921	0.000	0.000	1.487	16.00	15804.4	459741	23.35	0.167	58.93	29.26	0.010	0.353	0.000	0.000	0.851	1.532	7.578	44.02	412.0	100.00		my8407_rel_o2nofp.cz12a_nocb_c32r128
24993.5	204938	0.001	0.000	0.438	8.214	30940.8	540357	223.6	2.279	1.356	20.91	0.069	542.4	0.000	0.000	0.242	292.0	184.6	2.318	45.40	97.28		pg181_o2nofp.cx10b_c32r128
l.i2
l.i2: continue load after secondary indexes created with 5 inserts per transaction. Graphs for performance per 1-second interval are here.
Average throughput:
Insert response time histogram: each cell has the percentage of responses that take <= the time in the header and max is the max response time in seconds. For the max column values in the top 25% of the range have a red background and in the bottom 25% of the range have a green background. The red background is not used when the min value is within 80% of the max value.
| dbms | 256us | 1ms | 4ms | 16ms | 64ms | 256ms | 1s | 4s | 16s | gt | max |
|---|---|---|---|---|---|---|---|---|---|---|---|
| my8407_rel_o2nofp.cz12a_c32r128 | 28.094 | 44.811 | 26.648 | 0.394 | 0.052 | 0.002 | 5.639 | ||||
| my8407_rel_o2nofp.cz12a_nocb_c32r128 | 17.278 | 38.939 | 42.855 | 0.872 | 0.054 | 0.002 | 5.865 | ||||
| pg181_o2nofp.cx10b_c32r128 | 18.166 | 79.256 | 1.707 | 0.862 | 0.008 | nonzero | 0.920 |
Delete response time histogram: each cell has the percentage of responses that take <= the time in the header and max is the max response time in seconds. For the max column values in the top 25% of the range have a red background and in the bottom 25% of the range have a green background. The red background is not used when the min value is within 80% of the max value.
| dbms | 256us | 1ms | 4ms | 16ms | 64ms | 256ms | 1s | 4s | 16s | gt | max |
|---|---|---|---|---|---|---|---|---|---|---|---|
| my8407_rel_o2nofp.cz12a_c32r128 | 39.388 | 41.148 | 19.344 | 0.102 | 0.018 | nonzero | 4.627 | ||||
| my8407_rel_o2nofp.cz12a_nocb_c32r128 | 22.478 | 36.588 | 40.450 | 0.448 | 0.035 | 0.001 | 4.867 | ||||
| pg181_o2nofp.cx10b_c32r128 | 0.040 | 99.954 | 0.004 | 0.002 | 0.953 |
Performance metrics for the DBMS listed above. Some are normalized by throughput, others are not. Legend for results is here.
ips	qps	rps	rmbps	wps	wmbps	rpq	rkbpq	wpi	wkbpi	csps	cpups	cspq	cpupq	dbgb1	dbgb2	rss	maxop	p50	p99	tag
1269	0	11607	181.4	15464.4	437.7	9.147	146.357	12.187	353.188	100467	8.2	79.176	2068	735.2	1021.3	108.9	5.639	75	0	my8407_rel_o2nofp.cz12a_c32r128
939	0	12184	190.4	15539.6	435.5	12.974	207.580	16.547	474.897	95793	6.6	102.005	2249	727.0	1002.5	108.9	5.865	60	10	my8407_rel_o2nofp.cz12a_nocb_c32r128
1598	0	1864	15.3	3066.8	47.6	1.167	9.790	1.919	30.497	11081	27.1	6.934	5427	701.4	797.4	97.2	0.920	215	190	pg181_o2nofp.cx10b_c32r128
Average values from iostat.
r/s	rkB/s	rrqm/s	%rrqm	r_await	rareq-s	w/s	wkB/s	wrqm/s	%wrqm	w_await	wareq-s	d/s	dkB/s	drqm/s	%drqm	d_await	dareq-s	f/s	f_await	aqu-sz	%util
11607.0	185712	0.000	0.000	1.240	16.00	15464.4	448160	2.276	0.014	26.33	28.98	0.031	315.5	0.000	0.000	0.861	23.89	6.270	19.50	406.6	99.93		my8407_rel_o2nofp.cz12a_c32r128
12183.6	194938	0.000	0.000	0.781	16.00	15539.6	445976	2.039	0.013	26.91	28.70	0.024	225.9	0.000	0.000	0.872	12.90	5.343	19.21	417.2	99.99		my8407_rel_o2nofp.cz12a_nocb_c32r128
1864.1	15644.8	0.000	0.000	0.142	8.328	3066.8	48734.5	20.59	1.046	0.700	18.77	0.003	0.386	0.000	0.000	0.028	0.529	26.02	1.222	3.048	22.71		pg181_o2nofp.cx10b_c32r128
qr100.L1
qr100.L1: range queries with 100 insert/s per client. Graphs for performance per 1-second interval are here.
Average throughput:
Query response time histogram: each cell has the percentage of responses that take <= the time in the header and max is the max response time in seconds. For max values in the top 25% of the range have a red background and in the bottom 25% of the range have a green background. The red background is not used when the min value is within 80% of the max value.
| dbms | 256us | 1ms | 4ms | 16ms | 64ms | 256ms | 1s | 4s | 16s | gt | max |
|---|---|---|---|---|---|---|---|---|---|---|---|
| my8407_rel_o2nofp.cz12a_c32r128 | 99.902 | 0.094 | 0.003 | nonzero | nonzero | nonzero | nonzero | 0.718 | |||
| my8407_rel_o2nofp.cz12a_nocb_c32r128 | 99.868 | 0.130 | 0.002 | nonzero | nonzero | nonzero | 0.095 | ||||
| pg181_o2nofp.cx10b_c32r128 | 99.976 | 0.020 | 0.003 | nonzero | nonzero | nonzero | 0.128 |
Insert response time histogram: each cell has the percentage of responses that take <= the time in the header and max is the max response time in seconds. For max values in the top 25% of the range have a red background and in the bottom 25% of the range have a green background. The red background is not used when the min value is within 80% of the max value.
| dbms | 256us | 1ms | 4ms | 16ms | 64ms | 256ms | 1s | 4s | 16s | gt | max |
|---|---|---|---|---|---|---|---|---|---|---|---|
| my8407_rel_o2nofp.cz12a_c32r128 | 66.887 | 29.690 | 1.979 | 1.315 | 0.130 | 1.977 | |||||
| my8407_rel_o2nofp.cz12a_nocb_c32r128 | 13.475 | 85.907 | 0.602 | 0.016 | 0.281 | ||||||
| pg181_o2nofp.cx10b_c32r128 | 98.951 | 0.931 | 0.118 | 0.197 |
Delete response time histogram: each cell has the percentage of responses that take <= the time in the header and max is the max response time in seconds. For max values in the top 25% of the range have a red background and in the bottom 25% of the range have a green background. The red background is not used when the min value is within 80% of the max value.
| dbms | 256us | 1ms | 4ms | 16ms | 64ms | 256ms | 1s | 4s | 16s | gt | max |
|---|---|---|---|---|---|---|---|---|---|---|---|
| my8407_rel_o2nofp.cz12a_c32r128 | 98.713 | 0.264 | 0.236 | 0.650 | 0.137 | 0.784 | |||||
| my8407_rel_o2nofp.cz12a_nocb_c32r128 | 73.273 | 26.530 | 0.194 | 0.002 | 0.290 | ||||||
| pg181_o2nofp.cx10b_c32r128 | 43.669 | 56.292 | 0.023 | 0.016 | 0.023 |
Performance metrics for the DBMS listed above. Some are normalized by throughput, others are not. Legend for results is here.
ips	qps	rps	rmbps	wps	wmbps	rpq	rkbpq	wpi	wkbpi	csps	cpups	cspq	cpupq	dbgb1	dbgb2	rss	maxop	p50	p99	tag
1193	83544	5133	80.2	5277.8	151.3	0.061	0.983	4.425	129.858	503318	40.7	6.025	156	735.2	1021.6	108.8	0.718	7039	6239	my8407_rel_o2nofp.cz12a_c32r128
1193	83854	5235	81.8	5052.4	145.3	0.062	0.999	4.236	124.725	502887	40.8	5.997	156	727.0	1002.7	108.8	0.095	7039	6863	my8407_rel_o2nofp.cz12a_nocb_c32r128
1192	139408	1475	11.9	534.5	20.2	0.011	0.088	0.448	17.327	535668	37.9	3.842	87	701.5	797.5	97.2	0.128	11598	11310	pg181_o2nofp.cx10b_c32r128
Average values from iostat.
r/s	rkB/s	rrqm/s	%rrqm	r_await	rareq-s	w/s	wkB/s	wrqm/s	%wrqm	w_await	wareq-s	d/s	dkB/s	drqm/s	%drqm	d_await	dareq-s	f/s	f_await	aqu-sz	%util
5132.8	82124.7	0.000	0.000	0.401	16.00	5277.8	154882	1.547	0.031	8.444	29.47	0.004	0.040	0.000	0.000	0.123	0.166	2.726	5.438	44.32	26.98		my8407_rel_o2nofp.cz12a_c32r128
5235.1	83761.9	0.000	0.000	0.177	16.00	5052.4	148760	1.565	0.032	3.078	29.52	0.004	0.066	0.000	0.000	0.022	0.298	2.759	1.818	17.33	19.54		my8407_rel_o2nofp.cz12a_nocb_c32r128
1475.2	12198.6	0.000	0.000	0.120	8.268	534.5	20654.3	9.111	3.034	0.448	65.36	0.001	0.002	0.000	0.000	0.003	0.011	14.02	0.652	0.294	5.821		pg181_o2nofp.cx10b_c32r128
qp100.L2
qp100.L2: point queries with 100 insert/s per client. Graphs for performance per 1-second interval are here.
Average throughput:
Query response time histogram: each cell has the percentage of responses that take <= the time in the header and max is the max response time in seconds. For max values in the top 25% of the range have a red background and in the bottom 25% of the range have a green background. The red background is not used when the min value is within 80% of the max value.
| dbms | 256us | 1ms | 4ms | 16ms | 64ms | 256ms | 1s | 4s | 16s | gt | max |
|---|---|---|---|---|---|---|---|---|---|---|---|
| my8407_rel_o2nofp.cz12a_c32r128 | 0.003 | 26.185 | 66.002 | 7.537 | 0.238 | 0.030 | 0.002 | 0.002 | nonzero | 4.166 | |
| my8407_rel_o2nofp.cz12a_nocb_c32r128 | 0.003 | 26.506 | 65.456 | 7.745 | 0.251 | 0.034 | 0.003 | 0.002 | 3.546 | ||
| pg181_o2nofp.cx10b_c32r128 | nonzero | 1.238 | 98.607 | 0.155 | nonzero | 0.025 |
Insert response time histogram: each cell has the percentage of responses that take <= the time in the header and max is the max response time in seconds. For max values in the top 25% of the range have a red background and in the bottom 25% of the range have a green background. The red background is not used when the min value is within 80% of the max value.
| dbms | 256us | 1ms | 4ms | 16ms | 64ms | 256ms | 1s | 4s | 16s | gt | max |
|---|---|---|---|---|---|---|---|---|---|---|---|
| my8407_rel_o2nofp.cz12a_c32r128 | 10.389 | 79.572 | 8.970 | 0.718 | 0.269 | 0.083 | 4.842 | ||||
| my8407_rel_o2nofp.cz12a_nocb_c32r128 | 0.019 | 61.715 | 36.190 | 1.773 | 0.275 | 0.028 | 4.124 | ||||
| pg181_o2nofp.cx10b_c32r128 | 28.456 | 71.521 | 0.023 | 0.068 |
Delete response time histogram: each cell has the percentage of responses that take <= the time in the header and max is the max response time in seconds. For max values in the top 25% of the range have a red background and in the bottom 25% of the range have a green background. The red background is not used when the min value is within 80% of the max value.
| dbms | 256us | 1ms | 4ms | 16ms | 64ms | 256ms | 1s | 4s | 16s | gt | max |
|---|---|---|---|---|---|---|---|---|---|---|---|
| my8407_rel_o2nofp.cz12a_c32r128 | 96.752 | 1.512 | 0.843 | 0.354 | 0.275 | 0.264 | 3.762 | ||||
| my8407_rel_o2nofp.cz12a_nocb_c32r128 | 0.694 | 77.171 | 20.720 | 1.113 | 0.275 | 0.025 | 4.054 | ||||
| pg181_o2nofp.cx10b_c32r128 | 99.100 | 0.898 | 0.002 | 0.019 |
Performance metrics for the DBMS listed above. Some are normalized by throughput, others are not. Legend for results is here.
ips	qps	rps	rmbps	wps	wmbps	rpq	rkbpq	wpi	wkbpi	csps	cpups	cspq	cpupq	dbgb1	dbgb2	rss	maxop	p50	p99	tag
1192	6414	49743	777.2	11807.2	329.9	7.755	124.076	9.905	283.438	174014	11.4	27.128	569	735.2	1021.8	108.8	4.166	528	0	my8407_rel_o2nofp.cz12a_c32r128
1193	6382	49824	778.5	11884.5	332.3	7.808	124.920	9.964	285.260	171975	11.2	26.949	562	727.0	1002.9	108.8	3.546	528	0	my8407_rel_o2nofp.cz12a_nocb_c32r128
1192	7024	92321	725.0	4286.1	49.1	13.144	105.696	3.596	42.159	204214	11.6	29.075	529	701.5	797.6	97.2	0.025	608	400	pg181_o2nofp.cx10b_c32r128
Average values from iostat.
r/s	rkB/s	rrqm/s	%rrqm	r_await	rareq-s	w/s	wkB/s	wrqm/s	%wrqm	w_await	wareq-s	d/s	dkB/s	drqm/s	%drqm	d_await	dareq-s	f/s	f_await	aqu-sz	%util
49742.7	795883	0.000	0.000	0.343	16.00	11807.2	337858	3.640	0.035	8.766	28.67	0.004	0.027	0.000	0.000	0.142	0.099	2.836	9.218	107.1	99.97		my8407_rel_o2nofp.cz12a_c32r128
49823.7	797179	0.000	0.000	0.265	16.00	11884.5	340230	2.862	0.027	7.581	28.68	0.003	0.040	0.000	0.000	0.047	0.166	2.763	8.089	95.95	99.97		my8407_rel_o2nofp.cz12a_nocb_c32r128
92320.8	742365	0.000	0.000	0.099	8.041	4286.1	50253.2	17.48	0.534	0.030	13.41	0.003	0.285	0.000	0.000	0.009	0.365	17.95	0.621	9.029	99.97		pg181_o2nofp.cx10b_c32r128
qr500.L3
qr500.L3: range queries with 500 insert/s per client. Graphs for performance per 1-second interval are here.
Average throughput:
Query response time histogram: each cell has the percentage of responses that take <= the time in the header and max is the max response time in seconds. For max values in the top 25% of the range have a red background and in the bottom 25% of the range have a green background. The red background is not used when the min value is within 80% of the max value.
| dbms | 256us | 1ms | 4ms | 16ms | 64ms | 256ms | 1s | 4s | 16s | gt | max |
|---|---|---|---|---|---|---|---|---|---|---|---|
| my8407_rel_o2nofp.cz12a_c32r128 | 97.732 | 1.718 | 0.530 | 0.010 | 0.008 | 0.001 | nonzero | nonzero | nonzero | 4.202 | |
| my8407_rel_o2nofp.cz12a_nocb_c32r128 | 96.105 | 2.697 | 1.156 | 0.015 | 0.023 | 0.004 | nonzero | nonzero | nonzero | 5.001 | |
| pg181_o2nofp.cx10b_c32r128 | 99.941 | 0.048 | 0.005 | 0.001 | 0.002 | 0.002 | nonzero | 0.281 |
Insert response time histogram: each cell has the percentage of responses that take <= the time in the header and max is the max response time in seconds. For max values in the top 25% of the range have a red background and in the bottom 25% of the range have a green background. The red background is not used when the min value is within 80% of the max value.
| dbms | 256us | 1ms | 4ms | 16ms | 64ms | 256ms | 1s | 4s | 16s | gt | max |
|---|---|---|---|---|---|---|---|---|---|---|---|
| my8407_rel_o2nofp.cz12a_c32r128 | 10.660 | 70.393 | 17.127 | 1.425 | 0.354 | 0.041 | 8.602 | ||||
| my8407_rel_o2nofp.cz12a_nocb_c32r128 | 0.106 | 16.532 | 70.445 | 12.273 | 0.616 | 0.028 | 5.464 | ||||
| pg181_o2nofp.cx10b_c32r128 | 68.529 | 19.959 | 11.087 | 0.425 | 0.393 |
Delete response time histogram: each cell has the percentage of responses that take <= the time in the header and max is the max response time in seconds. For max values in the top 25% of the range have a red background and in the bottom 25% of the range have a green background. The red background is not used when the min value is within 80% of the max value.
| dbms | 256us | 1ms | 4ms | 16ms | 64ms | 256ms | 1s | 4s | 16s | gt | max |
|---|---|---|---|---|---|---|---|---|---|---|---|
| my8407_rel_o2nofp.cz12a_c32r128 | 76.256 | 16.762 | 4.880 | 1.706 | 0.147 | 0.237 | 0.013 | 8.657 | |||
| my8407_rel_o2nofp.cz12a_nocb_c32r128 | 0.581 | 27.781 | 62.412 | 8.734 | 0.475 | 0.018 | 5.326 | ||||
| pg181_o2nofp.cx10b_c32r128 | 31.900 | 66.184 | 0.805 | 1.106 | 0.005 | 0.304 |
Performance metrics for the DBMS listed above. Some are normalized by throughput, others are not. Legend for results is here.
ips	qps	rps	rmbps	wps	wmbps	rpq	rkbpq	wpi	wkbpi	csps	cpups	cspq	cpupq	dbgb1	dbgb2	rss	maxop	p50	p99	tag
5622	65214	13615	212.7	15797.6	452.1	0.209	3.340	2.810	82.351	457125	44.9	7.010	220	735.2	1022.8	108.8	4.202	5823	0	my8407_rel_o2nofp.cz12a_c32r128
3662	58623	13689	213.9	16247.1	450.0	0.234	3.736	4.436	125.824	422199	40.4	7.202	221	727.0	1004.1	108.8	5.001	5151	96	my8407_rel_o2nofp.cz12a_nocb_c32r128
5944	124342	8561	69.1	7418.4	136.2	0.069	0.569	1.248	23.464	492199	40.9	3.958	105	701.8	797.9	97.2	0.281	10815	5999	pg181_o2nofp.cx10b_c32r128
Average values from iostat.
r/s	rkB/s	rrqm/s	%rrqm	r_await	rareq-s	w/s	wkB/s	wrqm/s	%wrqm	w_await	wareq-s	d/s	dkB/s	drqm/s	%drqm	d_await	dareq-s	f/s	f_await	aqu-sz	%util
13615.0	217839	0.000	0.000	1.188	16.00	15797.6	462979	2.498	0.021	29.46	29.51	0.018	0.150	0.000	0.000	1.184	0.578	6.586	20.01	355.4	99.31		my8407_rel_o2nofp.cz12a_c32r128
13688.9	219023	0.000	0.000	0.704	16.00	16247.1	460792	2.164	0.014	25.89	28.42	0.012	0.106	0.000	0.000	0.901	0.468	5.081	20.27	406.4	99.39		my8407_rel_o2nofp.cz12a_nocb_c32r128
8561.3	70721.6	0.000	0.000	0.194	8.254	7418.4	139465	31.61	0.795	4.309	36.07	0.011	117.5	0.000	0.000	0.018	51.37	58.53	2.834	23.52	48.94		pg181_o2nofp.cx10b_c32r128
qp500.L4
qp500.L4: point queries with 500 insert/s per client. Graphs for performance per 1-second interval are here.
Average throughput:
Query response time histogram: each cell has the percentage of responses that take <= the time in the header and max is the max response time in seconds. For max values in the top 25% of the range have a red background and in the bottom 25% of the range have a green background. The red background is not used when the min value is within 80% of the max value.
| dbms | 256us | 1ms | 4ms | 16ms | 64ms | 256ms | 1s | 4s | 16s | gt | max |
|---|---|---|---|---|---|---|---|---|---|---|---|
| my8407_rel_o2nofp.cz12a_c32r128 | 0.079 | 40.574 | 51.387 | 6.655 | 1.253 | 0.037 | 0.016 | 3.088 | |||
| my8407_rel_o2nofp.cz12a_nocb_c32r128 | 0.008 | 22.257 | 53.546 | 17.796 | 6.271 | 0.098 | 0.024 | 2.847 | |||
| pg181_o2nofp.cx10b_c32r128 | 0.329 | 84.772 | 14.534 | 0.363 | 0.001 | 0.179 |
Insert response time histogram: each cell has the percentage of responses that take <= the time in the header and max is the max response time in seconds. For max values in the top 25% of the range have a red background and in the bottom 25% of the range have a green background. The red background is not used when the min value is within 80% of the max value.
| dbms | 256us | 1ms | 4ms | 16ms | 64ms | 256ms | 1s | 4s | 16s | gt | max |
|---|---|---|---|---|---|---|---|---|---|---|---|
| my8407_rel_o2nofp.cz12a_c32r128 | 9.813 | 64.375 | 24.056 | 1.512 | 0.244 | 3.537 | |||||
| my8407_rel_o2nofp.cz12a_nocb_c32r128 | 0.014 | 7.334 | 76.857 | 15.465 | 0.331 | 3.193 | |||||
| pg181_o2nofp.cx10b_c32r128 | 5.956 | 90.708 | 3.336 | 0.238 |
Delete response time histogram: each cell has the percentage of responses that take <= the time in the header and max is the max response time in seconds. For max values in the top 25% of the range have a red background and in the bottom 25% of the range have a green background. The red background is not used when the min value is within 80% of the max value.
| dbms | 256us | 1ms | 4ms | 16ms | 64ms | 256ms | 1s | 4s | 16s | gt | max |
|---|---|---|---|---|---|---|---|---|---|---|---|
| my8407_rel_o2nofp.cz12a_c32r128 | 49.051 | 40.456 | 7.629 | 2.490 | 0.250 | 0.123 | 2.994 | ||||
| my8407_rel_o2nofp.cz12a_nocb_c32r128 | 0.060 | 12.366 | 78.938 | 8.393 | 0.244 | 3.115 | |||||
| pg181_o2nofp.cx10b_c32r128 | 45.935 | 54.029 | 0.036 | 0.086 |
Performance metrics for the DBMS listed above. Some are normalized by throughput, others are not. Legend for results is here.
ips	qps	rps	rmbps	wps	wmbps	rpq	rkbpq	wpi	wkbpi	csps	cpups	cspq	cpupq	dbgb1	dbgb2	rss	maxop	p50	p99	tag
5800	1467	22973	358.9	14640.9	412.3	15.661	250.572	2.524	72.796	121270	10.9	82.671	2378	735.2	1024.2	108.8	3.088	128	0	my8407_rel_o2nofp.cz12a_c32r128
3361	674	18485	288.8	15440.8	419.1	27.422	438.754	4.594	127.663	106762	6.3	158.377	2991	727.0	1005.7	108.9	2.847	64	0	my8407_rel_o2nofp.cz12a_nocb_c32r128
5937	4603	73935	580.2	14091.7	184.9	16.062	129.073	2.373	31.895	161574	17.3	35.100	1203	702.2	798.2	97.2	0.179	400	48	pg181_o2nofp.cx10b_c32r128
Average values from iostat.
r/s	rkB/s	rrqm/s	%rrqm	r_await	rareq-s	w/s	wkB/s	wrqm/s	%wrqm	w_await	wareq-s	d/s	dkB/s	drqm/s	%drqm	d_await	dareq-s	f/s	f_await	aqu-sz	%util
22972.8	367565	0.000	0.000	0.847	16.00	14640.9	422233	2.904	0.020	22.60	28.85	0.026	0.222	0.000	0.000	1.856	0.946	5.571	16.33	333.0	100.00		my8407_rel_o2nofp.cz12a_c32r128
18485.3	295764	0.000	0.000	0.627	16.00	15440.8	429115	2.040	0.013	23.53	27.79	0.012	0.138	0.000	0.000	0.754	0.614	4.099	12.79	368.3	100.00		my8407_rel_o2nofp.cz12a_nocb_c32r128
73934.8	594148	0.000	0.000	0.198	8.037	14091.7	189370	94.11	0.606	0.511	13.90	0.008	36.52	0.000	0.000	0.043	38.95	74.85	2.167	19.43	99.97		pg181_o2nofp.cx10b_c32r128
qr1000.L5
qr1000.L5: range queries with 1000 insert/s per client. Graphs for performance per 1-second interval are here.
Average throughput:
Query response time histogram: each cell has the percentage of responses that take <= the time in the header and max is the max response time in seconds. For max values in the top 25% of the range have a red background and in the bottom 25% of the range have a green background. The red background is not used when the min value is within 80% of the max value.
| dbms | 256us | 1ms | 4ms | 16ms | 64ms | 256ms | 1s | 4s | 16s | gt | max |
|---|---|---|---|---|---|---|---|---|---|---|---|
| my8407_rel_o2nofp.cz12a_c32r128 | 64.299 | 32.840 | 2.711 | 0.076 | 0.061 | 0.013 | 0.001 | nonzero | 2.982 | ||
| my8407_rel_o2nofp.cz12a_nocb_c32r128 | 64.830 | 32.516 | 2.507 | 0.055 | 0.078 | 0.014 | 0.001 | nonzero | 3.856 | ||
| pg181_o2nofp.cx10b_c32r128 | 99.537 | 0.423 | 0.017 | 0.005 | 0.008 | 0.009 | nonzero | nonzero | 1.043 |
Insert response time histogram: each cell has the percentage of responses that take <= the time in the header and max is the max response time in seconds. For max values in the top 25% of the range have a red background and in the bottom 25% of the range have a green background. The red background is not used when the min value is within 80% of the max value.
| dbms | 256us | 1ms | 4ms | 16ms | 64ms | 256ms | 1s | 4s | 16s | gt | max |
|---|---|---|---|---|---|---|---|---|---|---|---|
| my8407_rel_o2nofp.cz12a_c32r128 | 0.019 | 28.815 | 49.784 | 19.854 | 1.400 | 0.128 | 3.578 | ||||
| my8407_rel_o2nofp.cz12a_nocb_c32r128 | 0.035 | 5.709 | 71.112 | 22.651 | 0.469 | 0.024 | 6.294 | ||||
| pg181_o2nofp.cx10b_c32r128 | 51.979 | 39.432 | 7.876 | 0.712 | 0.001 | 1.092 |
Delete response time histogram: each cell has the percentage of responses that take <= the time in the header and max is the max response time in seconds. For max values in the top 25% of the range have a red background and in the bottom 25% of the range have a green background. The red background is not used when the min value is within 80% of the max value.
| dbms | 256us | 1ms | 4ms | 16ms | 64ms | 256ms | 1s | 4s | 16s | gt | max |
|---|---|---|---|---|---|---|---|---|---|---|---|
| my8407_rel_o2nofp.cz12a_c32r128 | 41.302 | 29.173 | 22.564 | 6.656 | 0.254 | 0.052 | 3.521 | ||||
| my8407_rel_o2nofp.cz12a_nocb_c32r128 | 0.080 | 7.967 | 72.338 | 19.220 | 0.373 | 0.022 | 6.247 | ||||
| pg181_o2nofp.cx10b_c32r128 | 4.419 | 89.999 | 5.436 | 0.144 | 0.002 | 1.090 |
Performance metrics for the DBMS listed above. Some are normalized by throughput, others are not. Legend for results is here.
ips	qps	rps	rmbps	wps	wmbps	rpq	rkbpq	wpi	wkbpi	csps	cpups	cspq	cpupq	dbgb1	dbgb2	rss	maxop	p50	p99	tag
9954	38162	11132	173.9	15577.9	447.6	0.292	4.667	1.565	46.052	313607	43.3	8.218	363	735.2	1027.5	108.8	2.982	3168	624	my8407_rel_o2nofp.cz12a_c32r128
2819	37978	11917	186.2	15255.8	420.0	0.314	5.021	5.412	152.578	303318	36.0	7.987	303	727.0	1009.0	108.9	3.856	3248	1616	my8407_rel_o2nofp.cz12a_nocb_c32r128
10578	88467	13740	110.7	15807.1	265.4	0.155	1.282	1.494	25.697	342275	54.2	3.869	196	703.9	799.9	97.2	1.043	8271	2096	pg181_o2nofp.cx10b_c32r128
Average values from iostat.
r/s	rkB/s	rrqm/s	%rrqm	r_await	rareq-s	w/s	wkB/s	wrqm/s	%wrqm	w_await	wareq-s	d/s	dkB/s	drqm/s	%drqm	d_await	dareq-s	f/s	f_await	aqu-sz	%util
11131.7	178106	0.000	0.000	1.263	16.00	15577.9	458393	2.800	0.018	25.08	29.43	0.025	0.258	0.000	0.000	1.401	0.854	7.372	18.27	393.8	99.86		my8407_rel_o2nofp.cz12a_c32r128
11916.8	190670	0.000	0.000	0.751	16.00	15255.8	430072	2.089	0.013	28.49	28.19	0.014	0.171	0.000	0.000	1.320	0.766	4.842	20.08	424.9	100.00		my8407_rel_o2nofp.cz12a_nocb_c32r128
13739.7	113408	0.000	0.000	0.233	8.226	15807.1	271816	115.0	0.935	4.909	19.34	0.017	137.0	0.000	0.000	0.050	75.49	108.8	3.154	47.09	76.05		pg181_o2nofp.cx10b_c32r128
qp1000.L6
qp1000.L6: point queries with 1000 insert/s per client. Graphs for performance per 1-second interval are here.
Average throughput:
Query response time histogram: each cell has the percentage of responses that take <= the time in the header and max is the max response time in seconds. For max values in the top 25% of the range have a red background and in the bottom 25% of the range have a green background. The red background is not used when the min value is within 80% of the max value.
| dbms | 256us | 1ms | 4ms | 16ms | 64ms | 256ms | 1s | 4s | 16s | gt | max |
|---|---|---|---|---|---|---|---|---|---|---|---|
| my8407_rel_o2nofp.cz12a_c32r128 | nonzero | 0.150 | 47.015 | 46.726 | 5.346 | 0.734 | 0.021 | 0.008 | 3.375 | ||
| my8407_rel_o2nofp.cz12a_nocb_c32r128 | 0.096 | 41.223 | 47.545 | 8.983 | 2.103 | 0.043 | 0.008 | 3.779 | |||
| pg181_o2nofp.cx10b_c32r128 | 0.015 | 54.949 | 43.263 | 1.751 | 0.022 | 0.001 | nonzero | 2.857 |
Insert response time histogram: each cell has the percentage of responses that take <= the time in the header and max is the max response time in seconds. For max values in the top 25% of the range have a red background and in the bottom 25% of the range have a green background. The red background is not used when the min value is within 80% of the max value.
| dbms | 256us | 1ms | 4ms | 16ms | 64ms | 256ms | 1s | 4s | 16s | gt | max |
|---|---|---|---|---|---|---|---|---|---|---|---|
| my8407_rel_o2nofp.cz12a_c32r128 | 0.857 | 91.786 | 7.109 | 0.247 | 0.002 | 5.484 | |||||
| my8407_rel_o2nofp.cz12a_nocb_c32r128 | 27.414 | 71.912 | 0.671 | 0.003 | 5.573 | ||||||
| pg181_o2nofp.cx10b_c32r128 | 15.353 | 79.456 | 5.151 | 0.035 | 0.005 | 2.919 |
Delete response time histogram: each cell has the percentage of responses that take <= the time in the header and max is the max response time in seconds. For max values in the top 25% of the range have a red background and in the bottom 25% of the range have a green background. The red background is not used when the min value is within 80% of the max value.
| dbms | 256us | 1ms | 4ms | 16ms | 64ms | 256ms | 1s | 4s | 16s | gt | max |
|---|---|---|---|---|---|---|---|---|---|---|---|
| my8407_rel_o2nofp.cz12a_c32r128 | 6.370 | 92.701 | 0.862 | 0.067 | 3.249 | ||||||
| my8407_rel_o2nofp.cz12a_nocb_c32r128 | 40.402 | 59.120 | 0.477 | 0.001 | 5.370 | ||||||
| pg181_o2nofp.cx10b_c32r128 | 0.046 | 99.786 | 0.161 | 0.004 | 0.002 | 2.857 |
Performance metrics for the DBMS listed above. Some are normalized by throughput, others are not. Legend for results is here.
ips	qps	rps	rmbps	wps	wmbps	rpq	rkbpq	wpi	wkbpi	csps	cpups	cspq	cpupq	dbgb1	dbgb2	rss	maxop	p50	p99	tag
3659	1799	26400	412.5	14775.5	414.2	14.675	234.797	4.038	115.911	138725	12.3	77.112	2188	735.2	1030.6	108.8	3.375	160	0	my8407_rel_o2nofp.cz12a_c32r128
1833	1258	23044	360.1	15031.3	410.6	18.313	293.014	8.199	229.356	117168	7.3	93.116	1856	727.0	1012.1	108.9	3.779	112	16	my8407_rel_o2nofp.cz12a_nocb_c32r128
11380	2600	58440	458.7	22284.8	323.5	22.479	180.669	1.958	29.106	127214	28.6	48.934	3520	706.5	802.5	97.2	2.857	208	32	pg181_o2nofp.cx10b_c32r128
Average values from iostat.
r/s	rkB/s	rrqm/s	%rrqm	r_await	rareq-s	w/s	wkB/s	wrqm/s	%wrqm	w_await	wareq-s	d/s	dkB/s	drqm/s	%drqm	d_await	dareq-s	f/s	f_await	aqu-sz	%util
26400.0	422399	0.000	0.000	0.724	16.00	14775.5	424129	3.392	0.023	20.92	28.71	0.013	0.119	0.000	0.000	0.848	0.492	5.504	14.39	319.9	100.00		my8407_rel_o2nofp.cz12a_c32r128
23043.7	368699	0.000	0.000	0.601	16.00	15031.3	420479	2.478	0.016	21.97	27.97	0.008	0.091	0.000	0.000	0.642	0.409	4.023	11.29	338.6	100.00		my8407_rel_o2nofp.cz12a_nocb_c32r128
58439.5	469685	0.000	0.000	0.369	8.040	22284.8	331239	227.0	1.064	1.203	15.11	0.029	285.8	0.000	0.000	0.204	162.3	146.4	2.476	39.24	99.99		pg181_o2nofp.cx10b_c32r128
l.i0
l.i0: load without secondary indexes
Performance metrics for all DBMS, not just the ones listed above. Some are normalized by throughput, others are not. Legend for results is here.
ips	qps	rps	rmbps	wps	wmbps	rpq	rkbpq	wpi	wkbpi	csps	cpups	cspq	cpupq	dbgb1	dbgb2	rss	maxop	p50	p99	tag
808444	0	1	0.0	5376.7	300.5	0.000	0.000	0.007	0.381	144068	46.8	0.178	19	235.9	503.7	108.7	3.564	74791	5499	my8407_rel_o2nofp.cz12a_c32r128
817996	0	1	0.0	5445.1	304.2	0.000	0.000	0.007	0.381	146214	47.6	0.179	19	235.9	503.7	108.7	1.977	75391	13298	my8407_rel_o2nofp.cz12a_nocb_c32r128
1232877	0	636	5.0	4557.1	493.8	0.001	0.004	0.004	0.410	124047	54.3	0.101	14	344.4	440.5	97.2	1.767	113286	7799	pg181_o2nofp.cx10b_c32r128
l.x
l.x: create secondary indexes
Performance metrics for all DBMS, not just the ones listed above. Some are normalized by throughput, others are not. Legend for results is here.
ips	qps	rps	rmbps	wps	wmbps	rpq	rkbpq	wpi	wkbpi	csps	cpups	cspq	cpupq	dbgb1	dbgb2	rss	maxop	p50	p99	tag
491803	0	6606	643.9	15345.5	720.8	0.013	1.341	0.031	1.501	73922	26.7	0.150	17	543.1	810.9	109.0	0.002	NA	NA	my8407_rel_o2nofp.cz12a_c32r128
507185	0	6811	663.8	15822.2	743.2	0.013	1.340	0.031	1.501	60523	25.6	0.119	16	543.1	810.9	109.0	0.005	NA	NA	my8407_rel_o2nofp.cz12a_nocb_c32r128
1351351	0	3817	475.1	3705.7	433.1	0.003	0.360	0.003	0.328	19725	16.3	0.015	4	691.5	787.6	53.5	0.003	NA	NA	pg181_o2nofp.cx10b_c32r128
l.i1
l.i1: continue load after secondary indexes created with 50 inserts per transaction
Performance metrics for all DBMS, not just the ones listed above. Some are normalized by throughput, others are not. Legend for results is here.
ips	qps	rps	rmbps	wps	wmbps	rpq	rkbpq	wpi	wkbpi	csps	cpups	cspq	cpupq	dbgb1	dbgb2	rss	maxop	p50	p99	tag
5859	0	10470	163.6	15649.3	470.1	1.787	28.591	2.671	82.159	104559	9.9	17.845	541	735.2	1020.9	108.9	11.448	400	0	my8407_rel_o2nofp.cz12a_c32r128
2790	0	11995	187.4	15804.4	449.0	4.299	68.784	5.664	164.770	96164	5.8	34.465	665	727.0	1002.0	108.9	11.138	250	0	my8407_rel_o2nofp.cz12a_nocb_c32r128
20601	0	24994	200.1	30940.8	527.7	1.213	9.948	1.502	26.230	58462	30.1	2.838	468	699.4	795.4	97.2	3.066	1800	400	pg181_o2nofp.cx10b_c32r128
l.i2
l.i2: continue load after secondary indexes created with 5 inserts per transaction
Performance metrics for all DBMS, not just the ones listed above. Some are normalized by throughput, others are not. Legend for results is here.
ips	qps	rps	rmbps	wps	wmbps	rpq	rkbpq	wpi	wkbpi	csps	cpups	cspq	cpupq	dbgb1	dbgb2	rss	maxop	p50	p99	tag
1269	0	11607	181.4	15464.4	437.7	9.147	146.357	12.187	353.188	100467	8.2	79.176	2068	735.2	1021.3	108.9	5.639	75	0	my8407_rel_o2nofp.cz12a_c32r128
939	0	12184	190.4	15539.6	435.5	12.974	207.580	16.547	474.897	95793	6.6	102.005	2249	727.0	1002.5	108.9	5.865	60	10	my8407_rel_o2nofp.cz12a_nocb_c32r128
1598	0	1864	15.3	3066.8	47.6	1.167	9.790	1.919	30.497	11081	27.1	6.934	5427	701.4	797.4	97.2	0.920	215	190	pg181_o2nofp.cx10b_c32r128
qr100.L1
qr100.L1: range queries with 100 insert/s per client
Performance metrics for all DBMS, not just the ones listed above. Some are normalized by throughput, others are not. Legend for results is here.
ips	qps	rps	rmbps	wps	wmbps	rpq	rkbpq	wpi	wkbpi	csps	cpups	cspq	cpupq	dbgb1	dbgb2	rss	maxop	p50	p99	tag
1193	83544	5133	80.2	5277.8	151.3	0.061	0.983	4.425	129.858	503318	40.7	6.025	156	735.2	1021.6	108.8	0.718	7039	6239	my8407_rel_o2nofp.cz12a_c32r128
1193	83854	5235	81.8	5052.4	145.3	0.062	0.999	4.236	124.725	502887	40.8	5.997	156	727.0	1002.7	108.8	0.095	7039	6863	my8407_rel_o2nofp.cz12a_nocb_c32r128
1192	139408	1475	11.9	534.5	20.2	0.011	0.088	0.448	17.327	535668	37.9	3.842	87	701.5	797.5	97.2	0.128	11598	11310	pg181_o2nofp.cx10b_c32r128
qp100.L2
qp100.L2: point queries with 100 insert/s per client
Performance metrics for all DBMS, not just the ones listed above. Some are normalized by throughput, others are not. Legend for results is here.
ips	qps	rps	rmbps	wps	wmbps	rpq	rkbpq	wpi	wkbpi	csps	cpups	cspq	cpupq	dbgb1	dbgb2	rss	maxop	p50	p99	tag
1192	6414	49743	777.2	11807.2	329.9	7.755	124.076	9.905	283.438	174014	11.4	27.128	569	735.2	1021.8	108.8	4.166	528	0	my8407_rel_o2nofp.cz12a_c32r128
1193	6382	49824	778.5	11884.5	332.3	7.808	124.920	9.964	285.260	171975	11.2	26.949	562	727.0	1002.9	108.8	3.546	528	0	my8407_rel_o2nofp.cz12a_nocb_c32r128
1192	7024	92321	725.0	4286.1	49.1	13.144	105.696	3.596	42.159	204214	11.6	29.075	529	701.5	797.6	97.2	0.025	608	400	pg181_o2nofp.cx10b_c32r128
qr500.L3
qr500.L3: range queries with 500 insert/s per client
Performance metrics for all DBMS, not just the ones listed above. Some are normalized by throughput, others are not. Legend for results is here.
ips	qps	rps	rmbps	wps	wmbps	rpq	rkbpq	wpi	wkbpi	csps	cpups	cspq	cpupq	dbgb1	dbgb2	rss	maxop	p50	p99	tag
5622	65214	13615	212.7	15797.6	452.1	0.209	3.340	2.810	82.351	457125	44.9	7.010	220	735.2	1022.8	108.8	4.202	5823	0	my8407_rel_o2nofp.cz12a_c32r128
3662	58623	13689	213.9	16247.1	450.0	0.234	3.736	4.436	125.824	422199	40.4	7.202	221	727.0	1004.1	108.8	5.001	5151	96	my8407_rel_o2nofp.cz12a_nocb_c32r128
5944	124342	8561	69.1	7418.4	136.2	0.069	0.569	1.248	23.464	492199	40.9	3.958	105	701.8	797.9	97.2	0.281	10815	5999	pg181_o2nofp.cx10b_c32r128
qp500.L4
qp500.L4: point queries with 500 insert/s per client
Performance metrics for all DBMS, not just the ones listed above. Some are normalized by throughput, others are not. Legend for results is here.
ips	qps	rps	rmbps	wps	wmbps	rpq	rkbpq	wpi	wkbpi	csps	cpups	cspq	cpupq	dbgb1	dbgb2	rss	maxop	p50	p99	tag
5800	1467	22973	358.9	14640.9	412.3	15.661	250.572	2.524	72.796	121270	10.9	82.671	2378	735.2	1024.2	108.8	3.088	128	0	my8407_rel_o2nofp.cz12a_c32r128
3361	674	18485	288.8	15440.8	419.1	27.422	438.754	4.594	127.663	106762	6.3	158.377	2991	727.0	1005.7	108.9	2.847	64	0	my8407_rel_o2nofp.cz12a_nocb_c32r128
5937	4603	73935	580.2	14091.7	184.9	16.062	129.073	2.373	31.895	161574	17.3	35.100	1203	702.2	798.2	97.2	0.179	400	48	pg181_o2nofp.cx10b_c32r128
qr1000.L5
qr1000.L5: range queries with 1000 insert/s per client
Performance metrics for all DBMS, not just the ones listed above. Some are normalized by throughput, others are not. Legend for results is here.
ips	qps	rps	rmbps	wps	wmbps	rpq	rkbpq	wpi	wkbpi	csps	cpups	cspq	cpupq	dbgb1	dbgb2	rss	maxop	p50	p99	tag
9954	38162	11132	173.9	15577.9	447.6	0.292	4.667	1.565	46.052	313607	43.3	8.218	363	735.2	1027.5	108.8	2.982	3168	624	my8407_rel_o2nofp.cz12a_c32r128
2819	37978	11917	186.2	15255.8	420.0	0.314	5.021	5.412	152.578	303318	36.0	7.987	303	727.0	1009.0	108.9	3.856	3248	1616	my8407_rel_o2nofp.cz12a_nocb_c32r128
10578	88467	13740	110.7	15807.1	265.4	0.155	1.282	1.494	25.697	342275	54.2	3.869	196	703.9	799.9	97.2	1.043	8271	2096	pg181_o2nofp.cx10b_c32r128
qp1000.L6
qp1000.L6: point queries with 1000 insert/s per client
Performance metrics for all DBMS, not just the ones listed above. Some are normalized by throughput, others are not. Legend for results is here.
ips	qps	rps	rmbps	wps	wmbps	rpq	rkbpq	wpi	wkbpi	csps	cpups	cspq	cpupq	dbgb1	dbgb2	rss	maxop	p50	p99	tag
3659	1799	26400	412.5	14775.5	414.2	14.675	234.797	4.038	115.911	138725	12.3	77.112	2188	735.2	1030.6	108.8	3.375	160	0	my8407_rel_o2nofp.cz12a_c32r128
1833	1258	23044	360.1	15031.3	410.6	18.313	293.014	8.199	229.356	117168	7.3	93.116	1856	727.0	1012.1	108.9	3.779	112	16	my8407_rel_o2nofp.cz12a_nocb_c32r128
11380	2600	58440	458.7	22284.8	323.5	22.479	180.669	1.958	29.106	127214	28.6	48.934	3520	706.5	802.5	97.2	2.857	208	32	pg181_o2nofp.cx10b_c32r128
l.i0
- l.i0: load without secondary indexes
- Legend for results is here.
- Each entry lists the percentage of responses that fit in that bucket (slower than max time for previous bucket, faster than min time for next bucket).
Insert response time histogram
256us	1ms	4ms	16ms	64ms	256ms	1s	4s	16s	gt	max	tag
0.000	0.013	99.789	0.070	0.061	0.047	0.017	0.003	0.000	0.000	3.564	my8407_rel_o2nofp.cz12a_c32r128
0.000	0.010	99.791	0.075	0.059	0.048	0.015	0.002	0.000	0.000	1.977	my8407_rel_o2nofp.cz12a_nocb_c32r128
0.000	98.378	1.445	0.095	0.055	0.021	0.006	0.001	0.000	0.000	1.767	pg181_o2nofp.cx10b_c32r128
l.x
- l.x: create secondary indexes
- Legend for results is here.
- Each entry lists the percentage of responses that fit in that bucket (slower than max time for previous bucket, faster than min time for next bucket).
TODO - determine whether there is data for create index response time
l.i1
- l.i1: continue load after secondary indexes created with 50 inserts per transaction
- Legend for results is here.
- Each entry lists the percentage of responses that fit in that bucket (slower than max time for previous bucket, faster than min time for next bucket).
Insert response time histogram
256us	1ms	4ms	16ms	64ms	256ms	1s	4s	16s	gt	max	tag
0.000	0.000	0.443	19.491	34.311	39.620	5.685	0.293	0.157	0.000	11.448	my8407_rel_o2nofp.cz12a_c32r128
0.000	0.000	0.000	0.010	6.569	72.228	20.397	0.527	0.268	0.000	11.138	my8407_rel_o2nofp.cz12a_nocb_c32r128
0.000	0.000	0.000	25.833	70.584	3.541	0.025	0.017	0.000	0.000	3.066	pg181_o2nofp.cx10b_c32r128
Delete response time histogram
256us	1ms	4ms	16ms	64ms	256ms	1s	4s	16s	gt	max	tag
0.000	0.000	39.140	24.349	20.267	15.574	0.545	0.106	0.018	0.000	9.182	my8407_rel_o2nofp.cz12a_c32r128
0.000	0.000	0.000	0.263	21.516	65.362	12.300	0.420	0.140	0.000	10.910	my8407_rel_o2nofp.cz12a_nocb_c32r128
0.000	2.059	10.632	27.269	59.731	0.281	0.012	0.015	0.000	0.000	2.389	pg181_o2nofp.cx10b_c32r128
l.i2
- l.i2: continue load after secondary indexes created with 5 inserts per transaction
- Legend for results is here.
- Each entry lists the percentage of responses that fit in that bucket (slower than max time for previous bucket, faster than min time for next bucket).
Insert response time histogram
256us	1ms	4ms	16ms	64ms	256ms	1s	4s	16s	gt	max	tag
0.000	0.000	0.000	28.094	44.811	26.648	0.394	0.052	0.002	0.000	5.639	my8407_rel_o2nofp.cz12a_c32r128
0.000	0.000	0.000	17.278	38.939	42.855	0.872	0.054	0.002	0.000	5.865	my8407_rel_o2nofp.cz12a_nocb_c32r128
0.000	18.166	79.256	1.707	0.862	0.008	nonzero	0.000	0.000	0.000	0.920	pg181_o2nofp.cx10b_c32r128
Delete response time histogram
256us	1ms	4ms	16ms	64ms	256ms	1s	4s	16s	gt	max	tag
0.000	0.000	0.000	39.388	41.148	19.344	0.102	0.018	nonzero	0.000	4.627	my8407_rel_o2nofp.cz12a_c32r128
0.000	0.000	0.000	22.478	36.588	40.450	0.448	0.035	0.001	0.000	4.867	my8407_rel_o2nofp.cz12a_nocb_c32r128
0.000	0.000	0.000	0.040	99.954	0.004	0.002	0.000	0.000	0.000	0.953	pg181_o2nofp.cx10b_c32r128
qr100.L1
- qr100.L1: range queries with 100 insert/s per client
- Legend for results is here.
- Each entry lists the percentage of responses that fit in that bucket (slower than max time for previous bucket, faster than min time for next bucket).
Query response time histogram
256us	1ms	4ms	16ms	64ms	256ms	1s	4s	16s	gt	max	tag
99.902	0.094	0.003	nonzero	nonzero	nonzero	nonzero	0.000	0.000	0.000	0.718	my8407_rel_o2nofp.cz12a_c32r128
99.868	0.130	0.002	nonzero	nonzero	nonzero	0.000	0.000	0.000	0.000	0.095	my8407_rel_o2nofp.cz12a_nocb_c32r128
99.976	0.020	0.003	nonzero	nonzero	nonzero	0.000	0.000	0.000	0.000	0.128	pg181_o2nofp.cx10b_c32r128
Insert response time histogram
256us	1ms	4ms	16ms	64ms	256ms	1s	4s	16s	gt	max	tag
0.000	0.000	0.000	66.887	29.690	1.979	1.315	0.130	0.000	0.000	1.977	my8407_rel_o2nofp.cz12a_c32r128
0.000	0.000	0.000	13.475	85.907	0.602	0.016	0.000	0.000	0.000	0.281	my8407_rel_o2nofp.cz12a_nocb_c32r128
0.000	0.000	0.000	98.951	0.931	0.118	0.000	0.000	0.000	0.000	0.197	pg181_o2nofp.cx10b_c32r128
Delete response time histogram
256us	1ms	4ms	16ms	64ms	256ms	1s	4s	16s	gt	max	tag
0.000	0.000	98.713	0.264	0.236	0.650	0.137	0.000	0.000	0.000	0.784	my8407_rel_o2nofp.cz12a_c32r128
0.000	0.000	0.000	73.273	26.530	0.194	0.002	0.000	0.000	0.000	0.290	my8407_rel_o2nofp.cz12a_nocb_c32r128
0.000	43.669	56.292	0.023	0.016	0.000	0.000	0.000	0.000	0.000	0.023	pg181_o2nofp.cx10b_c32r128
qp100.L2
- qp100.L2: point queries with 100 insert/s per client
- Legend for results is here.
- Each entry lists the percentage of responses that fit in that bucket (slower than max time for previous bucket, faster than min time for next bucket).
Query response time histogram
256us	1ms	4ms	16ms	64ms	256ms	1s	4s	16s	gt	max	tag
0.003	26.185	66.002	7.537	0.238	0.030	0.002	0.002	nonzero	0.000	4.166	my8407_rel_o2nofp.cz12a_c32r128
0.003	26.506	65.456	7.745	0.251	0.034	0.003	0.002	0.000	0.000	3.546	my8407_rel_o2nofp.cz12a_nocb_c32r128
nonzero	1.238	98.607	0.155	nonzero	0.000	0.000	0.000	0.000	0.000	0.025	pg181_o2nofp.cx10b_c32r128
Insert response time histogram
256us	1ms	4ms	16ms	64ms	256ms	1s	4s	16s	gt	max	tag
0.000	0.000	0.000	10.389	79.572	8.970	0.718	0.269	0.083	0.000	4.842	my8407_rel_o2nofp.cz12a_c32r128
0.000	0.000	0.000	0.019	61.715	36.190	1.773	0.275	0.028	0.000	4.124	my8407_rel_o2nofp.cz12a_nocb_c32r128
0.000	0.000	0.000	28.456	71.521	0.023	0.000	0.000	0.000	0.000	0.068	pg181_o2nofp.cx10b_c32r128
Delete response time histogram
256us	1ms	4ms	16ms	64ms	256ms	1s	4s	16s	gt	max	tag
0.000	0.000	96.752	1.512	0.843	0.354	0.275	0.264	0.000	0.000	3.762	my8407_rel_o2nofp.cz12a_c32r128
0.000	0.000	0.000	0.694	77.171	20.720	1.113	0.275	0.025	0.000	4.054	my8407_rel_o2nofp.cz12a_nocb_c32r128
0.000	0.000	99.100	0.898	0.002	0.000	0.000	0.000	0.000	0.000	0.019	pg181_o2nofp.cx10b_c32r128
qr500.L3
- qr500.L3: range queries with 500 insert/s per client
- Legend for results is here.
- Each entry lists the percentage of responses that fit in that bucket (slower than max time for previous bucket, faster than min time for next bucket).
Query response time histogram
256us	1ms	4ms	16ms	64ms	256ms	1s	4s	16s	gt	max	tag
97.732	1.718	0.530	0.010	0.008	0.001	nonzero	nonzero	nonzero	0.000	4.202	my8407_rel_o2nofp.cz12a_c32r128
96.105	2.697	1.156	0.015	0.023	0.004	nonzero	nonzero	nonzero	0.000	5.001	my8407_rel_o2nofp.cz12a_nocb_c32r128
99.941	0.048	0.005	0.001	0.002	0.002	nonzero	0.000	0.000	0.000	0.281	pg181_o2nofp.cx10b_c32r128
Insert response time histogram
256us	1ms	4ms	16ms	64ms	256ms	1s	4s	16s	gt	max	tag
0.000	0.000	0.000	10.660	70.393	17.127	1.425	0.354	0.041	0.000	8.602	my8407_rel_o2nofp.cz12a_c32r128
0.000	0.000	0.000	0.106	16.532	70.445	12.273	0.616	0.028	0.000	5.464	my8407_rel_o2nofp.cz12a_nocb_c32r128
0.000	0.000	0.000	68.529	19.959	11.087	0.425	0.000	0.000	0.000	0.393	pg181_o2nofp.cx10b_c32r128
Delete response time histogram
256us	1ms	4ms	16ms	64ms	256ms	1s	4s	16s	gt	max	tag
0.000	0.000	76.256	16.762	4.880	1.706	0.147	0.237	0.013	0.000	8.657	my8407_rel_o2nofp.cz12a_c32r128
0.000	0.000	0.000	0.581	27.781	62.412	8.734	0.475	0.018	0.000	5.326	my8407_rel_o2nofp.cz12a_nocb_c32r128
0.000	0.000	31.900	66.184	0.805	1.106	0.005	0.000	0.000	0.000	0.304	pg181_o2nofp.cx10b_c32r128
qp500.L4
- qp500.L4: point queries with 500 insert/s per client
- Legend for results is here.
- Each entry lists the percentage of responses that fit in that bucket (slower than max time for previous bucket, faster than min time for next bucket).
Query response time histogram
256us	1ms	4ms	16ms	64ms	256ms	1s	4s	16s	gt	max	tag
0.000	0.079	40.574	51.387	6.655	1.253	0.037	0.016	0.000	0.000	3.088	my8407_rel_o2nofp.cz12a_c32r128
0.000	0.008	22.257	53.546	17.796	6.271	0.098	0.024	0.000	0.000	2.847	my8407_rel_o2nofp.cz12a_nocb_c32r128
0.000	0.329	84.772	14.534	0.363	0.001	0.000	0.000	0.000	0.000	0.179	pg181_o2nofp.cx10b_c32r128
Insert response time histogram
256us	1ms	4ms	16ms	64ms	256ms	1s	4s	16s	gt	max	tag
0.000	0.000	0.000	9.813	64.375	24.056	1.512	0.244	0.000	0.000	3.537	my8407_rel_o2nofp.cz12a_c32r128
0.000	0.000	0.000	0.014	7.334	76.857	15.465	0.331	0.000	0.000	3.193	my8407_rel_o2nofp.cz12a_nocb_c32r128
0.000	0.000	0.000	5.956	90.708	3.336	0.000	0.000	0.000	0.000	0.238	pg181_o2nofp.cx10b_c32r128
Delete response time histogram
256us	1ms	4ms	16ms	64ms	256ms	1s	4s	16s	gt	max	tag
0.000	0.000	49.051	40.456	7.629	2.490	0.250	0.123	0.000	0.000	2.994	my8407_rel_o2nofp.cz12a_c32r128
0.000	0.000	0.000	0.060	12.366	78.938	8.393	0.244	0.000	0.000	3.115	my8407_rel_o2nofp.cz12a_nocb_c32r128
0.000	0.000	0.000	45.935	54.029	0.036	0.000	0.000	0.000	0.000	0.086	pg181_o2nofp.cx10b_c32r128
qr1000.L5
- qr1000.L5: range queries with 1000 insert/s per client
- Legend for results is here.
- Each entry lists the percentage of responses that fit in that bucket (slower than max time for previous bucket, faster than min time for next bucket).
Query response time histogram
256us	1ms	4ms	16ms	64ms	256ms	1s	4s	16s	gt	max	tag
64.299	32.840	2.711	0.076	0.061	0.013	0.001	nonzero	0.000	0.000	2.982	my8407_rel_o2nofp.cz12a_c32r128
64.830	32.516	2.507	0.055	0.078	0.014	0.001	nonzero	0.000	0.000	3.856	my8407_rel_o2nofp.cz12a_nocb_c32r128
99.537	0.423	0.017	0.005	0.008	0.009	nonzero	nonzero	0.000	0.000	1.043	pg181_o2nofp.cx10b_c32r128
Insert response time histogram
256us	1ms	4ms	16ms	64ms	256ms	1s	4s	16s	gt	max	tag
0.000	0.000	0.019	28.815	49.784	19.854	1.400	0.128	0.000	0.000	3.578	my8407_rel_o2nofp.cz12a_c32r128
0.000	0.000	0.000	0.035	5.709	71.112	22.651	0.469	0.024	0.000	6.294	my8407_rel_o2nofp.cz12a_nocb_c32r128
0.000	0.000	0.000	51.979	39.432	7.876	0.712	0.001	0.000	0.000	1.092	pg181_o2nofp.cx10b_c32r128
Delete response time histogram
256us	1ms	4ms	16ms	64ms	256ms	1s	4s	16s	gt	max	tag
0.000	0.000	41.302	29.173	22.564	6.656	0.254	0.052	0.000	0.000	3.521	my8407_rel_o2nofp.cz12a_c32r128
0.000	0.000	0.000	0.080	7.967	72.338	19.220	0.373	0.022	0.000	6.247	my8407_rel_o2nofp.cz12a_nocb_c32r128
0.000	0.000	0.000	4.419	89.999	5.436	0.144	0.002	0.000	0.000	1.090	pg181_o2nofp.cx10b_c32r128
qp1000.L6
- qp1000.L6: point queries with 1000 insert/s per client
- Legend for results is here.
- Each entry lists the percentage of responses that fit in that bucket (slower than max time for previous bucket, faster than min time for next bucket).
Query response time histogram
256us	1ms	4ms	16ms	64ms	256ms	1s	4s	16s	gt	max	tag
nonzero	0.150	47.015	46.726	5.346	0.734	0.021	0.008	0.000	0.000	3.375	my8407_rel_o2nofp.cz12a_c32r128
0.000	0.096	41.223	47.545	8.983	2.103	0.043	0.008	0.000	0.000	3.779	my8407_rel_o2nofp.cz12a_nocb_c32r128
0.000	0.015	54.949	43.263	1.751	0.022	0.001	nonzero	0.000	0.000	2.857	pg181_o2nofp.cx10b_c32r128
Insert response time histogram
256us	1ms	4ms	16ms	64ms	256ms	1s	4s	16s	gt	max	tag
0.000	0.000	0.000	0.000	0.857	91.786	7.109	0.247	0.002	0.000	5.484	my8407_rel_o2nofp.cz12a_c32r128
0.000	0.000	0.000	0.000	0.000	27.414	71.912	0.671	0.003	0.000	5.573	my8407_rel_o2nofp.cz12a_nocb_c32r128
0.000	0.000	0.000	15.353	79.456	5.151	0.035	0.005	0.000	0.000	2.919	pg181_o2nofp.cx10b_c32r128
Delete response time histogram
256us	1ms	4ms	16ms	64ms	256ms	1s	4s	16s	gt	max	tag
0.000	0.000	0.000	0.000	6.370	92.701	0.862	0.067	0.000	0.000	3.249	my8407_rel_o2nofp.cz12a_c32r128
0.000	0.000	0.000	0.000	0.000	40.402	59.120	0.477	0.001	0.000	5.370	my8407_rel_o2nofp.cz12a_nocb_c32r128
0.000	0.000	0.000	0.046	99.786	0.161	0.004	0.002	0.000	0.000	2.857	pg181_o2nofp.cx10b_c32r128