Introduction
This is a report for the insert benchmark with 3600M docs and 12 client(s). It is generated by scripts (bash, awk, sed) and Tufte might not be impressed. An overview of the insert benchmark is here and a short update is here. Below, by DBMS, I mean DBMS+version.config. An example is my8020.c10b40 where my means MySQL, 8020 is version 8.0.20 and c10b40 is the name for the configuration file.
The test server has 32 cores, 128G RAM and 1 NVMe devices. The benchmark was run with 8 clients and there were 1 or 3 connections per client (1 for queries or inserts without rate limits, 1+1 for rate limited inserts+deletes). It uses 8 tables with a table per client. It loads 300M rows per table without secondary indexes, creates 3 secondary indexes per table, then inserts 4m+1m rows per table with a delete per insert to avoid growing the table. It then does 6 read+write tests for 1800s each that do queries as fast as possible with 100,100,500,500,1000,1000 inserts/s and the same for deletes/s per client concurrent with the queries. The database is larger than RAM and most tests are IO-bound except for the range query (qr*) tests that frequently have a cached working set. Clients and the DBMS share one server.
The tested DBMS are:
- my5651_rel_o2nofp.cz12a_c32r128 - MySQL 5.6.51 with the cz12a_c32r128 config
- my5744_rel_o2nofp.cz12a_c32r128 - MySQL 5.7.44 with the cz12a_c32r128 config
- my8044_rel_o2nofp.cz12a_c32r128 - MySQL 8.0.44 with the cz12a_c32r128 config
- my8407_rel_o2nofp.cz12a_c32r128 - MySQL 8.4.7 with the cz12a_c32r128 config
- my9400_rel_o2nofp.cz12a_c32r128 - MySQL 9.4.0 with the cz12a_c32r128 config
- my9500_rel_o2nofp.cz12a_c32r128 - MySQL 9.5.0 with the cz12a_c32r128 config
- my9500_rel_o2nofp.cz13a_c32r128 - MySQL 9.5.0 with the cz13a_c32r128 config
Contents
- Summary
- l.i0: load without secondary indexes
- l.x: create secondary indexes
- l.i1: continue load after secondary indexes created with 50 inserts per transaction
- l.i2: continue load after secondary indexes created with 5 inserts per transaction
- qr100.L1: range queries with 100 insert/s per client
- qp100.L2: point queries with 100 insert/s per client
- qr500.L3: range queries with 500 insert/s per client
- qp500.L4: point queries with 500 insert/s per client
- qr1000.L5: range queries with 1000 insert/s per client
- qp1000.L6: point queries with 1000 insert/s per client
Summary
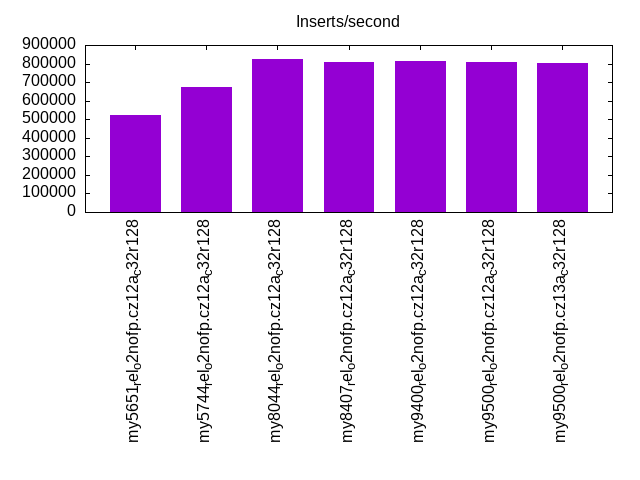
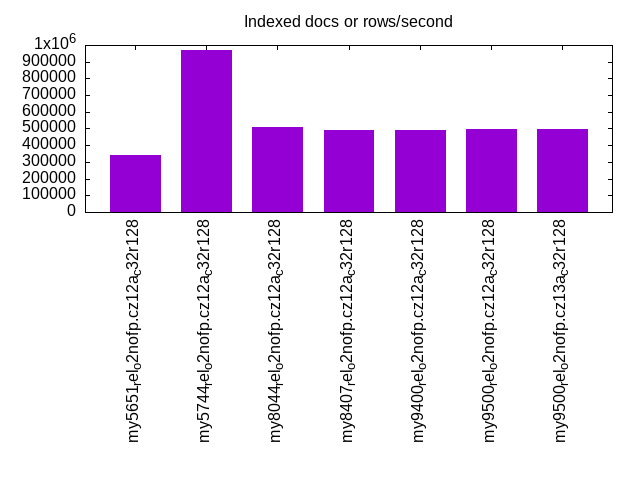
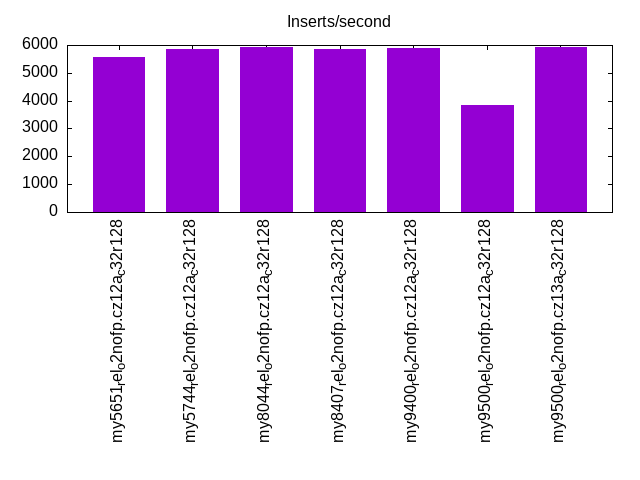
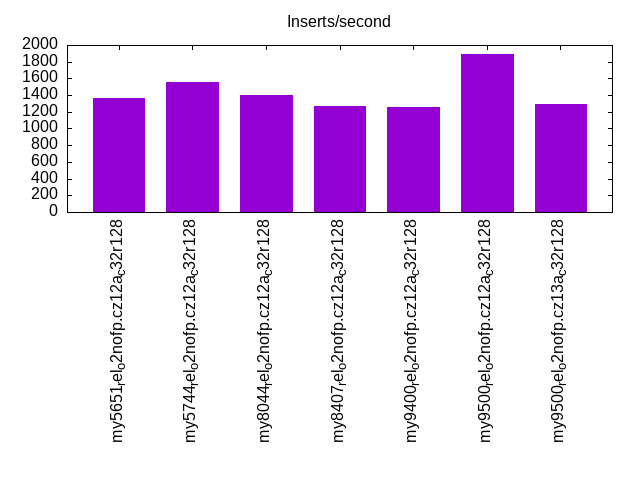
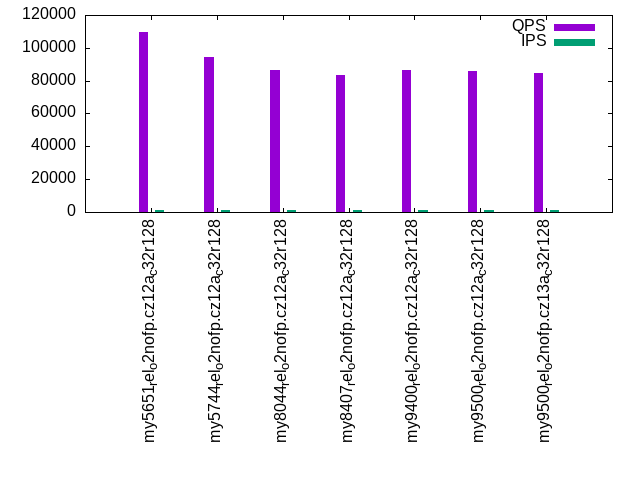
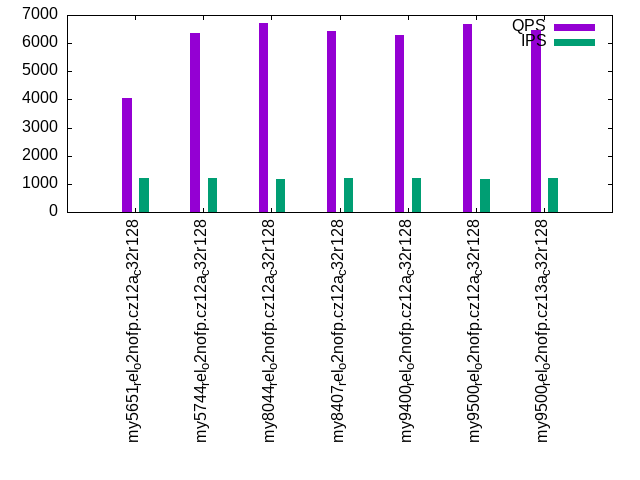
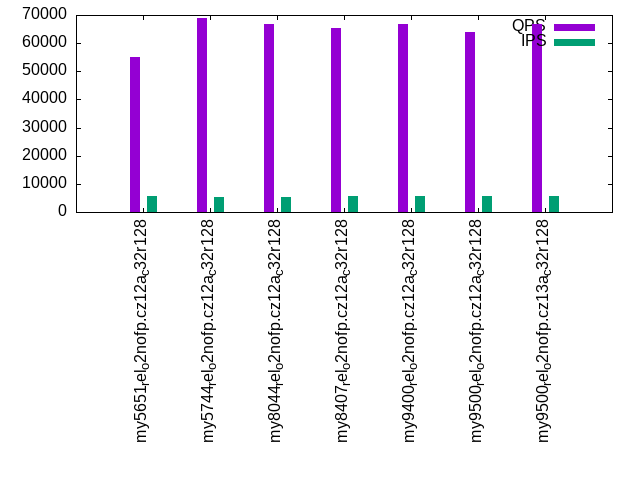
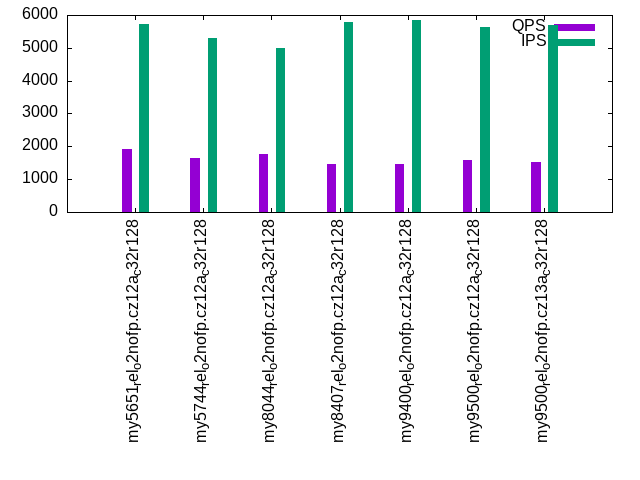
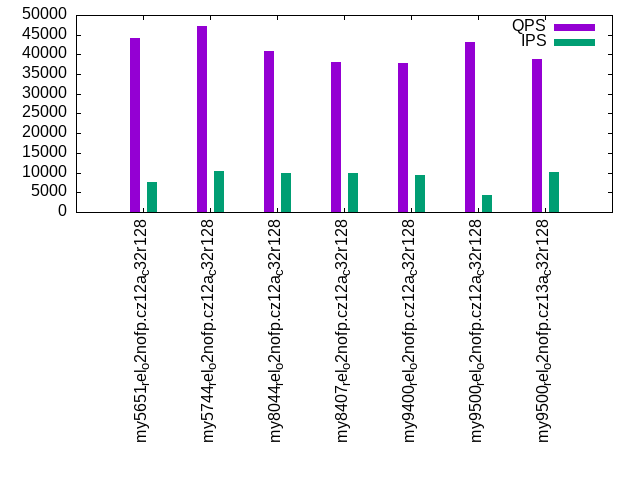
The numbers are inserts/s for l.i0, l.i1 and l.i2, indexed docs (or rows) /s for l.x and queries/s for qr100, qp100 thru qr1000, qp1000" The values are the average rate over the entire test for inserts (IPS) and queries (QPS). The range of values for IPS and QPS is split into 3 parts: bottom 25%, middle 50%, top 25%. Values in the bottom 25% have a red background, values in the top 25% have a green background and values in the middle have no color. A gray background is used for values that can be ignored because the DBMS did not sustain the target insert rate. Red backgrounds are not used when the minimum value is within 80% of the max value.
| dbms | l.i0 | l.x | l.i1 | l.i2 | qr100 | qp100 | qr500 | qp500 | qr1000 | qp1000 |
|---|---|---|---|---|---|---|---|---|---|---|
| my5651_rel_o2nofp.cz12a_c32r128 | 525241 | 340748 | 5561 | 1364 | 109827 | 4053 | 54982 | 1908 | 44094 | 2793 |
| my5744_rel_o2nofp.cz12a_c32r128 | 671016 | 972973 | 5869 | 1557 | 94284 | 6360 | 68776 | 1652 | 47149 | 2362 |
| my8044_rel_o2nofp.cz12a_c32r128 | 824553 | 508978 | 5932 | 1404 | 86332 | 6722 | 66654 | 1753 | 40932 | 1841 |
| my8407_rel_o2nofp.cz12a_c32r128 | 808444 | 491803 | 5859 | 1269 | 83544 | 6414 | 65214 | 1467 | 38162 | 1799 |
| my9400_rel_o2nofp.cz12a_c32r128 | 811725 | 493016 | 5905 | 1254 | 86486 | 6304 | 66648 | 1472 | 37761 | 1764 |
| my9500_rel_o2nofp.cz12a_c32r128 | 806090 | 495186 | 3838 | 1888 | 85684 | 6684 | 63865 | 1570 | 43199 | 1732 |
| my9500_rel_o2nofp.cz13a_c32r128 | 804829 | 496483 | 5930 | 1289 | 84966 | 6459 | 66957 | 1514 | 38857 | 1787 |
This table has relative throughput, throughput for the DBMS relative to the DBMS in the first line, using the absolute throughput from the previous table. Values less than 0.95 have a yellow background. Values greater than 1.05 have a blue background.
| dbms | l.i0 | l.x | l.i1 | l.i2 | qr100 | qp100 | qr500 | qp500 | qr1000 | qp1000 |
|---|---|---|---|---|---|---|---|---|---|---|
| my5651_rel_o2nofp.cz12a_c32r128 | 1.00 | 1.00 | 1.00 | 1.00 | 1.00 | 1.00 | 1.00 | 1.00 | 1.00 | 1.00 |
| my5744_rel_o2nofp.cz12a_c32r128 | 1.28 | 2.86 | 1.06 | 1.14 | 0.86 | 1.57 | 1.25 | 0.87 | 1.07 | 0.85 |
| my8044_rel_o2nofp.cz12a_c32r128 | 1.57 | 1.49 | 1.07 | 1.03 | 0.79 | 1.66 | 1.21 | 0.92 | 0.93 | 0.66 |
| my8407_rel_o2nofp.cz12a_c32r128 | 1.54 | 1.44 | 1.05 | 0.93 | 0.76 | 1.58 | 1.19 | 0.77 | 0.87 | 0.64 |
| my9400_rel_o2nofp.cz12a_c32r128 | 1.55 | 1.45 | 1.06 | 0.92 | 0.79 | 1.56 | 1.21 | 0.77 | 0.86 | 0.63 |
| my9500_rel_o2nofp.cz12a_c32r128 | 1.53 | 1.45 | 0.69 | 1.38 | 0.78 | 1.65 | 1.16 | 0.82 | 0.98 | 0.62 |
| my9500_rel_o2nofp.cz13a_c32r128 | 1.53 | 1.46 | 1.07 | 0.95 | 0.77 | 1.59 | 1.22 | 0.79 | 0.88 | 0.64 |
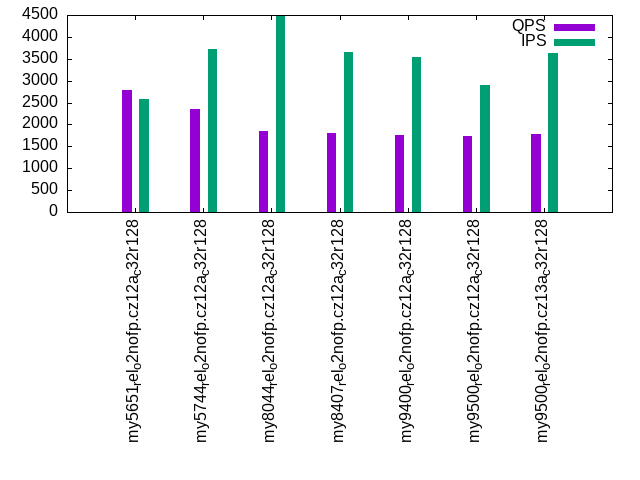
This lists the average rate of inserts/s for the tests that do inserts concurrent with queries. For such tests the query rate is listed in the table above. The read+write tests are setup so that the insert rate should match the target rate every second. Cells that are not at least 95% of the target have a red background to indicate a failure to satisfy the target.
| dbms | qr100.L1 | qp100.L2 | qr500.L3 | qp500.L4 | qr1000.L5 | qp1000.L6 |
|---|---|---|---|---|---|---|
| my5651_rel_o2nofp.cz12a_c32r128 | 1193 | 1191 | 5599 | 5729 | 7619 | 2589 |
| my5744_rel_o2nofp.cz12a_c32r128 | 1193 | 1191 | 5328 | 5304 | 10445 | 3731 |
| my8044_rel_o2nofp.cz12a_c32r128 | 1193 | 1181 | 5158 | 5005 | 10023 | 4479 |
| my8407_rel_o2nofp.cz12a_c32r128 | 1193 | 1192 | 5622 | 5800 | 9954 | 3659 |
| my9400_rel_o2nofp.cz12a_c32r128 | 1193 | 1192 | 5806 | 5835 | 9515 | 3532 |
| my9500_rel_o2nofp.cz12a_c32r128 | 1193 | 1189 | 5657 | 5640 | 4375 | 2906 |
| my9500_rel_o2nofp.cz13a_c32r128 | 1193 | 1193 | 5654 | 5681 | 10189 | 3642 |
| target | 1200 | 1200 | 6000 | 6000 | 12000 | 12000 |
l.i0
l.i0: load without secondary indexes. Graphs for performance per 1-second interval are here.
Average throughput:
Insert response time histogram: each cell has the percentage of responses that take <= the time in the header and max is the max response time in seconds. For the max column values in the top 25% of the range have a red background and in the bottom 25% of the range have a green background. The red background is not used when the min value is within 80% of the max value.
| dbms | 256us | 1ms | 4ms | 16ms | 64ms | 256ms | 1s | 4s | 16s | gt | max |
|---|---|---|---|---|---|---|---|---|---|---|---|
| my5651_rel_o2nofp.cz12a_c32r128 | 0.218 | 99.461 | 0.078 | 0.209 | 0.028 | 0.005 | 0.001 | 3.052 | |||
| my5744_rel_o2nofp.cz12a_c32r128 | 1.426 | 98.336 | 0.117 | 0.061 | 0.044 | 0.014 | 0.003 | 3.714 | |||
| my8044_rel_o2nofp.cz12a_c32r128 | 0.027 | 99.780 | 0.068 | 0.060 | 0.048 | 0.016 | 0.002 | 3.141 | |||
| my8407_rel_o2nofp.cz12a_c32r128 | 0.013 | 99.789 | 0.070 | 0.061 | 0.047 | 0.017 | 0.003 | 3.564 | |||
| my9400_rel_o2nofp.cz12a_c32r128 | 0.018 | 99.786 | 0.075 | 0.057 | 0.047 | 0.015 | 0.002 | 1.858 | |||
| my9500_rel_o2nofp.cz12a_c32r128 | 0.005 | 99.774 | 0.084 | 0.068 | 0.052 | 0.016 | 0.001 | 1.682 | |||
| my9500_rel_o2nofp.cz13a_c32r128 | 0.009 | 99.795 | 0.070 | 0.058 | 0.049 | 0.017 | 0.003 | 2.450 |
Performance metrics for the DBMS listed above. Some are normalized by throughput, others are not. Legend for results is here.
ips	qps	rps	rmbps	wps	wmbps	rpq	rkbpq	wpi	wkbpi	csps	cpups	cspq	cpupq	dbgb1	dbgb2	rss	maxop	p50	p99	tag
525241	0	3032	11.8	3393.4	186.9	0.006	0.023	0.006	0.364	81529	41.9	0.155	26	236.8	337.3	107.2	3.052	43895	21697	my5651_rel_o2nofp.cz12a_c32r128
671016	0	1	0.0	4373.7	239.9	0.000	0.000	0.007	0.366	85410	42.4	0.127	20	236.8	337.3	108.5	3.714	60993	8798	my5744_rel_o2nofp.cz12a_c32r128
824553	0	1	0.0	5489.6	306.6	0.000	0.000	0.007	0.381	146719	47.5	0.178	18	235.9	336.6	108.7	3.141	76190	12198	my8044_rel_o2nofp.cz12a_c32r128
808444	0	1	0.0	5376.7	300.5	0.000	0.000	0.007	0.381	144068	46.8	0.178	19	235.9	503.7	108.7	3.564	74791	5499	my8407_rel_o2nofp.cz12a_c32r128
811725	0	1	0.0	5411.0	301.9	0.000	0.000	0.007	0.381	144658	47.3	0.178	19	235.9	503.7	108.7	1.858	74890	14398	my9400_rel_o2nofp.cz12a_c32r128
806090	0	1	0.0	5389.3	302.4	0.000	0.000	0.007	0.384	152219	47.6	0.189	19	235.9	503.7	108.9	1.682	74391	17298	my9500_rel_o2nofp.cz12a_c32r128
804829	0	1	0.0	5364.5	299.5	0.000	0.000	0.007	0.381	143169	47.3	0.178	19	235.9	503.7	108.9	2.450	75389	3400	my9500_rel_o2nofp.cz13a_c32r128
Average values from iostat.
r/s	rkB/s	rrqm/s	%rrqm	r_await	rareq-s	w/s	wkB/s	wrqm/s	%wrqm	w_await	wareq-s	d/s	dkB/s	drqm/s	%drqm	d_await	dareq-s	f/s	f_await	aqu-sz	%util
3032.1	12131.8	0.003	0.000	0.575	3.831	3393.4	191349	27.48	0.832	2.673	57.72	1.205	8.270	0.000	0.000	1.788	3.345	2.134	1.483	7.402	16.03		my5651_rel_o2nofp.cz12a_c32r128
0.994	8.582	0.000	0.000	3.172	5.261	4373.7	245614	82.26	1.930	8.764	56.80	0.954	25.15	0.000	0.000	3.537	15.07	13.04	3.197	34.00	33.29		my5744_rel_o2nofp.cz12a_c32r128
1.214	10.80	0.003	0.069	3.589	5.287	5489.6	313934	92.09	1.761	12.83	57.88	1.290	11.92	0.000	0.000	4.172	7.168	17.28	3.786	65.79	33.62		my8044_rel_o2nofp.cz12a_c32r128
1.209	10.90	0.003	0.056	4.579	5.221	5376.7	307694	93.40	1.821	14.44	57.94	1.271	28.02	0.000	0.000	5.610	16.94	16.98	4.207	70.80	34.20		my8407_rel_o2nofp.cz12a_c32r128
0.927	9.728	0.002	0.073	2.974	4.066	5411.0	309179	92.85	1.788	12.04	57.72	1.213	11.37	0.000	0.000	4.618	7.201	17.15	3.514	63.87	31.86		my9400_rel_o2nofp.cz12a_c32r128
1.159	10.74	0.000	0.000	3.619	5.229	5389.3	309708	92.34	1.790	12.71	58.05	1.485	11.70	0.000	0.000	4.940	6.023	17.31	3.540	66.78	32.23		my9500_rel_o2nofp.cz12a_c32r128
1.276	11.16	0.000	0.000	5.143	5.233	5364.5	306673	91.49	1.782	14.26	57.81	1.375	12.95	0.000	0.000	4.301	7.041	16.88	4.226	69.82	33.93		my9500_rel_o2nofp.cz13a_c32r128
l.x
l.x: create secondary indexes.
Average throughput:
Performance metrics for the DBMS listed above. Some are normalized by throughput, others are not. Legend for results is here.
ips	qps	rps	rmbps	wps	wmbps	rpq	rkbpq	wpi	wkbpi	csps	cpups	cspq	cpupq	dbgb1	dbgb2	rss	maxop	p50	p99	tag
340748	0	3606	310.6	6230.2	435.7	0.011	0.933	0.018	1.309	16524	25.5	0.048	24	501.5	602.0	107.7	0.047	NA	NA	my5651_rel_o2nofp.cz12a_c32r128
972973	0	9739	881.0	15657.6	1081.8	0.010	0.927	0.016	1.139	60176	20.5	0.062	7	545.2	645.7	109.1	0.025	NA	NA	my5744_rel_o2nofp.cz12a_c32r128
508978	0	6847	665.6	15857.7	745.7	0.013	1.339	0.031	1.500	62770	26.3	0.123	17	543.1	643.8	109.0	0.004	NA	NA	my8044_rel_o2nofp.cz12a_c32r128
491803	0	6606	643.9	15345.5	720.8	0.013	1.341	0.031	1.501	73922	26.7	0.150	17	543.1	810.9	109.0	0.002	NA	NA	my8407_rel_o2nofp.cz12a_c32r128
493016	0	6621	645.2	15377.6	722.3	0.013	1.340	0.031	1.500	66651	25.8	0.135	17	543.1	810.9	109.0	0.005	NA	NA	my9400_rel_o2nofp.cz12a_c32r128
495186	0	6652	648.2	15450.3	725.5	0.013	1.340	0.031	1.500	74275	25.9	0.150	17	543.1	810.9	109.2	0.008	NA	NA	my9500_rel_o2nofp.cz12a_c32r128
496483	0	6667	650.0	15483.4	727.5	0.013	1.341	0.031	1.500	70590	25.7	0.142	17	543.1	810.9	109.2	0.002	NA	NA	my9500_rel_o2nofp.cz13a_c32r128
Average values from iostat.
r/s	rkB/s	rrqm/s	%rrqm	r_await	rareq-s	w/s	wkB/s	wrqm/s	%wrqm	w_await	wareq-s	d/s	dkB/s	drqm/s	%drqm	d_await	dareq-s	f/s	f_await	aqu-sz	%util
3606.3	318034	0.000	0.000	0.970	79.73	6230.2	446204	573.9	8.252	9.991	65.56	2.754	29376.7	0.000	0.000	0.294	187.2	212.9	8.390	28.34	86.29		my5651_rel_o2nofp.cz12a_c32r128
9738.8	902172	0.000	0.000	1.144	92.31	15657.6	1107731	146.3	1.339	16.58	107.5	9.812	83749.6	0.000	0.000	0.262	226.8	16.04	23.65	58.26	94.06		my5744_rel_o2nofp.cz12a_c32r128
6846.7	681575	0.000	0.000	5.520	112.1	15857.7	763631	96.72	0.771	22.38	72.54	10.20	82380.7	0.000	0.000	1.375	842.0	8.765	30.99	147.4	96.52		my8044_rel_o2nofp.cz12a_c32r128
6605.9	659306	0.001	0.000	4.810	110.9	15345.5	738077	99.24	0.715	19.05	71.20	9.952	79560.2	0.001	0.001	0.853	759.2	8.696	27.29	138.4	95.82		my8407_rel_o2nofp.cz12a_c32r128
6621.1	660674	0.000	0.000	6.449	111.8	15377.6	739685	99.87	0.720	24.58	72.90	10.22	79782.4	0.001	0.001	0.747	753.7	8.586	29.33	138.0	96.39		my9400_rel_o2nofp.cz12a_c32r128
6651.7	663774	0.000	0.000	5.138	111.2	15450.3	742911	99.85	0.754	18.11	71.48	10.14	80110.3	0.000	0.000	1.819	781.9	8.546	28.45	139.9	95.96		my9500_rel_o2nofp.cz12a_c32r128
6667.3	665628	0.000	0.000	4.648	111.2	15483.4	744953	100.3	0.823	19.03	72.00	9.908	80333.8	0.001	0.001	0.932	840.4	8.533	30.52	141.1	96.07		my9500_rel_o2nofp.cz13a_c32r128
l.i1
l.i1: continue load after secondary indexes created with 50 inserts per transaction. Graphs for performance per 1-second interval are here.
Average throughput:
Insert response time histogram: each cell has the percentage of responses that take <= the time in the header and max is the max response time in seconds. For the max column values in the top 25% of the range have a red background and in the bottom 25% of the range have a green background. The red background is not used when the min value is within 80% of the max value.
| dbms | 256us | 1ms | 4ms | 16ms | 64ms | 256ms | 1s | 4s | 16s | gt | max |
|---|---|---|---|---|---|---|---|---|---|---|---|
| my5651_rel_o2nofp.cz12a_c32r128 | 0.114 | 14.403 | 43.452 | 28.944 | 12.681 | 0.261 | 0.145 | 0.001 | 23.878 | ||
| my5744_rel_o2nofp.cz12a_c32r128 | 0.233 | 20.066 | 38.544 | 29.528 | 11.213 | 0.294 | 0.122 | 13.787 | |||
| my8044_rel_o2nofp.cz12a_c32r128 | 0.662 | 21.286 | 34.822 | 37.112 | 5.696 | 0.229 | 0.193 | 11.689 | |||
| my8407_rel_o2nofp.cz12a_c32r128 | 0.443 | 19.491 | 34.311 | 39.620 | 5.685 | 0.293 | 0.157 | 11.448 | |||
| my9400_rel_o2nofp.cz12a_c32r128 | 0.490 | 19.601 | 35.183 | 38.705 | 5.565 | 0.277 | 0.179 | 12.418 | |||
| my9500_rel_o2nofp.cz12a_c32r128 | 0.001 | 2.391 | 17.248 | 70.510 | 9.178 | 0.448 | 0.225 | 11.007 | |||
| my9500_rel_o2nofp.cz13a_c32r128 | 0.470 | 19.888 | 34.669 | 39.147 | 5.389 | 0.252 | 0.185 | 12.189 |
Delete response time histogram: each cell has the percentage of responses that take <= the time in the header and max is the max response time in seconds. For the max column values in the top 25% of the range have a red background and in the bottom 25% of the range have a green background. The red background is not used when the min value is within 80% of the max value.
| dbms | 256us | 1ms | 4ms | 16ms | 64ms | 256ms | 1s | 4s | 16s | gt | max |
|---|---|---|---|---|---|---|---|---|---|---|---|
| my5651_rel_o2nofp.cz12a_c32r128 | 8.697 | 42.524 | 36.617 | 2.673 | 9.296 | 0.172 | 0.022 | nonzero | 18.271 | ||
| my5744_rel_o2nofp.cz12a_c32r128 | 48.659 | 36.521 | 7.518 | 0.467 | 6.790 | 0.043 | 0.002 | 5.745 | |||
| my8044_rel_o2nofp.cz12a_c32r128 | 40.352 | 24.749 | 22.274 | 12.116 | 0.382 | 0.088 | 0.041 | 9.321 | |||
| my8407_rel_o2nofp.cz12a_c32r128 | 39.140 | 24.349 | 20.267 | 15.574 | 0.545 | 0.106 | 0.018 | 9.182 | |||
| my9400_rel_o2nofp.cz12a_c32r128 | 40.412 | 23.375 | 20.876 | 14.683 | 0.522 | 0.110 | 0.021 | 7.169 | |||
| my9500_rel_o2nofp.cz12a_c32r128 | 31.006 | 7.593 | 9.104 | 51.199 | 0.930 | 0.139 | 0.028 | 7.083 | |||
| my9500_rel_o2nofp.cz13a_c32r128 | 40.353 | 23.377 | 20.771 | 14.855 | 0.504 | 0.111 | 0.029 | 7.440 |
Performance metrics for the DBMS listed above. Some are normalized by throughput, others are not. Legend for results is here.
ips	qps	rps	rmbps	wps	wmbps	rpq	rkbpq	wpi	wkbpi	csps	cpups	cspq	cpupq	dbgb1	dbgb2	rss	maxop	p50	p99	tag
5561	0	11062	170.7	19016.2	496.4	1.989	31.441	3.420	91.417	79151	8.7	14.234	501	737.7	850.8	107.3	23.878	250	0	my5651_rel_o2nofp.cz12a_c32r128
5869	0	11643	181.9	18433.0	503.6	1.984	31.743	3.141	87.868	85672	9.6	14.598	523	735.0	847.5	108.6	13.787	250	0	my5744_rel_o2nofp.cz12a_c32r128
5932	0	10495	164.0	15625.4	470.2	1.769	28.306	2.634	81.169	104335	9.9	17.587	534	736.3	850.4	108.9	11.689	350	0	my8044_rel_o2nofp.cz12a_c32r128
5859	0	10470	163.6	15649.3	470.1	1.787	28.591	2.671	82.159	104559	9.9	17.845	541	735.2	1020.9	108.9	11.448	400	0	my8407_rel_o2nofp.cz12a_c32r128
5905	0	10525	164.5	15742.3	473.4	1.783	28.520	2.666	82.097	105260	10.0	17.826	542	735.2	1020.8	108.9	12.418	400	0	my9400_rel_o2nofp.cz12a_c32r128
3838	0	11205	175.1	16039.0	471.9	2.919	46.710	4.179	125.901	104375	8.9	27.195	742	716.5	994.9	109.0	11.007	300	0	my9500_rel_o2nofp.cz12a_c32r128
5930	0	10560	165.0	15730.2	473.0	1.781	28.491	2.653	81.677	105143	10.0	17.730	540	735.7	1021.5	109.0	12.189	400	0	my9500_rel_o2nofp.cz13a_c32r128
Average values from iostat.
r/s	rkB/s	rrqm/s	%rrqm	r_await	rareq-s	w/s	wkB/s	wrqm/s	%wrqm	w_await	wareq-s	d/s	dkB/s	drqm/s	%drqm	d_await	dareq-s	f/s	f_await	aqu-sz	%util
11061.5	174833	0.000	0.000	0.444	15.78	19016.2	508341	43.71	0.278	7.681	28.14	0.017	0.651	0.000	0.000	0.466	2.637	6.656	3.942	28.38	99.06		my5651_rel_o2nofp.cz12a_c32r128
11643.1	186287	0.000	0.000	0.643	16.00	18433.0	515661	58.18	0.338	8.844	28.24	0.014	0.106	0.000	0.000	0.742	0.350	10.67	4.168	43.03	99.94		my5744_rel_o2nofp.cz12a_c32r128
10495.3	167924	0.000	0.000	15.13	15.99	15625.4	481533	41.92	0.304	99.09	31.20	0.026	3.981	0.000	0.000	3.633	17.19	12.38	61.35	404.2	99.81		my8044_rel_o2nofp.cz12a_c32r128
10470.2	167521	0.000	0.000	6.167	16.00	15649.3	481392	48.69	0.344	58.07	31.07	0.012	0.341	0.000	0.000	1.312	1.237	12.53	39.77	383.9	99.86		my8407_rel_o2nofp.cz12a_c32r128
10525.3	168404	0.001	0.000	10.30	16.00	15742.3	484761	46.69	0.330	68.02	31.11	0.014	2.115	0.000	0.000	1.120	6.788	12.61	42.49	383.0	99.86		my9400_rel_o2nofp.cz12a_c32r128
11204.9	179277	0.001	0.000	7.330	16.00	16039.0	483220	28.13	0.201	59.75	30.38	0.018	0.558	0.000	0.000	3.042	2.435	10.16	43.26	409.8	99.95		my9500_rel_o2nofp.cz12a_c32r128
10560.2	168961	0.001	0.000	12.06	16.00	15730.2	484368	47.07	0.341	75.11	31.16	0.013	0.299	0.000	0.000	0.692	1.235	12.54	48.03	385.9	99.87		my9500_rel_o2nofp.cz13a_c32r128
l.i2
l.i2: continue load after secondary indexes created with 5 inserts per transaction. Graphs for performance per 1-second interval are here.
Average throughput:
Insert response time histogram: each cell has the percentage of responses that take <= the time in the header and max is the max response time in seconds. For the max column values in the top 25% of the range have a red background and in the bottom 25% of the range have a green background. The red background is not used when the min value is within 80% of the max value.
| dbms | 256us | 1ms | 4ms | 16ms | 64ms | 256ms | 1s | 4s | 16s | gt | max |
|---|---|---|---|---|---|---|---|---|---|---|---|
| my5651_rel_o2nofp.cz12a_c32r128 | 0.012 | 0.816 | 6.894 | 22.654 | 46.418 | 22.713 | 0.276 | 0.213 | 0.005 | 6.535 | |
| my5744_rel_o2nofp.cz12a_c32r128 | nonzero | 2.932 | 12.643 | 18.785 | 49.912 | 15.187 | 0.351 | 0.188 | 0.002 | 6.066 | |
| my8044_rel_o2nofp.cz12a_c32r128 | 0.001 | 39.332 | 45.893 | 14.431 | 0.105 | 0.159 | 0.080 | 8.974 | |||
| my8407_rel_o2nofp.cz12a_c32r128 | 28.094 | 44.811 | 26.648 | 0.394 | 0.052 | 0.002 | 5.639 | ||||
| my9400_rel_o2nofp.cz12a_c32r128 | 27.958 | 44.701 | 26.874 | 0.408 | 0.053 | 0.007 | 6.009 | ||||
| my9500_rel_o2nofp.cz12a_c32r128 | 55.418 | 30.195 | 14.080 | 0.231 | 0.077 | 3.726 | |||||
| my9500_rel_o2nofp.cz13a_c32r128 | 29.572 | 44.267 | 25.722 | 0.364 | 0.070 | 0.004 | 5.919 |
Delete response time histogram: each cell has the percentage of responses that take <= the time in the header and max is the max response time in seconds. For the max column values in the top 25% of the range have a red background and in the bottom 25% of the range have a green background. The red background is not used when the min value is within 80% of the max value.
| dbms | 256us | 1ms | 4ms | 16ms | 64ms | 256ms | 1s | 4s | 16s | gt | max |
|---|---|---|---|---|---|---|---|---|---|---|---|
| my5651_rel_o2nofp.cz12a_c32r128 | 0.090 | 8.044 | 17.132 | 11.092 | 42.862 | 20.460 | 0.226 | 0.093 | 0.001 | 5.591 | |
| my5744_rel_o2nofp.cz12a_c32r128 | 0.002 | 35.238 | 4.854 | 0.642 | 48.074 | 11.134 | 0.046 | 0.010 | nonzero | 4.959 | |
| my8044_rel_o2nofp.cz12a_c32r128 | 0.018 | 48.607 | 43.194 | 8.063 | 0.039 | 0.058 | 0.020 | 8.456 | |||
| my8407_rel_o2nofp.cz12a_c32r128 | 39.388 | 41.148 | 19.344 | 0.102 | 0.018 | nonzero | 4.627 | ||||
| my9400_rel_o2nofp.cz12a_c32r128 | 39.369 | 40.991 | 19.520 | 0.098 | 0.021 | 0.001 | 6.009 | ||||
| my9500_rel_o2nofp.cz12a_c32r128 | 68.740 | 22.920 | 8.266 | 0.052 | 0.021 | 3.498 | |||||
| my9500_rel_o2nofp.cz13a_c32r128 | 40.774 | 40.517 | 18.582 | 0.100 | 0.026 | 0.001 | 5.903 |
Performance metrics for the DBMS listed above. Some are normalized by throughput, others are not. Legend for results is here.
ips	qps	rps	rmbps	wps	wmbps	rpq	rkbpq	wpi	wkbpi	csps	cpups	cspq	cpupq	dbgb1	dbgb2	rss	maxop	p50	p99	tag
1364	0	12276	187.5	18075.2	457.9	8.997	140.724	13.248	343.665	75788	7.1	55.547	1665	737.7	850.8	107.2	6.535	75	0	my5651_rel_o2nofp.cz12a_c32r128
1557	0	13111	204.9	18151.0	495.1	8.423	134.761	11.661	325.671	77997	8.3	50.107	1706	735.0	847.5	108.6	6.066	85	0	my5744_rel_o2nofp.cz12a_c32r128
1404	0	12681	198.1	16757.6	475.4	9.035	144.556	11.939	346.841	108724	8.7	77.461	1983	736.3	848.4	108.9	8.974	80	0	my8044_rel_o2nofp.cz12a_c32r128
1269	0	11607	181.4	15464.4	437.7	9.147	146.357	12.187	353.188	100467	8.2	79.176	2068	735.2	1021.3	108.9	5.639	75	0	my8407_rel_o2nofp.cz12a_c32r128
1254	0	11483	179.4	15279.3	432.8	9.161	146.572	12.189	353.580	99153	8.1	79.101	2068	735.2	1021.2	108.9	6.009	75	0	my9400_rel_o2nofp.cz12a_c32r128
1888	0	11733	183.3	16017.3	455.0	6.216	99.455	8.486	246.844	112642	9.1	59.675	1543	716.5	997.2	109.0	3.726	110	0	my9500_rel_o2nofp.cz12a_c32r128
1289	0	11846	185.1	15761.8	446.3	9.192	147.071	12.231	354.666	102043	8.4	79.183	2086	735.7	1021.9	109.0	5.919	75	0	my9500_rel_o2nofp.cz13a_c32r128
Average values from iostat.
r/s	rkB/s	rrqm/s	%rrqm	r_await	rareq-s	w/s	wkB/s	wrqm/s	%wrqm	w_await	wareq-s	d/s	dkB/s	drqm/s	%drqm	d_await	dareq-s	f/s	f_await	aqu-sz	%util
12275.8	192004	0.000	0.000	0.337	15.61	18075.2	468896	19.74	0.119	4.658	26.19	0.003	0.016	0.000	0.000	0.151	0.064	4.944	4.020	22.94	99.40		my5651_rel_o2nofp.cz12a_c32r128
13110.6	209769	0.000	0.000	0.475	16.00	18151.0	506939	17.00	0.099	4.341	27.98	0.005	0.028	0.000	0.000	0.186	0.115	4.367	4.424	33.42	99.94		my5744_rel_o2nofp.cz12a_c32r128
12681.2	202898	0.000	0.000	13.94	16.00	16757.6	486827	1.719	0.032	93.76	29.28	0.027	351.5	0.000	0.000	0.608	20.95	6.258	67.11	410.0	99.88		my8044_rel_o2nofp.cz12a_c32r128
11607.0	185712	0.000	0.000	1.240	16.00	15464.4	448160	2.276	0.014	26.33	28.98	0.031	315.5	0.000	0.000	0.861	23.89	6.270	19.50	406.6	99.93		my8407_rel_o2nofp.cz12a_c32r128
11483.0	183728	0.000	0.000	1.374	16.00	15279.3	443213	1.981	0.014	28.11	29.01	0.033	310.0	0.000	0.000	0.972	16.97	6.169	21.58	408.3	99.94		my9400_rel_o2nofp.cz12a_c32r128
11733.3	187732	0.000	0.000	1.541	16.00	16017.3	465944	2.153	0.013	26.39	29.09	0.025	0.381	0.000	0.000	2.503	1.718	6.435	21.28	420.1	99.96		my9500_rel_o2nofp.cz12a_c32r128
11845.6	189530	0.000	0.000	1.212	16.00	15761.8	457058	2.090	0.013	26.23	29.00	0.031	322.4	0.000	0.000	1.258	27.36	6.396	19.83	405.0	99.93		my9500_rel_o2nofp.cz13a_c32r128
qr100.L1
qr100.L1: range queries with 100 insert/s per client. Graphs for performance per 1-second interval are here.
Average throughput:
Query response time histogram: each cell has the percentage of responses that take <= the time in the header and max is the max response time in seconds. For max values in the top 25% of the range have a red background and in the bottom 25% of the range have a green background. The red background is not used when the min value is within 80% of the max value.
| dbms | 256us | 1ms | 4ms | 16ms | 64ms | 256ms | 1s | 4s | 16s | gt | max |
|---|---|---|---|---|---|---|---|---|---|---|---|
| my5651_rel_o2nofp.cz12a_c32r128 | 99.504 | 0.389 | 0.095 | 0.012 | nonzero | nonzero | 0.152 | ||||
| my5744_rel_o2nofp.cz12a_c32r128 | 99.875 | 0.080 | 0.043 | 0.002 | nonzero | nonzero | 0.066 | ||||
| my8044_rel_o2nofp.cz12a_c32r128 | 99.919 | 0.079 | 0.001 | nonzero | nonzero | nonzero | 0.094 | ||||
| my8407_rel_o2nofp.cz12a_c32r128 | 99.902 | 0.094 | 0.003 | nonzero | nonzero | nonzero | nonzero | 0.718 | |||
| my9400_rel_o2nofp.cz12a_c32r128 | 99.907 | 0.088 | 0.004 | nonzero | nonzero | nonzero | nonzero | 0.533 | |||
| my9500_rel_o2nofp.cz12a_c32r128 | 99.890 | 0.108 | 0.001 | nonzero | nonzero | nonzero | nonzero | 0.651 | |||
| my9500_rel_o2nofp.cz13a_c32r128 | 99.901 | 0.091 | 0.006 | 0.001 | 0.001 | nonzero | nonzero | 0.762 |
Insert response time histogram: each cell has the percentage of responses that take <= the time in the header and max is the max response time in seconds. For max values in the top 25% of the range have a red background and in the bottom 25% of the range have a green background. The red background is not used when the min value is within 80% of the max value.
| dbms | 256us | 1ms | 4ms | 16ms | 64ms | 256ms | 1s | 4s | 16s | gt | max |
|---|---|---|---|---|---|---|---|---|---|---|---|
| my5651_rel_o2nofp.cz12a_c32r128 | 51.289 | 48.370 | 0.340 | 0.199 | |||||||
| my5744_rel_o2nofp.cz12a_c32r128 | 81.995 | 17.764 | 0.241 | 0.137 | |||||||
| my8044_rel_o2nofp.cz12a_c32r128 | 82.486 | 17.435 | 0.079 | 0.115 | |||||||
| my8407_rel_o2nofp.cz12a_c32r128 | 66.887 | 29.690 | 1.979 | 1.315 | 0.130 | 1.977 | |||||
| my9400_rel_o2nofp.cz12a_c32r128 | 72.979 | 26.525 | 0.435 | 0.058 | 0.002 | 1.119 | |||||
| my9500_rel_o2nofp.cz12a_c32r128 | 70.961 | 27.225 | 1.752 | 0.051 | 0.012 | 1.042 | |||||
| my9500_rel_o2nofp.cz13a_c32r128 | 66.169 | 30.150 | 2.773 | 0.847 | 0.060 | 1.909 |
Delete response time histogram: each cell has the percentage of responses that take <= the time in the header and max is the max response time in seconds. For max values in the top 25% of the range have a red background and in the bottom 25% of the range have a green background. The red background is not used when the min value is within 80% of the max value.
| dbms | 256us | 1ms | 4ms | 16ms | 64ms | 256ms | 1s | 4s | 16s | gt | max |
|---|---|---|---|---|---|---|---|---|---|---|---|
| my5651_rel_o2nofp.cz12a_c32r128 | 65.634 | 30.417 | 3.910 | 0.039 | 0.163 | ||||||
| my5744_rel_o2nofp.cz12a_c32r128 | 97.546 | 2.424 | 0.030 | 0.054 | |||||||
| my8044_rel_o2nofp.cz12a_c32r128 | 99.854 | 0.113 | 0.014 | 0.019 | 0.087 | ||||||
| my8407_rel_o2nofp.cz12a_c32r128 | 98.713 | 0.264 | 0.236 | 0.650 | 0.137 | 0.784 | |||||
| my9400_rel_o2nofp.cz12a_c32r128 | 99.468 | 0.361 | 0.141 | 0.030 | 0.142 | ||||||
| my9500_rel_o2nofp.cz12a_c32r128 | 96.833 | 1.715 | 1.123 | 0.315 | 0.014 | 0.959 | |||||
| my9500_rel_o2nofp.cz13a_c32r128 | 98.574 | 0.359 | 0.410 | 0.484 | 0.174 | 0.607 |
Performance metrics for the DBMS listed above. Some are normalized by throughput, others are not. Legend for results is here.
ips	qps	rps	rmbps	wps	wmbps	rpq	rkbpq	wpi	wkbpi	csps	cpups	cspq	cpupq	dbgb1	dbgb2	rss	maxop	p50	p99	tag
1193	109827	5634	87.5	4520.8	130.2	0.051	0.816	3.790	111.787	646835	39.3	5.890	115	737.7	850.8	107.2	0.152	9327	7423	my5651_rel_o2nofp.cz12a_c32r128
1193	94284	5574	87.1	4849.7	139.5	0.059	0.946	4.066	119.809	554737	40.4	5.884	137	735.0	847.5	108.7	0.066	7967	4816	my5744_rel_o2nofp.cz12a_c32r128
1193	86332	5109	79.8	4950.6	142.4	0.059	0.947	4.151	122.229	517321	40.9	5.992	152	736.3	848.4	108.8	0.094	7263	7119	my8044_rel_o2nofp.cz12a_c32r128
1193	83544	5133	80.2	5277.8	151.3	0.061	0.983	4.425	129.858	503318	40.7	6.025	156	735.2	1021.6	108.8	0.718	7039	6239	my8407_rel_o2nofp.cz12a_c32r128
1193	86486	5125	80.1	5435.6	155.8	0.059	0.948	4.557	133.726	519572	41.0	6.008	152	735.2	1021.4	108.8	0.533	7263	7038	my9400_rel_o2nofp.cz12a_c32r128
1193	85684	4947	77.3	4560.8	131.1	0.058	0.924	3.824	112.550	512294	40.8	5.979	152	716.5	997.4	109.0	0.651	7215	6943	my9500_rel_o2nofp.cz12a_c32r128
1193	84966	5129	80.1	5320.6	152.5	0.060	0.966	4.461	130.927	511314	40.7	6.018	153	735.7	1022.1	109.0	0.762	7183	5999	my9500_rel_o2nofp.cz13a_c32r128
Average values from iostat.
r/s	rkB/s	rrqm/s	%rrqm	r_await	rareq-s	w/s	wkB/s	wrqm/s	%wrqm	w_await	wareq-s	d/s	dkB/s	drqm/s	%drqm	d_await	dareq-s	f/s	f_await	aqu-sz	%util
5633.7	89629.5	0.000	0.000	0.178	15.90	4520.8	133329	7.494	0.544	0.346	33.14	0.002	0.013	0.000	0.000	0.028	0.066	2.009	1.367	2.717	24.04		my5651_rel_o2nofp.cz12a_c32r128
5573.8	89180.5	0.000	0.000	0.179	16.00	4849.7	142896	7.571	0.189	0.483	29.74	0.002	0.007	0.000	0.000	0.011	0.033	2.048	1.766	3.550	26.26		my5744_rel_o2nofp.cz12a_c32r128
5109.0	81744.1	0.000	0.000	0.243	16.00	4950.6	145783	1.095	0.024	3.295	29.55	0.004	0.015	0.000	0.000	0.028	0.077	4.093	1.997	18.49	18.15		my8044_rel_o2nofp.cz12a_c32r128
5132.8	82124.7	0.000	0.000	0.401	16.00	5277.8	154882	1.547	0.031	8.444	29.47	0.004	0.040	0.000	0.000	0.123	0.166	2.726	5.438	44.32	26.98		my8407_rel_o2nofp.cz12a_c32r128
5125.2	82003.9	0.000	0.000	0.240	16.00	5435.6	159496	1.320	0.026	3.550	29.46	0.014	0.075	0.000	0.000	0.388	0.343	2.634	2.158	21.40	21.81		my9400_rel_o2nofp.cz12a_c32r128
4946.8	79149.0	0.000	0.000	0.253	16.00	4560.8	134239	1.482	0.035	3.286	29.55	0.023	0.367	0.000	0.000	1.119	1.761	3.310	2.416	16.97	18.73		my9500_rel_o2nofp.cz12a_c32r128
5128.8	82060.4	0.000	0.000	0.447	16.00	5320.6	156157	1.351	0.027	10.40	29.47	0.014	0.217	0.000	0.000	0.826	1.009	2.760	6.349	51.89	28.80		my9500_rel_o2nofp.cz13a_c32r128
qp100.L2
qp100.L2: point queries with 100 insert/s per client. Graphs for performance per 1-second interval are here.
Average throughput:
Query response time histogram: each cell has the percentage of responses that take <= the time in the header and max is the max response time in seconds. For max values in the top 25% of the range have a red background and in the bottom 25% of the range have a green background. The red background is not used when the min value is within 80% of the max value.
| dbms | 256us | 1ms | 4ms | 16ms | 64ms | 256ms | 1s | 4s | 16s | gt | max |
|---|---|---|---|---|---|---|---|---|---|---|---|
| my5651_rel_o2nofp.cz12a_c32r128 | 0.001 | 7.897 | 71.708 | 19.706 | 0.671 | 0.015 | 0.001 | 0.001 | nonzero | 6.726 | |
| my5744_rel_o2nofp.cz12a_c32r128 | 0.004 | 28.822 | 63.288 | 7.577 | 0.293 | 0.011 | 0.004 | 0.001 | 3.550 | ||
| my8044_rel_o2nofp.cz12a_c32r128 | 0.004 | 30.539 | 62.935 | 6.259 | 0.234 | 0.024 | 0.002 | 0.003 | nonzero | 5.866 | |
| my8407_rel_o2nofp.cz12a_c32r128 | 0.003 | 26.185 | 66.002 | 7.537 | 0.238 | 0.030 | 0.002 | 0.002 | nonzero | 4.166 | |
| my9400_rel_o2nofp.cz12a_c32r128 | 0.003 | 25.697 | 65.963 | 8.033 | 0.260 | 0.039 | 0.003 | 0.001 | nonzero | 4.043 | |
| my9500_rel_o2nofp.cz12a_c32r128 | 0.004 | 27.074 | 65.880 | 6.834 | 0.183 | 0.020 | 0.002 | 0.002 | nonzero | 4.883 | |
| my9500_rel_o2nofp.cz13a_c32r128 | 0.004 | 26.465 | 65.709 | 7.567 | 0.227 | 0.024 | 0.003 | 0.002 | 3.648 |
Insert response time histogram: each cell has the percentage of responses that take <= the time in the header and max is the max response time in seconds. For max values in the top 25% of the range have a red background and in the bottom 25% of the range have a green background. The red background is not used when the min value is within 80% of the max value.
| dbms | 256us | 1ms | 4ms | 16ms | 64ms | 256ms | 1s | 4s | 16s | gt | max |
|---|---|---|---|---|---|---|---|---|---|---|---|
| my5651_rel_o2nofp.cz12a_c32r128 | 6.162 | 49.938 | 42.708 | 1.072 | 0.093 | 0.028 | 6.711 | ||||
| my5744_rel_o2nofp.cz12a_c32r128 | 19.975 | 70.380 | 8.347 | 1.002 | 0.236 | 0.060 | 6.458 | ||||
| my8044_rel_o2nofp.cz12a_c32r128 | 23.519 | 67.201 | 8.414 | 0.338 | 0.273 | 0.255 | 8.608 | ||||
| my8407_rel_o2nofp.cz12a_c32r128 | 10.389 | 79.572 | 8.970 | 0.718 | 0.269 | 0.083 | 4.842 | ||||
| my9400_rel_o2nofp.cz12a_c32r128 | 6.995 | 81.319 | 10.373 | 1.120 | 0.192 | 3.900 | |||||
| my9500_rel_o2nofp.cz12a_c32r128 | 31.852 | 62.701 | 4.688 | 0.377 | 0.245 | 0.137 | 7.235 | ||||
| my9500_rel_o2nofp.cz13a_c32r128 | 9.525 | 80.125 | 9.488 | 0.556 | 0.250 | 0.056 | 4.506 |
Delete response time histogram: each cell has the percentage of responses that take <= the time in the header and max is the max response time in seconds. For max values in the top 25% of the range have a red background and in the bottom 25% of the range have a green background. The red background is not used when the min value is within 80% of the max value.
| dbms | 256us | 1ms | 4ms | 16ms | 64ms | 256ms | 1s | 4s | 16s | gt | max |
|---|---|---|---|---|---|---|---|---|---|---|---|
| my5651_rel_o2nofp.cz12a_c32r128 | 0.005 | 42.850 | 49.310 | 6.840 | 0.875 | 0.065 | 0.051 | 0.005 | 6.612 | ||
| my5744_rel_o2nofp.cz12a_c32r128 | 93.414 | 4.806 | 1.111 | 0.215 | 0.204 | 0.215 | 0.035 | 4.759 | |||
| my8044_rel_o2nofp.cz12a_c32r128 | 96.414 | 1.231 | 1.019 | 0.419 | 0.324 | 0.586 | 0.007 | 5.366 | |||
| my8407_rel_o2nofp.cz12a_c32r128 | 96.752 | 1.512 | 0.843 | 0.354 | 0.275 | 0.264 | 3.762 | ||||
| my9400_rel_o2nofp.cz12a_c32r128 | 96.701 | 1.553 | 0.979 | 0.507 | 0.160 | 0.100 | 2.037 | ||||
| my9500_rel_o2nofp.cz12a_c32r128 | 97.606 | 0.875 | 0.692 | 0.319 | 0.141 | 0.363 | 0.002 | 4.038 | |||
| my9500_rel_o2nofp.cz13a_c32r128 | 96.942 | 1.488 | 0.757 | 0.289 | 0.215 | 0.308 | 3.934 |
Performance metrics for the DBMS listed above. Some are normalized by throughput, others are not. Legend for results is here.
ips	qps	rps	rmbps	wps	wmbps	rpq	rkbpq	wpi	wkbpi	csps	cpups	cspq	cpupq	dbgb1	dbgb2	rss	maxop	p50	p99	tag
1191	4053	35684	557.1	14254.7	310.9	8.804	140.741	11.966	267.201	143684	18.3	35.450	1445	737.7	850.8	107.2	6.726	352	48	my5651_rel_o2nofp.cz12a_c32r128
1191	6360	49427	772.3	13227.8	324.9	7.772	124.347	11.104	279.264	164231	10.4	25.823	523	735.0	847.5	108.7	3.550	560	0	my5744_rel_o2nofp.cz12a_c32r128
1181	6722	51303	801.6	11640.8	325.7	7.632	122.108	9.858	282.459	180478	11.3	26.848	538	736.3	848.4	108.8	5.866	608	0	my8044_rel_o2nofp.cz12a_c32r128
1192	6414	49743	777.2	11807.2	329.9	7.755	124.076	9.905	283.438	174014	11.4	27.128	569	735.2	1021.8	108.8	4.166	528	0	my8407_rel_o2nofp.cz12a_c32r128
1192	6304	49059	766.5	11785.5	329.7	7.782	124.519	9.887	283.253	169650	11.2	26.912	569	735.2	1021.6	108.8	4.043	528	48	my9400_rel_o2nofp.cz12a_c32r128
1189	6684	51012	797.1	11471.5	320.2	7.632	122.117	9.645	275.641	179729	11.5	26.891	551	716.5	997.6	109.0	4.883	544	0	my9500_rel_o2nofp.cz12a_c32r128
1193	6459	49982	781.0	11798.6	329.9	7.739	123.816	9.892	283.210	173595	11.4	26.877	565	735.7	1022.3	109.0	3.648	528	0	my9500_rel_o2nofp.cz13a_c32r128
Average values from iostat.
r/s	rkB/s	rrqm/s	%rrqm	r_await	rareq-s	w/s	wkB/s	wrqm/s	%wrqm	w_await	wareq-s	d/s	dkB/s	drqm/s	%drqm	d_await	dareq-s	f/s	f_await	aqu-sz	%util
35683.7	570438	0.000	0.000	0.237	15.99	14254.7	318316	6.553	0.053	0.425	23.53	0.002	0.013	0.000	0.000	0.036	0.066	1.677	3.271	12.96	98.66		my5651_rel_o2nofp.cz12a_c32r128
49427.3	790836	0.000	0.000	0.246	16.00	13227.8	332687	6.870	0.058	1.146	25.45	0.001	0.004	0.000	0.000	0.022	0.022	1.778	3.832	17.79	99.97		my5744_rel_o2nofp.cz12a_c32r128
51303.0	820848	0.000	0.000	3.399	16.00	11640.8	333556	2.135	0.026	30.34	28.72	0.002	0.009	0.000	0.000	0.056	0.033	2.870	18.68	137.2	99.87		my8044_rel_o2nofp.cz12a_c32r128
49742.7	795883	0.000	0.000	0.343	16.00	11807.2	337858	3.640	0.035	8.766	28.67	0.004	0.027	0.000	0.000	0.142	0.099	2.836	9.218	107.1	99.97		my8407_rel_o2nofp.cz12a_c32r128
49059.1	784945	0.000	0.000	0.295	16.00	11785.5	337638	2.662	0.026	8.182	28.71	0.001	0.013	0.000	0.000	0.014	0.033	2.912	6.999	102.2	99.97		my9400_rel_o2nofp.cz12a_c32r128
51012.3	816196	0.000	0.000	0.352	16.00	11471.5	327848	3.500	0.035	10.48	28.64	0.025	0.392	0.000	0.000	0.646	1.846	2.942	12.82	97.47	99.92		my9500_rel_o2nofp.cz12a_c32r128
49982.3	799717	0.000	0.000	0.310	16.00	11798.6	337785	3.098	0.030	8.012	28.69	0.004	0.053	0.000	0.000	0.097	0.232	2.880	8.703	99.71	99.98		my9500_rel_o2nofp.cz13a_c32r128
qr500.L3
qr500.L3: range queries with 500 insert/s per client. Graphs for performance per 1-second interval are here.
Average throughput:
Query response time histogram: each cell has the percentage of responses that take <= the time in the header and max is the max response time in seconds. For max values in the top 25% of the range have a red background and in the bottom 25% of the range have a green background. The red background is not used when the min value is within 80% of the max value.
| dbms | 256us | 1ms | 4ms | 16ms | 64ms | 256ms | 1s | 4s | 16s | gt | max |
|---|---|---|---|---|---|---|---|---|---|---|---|
| my5651_rel_o2nofp.cz12a_c32r128 | 94.661 | 3.363 | 1.593 | 0.283 | 0.097 | 0.002 | 0.001 | nonzero | nonzero | 7.319 | |
| my5744_rel_o2nofp.cz12a_c32r128 | 98.035 | 1.463 | 0.461 | 0.033 | 0.005 | 0.001 | 0.001 | nonzero | nonzero | 6.864 | |
| my8044_rel_o2nofp.cz12a_c32r128 | 98.171 | 1.482 | 0.336 | 0.006 | 0.004 | 0.001 | nonzero | nonzero | nonzero | 7.857 | |
| my8407_rel_o2nofp.cz12a_c32r128 | 97.732 | 1.718 | 0.530 | 0.010 | 0.008 | 0.001 | nonzero | nonzero | nonzero | 4.202 | |
| my9400_rel_o2nofp.cz12a_c32r128 | 97.581 | 1.780 | 0.612 | 0.013 | 0.010 | 0.002 | nonzero | nonzero | 3.462 | ||
| my9500_rel_o2nofp.cz12a_c32r128 | 97.236 | 2.062 | 0.667 | 0.019 | 0.014 | 0.002 | nonzero | nonzero | nonzero | 4.591 | |
| my9500_rel_o2nofp.cz13a_c32r128 | 97.869 | 1.612 | 0.500 | 0.010 | 0.008 | 0.001 | nonzero | nonzero | nonzero | 4.984 |
Insert response time histogram: each cell has the percentage of responses that take <= the time in the header and max is the max response time in seconds. For max values in the top 25% of the range have a red background and in the bottom 25% of the range have a green background. The red background is not used when the min value is within 80% of the max value.
| dbms | 256us | 1ms | 4ms | 16ms | 64ms | 256ms | 1s | 4s | 16s | gt | max |
|---|---|---|---|---|---|---|---|---|---|---|---|
| my5651_rel_o2nofp.cz12a_c32r128 | 8.333 | 62.163 | 28.129 | 1.196 | 0.106 | 0.072 | 12.387 | ||||
| my5744_rel_o2nofp.cz12a_c32r128 | 3.164 | 75.618 | 20.400 | 0.392 | 0.254 | 0.173 | 7.622 | ||||
| my8044_rel_o2nofp.cz12a_c32r128 | 14.912 | 68.854 | 14.942 | 0.836 | 0.190 | 0.267 | 9.013 | ||||
| my8407_rel_o2nofp.cz12a_c32r128 | 10.660 | 70.393 | 17.127 | 1.425 | 0.354 | 0.041 | 8.602 | ||||
| my9400_rel_o2nofp.cz12a_c32r128 | nonzero | 9.464 | 69.324 | 19.167 | 1.774 | 0.265 | 0.006 | 4.513 | |||
| my9500_rel_o2nofp.cz12a_c32r128 | 14.137 | 69.435 | 14.986 | 1.106 | 0.296 | 0.039 | 4.735 | ||||
| my9500_rel_o2nofp.cz13a_c32r128 | 12.166 | 69.267 | 16.906 | 1.300 | 0.332 | 0.029 | 6.358 |
Delete response time histogram: each cell has the percentage of responses that take <= the time in the header and max is the max response time in seconds. For max values in the top 25% of the range have a red background and in the bottom 25% of the range have a green background. The red background is not used when the min value is within 80% of the max value.
| dbms | 256us | 1ms | 4ms | 16ms | 64ms | 256ms | 1s | 4s | 16s | gt | max |
|---|---|---|---|---|---|---|---|---|---|---|---|
| my5651_rel_o2nofp.cz12a_c32r128 | 0.001 | 41.325 | 40.958 | 15.764 | 1.630 | 0.199 | 0.100 | 0.023 | 9.125 | ||
| my5744_rel_o2nofp.cz12a_c32r128 | 80.910 | 15.545 | 2.875 | 0.147 | 0.291 | 0.200 | 0.031 | 6.790 | |||
| my8044_rel_o2nofp.cz12a_c32r128 | 82.768 | 11.338 | 4.260 | 1.126 | 0.131 | 0.291 | 0.086 | 6.978 | |||
| my8407_rel_o2nofp.cz12a_c32r128 | 76.256 | 16.762 | 4.880 | 1.706 | 0.147 | 0.237 | 0.013 | 8.657 | |||
| my9400_rel_o2nofp.cz12a_c32r128 | 71.328 | 20.573 | 5.535 | 2.220 | 0.183 | 0.162 | 3.601 | ||||
| my9500_rel_o2nofp.cz12a_c32r128 | 74.792 | 18.538 | 4.767 | 1.479 | 0.194 | 0.224 | 0.007 | 4.584 | |||
| my9500_rel_o2nofp.cz13a_c32r128 | 75.981 | 17.362 | 4.741 | 1.539 | 0.153 | 0.212 | 0.011 | 5.212 |
Performance metrics for the DBMS listed above. Some are normalized by throughput, others are not. Legend for results is here.
ips	qps	rps	rmbps	wps	wmbps	rpq	rkbpq	wpi	wkbpi	csps	cpups	cspq	cpupq	dbgb1	dbgb2	rss	maxop	p50	p99	tag
5599	54982	13689	211.7	19809.5	466.6	0.249	3.942	3.538	85.346	388338	32.4	7.063	189	737.7	850.8	107.2	7.319	4927	0	my5651_rel_o2nofp.cz12a_c32r128
5328	68776	15227	237.9	19037.2	499.2	0.221	3.542	3.573	95.936	465743	43.0	6.772	200	735.0	847.5	108.7	6.864	6463	0	my5744_rel_o2nofp.cz12a_c32r128
5158	66654	14051	219.5	16464.4	471.6	0.211	3.373	3.192	93.628	467937	44.0	7.020	211	736.3	848.4	108.8	7.857	6127	0	my8044_rel_o2nofp.cz12a_c32r128
5622	65214	13615	212.7	15797.6	452.1	0.209	3.340	2.810	82.351	457125	44.9	7.010	220	735.2	1022.8	108.8	4.202	5823	0	my8407_rel_o2nofp.cz12a_c32r128
5806	66648	13541	211.6	15804.3	452.6	0.203	3.251	2.722	79.824	466588	45.2	7.001	217	735.2	1022.7	108.8	3.462	5919	624	my9400_rel_o2nofp.cz12a_c32r128
5657	63865	13988	218.6	16275.0	465.2	0.219	3.504	2.877	84.200	456891	43.6	7.154	218	716.5	998.7	109.0	4.591	5679	0	my9500_rel_o2nofp.cz12a_c32r128
5654	66957	13794	215.5	16074.5	460.3	0.206	3.296	2.843	83.355	467265	45.2	6.979	216	735.7	1023.4	109.0	4.984	5967	0	my9500_rel_o2nofp.cz13a_c32r128
Average values from iostat.
r/s	rkB/s	rrqm/s	%rrqm	r_await	rareq-s	w/s	wkB/s	wrqm/s	%wrqm	w_await	wareq-s	d/s	dkB/s	drqm/s	%drqm	d_await	dareq-s	f/s	f_await	aqu-sz	%util
13689.0	216752	0.000	0.000	0.378	15.81	19809.5	477825	18.95	0.103	2.654	24.46	0.006	0.027	0.000	0.000	0.166	0.093	4.729	4.468	22.94	98.60		my5651_rel_o2nofp.cz12a_c32r128
15226.9	243631	0.000	0.000	0.527	16.00	19037.2	511149	13.79	0.078	4.714	26.89	0.012	0.059	0.000	0.000	0.288	0.198	3.932	4.945	35.83	99.81		my5744_rel_o2nofp.cz12a_c32r128
14050.8	224812	0.000	0.000	6.835	16.00	16464.4	482887	1.751	0.034	92.75	29.93	0.006	0.040	0.000	0.000	0.193	0.162	6.651	63.88	375.5	99.06		my8044_rel_o2nofp.cz12a_c32r128
13615.0	217839	0.000	0.000	1.188	16.00	15797.6	462979	2.498	0.021	29.46	29.51	0.018	0.150	0.000	0.000	1.184	0.578	6.586	20.01	355.4	99.31		my8407_rel_o2nofp.cz12a_c32r128
13540.8	216653	0.000	0.000	1.421	16.00	15804.3	463488	2.085	0.015	22.79	29.43	0.034	0.187	0.000	0.000	2.238	0.674	6.921	17.41	356.6	99.30		my9400_rel_o2nofp.cz12a_c32r128
13987.7	223803	0.000	0.000	1.060	16.00	16275.0	476354	2.111	0.016	23.69	29.38	0.036	0.563	0.000	0.000	2.811	2.534	7.073	21.24	349.2	99.47		my9500_rel_o2nofp.cz12a_c32r128
13794.0	220704	0.000	0.000	1.376	16.00	16074.5	471324	2.277	0.015	22.55	29.41	0.018	0.145	0.000	0.000	1.079	0.581	6.685	18.05	346.7	99.07		my9500_rel_o2nofp.cz13a_c32r128
qp500.L4
qp500.L4: point queries with 500 insert/s per client. Graphs for performance per 1-second interval are here.
Average throughput:
Query response time histogram: each cell has the percentage of responses that take <= the time in the header and max is the max response time in seconds. For max values in the top 25% of the range have a red background and in the bottom 25% of the range have a green background. The red background is not used when the min value is within 80% of the max value.
| dbms | 256us | 1ms | 4ms | 16ms | 64ms | 256ms | 1s | 4s | 16s | gt | max |
|---|---|---|---|---|---|---|---|---|---|---|---|
| my5651_rel_o2nofp.cz12a_c32r128 | 0.219 | 39.238 | 55.961 | 4.484 | 0.073 | 0.014 | 0.011 | 0.001 | 5.828 | ||
| my5744_rel_o2nofp.cz12a_c32r128 | 0.067 | 31.217 | 64.571 | 3.964 | 0.061 | 0.082 | 0.037 | 0.001 | 5.725 | ||
| my8044_rel_o2nofp.cz12a_c32r128 | 0.294 | 47.413 | 48.301 | 3.676 | 0.248 | 0.022 | 0.036 | 0.008 | 8.168 | ||
| my8407_rel_o2nofp.cz12a_c32r128 | 0.079 | 40.574 | 51.387 | 6.655 | 1.253 | 0.037 | 0.016 | 3.088 | |||
| my9400_rel_o2nofp.cz12a_c32r128 | 0.089 | 40.555 | 51.325 | 6.680 | 1.299 | 0.040 | 0.012 | 2.495 | |||
| my9500_rel_o2nofp.cz12a_c32r128 | 0.101 | 41.810 | 51.485 | 5.750 | 0.796 | 0.034 | 0.023 | 0.002 | 5.006 | ||
| my9500_rel_o2nofp.cz13a_c32r128 | 0.102 | 41.524 | 51.095 | 6.228 | 0.990 | 0.039 | 0.023 | nonzero | 4.169 |
Insert response time histogram: each cell has the percentage of responses that take <= the time in the header and max is the max response time in seconds. For max values in the top 25% of the range have a red background and in the bottom 25% of the range have a green background. The red background is not used when the min value is within 80% of the max value.
| dbms | 256us | 1ms | 4ms | 16ms | 64ms | 256ms | 1s | 4s | 16s | gt | max |
|---|---|---|---|---|---|---|---|---|---|---|---|
| my5651_rel_o2nofp.cz12a_c32r128 | 6.879 | 68.730 | 23.652 | 0.573 | 0.107 | 0.059 | 5.779 | ||||
| my5744_rel_o2nofp.cz12a_c32r128 | 3.972 | 83.869 | 11.398 | 0.250 | 0.336 | 0.175 | 7.381 | ||||
| my8044_rel_o2nofp.cz12a_c32r128 | 10.240 | 74.927 | 14.000 | 0.323 | 0.198 | 0.312 | 9.202 | ||||
| my8407_rel_o2nofp.cz12a_c32r128 | 9.813 | 64.375 | 24.056 | 1.512 | 0.244 | 3.537 | |||||
| my9400_rel_o2nofp.cz12a_c32r128 | 9.447 | 64.113 | 24.572 | 1.680 | 0.188 | 2.903 | |||||
| my9500_rel_o2nofp.cz12a_c32r128 | 8.033 | 70.499 | 20.081 | 1.058 | 0.269 | 0.061 | 5.501 | ||||
| my9500_rel_o2nofp.cz13a_c32r128 | 8.777 | 66.672 | 22.937 | 1.296 | 0.310 | 0.009 | 15.257 |
Delete response time histogram: each cell has the percentage of responses that take <= the time in the header and max is the max response time in seconds. For max values in the top 25% of the range have a red background and in the bottom 25% of the range have a green background. The red background is not used when the min value is within 80% of the max value.
| dbms | 256us | 1ms | 4ms | 16ms | 64ms | 256ms | 1s | 4s | 16s | gt | max |
|---|---|---|---|---|---|---|---|---|---|---|---|
| my5651_rel_o2nofp.cz12a_c32r128 | 23.937 | 57.240 | 17.517 | 1.061 | 0.120 | 0.106 | 0.019 | 5.771 | |||
| my5744_rel_o2nofp.cz12a_c32r128 | 69.857 | 26.219 | 3.244 | 0.138 | 0.252 | 0.256 | 0.033 | 5.999 | |||
| my8044_rel_o2nofp.cz12a_c32r128 | 55.480 | 38.015 | 5.072 | 0.805 | 0.178 | 0.314 | 0.136 | 8.405 | |||
| my8407_rel_o2nofp.cz12a_c32r128 | 49.051 | 40.456 | 7.629 | 2.490 | 0.250 | 0.123 | 2.994 | ||||
| my9400_rel_o2nofp.cz12a_c32r128 | 48.892 | 39.787 | 8.190 | 2.775 | 0.279 | 0.077 | 2.494 | ||||
| my9500_rel_o2nofp.cz12a_c32r128 | 51.299 | 39.283 | 7.057 | 1.906 | 0.217 | 0.213 | 0.025 | 5.295 | |||
| my9500_rel_o2nofp.cz13a_c32r128 | 48.018 | 41.119 | 8.130 | 2.274 | 0.235 | 0.222 | 0.003 | 7.529 |
Performance metrics for the DBMS listed above. Some are normalized by throughput, others are not. Legend for results is here.
ips	qps	rps	rmbps	wps	wmbps	rpq	rkbpq	wpi	wkbpi	csps	cpups	cspq	cpupq	dbgb1	dbgb2	rss	maxop	p50	p99	tag
5729	1908	27721	430.9	22842.9	443.1	14.533	231.333	3.987	79.198	163398	17.6	85.661	2953	737.7	850.8	107.3	5.828	160	0	my5651_rel_o2nofp.cz12a_c32r128
5304	1652	27060	422.8	17841.4	477.6	16.382	262.110	3.363	92.205	114419	11.1	69.269	2150	735.0	847.5	108.7	5.725	160	0	my5744_rel_o2nofp.cz12a_c32r128
5005	1753	26609	415.8	15944.9	450.7	15.181	242.892	3.186	92.227	134906	11.0	76.966	2008	736.3	848.6	108.8	8.168	176	0	my8044_rel_o2nofp.cz12a_c32r128
5800	1467	22973	358.9	14640.9	412.3	15.661	250.572	2.524	72.796	121270	10.9	82.671	2378	735.2	1024.2	108.8	3.088	128	0	my8407_rel_o2nofp.cz12a_c32r128
5835	1472	22977	359.0	14559.2	410.6	15.609	249.750	2.495	72.067	121739	10.9	82.703	2370	735.2	1024.1	108.8	2.495	128	0	my9400_rel_o2nofp.cz12a_c32r128
5640	1570	24157	377.4	14925.6	420.3	15.385	246.167	2.647	76.319	126213	11.1	80.385	2262	716.5	999.8	109.0	5.006	144	0	my9500_rel_o2nofp.cz12a_c32r128
5681	1514	23553	368.0	14833.5	418.1	15.561	248.971	2.611	75.360	123033	11.1	81.285	2347	735.7	1024.7	109.0	4.169	128	0	my9500_rel_o2nofp.cz13a_c32r128
Average values from iostat.
r/s	rkB/s	rrqm/s	%rrqm	r_await	rareq-s	w/s	wkB/s	wrqm/s	%wrqm	w_await	wareq-s	d/s	dkB/s	drqm/s	%drqm	d_await	dareq-s	f/s	f_await	aqu-sz	%util
27721.0	441267	0.000	0.000	0.395	15.91	22842.9	453756	15.15	0.072	0.808	20.38	0.007	0.034	0.000	0.000	0.196	0.127	3.851	3.838	22.11	99.55		my5651_rel_o2nofp.cz12a_c32r128
27059.6	432954	0.000	0.000	0.543	16.00	17841.4	489100	14.23	0.088	3.724	27.49	0.009	0.045	0.000	0.000	0.412	0.187	3.512	5.105	43.20	100.00		my5744_rel_o2nofp.cz12a_c32r128
26608.8	425741	0.000	0.000	5.988	16.00	15944.9	461561	2.206	0.042	91.37	29.27	0.006	0.030	0.000	0.000	0.265	0.111	4.874	55.36	347.8	100.00		my8044_rel_o2nofp.cz12a_c32r128
22972.8	367565	0.000	0.000	0.847	16.00	14640.9	422233	2.904	0.020	22.60	28.85	0.026	0.222	0.000	0.000	1.856	0.946	5.571	16.33	333.0	100.00		my8407_rel_o2nofp.cz12a_c32r128
22977.0	367632	0.000	0.000	0.792	16.00	14559.2	420483	2.505	0.017	22.08	28.89	0.012	0.108	0.000	0.000	0.635	0.405	5.654	15.77	331.8	100.00		my9400_rel_o2nofp.cz12a_c32r128
24156.7	386507	0.000	0.000	0.837	16.00	14925.6	430407	2.655	0.020	24.05	28.85	0.039	0.595	0.000	0.000	2.098	2.691	5.381	22.09	324.4	100.00		my9500_rel_o2nofp.cz12a_c32r128
23552.7	376843	0.000	0.000	1.222	16.00	14833.5	428137	2.885	0.022	25.99	28.88	0.019	0.280	0.000	0.000	1.466	1.268	5.472	19.22	324.1	100.00		my9500_rel_o2nofp.cz13a_c32r128
qr1000.L5
qr1000.L5: range queries with 1000 insert/s per client. Graphs for performance per 1-second interval are here.
Average throughput:
Query response time histogram: each cell has the percentage of responses that take <= the time in the header and max is the max response time in seconds. For max values in the top 25% of the range have a red background and in the bottom 25% of the range have a green background. The red background is not used when the min value is within 80% of the max value.
| dbms | 256us | 1ms | 4ms | 16ms | 64ms | 256ms | 1s | 4s | 16s | gt | max |
|---|---|---|---|---|---|---|---|---|---|---|---|
| my5651_rel_o2nofp.cz12a_c32r128 | 90.174 | 6.785 | 2.626 | 0.368 | 0.044 | 0.001 | 0.002 | 0.001 | nonzero | 7.152 | |
| my5744_rel_o2nofp.cz12a_c32r128 | 91.682 | 5.840 | 2.286 | 0.160 | 0.028 | 0.002 | 0.002 | 0.001 | nonzero | 5.422 | |
| my8044_rel_o2nofp.cz12a_c32r128 | 70.077 | 27.729 | 2.095 | 0.053 | 0.040 | 0.004 | 0.001 | 0.001 | nonzero | 8.088 | |
| my8407_rel_o2nofp.cz12a_c32r128 | 64.299 | 32.840 | 2.711 | 0.076 | 0.061 | 0.013 | 0.001 | nonzero | 2.982 | ||
| my9400_rel_o2nofp.cz12a_c32r128 | 64.484 | 32.488 | 2.872 | 0.078 | 0.064 | 0.014 | 0.001 | nonzero | 3.251 | ||
| my9500_rel_o2nofp.cz12a_c32r128 | 65.646 | 31.694 | 2.535 | 0.065 | 0.050 | 0.009 | nonzero | nonzero | 3.026 | ||
| my9500_rel_o2nofp.cz13a_c32r128 | 65.157 | 31.998 | 2.696 | 0.075 | 0.061 | 0.012 | 0.001 | nonzero | 2.852 |
Insert response time histogram: each cell has the percentage of responses that take <= the time in the header and max is the max response time in seconds. For max values in the top 25% of the range have a red background and in the bottom 25% of the range have a green background. The red background is not used when the min value is within 80% of the max value.
| dbms | 256us | 1ms | 4ms | 16ms | 64ms | 256ms | 1s | 4s | 16s | gt | max |
|---|---|---|---|---|---|---|---|---|---|---|---|
| my5651_rel_o2nofp.cz12a_c32r128 | 0.007 | 17.353 | 66.263 | 8.187 | 7.893 | 0.209 | 0.088 | 8.420 | |||
| my5744_rel_o2nofp.cz12a_c32r128 | 0.007 | 20.646 | 69.896 | 8.817 | 0.357 | 0.234 | 0.044 | 6.831 | |||
| my8044_rel_o2nofp.cz12a_c32r128 | 0.018 | 37.214 | 53.944 | 8.194 | 0.366 | 0.135 | 0.130 | 8.376 | |||
| my8407_rel_o2nofp.cz12a_c32r128 | 0.019 | 28.815 | 49.784 | 19.854 | 1.400 | 0.128 | 3.578 | ||||
| my9400_rel_o2nofp.cz12a_c32r128 | 0.019 | 26.626 | 47.666 | 23.812 | 1.793 | 0.078 | 0.005 | 6.454 | |||
| my9500_rel_o2nofp.cz12a_c32r128 | 1.518 | 10.671 | 79.851 | 7.597 | 0.363 | 3.381 | |||||
| my9500_rel_o2nofp.cz13a_c32r128 | 0.017 | 28.156 | 51.233 | 19.220 | 1.278 | 0.096 | 3.331 |
Delete response time histogram: each cell has the percentage of responses that take <= the time in the header and max is the max response time in seconds. For max values in the top 25% of the range have a red background and in the bottom 25% of the range have a green background. The red background is not used when the min value is within 80% of the max value.
| dbms | 256us | 1ms | 4ms | 16ms | 64ms | 256ms | 1s | 4s | 16s | gt | max |
|---|---|---|---|---|---|---|---|---|---|---|---|
| my5651_rel_o2nofp.cz12a_c32r128 | 24.386 | 52.902 | 13.780 | 0.789 | 7.982 | 0.140 | 0.021 | 7.969 | |||
| my5744_rel_o2nofp.cz12a_c32r128 | 67.395 | 27.142 | 4.873 | 0.215 | 0.266 | 0.102 | 0.007 | 6.720 | |||
| my8044_rel_o2nofp.cz12a_c32r128 | 56.970 | 36.244 | 5.244 | 1.263 | 0.127 | 0.105 | 0.046 | 8.172 | |||
| my8407_rel_o2nofp.cz12a_c32r128 | 41.302 | 29.173 | 22.564 | 6.656 | 0.254 | 0.052 | 3.521 | ||||
| my9400_rel_o2nofp.cz12a_c32r128 | 39.249 | 27.247 | 23.955 | 9.201 | 0.314 | 0.034 | nonzero | 4.848 | |||
| my9500_rel_o2nofp.cz12a_c32r128 | 4.891 | 2.864 | 24.741 | 66.391 | 1.024 | 0.090 | 3.199 | ||||
| my9500_rel_o2nofp.cz13a_c32r128 | 42.056 | 29.964 | 21.886 | 5.798 | 0.254 | 0.042 | 3.014 |
Performance metrics for the DBMS listed above. Some are normalized by throughput, others are not. Legend for results is here.
ips	qps	rps	rmbps	wps	wmbps	rpq	rkbpq	wpi	wkbpi	csps	cpups	cspq	cpupq	dbgb1	dbgb2	rss	maxop	p50	p99	tag
7619	44094	11564	177.8	18712.2	468.7	0.262	4.128	2.456	62.995	327480	34.4	7.427	250	737.7	850.8	107.3	7.152	4143	0	my5651_rel_o2nofp.cz12a_c32r128
10445	47149	12632	197.4	18764.4	496.7	0.268	4.287	1.797	48.697	343920	41.7	7.294	283	735.0	847.5	108.7	5.422	4303	0	my5744_rel_o2nofp.cz12a_c32r128
10023	40932	12018	187.8	16414.8	471.9	0.294	4.698	1.638	48.207	325546	41.8	7.953	327	736.3	849.6	108.8	8.088	3743	0	my8044_rel_o2nofp.cz12a_c32r128
9954	38162	11132	173.9	15577.9	447.6	0.292	4.667	1.565	46.052	313607	43.3	8.218	363	735.2	1027.5	108.8	2.982	3168	624	my8407_rel_o2nofp.cz12a_c32r128
9515	37761	10853	169.6	15283.7	439.3	0.287	4.599	1.606	47.278	310387	42.7	8.220	362	735.2	1027.4	108.8	3.251	3248	672	my9400_rel_o2nofp.cz12a_c32r128
4375	43199	11768	183.9	15877.6	451.1	0.272	4.359	3.629	105.580	345893	41.0	8.007	304	716.5	1001.9	109.0	3.026	3712	1088	my9500_rel_o2nofp.cz12a_c32r128
10189	38857	11221	175.3	15489.0	445.6	0.289	4.621	1.520	44.784	316554	43.4	8.147	357	735.7	1028.1	109.0	2.852	3295	1072	my9500_rel_o2nofp.cz13a_c32r128
Average values from iostat.
r/s	rkB/s	rrqm/s	%rrqm	r_await	rareq-s	w/s	wkB/s	wrqm/s	%wrqm	w_await	wareq-s	d/s	dkB/s	drqm/s	%drqm	d_await	dareq-s	f/s	f_await	aqu-sz	%util
11564.5	182029	0.000	0.000	0.398	15.71	18712.2	479957	26.57	0.154	6.402	25.95	0.011	0.055	0.000	0.000	0.298	0.201	6.661	3.911	23.52	98.83		my5651_rel_o2nofp.cz12a_c32r128
12632.0	202113	0.000	0.000	0.570	16.00	18764.4	508632	21.46	0.121	3.917	27.17	0.019	0.108	0.000	0.000	0.565	0.378	5.268	4.592	37.59	99.92		my5744_rel_o2nofp.cz12a_c32r128
12017.6	192282	0.000	0.000	15.71	16.00	16414.8	483190	2.230	0.046	124.0	29.84	0.011	0.071	0.000	0.000	4.314	0.269	7.187	69.15	406.4	99.54		my8044_rel_o2nofp.cz12a_c32r128
11131.7	178106	0.000	0.000	1.263	16.00	15577.9	458393	2.800	0.018	25.08	29.43	0.025	0.258	0.000	0.000	1.401	0.854	7.372	18.27	393.8	99.86		my8407_rel_o2nofp.cz12a_c32r128
10853.4	173654	0.000	0.000	1.381	16.00	15283.7	449870	2.379	0.016	25.75	29.44	0.021	0.365	0.000	0.000	1.226	1.507	7.445	18.66	397.7	99.87		my9400_rel_o2nofp.cz12a_c32r128
11767.6	188282	0.000	0.000	1.539	16.00	15877.6	461924	2.197	0.014	26.14	29.10	0.035	0.554	0.000	0.000	2.716	2.469	6.901	20.26	421.8	99.96		my9500_rel_o2nofp.cz12a_c32r128
11221.3	179541	0.000	0.000	1.286	16.00	15489.0	456287	2.177	0.015	25.18	29.47	0.023	0.285	0.000	0.000	1.633	1.028	7.199	17.89	396.8	99.85		my9500_rel_o2nofp.cz13a_c32r128
qp1000.L6
qp1000.L6: point queries with 1000 insert/s per client. Graphs for performance per 1-second interval are here.
Average throughput:
Query response time histogram: each cell has the percentage of responses that take <= the time in the header and max is the max response time in seconds. For max values in the top 25% of the range have a red background and in the bottom 25% of the range have a green background. The red background is not used when the min value is within 80% of the max value.
| dbms | 256us | 1ms | 4ms | 16ms | 64ms | 256ms | 1s | 4s | 16s | gt | max |
|---|---|---|---|---|---|---|---|---|---|---|---|
| my5651_rel_o2nofp.cz12a_c32r128 | nonzero | 2.520 | 55.540 | 39.745 | 2.173 | 0.018 | 0.002 | 0.001 | nonzero | 7.646 | |
| my5744_rel_o2nofp.cz12a_c32r128 | nonzero | 0.522 | 49.149 | 48.456 | 1.781 | 0.039 | 0.038 | 0.015 | nonzero | 4.591 | |
| my8044_rel_o2nofp.cz12a_c32r128 | 0.209 | 49.472 | 46.560 | 3.480 | 0.212 | 0.021 | 0.040 | 0.005 | 8.299 | ||
| my8407_rel_o2nofp.cz12a_c32r128 | nonzero | 0.150 | 47.015 | 46.726 | 5.346 | 0.734 | 0.021 | 0.008 | 3.375 | ||
| my9400_rel_o2nofp.cz12a_c32r128 | 0.175 | 47.210 | 46.347 | 5.418 | 0.820 | 0.023 | 0.006 | nonzero | 5.008 | ||
| my9500_rel_o2nofp.cz12a_c32r128 | 0.145 | 45.936 | 47.443 | 5.601 | 0.839 | 0.028 | 0.008 | 3.067 | |||
| my9500_rel_o2nofp.cz13a_c32r128 | 0.166 | 47.348 | 46.293 | 5.380 | 0.782 | 0.024 | 0.007 | 3.512 |
Insert response time histogram: each cell has the percentage of responses that take <= the time in the header and max is the max response time in seconds. For max values in the top 25% of the range have a red background and in the bottom 25% of the range have a green background. The red background is not used when the min value is within 80% of the max value.
| dbms | 256us | 1ms | 4ms | 16ms | 64ms | 256ms | 1s | 4s | 16s | gt | max |
|---|---|---|---|---|---|---|---|---|---|---|---|
| my5651_rel_o2nofp.cz12a_c32r128 | 1.905 | 24.860 | 10.002 | 63.138 | 0.082 | 0.013 | 10.735 | ||||
| my5744_rel_o2nofp.cz12a_c32r128 | nonzero | 6.096 | 49.121 | 4.990 | 39.187 | 0.566 | 0.040 | 5.582 | |||
| my8044_rel_o2nofp.cz12a_c32r128 | nonzero | 1.902 | 14.410 | 82.348 | 0.777 | 0.226 | 0.338 | 9.298 | |||
| my8407_rel_o2nofp.cz12a_c32r128 | 0.857 | 91.786 | 7.109 | 0.247 | 0.002 | 5.484 | |||||
| my9400_rel_o2nofp.cz12a_c32r128 | 0.677 | 90.669 | 8.461 | 0.170 | 0.024 | 6.644 | |||||
| my9500_rel_o2nofp.cz12a_c32r128 | 83.350 | 16.335 | 0.314 | 3.311 | |||||||
| my9500_rel_o2nofp.cz13a_c32r128 | 0.897 | 91.354 | 7.506 | 0.239 | 0.003 | 5.959 |
Delete response time histogram: each cell has the percentage of responses that take <= the time in the header and max is the max response time in seconds. For max values in the top 25% of the range have a red background and in the bottom 25% of the range have a green background. The red background is not used when the min value is within 80% of the max value.
| dbms | 256us | 1ms | 4ms | 16ms | 64ms | 256ms | 1s | 4s | 16s | gt | max |
|---|---|---|---|---|---|---|---|---|---|---|---|
| my5651_rel_o2nofp.cz12a_c32r128 | 3.810 | 23.265 | 9.325 | 0.467 | 63.107 | 0.026 | 0.002 | 6.776 | |||
| my5744_rel_o2nofp.cz12a_c32r128 | 35.713 | 21.563 | 2.830 | 0.139 | 39.636 | 0.119 | 0.001 | 4.676 | |||
| my8044_rel_o2nofp.cz12a_c32r128 | 2.349 | 4.158 | 22.504 | 70.613 | 0.171 | 0.144 | 0.061 | 9.023 | |||
| my8407_rel_o2nofp.cz12a_c32r128 | 6.370 | 92.701 | 0.862 | 0.067 | 3.249 | ||||||
| my9400_rel_o2nofp.cz12a_c32r128 | 5.660 | 93.244 | 1.044 | 0.046 | 0.006 | 5.574 | |||||
| my9500_rel_o2nofp.cz12a_c32r128 | 0.028 | 98.826 | 1.082 | 0.065 | 2.921 | ||||||
| my9500_rel_o2nofp.cz13a_c32r128 | 6.730 | 92.280 | 0.930 | 0.059 | 0.001 | 5.160 |
Performance metrics for the DBMS listed above. Some are normalized by throughput, others are not. Legend for results is here.
ips	qps	rps	rmbps	wps	wmbps	rpq	rkbpq	wpi	wkbpi	csps	cpups	cspq	cpupq	dbgb1	dbgb2	rss	maxop	p50	p99	tag
2589	2793	32150	501.3	19944.0	381.7	11.512	183.807	7.702	150.968	170945	20.0	61.209	2292	737.7	850.9	107.3	7.646	240	48	my5651_rel_o2nofp.cz12a_c32r128
3731	2362	32913	514.3	17505.3	482.8	13.932	222.912	4.692	132.513	126764	12.4	53.659	1680	735.0	847.5	108.7	4.591	208	0	my5744_rel_o2nofp.cz12a_c32r128
4479	1841	27702	432.9	15822.6	446.6	15.049	240.786	3.532	102.100	149732	13.2	81.341	2295	736.3	850.7	108.8	8.299	192	0	my8044_rel_o2nofp.cz12a_c32r128
3659	1799	26400	412.5	14775.5	414.2	14.675	234.797	4.038	115.911	138725	12.3	77.112	2188	735.2	1030.6	108.8	3.375	160	0	my8407_rel_o2nofp.cz12a_c32r128
3532	1764	25811	403.3	14346.2	402.5	14.629	234.063	4.062	116.695	135037	11.9	76.534	2158	735.2	1030.5	108.8	5.008	160	0	my9400_rel_o2nofp.cz12a_c32r128
2906	1732	26152	408.6	14822.8	414.2	15.100	241.606	5.101	145.947	134135	11.0	77.450	2032	716.5	1004.1	109.0	3.067	144	16	my9500_rel_o2nofp.cz12a_c32r128
3642	1787	26135	408.4	14592.4	409.3	14.622	233.952	4.007	115.076	137297	12.1	76.814	2166	735.7	1031.2	109.0	3.512	160	16	my9500_rel_o2nofp.cz13a_c32r128
Average values from iostat.
r/s	rkB/s	rrqm/s	%rrqm	r_await	rareq-s	w/s	wkB/s	wrqm/s	%wrqm	w_await	wareq-s	d/s	dkB/s	drqm/s	%drqm	d_await	dareq-s	f/s	f_await	aqu-sz	%util
32149.6	513337	0.000	0.000	0.304	15.97	19944.0	390902	10.70	0.058	0.632	20.24	0.010	0.098	0.000	0.000	0.240	0.404	2.776	3.718	16.26	99.10		my5651_rel_o2nofp.cz12a_c32r128
32913.0	526608	0.000	0.000	0.491	16.00	17505.3	494431	13.91	0.081	1.544	28.26	0.008	0.039	0.000	0.000	0.208	0.162	3.697	4.700	38.40	100.00		my5744_rel_o2nofp.cz12a_c32r128
27702.5	443240	0.000	0.000	9.648	16.00	15822.6	457346	2.464	0.042	90.66	29.19	0.007	0.044	0.000	0.000	0.306	0.187	5.094	69.28	354.9	100.00		my8044_rel_o2nofp.cz12a_c32r128
26400.0	422399	0.000	0.000	0.724	16.00	14775.5	424129	3.392	0.023	20.92	28.71	0.013	0.119	0.000	0.000	0.848	0.492	5.504	14.39	319.9	100.00		my8407_rel_o2nofp.cz12a_c32r128
25811.3	412981	0.000	0.000	0.766	16.00	14346.2	412191	2.747	0.020	22.05	28.73	0.012	0.192	0.000	0.000	0.842	0.867	5.479	15.91	320.4	100.00		my9400_rel_o2nofp.cz12a_c32r128
26152.3	418437	0.000	0.000	0.761	16.00	14822.8	424106	2.867	0.020	21.01	28.61	0.030	0.271	0.000	0.000	2.574	1.246	5.312	14.31	324.3	100.00		my9500_rel_o2nofp.cz12a_c32r128
26135.3	418165	0.000	0.000	0.716	16.00	14592.4	419083	3.194	0.022	21.50	28.72	0.014	0.144	0.000	0.000	1.080	0.624	5.525	14.59	321.5	100.00		my9500_rel_o2nofp.cz13a_c32r128
l.i0
l.i0: load without secondary indexes
Performance metrics for all DBMS, not just the ones listed above. Some are normalized by throughput, others are not. Legend for results is here.
ips	qps	rps	rmbps	wps	wmbps	rpq	rkbpq	wpi	wkbpi	csps	cpups	cspq	cpupq	dbgb1	dbgb2	rss	maxop	p50	p99	tag
525241	0	3032	11.8	3393.4	186.9	0.006	0.023	0.006	0.364	81529	41.9	0.155	26	236.8	337.3	107.2	3.052	43895	21697	my5651_rel_o2nofp.cz12a_c32r128
671016	0	1	0.0	4373.7	239.9	0.000	0.000	0.007	0.366	85410	42.4	0.127	20	236.8	337.3	108.5	3.714	60993	8798	my5744_rel_o2nofp.cz12a_c32r128
824553	0	1	0.0	5489.6	306.6	0.000	0.000	0.007	0.381	146719	47.5	0.178	18	235.9	336.6	108.7	3.141	76190	12198	my8044_rel_o2nofp.cz12a_c32r128
808444	0	1	0.0	5376.7	300.5	0.000	0.000	0.007	0.381	144068	46.8	0.178	19	235.9	503.7	108.7	3.564	74791	5499	my8407_rel_o2nofp.cz12a_c32r128
811725	0	1	0.0	5411.0	301.9	0.000	0.000	0.007	0.381	144658	47.3	0.178	19	235.9	503.7	108.7	1.858	74890	14398	my9400_rel_o2nofp.cz12a_c32r128
806090	0	1	0.0	5389.3	302.4	0.000	0.000	0.007	0.384	152219	47.6	0.189	19	235.9	503.7	108.9	1.682	74391	17298	my9500_rel_o2nofp.cz12a_c32r128
804829	0	1	0.0	5364.5	299.5	0.000	0.000	0.007	0.381	143169	47.3	0.178	19	235.9	503.7	108.9	2.450	75389	3400	my9500_rel_o2nofp.cz13a_c32r128
l.x
l.x: create secondary indexes
Performance metrics for all DBMS, not just the ones listed above. Some are normalized by throughput, others are not. Legend for results is here.
ips	qps	rps	rmbps	wps	wmbps	rpq	rkbpq	wpi	wkbpi	csps	cpups	cspq	cpupq	dbgb1	dbgb2	rss	maxop	p50	p99	tag
340748	0	3606	310.6	6230.2	435.7	0.011	0.933	0.018	1.309	16524	25.5	0.048	24	501.5	602.0	107.7	0.047	NA	NA	my5651_rel_o2nofp.cz12a_c32r128
972973	0	9739	881.0	15657.6	1081.8	0.010	0.927	0.016	1.139	60176	20.5	0.062	7	545.2	645.7	109.1	0.025	NA	NA	my5744_rel_o2nofp.cz12a_c32r128
508978	0	6847	665.6	15857.7	745.7	0.013	1.339	0.031	1.500	62770	26.3	0.123	17	543.1	643.8	109.0	0.004	NA	NA	my8044_rel_o2nofp.cz12a_c32r128
491803	0	6606	643.9	15345.5	720.8	0.013	1.341	0.031	1.501	73922	26.7	0.150	17	543.1	810.9	109.0	0.002	NA	NA	my8407_rel_o2nofp.cz12a_c32r128
493016	0	6621	645.2	15377.6	722.3	0.013	1.340	0.031	1.500	66651	25.8	0.135	17	543.1	810.9	109.0	0.005	NA	NA	my9400_rel_o2nofp.cz12a_c32r128
495186	0	6652	648.2	15450.3	725.5	0.013	1.340	0.031	1.500	74275	25.9	0.150	17	543.1	810.9	109.2	0.008	NA	NA	my9500_rel_o2nofp.cz12a_c32r128
496483	0	6667	650.0	15483.4	727.5	0.013	1.341	0.031	1.500	70590	25.7	0.142	17	543.1	810.9	109.2	0.002	NA	NA	my9500_rel_o2nofp.cz13a_c32r128
l.i1
l.i1: continue load after secondary indexes created with 50 inserts per transaction
Performance metrics for all DBMS, not just the ones listed above. Some are normalized by throughput, others are not. Legend for results is here.
ips	qps	rps	rmbps	wps	wmbps	rpq	rkbpq	wpi	wkbpi	csps	cpups	cspq	cpupq	dbgb1	dbgb2	rss	maxop	p50	p99	tag
5561	0	11062	170.7	19016.2	496.4	1.989	31.441	3.420	91.417	79151	8.7	14.234	501	737.7	850.8	107.3	23.878	250	0	my5651_rel_o2nofp.cz12a_c32r128
5869	0	11643	181.9	18433.0	503.6	1.984	31.743	3.141	87.868	85672	9.6	14.598	523	735.0	847.5	108.6	13.787	250	0	my5744_rel_o2nofp.cz12a_c32r128
5932	0	10495	164.0	15625.4	470.2	1.769	28.306	2.634	81.169	104335	9.9	17.587	534	736.3	850.4	108.9	11.689	350	0	my8044_rel_o2nofp.cz12a_c32r128
5859	0	10470	163.6	15649.3	470.1	1.787	28.591	2.671	82.159	104559	9.9	17.845	541	735.2	1020.9	108.9	11.448	400	0	my8407_rel_o2nofp.cz12a_c32r128
5905	0	10525	164.5	15742.3	473.4	1.783	28.520	2.666	82.097	105260	10.0	17.826	542	735.2	1020.8	108.9	12.418	400	0	my9400_rel_o2nofp.cz12a_c32r128
3838	0	11205	175.1	16039.0	471.9	2.919	46.710	4.179	125.901	104375	8.9	27.195	742	716.5	994.9	109.0	11.007	300	0	my9500_rel_o2nofp.cz12a_c32r128
5930	0	10560	165.0	15730.2	473.0	1.781	28.491	2.653	81.677	105143	10.0	17.730	540	735.7	1021.5	109.0	12.189	400	0	my9500_rel_o2nofp.cz13a_c32r128
l.i2
l.i2: continue load after secondary indexes created with 5 inserts per transaction
Performance metrics for all DBMS, not just the ones listed above. Some are normalized by throughput, others are not. Legend for results is here.
ips	qps	rps	rmbps	wps	wmbps	rpq	rkbpq	wpi	wkbpi	csps	cpups	cspq	cpupq	dbgb1	dbgb2	rss	maxop	p50	p99	tag
1364	0	12276	187.5	18075.2	457.9	8.997	140.724	13.248	343.665	75788	7.1	55.547	1665	737.7	850.8	107.2	6.535	75	0	my5651_rel_o2nofp.cz12a_c32r128
1557	0	13111	204.9	18151.0	495.1	8.423	134.761	11.661	325.671	77997	8.3	50.107	1706	735.0	847.5	108.6	6.066	85	0	my5744_rel_o2nofp.cz12a_c32r128
1404	0	12681	198.1	16757.6	475.4	9.035	144.556	11.939	346.841	108724	8.7	77.461	1983	736.3	848.4	108.9	8.974	80	0	my8044_rel_o2nofp.cz12a_c32r128
1269	0	11607	181.4	15464.4	437.7	9.147	146.357	12.187	353.188	100467	8.2	79.176	2068	735.2	1021.3	108.9	5.639	75	0	my8407_rel_o2nofp.cz12a_c32r128
1254	0	11483	179.4	15279.3	432.8	9.161	146.572	12.189	353.580	99153	8.1	79.101	2068	735.2	1021.2	108.9	6.009	75	0	my9400_rel_o2nofp.cz12a_c32r128
1888	0	11733	183.3	16017.3	455.0	6.216	99.455	8.486	246.844	112642	9.1	59.675	1543	716.5	997.2	109.0	3.726	110	0	my9500_rel_o2nofp.cz12a_c32r128
1289	0	11846	185.1	15761.8	446.3	9.192	147.071	12.231	354.666	102043	8.4	79.183	2086	735.7	1021.9	109.0	5.919	75	0	my9500_rel_o2nofp.cz13a_c32r128
qr100.L1
qr100.L1: range queries with 100 insert/s per client
Performance metrics for all DBMS, not just the ones listed above. Some are normalized by throughput, others are not. Legend for results is here.
ips	qps	rps	rmbps	wps	wmbps	rpq	rkbpq	wpi	wkbpi	csps	cpups	cspq	cpupq	dbgb1	dbgb2	rss	maxop	p50	p99	tag
1193	109827	5634	87.5	4520.8	130.2	0.051	0.816	3.790	111.787	646835	39.3	5.890	115	737.7	850.8	107.2	0.152	9327	7423	my5651_rel_o2nofp.cz12a_c32r128
1193	94284	5574	87.1	4849.7	139.5	0.059	0.946	4.066	119.809	554737	40.4	5.884	137	735.0	847.5	108.7	0.066	7967	4816	my5744_rel_o2nofp.cz12a_c32r128
1193	86332	5109	79.8	4950.6	142.4	0.059	0.947	4.151	122.229	517321	40.9	5.992	152	736.3	848.4	108.8	0.094	7263	7119	my8044_rel_o2nofp.cz12a_c32r128
1193	83544	5133	80.2	5277.8	151.3	0.061	0.983	4.425	129.858	503318	40.7	6.025	156	735.2	1021.6	108.8	0.718	7039	6239	my8407_rel_o2nofp.cz12a_c32r128
1193	86486	5125	80.1	5435.6	155.8	0.059	0.948	4.557	133.726	519572	41.0	6.008	152	735.2	1021.4	108.8	0.533	7263	7038	my9400_rel_o2nofp.cz12a_c32r128
1193	85684	4947	77.3	4560.8	131.1	0.058	0.924	3.824	112.550	512294	40.8	5.979	152	716.5	997.4	109.0	0.651	7215	6943	my9500_rel_o2nofp.cz12a_c32r128
1193	84966	5129	80.1	5320.6	152.5	0.060	0.966	4.461	130.927	511314	40.7	6.018	153	735.7	1022.1	109.0	0.762	7183	5999	my9500_rel_o2nofp.cz13a_c32r128
qp100.L2
qp100.L2: point queries with 100 insert/s per client
Performance metrics for all DBMS, not just the ones listed above. Some are normalized by throughput, others are not. Legend for results is here.
ips	qps	rps	rmbps	wps	wmbps	rpq	rkbpq	wpi	wkbpi	csps	cpups	cspq	cpupq	dbgb1	dbgb2	rss	maxop	p50	p99	tag
1191	4053	35684	557.1	14254.7	310.9	8.804	140.741	11.966	267.201	143684	18.3	35.450	1445	737.7	850.8	107.2	6.726	352	48	my5651_rel_o2nofp.cz12a_c32r128
1191	6360	49427	772.3	13227.8	324.9	7.772	124.347	11.104	279.264	164231	10.4	25.823	523	735.0	847.5	108.7	3.550	560	0	my5744_rel_o2nofp.cz12a_c32r128
1181	6722	51303	801.6	11640.8	325.7	7.632	122.108	9.858	282.459	180478	11.3	26.848	538	736.3	848.4	108.8	5.866	608	0	my8044_rel_o2nofp.cz12a_c32r128
1192	6414	49743	777.2	11807.2	329.9	7.755	124.076	9.905	283.438	174014	11.4	27.128	569	735.2	1021.8	108.8	4.166	528	0	my8407_rel_o2nofp.cz12a_c32r128
1192	6304	49059	766.5	11785.5	329.7	7.782	124.519	9.887	283.253	169650	11.2	26.912	569	735.2	1021.6	108.8	4.043	528	48	my9400_rel_o2nofp.cz12a_c32r128
1189	6684	51012	797.1	11471.5	320.2	7.632	122.117	9.645	275.641	179729	11.5	26.891	551	716.5	997.6	109.0	4.883	544	0	my9500_rel_o2nofp.cz12a_c32r128
1193	6459	49982	781.0	11798.6	329.9	7.739	123.816	9.892	283.210	173595	11.4	26.877	565	735.7	1022.3	109.0	3.648	528	0	my9500_rel_o2nofp.cz13a_c32r128
qr500.L3
qr500.L3: range queries with 500 insert/s per client
Performance metrics for all DBMS, not just the ones listed above. Some are normalized by throughput, others are not. Legend for results is here.
ips	qps	rps	rmbps	wps	wmbps	rpq	rkbpq	wpi	wkbpi	csps	cpups	cspq	cpupq	dbgb1	dbgb2	rss	maxop	p50	p99	tag
5599	54982	13689	211.7	19809.5	466.6	0.249	3.942	3.538	85.346	388338	32.4	7.063	189	737.7	850.8	107.2	7.319	4927	0	my5651_rel_o2nofp.cz12a_c32r128
5328	68776	15227	237.9	19037.2	499.2	0.221	3.542	3.573	95.936	465743	43.0	6.772	200	735.0	847.5	108.7	6.864	6463	0	my5744_rel_o2nofp.cz12a_c32r128
5158	66654	14051	219.5	16464.4	471.6	0.211	3.373	3.192	93.628	467937	44.0	7.020	211	736.3	848.4	108.8	7.857	6127	0	my8044_rel_o2nofp.cz12a_c32r128
5622	65214	13615	212.7	15797.6	452.1	0.209	3.340	2.810	82.351	457125	44.9	7.010	220	735.2	1022.8	108.8	4.202	5823	0	my8407_rel_o2nofp.cz12a_c32r128
5806	66648	13541	211.6	15804.3	452.6	0.203	3.251	2.722	79.824	466588	45.2	7.001	217	735.2	1022.7	108.8	3.462	5919	624	my9400_rel_o2nofp.cz12a_c32r128
5657	63865	13988	218.6	16275.0	465.2	0.219	3.504	2.877	84.200	456891	43.6	7.154	218	716.5	998.7	109.0	4.591	5679	0	my9500_rel_o2nofp.cz12a_c32r128
5654	66957	13794	215.5	16074.5	460.3	0.206	3.296	2.843	83.355	467265	45.2	6.979	216	735.7	1023.4	109.0	4.984	5967	0	my9500_rel_o2nofp.cz13a_c32r128
qp500.L4
qp500.L4: point queries with 500 insert/s per client
Performance metrics for all DBMS, not just the ones listed above. Some are normalized by throughput, others are not. Legend for results is here.
ips	qps	rps	rmbps	wps	wmbps	rpq	rkbpq	wpi	wkbpi	csps	cpups	cspq	cpupq	dbgb1	dbgb2	rss	maxop	p50	p99	tag
5729	1908	27721	430.9	22842.9	443.1	14.533	231.333	3.987	79.198	163398	17.6	85.661	2953	737.7	850.8	107.3	5.828	160	0	my5651_rel_o2nofp.cz12a_c32r128
5304	1652	27060	422.8	17841.4	477.6	16.382	262.110	3.363	92.205	114419	11.1	69.269	2150	735.0	847.5	108.7	5.725	160	0	my5744_rel_o2nofp.cz12a_c32r128
5005	1753	26609	415.8	15944.9	450.7	15.181	242.892	3.186	92.227	134906	11.0	76.966	2008	736.3	848.6	108.8	8.168	176	0	my8044_rel_o2nofp.cz12a_c32r128
5800	1467	22973	358.9	14640.9	412.3	15.661	250.572	2.524	72.796	121270	10.9	82.671	2378	735.2	1024.2	108.8	3.088	128	0	my8407_rel_o2nofp.cz12a_c32r128
5835	1472	22977	359.0	14559.2	410.6	15.609	249.750	2.495	72.067	121739	10.9	82.703	2370	735.2	1024.1	108.8	2.495	128	0	my9400_rel_o2nofp.cz12a_c32r128
5640	1570	24157	377.4	14925.6	420.3	15.385	246.167	2.647	76.319	126213	11.1	80.385	2262	716.5	999.8	109.0	5.006	144	0	my9500_rel_o2nofp.cz12a_c32r128
5681	1514	23553	368.0	14833.5	418.1	15.561	248.971	2.611	75.360	123033	11.1	81.285	2347	735.7	1024.7	109.0	4.169	128	0	my9500_rel_o2nofp.cz13a_c32r128
qr1000.L5
qr1000.L5: range queries with 1000 insert/s per client
Performance metrics for all DBMS, not just the ones listed above. Some are normalized by throughput, others are not. Legend for results is here.
ips	qps	rps	rmbps	wps	wmbps	rpq	rkbpq	wpi	wkbpi	csps	cpups	cspq	cpupq	dbgb1	dbgb2	rss	maxop	p50	p99	tag
7619	44094	11564	177.8	18712.2	468.7	0.262	4.128	2.456	62.995	327480	34.4	7.427	250	737.7	850.8	107.3	7.152	4143	0	my5651_rel_o2nofp.cz12a_c32r128
10445	47149	12632	197.4	18764.4	496.7	0.268	4.287	1.797	48.697	343920	41.7	7.294	283	735.0	847.5	108.7	5.422	4303	0	my5744_rel_o2nofp.cz12a_c32r128
10023	40932	12018	187.8	16414.8	471.9	0.294	4.698	1.638	48.207	325546	41.8	7.953	327	736.3	849.6	108.8	8.088	3743	0	my8044_rel_o2nofp.cz12a_c32r128
9954	38162	11132	173.9	15577.9	447.6	0.292	4.667	1.565	46.052	313607	43.3	8.218	363	735.2	1027.5	108.8	2.982	3168	624	my8407_rel_o2nofp.cz12a_c32r128
9515	37761	10853	169.6	15283.7	439.3	0.287	4.599	1.606	47.278	310387	42.7	8.220	362	735.2	1027.4	108.8	3.251	3248	672	my9400_rel_o2nofp.cz12a_c32r128
4375	43199	11768	183.9	15877.6	451.1	0.272	4.359	3.629	105.580	345893	41.0	8.007	304	716.5	1001.9	109.0	3.026	3712	1088	my9500_rel_o2nofp.cz12a_c32r128
10189	38857	11221	175.3	15489.0	445.6	0.289	4.621	1.520	44.784	316554	43.4	8.147	357	735.7	1028.1	109.0	2.852	3295	1072	my9500_rel_o2nofp.cz13a_c32r128
qp1000.L6
qp1000.L6: point queries with 1000 insert/s per client
Performance metrics for all DBMS, not just the ones listed above. Some are normalized by throughput, others are not. Legend for results is here.
ips	qps	rps	rmbps	wps	wmbps	rpq	rkbpq	wpi	wkbpi	csps	cpups	cspq	cpupq	dbgb1	dbgb2	rss	maxop	p50	p99	tag
2589	2793	32150	501.3	19944.0	381.7	11.512	183.807	7.702	150.968	170945	20.0	61.209	2292	737.7	850.9	107.3	7.646	240	48	my5651_rel_o2nofp.cz12a_c32r128
3731	2362	32913	514.3	17505.3	482.8	13.932	222.912	4.692	132.513	126764	12.4	53.659	1680	735.0	847.5	108.7	4.591	208	0	my5744_rel_o2nofp.cz12a_c32r128
4479	1841	27702	432.9	15822.6	446.6	15.049	240.786	3.532	102.100	149732	13.2	81.341	2295	736.3	850.7	108.8	8.299	192	0	my8044_rel_o2nofp.cz12a_c32r128
3659	1799	26400	412.5	14775.5	414.2	14.675	234.797	4.038	115.911	138725	12.3	77.112	2188	735.2	1030.6	108.8	3.375	160	0	my8407_rel_o2nofp.cz12a_c32r128
3532	1764	25811	403.3	14346.2	402.5	14.629	234.063	4.062	116.695	135037	11.9	76.534	2158	735.2	1030.5	108.8	5.008	160	0	my9400_rel_o2nofp.cz12a_c32r128
2906	1732	26152	408.6	14822.8	414.2	15.100	241.606	5.101	145.947	134135	11.0	77.450	2032	716.5	1004.1	109.0	3.067	144	16	my9500_rel_o2nofp.cz12a_c32r128
3642	1787	26135	408.4	14592.4	409.3	14.622	233.952	4.007	115.076	137297	12.1	76.814	2166	735.7	1031.2	109.0	3.512	160	16	my9500_rel_o2nofp.cz13a_c32r128
l.i0
- l.i0: load without secondary indexes
- Legend for results is here.
- Each entry lists the percentage of responses that fit in that bucket (slower than max time for previous bucket, faster than min time for next bucket).
Insert response time histogram
256us	1ms	4ms	16ms	64ms	256ms	1s	4s	16s	gt	max	tag
0.000	0.218	99.461	0.078	0.209	0.028	0.005	0.001	0.000	0.000	3.052	my5651_rel_o2nofp.cz12a_c32r128
0.000	1.426	98.336	0.117	0.061	0.044	0.014	0.003	0.000	0.000	3.714	my5744_rel_o2nofp.cz12a_c32r128
0.000	0.027	99.780	0.068	0.060	0.048	0.016	0.002	0.000	0.000	3.141	my8044_rel_o2nofp.cz12a_c32r128
0.000	0.013	99.789	0.070	0.061	0.047	0.017	0.003	0.000	0.000	3.564	my8407_rel_o2nofp.cz12a_c32r128
0.000	0.018	99.786	0.075	0.057	0.047	0.015	0.002	0.000	0.000	1.858	my9400_rel_o2nofp.cz12a_c32r128
0.000	0.005	99.774	0.084	0.068	0.052	0.016	0.001	0.000	0.000	1.682	my9500_rel_o2nofp.cz12a_c32r128
0.000	0.009	99.795	0.070	0.058	0.049	0.017	0.003	0.000	0.000	2.450	my9500_rel_o2nofp.cz13a_c32r128
l.x
- l.x: create secondary indexes
- Legend for results is here.
- Each entry lists the percentage of responses that fit in that bucket (slower than max time for previous bucket, faster than min time for next bucket).
TODO - determine whether there is data for create index response time
l.i1
- l.i1: continue load after secondary indexes created with 50 inserts per transaction
- Legend for results is here.
- Each entry lists the percentage of responses that fit in that bucket (slower than max time for previous bucket, faster than min time for next bucket).
Insert response time histogram
256us	1ms	4ms	16ms	64ms	256ms	1s	4s	16s	gt	max	tag
0.000	0.000	0.114	14.403	43.452	28.944	12.681	0.261	0.145	0.001	23.878	my5651_rel_o2nofp.cz12a_c32r128
0.000	0.000	0.233	20.066	38.544	29.528	11.213	0.294	0.122	0.000	13.787	my5744_rel_o2nofp.cz12a_c32r128
0.000	0.000	0.662	21.286	34.822	37.112	5.696	0.229	0.193	0.000	11.689	my8044_rel_o2nofp.cz12a_c32r128
0.000	0.000	0.443	19.491	34.311	39.620	5.685	0.293	0.157	0.000	11.448	my8407_rel_o2nofp.cz12a_c32r128
0.000	0.000	0.490	19.601	35.183	38.705	5.565	0.277	0.179	0.000	12.418	my9400_rel_o2nofp.cz12a_c32r128
0.000	0.000	0.001	2.391	17.248	70.510	9.178	0.448	0.225	0.000	11.007	my9500_rel_o2nofp.cz12a_c32r128
0.000	0.000	0.470	19.888	34.669	39.147	5.389	0.252	0.185	0.000	12.189	my9500_rel_o2nofp.cz13a_c32r128
Delete response time histogram
256us	1ms	4ms	16ms	64ms	256ms	1s	4s	16s	gt	max	tag
0.000	0.000	8.697	42.524	36.617	2.673	9.296	0.172	0.022	nonzero	18.271	my5651_rel_o2nofp.cz12a_c32r128
0.000	0.000	48.659	36.521	7.518	0.467	6.790	0.043	0.002	0.000	5.745	my5744_rel_o2nofp.cz12a_c32r128
0.000	0.000	40.352	24.749	22.274	12.116	0.382	0.088	0.041	0.000	9.321	my8044_rel_o2nofp.cz12a_c32r128
0.000	0.000	39.140	24.349	20.267	15.574	0.545	0.106	0.018	0.000	9.182	my8407_rel_o2nofp.cz12a_c32r128
0.000	0.000	40.412	23.375	20.876	14.683	0.522	0.110	0.021	0.000	7.169	my9400_rel_o2nofp.cz12a_c32r128
0.000	0.000	31.006	7.593	9.104	51.199	0.930	0.139	0.028	0.000	7.083	my9500_rel_o2nofp.cz12a_c32r128
0.000	0.000	40.353	23.377	20.771	14.855	0.504	0.111	0.029	0.000	7.440	my9500_rel_o2nofp.cz13a_c32r128
l.i2
- l.i2: continue load after secondary indexes created with 5 inserts per transaction
- Legend for results is here.
- Each entry lists the percentage of responses that fit in that bucket (slower than max time for previous bucket, faster than min time for next bucket).
Insert response time histogram
256us	1ms	4ms	16ms	64ms	256ms	1s	4s	16s	gt	max	tag
0.012	0.816	6.894	22.654	46.418	22.713	0.276	0.213	0.005	0.000	6.535	my5651_rel_o2nofp.cz12a_c32r128
nonzero	2.932	12.643	18.785	49.912	15.187	0.351	0.188	0.002	0.000	6.066	my5744_rel_o2nofp.cz12a_c32r128
0.000	0.000	0.001	39.332	45.893	14.431	0.105	0.159	0.080	0.000	8.974	my8044_rel_o2nofp.cz12a_c32r128
0.000	0.000	0.000	28.094	44.811	26.648	0.394	0.052	0.002	0.000	5.639	my8407_rel_o2nofp.cz12a_c32r128
0.000	0.000	0.000	27.958	44.701	26.874	0.408	0.053	0.007	0.000	6.009	my9400_rel_o2nofp.cz12a_c32r128
0.000	0.000	0.000	55.418	30.195	14.080	0.231	0.077	0.000	0.000	3.726	my9500_rel_o2nofp.cz12a_c32r128
0.000	0.000	0.000	29.572	44.267	25.722	0.364	0.070	0.004	0.000	5.919	my9500_rel_o2nofp.cz13a_c32r128
Delete response time histogram
256us	1ms	4ms	16ms	64ms	256ms	1s	4s	16s	gt	max	tag
0.090	8.044	17.132	11.092	42.862	20.460	0.226	0.093	0.001	0.000	5.591	my5651_rel_o2nofp.cz12a_c32r128
0.002	35.238	4.854	0.642	48.074	11.134	0.046	0.010	nonzero	0.000	4.959	my5744_rel_o2nofp.cz12a_c32r128
0.000	0.000	0.018	48.607	43.194	8.063	0.039	0.058	0.020	0.000	8.456	my8044_rel_o2nofp.cz12a_c32r128
0.000	0.000	0.000	39.388	41.148	19.344	0.102	0.018	nonzero	0.000	4.627	my8407_rel_o2nofp.cz12a_c32r128
0.000	0.000	0.000	39.369	40.991	19.520	0.098	0.021	0.001	0.000	6.009	my9400_rel_o2nofp.cz12a_c32r128
0.000	0.000	0.000	68.740	22.920	8.266	0.052	0.021	0.000	0.000	3.498	my9500_rel_o2nofp.cz12a_c32r128
0.000	0.000	0.000	40.774	40.517	18.582	0.100	0.026	0.001	0.000	5.903	my9500_rel_o2nofp.cz13a_c32r128
qr100.L1
- qr100.L1: range queries with 100 insert/s per client
- Legend for results is here.
- Each entry lists the percentage of responses that fit in that bucket (slower than max time for previous bucket, faster than min time for next bucket).
Query response time histogram
256us	1ms	4ms	16ms	64ms	256ms	1s	4s	16s	gt	max	tag
99.504	0.389	0.095	0.012	nonzero	nonzero	0.000	0.000	0.000	0.000	0.152	my5651_rel_o2nofp.cz12a_c32r128
99.875	0.080	0.043	0.002	nonzero	nonzero	0.000	0.000	0.000	0.000	0.066	my5744_rel_o2nofp.cz12a_c32r128
99.919	0.079	0.001	nonzero	nonzero	nonzero	0.000	0.000	0.000	0.000	0.094	my8044_rel_o2nofp.cz12a_c32r128
99.902	0.094	0.003	nonzero	nonzero	nonzero	nonzero	0.000	0.000	0.000	0.718	my8407_rel_o2nofp.cz12a_c32r128
99.907	0.088	0.004	nonzero	nonzero	nonzero	nonzero	0.000	0.000	0.000	0.533	my9400_rel_o2nofp.cz12a_c32r128
99.890	0.108	0.001	nonzero	nonzero	nonzero	nonzero	0.000	0.000	0.000	0.651	my9500_rel_o2nofp.cz12a_c32r128
99.901	0.091	0.006	0.001	0.001	nonzero	nonzero	0.000	0.000	0.000	0.762	my9500_rel_o2nofp.cz13a_c32r128
Insert response time histogram
256us	1ms	4ms	16ms	64ms	256ms	1s	4s	16s	gt	max	tag
0.000	0.000	0.000	51.289	48.370	0.340	0.000	0.000	0.000	0.000	0.199	my5651_rel_o2nofp.cz12a_c32r128
0.000	0.000	0.000	81.995	17.764	0.241	0.000	0.000	0.000	0.000	0.137	my5744_rel_o2nofp.cz12a_c32r128
0.000	0.000	0.000	82.486	17.435	0.079	0.000	0.000	0.000	0.000	0.115	my8044_rel_o2nofp.cz12a_c32r128
0.000	0.000	0.000	66.887	29.690	1.979	1.315	0.130	0.000	0.000	1.977	my8407_rel_o2nofp.cz12a_c32r128
0.000	0.000	0.000	72.979	26.525	0.435	0.058	0.002	0.000	0.000	1.119	my9400_rel_o2nofp.cz12a_c32r128
0.000	0.000	0.000	70.961	27.225	1.752	0.051	0.012	0.000	0.000	1.042	my9500_rel_o2nofp.cz12a_c32r128
0.000	0.000	0.000	66.169	30.150	2.773	0.847	0.060	0.000	0.000	1.909	my9500_rel_o2nofp.cz13a_c32r128
Delete response time histogram
256us	1ms	4ms	16ms	64ms	256ms	1s	4s	16s	gt	max	tag
0.000	0.000	65.634	30.417	3.910	0.039	0.000	0.000	0.000	0.000	0.163	my5651_rel_o2nofp.cz12a_c32r128
0.000	0.000	97.546	2.424	0.030	0.000	0.000	0.000	0.000	0.000	0.054	my5744_rel_o2nofp.cz12a_c32r128
0.000	0.000	99.854	0.113	0.014	0.019	0.000	0.000	0.000	0.000	0.087	my8044_rel_o2nofp.cz12a_c32r128
0.000	0.000	98.713	0.264	0.236	0.650	0.137	0.000	0.000	0.000	0.784	my8407_rel_o2nofp.cz12a_c32r128
0.000	0.000	99.468	0.361	0.141	0.030	0.000	0.000	0.000	0.000	0.142	my9400_rel_o2nofp.cz12a_c32r128
0.000	0.000	96.833	1.715	1.123	0.315	0.014	0.000	0.000	0.000	0.959	my9500_rel_o2nofp.cz12a_c32r128
0.000	0.000	98.574	0.359	0.410	0.484	0.174	0.000	0.000	0.000	0.607	my9500_rel_o2nofp.cz13a_c32r128
qp100.L2
- qp100.L2: point queries with 100 insert/s per client
- Legend for results is here.
- Each entry lists the percentage of responses that fit in that bucket (slower than max time for previous bucket, faster than min time for next bucket).
Query response time histogram
256us	1ms	4ms	16ms	64ms	256ms	1s	4s	16s	gt	max	tag
0.001	7.897	71.708	19.706	0.671	0.015	0.001	0.001	nonzero	0.000	6.726	my5651_rel_o2nofp.cz12a_c32r128
0.004	28.822	63.288	7.577	0.293	0.011	0.004	0.001	0.000	0.000	3.550	my5744_rel_o2nofp.cz12a_c32r128
0.004	30.539	62.935	6.259	0.234	0.024	0.002	0.003	nonzero	0.000	5.866	my8044_rel_o2nofp.cz12a_c32r128
0.003	26.185	66.002	7.537	0.238	0.030	0.002	0.002	nonzero	0.000	4.166	my8407_rel_o2nofp.cz12a_c32r128
0.003	25.697	65.963	8.033	0.260	0.039	0.003	0.001	nonzero	0.000	4.043	my9400_rel_o2nofp.cz12a_c32r128
0.004	27.074	65.880	6.834	0.183	0.020	0.002	0.002	nonzero	0.000	4.883	my9500_rel_o2nofp.cz12a_c32r128
0.004	26.465	65.709	7.567	0.227	0.024	0.003	0.002	0.000	0.000	3.648	my9500_rel_o2nofp.cz13a_c32r128
Insert response time histogram
256us	1ms	4ms	16ms	64ms	256ms	1s	4s	16s	gt	max	tag
0.000	0.000	0.000	6.162	49.938	42.708	1.072	0.093	0.028	0.000	6.711	my5651_rel_o2nofp.cz12a_c32r128
0.000	0.000	0.000	19.975	70.380	8.347	1.002	0.236	0.060	0.000	6.458	my5744_rel_o2nofp.cz12a_c32r128
0.000	0.000	0.000	23.519	67.201	8.414	0.338	0.273	0.255	0.000	8.608	my8044_rel_o2nofp.cz12a_c32r128
0.000	0.000	0.000	10.389	79.572	8.970	0.718	0.269	0.083	0.000	4.842	my8407_rel_o2nofp.cz12a_c32r128
0.000	0.000	0.000	6.995	81.319	10.373	1.120	0.192	0.000	0.000	3.900	my9400_rel_o2nofp.cz12a_c32r128
0.000	0.000	0.000	31.852	62.701	4.688	0.377	0.245	0.137	0.000	7.235	my9500_rel_o2nofp.cz12a_c32r128
0.000	0.000	0.000	9.525	80.125	9.488	0.556	0.250	0.056	0.000	4.506	my9500_rel_o2nofp.cz13a_c32r128
Delete response time histogram
256us	1ms	4ms	16ms	64ms	256ms	1s	4s	16s	gt	max	tag
0.000	0.005	42.850	49.310	6.840	0.875	0.065	0.051	0.005	0.000	6.612	my5651_rel_o2nofp.cz12a_c32r128
0.000	0.000	93.414	4.806	1.111	0.215	0.204	0.215	0.035	0.000	4.759	my5744_rel_o2nofp.cz12a_c32r128
0.000	0.000	96.414	1.231	1.019	0.419	0.324	0.586	0.007	0.000	5.366	my8044_rel_o2nofp.cz12a_c32r128
0.000	0.000	96.752	1.512	0.843	0.354	0.275	0.264	0.000	0.000	3.762	my8407_rel_o2nofp.cz12a_c32r128
0.000	0.000	96.701	1.553	0.979	0.507	0.160	0.100	0.000	0.000	2.037	my9400_rel_o2nofp.cz12a_c32r128
0.000	0.000	97.606	0.875	0.692	0.319	0.141	0.363	0.002	0.000	4.038	my9500_rel_o2nofp.cz12a_c32r128
0.000	0.000	96.942	1.488	0.757	0.289	0.215	0.308	0.000	0.000	3.934	my9500_rel_o2nofp.cz13a_c32r128
qr500.L3
- qr500.L3: range queries with 500 insert/s per client
- Legend for results is here.
- Each entry lists the percentage of responses that fit in that bucket (slower than max time for previous bucket, faster than min time for next bucket).
Query response time histogram
256us	1ms	4ms	16ms	64ms	256ms	1s	4s	16s	gt	max	tag
94.661	3.363	1.593	0.283	0.097	0.002	0.001	nonzero	nonzero	0.000	7.319	my5651_rel_o2nofp.cz12a_c32r128
98.035	1.463	0.461	0.033	0.005	0.001	0.001	nonzero	nonzero	0.000	6.864	my5744_rel_o2nofp.cz12a_c32r128
98.171	1.482	0.336	0.006	0.004	0.001	nonzero	nonzero	nonzero	0.000	7.857	my8044_rel_o2nofp.cz12a_c32r128
97.732	1.718	0.530	0.010	0.008	0.001	nonzero	nonzero	nonzero	0.000	4.202	my8407_rel_o2nofp.cz12a_c32r128
97.581	1.780	0.612	0.013	0.010	0.002	nonzero	nonzero	0.000	0.000	3.462	my9400_rel_o2nofp.cz12a_c32r128
97.236	2.062	0.667	0.019	0.014	0.002	nonzero	nonzero	nonzero	0.000	4.591	my9500_rel_o2nofp.cz12a_c32r128
97.869	1.612	0.500	0.010	0.008	0.001	nonzero	nonzero	nonzero	0.000	4.984	my9500_rel_o2nofp.cz13a_c32r128
Insert response time histogram
256us	1ms	4ms	16ms	64ms	256ms	1s	4s	16s	gt	max	tag
0.000	0.000	0.000	8.333	62.163	28.129	1.196	0.106	0.072	0.000	12.387	my5651_rel_o2nofp.cz12a_c32r128
0.000	0.000	0.000	3.164	75.618	20.400	0.392	0.254	0.173	0.000	7.622	my5744_rel_o2nofp.cz12a_c32r128
0.000	0.000	0.000	14.912	68.854	14.942	0.836	0.190	0.267	0.000	9.013	my8044_rel_o2nofp.cz12a_c32r128
0.000	0.000	0.000	10.660	70.393	17.127	1.425	0.354	0.041	0.000	8.602	my8407_rel_o2nofp.cz12a_c32r128
0.000	0.000	nonzero	9.464	69.324	19.167	1.774	0.265	0.006	0.000	4.513	my9400_rel_o2nofp.cz12a_c32r128
0.000	0.000	0.000	14.137	69.435	14.986	1.106	0.296	0.039	0.000	4.735	my9500_rel_o2nofp.cz12a_c32r128
0.000	0.000	0.000	12.166	69.267	16.906	1.300	0.332	0.029	0.000	6.358	my9500_rel_o2nofp.cz13a_c32r128
Delete response time histogram
256us	1ms	4ms	16ms	64ms	256ms	1s	4s	16s	gt	max	tag
0.000	0.001	41.325	40.958	15.764	1.630	0.199	0.100	0.023	0.000	9.125	my5651_rel_o2nofp.cz12a_c32r128
0.000	0.000	80.910	15.545	2.875	0.147	0.291	0.200	0.031	0.000	6.790	my5744_rel_o2nofp.cz12a_c32r128
0.000	0.000	82.768	11.338	4.260	1.126	0.131	0.291	0.086	0.000	6.978	my8044_rel_o2nofp.cz12a_c32r128
0.000	0.000	76.256	16.762	4.880	1.706	0.147	0.237	0.013	0.000	8.657	my8407_rel_o2nofp.cz12a_c32r128
0.000	0.000	71.328	20.573	5.535	2.220	0.183	0.162	0.000	0.000	3.601	my9400_rel_o2nofp.cz12a_c32r128
0.000	0.000	74.792	18.538	4.767	1.479	0.194	0.224	0.007	0.000	4.584	my9500_rel_o2nofp.cz12a_c32r128
0.000	0.000	75.981	17.362	4.741	1.539	0.153	0.212	0.011	0.000	5.212	my9500_rel_o2nofp.cz13a_c32r128
qp500.L4
- qp500.L4: point queries with 500 insert/s per client
- Legend for results is here.
- Each entry lists the percentage of responses that fit in that bucket (slower than max time for previous bucket, faster than min time for next bucket).
Query response time histogram
256us	1ms	4ms	16ms	64ms	256ms	1s	4s	16s	gt	max	tag
0.000	0.219	39.238	55.961	4.484	0.073	0.014	0.011	0.001	0.000	5.828	my5651_rel_o2nofp.cz12a_c32r128
0.000	0.067	31.217	64.571	3.964	0.061	0.082	0.037	0.001	0.000	5.725	my5744_rel_o2nofp.cz12a_c32r128
0.000	0.294	47.413	48.301	3.676	0.248	0.022	0.036	0.008	0.000	8.168	my8044_rel_o2nofp.cz12a_c32r128
0.000	0.079	40.574	51.387	6.655	1.253	0.037	0.016	0.000	0.000	3.088	my8407_rel_o2nofp.cz12a_c32r128
0.000	0.089	40.555	51.325	6.680	1.299	0.040	0.012	0.000	0.000	2.495	my9400_rel_o2nofp.cz12a_c32r128
0.000	0.101	41.810	51.485	5.750	0.796	0.034	0.023	0.002	0.000	5.006	my9500_rel_o2nofp.cz12a_c32r128
0.000	0.102	41.524	51.095	6.228	0.990	0.039	0.023	nonzero	0.000	4.169	my9500_rel_o2nofp.cz13a_c32r128
Insert response time histogram
256us	1ms	4ms	16ms	64ms	256ms	1s	4s	16s	gt	max	tag
0.000	0.000	0.000	6.879	68.730	23.652	0.573	0.107	0.059	0.000	5.779	my5651_rel_o2nofp.cz12a_c32r128
0.000	0.000	0.000	3.972	83.869	11.398	0.250	0.336	0.175	0.000	7.381	my5744_rel_o2nofp.cz12a_c32r128
0.000	0.000	0.000	10.240	74.927	14.000	0.323	0.198	0.312	0.000	9.202	my8044_rel_o2nofp.cz12a_c32r128
0.000	0.000	0.000	9.813	64.375	24.056	1.512	0.244	0.000	0.000	3.537	my8407_rel_o2nofp.cz12a_c32r128
0.000	0.000	0.000	9.447	64.113	24.572	1.680	0.188	0.000	0.000	2.903	my9400_rel_o2nofp.cz12a_c32r128
0.000	0.000	0.000	8.033	70.499	20.081	1.058	0.269	0.061	0.000	5.501	my9500_rel_o2nofp.cz12a_c32r128
0.000	0.000	0.000	8.777	66.672	22.937	1.296	0.310	0.009	0.000	15.257	my9500_rel_o2nofp.cz13a_c32r128
Delete response time histogram
256us	1ms	4ms	16ms	64ms	256ms	1s	4s	16s	gt	max	tag
0.000	0.000	23.937	57.240	17.517	1.061	0.120	0.106	0.019	0.000	5.771	my5651_rel_o2nofp.cz12a_c32r128
0.000	0.000	69.857	26.219	3.244	0.138	0.252	0.256	0.033	0.000	5.999	my5744_rel_o2nofp.cz12a_c32r128
0.000	0.000	55.480	38.015	5.072	0.805	0.178	0.314	0.136	0.000	8.405	my8044_rel_o2nofp.cz12a_c32r128
0.000	0.000	49.051	40.456	7.629	2.490	0.250	0.123	0.000	0.000	2.994	my8407_rel_o2nofp.cz12a_c32r128
0.000	0.000	48.892	39.787	8.190	2.775	0.279	0.077	0.000	0.000	2.494	my9400_rel_o2nofp.cz12a_c32r128
0.000	0.000	51.299	39.283	7.057	1.906	0.217	0.213	0.025	0.000	5.295	my9500_rel_o2nofp.cz12a_c32r128
0.000	0.000	48.018	41.119	8.130	2.274	0.235	0.222	0.003	0.000	7.529	my9500_rel_o2nofp.cz13a_c32r128
qr1000.L5
- qr1000.L5: range queries with 1000 insert/s per client
- Legend for results is here.
- Each entry lists the percentage of responses that fit in that bucket (slower than max time for previous bucket, faster than min time for next bucket).
Query response time histogram
256us	1ms	4ms	16ms	64ms	256ms	1s	4s	16s	gt	max	tag
90.174	6.785	2.626	0.368	0.044	0.001	0.002	0.001	nonzero	0.000	7.152	my5651_rel_o2nofp.cz12a_c32r128
91.682	5.840	2.286	0.160	0.028	0.002	0.002	0.001	nonzero	0.000	5.422	my5744_rel_o2nofp.cz12a_c32r128
70.077	27.729	2.095	0.053	0.040	0.004	0.001	0.001	nonzero	0.000	8.088	my8044_rel_o2nofp.cz12a_c32r128
64.299	32.840	2.711	0.076	0.061	0.013	0.001	nonzero	0.000	0.000	2.982	my8407_rel_o2nofp.cz12a_c32r128
64.484	32.488	2.872	0.078	0.064	0.014	0.001	nonzero	0.000	0.000	3.251	my9400_rel_o2nofp.cz12a_c32r128
65.646	31.694	2.535	0.065	0.050	0.009	nonzero	nonzero	0.000	0.000	3.026	my9500_rel_o2nofp.cz12a_c32r128
65.157	31.998	2.696	0.075	0.061	0.012	0.001	nonzero	0.000	0.000	2.852	my9500_rel_o2nofp.cz13a_c32r128
Insert response time histogram
256us	1ms	4ms	16ms	64ms	256ms	1s	4s	16s	gt	max	tag
0.000	0.000	0.007	17.353	66.263	8.187	7.893	0.209	0.088	0.000	8.420	my5651_rel_o2nofp.cz12a_c32r128
0.000	0.000	0.007	20.646	69.896	8.817	0.357	0.234	0.044	0.000	6.831	my5744_rel_o2nofp.cz12a_c32r128
0.000	0.000	0.018	37.214	53.944	8.194	0.366	0.135	0.130	0.000	8.376	my8044_rel_o2nofp.cz12a_c32r128
0.000	0.000	0.019	28.815	49.784	19.854	1.400	0.128	0.000	0.000	3.578	my8407_rel_o2nofp.cz12a_c32r128
0.000	0.000	0.019	26.626	47.666	23.812	1.793	0.078	0.005	0.000	6.454	my9400_rel_o2nofp.cz12a_c32r128
0.000	0.000	0.000	1.518	10.671	79.851	7.597	0.363	0.000	0.000	3.381	my9500_rel_o2nofp.cz12a_c32r128
0.000	0.000	0.017	28.156	51.233	19.220	1.278	0.096	0.000	0.000	3.331	my9500_rel_o2nofp.cz13a_c32r128
Delete response time histogram
256us	1ms	4ms	16ms	64ms	256ms	1s	4s	16s	gt	max	tag
0.000	0.000	24.386	52.902	13.780	0.789	7.982	0.140	0.021	0.000	7.969	my5651_rel_o2nofp.cz12a_c32r128
0.000	0.000	67.395	27.142	4.873	0.215	0.266	0.102	0.007	0.000	6.720	my5744_rel_o2nofp.cz12a_c32r128
0.000	0.000	56.970	36.244	5.244	1.263	0.127	0.105	0.046	0.000	8.172	my8044_rel_o2nofp.cz12a_c32r128
0.000	0.000	41.302	29.173	22.564	6.656	0.254	0.052	0.000	0.000	3.521	my8407_rel_o2nofp.cz12a_c32r128
0.000	0.000	39.249	27.247	23.955	9.201	0.314	0.034	nonzero	0.000	4.848	my9400_rel_o2nofp.cz12a_c32r128
0.000	0.000	4.891	2.864	24.741	66.391	1.024	0.090	0.000	0.000	3.199	my9500_rel_o2nofp.cz12a_c32r128
0.000	0.000	42.056	29.964	21.886	5.798	0.254	0.042	0.000	0.000	3.014	my9500_rel_o2nofp.cz13a_c32r128
qp1000.L6
- qp1000.L6: point queries with 1000 insert/s per client
- Legend for results is here.
- Each entry lists the percentage of responses that fit in that bucket (slower than max time for previous bucket, faster than min time for next bucket).
Query response time histogram
256us	1ms	4ms	16ms	64ms	256ms	1s	4s	16s	gt	max	tag
nonzero	2.520	55.540	39.745	2.173	0.018	0.002	0.001	nonzero	0.000	7.646	my5651_rel_o2nofp.cz12a_c32r128
nonzero	0.522	49.149	48.456	1.781	0.039	0.038	0.015	nonzero	0.000	4.591	my5744_rel_o2nofp.cz12a_c32r128
0.000	0.209	49.472	46.560	3.480	0.212	0.021	0.040	0.005	0.000	8.299	my8044_rel_o2nofp.cz12a_c32r128
nonzero	0.150	47.015	46.726	5.346	0.734	0.021	0.008	0.000	0.000	3.375	my8407_rel_o2nofp.cz12a_c32r128
0.000	0.175	47.210	46.347	5.418	0.820	0.023	0.006	nonzero	0.000	5.008	my9400_rel_o2nofp.cz12a_c32r128
0.000	0.145	45.936	47.443	5.601	0.839	0.028	0.008	0.000	0.000	3.067	my9500_rel_o2nofp.cz12a_c32r128
0.000	0.166	47.348	46.293	5.380	0.782	0.024	0.007	0.000	0.000	3.512	my9500_rel_o2nofp.cz13a_c32r128
Insert response time histogram
256us	1ms	4ms	16ms	64ms	256ms	1s	4s	16s	gt	max	tag
0.000	0.000	0.000	1.905	24.860	10.002	63.138	0.082	0.013	0.000	10.735	my5651_rel_o2nofp.cz12a_c32r128
0.000	0.000	nonzero	6.096	49.121	4.990	39.187	0.566	0.040	0.000	5.582	my5744_rel_o2nofp.cz12a_c32r128
0.000	0.000	nonzero	1.902	14.410	82.348	0.777	0.226	0.338	0.000	9.298	my8044_rel_o2nofp.cz12a_c32r128
0.000	0.000	0.000	0.000	0.857	91.786	7.109	0.247	0.002	0.000	5.484	my8407_rel_o2nofp.cz12a_c32r128
0.000	0.000	0.000	0.000	0.677	90.669	8.461	0.170	0.024	0.000	6.644	my9400_rel_o2nofp.cz12a_c32r128
0.000	0.000	0.000	0.000	0.000	83.350	16.335	0.314	0.000	0.000	3.311	my9500_rel_o2nofp.cz12a_c32r128
0.000	0.000	0.000	0.000	0.897	91.354	7.506	0.239	0.003	0.000	5.959	my9500_rel_o2nofp.cz13a_c32r128
Delete response time histogram
256us	1ms	4ms	16ms	64ms	256ms	1s	4s	16s	gt	max	tag
0.000	0.000	3.810	23.265	9.325	0.467	63.107	0.026	0.002	0.000	6.776	my5651_rel_o2nofp.cz12a_c32r128
0.000	0.000	35.713	21.563	2.830	0.139	39.636	0.119	0.001	0.000	4.676	my5744_rel_o2nofp.cz12a_c32r128
0.000	0.000	2.349	4.158	22.504	70.613	0.171	0.144	0.061	0.000	9.023	my8044_rel_o2nofp.cz12a_c32r128
0.000	0.000	0.000	0.000	6.370	92.701	0.862	0.067	0.000	0.000	3.249	my8407_rel_o2nofp.cz12a_c32r128
0.000	0.000	0.000	0.000	5.660	93.244	1.044	0.046	0.006	0.000	5.574	my9400_rel_o2nofp.cz12a_c32r128
0.000	0.000	0.000	0.000	0.028	98.826	1.082	0.065	0.000	0.000	2.921	my9500_rel_o2nofp.cz12a_c32r128
0.000	0.000	0.000	0.000	6.730	92.280	0.930	0.059	0.001	0.000	5.160	my9500_rel_o2nofp.cz13a_c32r128