Introduction
This is a report for the insert benchmark with 30M docs and 1 client(s). It is generated by scripts (bash, awk, sed) and Tufte might not be impressed. An overview of the insert benchmark is here and a short update is here. Below, by DBMS, I mean DBMS+version.config. An example is my8020.c10b40 where my means MySQL, 8020 is version 8.0.20 and c10b40 is the name for the configuration file.
The test server has 8 AMD cores, 32G RAM and an NVMe device for the database. The benchmark was run with 1 client and there were 1 or 3 connections per client (1 for queries or inserts without rate limits, 1+1 for rate limited inserts+deletes). It uses 1 table with a table per client. It loads 30M rows per table without secondary indexes, creates 3 secondary indexes per table, then inserts 40m+10m rows per table with a delete per insert to avoid growing the table. It then does 6 read+write tests for 1800s each that do queries as fast as possible with 100,100,500,500,1000,1000 inserts/s and the same for deletes/s per client concurrent with the queries. The database is cached by InnoDB. Clients and the DBMS share one server.
The tested DBMS are:
- ma120300_rel_withdbg.cz12b_sync_c8r32 - MariaDB 12.3.0 with the z12b_c8r32 config that syncs InnoDB and the binlog on commit
- ma120300_rel_withdbg.cz12c_sync_c8r32 - MariaDB 12.3.0 with the z12c_c8r32 config that uses the binlog storage engine and syncs InnoDB on commit
Contents
- Summary
- l.i0: load without secondary indexes
- l.x: create secondary indexes
- l.i1: continue load after secondary indexes created with 50 inserts per transaction
- l.i2: continue load after secondary indexes created with 5 inserts per transaction
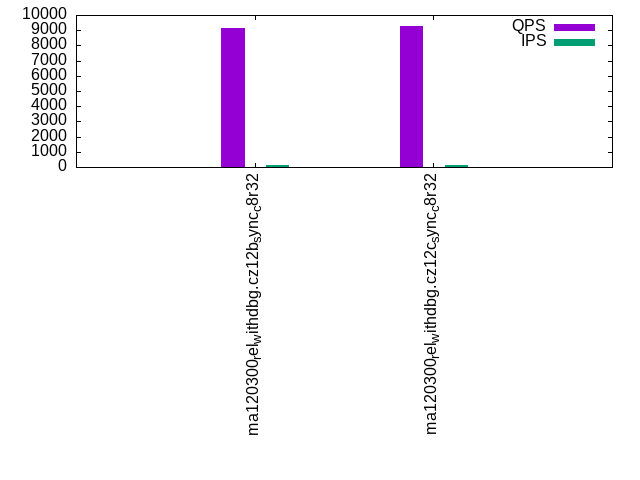
- qr100.L1: range queries with 100 insert/s per client
- qp100.L2: point queries with 100 insert/s per client
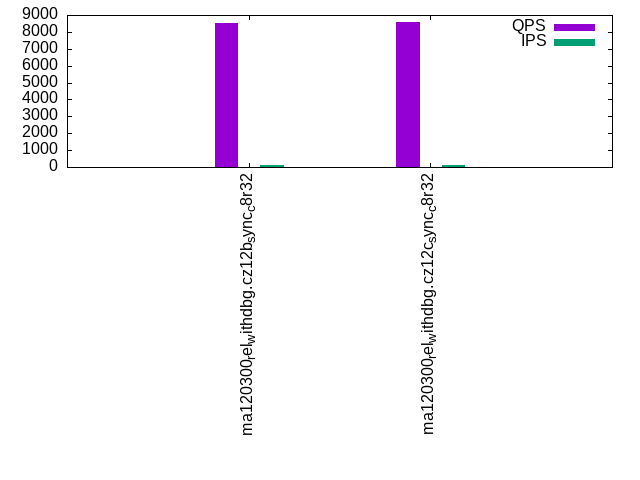
- qr500.L3: range queries with 500 insert/s per client
- qp500.L4: point queries with 500 insert/s per client
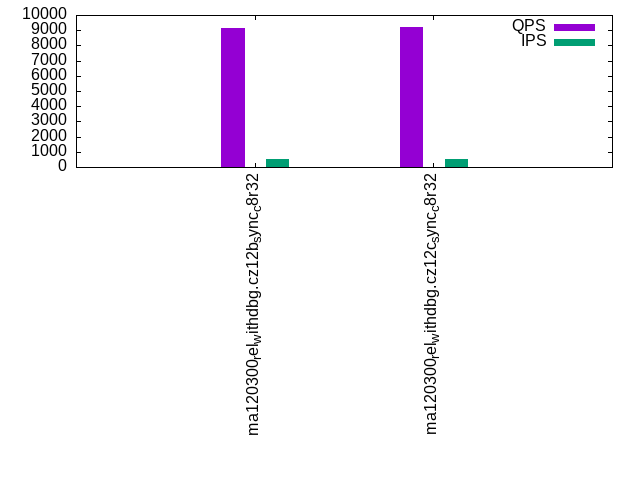
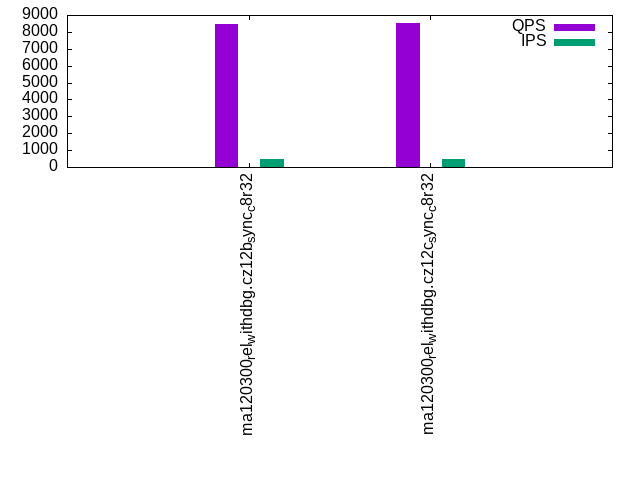
- qr1000.L5: range queries with 1000 insert/s per client
- qp1000.L6: point queries with 1000 insert/s per client
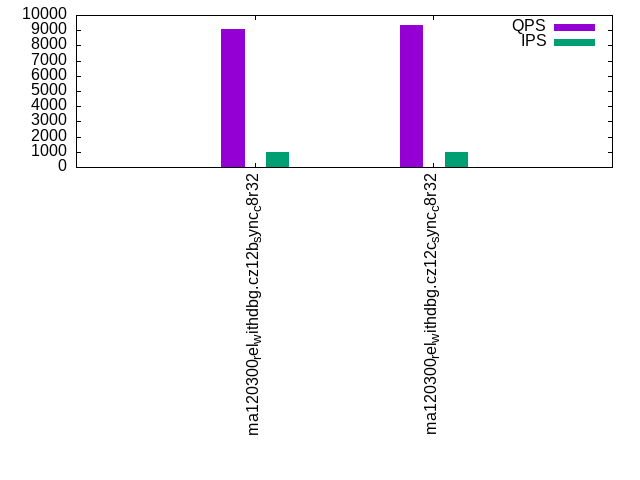
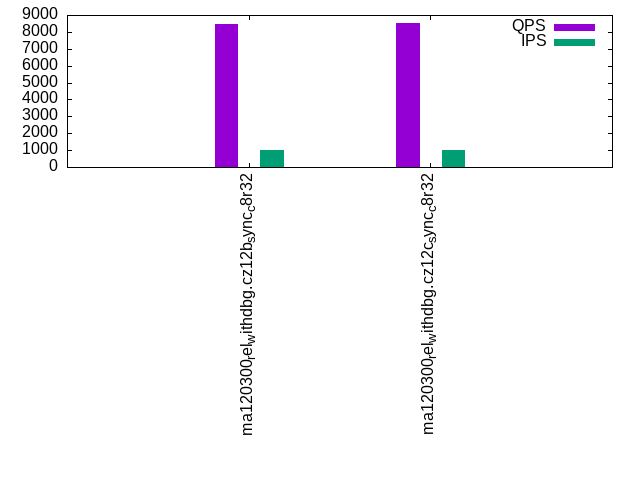
Summary
The numbers are inserts/s for l.i0, l.i1 and l.i2, indexed docs (or rows) /s for l.x and queries/s for qr100, qp100 thru qr1000, qp1000" The values are the average rate over the entire test for inserts (IPS) and queries (QPS). The range of values for IPS and QPS is split into 3 parts: bottom 25%, middle 50%, top 25%. Values in the bottom 25% have a red background, values in the top 25% have a green background and values in the middle have no color. A gray background is used for values that can be ignored because the DBMS did not sustain the target insert rate. Red backgrounds are not used when the minimum value is within 80% of the max value.
| dbms | l.i0 | l.x | l.i1 | l.i2 | qr100 | qp100 | qr500 | qp500 | qr1000 | qp1000 |
|---|---|---|---|---|---|---|---|---|---|---|
| ma120300_rel_withdbg.cz12b_sync_c8r32 | 7036 | 191083 | 2777 | 254 | 9145 | 8528 | 9119 | 8486 | 9049 | 8438 |
| ma120300_rel_withdbg.cz12c_sync_c8r32 | 12290 | 193549 | 11071 | 1735 | 9266 | 8573 | 9218 | 8550 | 9313 | 8501 |
This table has relative throughput, throughput for the DBMS relative to the DBMS in the first line, using the absolute throughput from the previous table. Values less than 0.95 have a yellow background. Values greater than 1.05 have a blue background.
| dbms | l.i0 | l.x | l.i1 | l.i2 | qr100 | qp100 | qr500 | qp500 | qr1000 | qp1000 |
|---|---|---|---|---|---|---|---|---|---|---|
| ma120300_rel_withdbg.cz12b_sync_c8r32 | 1.00 | 1.00 | 1.00 | 1.00 | 1.00 | 1.00 | 1.00 | 1.00 | 1.00 | 1.00 |
| ma120300_rel_withdbg.cz12c_sync_c8r32 | 1.75 | 1.01 | 3.99 | 6.83 | 1.01 | 1.01 | 1.01 | 1.01 | 1.03 | 1.01 |
This lists the average rate of inserts/s for the tests that do inserts concurrent with queries. For such tests the query rate is listed in the table above. The read+write tests are setup so that the insert rate should match the target rate every second. Cells that are not at least 95% of the target have a red background to indicate a failure to satisfy the target.
| dbms | qr100.L1 | qp100.L2 | qr500.L3 | qp500.L4 | qr1000.L5 | qp1000.L6 |
|---|---|---|---|---|---|---|
| ma120300_rel_withdbg.cz12b_sync_c8r32 | 100 | 100 | 500 | 500 | 999 | 999 |
| ma120300_rel_withdbg.cz12c_sync_c8r32 | 100 | 100 | 500 | 500 | 1000 | 999 |
| target | 100 | 100 | 500 | 500 | 1000 | 1000 |
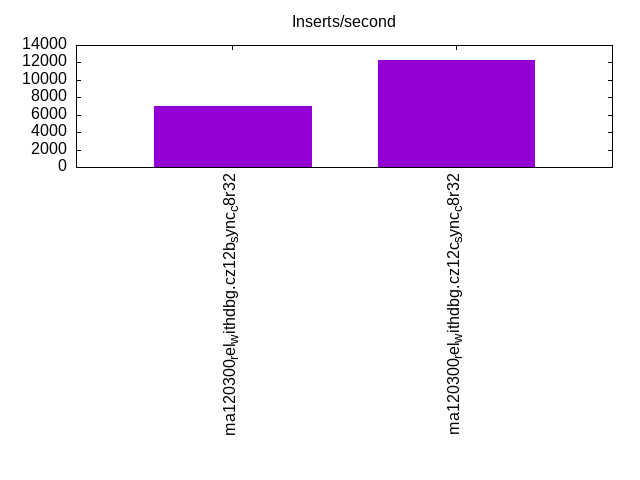
l.i0
l.i0: load without secondary indexes. Graphs for performance per 1-second interval are here.
Average throughput:
Insert response time histogram: each cell has the percentage of responses that take <= the time in the header and max is the max response time in seconds. For the max column values in the top 25% of the range have a red background and in the bottom 25% of the range have a green background. The red background is not used when the min value is within 80% of the max value.
| dbms | 256us | 1ms | 4ms | 16ms | 64ms | 256ms | 1s | 4s | 16s | gt | max |
|---|---|---|---|---|---|---|---|---|---|---|---|
| ma120300_rel_withdbg.cz12b_sync_c8r32 | 85.577 | 14.423 | 0.001 | 0.225 | |||||||
| ma120300_rel_withdbg.cz12c_sync_c8r32 | 0.004 | 99.766 | 0.229 | nonzero | 0.074 |
Performance metrics for the DBMS listed above. Some are normalized by throughput, others are not. Legend for results is here.
ips	qps	rps	rmbps	wps	wmbps	rpq	rkbpq	wpi	wkbpi	csps	cpups	cspq	cpupq	dbgb1	dbgb2	rss	maxop	p50	p99	tag
7036	0	0	0.0	567.8	5.1	0.000	0.000	0.081	0.737	3898	2.9	0.554	33	2.0	32.8	2.6	0.225	7299	5998	ma120300_rel_withdbg.cz12b_sync_c8r32
12290	0	0	0.0	534.0	9.1	0.000	0.000	0.043	0.758	5168	4.3	0.421	28	2.0	33.3	2.6	0.074	12398	10298	ma120300_rel_withdbg.cz12c_sync_c8r32
Average values from iostat.
r/s	rkB/s	rrqm/s	%rrqm	r_await	rareq-s	w/s	wkB/s	wrqm/s	%wrqm	w_await	wareq-s	d/s	dkB/s	drqm/s	%drqm	d_await	dareq-s	f/s	f_await	aqu-sz	%util
0.010	0.040	0.000	0.000	0.006	0.197	567.9	5183.7	568.7	50.07	1.467	9.105	2.516	19.05	0.000	0.000	0.050	0.615	211.5	1.344	1.109	82.35		ma120300_rel_withdbg.cz12b_sync_c8r32
0.017	0.067	0.000	0.000	0.006	0.222	534.0	9311.6	646.1	55.25	1.642	17.49	18.32	145.7	0.000	0.000	0.376	3.178	163.3	1.267	1.070	81.36		ma120300_rel_withdbg.cz12c_sync_c8r32
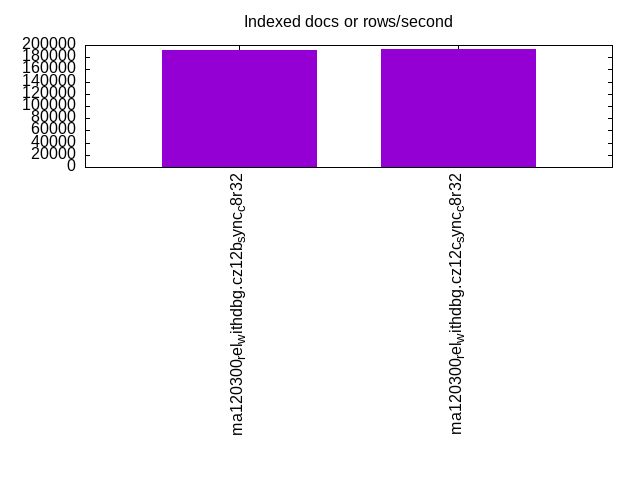
l.x
l.x: create secondary indexes.
Average throughput:
Performance metrics for the DBMS listed above. Some are normalized by throughput, others are not. Legend for results is here.
ips	qps	rps	rmbps	wps	wmbps	rpq	rkbpq	wpi	wkbpi	csps	cpups	cspq	cpupq	dbgb1	dbgb2	rss	maxop	p50	p99	tag
191083	0	0	0.0	2514.9	169.8	0.000	0.000	0.013	0.910	7390	12.2	0.039	5	4.2	35.0	4.3	0.019	NA	NA	ma120300_rel_withdbg.cz12b_sync_c8r32
193549	0	0	0.0	2076.0	164.6	0.000	0.000	0.011	0.871	5123	12.1	0.026	5	4.2	35.5	4.5	0.008	NA	NA	ma120300_rel_withdbg.cz12c_sync_c8r32
Average values from iostat.
r/s	rkB/s	rrqm/s	%rrqm	r_await	rareq-s	w/s	wkB/s	wrqm/s	%wrqm	w_await	wareq-s	d/s	dkB/s	drqm/s	%drqm	d_await	dareq-s	f/s	f_await	aqu-sz	%util
0.013	0.053	0.000	0.000	0.000	0.267	2456.3	176456	20.01	1.673	0.142	100.8	1.086	8198.2	0.000	0.000	0.028	516.4	8.406	1.205	0.208	6.646		ma120300_rel_withdbg.cz12b_sync_c8r32
0.187	0.746	0.000	0.000	0.061	1.733	2068.8	171898	19.97	1.768	0.192	108.9	1.709	17176.8	0.000	0.000	0.042	1010.2	9.012	0.964	0.283	6.324		ma120300_rel_withdbg.cz12c_sync_c8r32
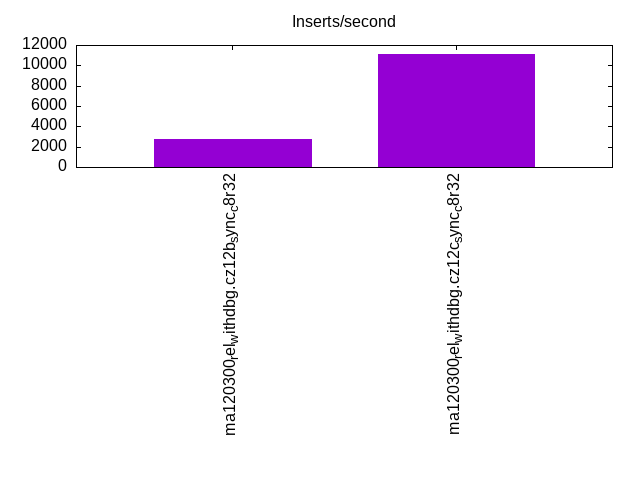
l.i1
l.i1: continue load after secondary indexes created with 50 inserts per transaction. Graphs for performance per 1-second interval are here.
Average throughput:
Insert response time histogram: each cell has the percentage of responses that take <= the time in the header and max is the max response time in seconds. For the max column values in the top 25% of the range have a red background and in the bottom 25% of the range have a green background. The red background is not used when the min value is within 80% of the max value.
| dbms | 256us | 1ms | 4ms | 16ms | 64ms | 256ms | 1s | 4s | 16s | gt | max |
|---|---|---|---|---|---|---|---|---|---|---|---|
| ma120300_rel_withdbg.cz12b_sync_c8r32 | 50.492 | 49.488 | 0.020 | 0.244 | |||||||
| ma120300_rel_withdbg.cz12c_sync_c8r32 | 73.114 | 26.504 | 0.381 | 0.001 | 0.245 |
Delete response time histogram: each cell has the percentage of responses that take <= the time in the header and max is the max response time in seconds. For the max column values in the top 25% of the range have a red background and in the bottom 25% of the range have a green background. The red background is not used when the min value is within 80% of the max value.
| dbms | 256us | 1ms | 4ms | 16ms | 64ms | 256ms | 1s | 4s | 16s | gt | max |
|---|---|---|---|---|---|---|---|---|---|---|---|
| ma120300_rel_withdbg.cz12b_sync_c8r32 | 50.033 | 49.947 | 0.020 | 0.227 | |||||||
| ma120300_rel_withdbg.cz12c_sync_c8r32 | 73.084 | 26.651 | 0.264 | 0.001 | 0.224 |
Performance metrics for the DBMS listed above. Some are normalized by throughput, others are not. Legend for results is here.
ips	qps	rps	rmbps	wps	wmbps	rpq	rkbpq	wpi	wkbpi	csps	cpups	cspq	cpupq	dbgb1	dbgb2	rss	maxop	p50	p99	tag
2777	0	0	0.0	1043.0	14.0	0.000	0.000	0.376	5.168	5695	4.0	2.051	115	5.3	36.1	5.9	0.244	2750	1700	ma120300_rel_withdbg.cz12b_sync_c8r32
11071	0	0	0.0	2022.6	45.5	0.000	0.000	0.183	4.212	12271	10.5	1.108	76	5.7	37.0	6.3	0.245	12348	3749	ma120300_rel_withdbg.cz12c_sync_c8r32
Average values from iostat.
r/s	rkB/s	rrqm/s	%rrqm	r_await	rareq-s	w/s	wkB/s	wrqm/s	%wrqm	w_await	wareq-s	d/s	dkB/s	drqm/s	%drqm	d_await	dareq-s	f/s	f_await	aqu-sz	%util
0.004	0.016	0.000	0.000	0.015	0.074	1042.3	14335.5	689.2	41.63	1.617	12.85	0.007	0.030	0.000	0.000	0.031	0.146	335.5	1.939	2.294	97.06		ma120300_rel_withdbg.cz12b_sync_c8r32
0.017	0.068	0.000	0.000	0.031	0.183	2021.6	46589.8	285.5	18.00	0.933	23.56	0.264	1.080	0.000	0.000	0.215	1.072	456.4	1.302	2.111	92.45		ma120300_rel_withdbg.cz12c_sync_c8r32
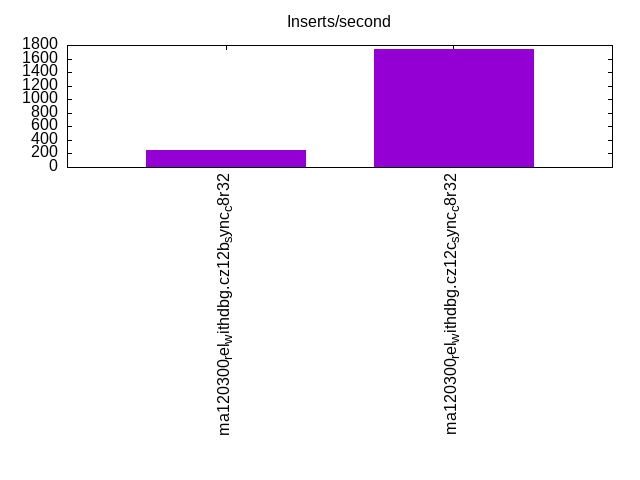
l.i2
l.i2: continue load after secondary indexes created with 5 inserts per transaction. Graphs for performance per 1-second interval are here.
Average throughput:
Insert response time histogram: each cell has the percentage of responses that take <= the time in the header and max is the max response time in seconds. For the max column values in the top 25% of the range have a red background and in the bottom 25% of the range have a green background. The red background is not used when the min value is within 80% of the max value.
| dbms | 256us | 1ms | 4ms | 16ms | 64ms | 256ms | 1s | 4s | 16s | gt | max |
|---|---|---|---|---|---|---|---|---|---|---|---|
| ma120300_rel_withdbg.cz12b_sync_c8r32 | 26.537 | 73.462 | 0.001 | 0.079 | |||||||
| ma120300_rel_withdbg.cz12c_sync_c8r32 | 89.759 | 10.238 | 0.003 | 0.033 |
Delete response time histogram: each cell has the percentage of responses that take <= the time in the header and max is the max response time in seconds. For the max column values in the top 25% of the range have a red background and in the bottom 25% of the range have a green background. The red background is not used when the min value is within 80% of the max value.
| dbms | 256us | 1ms | 4ms | 16ms | 64ms | 256ms | 1s | 4s | 16s | gt | max |
|---|---|---|---|---|---|---|---|---|---|---|---|
| ma120300_rel_withdbg.cz12b_sync_c8r32 | 26.532 | 73.466 | 0.002 | 0.108 | |||||||
| ma120300_rel_withdbg.cz12c_sync_c8r32 | nonzero | 89.717 | 10.280 | 0.003 | 0.037 |
Performance metrics for the DBMS listed above. Some are normalized by throughput, others are not. Legend for results is here.
ips	qps	rps	rmbps	wps	wmbps	rpq	rkbpq	wpi	wkbpi	csps	cpups	cspq	cpupq	dbgb1	dbgb2	rss	maxop	p50	p99	tag
254	0	0	0.0	736.1	3.9	0.000	0.000	2.896	15.702	3972	1.8	15.626	566	5.3	36.1	5.9	0.079	240	175	ma120300_rel_withdbg.cz12b_sync_c8r32
1735	0	0	0.0	1526.2	8.6	0.000	0.000	0.880	5.049	12507	4.0	7.209	184	5.7	37.0	6.3	0.033	1920	1160	ma120300_rel_withdbg.cz12c_sync_c8r32
Average values from iostat.
r/s	rkB/s	rrqm/s	%rrqm	r_await	rareq-s	w/s	wkB/s	wrqm/s	%wrqm	w_await	wareq-s	d/s	dkB/s	drqm/s	%drqm	d_await	dareq-s	f/s	f_await	aqu-sz	%util
0.000	0.002	0.000	0.000	0.005	0.008	736.1	3991.4	269.2	27.15	2.534	4.968	0.001	0.146	0.000	0.000	0.001	0.382	305.8	3.167	2.748	98.49		ma120300_rel_withdbg.cz12b_sync_c8r32
0.003	0.012	0.000	0.000	0.008	0.028	1524.7	8728.9	9.880	0.682	0.749	5.204	0.964	4.001	0.000	0.000	0.395	1.893	698.6	1.405	2.083	96.45		ma120300_rel_withdbg.cz12c_sync_c8r32
qr100.L1
qr100.L1: range queries with 100 insert/s per client. Graphs for performance per 1-second interval are here.
Average throughput:
Query response time histogram: each cell has the percentage of responses that take <= the time in the header and max is the max response time in seconds. For max values in the top 25% of the range have a red background and in the bottom 25% of the range have a green background. The red background is not used when the min value is within 80% of the max value.
| dbms | 256us | 1ms | 4ms | 16ms | 64ms | 256ms | 1s | 4s | 16s | gt | max |
|---|---|---|---|---|---|---|---|---|---|---|---|
| ma120300_rel_withdbg.cz12b_sync_c8r32 | 99.977 | 0.023 | nonzero | nonzero | 0.007 | ||||||
| ma120300_rel_withdbg.cz12c_sync_c8r32 | 99.986 | 0.014 | 0.001 |
Insert response time histogram: each cell has the percentage of responses that take <= the time in the header and max is the max response time in seconds. For max values in the top 25% of the range have a red background and in the bottom 25% of the range have a green background. The red background is not used when the min value is within 80% of the max value.
| dbms | 256us | 1ms | 4ms | 16ms | 64ms | 256ms | 1s | 4s | 16s | gt | max |
|---|---|---|---|---|---|---|---|---|---|---|---|
| ma120300_rel_withdbg.cz12b_sync_c8r32 | 33.056 | 66.944 | 0.051 | ||||||||
| ma120300_rel_withdbg.cz12c_sync_c8r32 | 27.278 | 69.167 | 3.556 | 0.024 |
Delete response time histogram: each cell has the percentage of responses that take <= the time in the header and max is the max response time in seconds. For max values in the top 25% of the range have a red background and in the bottom 25% of the range have a green background. The red background is not used when the min value is within 80% of the max value.
| dbms | 256us | 1ms | 4ms | 16ms | 64ms | 256ms | 1s | 4s | 16s | gt | max |
|---|---|---|---|---|---|---|---|---|---|---|---|
| ma120300_rel_withdbg.cz12b_sync_c8r32 | 31.889 | 68.056 | 0.056 | 0.066 | |||||||
| ma120300_rel_withdbg.cz12c_sync_c8r32 | 12.194 | 86.056 | 1.750 | 0.026 |
Performance metrics for the DBMS listed above. Some are normalized by throughput, others are not. Legend for results is here.
ips	qps	rps	rmbps	wps	wmbps	rpq	rkbpq	wpi	wkbpi	csps	cpups	cspq	cpupq	dbgb1	dbgb2	rss	maxop	p50	p99	tag
100	9145	0	0.0	34.7	0.4	0.000	0.000	0.348	4.417	52553	12.4	5.747	108	5.3	36.1	5.9	0.007	9151	9070	ma120300_rel_withdbg.cz12b_sync_c8r32
100	9266	0	0.0	11.2	0.2	0.000	0.000	0.112	1.877	53107	12.4	5.731	107	5.7	37.0	6.3	0.001	9246	9150	ma120300_rel_withdbg.cz12c_sync_c8r32
Average values from iostat.
r/s	rkB/s	rrqm/s	%rrqm	r_await	rareq-s	w/s	wkB/s	wrqm/s	%wrqm	w_await	wareq-s	d/s	dkB/s	drqm/s	%drqm	d_await	dareq-s	f/s	f_await	aqu-sz	%util
0.000	0.000	0.000	0.000	0.000	0.000	34.77	441.9	21.13	42.52	2.041	9.404	0.001	0.002	0.000	0.000	0.003	0.011	12.16	2.041	0.084	4.342		ma120300_rel_withdbg.cz12b_sync_c8r32
0.000	0.000	0.000	0.000	0.000	0.000	11.19	187.7	3.955	26.12	2.695	16.77	0.001	0.002	0.000	0.000	0.003	0.011	5.027	1.946	0.041	1.908		ma120300_rel_withdbg.cz12c_sync_c8r32
qp100.L2
qp100.L2: point queries with 100 insert/s per client. Graphs for performance per 1-second interval are here.
Average throughput:
Query response time histogram: each cell has the percentage of responses that take <= the time in the header and max is the max response time in seconds. For max values in the top 25% of the range have a red background and in the bottom 25% of the range have a green background. The red background is not used when the min value is within 80% of the max value.
| dbms | 256us | 1ms | 4ms | 16ms | 64ms | 256ms | 1s | 4s | 16s | gt | max |
|---|---|---|---|---|---|---|---|---|---|---|---|
| ma120300_rel_withdbg.cz12b_sync_c8r32 | 99.981 | 0.019 | nonzero | 0.002 | |||||||
| ma120300_rel_withdbg.cz12c_sync_c8r32 | 99.987 | 0.013 | nonzero | 0.001 |
Insert response time histogram: each cell has the percentage of responses that take <= the time in the header and max is the max response time in seconds. For max values in the top 25% of the range have a red background and in the bottom 25% of the range have a green background. The red background is not used when the min value is within 80% of the max value.
| dbms | 256us | 1ms | 4ms | 16ms | 64ms | 256ms | 1s | 4s | 16s | gt | max |
|---|---|---|---|---|---|---|---|---|---|---|---|
| ma120300_rel_withdbg.cz12b_sync_c8r32 | 31.611 | 68.389 | 0.056 | ||||||||
| ma120300_rel_withdbg.cz12c_sync_c8r32 | 13.806 | 70.944 | 15.250 | 0.033 |
Delete response time histogram: each cell has the percentage of responses that take <= the time in the header and max is the max response time in seconds. For max values in the top 25% of the range have a red background and in the bottom 25% of the range have a green background. The red background is not used when the min value is within 80% of the max value.
| dbms | 256us | 1ms | 4ms | 16ms | 64ms | 256ms | 1s | 4s | 16s | gt | max |
|---|---|---|---|---|---|---|---|---|---|---|---|
| ma120300_rel_withdbg.cz12b_sync_c8r32 | 28.861 | 71.111 | 0.028 | 0.065 | |||||||
| ma120300_rel_withdbg.cz12c_sync_c8r32 | 7.861 | 86.778 | 5.361 | 0.022 |
Performance metrics for the DBMS listed above. Some are normalized by throughput, others are not. Legend for results is here.
ips	qps	rps	rmbps	wps	wmbps	rpq	rkbpq	wpi	wkbpi	csps	cpups	cspq	cpupq	dbgb1	dbgb2	rss	maxop	p50	p99	tag
100	8528	0	0.0	41.0	0.6	0.000	0.000	0.410	6.157	49512	12.2	5.806	114	5.3	36.1	5.9	0.002	8527	8431	ma120300_rel_withdbg.cz12b_sync_c8r32
100	8573	0	0.0	30.2	0.7	0.000	0.000	0.303	7.156	49731	12.1	5.801	113	5.7	37.0	6.3	0.001	8575	8479	ma120300_rel_withdbg.cz12c_sync_c8r32
Average values from iostat.
r/s	rkB/s	rrqm/s	%rrqm	r_await	rareq-s	w/s	wkB/s	wrqm/s	%wrqm	w_await	wareq-s	d/s	dkB/s	drqm/s	%drqm	d_await	dareq-s	f/s	f_await	aqu-sz	%util
0.001	0.004	0.000	0.000	0.003	0.011	41.09	616.8	21.19	42.44	2.058	9.447	0.001	0.002	0.000	0.000	0.003	0.011	12.21	2.070	0.085	4.391		ma120300_rel_withdbg.cz12b_sync_c8r32
0.000	0.000	0.000	0.000	0.000	0.000	23.90	539.8	3.933	25.62	2.992	16.83	0.000	0.000	0.000	0.000	0.000	0.000	5.224	2.169	0.046	2.150		ma120300_rel_withdbg.cz12c_sync_c8r32
qr500.L3
qr500.L3: range queries with 500 insert/s per client. Graphs for performance per 1-second interval are here.
Average throughput:
Query response time histogram: each cell has the percentage of responses that take <= the time in the header and max is the max response time in seconds. For max values in the top 25% of the range have a red background and in the bottom 25% of the range have a green background. The red background is not used when the min value is within 80% of the max value.
| dbms | 256us | 1ms | 4ms | 16ms | 64ms | 256ms | 1s | 4s | 16s | gt | max |
|---|---|---|---|---|---|---|---|---|---|---|---|
| ma120300_rel_withdbg.cz12b_sync_c8r32 | 99.971 | 0.029 | nonzero | 0.002 | |||||||
| ma120300_rel_withdbg.cz12c_sync_c8r32 | 99.976 | 0.024 | nonzero | 0.002 |
Insert response time histogram: each cell has the percentage of responses that take <= the time in the header and max is the max response time in seconds. For max values in the top 25% of the range have a red background and in the bottom 25% of the range have a green background. The red background is not used when the min value is within 80% of the max value.
| dbms | 256us | 1ms | 4ms | 16ms | 64ms | 256ms | 1s | 4s | 16s | gt | max |
|---|---|---|---|---|---|---|---|---|---|---|---|
| ma120300_rel_withdbg.cz12b_sync_c8r32 | 53.389 | 46.611 | 0.064 | ||||||||
| ma120300_rel_withdbg.cz12c_sync_c8r32 | 72.106 | 27.700 | 0.194 | 0.021 |
Delete response time histogram: each cell has the percentage of responses that take <= the time in the header and max is the max response time in seconds. For max values in the top 25% of the range have a red background and in the bottom 25% of the range have a green background. The red background is not used when the min value is within 80% of the max value.
| dbms | 256us | 1ms | 4ms | 16ms | 64ms | 256ms | 1s | 4s | 16s | gt | max |
|---|---|---|---|---|---|---|---|---|---|---|---|
| ma120300_rel_withdbg.cz12b_sync_c8r32 | 52.244 | 47.756 | 0.048 | ||||||||
| ma120300_rel_withdbg.cz12c_sync_c8r32 | 72.967 | 27.011 | 0.022 | 0.020 |
Performance metrics for the DBMS listed above. Some are normalized by throughput, others are not. Legend for results is here.
ips	qps	rps	rmbps	wps	wmbps	rpq	rkbpq	wpi	wkbpi	csps	cpups	cspq	cpupq	dbgb1	dbgb2	rss	maxop	p50	p99	tag
500	9119	0	0.0	147.6	1.5	0.000	0.000	0.295	2.976	53002	12.4	5.812	109	5.3	36.1	5.9	0.002	9119	9038	ma120300_rel_withdbg.cz12b_sync_c8r32
500	9218	0	0.0	51.7	0.9	0.000	0.000	0.103	1.860	53141	12.4	5.765	108	5.7	37.0	6.3	0.002	9215	9134	ma120300_rel_withdbg.cz12c_sync_c8r32
Average values from iostat.
r/s	rkB/s	rrqm/s	%rrqm	r_await	rareq-s	w/s	wkB/s	wrqm/s	%wrqm	w_await	wareq-s	d/s	dkB/s	drqm/s	%drqm	d_await	dareq-s	f/s	f_await	aqu-sz	%util
0.000	0.000	0.000	0.000	0.000	0.000	141.4	1313.4	105.6	42.76	1.922	9.291	0.002	0.009	0.000	0.000	0.008	0.045	60.02	2.278	0.409	16.72		ma120300_rel_withdbg.cz12b_sync_c8r32
0.000	0.000	0.000	0.000	0.000	0.000	46.63	789.1	6.583	12.20	1.277	16.92	0.001	0.002	0.000	0.000	0.000	0.011	21.87	1.374	0.090	3.998		ma120300_rel_withdbg.cz12c_sync_c8r32
qp500.L4
qp500.L4: point queries with 500 insert/s per client. Graphs for performance per 1-second interval are here.
Average throughput:
Query response time histogram: each cell has the percentage of responses that take <= the time in the header and max is the max response time in seconds. For max values in the top 25% of the range have a red background and in the bottom 25% of the range have a green background. The red background is not used when the min value is within 80% of the max value.
| dbms | 256us | 1ms | 4ms | 16ms | 64ms | 256ms | 1s | 4s | 16s | gt | max |
|---|---|---|---|---|---|---|---|---|---|---|---|
| ma120300_rel_withdbg.cz12b_sync_c8r32 | 99.974 | 0.026 | nonzero | 0.002 | |||||||
| ma120300_rel_withdbg.cz12c_sync_c8r32 | 99.978 | 0.022 | nonzero | 0.002 |
Insert response time histogram: each cell has the percentage of responses that take <= the time in the header and max is the max response time in seconds. For max values in the top 25% of the range have a red background and in the bottom 25% of the range have a green background. The red background is not used when the min value is within 80% of the max value.
| dbms | 256us | 1ms | 4ms | 16ms | 64ms | 256ms | 1s | 4s | 16s | gt | max |
|---|---|---|---|---|---|---|---|---|---|---|---|
| ma120300_rel_withdbg.cz12b_sync_c8r32 | 49.950 | 50.050 | 0.049 | ||||||||
| ma120300_rel_withdbg.cz12c_sync_c8r32 | 67.922 | 31.883 | 0.194 | 0.022 |
Delete response time histogram: each cell has the percentage of responses that take <= the time in the header and max is the max response time in seconds. For max values in the top 25% of the range have a red background and in the bottom 25% of the range have a green background. The red background is not used when the min value is within 80% of the max value.
| dbms | 256us | 1ms | 4ms | 16ms | 64ms | 256ms | 1s | 4s | 16s | gt | max |
|---|---|---|---|---|---|---|---|---|---|---|---|
| ma120300_rel_withdbg.cz12b_sync_c8r32 | 48.478 | 51.522 | 0.063 | ||||||||
| ma120300_rel_withdbg.cz12c_sync_c8r32 | 68.289 | 31.689 | 0.022 | 0.020 |
Performance metrics for the DBMS listed above. Some are normalized by throughput, others are not. Legend for results is here.
ips	qps	rps	rmbps	wps	wmbps	rpq	rkbpq	wpi	wkbpi	csps	cpups	cspq	cpupq	dbgb1	dbgb2	rss	maxop	p50	p99	tag
500	8486	0	0.0	153.3	1.6	0.000	0.000	0.307	3.264	49891	12.4	5.879	117	5.3	36.1	5.9	0.002	8494	8399	ma120300_rel_withdbg.cz12b_sync_c8r32
500	8550	0	0.0	53.3	0.9	0.000	0.000	0.107	1.933	49783	12.3	5.822	115	5.7	37.0	6.3	0.002	8543	8463	ma120300_rel_withdbg.cz12c_sync_c8r32
Average values from iostat.
r/s	rkB/s	rrqm/s	%rrqm	r_await	rareq-s	w/s	wkB/s	wrqm/s	%wrqm	w_await	wareq-s	d/s	dkB/s	drqm/s	%drqm	d_await	dareq-s	f/s	f_await	aqu-sz	%util
0.000	0.000	0.000	0.000	0.000	0.000	147.7	1477.8	105.7	42.66	1.939	9.302	0.002	0.007	0.000	0.000	0.017	0.033	60.09	2.313	0.416	16.95		ma120300_rel_withdbg.cz12b_sync_c8r32
0.000	0.000	0.000	0.000	0.000	0.000	47.05	796.1	7.193	13.09	1.357	16.92	0.000	0.000	0.000	0.000	0.000	0.000	22.00	1.469	0.096	4.329		ma120300_rel_withdbg.cz12c_sync_c8r32
qr1000.L5
qr1000.L5: range queries with 1000 insert/s per client. Graphs for performance per 1-second interval are here.
Average throughput:
Query response time histogram: each cell has the percentage of responses that take <= the time in the header and max is the max response time in seconds. For max values in the top 25% of the range have a red background and in the bottom 25% of the range have a green background. The red background is not used when the min value is within 80% of the max value.
| dbms | 256us | 1ms | 4ms | 16ms | 64ms | 256ms | 1s | 4s | 16s | gt | max |
|---|---|---|---|---|---|---|---|---|---|---|---|
| ma120300_rel_withdbg.cz12b_sync_c8r32 | 99.962 | 0.037 | nonzero | nonzero | nonzero | 0.021 | |||||
| ma120300_rel_withdbg.cz12c_sync_c8r32 | 99.974 | 0.025 | nonzero | nonzero | 0.012 |
Insert response time histogram: each cell has the percentage of responses that take <= the time in the header and max is the max response time in seconds. For max values in the top 25% of the range have a red background and in the bottom 25% of the range have a green background. The red background is not used when the min value is within 80% of the max value.
| dbms | 256us | 1ms | 4ms | 16ms | 64ms | 256ms | 1s | 4s | 16s | gt | max |
|---|---|---|---|---|---|---|---|---|---|---|---|
| ma120300_rel_withdbg.cz12b_sync_c8r32 | 56.394 | 43.606 | 0.061 | ||||||||
| ma120300_rel_withdbg.cz12c_sync_c8r32 | 77.667 | 22.258 | 0.075 | 0.022 |
Delete response time histogram: each cell has the percentage of responses that take <= the time in the header and max is the max response time in seconds. For max values in the top 25% of the range have a red background and in the bottom 25% of the range have a green background. The red background is not used when the min value is within 80% of the max value.
| dbms | 256us | 1ms | 4ms | 16ms | 64ms | 256ms | 1s | 4s | 16s | gt | max |
|---|---|---|---|---|---|---|---|---|---|---|---|
| ma120300_rel_withdbg.cz12b_sync_c8r32 | 55.058 | 44.942 | 0.046 | ||||||||
| ma120300_rel_withdbg.cz12c_sync_c8r32 | 78.444 | 21.531 | 0.025 | 0.019 |
Performance metrics for the DBMS listed above. Some are normalized by throughput, others are not. Legend for results is here.
ips	qps	rps	rmbps	wps	wmbps	rpq	rkbpq	wpi	wkbpi	csps	cpups	cspq	cpupq	dbgb1	dbgb2	rss	maxop	p50	p99	tag
999	9049	0	0.0	361.0	4.5	0.000	0.000	0.361	4.643	53614	13.3	5.925	118	5.3	36.1	5.9	0.021	9055	8846	ma120300_rel_withdbg.cz12b_sync_c8r32
1000	9313	0	0.0	183.3	3.8	0.000	0.000	0.183	3.935	54243	12.9	5.824	111	5.7	37.0	6.3	0.012	9311	9103	ma120300_rel_withdbg.cz12c_sync_c8r32
Average values from iostat.
r/s	rkB/s	rrqm/s	%rrqm	r_await	rareq-s	w/s	wkB/s	wrqm/s	%wrqm	w_await	wareq-s	d/s	dkB/s	drqm/s	%drqm	d_await	dareq-s	f/s	f_await	aqu-sz	%util
0.000	0.000	0.000	0.000	0.000	0.000	355.1	4479.1	211.4	40.57	1.870	10.25	0.003	0.013	0.000	0.000	0.017	0.067	121.0	2.316	0.908	32.42		ma120300_rel_withdbg.cz12b_sync_c8r32
0.001	0.002	0.000	0.000	0.011	0.011	177.3	3774.4	5.534	5.120	1.084	17.61	0.001	0.002	0.000	0.000	0.000	0.011	42.92	1.355	0.202	6.921		ma120300_rel_withdbg.cz12c_sync_c8r32
qp1000.L6
qp1000.L6: point queries with 1000 insert/s per client. Graphs for performance per 1-second interval are here.
Average throughput:
Query response time histogram: each cell has the percentage of responses that take <= the time in the header and max is the max response time in seconds. For max values in the top 25% of the range have a red background and in the bottom 25% of the range have a green background. The red background is not used when the min value is within 80% of the max value.
| dbms | 256us | 1ms | 4ms | 16ms | 64ms | 256ms | 1s | 4s | 16s | gt | max |
|---|---|---|---|---|---|---|---|---|---|---|---|
| ma120300_rel_withdbg.cz12b_sync_c8r32 | 99.969 | 0.031 | nonzero | 0.002 | |||||||
| ma120300_rel_withdbg.cz12c_sync_c8r32 | 99.972 | 0.028 | nonzero | nonzero | 0.008 |
Insert response time histogram: each cell has the percentage of responses that take <= the time in the header and max is the max response time in seconds. For max values in the top 25% of the range have a red background and in the bottom 25% of the range have a green background. The red background is not used when the min value is within 80% of the max value.
| dbms | 256us | 1ms | 4ms | 16ms | 64ms | 256ms | 1s | 4s | 16s | gt | max |
|---|---|---|---|---|---|---|---|---|---|---|---|
| ma120300_rel_withdbg.cz12b_sync_c8r32 | 57.700 | 42.297 | 0.003 | 0.065 | |||||||
| ma120300_rel_withdbg.cz12c_sync_c8r32 | 80.994 | 18.939 | 0.067 | 0.034 |
Delete response time histogram: each cell has the percentage of responses that take <= the time in the header and max is the max response time in seconds. For max values in the top 25% of the range have a red background and in the bottom 25% of the range have a green background. The red background is not used when the min value is within 80% of the max value.
| dbms | 256us | 1ms | 4ms | 16ms | 64ms | 256ms | 1s | 4s | 16s | gt | max |
|---|---|---|---|---|---|---|---|---|---|---|---|
| ma120300_rel_withdbg.cz12b_sync_c8r32 | 56.139 | 43.861 | 0.046 | ||||||||
| ma120300_rel_withdbg.cz12c_sync_c8r32 | 81.617 | 18.350 | 0.033 | 0.034 |
Performance metrics for the DBMS listed above. Some are normalized by throughput, others are not. Legend for results is here.
ips	qps	rps	rmbps	wps	wmbps	rpq	rkbpq	wpi	wkbpi	csps	cpups	cspq	cpupq	dbgb1	dbgb2	rss	maxop	p50	p99	tag
999	8438	0	0.0	303.3	3.0	0.000	0.000	0.304	3.115	50453	13.3	5.980	126	5.3	36.1	5.9	0.002	8447	8335	ma120300_rel_withdbg.cz12b_sync_c8r32
999	8501	0	0.0	175.0	3.6	0.000	0.000	0.175	3.731	50090	13.2	5.893	124	5.7	37.0	6.3	0.008	8510	8399	ma120300_rel_withdbg.cz12c_sync_c8r32
Average values from iostat.
r/s	rkB/s	rrqm/s	%rrqm	r_await	rareq-s	w/s	wkB/s	wrqm/s	%wrqm	w_await	wareq-s	d/s	dkB/s	drqm/s	%drqm	d_await	dareq-s	f/s	f_await	aqu-sz	%util
0.000	0.000	0.000	0.000	0.000	0.000	303.5	3114.5	211.2	42.02	1.892	9.566	0.003	0.011	0.000	0.000	0.014	0.056	120.2	2.304	0.842	32.18		ma120300_rel_withdbg.cz12b_sync_c8r32
0.001	0.002	0.000	0.000	0.003	0.011	175.2	3735.7	5.950	5.451	1.033	17.74	0.001	0.002	0.000	0.000	0.008	0.011	42.98	1.287	0.194	6.612		ma120300_rel_withdbg.cz12c_sync_c8r32
l.i0
l.i0: load without secondary indexes
Performance metrics for all DBMS, not just the ones listed above. Some are normalized by throughput, others are not. Legend for results is here.
ips	qps	rps	rmbps	wps	wmbps	rpq	rkbpq	wpi	wkbpi	csps	cpups	cspq	cpupq	dbgb1	dbgb2	rss	maxop	p50	p99	tag
7036	0	0	0.0	567.8	5.1	0.000	0.000	0.081	0.737	3898	2.9	0.554	33	2.0	32.8	2.6	0.225	7299	5998	ma120300_rel_withdbg.cz12b_sync_c8r32
12290	0	0	0.0	534.0	9.1	0.000	0.000	0.043	0.758	5168	4.3	0.421	28	2.0	33.3	2.6	0.074	12398	10298	ma120300_rel_withdbg.cz12c_sync_c8r32
l.x
l.x: create secondary indexes
Performance metrics for all DBMS, not just the ones listed above. Some are normalized by throughput, others are not. Legend for results is here.
ips	qps	rps	rmbps	wps	wmbps	rpq	rkbpq	wpi	wkbpi	csps	cpups	cspq	cpupq	dbgb1	dbgb2	rss	maxop	p50	p99	tag
191083	0	0	0.0	2514.9	169.8	0.000	0.000	0.013	0.910	7390	12.2	0.039	5	4.2	35.0	4.3	0.019	NA	NA	ma120300_rel_withdbg.cz12b_sync_c8r32
193549	0	0	0.0	2076.0	164.6	0.000	0.000	0.011	0.871	5123	12.1	0.026	5	4.2	35.5	4.5	0.008	NA	NA	ma120300_rel_withdbg.cz12c_sync_c8r32
l.i1
l.i1: continue load after secondary indexes created with 50 inserts per transaction
Performance metrics for all DBMS, not just the ones listed above. Some are normalized by throughput, others are not. Legend for results is here.
ips	qps	rps	rmbps	wps	wmbps	rpq	rkbpq	wpi	wkbpi	csps	cpups	cspq	cpupq	dbgb1	dbgb2	rss	maxop	p50	p99	tag
2777	0	0	0.0	1043.0	14.0	0.000	0.000	0.376	5.168	5695	4.0	2.051	115	5.3	36.1	5.9	0.244	2750	1700	ma120300_rel_withdbg.cz12b_sync_c8r32
11071	0	0	0.0	2022.6	45.5	0.000	0.000	0.183	4.212	12271	10.5	1.108	76	5.7	37.0	6.3	0.245	12348	3749	ma120300_rel_withdbg.cz12c_sync_c8r32
l.i2
l.i2: continue load after secondary indexes created with 5 inserts per transaction
Performance metrics for all DBMS, not just the ones listed above. Some are normalized by throughput, others are not. Legend for results is here.
ips	qps	rps	rmbps	wps	wmbps	rpq	rkbpq	wpi	wkbpi	csps	cpups	cspq	cpupq	dbgb1	dbgb2	rss	maxop	p50	p99	tag
254	0	0	0.0	736.1	3.9	0.000	0.000	2.896	15.702	3972	1.8	15.626	566	5.3	36.1	5.9	0.079	240	175	ma120300_rel_withdbg.cz12b_sync_c8r32
1735	0	0	0.0	1526.2	8.6	0.000	0.000	0.880	5.049	12507	4.0	7.209	184	5.7	37.0	6.3	0.033	1920	1160	ma120300_rel_withdbg.cz12c_sync_c8r32
qr100.L1
qr100.L1: range queries with 100 insert/s per client
Performance metrics for all DBMS, not just the ones listed above. Some are normalized by throughput, others are not. Legend for results is here.
ips	qps	rps	rmbps	wps	wmbps	rpq	rkbpq	wpi	wkbpi	csps	cpups	cspq	cpupq	dbgb1	dbgb2	rss	maxop	p50	p99	tag
100	9145	0	0.0	34.7	0.4	0.000	0.000	0.348	4.417	52553	12.4	5.747	108	5.3	36.1	5.9	0.007	9151	9070	ma120300_rel_withdbg.cz12b_sync_c8r32
100	9266	0	0.0	11.2	0.2	0.000	0.000	0.112	1.877	53107	12.4	5.731	107	5.7	37.0	6.3	0.001	9246	9150	ma120300_rel_withdbg.cz12c_sync_c8r32
qp100.L2
qp100.L2: point queries with 100 insert/s per client
Performance metrics for all DBMS, not just the ones listed above. Some are normalized by throughput, others are not. Legend for results is here.
ips	qps	rps	rmbps	wps	wmbps	rpq	rkbpq	wpi	wkbpi	csps	cpups	cspq	cpupq	dbgb1	dbgb2	rss	maxop	p50	p99	tag
100	8528	0	0.0	41.0	0.6	0.000	0.000	0.410	6.157	49512	12.2	5.806	114	5.3	36.1	5.9	0.002	8527	8431	ma120300_rel_withdbg.cz12b_sync_c8r32
100	8573	0	0.0	30.2	0.7	0.000	0.000	0.303	7.156	49731	12.1	5.801	113	5.7	37.0	6.3	0.001	8575	8479	ma120300_rel_withdbg.cz12c_sync_c8r32
qr500.L3
qr500.L3: range queries with 500 insert/s per client
Performance metrics for all DBMS, not just the ones listed above. Some are normalized by throughput, others are not. Legend for results is here.
ips	qps	rps	rmbps	wps	wmbps	rpq	rkbpq	wpi	wkbpi	csps	cpups	cspq	cpupq	dbgb1	dbgb2	rss	maxop	p50	p99	tag
500	9119	0	0.0	147.6	1.5	0.000	0.000	0.295	2.976	53002	12.4	5.812	109	5.3	36.1	5.9	0.002	9119	9038	ma120300_rel_withdbg.cz12b_sync_c8r32
500	9218	0	0.0	51.7	0.9	0.000	0.000	0.103	1.860	53141	12.4	5.765	108	5.7	37.0	6.3	0.002	9215	9134	ma120300_rel_withdbg.cz12c_sync_c8r32
qp500.L4
qp500.L4: point queries with 500 insert/s per client
Performance metrics for all DBMS, not just the ones listed above. Some are normalized by throughput, others are not. Legend for results is here.
ips	qps	rps	rmbps	wps	wmbps	rpq	rkbpq	wpi	wkbpi	csps	cpups	cspq	cpupq	dbgb1	dbgb2	rss	maxop	p50	p99	tag
500	8486	0	0.0	153.3	1.6	0.000	0.000	0.307	3.264	49891	12.4	5.879	117	5.3	36.1	5.9	0.002	8494	8399	ma120300_rel_withdbg.cz12b_sync_c8r32
500	8550	0	0.0	53.3	0.9	0.000	0.000	0.107	1.933	49783	12.3	5.822	115	5.7	37.0	6.3	0.002	8543	8463	ma120300_rel_withdbg.cz12c_sync_c8r32
qr1000.L5
qr1000.L5: range queries with 1000 insert/s per client
Performance metrics for all DBMS, not just the ones listed above. Some are normalized by throughput, others are not. Legend for results is here.
ips	qps	rps	rmbps	wps	wmbps	rpq	rkbpq	wpi	wkbpi	csps	cpups	cspq	cpupq	dbgb1	dbgb2	rss	maxop	p50	p99	tag
999	9049	0	0.0	361.0	4.5	0.000	0.000	0.361	4.643	53614	13.3	5.925	118	5.3	36.1	5.9	0.021	9055	8846	ma120300_rel_withdbg.cz12b_sync_c8r32
1000	9313	0	0.0	183.3	3.8	0.000	0.000	0.183	3.935	54243	12.9	5.824	111	5.7	37.0	6.3	0.012	9311	9103	ma120300_rel_withdbg.cz12c_sync_c8r32
qp1000.L6
qp1000.L6: point queries with 1000 insert/s per client
Performance metrics for all DBMS, not just the ones listed above. Some are normalized by throughput, others are not. Legend for results is here.
ips	qps	rps	rmbps	wps	wmbps	rpq	rkbpq	wpi	wkbpi	csps	cpups	cspq	cpupq	dbgb1	dbgb2	rss	maxop	p50	p99	tag
999	8438	0	0.0	303.3	3.0	0.000	0.000	0.304	3.115	50453	13.3	5.980	126	5.3	36.1	5.9	0.002	8447	8335	ma120300_rel_withdbg.cz12b_sync_c8r32
999	8501	0	0.0	175.0	3.6	0.000	0.000	0.175	3.731	50090	13.2	5.893	124	5.7	37.0	6.3	0.008	8510	8399	ma120300_rel_withdbg.cz12c_sync_c8r32
l.i0
- l.i0: load without secondary indexes
- Legend for results is here.
- Each entry lists the percentage of responses that fit in that bucket (slower than max time for previous bucket, faster than min time for next bucket).
Insert response time histogram
256us	1ms	4ms	16ms	64ms	256ms	1s	4s	16s	gt	max	tag
0.000	0.000	0.000	85.577	14.423	0.001	0.000	0.000	0.000	0.000	0.225	ma120300_rel_withdbg.cz12b_sync_c8r32
0.000	0.000	0.004	99.766	0.229	nonzero	0.000	0.000	0.000	0.000	0.074	ma120300_rel_withdbg.cz12c_sync_c8r32
l.x
- l.x: create secondary indexes
- Legend for results is here.
- Each entry lists the percentage of responses that fit in that bucket (slower than max time for previous bucket, faster than min time for next bucket).
TODO - determine whether there is data for create index response time
l.i1
- l.i1: continue load after secondary indexes created with 50 inserts per transaction
- Legend for results is here.
- Each entry lists the percentage of responses that fit in that bucket (slower than max time for previous bucket, faster than min time for next bucket).
Insert response time histogram
256us	1ms	4ms	16ms	64ms	256ms	1s	4s	16s	gt	max	tag
0.000	0.000	0.000	50.492	49.488	0.020	0.000	0.000	0.000	0.000	0.244	ma120300_rel_withdbg.cz12b_sync_c8r32
0.000	0.000	73.114	26.504	0.381	0.001	0.000	0.000	0.000	0.000	0.245	ma120300_rel_withdbg.cz12c_sync_c8r32
Delete response time histogram
256us	1ms	4ms	16ms	64ms	256ms	1s	4s	16s	gt	max	tag
0.000	0.000	0.000	50.033	49.947	0.020	0.000	0.000	0.000	0.000	0.227	ma120300_rel_withdbg.cz12b_sync_c8r32
0.000	0.000	73.084	26.651	0.264	0.001	0.000	0.000	0.000	0.000	0.224	ma120300_rel_withdbg.cz12c_sync_c8r32
l.i2
- l.i2: continue load after secondary indexes created with 5 inserts per transaction
- Legend for results is here.
- Each entry lists the percentage of responses that fit in that bucket (slower than max time for previous bucket, faster than min time for next bucket).
Insert response time histogram
256us	1ms	4ms	16ms	64ms	256ms	1s	4s	16s	gt	max	tag
0.000	0.000	0.000	26.537	73.462	0.001	0.000	0.000	0.000	0.000	0.079	ma120300_rel_withdbg.cz12b_sync_c8r32
0.000	0.000	89.759	10.238	0.003	0.000	0.000	0.000	0.000	0.000	0.033	ma120300_rel_withdbg.cz12c_sync_c8r32
Delete response time histogram
256us	1ms	4ms	16ms	64ms	256ms	1s	4s	16s	gt	max	tag
0.000	0.000	0.000	26.532	73.466	0.002	0.000	0.000	0.000	0.000	0.108	ma120300_rel_withdbg.cz12b_sync_c8r32
0.000	nonzero	89.717	10.280	0.003	0.000	0.000	0.000	0.000	0.000	0.037	ma120300_rel_withdbg.cz12c_sync_c8r32
qr100.L1
- qr100.L1: range queries with 100 insert/s per client
- Legend for results is here.
- Each entry lists the percentage of responses that fit in that bucket (slower than max time for previous bucket, faster than min time for next bucket).
Query response time histogram
256us	1ms	4ms	16ms	64ms	256ms	1s	4s	16s	gt	max	tag
99.977	0.023	nonzero	nonzero	0.000	0.000	0.000	0.000	0.000	0.000	0.007	ma120300_rel_withdbg.cz12b_sync_c8r32
99.986	0.014	0.000	0.000	0.000	0.000	0.000	0.000	0.000	0.000	0.001	ma120300_rel_withdbg.cz12c_sync_c8r32
Insert response time histogram
256us	1ms	4ms	16ms	64ms	256ms	1s	4s	16s	gt	max	tag
0.000	0.000	0.000	33.056	66.944	0.000	0.000	0.000	0.000	0.000	0.051	ma120300_rel_withdbg.cz12b_sync_c8r32
0.000	0.000	27.278	69.167	3.556	0.000	0.000	0.000	0.000	0.000	0.024	ma120300_rel_withdbg.cz12c_sync_c8r32
Delete response time histogram
256us	1ms	4ms	16ms	64ms	256ms	1s	4s	16s	gt	max	tag
0.000	0.000	0.000	31.889	68.056	0.056	0.000	0.000	0.000	0.000	0.066	ma120300_rel_withdbg.cz12b_sync_c8r32
0.000	0.000	12.194	86.056	1.750	0.000	0.000	0.000	0.000	0.000	0.026	ma120300_rel_withdbg.cz12c_sync_c8r32
qp100.L2
- qp100.L2: point queries with 100 insert/s per client
- Legend for results is here.
- Each entry lists the percentage of responses that fit in that bucket (slower than max time for previous bucket, faster than min time for next bucket).
Query response time histogram
256us	1ms	4ms	16ms	64ms	256ms	1s	4s	16s	gt	max	tag
99.981	0.019	nonzero	0.000	0.000	0.000	0.000	0.000	0.000	0.000	0.002	ma120300_rel_withdbg.cz12b_sync_c8r32
99.987	0.013	nonzero	0.000	0.000	0.000	0.000	0.000	0.000	0.000	0.001	ma120300_rel_withdbg.cz12c_sync_c8r32
Insert response time histogram
256us	1ms	4ms	16ms	64ms	256ms	1s	4s	16s	gt	max	tag
0.000	0.000	0.000	31.611	68.389	0.000	0.000	0.000	0.000	0.000	0.056	ma120300_rel_withdbg.cz12b_sync_c8r32
0.000	0.000	13.806	70.944	15.250	0.000	0.000	0.000	0.000	0.000	0.033	ma120300_rel_withdbg.cz12c_sync_c8r32
Delete response time histogram
256us	1ms	4ms	16ms	64ms	256ms	1s	4s	16s	gt	max	tag
0.000	0.000	0.000	28.861	71.111	0.028	0.000	0.000	0.000	0.000	0.065	ma120300_rel_withdbg.cz12b_sync_c8r32
0.000	0.000	7.861	86.778	5.361	0.000	0.000	0.000	0.000	0.000	0.022	ma120300_rel_withdbg.cz12c_sync_c8r32
qr500.L3
- qr500.L3: range queries with 500 insert/s per client
- Legend for results is here.
- Each entry lists the percentage of responses that fit in that bucket (slower than max time for previous bucket, faster than min time for next bucket).
Query response time histogram
256us	1ms	4ms	16ms	64ms	256ms	1s	4s	16s	gt	max	tag
99.971	0.029	nonzero	0.000	0.000	0.000	0.000	0.000	0.000	0.000	0.002	ma120300_rel_withdbg.cz12b_sync_c8r32
99.976	0.024	nonzero	0.000	0.000	0.000	0.000	0.000	0.000	0.000	0.002	ma120300_rel_withdbg.cz12c_sync_c8r32
Insert response time histogram
256us	1ms	4ms	16ms	64ms	256ms	1s	4s	16s	gt	max	tag
0.000	0.000	0.000	53.389	46.611	0.000	0.000	0.000	0.000	0.000	0.064	ma120300_rel_withdbg.cz12b_sync_c8r32
0.000	0.000	72.106	27.700	0.194	0.000	0.000	0.000	0.000	0.000	0.021	ma120300_rel_withdbg.cz12c_sync_c8r32
Delete response time histogram
256us	1ms	4ms	16ms	64ms	256ms	1s	4s	16s	gt	max	tag
0.000	0.000	0.000	52.244	47.756	0.000	0.000	0.000	0.000	0.000	0.048	ma120300_rel_withdbg.cz12b_sync_c8r32
0.000	0.000	72.967	27.011	0.022	0.000	0.000	0.000	0.000	0.000	0.020	ma120300_rel_withdbg.cz12c_sync_c8r32
qp500.L4
- qp500.L4: point queries with 500 insert/s per client
- Legend for results is here.
- Each entry lists the percentage of responses that fit in that bucket (slower than max time for previous bucket, faster than min time for next bucket).
Query response time histogram
256us	1ms	4ms	16ms	64ms	256ms	1s	4s	16s	gt	max	tag
99.974	0.026	nonzero	0.000	0.000	0.000	0.000	0.000	0.000	0.000	0.002	ma120300_rel_withdbg.cz12b_sync_c8r32
99.978	0.022	nonzero	0.000	0.000	0.000	0.000	0.000	0.000	0.000	0.002	ma120300_rel_withdbg.cz12c_sync_c8r32
Insert response time histogram
256us	1ms	4ms	16ms	64ms	256ms	1s	4s	16s	gt	max	tag
0.000	0.000	0.000	49.950	50.050	0.000	0.000	0.000	0.000	0.000	0.049	ma120300_rel_withdbg.cz12b_sync_c8r32
0.000	0.000	67.922	31.883	0.194	0.000	0.000	0.000	0.000	0.000	0.022	ma120300_rel_withdbg.cz12c_sync_c8r32
Delete response time histogram
256us	1ms	4ms	16ms	64ms	256ms	1s	4s	16s	gt	max	tag
0.000	0.000	0.000	48.478	51.522	0.000	0.000	0.000	0.000	0.000	0.063	ma120300_rel_withdbg.cz12b_sync_c8r32
0.000	0.000	68.289	31.689	0.022	0.000	0.000	0.000	0.000	0.000	0.020	ma120300_rel_withdbg.cz12c_sync_c8r32
qr1000.L5
- qr1000.L5: range queries with 1000 insert/s per client
- Legend for results is here.
- Each entry lists the percentage of responses that fit in that bucket (slower than max time for previous bucket, faster than min time for next bucket).
Query response time histogram
256us	1ms	4ms	16ms	64ms	256ms	1s	4s	16s	gt	max	tag
99.962	0.037	nonzero	nonzero	nonzero	0.000	0.000	0.000	0.000	0.000	0.021	ma120300_rel_withdbg.cz12b_sync_c8r32
99.974	0.025	nonzero	nonzero	0.000	0.000	0.000	0.000	0.000	0.000	0.012	ma120300_rel_withdbg.cz12c_sync_c8r32
Insert response time histogram
256us	1ms	4ms	16ms	64ms	256ms	1s	4s	16s	gt	max	tag
0.000	0.000	0.000	56.394	43.606	0.000	0.000	0.000	0.000	0.000	0.061	ma120300_rel_withdbg.cz12b_sync_c8r32
0.000	0.000	77.667	22.258	0.075	0.000	0.000	0.000	0.000	0.000	0.022	ma120300_rel_withdbg.cz12c_sync_c8r32
Delete response time histogram
256us	1ms	4ms	16ms	64ms	256ms	1s	4s	16s	gt	max	tag
0.000	0.000	0.000	55.058	44.942	0.000	0.000	0.000	0.000	0.000	0.046	ma120300_rel_withdbg.cz12b_sync_c8r32
0.000	0.000	78.444	21.531	0.025	0.000	0.000	0.000	0.000	0.000	0.019	ma120300_rel_withdbg.cz12c_sync_c8r32
qp1000.L6
- qp1000.L6: point queries with 1000 insert/s per client
- Legend for results is here.
- Each entry lists the percentage of responses that fit in that bucket (slower than max time for previous bucket, faster than min time for next bucket).
Query response time histogram
256us	1ms	4ms	16ms	64ms	256ms	1s	4s	16s	gt	max	tag
99.969	0.031	nonzero	0.000	0.000	0.000	0.000	0.000	0.000	0.000	0.002	ma120300_rel_withdbg.cz12b_sync_c8r32
99.972	0.028	nonzero	nonzero	0.000	0.000	0.000	0.000	0.000	0.000	0.008	ma120300_rel_withdbg.cz12c_sync_c8r32
Insert response time histogram
256us	1ms	4ms	16ms	64ms	256ms	1s	4s	16s	gt	max	tag
0.000	0.000	0.000	57.700	42.297	0.003	0.000	0.000	0.000	0.000	0.065	ma120300_rel_withdbg.cz12b_sync_c8r32
0.000	0.000	80.994	18.939	0.067	0.000	0.000	0.000	0.000	0.000	0.034	ma120300_rel_withdbg.cz12c_sync_c8r32
Delete response time histogram
256us	1ms	4ms	16ms	64ms	256ms	1s	4s	16s	gt	max	tag
0.000	0.000	0.000	56.139	43.861	0.000	0.000	0.000	0.000	0.000	0.046	ma120300_rel_withdbg.cz12b_sync_c8r32
0.000	0.000	81.617	18.350	0.033	0.000	0.000	0.000	0.000	0.000	0.034	ma120300_rel_withdbg.cz12c_sync_c8r32