Introduction
This is a report for the insert benchmark with 800M docs and 1 client(s). It is generated by scripts (bash, awk, sed) and Tufte might not be impressed. An overview of the insert benchmark is here and a short update is here. Below, by DBMS, I mean DBMS+version.config. An example is my8020.c10b40 where my means MySQL, 8020 is version 8.0.20 and c10b40 is the name for the configuration file.
The test server has 8 AMD cores, 32G RAM and an NVMe device for the database. The benchmark was run with 1 client and there were 1 or 3 connections per client (1 for queries or inserts without rate limits, 1+1 for rate limited inserts+deletes). It uses 1 table with a table per client. It loads 800M rows per table without secondary indexes, creates 3 secondary indexes per table, then inserts 4m+1m rows per table with a delete per insert to avoid growing the table. It then does 6 read+write tests for 1800s each that do queries as fast as possible with 100,100,500,500,1000,1000 inserts/s and the same for deletes/s per client concurrent with the queries. The database is larger than memory and the workload is IO-bound for except for the range query tests (qr*). Clients and the DBMS share one server.
The tested DBMS are:
- ma120300_rel_withdbg.cz12b_c8r32 - MariaDB 12.3.0 with the z12b_c8r32 config
- ma120300_rel_withdbg.cz12c_c8r32 - MariaDB 12.3.0 with the z12c_c8r32 config that uses the binlog storage engine
- ma120300_rel_withdbg.cz12b_sync_c8r32 - MariaDB 12.3.0 with the z12b_c8r32 config that syncs InnoDB and the binlog on commit
- ma120300_rel_withdbg.cz12c_sync_c8r32 - MariaDB 12.3.0 with the z12c_c8r32 config that uses the binlog storage engine and syncs InnoDB on commit
Contents
- Summary
- l.i0: load without secondary indexes
- l.x: create secondary indexes
- l.i1: continue load after secondary indexes created with 50 inserts per transaction
- l.i2: continue load after secondary indexes created with 5 inserts per transaction
- qr100.L1: range queries with 100 insert/s per client
- qp100.L2: point queries with 100 insert/s per client
- qr500.L3: range queries with 500 insert/s per client
- qp500.L4: point queries with 500 insert/s per client
- qr1000.L5: range queries with 1000 insert/s per client
- qp1000.L6: point queries with 1000 insert/s per client
Summary
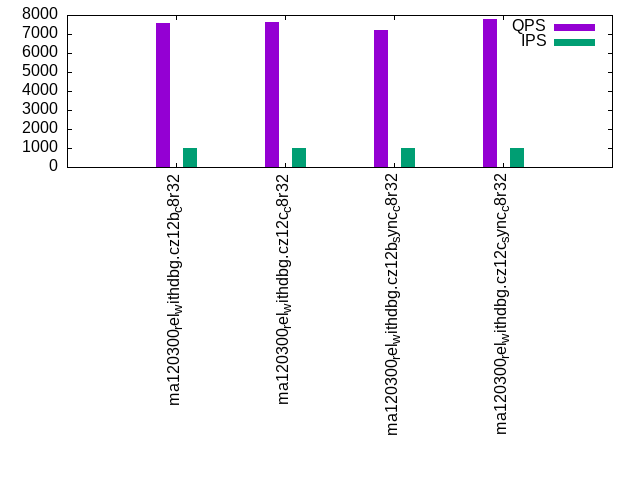
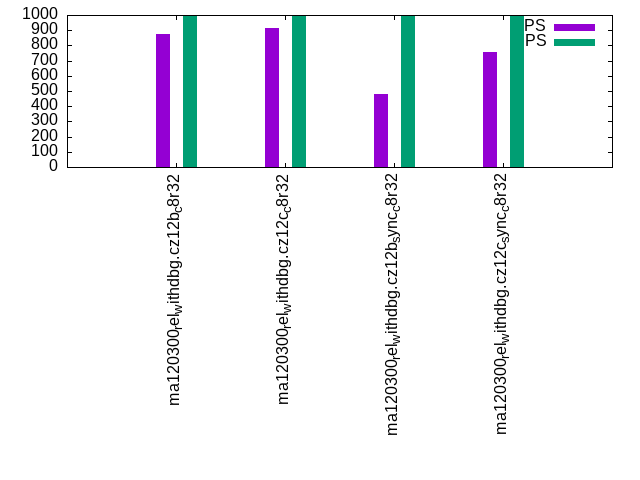
The numbers are inserts/s for l.i0, l.i1 and l.i2, indexed docs (or rows) /s for l.x and queries/s for qr100, qp100 thru qr1000, qp1000" The values are the average rate over the entire test for inserts (IPS) and queries (QPS). The range of values for IPS and QPS is split into 3 parts: bottom 25%, middle 50%, top 25%. Values in the bottom 25% have a red background, values in the top 25% have a green background and values in the middle have no color. A gray background is used for values that can be ignored because the DBMS did not sustain the target insert rate. Red backgrounds are not used when the minimum value is within 80% of the max value.
| dbms | l.i0 | l.x | l.i1 | l.i2 | qr100 | qp100 | qr500 | qp500 | qr1000 | qp1000 |
|---|---|---|---|---|---|---|---|---|---|---|
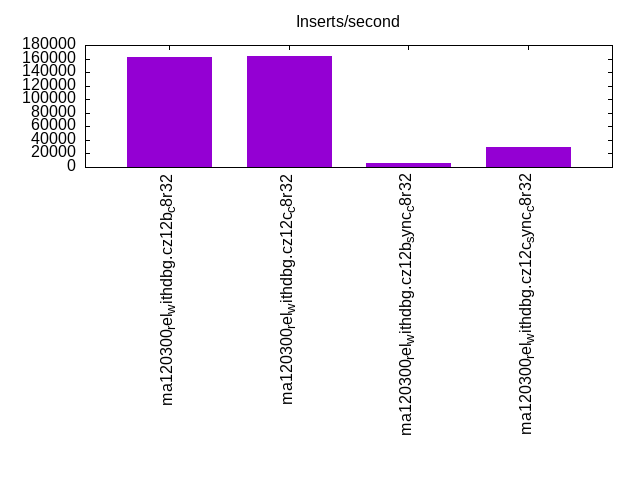
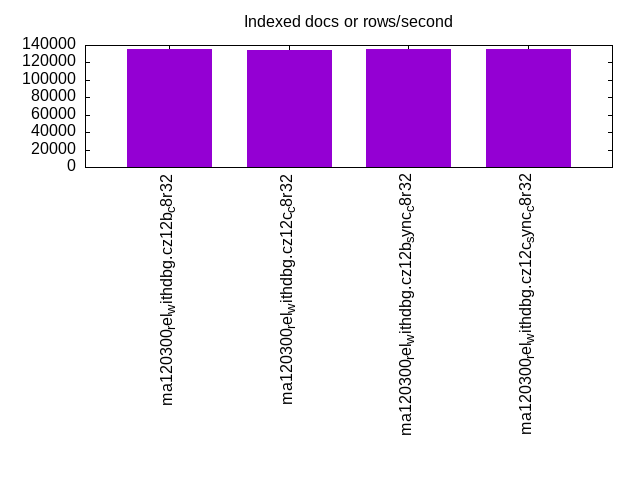
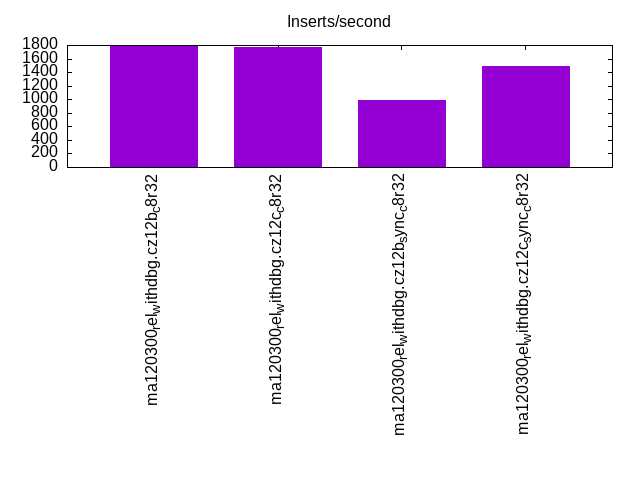
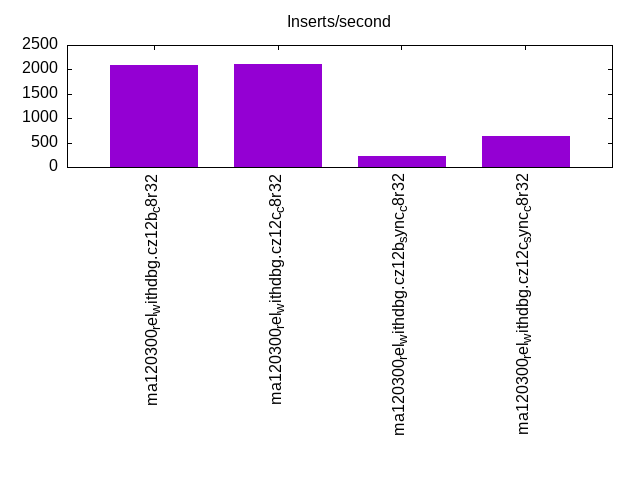
| ma120300_rel_withdbg.cz12b_c8r32 | 162966 | 135593 | 1793 | 2092 | 8478 | 1338 | 8022 | 1081 | 7601 | 878 |
| ma120300_rel_withdbg.cz12c_c8r32 | 164170 | 134341 | 1775 | 2119 | 8592 | 1349 | 8128 | 1162 | 7648 | 917 |
| ma120300_rel_withdbg.cz12b_sync_c8r32 | 6252 | 135478 | 990 | 216 | 8685 | 1296 | 8055 | 870 | 7199 | 481 |
| ma120300_rel_withdbg.cz12c_sync_c8r32 | 29664 | 135135 | 1489 | 645 | 8649 | 1347 | 8190 | 1043 | 7781 | 754 |
This table has relative throughput, throughput for the DBMS relative to the DBMS in the first line, using the absolute throughput from the previous table. Values less than 0.95 have a yellow background. Values greater than 1.05 have a blue background.
| dbms | l.i0 | l.x | l.i1 | l.i2 | qr100 | qp100 | qr500 | qp500 | qr1000 | qp1000 |
|---|---|---|---|---|---|---|---|---|---|---|
| ma120300_rel_withdbg.cz12b_c8r32 | 1.00 | 1.00 | 1.00 | 1.00 | 1.00 | 1.00 | 1.00 | 1.00 | 1.00 | 1.00 |
| ma120300_rel_withdbg.cz12c_c8r32 | 1.01 | 0.99 | 0.99 | 1.01 | 1.01 | 1.01 | 1.01 | 1.07 | 1.01 | 1.04 |
| ma120300_rel_withdbg.cz12b_sync_c8r32 | 0.04 | 1.00 | 0.55 | 0.10 | 1.02 | 0.97 | 1.00 | 0.80 | 0.95 | 0.55 |
| ma120300_rel_withdbg.cz12c_sync_c8r32 | 0.18 | 1.00 | 0.83 | 0.31 | 1.02 | 1.01 | 1.02 | 0.96 | 1.02 | 0.86 |
This lists the average rate of inserts/s for the tests that do inserts concurrent with queries. For such tests the query rate is listed in the table above. The read+write tests are setup so that the insert rate should match the target rate every second. Cells that are not at least 95% of the target have a red background to indicate a failure to satisfy the target.
| dbms | qr100.L1 | qp100.L2 | qr500.L3 | qp500.L4 | qr1000.L5 | qp1000.L6 |
|---|---|---|---|---|---|---|
| ma120300_rel_withdbg.cz12b_c8r32 | 100 | 100 | 500 | 499 | 999 | 999 |
| ma120300_rel_withdbg.cz12c_c8r32 | 100 | 100 | 500 | 500 | 999 | 999 |
| ma120300_rel_withdbg.cz12b_sync_c8r32 | 100 | 100 | 500 | 499 | 999 | 999 |
| ma120300_rel_withdbg.cz12c_sync_c8r32 | 100 | 100 | 500 | 500 | 999 | 999 |
| target | 100 | 100 | 500 | 500 | 1000 | 1000 |
l.i0
l.i0: load without secondary indexes. Graphs for performance per 1-second interval are here.
Average throughput:
Insert response time histogram: each cell has the percentage of responses that take <= the time in the header and max is the max response time in seconds. For the max column values in the top 25% of the range have a red background and in the bottom 25% of the range have a green background. The red background is not used when the min value is within 80% of the max value.
| dbms | 256us | 1ms | 4ms | 16ms | 64ms | 256ms | 1s | 4s | 16s | gt | max |
|---|---|---|---|---|---|---|---|---|---|---|---|
| ma120300_rel_withdbg.cz12b_c8r32 | 99.659 | 0.146 | 0.142 | 0.049 | 0.004 | 0.157 | |||||
| ma120300_rel_withdbg.cz12c_c8r32 | 99.680 | 0.132 | 0.062 | 0.125 | 0.001 | 0.229 | |||||
| ma120300_rel_withdbg.cz12b_sync_c8r32 | 59.499 | 40.500 | 0.001 | 0.231 | |||||||
| ma120300_rel_withdbg.cz12c_sync_c8r32 | 76.879 | 23.075 | 0.046 | nonzero | 0.199 |
Performance metrics for the DBMS listed above. Some are normalized by throughput, others are not. Legend for results is here.
ips	qps	rps	rmbps	wps	wmbps	rpq	rkbpq	wpi	wkbpi	csps	cpups	cspq	cpupq	dbgb1	dbgb2	rss	maxop	p50	p99	tag
162966	0	0	0.0	978.0	43.8	0.000	0.000	0.006	0.275	22195	20.1	0.136	10	52.6	83.4	23.4	0.157	164075	143582	ma120300_rel_withdbg.cz12b_c8r32
164170	0	0	0.0	1141.5	62.2	0.000	0.000	0.007	0.388	23816	20.2	0.145	10	52.6	83.9	23.4	0.229	164676	150175	ma120300_rel_withdbg.cz12c_c8r32
6252	0	0	0.0	491.6	4.5	0.000	0.000	0.079	0.729	3025	2.0	0.484	26	52.6	83.4	23.4	0.231	6399	4400	ma120300_rel_withdbg.cz12b_sync_c8r32
29664	0	0	0.0	883.8	14.6	0.000	0.000	0.030	0.504	7155	5.9	0.241	16	52.6	83.9	23.4	0.199	26496	10799	ma120300_rel_withdbg.cz12c_sync_c8r32
Average values from iostat.
r/s	rkB/s	rrqm/s	%rrqm	r_await	rareq-s	w/s	wkB/s	wrqm/s	%wrqm	w_await	wareq-s	d/s	dkB/s	drqm/s	%drqm	d_await	dareq-s	f/s	f_await	aqu-sz	%util
0.343	1.679	0.009	0.161	2.337	3.071	978.9	44850.8	25.77	3.310	1.349	49.68	0.714	574.1	0.000	0.000	0.382	442.2	15.44	0.967	1.073	7.081		ma120300_rel_withdbg.cz12b_c8r32
0.263	1.328	0.002	0.057	2.185	2.619	1142.3	63690.5	26.96	2.554	1.973	61.26	0.373	20.47	0.000	0.000	0.561	28.69	16.62	1.602	2.021	8.827		ma120300_rel_withdbg.cz12c_c8r32
0.011	0.055	0.000	0.003	0.010	0.199	491.6	4557.4	431.1	47.10	1.945	9.047	2.653	1208.0	0.000	0.000	0.101	29.91	188.2	2.583	1.408	89.33		ma120300_rel_withdbg.cz12b_sync_c8r32
0.047	0.242	0.001	0.014	0.027	0.571	883.9	14959.2	306.8	25.81	1.247	17.01	9.256	28876.3	0.000	0.000	0.268	692.0	328.9	1.551	1.431	74.79		ma120300_rel_withdbg.cz12c_sync_c8r32
l.x
l.x: create secondary indexes.
Average throughput:
Performance metrics for the DBMS listed above. Some are normalized by throughput, others are not. Legend for results is here.
ips	qps	rps	rmbps	wps	wmbps	rpq	rkbpq	wpi	wkbpi	csps	cpups	cspq	cpupq	dbgb1	dbgb2	rss	maxop	p50	p99	tag
135593	0	1443	134.2	1623.4	149.7	0.011	1.014	0.012	1.130	4510	12.2	0.033	7	111.5	142.3	23.4	0.001	NA	NA	ma120300_rel_withdbg.cz12b_c8r32
134341	0	1433	133.3	1599.4	148.2	0.011	1.016	0.012	1.130	4481	11.7	0.033	7	111.5	142.8	23.4	0.001	NA	NA	ma120300_rel_withdbg.cz12c_c8r32
135478	0	1446	134.2	1620.0	149.6	0.011	1.014	0.012	1.131	4478	11.9	0.033	7	111.5	142.3	23.4	0.018	NA	NA	ma120300_rel_withdbg.cz12b_sync_c8r32
135135	0	1440	134.0	1612.1	149.1	0.011	1.016	0.012	1.130	4506	11.8	0.033	7	111.5	142.8	23.4	0.005	NA	NA	ma120300_rel_withdbg.cz12c_sync_c8r32
Average values from iostat.
r/s	rkB/s	rrqm/s	%rrqm	r_await	rareq-s	w/s	wkB/s	wrqm/s	%wrqm	w_await	wareq-s	d/s	dkB/s	drqm/s	%drqm	d_await	dareq-s	f/s	f_await	aqu-sz	%util
1442.9	137553	0.000	0.000	0.131	103.5	1622.9	153364	15.10	1.316	0.477	117.4	1.102	11663.0	0.000	0.000	0.002	33.65	6.367	1.926	0.729	18.67		ma120300_rel_withdbg.cz12b_c8r32
1432.6	136623	0.000	0.000	0.148	103.6	1600.6	151896	15.19	1.353	0.533	117.6	0.648	5521.0	0.000	0.000	0.004	22.83	6.801	2.624	0.810	20.18		ma120300_rel_withdbg.cz12c_c8r32
1445.2	137464	0.000	0.000	0.141	103.3	1621.2	153307	16.45	1.378	0.509	117.4	1.286	11439.0	0.000	0.000	0.002	29.05	6.365	2.758	0.802	20.38		ma120300_rel_withdbg.cz12b_sync_c8r32
1439.8	137326	0.000	0.000	0.145	103.6	1611.6	152785	15.39	1.337	0.490	117.5	1.029	11667.6	0.000	0.000	0.002	49.20	6.866	2.471	0.786	20.26		ma120300_rel_withdbg.cz12c_sync_c8r32
l.i1
l.i1: continue load after secondary indexes created with 50 inserts per transaction. Graphs for performance per 1-second interval are here.
Average throughput:
Insert response time histogram: each cell has the percentage of responses that take <= the time in the header and max is the max response time in seconds. For the max column values in the top 25% of the range have a red background and in the bottom 25% of the range have a green background. The red background is not used when the min value is within 80% of the max value.
| dbms | 256us | 1ms | 4ms | 16ms | 64ms | 256ms | 1s | 4s | 16s | gt | max |
|---|---|---|---|---|---|---|---|---|---|---|---|
| ma120300_rel_withdbg.cz12b_c8r32 | 47.413 | 43.230 | 9.356 | 0.001 | 2.503 | ||||||
| ma120300_rel_withdbg.cz12c_c8r32 | 47.689 | 42.983 | 9.328 | 0.001 | 3.045 | ||||||
| ma120300_rel_withdbg.cz12b_sync_c8r32 | 79.880 | 20.117 | 0.001 | 0.001 | 3.155 | ||||||
| ma120300_rel_withdbg.cz12c_sync_c8r32 | 5.121 | 82.115 | 12.762 | 0.001 | 2.504 |
Delete response time histogram: each cell has the percentage of responses that take <= the time in the header and max is the max response time in seconds. For the max column values in the top 25% of the range have a red background and in the bottom 25% of the range have a green background. The red background is not used when the min value is within 80% of the max value.
| dbms | 256us | 1ms | 4ms | 16ms | 64ms | 256ms | 1s | 4s | 16s | gt | max |
|---|---|---|---|---|---|---|---|---|---|---|---|
| ma120300_rel_withdbg.cz12b_c8r32 | 70.876 | 29.040 | 0.083 | 0.001 | 2.467 | ||||||
| ma120300_rel_withdbg.cz12c_c8r32 | 70.764 | 29.121 | 0.114 | 0.001 | 3.005 | ||||||
| ma120300_rel_withdbg.cz12b_sync_c8r32 | 0.220 | 98.905 | 0.874 | 0.001 | 3.080 | ||||||
| ma120300_rel_withdbg.cz12c_sync_c8r32 | 70.843 | 29.020 | 0.136 | 0.001 | 2.459 |
Performance metrics for the DBMS listed above. Some are normalized by throughput, others are not. Legend for results is here.
ips	qps	rps	rmbps	wps	wmbps	rpq	rkbpq	wpi	wkbpi	csps	cpups	cspq	cpupq	dbgb1	dbgb2	rss	maxop	p50	p99	tag
1793	0	8395	131.2	9476.7	250.4	4.682	74.919	5.286	143.009	75723	11.6	42.235	518	133.0	163.8	23.5	2.503	1800	600	ma120300_rel_withdbg.cz12b_c8r32
1775	0	8308	129.8	9379.9	248.0	4.680	74.874	5.283	143.040	74926	11.4	42.202	514	133.0	164.3	23.5	3.045	1750	600	ma120300_rel_withdbg.cz12c_c8r32
990	0	4636	72.4	5716.7	146.1	4.681	74.894	5.772	151.076	41523	6.7	41.921	541	133.0	163.8	23.5	3.155	1000	500	ma120300_rel_withdbg.cz12b_sync_c8r32
1489	0	6968	108.9	7968.4	208.7	4.679	74.869	5.351	143.473	62104	9.7	41.703	521	133.0	164.3	23.5	2.504	1500	550	ma120300_rel_withdbg.cz12c_sync_c8r32
Average values from iostat.
r/s	rkB/s	rrqm/s	%rrqm	r_await	rareq-s	w/s	wkB/s	wrqm/s	%wrqm	w_await	wareq-s	d/s	dkB/s	drqm/s	%drqm	d_await	dareq-s	f/s	f_await	aqu-sz	%util
8400.7	134409	0.000	0.000	0.158	16.00	9491.5	256853	79.37	0.989	0.341	27.45	0.005	0.058	0.000	0.000	0.015	0.216	123.2	2.869	4.877	83.94		ma120300_rel_withdbg.cz12b_c8r32
8317.1	133072	0.000	0.000	0.159	16.00	9394.5	254410	71.88	0.936	0.361	27.42	0.001	0.004	0.000	0.000	0.002	0.018	124.4	2.909	5.041	84.40		ma120300_rel_withdbg.cz12c_c8r32
4638.7	74218.7	0.000	0.000	0.219	16.00	5719.1	149745	242.5	4.553	0.888	26.41	0.003	0.136	0.000	0.000	0.025	0.680	190.9	3.019	6.682	92.52		ma120300_rel_withdbg.cz12b_sync_c8r32
6972.3	111557	0.000	0.000	0.184	16.00	7977.8	213952	62.31	0.887	0.548	27.04	0.002	0.009	0.000	0.000	0.026	0.045	163.3	2.931	6.141	86.41		ma120300_rel_withdbg.cz12c_sync_c8r32
l.i2
l.i2: continue load after secondary indexes created with 5 inserts per transaction. Graphs for performance per 1-second interval are here.
Average throughput:
Insert response time histogram: each cell has the percentage of responses that take <= the time in the header and max is the max response time in seconds. For the max column values in the top 25% of the range have a red background and in the bottom 25% of the range have a green background. The red background is not used when the min value is within 80% of the max value.
| dbms | 256us | 1ms | 4ms | 16ms | 64ms | 256ms | 1s | 4s | 16s | gt | max |
|---|---|---|---|---|---|---|---|---|---|---|---|
| ma120300_rel_withdbg.cz12b_c8r32 | 15.839 | 67.537 | 16.026 | 0.599 | 0.045 | ||||||
| ma120300_rel_withdbg.cz12c_c8r32 | 0.001 | 16.260 | 67.809 | 15.223 | 0.708 | 0.001 | 0.134 | ||||
| ma120300_rel_withdbg.cz12b_sync_c8r32 | 3.925 | 95.969 | 0.107 | 0.153 | |||||||
| ma120300_rel_withdbg.cz12c_sync_c8r32 | 11.200 | 85.374 | 3.423 | 0.002 | 0.001 | 0.385 |
Delete response time histogram: each cell has the percentage of responses that take <= the time in the header and max is the max response time in seconds. For the max column values in the top 25% of the range have a red background and in the bottom 25% of the range have a green background. The red background is not used when the min value is within 80% of the max value.
| dbms | 256us | 1ms | 4ms | 16ms | 64ms | 256ms | 1s | 4s | 16s | gt | max |
|---|---|---|---|---|---|---|---|---|---|---|---|
| ma120300_rel_withdbg.cz12b_c8r32 | 0.002 | 47.566 | 42.078 | 10.034 | 0.320 | 0.040 | |||||
| ma120300_rel_withdbg.cz12c_c8r32 | 0.003 | 48.611 | 41.745 | 9.213 | 0.428 | 0.001 | 0.134 | ||||
| ma120300_rel_withdbg.cz12b_sync_c8r32 | 7.538 | 92.412 | 0.050 | 0.152 | |||||||
| ma120300_rel_withdbg.cz12c_sync_c8r32 | 32.391 | 66.838 | 0.770 | 0.001 | 0.378 |
Performance metrics for the DBMS listed above. Some are normalized by throughput, others are not. Legend for results is here.
ips	qps	rps	rmbps	wps	wmbps	rpq	rkbpq	wpi	wkbpi	csps	cpups	cspq	cpupq	dbgb1	dbgb2	rss	maxop	p50	p99	tag
2092	0	8845	138.2	9380.4	257.8	4.228	67.648	4.484	126.174	85162	13.5	40.708	516	133.0	163.8	23.5	0.045	2140	760	ma120300_rel_withdbg.cz12b_c8r32
2119	0	8934	139.6	9430.7	259.4	4.217	67.474	4.451	125.359	85582	13.4	40.396	506	133.0	164.3	23.5	0.134	2180	810	ma120300_rel_withdbg.cz12c_c8r32
216	0	912	14.2	1702.2	32.6	4.220	67.521	7.881	154.703	10204	2.0	47.242	741	133.0	163.8	23.5	0.153	215	155	ma120300_rel_withdbg.cz12b_sync_c8r32
645	0	2721	42.5	3739.2	90.4	4.221	67.534	5.800	143.553	26189	5.4	40.623	670	133.0	164.3	23.5	0.385	645	415	ma120300_rel_withdbg.cz12c_sync_c8r32
Average values from iostat.
r/s	rkB/s	rrqm/s	%rrqm	r_await	rareq-s	w/s	wkB/s	wrqm/s	%wrqm	w_await	wareq-s	d/s	dkB/s	drqm/s	%drqm	d_await	dareq-s	f/s	f_await	aqu-sz	%util
8848.4	141574	0.000	0.000	0.172	16.00	9385.8	264131	31.62	0.336	0.211	28.19	0.017	0.068	0.000	0.000	0.096	0.298	127.8	3.054	3.888	84.23		ma120300_rel_withdbg.cz12b_c8r32
8941.5	143064	0.000	0.000	0.170	16.00	9415.9	265216	16.23	0.175	0.231	28.22	0.000	0.000	0.000	0.000	0.000	0.000	131.0	2.981	4.056	84.44		ma120300_rel_withdbg.cz12c_c8r32
911.7	14587.2	0.000	0.000	0.539	16.00	1696.8	33271.9	229.6	13.20	2.237	18.60	0.000	0.001	0.000	0.000	0.000	0.004	286.2	3.620	5.222	99.07		ma120300_rel_withdbg.cz12b_sync_c8r32
2722.2	43555.7	0.000	0.000	0.433	16.00	3723.8	92149.7	6.601	0.189	1.462	24.59	0.000	0.000	0.000	0.000	0.000	0.000	305.8	2.754	7.389	93.31		ma120300_rel_withdbg.cz12c_sync_c8r32
qr100.L1
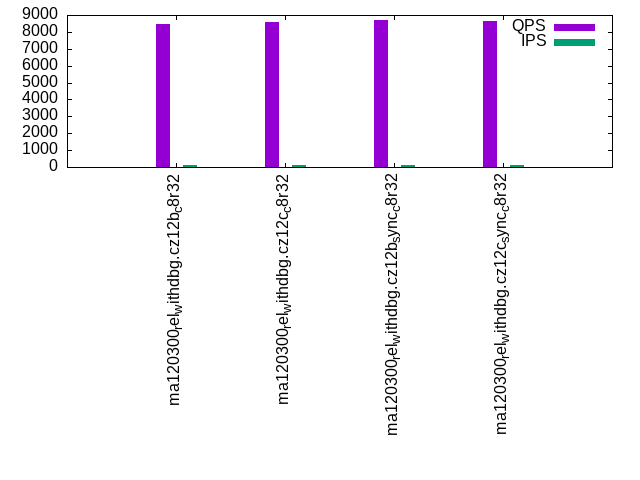
qr100.L1: range queries with 100 insert/s per client. Graphs for performance per 1-second interval are here.
Average throughput:
Query response time histogram: each cell has the percentage of responses that take <= the time in the header and max is the max response time in seconds. For max values in the top 25% of the range have a red background and in the bottom 25% of the range have a green background. The red background is not used when the min value is within 80% of the max value.
| dbms | 256us | 1ms | 4ms | 16ms | 64ms | 256ms | 1s | 4s | 16s | gt | max |
|---|---|---|---|---|---|---|---|---|---|---|---|
| ma120300_rel_withdbg.cz12b_c8r32 | 99.679 | 0.286 | 0.019 | 0.016 | 0.015 | ||||||
| ma120300_rel_withdbg.cz12c_c8r32 | 99.685 | 0.282 | 0.019 | 0.014 | nonzero | 0.019 | |||||
| ma120300_rel_withdbg.cz12b_sync_c8r32 | 99.745 | 0.225 | 0.021 | 0.010 | 0.014 | ||||||
| ma120300_rel_withdbg.cz12c_sync_c8r32 | 99.757 | 0.219 | 0.015 | 0.009 | 0.013 |
Insert response time histogram: each cell has the percentage of responses that take <= the time in the header and max is the max response time in seconds. For max values in the top 25% of the range have a red background and in the bottom 25% of the range have a green background. The red background is not used when the min value is within 80% of the max value.
| dbms | 256us | 1ms | 4ms | 16ms | 64ms | 256ms | 1s | 4s | 16s | gt | max |
|---|---|---|---|---|---|---|---|---|---|---|---|
| ma120300_rel_withdbg.cz12b_c8r32 | 53.528 | 46.472 | 0.063 | ||||||||
| ma120300_rel_withdbg.cz12c_c8r32 | 53.111 | 46.889 | 0.052 | ||||||||
| ma120300_rel_withdbg.cz12b_sync_c8r32 | 99.806 | 0.194 | 0.072 | ||||||||
| ma120300_rel_withdbg.cz12c_sync_c8r32 | 43.889 | 56.111 | 0.058 |
Delete response time histogram: each cell has the percentage of responses that take <= the time in the header and max is the max response time in seconds. For max values in the top 25% of the range have a red background and in the bottom 25% of the range have a green background. The red background is not used when the min value is within 80% of the max value.
| dbms | 256us | 1ms | 4ms | 16ms | 64ms | 256ms | 1s | 4s | 16s | gt | max |
|---|---|---|---|---|---|---|---|---|---|---|---|
| ma120300_rel_withdbg.cz12b_c8r32 | 56.278 | 43.722 | 0.038 | ||||||||
| ma120300_rel_withdbg.cz12c_c8r32 | 56.222 | 43.778 | 0.040 | ||||||||
| ma120300_rel_withdbg.cz12b_sync_c8r32 | 3.444 | 96.556 | 0.051 | ||||||||
| ma120300_rel_withdbg.cz12c_sync_c8r32 | 50.833 | 49.167 | 0.035 |
Performance metrics for the DBMS listed above. Some are normalized by throughput, others are not. Legend for results is here.
ips	qps	rps	rmbps	wps	wmbps	rpq	rkbpq	wpi	wkbpi	csps	cpups	cspq	cpupq	dbgb1	dbgb2	rss	maxop	p50	p99	tag
100	8478	459	7.2	108.2	3.4	0.054	0.866	1.084	34.823	50814	12.3	5.994	116	133.0	163.8	23.4	0.015	8527	7967	ma120300_rel_withdbg.cz12b_c8r32
100	8592	459	7.2	110.5	3.4	0.053	0.855	1.106	35.256	51434	12.3	5.986	115	133.0	164.3	23.4	0.019	8639	7854	ma120300_rel_withdbg.cz12c_c8r32
100	8685	459	7.2	131.9	3.5	0.053	0.846	1.320	36.276	52096	12.3	5.998	113	133.0	163.8	23.4	0.014	8735	7967	ma120300_rel_withdbg.cz12b_sync_c8r32
100	8649	459	7.2	114.8	3.5	0.053	0.848	1.149	35.404	51755	12.3	5.984	114	133.0	164.3	23.4	0.013	8703	8046	ma120300_rel_withdbg.cz12c_sync_c8r32
Average values from iostat.
r/s	rkB/s	rrqm/s	%rrqm	r_await	rareq-s	w/s	wkB/s	wrqm/s	%wrqm	w_await	wareq-s	d/s	dkB/s	drqm/s	%drqm	d_await	dareq-s	f/s	f_await	aqu-sz	%util
440.4	7045.9	0.000	0.000	0.156	16.00	108.5	3487.0	0.992	3.111	1.815	52.24	0.009	0.038	0.000	0.000	0.036	0.189	3.516	2.186	0.116	5.682		ma120300_rel_withdbg.cz12b_c8r32
440.7	7051.9	0.000	0.000	0.154	16.00	110.8	3530.2	4.213	13.33	1.471	46.89	0.001	0.002	0.000	0.000	0.003	0.011	4.509	1.734	0.118	5.790		ma120300_rel_withdbg.cz12c_c8r32
440.5	7048.2	0.000	0.000	0.155	16.00	132.2	3632.2	21.15	26.18	0.843	27.48	0.001	0.002	0.000	0.000	0.000	0.011	13.95	1.764	0.156	7.566		ma120300_rel_withdbg.cz12b_sync_c8r32
440.2	7043.0	0.000	0.000	0.144	16.00	115.1	3544.9	4.217	11.57	0.520	40.10	0.001	0.002	0.000	0.000	0.003	0.011	7.231	1.479	0.100	5.515		ma120300_rel_withdbg.cz12c_sync_c8r32
qp100.L2
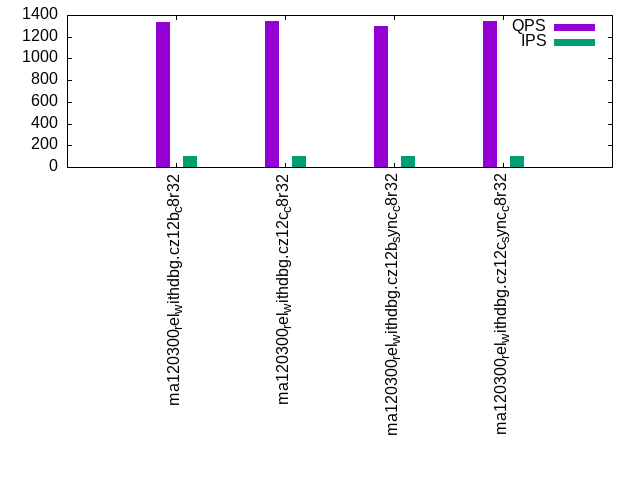
qp100.L2: point queries with 100 insert/s per client. Graphs for performance per 1-second interval are here.
Average throughput:
Query response time histogram: each cell has the percentage of responses that take <= the time in the header and max is the max response time in seconds. For max values in the top 25% of the range have a red background and in the bottom 25% of the range have a green background. The red background is not used when the min value is within 80% of the max value.
| dbms | 256us | 1ms | 4ms | 16ms | 64ms | 256ms | 1s | 4s | 16s | gt | max |
|---|---|---|---|---|---|---|---|---|---|---|---|
| ma120300_rel_withdbg.cz12b_c8r32 | 0.098 | 95.140 | 4.608 | 0.154 | nonzero | 0.023 | |||||
| ma120300_rel_withdbg.cz12c_c8r32 | 0.103 | 95.949 | 3.740 | 0.206 | nonzero | 0.031 | |||||
| ma120300_rel_withdbg.cz12b_sync_c8r32 | 0.096 | 95.174 | 4.183 | 0.546 | 0.001 | 0.028 | |||||
| ma120300_rel_withdbg.cz12c_sync_c8r32 | 0.100 | 95.780 | 3.949 | 0.171 | nonzero | 0.019 |
Insert response time histogram: each cell has the percentage of responses that take <= the time in the header and max is the max response time in seconds. For max values in the top 25% of the range have a red background and in the bottom 25% of the range have a green background. The red background is not used when the min value is within 80% of the max value.
| dbms | 256us | 1ms | 4ms | 16ms | 64ms | 256ms | 1s | 4s | 16s | gt | max |
|---|---|---|---|---|---|---|---|---|---|---|---|
| ma120300_rel_withdbg.cz12b_c8r32 | 82.528 | 17.472 | 0.048 | ||||||||
| ma120300_rel_withdbg.cz12c_c8r32 | 81.944 | 18.056 | 0.048 | ||||||||
| ma120300_rel_withdbg.cz12b_sync_c8r32 | 99.611 | 0.389 | 0.088 | ||||||||
| ma120300_rel_withdbg.cz12c_sync_c8r32 | 55.278 | 44.722 | 0.048 |
Delete response time histogram: each cell has the percentage of responses that take <= the time in the header and max is the max response time in seconds. For max values in the top 25% of the range have a red background and in the bottom 25% of the range have a green background. The red background is not used when the min value is within 80% of the max value.
| dbms | 256us | 1ms | 4ms | 16ms | 64ms | 256ms | 1s | 4s | 16s | gt | max |
|---|---|---|---|---|---|---|---|---|---|---|---|
| ma120300_rel_withdbg.cz12b_c8r32 | 91.028 | 8.972 | 0.043 | ||||||||
| ma120300_rel_withdbg.cz12c_c8r32 | 90.056 | 9.944 | 0.038 | ||||||||
| ma120300_rel_withdbg.cz12b_sync_c8r32 | 0.361 | 99.611 | 0.028 | 0.075 | |||||||
| ma120300_rel_withdbg.cz12c_sync_c8r32 | 90.111 | 9.889 | 0.045 |
Performance metrics for the DBMS listed above. Some are normalized by throughput, others are not. Legend for results is here.
ips	qps	rps	rmbps	wps	wmbps	rpq	rkbpq	wpi	wkbpi	csps	cpups	cspq	cpupq	dbgb1	dbgb2	rss	maxop	p50	p99	tag
100	1338	9270	144.8	990.9	26.5	6.930	110.866	9.909	271.222	30314	4.4	22.663	263	133.0	163.8	23.5	0.023	1424	864	ma120300_rel_withdbg.cz12b_c8r32
100	1349	9336	145.9	999.8	26.6	6.923	110.762	10.008	273.013	30468	4.3	22.591	255	133.0	164.3	23.4	0.031	1424	896	ma120300_rel_withdbg.cz12c_c8r32
100	1296	9014	140.9	1017.6	26.7	6.955	111.272	10.176	273.579	29673	4.2	22.892	259	133.0	163.8	23.4	0.028	1344	896	ma120300_rel_withdbg.cz12b_sync_c8r32
100	1347	9326	145.7	1000.8	26.6	6.925	110.795	10.008	272.098	30508	4.3	22.653	255	133.0	164.3	23.5	0.019	1424	912	ma120300_rel_withdbg.cz12c_sync_c8r32
Average values from iostat.
r/s	rkB/s	rrqm/s	%rrqm	r_await	rareq-s	w/s	wkB/s	wrqm/s	%wrqm	w_await	wareq-s	d/s	dkB/s	drqm/s	%drqm	d_await	dareq-s	f/s	f_await	aqu-sz	%util
9270.8	148332	0.000	0.000	0.080	16.00	981.2	26855.1	3.135	0.325	0.079	27.56	0.010	0.040	0.000	0.000	0.039	0.201	21.72	1.429	0.830	70.06		ma120300_rel_withdbg.cz12b_c8r32
9338.2	149412	0.000	0.000	0.080	16.00	988.7	26967.9	5.464	0.787	0.154	27.43	0.001	0.002	0.000	0.000	0.003	0.011	25.41	1.366	0.890	70.21		ma120300_rel_withdbg.cz12c_c8r32
9015.2	144243	0.000	0.000	0.083	16.00	1006.1	27040.8	21.42	2.898	0.188	26.85	0.001	0.002	0.000	0.000	0.003	0.011	32.30	2.183	0.978	71.82		ma120300_rel_withdbg.cz12b_sync_c8r32
9326.9	149231	0.000	0.000	0.080	16.00	988.6	26873.7	5.425	0.787	0.163	27.30	0.001	0.002	0.000	0.000	0.003	0.011	28.00	1.278	0.899	69.68		ma120300_rel_withdbg.cz12c_sync_c8r32
qr500.L3
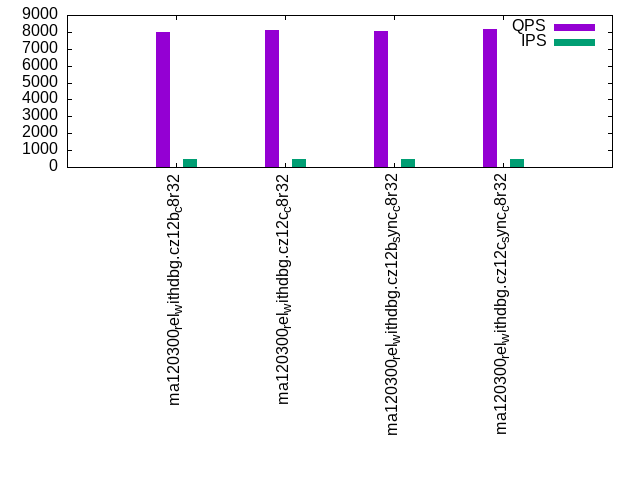
qr500.L3: range queries with 500 insert/s per client. Graphs for performance per 1-second interval are here.
Average throughput:
Query response time histogram: each cell has the percentage of responses that take <= the time in the header and max is the max response time in seconds. For max values in the top 25% of the range have a red background and in the bottom 25% of the range have a green background. The red background is not used when the min value is within 80% of the max value.
| dbms | 256us | 1ms | 4ms | 16ms | 64ms | 256ms | 1s | 4s | 16s | gt | max |
|---|---|---|---|---|---|---|---|---|---|---|---|
| ma120300_rel_withdbg.cz12b_c8r32 | 99.105 | 0.725 | 0.141 | 0.029 | nonzero | 0.036 | |||||
| ma120300_rel_withdbg.cz12c_c8r32 | 99.126 | 0.728 | 0.116 | 0.031 | nonzero | 0.030 | |||||
| ma120300_rel_withdbg.cz12b_sync_c8r32 | 99.040 | 0.792 | 0.134 | 0.033 | nonzero | 0.043 | |||||
| ma120300_rel_withdbg.cz12c_sync_c8r32 | 99.238 | 0.635 | 0.098 | 0.029 | nonzero | 0.024 |
Insert response time histogram: each cell has the percentage of responses that take <= the time in the header and max is the max response time in seconds. For max values in the top 25% of the range have a red background and in the bottom 25% of the range have a green background. The red background is not used when the min value is within 80% of the max value.
| dbms | 256us | 1ms | 4ms | 16ms | 64ms | 256ms | 1s | 4s | 16s | gt | max |
|---|---|---|---|---|---|---|---|---|---|---|---|
| ma120300_rel_withdbg.cz12b_c8r32 | 77.350 | 22.550 | 0.100 | 0.090 | |||||||
| ma120300_rel_withdbg.cz12c_c8r32 | 77.428 | 22.511 | 0.061 | 0.090 | |||||||
| ma120300_rel_withdbg.cz12b_sync_c8r32 | 0.383 | 97.778 | 1.839 | 0.169 | |||||||
| ma120300_rel_withdbg.cz12c_sync_c8r32 | 73.339 | 26.600 | 0.061 | 0.131 |
Delete response time histogram: each cell has the percentage of responses that take <= the time in the header and max is the max response time in seconds. For max values in the top 25% of the range have a red background and in the bottom 25% of the range have a green background. The red background is not used when the min value is within 80% of the max value.
| dbms | 256us | 1ms | 4ms | 16ms | 64ms | 256ms | 1s | 4s | 16s | gt | max |
|---|---|---|---|---|---|---|---|---|---|---|---|
| ma120300_rel_withdbg.cz12b_c8r32 | 83.650 | 16.350 | 0.063 | ||||||||
| ma120300_rel_withdbg.cz12c_c8r32 | 84.378 | 15.617 | 0.006 | 0.088 | |||||||
| ma120300_rel_withdbg.cz12b_sync_c8r32 | 2.422 | 97.467 | 0.111 | 0.083 | |||||||
| ma120300_rel_withdbg.cz12c_sync_c8r32 | 81.900 | 18.100 | 0.055 |
Performance metrics for the DBMS listed above. Some are normalized by throughput, others are not. Legend for results is here.
ips	qps	rps	rmbps	wps	wmbps	rpq	rkbpq	wpi	wkbpi	csps	cpups	cspq	cpupq	dbgb1	dbgb2	rss	maxop	p50	p99	tag
500	8022	2443	38.2	1856.6	51.5	0.304	4.872	3.716	105.511	63408	13.5	7.905	135	133.0	163.8	23.5	0.036	8111	6543	ma120300_rel_withdbg.cz12b_c8r32
500	8128	2442	38.2	1877.9	52.1	0.300	4.807	3.756	106.682	63932	13.6	7.866	134	133.0	164.3	23.5	0.030	8191	6783	ma120300_rel_withdbg.cz12c_c8r32
500	8055	2474	38.7	2028.6	53.3	0.307	4.914	4.060	109.285	63446	13.8	7.877	137	133.0	163.8	23.5	0.043	8175	4415	ma120300_rel_withdbg.cz12b_sync_c8r32
500	8190	2446	38.2	1921.0	52.5	0.299	4.778	3.842	107.491	64051	13.6	7.821	133	133.0	164.3	23.5	0.024	8271	6767	ma120300_rel_withdbg.cz12c_sync_c8r32
Average values from iostat.
r/s	rkB/s	rrqm/s	%rrqm	r_await	rareq-s	w/s	wkB/s	wrqm/s	%wrqm	w_await	wareq-s	d/s	dkB/s	drqm/s	%drqm	d_await	dareq-s	f/s	f_await	aqu-sz	%util
2419.4	38710.9	0.000	0.000	0.105	16.00	1859.7	52808.8	6.535	0.366	0.130	29.15	0.004	0.016	0.000	0.000	0.019	0.078	33.97	1.415	0.531	19.18		ma120300_rel_withdbg.cz12b_c8r32
2418.6	38698.1	0.000	0.000	0.102	16.00	1881.2	53430.5	7.535	0.571	0.146	29.17	0.002	0.007	0.000	0.000	0.006	0.033	35.08	1.310	0.538	18.69		ma120300_rel_withdbg.cz12c_c8r32
2453.4	39254.1	0.000	0.000	0.129	16.00	2032.1	54703.7	106.9	6.114	0.418	26.96	0.003	0.011	0.000	0.000	0.039	0.056	97.41	1.740	1.240	34.09		ma120300_rel_withdbg.cz12b_sync_c8r32
2423.0	38767.8	0.000	0.000	0.106	16.00	1924.3	53835.9	7.614	0.534	0.184	28.45	0.002	0.009	0.000	0.000	0.006	0.045	56.29	1.269	0.652	21.82		ma120300_rel_withdbg.cz12c_sync_c8r32
qp500.L4
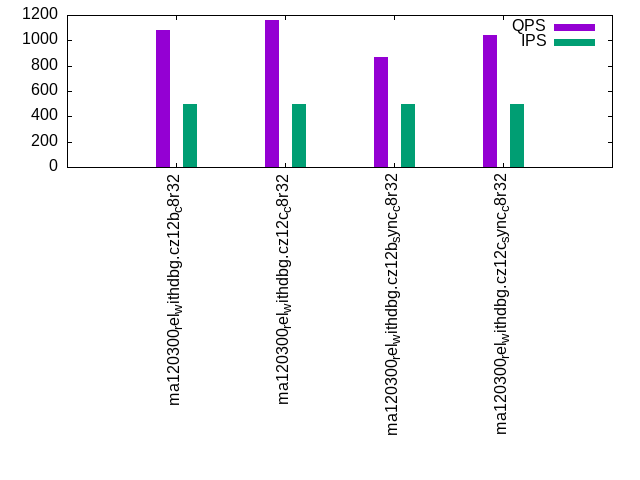
qp500.L4: point queries with 500 insert/s per client. Graphs for performance per 1-second interval are here.
Average throughput:
Query response time histogram: each cell has the percentage of responses that take <= the time in the header and max is the max response time in seconds. For max values in the top 25% of the range have a red background and in the bottom 25% of the range have a green background. The red background is not used when the min value is within 80% of the max value.
| dbms | 256us | 1ms | 4ms | 16ms | 64ms | 256ms | 1s | 4s | 16s | gt | max |
|---|---|---|---|---|---|---|---|---|---|---|---|
| ma120300_rel_withdbg.cz12b_c8r32 | 0.007 | 89.984 | 8.338 | 1.670 | 0.001 | nonzero | 0.065 | ||||
| ma120300_rel_withdbg.cz12c_c8r32 | 0.010 | 91.312 | 8.134 | 0.543 | 0.001 | 0.030 | |||||
| ma120300_rel_withdbg.cz12b_sync_c8r32 | 0.004 | 83.149 | 12.883 | 3.941 | 0.023 | nonzero | 0.154 | ||||
| ma120300_rel_withdbg.cz12c_sync_c8r32 | 0.007 | 88.585 | 9.701 | 1.703 | 0.003 | nonzero | 0.189 |
Insert response time histogram: each cell has the percentage of responses that take <= the time in the header and max is the max response time in seconds. For max values in the top 25% of the range have a red background and in the bottom 25% of the range have a green background. The red background is not used when the min value is within 80% of the max value.
| dbms | 256us | 1ms | 4ms | 16ms | 64ms | 256ms | 1s | 4s | 16s | gt | max |
|---|---|---|---|---|---|---|---|---|---|---|---|
| ma120300_rel_withdbg.cz12b_c8r32 | 77.022 | 21.794 | 1.183 | 0.171 | |||||||
| ma120300_rel_withdbg.cz12c_c8r32 | 83.183 | 16.750 | 0.067 | 0.178 | |||||||
| ma120300_rel_withdbg.cz12b_sync_c8r32 | 0.022 | 93.333 | 6.644 | 0.137 | |||||||
| ma120300_rel_withdbg.cz12c_sync_c8r32 | 43.089 | 55.667 | 1.244 | 0.122 |
Delete response time histogram: each cell has the percentage of responses that take <= the time in the header and max is the max response time in seconds. For max values in the top 25% of the range have a red background and in the bottom 25% of the range have a green background. The red background is not used when the min value is within 80% of the max value.
| dbms | 256us | 1ms | 4ms | 16ms | 64ms | 256ms | 1s | 4s | 16s | gt | max |
|---|---|---|---|---|---|---|---|---|---|---|---|
| ma120300_rel_withdbg.cz12b_c8r32 | 80.056 | 19.894 | 0.050 | 0.083 | |||||||
| ma120300_rel_withdbg.cz12c_c8r32 | 87.572 | 12.428 | 0.056 | ||||||||
| ma120300_rel_withdbg.cz12b_sync_c8r32 | 0.322 | 98.783 | 0.894 | 0.084 | |||||||
| ma120300_rel_withdbg.cz12c_sync_c8r32 | 80.183 | 19.817 | 0.062 |
Performance metrics for the DBMS listed above. Some are normalized by throughput, others are not. Legend for results is here.
ips	qps	rps	rmbps	wps	wmbps	rpq	rkbpq	wpi	wkbpi	csps	cpups	cspq	cpupq	dbgb1	dbgb2	rss	maxop	p50	p99	tag
499	1081	10822	169.1	2997.0	81.6	10.013	160.214	6.001	167.392	43793	5.8	40.520	429	133.0	163.8	23.5	0.065	1104	832	ma120300_rel_withdbg.cz12b_c8r32
500	1162	11343	177.2	3029.3	82.5	9.763	156.215	6.062	169.006	44750	5.8	38.518	399	133.0	164.3	23.5	0.030	1200	864	ma120300_rel_withdbg.cz12c_c8r32
499	870	9388	146.7	3051.2	80.5	10.796	172.732	6.110	165.072	39452	5.0	45.368	460	133.0	163.8	23.5	0.154	880	672	ma120300_rel_withdbg.cz12b_sync_c8r32
500	1043	10562	165.0	3011.5	81.3	10.123	161.976	6.023	166.559	42608	5.8	40.839	445	133.0	164.3	23.5	0.189	1040	800	ma120300_rel_withdbg.cz12c_sync_c8r32
Average values from iostat.
r/s	rkB/s	rrqm/s	%rrqm	r_await	rareq-s	w/s	wkB/s	wrqm/s	%wrqm	w_await	wareq-s	d/s	dkB/s	drqm/s	%drqm	d_await	dareq-s	f/s	f_await	aqu-sz	%util
10825.5	173209	0.000	0.000	0.094	16.00	2986.6	83310.8	9.551	0.318	0.130	27.91	0.003	0.013	0.000	0.000	0.017	0.067	49.84	2.625	1.523	78.15		ma120300_rel_withdbg.cz12b_c8r32
11346.5	181544	0.000	0.000	0.082	16.00	3022.4	84260.3	10.74	0.366	0.121	27.89	0.001	0.004	0.000	0.000	0.003	0.022	54.71	1.470	1.365	76.16		ma120300_rel_withdbg.cz12c_c8r32
9389.9	150238	0.000	0.000	0.122	16.00	3039.0	82106.2	105.8	3.455	0.439	27.00	0.004	0.016	0.000	0.000	0.025	0.078	105.8	2.740	2.734	84.20		ma120300_rel_withdbg.cz12b_sync_c8r32
10564.4	169030	0.000	0.000	0.098	16.00	3004.1	83071.1	10.33	0.355	0.262	27.66	0.003	0.011	0.000	0.000	0.031	0.056	72.08	2.313	1.949	78.56		ma120300_rel_withdbg.cz12c_sync_c8r32
qr1000.L5
qr1000.L5: range queries with 1000 insert/s per client. Graphs for performance per 1-second interval are here.
Average throughput:
Query response time histogram: each cell has the percentage of responses that take <= the time in the header and max is the max response time in seconds. For max values in the top 25% of the range have a red background and in the bottom 25% of the range have a green background. The red background is not used when the min value is within 80% of the max value.
| dbms | 256us | 1ms | 4ms | 16ms | 64ms | 256ms | 1s | 4s | 16s | gt | max |
|---|---|---|---|---|---|---|---|---|---|---|---|
| ma120300_rel_withdbg.cz12b_c8r32 | 98.369 | 1.300 | 0.293 | 0.038 | nonzero | 0.030 | |||||
| ma120300_rel_withdbg.cz12c_c8r32 | 98.362 | 1.323 | 0.272 | 0.041 | 0.001 | 0.033 | |||||
| ma120300_rel_withdbg.cz12b_sync_c8r32 | 97.880 | 1.565 | 0.477 | 0.078 | nonzero | 0.034 | |||||
| ma120300_rel_withdbg.cz12c_sync_c8r32 | 98.640 | 1.111 | 0.211 | 0.037 | nonzero | 0.048 |
Insert response time histogram: each cell has the percentage of responses that take <= the time in the header and max is the max response time in seconds. For max values in the top 25% of the range have a red background and in the bottom 25% of the range have a green background. The red background is not used when the min value is within 80% of the max value.
| dbms | 256us | 1ms | 4ms | 16ms | 64ms | 256ms | 1s | 4s | 16s | gt | max |
|---|---|---|---|---|---|---|---|---|---|---|---|
| ma120300_rel_withdbg.cz12b_c8r32 | 75.919 | 23.906 | 0.175 | 0.125 | |||||||
| ma120300_rel_withdbg.cz12c_c8r32 | 76.131 | 23.492 | 0.378 | 0.095 | |||||||
| ma120300_rel_withdbg.cz12b_sync_c8r32 | 0.967 | 95.489 | 3.544 | 0.120 | |||||||
| ma120300_rel_withdbg.cz12c_sync_c8r32 | 70.167 | 29.511 | 0.322 | 0.146 |
Delete response time histogram: each cell has the percentage of responses that take <= the time in the header and max is the max response time in seconds. For max values in the top 25% of the range have a red background and in the bottom 25% of the range have a green background. The red background is not used when the min value is within 80% of the max value.
| dbms | 256us | 1ms | 4ms | 16ms | 64ms | 256ms | 1s | 4s | 16s | gt | max |
|---|---|---|---|---|---|---|---|---|---|---|---|
| ma120300_rel_withdbg.cz12b_c8r32 | 83.436 | 16.561 | 0.003 | 0.089 | |||||||
| ma120300_rel_withdbg.cz12c_c8r32 | 84.392 | 15.606 | 0.003 | 0.068 | |||||||
| ma120300_rel_withdbg.cz12b_sync_c8r32 | 1.344 | 98.211 | 0.444 | 0.096 | |||||||
| ma120300_rel_withdbg.cz12c_sync_c8r32 | 79.450 | 20.539 | 0.011 | 0.081 |
Performance metrics for the DBMS listed above. Some are normalized by throughput, others are not. Legend for results is here.
ips	qps	rps	rmbps	wps	wmbps	rpq	rkbpq	wpi	wkbpi	csps	cpups	cspq	cpupq	dbgb1	dbgb2	rss	maxop	p50	p99	tag
999	7601	4326	67.6	3792.3	104.8	0.569	9.106	3.795	107.354	77097	15.1	10.143	159	133.0	163.8	23.5	0.030	7759	4927	ma120300_rel_withdbg.cz12b_c8r32
999	7648	4328	67.6	3764.6	104.1	0.566	9.054	3.767	106.679	77209	15.0	10.095	157	133.0	164.3	23.5	0.033	7807	5295	ma120300_rel_withdbg.cz12c_c8r32
999	7199	4324	67.6	3973.1	104.3	0.601	9.611	3.976	106.886	72976	15.0	10.137	167	133.0	163.8	23.5	0.034	7567	2288	ma120300_rel_withdbg.cz12b_sync_c8r32
999	7781	4327	67.6	3828.9	104.4	0.556	8.898	3.834	107.067	76660	14.9	9.852	153	133.0	164.3	23.5	0.048	7935	4368	ma120300_rel_withdbg.cz12c_sync_c8r32
Average values from iostat.
r/s	rkB/s	rrqm/s	%rrqm	r_await	rareq-s	w/s	wkB/s	wrqm/s	%wrqm	w_await	wareq-s	d/s	dkB/s	drqm/s	%drqm	d_await	dareq-s	f/s	f_await	aqu-sz	%util
4305.6	68889.4	0.000	0.000	0.107	16.00	3795.0	107367	12.85	0.339	0.104	28.48	0.006	0.045	0.000	0.000	0.025	0.223	60.21	1.505	0.950	32.26		ma120300_rel_withdbg.cz12b_c8r32
4306.6	68905.3	0.000	0.000	0.108	16.00	3767.6	106701	8.411	0.257	0.129	28.51	0.001	0.004	0.000	0.000	0.028	0.022	61.85	1.573	1.019	32.35		ma120300_rel_withdbg.cz12c_c8r32
4311.3	68980.6	0.000	0.000	0.152	16.00	3970.3	106742	213.2	5.404	0.567	26.90	0.003	0.013	0.000	0.000	0.014	0.067	176.7	2.086	3.213	63.19		ma120300_rel_withdbg.cz12b_sync_c8r32
4308.6	68937.5	0.000	0.000	0.112	16.00	3831.3	107005	8.941	0.261	0.236	28.04	0.004	0.016	0.000	0.000	0.022	0.078	98.40	1.551	1.511	38.74		ma120300_rel_withdbg.cz12c_sync_c8r32
qp1000.L6
qp1000.L6: point queries with 1000 insert/s per client. Graphs for performance per 1-second interval are here.
Average throughput:
Query response time histogram: each cell has the percentage of responses that take <= the time in the header and max is the max response time in seconds. For max values in the top 25% of the range have a red background and in the bottom 25% of the range have a green background. The red background is not used when the min value is within 80% of the max value.
| dbms | 256us | 1ms | 4ms | 16ms | 64ms | 256ms | 1s | 4s | 16s | gt | max |
|---|---|---|---|---|---|---|---|---|---|---|---|
| ma120300_rel_withdbg.cz12b_c8r32 | nonzero | 79.425 | 16.446 | 4.126 | 0.004 | nonzero | 0.199 | ||||
| ma120300_rel_withdbg.cz12c_c8r32 | nonzero | 81.065 | 15.974 | 2.951 | 0.009 | 0.050 | |||||
| ma120300_rel_withdbg.cz12b_sync_c8r32 | 48.591 | 36.855 | 14.351 | 0.203 | nonzero | nonzero | 0.299 | ||||
| ma120300_rel_withdbg.cz12c_sync_c8r32 | 72.802 | 21.347 | 5.831 | 0.020 | nonzero | nonzero | 0.354 |
Insert response time histogram: each cell has the percentage of responses that take <= the time in the header and max is the max response time in seconds. For max values in the top 25% of the range have a red background and in the bottom 25% of the range have a green background. The red background is not used when the min value is within 80% of the max value.
| dbms | 256us | 1ms | 4ms | 16ms | 64ms | 256ms | 1s | 4s | 16s | gt | max |
|---|---|---|---|---|---|---|---|---|---|---|---|
| ma120300_rel_withdbg.cz12b_c8r32 | 74.500 | 24.639 | 0.861 | 0.146 | |||||||
| ma120300_rel_withdbg.cz12c_c8r32 | 76.006 | 23.244 | 0.750 | 0.128 | |||||||
| ma120300_rel_withdbg.cz12b_sync_c8r32 | 0.067 | 87.033 | 12.894 | 0.006 | 0.601 | ||||||
| ma120300_rel_withdbg.cz12c_sync_c8r32 | 39.319 | 58.411 | 2.267 | 0.003 | 0.402 |
Delete response time histogram: each cell has the percentage of responses that take <= the time in the header and max is the max response time in seconds. For max values in the top 25% of the range have a red background and in the bottom 25% of the range have a green background. The red background is not used when the min value is within 80% of the max value.
| dbms | 256us | 1ms | 4ms | 16ms | 64ms | 256ms | 1s | 4s | 16s | gt | max |
|---|---|---|---|---|---|---|---|---|---|---|---|
| ma120300_rel_withdbg.cz12b_c8r32 | 73.903 | 26.053 | 0.044 | 0.096 | |||||||
| ma120300_rel_withdbg.cz12c_c8r32 | 77.828 | 22.139 | 0.033 | 0.096 | |||||||
| ma120300_rel_withdbg.cz12b_sync_c8r32 | 0.164 | 96.664 | 3.167 | 0.006 | 0.555 | ||||||
| ma120300_rel_withdbg.cz12c_sync_c8r32 | 70.933 | 29.019 | 0.044 | 0.003 | 0.410 |
Performance metrics for the DBMS listed above. Some are normalized by throughput, others are not. Legend for results is here.
ips	qps	rps	rmbps	wps	wmbps	rpq	rkbpq	wpi	wkbpi	csps	cpups	cspq	cpupq	dbgb1	dbgb2	rss	maxop	p50	p99	tag
999	878	12274	191.8	4961.6	135.8	13.986	223.776	4.968	139.180	57901	7.6	65.976	693	133.0	163.8	23.5	0.199	880	640	ma120300_rel_withdbg.cz12b_c8r32
999	917	12570	196.4	4997.3	136.7	13.706	219.294	5.000	140.089	58529	7.7	63.820	672	133.0	164.3	23.5	0.050	912	608	ma120300_rel_withdbg.cz12c_c8r32
999	481	8995	140.5	4948.0	130.0	18.700	299.207	4.954	133.323	47438	7.4	98.624	1231	133.0	163.8	23.5	0.299	480	288	ma120300_rel_withdbg.cz12b_sync_c8r32
999	754	11287	176.4	4957.1	134.2	14.976	239.616	4.960	137.508	54318	7.2	72.068	764	133.0	164.3	23.5	0.354	752	528	ma120300_rel_withdbg.cz12c_sync_c8r32
Average values from iostat.
r/s	rkB/s	rrqm/s	%rrqm	r_await	rareq-s	w/s	wkB/s	wrqm/s	%wrqm	w_await	wareq-s	d/s	dkB/s	drqm/s	%drqm	d_await	dareq-s	f/s	f_await	aqu-sz	%util
12278.1	196450	0.000	0.000	0.113	16.00	4942.8	138503	15.90	0.321	0.139	28.04	0.003	0.027	0.000	0.000	0.010	0.123	77.83	2.886	2.293	84.90		ma120300_rel_withdbg.cz12b_c8r32
12574.2	201187	0.000	0.000	0.106	16.00	4984.5	139659	15.83	0.325	0.180	28.04	0.001	0.002	0.000	0.000	0.000	0.011	82.99	2.432	2.397	83.60		ma120300_rel_withdbg.cz12c_c8r32
8993.2	143891	0.000	0.000	0.203	16.00	4934.9	132809	213.2	4.237	0.753	26.91	0.002	0.009	0.000	0.000	0.017	0.045	189.2	2.978	6.021	95.20		ma120300_rel_withdbg.cz12b_sync_c8r32
11291.4	180663	0.000	0.000	0.133	16.00	4940.4	136975	15.60	0.322	0.371	27.74	0.004	0.016	0.000	0.000	0.028	0.078	118.2	2.804	3.638	87.62		ma120300_rel_withdbg.cz12c_sync_c8r32
l.i0
l.i0: load without secondary indexes
Performance metrics for all DBMS, not just the ones listed above. Some are normalized by throughput, others are not. Legend for results is here.
ips	qps	rps	rmbps	wps	wmbps	rpq	rkbpq	wpi	wkbpi	csps	cpups	cspq	cpupq	dbgb1	dbgb2	rss	maxop	p50	p99	tag
162966	0	0	0.0	978.0	43.8	0.000	0.000	0.006	0.275	22195	20.1	0.136	10	52.6	83.4	23.4	0.157	164075	143582	ma120300_rel_withdbg.cz12b_c8r32
164170	0	0	0.0	1141.5	62.2	0.000	0.000	0.007	0.388	23816	20.2	0.145	10	52.6	83.9	23.4	0.229	164676	150175	ma120300_rel_withdbg.cz12c_c8r32
6252	0	0	0.0	491.6	4.5	0.000	0.000	0.079	0.729	3025	2.0	0.484	26	52.6	83.4	23.4	0.231	6399	4400	ma120300_rel_withdbg.cz12b_sync_c8r32
29664	0	0	0.0	883.8	14.6	0.000	0.000	0.030	0.504	7155	5.9	0.241	16	52.6	83.9	23.4	0.199	26496	10799	ma120300_rel_withdbg.cz12c_sync_c8r32
l.x
l.x: create secondary indexes
Performance metrics for all DBMS, not just the ones listed above. Some are normalized by throughput, others are not. Legend for results is here.
ips	qps	rps	rmbps	wps	wmbps	rpq	rkbpq	wpi	wkbpi	csps	cpups	cspq	cpupq	dbgb1	dbgb2	rss	maxop	p50	p99	tag
135593	0	1443	134.2	1623.4	149.7	0.011	1.014	0.012	1.130	4510	12.2	0.033	7	111.5	142.3	23.4	0.001	NA	NA	ma120300_rel_withdbg.cz12b_c8r32
134341	0	1433	133.3	1599.4	148.2	0.011	1.016	0.012	1.130	4481	11.7	0.033	7	111.5	142.8	23.4	0.001	NA	NA	ma120300_rel_withdbg.cz12c_c8r32
135478	0	1446	134.2	1620.0	149.6	0.011	1.014	0.012	1.131	4478	11.9	0.033	7	111.5	142.3	23.4	0.018	NA	NA	ma120300_rel_withdbg.cz12b_sync_c8r32
135135	0	1440	134.0	1612.1	149.1	0.011	1.016	0.012	1.130	4506	11.8	0.033	7	111.5	142.8	23.4	0.005	NA	NA	ma120300_rel_withdbg.cz12c_sync_c8r32
l.i1
l.i1: continue load after secondary indexes created with 50 inserts per transaction
Performance metrics for all DBMS, not just the ones listed above. Some are normalized by throughput, others are not. Legend for results is here.
ips	qps	rps	rmbps	wps	wmbps	rpq	rkbpq	wpi	wkbpi	csps	cpups	cspq	cpupq	dbgb1	dbgb2	rss	maxop	p50	p99	tag
1793	0	8395	131.2	9476.7	250.4	4.682	74.919	5.286	143.009	75723	11.6	42.235	518	133.0	163.8	23.5	2.503	1800	600	ma120300_rel_withdbg.cz12b_c8r32
1775	0	8308	129.8	9379.9	248.0	4.680	74.874	5.283	143.040	74926	11.4	42.202	514	133.0	164.3	23.5	3.045	1750	600	ma120300_rel_withdbg.cz12c_c8r32
990	0	4636	72.4	5716.7	146.1	4.681	74.894	5.772	151.076	41523	6.7	41.921	541	133.0	163.8	23.5	3.155	1000	500	ma120300_rel_withdbg.cz12b_sync_c8r32
1489	0	6968	108.9	7968.4	208.7	4.679	74.869	5.351	143.473	62104	9.7	41.703	521	133.0	164.3	23.5	2.504	1500	550	ma120300_rel_withdbg.cz12c_sync_c8r32
l.i2
l.i2: continue load after secondary indexes created with 5 inserts per transaction
Performance metrics for all DBMS, not just the ones listed above. Some are normalized by throughput, others are not. Legend for results is here.
ips	qps	rps	rmbps	wps	wmbps	rpq	rkbpq	wpi	wkbpi	csps	cpups	cspq	cpupq	dbgb1	dbgb2	rss	maxop	p50	p99	tag
2092	0	8845	138.2	9380.4	257.8	4.228	67.648	4.484	126.174	85162	13.5	40.708	516	133.0	163.8	23.5	0.045	2140	760	ma120300_rel_withdbg.cz12b_c8r32
2119	0	8934	139.6	9430.7	259.4	4.217	67.474	4.451	125.359	85582	13.4	40.396	506	133.0	164.3	23.5	0.134	2180	810	ma120300_rel_withdbg.cz12c_c8r32
216	0	912	14.2	1702.2	32.6	4.220	67.521	7.881	154.703	10204	2.0	47.242	741	133.0	163.8	23.5	0.153	215	155	ma120300_rel_withdbg.cz12b_sync_c8r32
645	0	2721	42.5	3739.2	90.4	4.221	67.534	5.800	143.553	26189	5.4	40.623	670	133.0	164.3	23.5	0.385	645	415	ma120300_rel_withdbg.cz12c_sync_c8r32
qr100.L1
qr100.L1: range queries with 100 insert/s per client
Performance metrics for all DBMS, not just the ones listed above. Some are normalized by throughput, others are not. Legend for results is here.
ips	qps	rps	rmbps	wps	wmbps	rpq	rkbpq	wpi	wkbpi	csps	cpups	cspq	cpupq	dbgb1	dbgb2	rss	maxop	p50	p99	tag
100	8478	459	7.2	108.2	3.4	0.054	0.866	1.084	34.823	50814	12.3	5.994	116	133.0	163.8	23.4	0.015	8527	7967	ma120300_rel_withdbg.cz12b_c8r32
100	8592	459	7.2	110.5	3.4	0.053	0.855	1.106	35.256	51434	12.3	5.986	115	133.0	164.3	23.4	0.019	8639	7854	ma120300_rel_withdbg.cz12c_c8r32
100	8685	459	7.2	131.9	3.5	0.053	0.846	1.320	36.276	52096	12.3	5.998	113	133.0	163.8	23.4	0.014	8735	7967	ma120300_rel_withdbg.cz12b_sync_c8r32
100	8649	459	7.2	114.8	3.5	0.053	0.848	1.149	35.404	51755	12.3	5.984	114	133.0	164.3	23.4	0.013	8703	8046	ma120300_rel_withdbg.cz12c_sync_c8r32
qp100.L2
qp100.L2: point queries with 100 insert/s per client
Performance metrics for all DBMS, not just the ones listed above. Some are normalized by throughput, others are not. Legend for results is here.
ips	qps	rps	rmbps	wps	wmbps	rpq	rkbpq	wpi	wkbpi	csps	cpups	cspq	cpupq	dbgb1	dbgb2	rss	maxop	p50	p99	tag
100	1338	9270	144.8	990.9	26.5	6.930	110.866	9.909	271.222	30314	4.4	22.663	263	133.0	163.8	23.5	0.023	1424	864	ma120300_rel_withdbg.cz12b_c8r32
100	1349	9336	145.9	999.8	26.6	6.923	110.762	10.008	273.013	30468	4.3	22.591	255	133.0	164.3	23.4	0.031	1424	896	ma120300_rel_withdbg.cz12c_c8r32
100	1296	9014	140.9	1017.6	26.7	6.955	111.272	10.176	273.579	29673	4.2	22.892	259	133.0	163.8	23.4	0.028	1344	896	ma120300_rel_withdbg.cz12b_sync_c8r32
100	1347	9326	145.7	1000.8	26.6	6.925	110.795	10.008	272.098	30508	4.3	22.653	255	133.0	164.3	23.5	0.019	1424	912	ma120300_rel_withdbg.cz12c_sync_c8r32
qr500.L3
qr500.L3: range queries with 500 insert/s per client
Performance metrics for all DBMS, not just the ones listed above. Some are normalized by throughput, others are not. Legend for results is here.
ips	qps	rps	rmbps	wps	wmbps	rpq	rkbpq	wpi	wkbpi	csps	cpups	cspq	cpupq	dbgb1	dbgb2	rss	maxop	p50	p99	tag
500	8022	2443	38.2	1856.6	51.5	0.304	4.872	3.716	105.511	63408	13.5	7.905	135	133.0	163.8	23.5	0.036	8111	6543	ma120300_rel_withdbg.cz12b_c8r32
500	8128	2442	38.2	1877.9	52.1	0.300	4.807	3.756	106.682	63932	13.6	7.866	134	133.0	164.3	23.5	0.030	8191	6783	ma120300_rel_withdbg.cz12c_c8r32
500	8055	2474	38.7	2028.6	53.3	0.307	4.914	4.060	109.285	63446	13.8	7.877	137	133.0	163.8	23.5	0.043	8175	4415	ma120300_rel_withdbg.cz12b_sync_c8r32
500	8190	2446	38.2	1921.0	52.5	0.299	4.778	3.842	107.491	64051	13.6	7.821	133	133.0	164.3	23.5	0.024	8271	6767	ma120300_rel_withdbg.cz12c_sync_c8r32
qp500.L4
qp500.L4: point queries with 500 insert/s per client
Performance metrics for all DBMS, not just the ones listed above. Some are normalized by throughput, others are not. Legend for results is here.
ips	qps	rps	rmbps	wps	wmbps	rpq	rkbpq	wpi	wkbpi	csps	cpups	cspq	cpupq	dbgb1	dbgb2	rss	maxop	p50	p99	tag
499	1081	10822	169.1	2997.0	81.6	10.013	160.214	6.001	167.392	43793	5.8	40.520	429	133.0	163.8	23.5	0.065	1104	832	ma120300_rel_withdbg.cz12b_c8r32
500	1162	11343	177.2	3029.3	82.5	9.763	156.215	6.062	169.006	44750	5.8	38.518	399	133.0	164.3	23.5	0.030	1200	864	ma120300_rel_withdbg.cz12c_c8r32
499	870	9388	146.7	3051.2	80.5	10.796	172.732	6.110	165.072	39452	5.0	45.368	460	133.0	163.8	23.5	0.154	880	672	ma120300_rel_withdbg.cz12b_sync_c8r32
500	1043	10562	165.0	3011.5	81.3	10.123	161.976	6.023	166.559	42608	5.8	40.839	445	133.0	164.3	23.5	0.189	1040	800	ma120300_rel_withdbg.cz12c_sync_c8r32
qr1000.L5
qr1000.L5: range queries with 1000 insert/s per client
Performance metrics for all DBMS, not just the ones listed above. Some are normalized by throughput, others are not. Legend for results is here.
ips	qps	rps	rmbps	wps	wmbps	rpq	rkbpq	wpi	wkbpi	csps	cpups	cspq	cpupq	dbgb1	dbgb2	rss	maxop	p50	p99	tag
999	7601	4326	67.6	3792.3	104.8	0.569	9.106	3.795	107.354	77097	15.1	10.143	159	133.0	163.8	23.5	0.030	7759	4927	ma120300_rel_withdbg.cz12b_c8r32
999	7648	4328	67.6	3764.6	104.1	0.566	9.054	3.767	106.679	77209	15.0	10.095	157	133.0	164.3	23.5	0.033	7807	5295	ma120300_rel_withdbg.cz12c_c8r32
999	7199	4324	67.6	3973.1	104.3	0.601	9.611	3.976	106.886	72976	15.0	10.137	167	133.0	163.8	23.5	0.034	7567	2288	ma120300_rel_withdbg.cz12b_sync_c8r32
999	7781	4327	67.6	3828.9	104.4	0.556	8.898	3.834	107.067	76660	14.9	9.852	153	133.0	164.3	23.5	0.048	7935	4368	ma120300_rel_withdbg.cz12c_sync_c8r32
qp1000.L6
qp1000.L6: point queries with 1000 insert/s per client
Performance metrics for all DBMS, not just the ones listed above. Some are normalized by throughput, others are not. Legend for results is here.
ips	qps	rps	rmbps	wps	wmbps	rpq	rkbpq	wpi	wkbpi	csps	cpups	cspq	cpupq	dbgb1	dbgb2	rss	maxop	p50	p99	tag
999	878	12274	191.8	4961.6	135.8	13.986	223.776	4.968	139.180	57901	7.6	65.976	693	133.0	163.8	23.5	0.199	880	640	ma120300_rel_withdbg.cz12b_c8r32
999	917	12570	196.4	4997.3	136.7	13.706	219.294	5.000	140.089	58529	7.7	63.820	672	133.0	164.3	23.5	0.050	912	608	ma120300_rel_withdbg.cz12c_c8r32
999	481	8995	140.5	4948.0	130.0	18.700	299.207	4.954	133.323	47438	7.4	98.624	1231	133.0	163.8	23.5	0.299	480	288	ma120300_rel_withdbg.cz12b_sync_c8r32
999	754	11287	176.4	4957.1	134.2	14.976	239.616	4.960	137.508	54318	7.2	72.068	764	133.0	164.3	23.5	0.354	752	528	ma120300_rel_withdbg.cz12c_sync_c8r32
l.i0
- l.i0: load without secondary indexes
- Legend for results is here.
- Each entry lists the percentage of responses that fit in that bucket (slower than max time for previous bucket, faster than min time for next bucket).
Insert response time histogram
256us	1ms	4ms	16ms	64ms	256ms	1s	4s	16s	gt	max	tag
0.000	99.659	0.146	0.142	0.049	0.004	0.000	0.000	0.000	0.000	0.157	ma120300_rel_withdbg.cz12b_c8r32
0.000	99.680	0.132	0.062	0.125	0.001	0.000	0.000	0.000	0.000	0.229	ma120300_rel_withdbg.cz12c_c8r32
0.000	0.000	0.000	59.499	40.500	0.001	0.000	0.000	0.000	0.000	0.231	ma120300_rel_withdbg.cz12b_sync_c8r32
0.000	0.000	76.879	23.075	0.046	nonzero	0.000	0.000	0.000	0.000	0.199	ma120300_rel_withdbg.cz12c_sync_c8r32
l.x
- l.x: create secondary indexes
- Legend for results is here.
- Each entry lists the percentage of responses that fit in that bucket (slower than max time for previous bucket, faster than min time for next bucket).
TODO - determine whether there is data for create index response time
l.i1
- l.i1: continue load after secondary indexes created with 50 inserts per transaction
- Legend for results is here.
- Each entry lists the percentage of responses that fit in that bucket (slower than max time for previous bucket, faster than min time for next bucket).
Insert response time histogram
256us	1ms	4ms	16ms	64ms	256ms	1s	4s	16s	gt	max	tag
0.000	0.000	0.000	47.413	43.230	9.356	0.000	0.001	0.000	0.000	2.503	ma120300_rel_withdbg.cz12b_c8r32
0.000	0.000	0.000	47.689	42.983	9.328	0.000	0.001	0.000	0.000	3.045	ma120300_rel_withdbg.cz12c_c8r32
0.000	0.000	0.000	0.000	79.880	20.117	0.001	0.001	0.000	0.000	3.155	ma120300_rel_withdbg.cz12b_sync_c8r32
0.000	0.000	0.000	5.121	82.115	12.762	0.000	0.001	0.000	0.000	2.504	ma120300_rel_withdbg.cz12c_sync_c8r32
Delete response time histogram
256us	1ms	4ms	16ms	64ms	256ms	1s	4s	16s	gt	max	tag
0.000	0.000	0.000	70.876	29.040	0.083	0.000	0.001	0.000	0.000	2.467	ma120300_rel_withdbg.cz12b_c8r32
0.000	0.000	0.000	70.764	29.121	0.114	0.000	0.001	0.000	0.000	3.005	ma120300_rel_withdbg.cz12c_c8r32
0.000	0.000	0.000	0.220	98.905	0.874	0.000	0.001	0.000	0.000	3.080	ma120300_rel_withdbg.cz12b_sync_c8r32
0.000	0.000	0.000	70.843	29.020	0.136	0.000	0.001	0.000	0.000	2.459	ma120300_rel_withdbg.cz12c_sync_c8r32
l.i2
- l.i2: continue load after secondary indexes created with 5 inserts per transaction
- Legend for results is here.
- Each entry lists the percentage of responses that fit in that bucket (slower than max time for previous bucket, faster than min time for next bucket).
Insert response time histogram
256us	1ms	4ms	16ms	64ms	256ms	1s	4s	16s	gt	max	tag
0.000	15.839	67.537	16.026	0.599	0.000	0.000	0.000	0.000	0.000	0.045	ma120300_rel_withdbg.cz12b_c8r32
0.001	16.260	67.809	15.223	0.708	0.001	0.000	0.000	0.000	0.000	0.134	ma120300_rel_withdbg.cz12c_c8r32
0.000	0.000	0.000	3.925	95.969	0.107	0.000	0.000	0.000	0.000	0.153	ma120300_rel_withdbg.cz12b_sync_c8r32
0.000	0.000	11.200	85.374	3.423	0.002	0.001	0.000	0.000	0.000	0.385	ma120300_rel_withdbg.cz12c_sync_c8r32
Delete response time histogram
256us	1ms	4ms	16ms	64ms	256ms	1s	4s	16s	gt	max	tag
0.002	47.566	42.078	10.034	0.320	0.000	0.000	0.000	0.000	0.000	0.040	ma120300_rel_withdbg.cz12b_c8r32
0.003	48.611	41.745	9.213	0.428	0.001	0.000	0.000	0.000	0.000	0.134	ma120300_rel_withdbg.cz12c_c8r32
0.000	0.000	0.000	7.538	92.412	0.050	0.000	0.000	0.000	0.000	0.152	ma120300_rel_withdbg.cz12b_sync_c8r32
0.000	0.000	32.391	66.838	0.770	0.000	0.001	0.000	0.000	0.000	0.378	ma120300_rel_withdbg.cz12c_sync_c8r32
qr100.L1
- qr100.L1: range queries with 100 insert/s per client
- Legend for results is here.
- Each entry lists the percentage of responses that fit in that bucket (slower than max time for previous bucket, faster than min time for next bucket).
Query response time histogram
256us	1ms	4ms	16ms	64ms	256ms	1s	4s	16s	gt	max	tag
99.679	0.286	0.019	0.016	0.000	0.000	0.000	0.000	0.000	0.000	0.015	ma120300_rel_withdbg.cz12b_c8r32
99.685	0.282	0.019	0.014	nonzero	0.000	0.000	0.000	0.000	0.000	0.019	ma120300_rel_withdbg.cz12c_c8r32
99.745	0.225	0.021	0.010	0.000	0.000	0.000	0.000	0.000	0.000	0.014	ma120300_rel_withdbg.cz12b_sync_c8r32
99.757	0.219	0.015	0.009	0.000	0.000	0.000	0.000	0.000	0.000	0.013	ma120300_rel_withdbg.cz12c_sync_c8r32
Insert response time histogram
256us	1ms	4ms	16ms	64ms	256ms	1s	4s	16s	gt	max	tag
0.000	0.000	0.000	53.528	46.472	0.000	0.000	0.000	0.000	0.000	0.063	ma120300_rel_withdbg.cz12b_c8r32
0.000	0.000	0.000	53.111	46.889	0.000	0.000	0.000	0.000	0.000	0.052	ma120300_rel_withdbg.cz12c_c8r32
0.000	0.000	0.000	0.000	99.806	0.194	0.000	0.000	0.000	0.000	0.072	ma120300_rel_withdbg.cz12b_sync_c8r32
0.000	0.000	0.000	43.889	56.111	0.000	0.000	0.000	0.000	0.000	0.058	ma120300_rel_withdbg.cz12c_sync_c8r32
Delete response time histogram
256us	1ms	4ms	16ms	64ms	256ms	1s	4s	16s	gt	max	tag
0.000	0.000	0.000	56.278	43.722	0.000	0.000	0.000	0.000	0.000	0.038	ma120300_rel_withdbg.cz12b_c8r32
0.000	0.000	0.000	56.222	43.778	0.000	0.000	0.000	0.000	0.000	0.040	ma120300_rel_withdbg.cz12c_c8r32
0.000	0.000	0.000	3.444	96.556	0.000	0.000	0.000	0.000	0.000	0.051	ma120300_rel_withdbg.cz12b_sync_c8r32
0.000	0.000	0.000	50.833	49.167	0.000	0.000	0.000	0.000	0.000	0.035	ma120300_rel_withdbg.cz12c_sync_c8r32
qp100.L2
- qp100.L2: point queries with 100 insert/s per client
- Legend for results is here.
- Each entry lists the percentage of responses that fit in that bucket (slower than max time for previous bucket, faster than min time for next bucket).
Query response time histogram
256us	1ms	4ms	16ms	64ms	256ms	1s	4s	16s	gt	max	tag
0.098	95.140	4.608	0.154	nonzero	0.000	0.000	0.000	0.000	0.000	0.023	ma120300_rel_withdbg.cz12b_c8r32
0.103	95.949	3.740	0.206	nonzero	0.000	0.000	0.000	0.000	0.000	0.031	ma120300_rel_withdbg.cz12c_c8r32
0.096	95.174	4.183	0.546	0.001	0.000	0.000	0.000	0.000	0.000	0.028	ma120300_rel_withdbg.cz12b_sync_c8r32
0.100	95.780	3.949	0.171	nonzero	0.000	0.000	0.000	0.000	0.000	0.019	ma120300_rel_withdbg.cz12c_sync_c8r32
Insert response time histogram
256us	1ms	4ms	16ms	64ms	256ms	1s	4s	16s	gt	max	tag
0.000	0.000	0.000	82.528	17.472	0.000	0.000	0.000	0.000	0.000	0.048	ma120300_rel_withdbg.cz12b_c8r32
0.000	0.000	0.000	81.944	18.056	0.000	0.000	0.000	0.000	0.000	0.048	ma120300_rel_withdbg.cz12c_c8r32
0.000	0.000	0.000	0.000	99.611	0.389	0.000	0.000	0.000	0.000	0.088	ma120300_rel_withdbg.cz12b_sync_c8r32
0.000	0.000	0.000	55.278	44.722	0.000	0.000	0.000	0.000	0.000	0.048	ma120300_rel_withdbg.cz12c_sync_c8r32
Delete response time histogram
256us	1ms	4ms	16ms	64ms	256ms	1s	4s	16s	gt	max	tag
0.000	0.000	0.000	91.028	8.972	0.000	0.000	0.000	0.000	0.000	0.043	ma120300_rel_withdbg.cz12b_c8r32
0.000	0.000	0.000	90.056	9.944	0.000	0.000	0.000	0.000	0.000	0.038	ma120300_rel_withdbg.cz12c_c8r32
0.000	0.000	0.000	0.361	99.611	0.028	0.000	0.000	0.000	0.000	0.075	ma120300_rel_withdbg.cz12b_sync_c8r32
0.000	0.000	0.000	90.111	9.889	0.000	0.000	0.000	0.000	0.000	0.045	ma120300_rel_withdbg.cz12c_sync_c8r32
qr500.L3
- qr500.L3: range queries with 500 insert/s per client
- Legend for results is here.
- Each entry lists the percentage of responses that fit in that bucket (slower than max time for previous bucket, faster than min time for next bucket).
Query response time histogram
256us	1ms	4ms	16ms	64ms	256ms	1s	4s	16s	gt	max	tag
99.105	0.725	0.141	0.029	nonzero	0.000	0.000	0.000	0.000	0.000	0.036	ma120300_rel_withdbg.cz12b_c8r32
99.126	0.728	0.116	0.031	nonzero	0.000	0.000	0.000	0.000	0.000	0.030	ma120300_rel_withdbg.cz12c_c8r32
99.040	0.792	0.134	0.033	nonzero	0.000	0.000	0.000	0.000	0.000	0.043	ma120300_rel_withdbg.cz12b_sync_c8r32
99.238	0.635	0.098	0.029	nonzero	0.000	0.000	0.000	0.000	0.000	0.024	ma120300_rel_withdbg.cz12c_sync_c8r32
Insert response time histogram
256us	1ms	4ms	16ms	64ms	256ms	1s	4s	16s	gt	max	tag
0.000	0.000	0.000	77.350	22.550	0.100	0.000	0.000	0.000	0.000	0.090	ma120300_rel_withdbg.cz12b_c8r32
0.000	0.000	0.000	77.428	22.511	0.061	0.000	0.000	0.000	0.000	0.090	ma120300_rel_withdbg.cz12c_c8r32
0.000	0.000	0.000	0.383	97.778	1.839	0.000	0.000	0.000	0.000	0.169	ma120300_rel_withdbg.cz12b_sync_c8r32
0.000	0.000	0.000	73.339	26.600	0.061	0.000	0.000	0.000	0.000	0.131	ma120300_rel_withdbg.cz12c_sync_c8r32
Delete response time histogram
256us	1ms	4ms	16ms	64ms	256ms	1s	4s	16s	gt	max	tag
0.000	0.000	0.000	83.650	16.350	0.000	0.000	0.000	0.000	0.000	0.063	ma120300_rel_withdbg.cz12b_c8r32
0.000	0.000	0.000	84.378	15.617	0.006	0.000	0.000	0.000	0.000	0.088	ma120300_rel_withdbg.cz12c_c8r32
0.000	0.000	0.000	2.422	97.467	0.111	0.000	0.000	0.000	0.000	0.083	ma120300_rel_withdbg.cz12b_sync_c8r32
0.000	0.000	0.000	81.900	18.100	0.000	0.000	0.000	0.000	0.000	0.055	ma120300_rel_withdbg.cz12c_sync_c8r32
qp500.L4
- qp500.L4: point queries with 500 insert/s per client
- Legend for results is here.
- Each entry lists the percentage of responses that fit in that bucket (slower than max time for previous bucket, faster than min time for next bucket).
Query response time histogram
256us	1ms	4ms	16ms	64ms	256ms	1s	4s	16s	gt	max	tag
0.007	89.984	8.338	1.670	0.001	nonzero	0.000	0.000	0.000	0.000	0.065	ma120300_rel_withdbg.cz12b_c8r32
0.010	91.312	8.134	0.543	0.001	0.000	0.000	0.000	0.000	0.000	0.030	ma120300_rel_withdbg.cz12c_c8r32
0.004	83.149	12.883	3.941	0.023	nonzero	0.000	0.000	0.000	0.000	0.154	ma120300_rel_withdbg.cz12b_sync_c8r32
0.007	88.585	9.701	1.703	0.003	nonzero	0.000	0.000	0.000	0.000	0.189	ma120300_rel_withdbg.cz12c_sync_c8r32
Insert response time histogram
256us	1ms	4ms	16ms	64ms	256ms	1s	4s	16s	gt	max	tag
0.000	0.000	0.000	77.022	21.794	1.183	0.000	0.000	0.000	0.000	0.171	ma120300_rel_withdbg.cz12b_c8r32
0.000	0.000	0.000	83.183	16.750	0.067	0.000	0.000	0.000	0.000	0.178	ma120300_rel_withdbg.cz12c_c8r32
0.000	0.000	0.000	0.022	93.333	6.644	0.000	0.000	0.000	0.000	0.137	ma120300_rel_withdbg.cz12b_sync_c8r32
0.000	0.000	0.000	43.089	55.667	1.244	0.000	0.000	0.000	0.000	0.122	ma120300_rel_withdbg.cz12c_sync_c8r32
Delete response time histogram
256us	1ms	4ms	16ms	64ms	256ms	1s	4s	16s	gt	max	tag
0.000	0.000	0.000	80.056	19.894	0.050	0.000	0.000	0.000	0.000	0.083	ma120300_rel_withdbg.cz12b_c8r32
0.000	0.000	0.000	87.572	12.428	0.000	0.000	0.000	0.000	0.000	0.056	ma120300_rel_withdbg.cz12c_c8r32
0.000	0.000	0.000	0.322	98.783	0.894	0.000	0.000	0.000	0.000	0.084	ma120300_rel_withdbg.cz12b_sync_c8r32
0.000	0.000	0.000	80.183	19.817	0.000	0.000	0.000	0.000	0.000	0.062	ma120300_rel_withdbg.cz12c_sync_c8r32
qr1000.L5
- qr1000.L5: range queries with 1000 insert/s per client
- Legend for results is here.
- Each entry lists the percentage of responses that fit in that bucket (slower than max time for previous bucket, faster than min time for next bucket).
Query response time histogram
256us	1ms	4ms	16ms	64ms	256ms	1s	4s	16s	gt	max	tag
98.369	1.300	0.293	0.038	nonzero	0.000	0.000	0.000	0.000	0.000	0.030	ma120300_rel_withdbg.cz12b_c8r32
98.362	1.323	0.272	0.041	0.001	0.000	0.000	0.000	0.000	0.000	0.033	ma120300_rel_withdbg.cz12c_c8r32
97.880	1.565	0.477	0.078	nonzero	0.000	0.000	0.000	0.000	0.000	0.034	ma120300_rel_withdbg.cz12b_sync_c8r32
98.640	1.111	0.211	0.037	nonzero	0.000	0.000	0.000	0.000	0.000	0.048	ma120300_rel_withdbg.cz12c_sync_c8r32
Insert response time histogram
256us	1ms	4ms	16ms	64ms	256ms	1s	4s	16s	gt	max	tag
0.000	0.000	0.000	75.919	23.906	0.175	0.000	0.000	0.000	0.000	0.125	ma120300_rel_withdbg.cz12b_c8r32
0.000	0.000	0.000	76.131	23.492	0.378	0.000	0.000	0.000	0.000	0.095	ma120300_rel_withdbg.cz12c_c8r32
0.000	0.000	0.000	0.967	95.489	3.544	0.000	0.000	0.000	0.000	0.120	ma120300_rel_withdbg.cz12b_sync_c8r32
0.000	0.000	0.000	70.167	29.511	0.322	0.000	0.000	0.000	0.000	0.146	ma120300_rel_withdbg.cz12c_sync_c8r32
Delete response time histogram
256us	1ms	4ms	16ms	64ms	256ms	1s	4s	16s	gt	max	tag
0.000	0.000	0.000	83.436	16.561	0.003	0.000	0.000	0.000	0.000	0.089	ma120300_rel_withdbg.cz12b_c8r32
0.000	0.000	0.000	84.392	15.606	0.003	0.000	0.000	0.000	0.000	0.068	ma120300_rel_withdbg.cz12c_c8r32
0.000	0.000	0.000	1.344	98.211	0.444	0.000	0.000	0.000	0.000	0.096	ma120300_rel_withdbg.cz12b_sync_c8r32
0.000	0.000	0.000	79.450	20.539	0.011	0.000	0.000	0.000	0.000	0.081	ma120300_rel_withdbg.cz12c_sync_c8r32
qp1000.L6
- qp1000.L6: point queries with 1000 insert/s per client
- Legend for results is here.
- Each entry lists the percentage of responses that fit in that bucket (slower than max time for previous bucket, faster than min time for next bucket).
Query response time histogram
256us	1ms	4ms	16ms	64ms	256ms	1s	4s	16s	gt	max	tag
nonzero	79.425	16.446	4.126	0.004	nonzero	0.000	0.000	0.000	0.000	0.199	ma120300_rel_withdbg.cz12b_c8r32
nonzero	81.065	15.974	2.951	0.009	0.000	0.000	0.000	0.000	0.000	0.050	ma120300_rel_withdbg.cz12c_c8r32
0.000	48.591	36.855	14.351	0.203	nonzero	nonzero	0.000	0.000	0.000	0.299	ma120300_rel_withdbg.cz12b_sync_c8r32
0.000	72.802	21.347	5.831	0.020	nonzero	nonzero	0.000	0.000	0.000	0.354	ma120300_rel_withdbg.cz12c_sync_c8r32
Insert response time histogram
256us	1ms	4ms	16ms	64ms	256ms	1s	4s	16s	gt	max	tag
0.000	0.000	0.000	74.500	24.639	0.861	0.000	0.000	0.000	0.000	0.146	ma120300_rel_withdbg.cz12b_c8r32
0.000	0.000	0.000	76.006	23.244	0.750	0.000	0.000	0.000	0.000	0.128	ma120300_rel_withdbg.cz12c_c8r32
0.000	0.000	0.000	0.067	87.033	12.894	0.006	0.000	0.000	0.000	0.601	ma120300_rel_withdbg.cz12b_sync_c8r32
0.000	0.000	0.000	39.319	58.411	2.267	0.003	0.000	0.000	0.000	0.402	ma120300_rel_withdbg.cz12c_sync_c8r32
Delete response time histogram
256us	1ms	4ms	16ms	64ms	256ms	1s	4s	16s	gt	max	tag
0.000	0.000	0.000	73.903	26.053	0.044	0.000	0.000	0.000	0.000	0.096	ma120300_rel_withdbg.cz12b_c8r32
0.000	0.000	0.000	77.828	22.139	0.033	0.000	0.000	0.000	0.000	0.096	ma120300_rel_withdbg.cz12c_c8r32
0.000	0.000	0.000	0.164	96.664	3.167	0.006	0.000	0.000	0.000	0.555	ma120300_rel_withdbg.cz12b_sync_c8r32
0.000	0.000	0.000	70.933	29.019	0.044	0.003	0.000	0.000	0.000	0.410	ma120300_rel_withdbg.cz12c_sync_c8r32