Introduction
This is a report for the insert benchmark with 120M docs and 12 client(s). It is generated by scripts (bash, awk, sed) and Tufte might not be impressed. An overview of the insert benchmark is here and a short update is here. Below, by DBMS, I mean DBMS+version.config. An example is my8020.c10b40 where my means MySQL, 8020 is version 8.0.20 and c10b40 is the name for the configuration file.
The test server has 32 cores, 128G RAM and 1 NVMe device. The benchmark was run with 12 clients and there were 1 or 3 connections per client (1 for queries or inserts without rate limits, 1+1 for rate limited inserts+deletes). It uses 8 tables with a table per client. It loads 10M rows per table without secondary indexes, creates 3 secondary indexes per table, then inserts 16m+4m rows per table with a delete per insert to avoid growing the table. It then does 6 read+write tests for 1800s each that do queries as fast as possible with 100,100,500,500,1000,1000 inserts/s and the same for deletes/s per client concurrent with the queries. The database is cached. Clients and the DBMS share one server.
The tested DBMS are:
- ma120300_rel_withdbg.cz12b_c32r128 - MariaDB 12.3.0 with the z12b config, my standard config
- ma120300_rel_withdbg.cz12c_c32r128 - MariaDB 12.3.0 with the z12c config that uses the binlog storage engine
- ma120300_rel_withdbg.cz12b_sync_c32r128 - MariaDB 12.3.0 with the z12b_config that adds sync_binlog=1 and innodb_flush_log_at_trx_commit=1 to z12b
- ma120300_rel_withdbg.cz12c_sync_c32r128 - MariaDB 12.3.0 with the z12c_config that adds innodb_flush_log_at_trx_commit=1 to z12c
Contents
- Summary
- l.i0: load without secondary indexes
- l.x: create secondary indexes
- l.i1: continue load after secondary indexes created with 50 inserts per transaction
- l.i2: continue load after secondary indexes created with 5 inserts per transaction
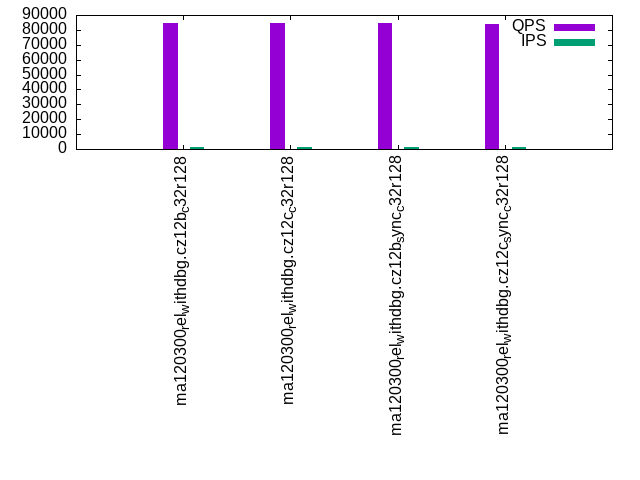
- qr100.L1: range queries with 100 insert/s per client
- qp100.L2: point queries with 100 insert/s per client
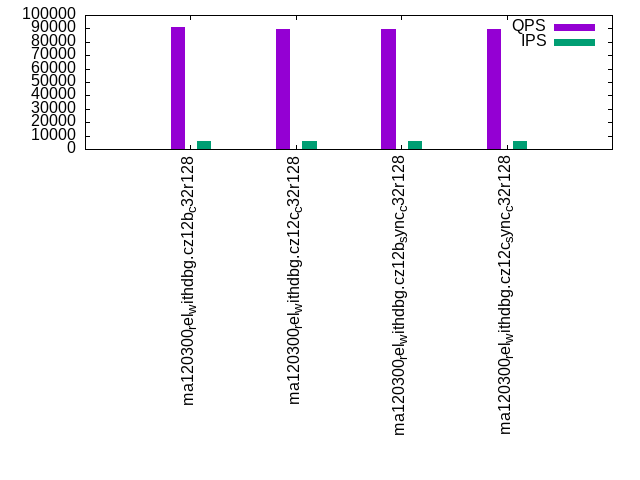
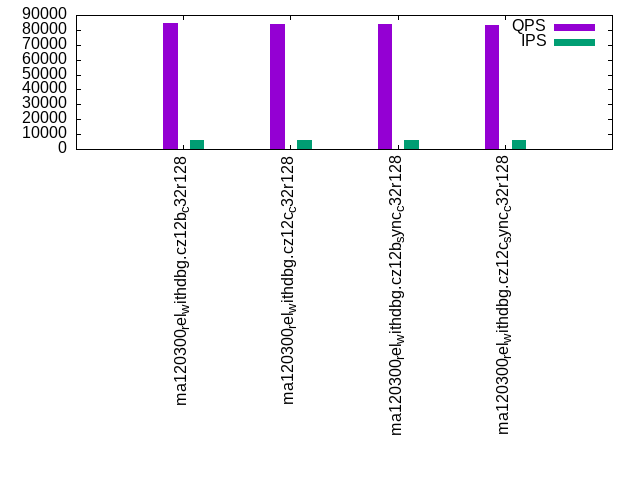
- qr500.L3: range queries with 500 insert/s per client
- qp500.L4: point queries with 500 insert/s per client
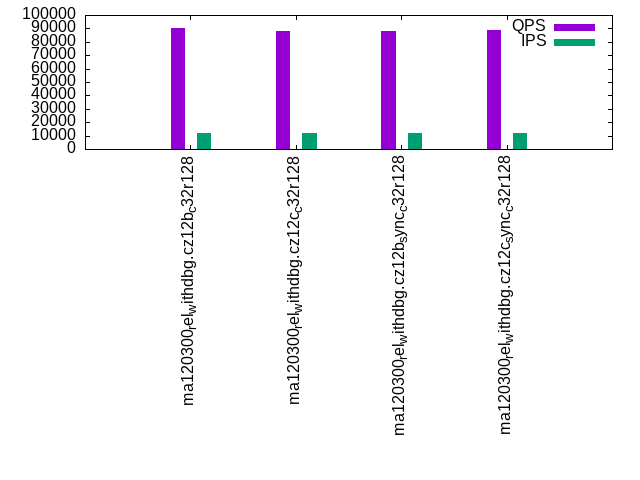
- qr1000.L5: range queries with 1000 insert/s per client
- qp1000.L6: point queries with 1000 insert/s per client
Summary
The numbers are inserts/s for l.i0, l.i1 and l.i2, indexed docs (or rows) /s for l.x and queries/s for qr100, qp100 thru qr1000, qp1000" The values are the average rate over the entire test for inserts (IPS) and queries (QPS). The range of values for IPS and QPS is split into 3 parts: bottom 25%, middle 50%, top 25%. Values in the bottom 25% have a red background, values in the top 25% have a green background and values in the middle have no color. A gray background is used for values that can be ignored because the DBMS did not sustain the target insert rate. Red backgrounds are not used when the minimum value is within 80% of the max value.
| dbms | l.i0 | l.x | l.i1 | l.i2 | qr100 | qp100 | qr500 | qp500 | qr1000 | qp1000 |
|---|---|---|---|---|---|---|---|---|---|---|
| ma120300_rel_withdbg.cz12b_c32r128 | 1034483 | 1578949 | 160535 | 96192 | 92005 | 84897 | 91217 | 84426 | 90148 | 83528 |
| ma120300_rel_withdbg.cz12c_c32r128 | 1081081 | 1818183 | 158025 | 92843 | 90087 | 84298 | 89261 | 83731 | 88329 | 82742 |
| ma120300_rel_withdbg.cz12b_sync_c32r128 | 122449 | 1846155 | 63054 | 10690 | 90926 | 84875 | 89597 | 83986 | 88403 | 82451 |
| ma120300_rel_withdbg.cz12c_sync_c32r128 | 442804 | 1846155 | 171735 | 38710 | 90487 | 84249 | 89501 | 83615 | 88449 | 82584 |
This table has relative throughput, throughput for the DBMS relative to the DBMS in the first line, using the absolute throughput from the previous table. Values less than 0.95 have a yellow background. Values greater than 1.05 have a blue background.
| dbms | l.i0 | l.x | l.i1 | l.i2 | qr100 | qp100 | qr500 | qp500 | qr1000 | qp1000 |
|---|---|---|---|---|---|---|---|---|---|---|
| ma120300_rel_withdbg.cz12b_c32r128 | 1.00 | 1.00 | 1.00 | 1.00 | 1.00 | 1.00 | 1.00 | 1.00 | 1.00 | 1.00 |
| ma120300_rel_withdbg.cz12c_c32r128 | 1.05 | 1.15 | 0.98 | 0.97 | 0.98 | 0.99 | 0.98 | 0.99 | 0.98 | 0.99 |
| ma120300_rel_withdbg.cz12b_sync_c32r128 | 0.12 | 1.17 | 0.39 | 0.11 | 0.99 | 1.00 | 0.98 | 0.99 | 0.98 | 0.99 |
| ma120300_rel_withdbg.cz12c_sync_c32r128 | 0.43 | 1.17 | 1.07 | 0.40 | 0.98 | 0.99 | 0.98 | 0.99 | 0.98 | 0.99 |
This lists the average rate of inserts/s for the tests that do inserts concurrent with queries. For such tests the query rate is listed in the table above. The read+write tests are setup so that the insert rate should match the target rate every second. Cells that are not at least 95% of the target have a red background to indicate a failure to satisfy the target.
| dbms | qr100.L1 | qp100.L2 | qr500.L3 | qp500.L4 | qr1000.L5 | qp1000.L6 |
|---|---|---|---|---|---|---|
| ma120300_rel_withdbg.cz12b_c32r128 | 1192 | 1192 | 5960 | 5964 | 11920 | 11920 |
| ma120300_rel_withdbg.cz12c_c32r128 | 1193 | 1193 | 5964 | 5960 | 11927 | 11927 |
| ma120300_rel_withdbg.cz12b_sync_c32r128 | 1192 | 1192 | 5964 | 5964 | 11927 | 11927 |
| ma120300_rel_withdbg.cz12c_sync_c32r128 | 1193 | 1193 | 5964 | 5960 | 11927 | 11927 |
| target | 1200 | 1200 | 6000 | 6000 | 12000 | 12000 |
l.i0
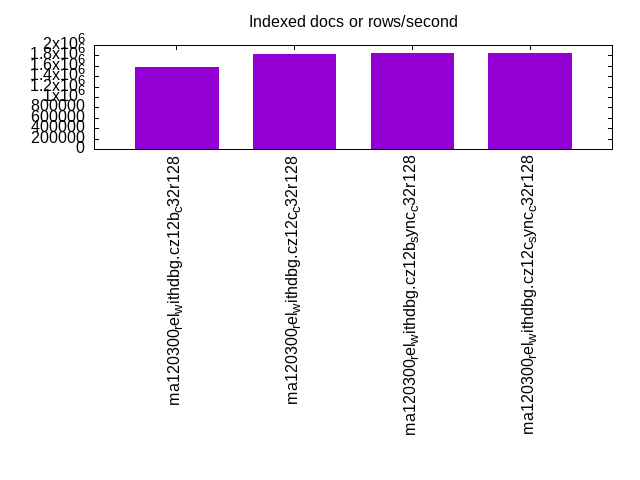
l.i0: load without secondary indexes. Graphs for performance per 1-second interval are here.
Average throughput:

Insert response time histogram: each cell has the percentage of responses that take <= the time in the header and max is the max response time in seconds. For the max column values in the top 25% of the range have a red background and in the bottom 25% of the range have a green background. The red background is not used when the min value is within 80% of the max value.
| dbms | 256us | 1ms | 4ms | 16ms | 64ms | 256ms | 1s | 4s | 16s | gt | max |
|---|---|---|---|---|---|---|---|---|---|---|---|
| ma120300_rel_withdbg.cz12b_c32r128 | 97.491 | 2.429 | 0.026 | 0.005 | 0.048 | 0.001 | 0.257 | ||||
| ma120300_rel_withdbg.cz12c_c32r128 | 97.809 | 2.106 | 0.073 | 0.009 | 0.003 | 0.248 | |||||
| ma120300_rel_withdbg.cz12b_sync_c32r128 | 0.285 | 99.664 | 0.050 | 0.001 | 0.242 | ||||||
| ma120300_rel_withdbg.cz12c_sync_c32r128 | 98.445 | 1.552 | 0.001 | 0.002 | 0.215 |
Performance metrics for the DBMS listed above. Some are normalized by throughput, others are not. Legend for results is here.
ips	qps	rps	rmbps	wps	wmbps	rpq	rkbpq	wpi	wkbpi	csps	cpups	cspq	cpupq	dbgb1	dbgb2	rss	maxop	p50	p99	tag
1034483	0	1	0.0	2423.6	217.3	0.000	0.000	0.002	0.215	151476	43.4	0.146	13	8.0	108.8	10.0	0.257	108085	94788	ma120300_rel_withdbg.cz12b_c32r128
1081081	0	1	0.0	5254.0	375.4	0.000	0.000	0.005	0.356	165938	46.8	0.153	14	8.0	109.3	8.4	0.248	111187	83789	ma120300_rel_withdbg.cz12c_c32r128
122449	0	0	0.0	3206.7	50.4	0.000	0.000	0.026	0.421	42023	6.4	0.343	17	8.0	108.8	9.9	0.242	10599	7199	ma120300_rel_withdbg.cz12b_sync_c32r128
442804	0	0	0.0	4455.2	175.4	0.000	0.000	0.010	0.406	95061	20.7	0.215	15	8.0	109.3	10.0	0.215	39895	37895	ma120300_rel_withdbg.cz12c_sync_c32r128
Average values from iostat.
r/s	rkB/s	rrqm/s	%rrqm	r_await	rareq-s	w/s	wkB/s	wrqm/s	%wrqm	w_await	wareq-s	d/s	dkB/s	drqm/s	%drqm	d_await	dareq-s	f/s	f_await	aqu-sz	%util
0.878	6.435	0.000	0.000	0.433	4.348	2423.6	222486	172.1	9.243	0.279	103.3	3.148	268.4	0.000	0.000	0.999	61.73	55.48	0.390	0.589	12.62		ma120300_rel_withdbg.cz12b_c32r128
0.673	5.636	0.000	0.000	0.512	4.545	5254.0	384390	222.1	5.749	0.333	84.70	2.264	63.31	0.000	0.000	1.510	25.02	68.28	0.401	1.361	18.77		ma120300_rel_withdbg.cz12c_c32r128
0.067	0.612	0.000	0.000	0.069	0.837	3206.7	51603.2	4195.8	56.72	0.450	16.08	21.68	1372.5	0.000	0.000	0.462	21.06	1043.4	0.445	1.920	96.59		ma120300_rel_withdbg.cz12b_sync_c32r128
0.100	1.600	0.000	0.000	0.002	0.296	4455.2	179603	3236.7	42.99	0.308	40.84	7.430	47.04	0.000	0.000	1.586	15.79	816.8	0.440	1.724	82.09		ma120300_rel_withdbg.cz12c_sync_c32r128
l.x
l.x: create secondary indexes.
Average throughput:
Performance metrics for the DBMS listed above. Some are normalized by throughput, others are not. Legend for results is here.
ips	qps	rps	rmbps	wps	wmbps	rpq	rkbpq	wpi	wkbpi	csps	cpups	cspq	cpupq	dbgb1	dbgb2	rss	maxop	p50	p99	tag
1578949	0	1	0.0	12328.0	1112.7	0.000	0.000	0.008	0.722	21977	28.5	0.014	6	16.9	117.7	17.5	0.002	NA	NA	ma120300_rel_withdbg.cz12b_c32r128
1818183	0	0	0.0	13497.3	1272.9	0.000	0.000	0.007	0.717	20905	31.1	0.011	5	16.9	118.2	17.8	0.001	NA	NA	ma120300_rel_withdbg.cz12c_c32r128
1846155	0	0	0.0	13242.5	1270.4	0.000	0.000	0.007	0.705	19670	31.1	0.011	5	16.9	117.7	17.9	0.017	NA	NA	ma120300_rel_withdbg.cz12b_sync_c32r128
1846155	0	0	0.0	12747.8	1262.5	0.000	0.000	0.007	0.700	17368	30.9	0.009	5	16.9	118.2	17.9	0.008	NA	NA	ma120300_rel_withdbg.cz12c_sync_c32r128
Average values from iostat.
r/s	rkB/s	rrqm/s	%rrqm	r_await	rareq-s	w/s	wkB/s	wrqm/s	%wrqm	w_await	wareq-s	d/s	dkB/s	drqm/s	%drqm	d_await	dareq-s	f/s	f_await	aqu-sz	%util
0.613	16.00	0.000	0.000	0.133	8.882	12328.0	1139389	369.1	2.854	0.189	86.69	18.76	132152	0.000	0.000	1.240	5099.2	71.97	0.574	2.739	35.16		ma120300_rel_withdbg.cz12b_c32r128
0.385	1.723	0.000	0.000	0.135	4.000	13497.3	1303412	388.6	2.693	0.231	91.03	21.18	152304	0.000	0.000	1.298	4661.0	83.31	0.659	3.822	38.49		ma120300_rel_withdbg.cz12c_c32r128
0.308	37.23	0.000	0.000	0.014	19.85	13242.5	1300891	406.8	2.833	0.201	88.74	24.58	159225	0.000	0.000	1.273	4138.0	82.82	0.614	3.100	38.88		ma120300_rel_withdbg.cz12b_sync_c32r128
0.277	32.62	0.000	0.000	0.009	10.75	12747.8	1292850	388.1	2.852	0.232	94.67	21.58	152294	0.000	0.000	1.277	4671.5	83.52	0.632	3.571	37.60		ma120300_rel_withdbg.cz12c_sync_c32r128
l.i1
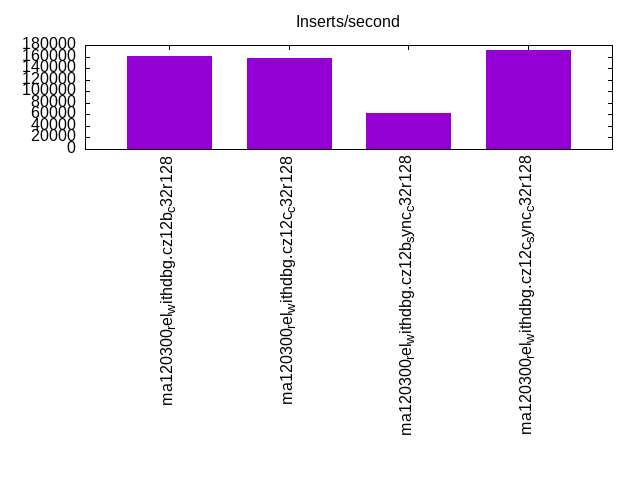
l.i1: continue load after secondary indexes created with 50 inserts per transaction. Graphs for performance per 1-second interval are here.
Average throughput:
Insert response time histogram: each cell has the percentage of responses that take <= the time in the header and max is the max response time in seconds. For the max column values in the top 25% of the range have a red background and in the bottom 25% of the range have a green background. The red background is not used when the min value is within 80% of the max value.
| dbms | 256us | 1ms | 4ms | 16ms | 64ms | 256ms | 1s | 4s | 16s | gt | max |
|---|---|---|---|---|---|---|---|---|---|---|---|
| ma120300_rel_withdbg.cz12b_c32r128 | 0.188 | 95.320 | 2.380 | 1.440 | 0.513 | 0.158 | 0.001 | 2.863 | |||
| ma120300_rel_withdbg.cz12c_c32r128 | 0.299 | 95.446 | 2.172 | 1.360 | 0.508 | 0.214 | nonzero | 2.029 | |||
| ma120300_rel_withdbg.cz12b_sync_c32r128 | 0.007 | 94.710 | 5.264 | 0.017 | 0.002 | 0.661 | |||||
| ma120300_rel_withdbg.cz12c_sync_c32r128 | 84.740 | 14.809 | 0.446 | 0.005 | 0.239 |
Delete response time histogram: each cell has the percentage of responses that take <= the time in the header and max is the max response time in seconds. For the max column values in the top 25% of the range have a red background and in the bottom 25% of the range have a green background. The red background is not used when the min value is within 80% of the max value.
| dbms | 256us | 1ms | 4ms | 16ms | 64ms | 256ms | 1s | 4s | 16s | gt | max |
|---|---|---|---|---|---|---|---|---|---|---|---|
| ma120300_rel_withdbg.cz12b_c32r128 | 1.679 | 94.154 | 2.119 | 1.401 | 0.500 | 0.146 | 0.001 | 2.986 | |||
| ma120300_rel_withdbg.cz12c_c32r128 | 1.809 | 94.232 | 1.930 | 1.327 | 0.496 | 0.206 | nonzero | 2.029 | |||
| ma120300_rel_withdbg.cz12b_sync_c32r128 | 0.063 | 95.126 | 4.795 | 0.014 | 0.002 | 0.874 | |||||
| ma120300_rel_withdbg.cz12c_sync_c32r128 | 88.063 | 11.552 | 0.381 | 0.004 | 0.239 |
Performance metrics for the DBMS listed above. Some are normalized by throughput, others are not. Legend for results is here.
ips	qps	rps	rmbps	wps	wmbps	rpq	rkbpq	wpi	wkbpi	csps	cpups	cspq	cpupq	dbgb1	dbgb2	rss	maxop	p50	p99	tag
160535	0	0	0.0	8620.4	288.8	0.000	0.000	0.054	1.842	121846	49.5	0.759	99	27.1	129.2	30.1	2.863	15440	150	ma120300_rel_withdbg.cz12b_c32r128
158025	0	0	0.0	8195.7	298.0	0.000	0.000	0.052	1.931	110195	47.1	0.697	95	27.1	129.8	30.2	2.029	16198	150	ma120300_rel_withdbg.cz12c_c32r128
63054	0	0	0.0	9010.2	240.8	0.000	0.000	0.143	3.910	80361	17.5	1.274	89	22.3	123.1	24.0	0.661	5849	2000	ma120300_rel_withdbg.cz12b_sync_c32r128
171735	0	0	0.0	13068.4	473.6	0.000	0.000	0.076	2.824	141148	50.3	0.822	94	26.2	128.6	29.1	0.239	15648	5149	ma120300_rel_withdbg.cz12c_sync_c32r128
Average values from iostat.
r/s	rkB/s	rrqm/s	%rrqm	r_await	rareq-s	w/s	wkB/s	wrqm/s	%wrqm	w_await	wareq-s	d/s	dkB/s	drqm/s	%drqm	d_await	dareq-s	f/s	f_await	aqu-sz	%util
0.155	0.619	0.000	0.000	2.521	1.741	8620.4	295733	486.5	4.969	2.351	33.84	0.727	38.97	0.000	0.000	1.273	24.86	643.0	0.703	8.433	52.55		ma120300_rel_withdbg.cz12b_c32r128
0.242	0.968	0.000	0.000	0.187	2.025	8195.7	305199	411.4	4.540	3.130	36.65	0.474	21.52	0.000	0.000	3.154	37.31	562.2	0.859	12.20	55.17		ma120300_rel_withdbg.cz12c_c32r128
0.024	0.095	0.000	0.000	0.050	0.440	9010.2	246567	3147.8	26.14	0.698	27.27	77.56	1469.7	0.000	0.000	0.936	10.71	1526.8	0.647	6.871	97.14		ma120300_rel_withdbg.cz12b_sync_c32r128
0.001	0.004	0.000	0.000	0.004	0.018	13068.4	484939	722.2	5.233	0.273	37.25	1.361	45.64	0.000	0.000	1.740	33.55	1546.5	0.455	4.287	75.92		ma120300_rel_withdbg.cz12c_sync_c32r128
l.i2
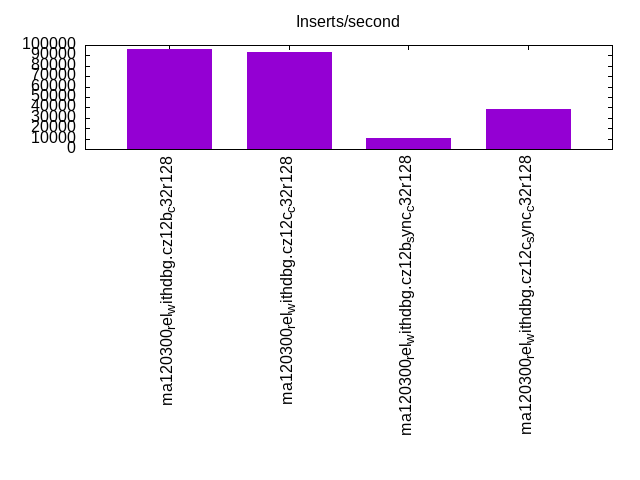
l.i2: continue load after secondary indexes created with 5 inserts per transaction. Graphs for performance per 1-second interval are here.
Average throughput:
Insert response time histogram: each cell has the percentage of responses that take <= the time in the header and max is the max response time in seconds. For the max column values in the top 25% of the range have a red background and in the bottom 25% of the range have a green background. The red background is not used when the min value is within 80% of the max value.
| dbms | 256us | 1ms | 4ms | 16ms | 64ms | 256ms | 1s | 4s | 16s | gt | max |
|---|---|---|---|---|---|---|---|---|---|---|---|
| ma120300_rel_withdbg.cz12b_c32r128 | 6.812 | 91.264 | 1.306 | 0.245 | 0.353 | 0.021 | 0.001 | 0.607 | |||
| ma120300_rel_withdbg.cz12c_c32r128 | 13.123 | 84.711 | 1.472 | 0.229 | 0.442 | 0.023 | nonzero | 0.295 | |||
| ma120300_rel_withdbg.cz12b_sync_c32r128 | 0.224 | 99.015 | 0.757 | 0.004 | 0.169 | ||||||
| ma120300_rel_withdbg.cz12c_sync_c32r128 | 1.137 | 98.031 | 0.822 | 0.010 | 0.056 |
Delete response time histogram: each cell has the percentage of responses that take <= the time in the header and max is the max response time in seconds. For the max column values in the top 25% of the range have a red background and in the bottom 25% of the range have a green background. The red background is not used when the min value is within 80% of the max value.
| dbms | 256us | 1ms | 4ms | 16ms | 64ms | 256ms | 1s | 4s | 16s | gt | max |
|---|---|---|---|---|---|---|---|---|---|---|---|
| ma120300_rel_withdbg.cz12b_c32r128 | 6.522 | 91.568 | 1.313 | 0.231 | 0.347 | 0.018 | 0.001 | 0.607 | |||
| ma120300_rel_withdbg.cz12c_c32r128 | 12.638 | 85.173 | 1.516 | 0.218 | 0.436 | 0.019 | nonzero | 0.306 | |||
| ma120300_rel_withdbg.cz12b_sync_c32r128 | 0.163 | 99.072 | 0.761 | 0.004 | 0.169 | ||||||
| ma120300_rel_withdbg.cz12c_sync_c32r128 | 1.086 | 98.101 | 0.804 | 0.009 | 0.056 |
Performance metrics for the DBMS listed above. Some are normalized by throughput, others are not. Legend for results is here.
ips	qps	rps	rmbps	wps	wmbps	rpq	rkbpq	wpi	wkbpi	csps	cpups	cspq	cpupq	dbgb1	dbgb2	rss	maxop	p50	p99	tag
96192	0	0	0.0	8903.1	309.8	0.000	0.000	0.093	3.298	499355	61.0	5.191	203	27.1	129.2	30.2	0.607	9529	920	ma120300_rel_withdbg.cz12b_c32r128
92843	0	0	0.0	8432.3	312.7	0.000	0.000	0.091	3.449	443641	56.6	4.778	195	27.1	129.8	30.2	0.295	9658	625	ma120300_rel_withdbg.cz12c_c32r128
10690	0	0	0.0	4734.3	52.4	0.000	0.000	0.443	5.023	87304	7.3	8.167	219	22.3	123.1	24.0	0.169	945	300	ma120300_rel_withdbg.cz12b_sync_c32r128
38710	0	0	0.0	6400.9	151.4	0.000	0.000	0.165	4.004	230850	22.8	5.964	188	26.2	128.6	29.1	0.056	3860	1310	ma120300_rel_withdbg.cz12c_sync_c32r128
Average values from iostat.
r/s	rkB/s	rrqm/s	%rrqm	r_await	rareq-s	w/s	wkB/s	wrqm/s	%wrqm	w_await	wareq-s	d/s	dkB/s	drqm/s	%drqm	d_await	dareq-s	f/s	f_await	aqu-sz	%util
0.066	0.264	0.000	0.000	1.510	1.280	8903.1	317202	37.51	0.418	1.261	35.68	0.486	47.90	0.000	0.000	1.531	42.79	604.0	0.689	8.083	52.78		ma120300_rel_withdbg.cz12b_c32r128
0.161	0.645	0.000	0.000	0.083	1.631	8432.3	320245	35.67	0.419	2.046	38.16	0.334	15.67	0.000	0.000	2.503	29.68	546.7	0.845	12.14	58.34		ma120300_rel_withdbg.cz12c_c32r128
0.006	0.023	0.000	0.000	0.008	0.116	4734.3	53702.3	2645.6	35.94	0.509	11.24	0.019	0.094	0.000	0.000	0.164	0.450	1753.4	0.571	3.329	98.04		ma120300_rel_withdbg.cz12b_sync_c32r128
0.002	0.010	0.000	0.000	0.000	0.048	6400.9	155007	39.75	0.419	0.459	23.69	0.660	2.652	0.000	0.000	1.830	3.222	1571.6	0.742	3.254	89.73		ma120300_rel_withdbg.cz12c_sync_c32r128
qr100.L1
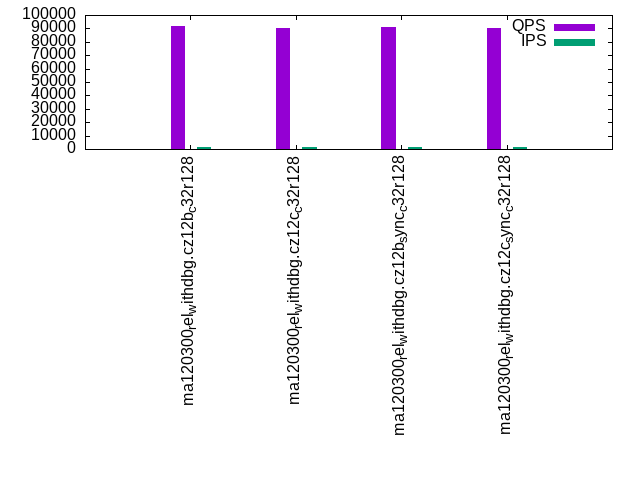
qr100.L1: range queries with 100 insert/s per client. Graphs for performance per 1-second interval are here.
Average throughput:
Query response time histogram: each cell has the percentage of responses that take <= the time in the header and max is the max response time in seconds. For max values in the top 25% of the range have a red background and in the bottom 25% of the range have a green background. The red background is not used when the min value is within 80% of the max value.
| dbms | 256us | 1ms | 4ms | 16ms | 64ms | 256ms | 1s | 4s | 16s | gt | max |
|---|---|---|---|---|---|---|---|---|---|---|---|
| ma120300_rel_withdbg.cz12b_c32r128 | 99.994 | 0.006 | nonzero | 0.002 | |||||||
| ma120300_rel_withdbg.cz12c_c32r128 | 99.993 | 0.007 | nonzero | 0.002 | |||||||
| ma120300_rel_withdbg.cz12b_sync_c32r128 | 99.993 | 0.007 | nonzero | 0.004 | |||||||
| ma120300_rel_withdbg.cz12c_sync_c32r128 | 99.993 | 0.007 | nonzero | 0.003 |
Insert response time histogram: each cell has the percentage of responses that take <= the time in the header and max is the max response time in seconds. For max values in the top 25% of the range have a red background and in the bottom 25% of the range have a green background. The red background is not used when the min value is within 80% of the max value.
| dbms | 256us | 1ms | 4ms | 16ms | 64ms | 256ms | 1s | 4s | 16s | gt | max |
|---|---|---|---|---|---|---|---|---|---|---|---|
| ma120300_rel_withdbg.cz12b_c32r128 | 2.245 | 97.444 | 0.310 | 0.013 | |||||||
| ma120300_rel_withdbg.cz12c_c32r128 | 3.324 | 96.674 | 0.002 | 0.005 | |||||||
| ma120300_rel_withdbg.cz12b_sync_c32r128 | 0.134 | 99.769 | 0.083 | 0.014 | 0.074 | ||||||
| ma120300_rel_withdbg.cz12c_sync_c32r128 | 94.012 | 5.743 | 0.245 | 0.059 |
Delete response time histogram: each cell has the percentage of responses that take <= the time in the header and max is the max response time in seconds. For max values in the top 25% of the range have a red background and in the bottom 25% of the range have a green background. The red background is not used when the min value is within 80% of the max value.
| dbms | 256us | 1ms | 4ms | 16ms | 64ms | 256ms | 1s | 4s | 16s | gt | max |
|---|---|---|---|---|---|---|---|---|---|---|---|
| ma120300_rel_withdbg.cz12b_c32r128 | 37.347 | 62.438 | 0.215 | 0.013 | |||||||
| ma120300_rel_withdbg.cz12c_c32r128 | 43.542 | 56.456 | 0.002 | 0.005 | |||||||
| ma120300_rel_withdbg.cz12b_sync_c32r128 | 0.692 | 99.218 | 0.076 | 0.014 | 0.076 | ||||||
| ma120300_rel_withdbg.cz12c_sync_c32r128 | 95.178 | 4.583 | 0.238 | 0.057 |
Performance metrics for the DBMS listed above. Some are normalized by throughput, others are not. Legend for results is here.
ips	qps	rps	rmbps	wps	wmbps	rpq	rkbpq	wpi	wkbpi	csps	cpups	cspq	cpupq	dbgb1	dbgb2	rss	maxop	p50	p99	tag
1192	92005	0	0.0	14.0	1.4	0.000	0.000	0.012	1.237	527660	38.9	5.735	135	27.1	129.2	30.2	0.002	7711	7615	ma120300_rel_withdbg.cz12b_c32r128
1193	90087	0	0.0	18.0	1.6	0.000	0.000	0.015	1.406	516398	38.9	5.732	138	27.1	129.8	30.2	0.002	7551	7487	ma120300_rel_withdbg.cz12c_c32r128
1192	90926	0	0.0	95.6	1.8	0.000	0.000	0.080	1.547	521899	38.9	5.740	137	22.3	123.1	24.0	0.004	7631	7567	ma120300_rel_withdbg.cz12b_sync_c32r128
1193	90487	0	0.0	59.5	1.6	0.000	0.000	0.050	1.372	518793	38.9	5.733	138	26.2	128.6	29.1	0.003	7487	7423	ma120300_rel_withdbg.cz12c_sync_c32r128
Average values from iostat.
r/s	rkB/s	rrqm/s	%rrqm	r_await	rareq-s	w/s	wkB/s	wrqm/s	%wrqm	w_await	wareq-s	d/s	dkB/s	drqm/s	%drqm	d_await	dareq-s	f/s	f_await	aqu-sz	%util
0.000	0.000	0.000	0.000	0.000	0.000	14.00	1474.0	0.813	5.744	2.689	104.4	0.028	0.972	0.000	0.000	0.256	4.807	1.199	0.768	0.039	0.524		ma120300_rel_withdbg.cz12b_c32r128
0.000	0.000	0.000	0.000	0.000	0.000	17.96	1677.4	3.157	15.05	2.117	92.95	0.046	0.373	0.000	0.000	0.123	0.413	2.005	0.694	0.039	0.789		ma120300_rel_withdbg.cz12c_c32r128
0.000	0.000	0.000	0.000	0.000	0.000	95.62	1843.8	76.63	44.38	0.536	19.55	0.215	1.339	0.000	0.000	0.041	0.221	39.86	0.510	0.071	2.605		ma120300_rel_withdbg.cz12b_sync_c32r128
0.000	0.000	0.000	0.000	0.000	0.000	59.55	1636.3	3.073	5.072	0.504	28.08	0.001	0.002	0.000	0.000	0.003	0.011	26.41	0.512	0.041	1.711		ma120300_rel_withdbg.cz12c_sync_c32r128
qp100.L2
qp100.L2: point queries with 100 insert/s per client. Graphs for performance per 1-second interval are here.
Average throughput:
Query response time histogram: each cell has the percentage of responses that take <= the time in the header and max is the max response time in seconds. For max values in the top 25% of the range have a red background and in the bottom 25% of the range have a green background. The red background is not used when the min value is within 80% of the max value.
| dbms | 256us | 1ms | 4ms | 16ms | 64ms | 256ms | 1s | 4s | 16s | gt | max |
|---|---|---|---|---|---|---|---|---|---|---|---|
| ma120300_rel_withdbg.cz12b_c32r128 | 99.993 | 0.007 | nonzero | 0.003 | |||||||
| ma120300_rel_withdbg.cz12c_c32r128 | 99.992 | 0.008 | nonzero | 0.002 | |||||||
| ma120300_rel_withdbg.cz12b_sync_c32r128 | 99.991 | 0.009 | nonzero | 0.001 | |||||||
| ma120300_rel_withdbg.cz12c_sync_c32r128 | 99.990 | 0.010 | nonzero | 0.003 |
Insert response time histogram: each cell has the percentage of responses that take <= the time in the header and max is the max response time in seconds. For max values in the top 25% of the range have a red background and in the bottom 25% of the range have a green background. The red background is not used when the min value is within 80% of the max value.
| dbms | 256us | 1ms | 4ms | 16ms | 64ms | 256ms | 1s | 4s | 16s | gt | max |
|---|---|---|---|---|---|---|---|---|---|---|---|
| ma120300_rel_withdbg.cz12b_c32r128 | 2.125 | 97.391 | 0.484 | 0.012 | |||||||
| ma120300_rel_withdbg.cz12c_c32r128 | 1.935 | 98.065 | 0.002 | ||||||||
| ma120300_rel_withdbg.cz12b_sync_c32r128 | 4.380 | 95.551 | 0.067 | 0.002 | 0.065 | ||||||
| ma120300_rel_withdbg.cz12c_sync_c32r128 | 92.002 | 7.359 | 0.639 | 0.059 |
Delete response time histogram: each cell has the percentage of responses that take <= the time in the header and max is the max response time in seconds. For max values in the top 25% of the range have a red background and in the bottom 25% of the range have a green background. The red background is not used when the min value is within 80% of the max value.
| dbms | 256us | 1ms | 4ms | 16ms | 64ms | 256ms | 1s | 4s | 16s | gt | max |
|---|---|---|---|---|---|---|---|---|---|---|---|
| ma120300_rel_withdbg.cz12b_c32r128 | 46.245 | 53.440 | 0.315 | 0.009 | |||||||
| ma120300_rel_withdbg.cz12c_c32r128 | 44.072 | 55.928 | 0.002 | ||||||||
| ma120300_rel_withdbg.cz12b_sync_c32r128 | 7.667 | 92.264 | 0.067 | 0.002 | 0.064 | ||||||
| ma120300_rel_withdbg.cz12c_sync_c32r128 | 92.734 | 6.646 | 0.620 | 0.059 |
Performance metrics for the DBMS listed above. Some are normalized by throughput, others are not. Legend for results is here.
ips	qps	rps	rmbps	wps	wmbps	rpq	rkbpq	wpi	wkbpi	csps	cpups	cspq	cpupq	dbgb1	dbgb2	rss	maxop	p50	p99	tag
1192	84897	0	0.0	12.3	1.3	0.000	0.000	0.010	1.083	491840	38.6	5.793	145	27.1	129.2	30.1	0.003	7119	7039	ma120300_rel_withdbg.cz12b_c32r128
1193	84298	0	0.0	16.7	1.5	0.000	0.000	0.014	1.274	488129	38.9	5.791	148	27.1	129.8	30.2	0.002	7071	6991	ma120300_rel_withdbg.cz12c_c32r128
1192	84875	0	0.0	149.5	2.1	0.000	0.000	0.125	1.799	492472	38.5	5.802	145	22.3	123.1	24.0	0.001	7119	7055	ma120300_rel_withdbg.cz12b_sync_c32r128
1193	84249	0	0.0	60.1	1.6	0.000	0.000	0.050	1.369	487951	38.9	5.792	148	26.2	128.6	29.1	0.003	7055	6975	ma120300_rel_withdbg.cz12c_sync_c32r128
Average values from iostat.
r/s	rkB/s	rrqm/s	%rrqm	r_await	rareq-s	w/s	wkB/s	wrqm/s	%wrqm	w_await	wareq-s	d/s	dkB/s	drqm/s	%drqm	d_await	dareq-s	f/s	f_await	aqu-sz	%util
0.000	0.000	0.000	0.000	0.000	0.000	12.32	1291.1	0.746	5.817	2.518	104.3	0.011	1.176	0.000	0.000	0.099	5.878	1.200	0.622	0.032	0.472		ma120300_rel_withdbg.cz12b_c32r128
0.000	0.000	0.000	0.000	0.000	0.000	16.70	1519.6	3.089	15.60	2.032	90.99	0.002	0.007	0.000	0.000	0.017	0.033	2.008	0.622	0.034	0.740		ma120300_rel_withdbg.cz12c_c32r128
0.000	0.000	0.000	0.000	0.000	0.000	149.5	2144.2	121.6	44.81	0.471	14.54	0.004	0.015	0.000	0.000	0.039	0.077	63.39	0.500	0.102	3.982		ma120300_rel_withdbg.cz12b_sync_c32r128
0.000	0.000	0.000	0.000	0.000	0.000	60.08	1632.3	3.145	5.113	0.526	27.73	0.003	0.011	0.000	0.000	0.033	0.055	26.50	0.537	0.042	1.744		ma120300_rel_withdbg.cz12c_sync_c32r128
qr500.L3
qr500.L3: range queries with 500 insert/s per client. Graphs for performance per 1-second interval are here.
Average throughput:
Query response time histogram: each cell has the percentage of responses that take <= the time in the header and max is the max response time in seconds. For max values in the top 25% of the range have a red background and in the bottom 25% of the range have a green background. The red background is not used when the min value is within 80% of the max value.
| dbms | 256us | 1ms | 4ms | 16ms | 64ms | 256ms | 1s | 4s | 16s | gt | max |
|---|---|---|---|---|---|---|---|---|---|---|---|
| ma120300_rel_withdbg.cz12b_c32r128 | 99.987 | 0.013 | nonzero | nonzero | 0.012 | ||||||
| ma120300_rel_withdbg.cz12c_c32r128 | 99.981 | 0.018 | 0.001 | nonzero | nonzero | 0.019 | |||||
| ma120300_rel_withdbg.cz12b_sync_c32r128 | 99.977 | 0.023 | nonzero | nonzero | nonzero | 0.027 | |||||
| ma120300_rel_withdbg.cz12c_sync_c32r128 | 99.980 | 0.020 | nonzero | nonzero | 0.011 |
Insert response time histogram: each cell has the percentage of responses that take <= the time in the header and max is the max response time in seconds. For max values in the top 25% of the range have a red background and in the bottom 25% of the range have a green background. The red background is not used when the min value is within 80% of the max value.
| dbms | 256us | 1ms | 4ms | 16ms | 64ms | 256ms | 1s | 4s | 16s | gt | max |
|---|---|---|---|---|---|---|---|---|---|---|---|
| ma120300_rel_withdbg.cz12b_c32r128 | 1.301 | 98.425 | 0.273 | 0.002 | 0.021 | ||||||
| ma120300_rel_withdbg.cz12c_c32r128 | 0.676 | 99.100 | 0.219 | 0.006 | 0.041 | ||||||
| ma120300_rel_withdbg.cz12b_sync_c32r128 | 0.599 | 98.896 | 0.506 | 0.054 | |||||||
| ma120300_rel_withdbg.cz12c_sync_c32r128 | 95.250 | 4.047 | 0.697 | 0.006 | 0.074 |
Delete response time histogram: each cell has the percentage of responses that take <= the time in the header and max is the max response time in seconds. For max values in the top 25% of the range have a red background and in the bottom 25% of the range have a green background. The red background is not used when the min value is within 80% of the max value.
| dbms | 256us | 1ms | 4ms | 16ms | 64ms | 256ms | 1s | 4s | 16s | gt | max |
|---|---|---|---|---|---|---|---|---|---|---|---|
| ma120300_rel_withdbg.cz12b_c32r128 | 32.373 | 67.457 | 0.168 | 0.002 | 0.017 | ||||||
| ma120300_rel_withdbg.cz12c_c32r128 | 13.124 | 86.725 | 0.150 | 0.001 | 0.025 | ||||||
| ma120300_rel_withdbg.cz12b_sync_c32r128 | 0.783 | 98.745 | 0.472 | 0.058 | |||||||
| ma120300_rel_withdbg.cz12c_sync_c32r128 | 95.558 | 3.772 | 0.665 | 0.005 | 0.073 |
Performance metrics for the DBMS listed above. Some are normalized by throughput, others are not. Legend for results is here.
ips	qps	rps	rmbps	wps	wmbps	rpq	rkbpq	wpi	wkbpi	csps	cpups	cspq	cpupq	dbgb1	dbgb2	rss	maxop	p50	p99	tag
5960	91217	0	0.0	418.7	15.4	0.000	0.000	0.070	2.654	526203	39.9	5.769	140	27.1	129.2	30.2	0.012	7647	7535	ma120300_rel_withdbg.cz12b_c32r128
5964	89261	0	0.0	440.5	16.7	0.000	0.000	0.074	2.875	514158	39.9	5.760	143	27.1	129.8	30.2	0.019	7487	7391	ma120300_rel_withdbg.cz12c_c32r128
5964	89597	0	0.0	754.8	17.8	0.000	0.000	0.127	3.055	518170	39.9	5.783	143	22.3	123.1	24.0	0.027	7503	7391	ma120300_rel_withdbg.cz12b_sync_c32r128
5964	89501	0	0.0	553.2	17.0	0.000	0.000	0.093	2.926	515821	39.9	5.763	143	26.2	128.6	29.1	0.011	7551	7439	ma120300_rel_withdbg.cz12c_sync_c32r128
Average values from iostat.
r/s	rkB/s	rrqm/s	%rrqm	r_await	rareq-s	w/s	wkB/s	wrqm/s	%wrqm	w_await	wareq-s	d/s	dkB/s	drqm/s	%drqm	d_await	dareq-s	f/s	f_await	aqu-sz	%util
0.000	0.000	0.000	0.000	0.000	0.000	418.7	15816.1	1.933	1.380	2.359	105.3	0.050	30.82	0.000	0.000	0.136	79.03	15.95	0.529	0.161	1.552		ma120300_rel_withdbg.cz12b_c32r128
0.005	0.020	0.000	0.000	0.001	0.044	440.5	17144.1	4.920	4.878	2.274	104.2	0.327	5.224	0.000	0.000	0.354	5.308	16.38	0.554	0.189	1.832		ma120300_rel_withdbg.cz12c_c32r128
0.001	0.004	0.000	0.000	0.006	0.022	754.8	18220.6	313.5	41.49	0.551	23.11	6.765	78.20	0.000	0.000	0.235	2.041	172.0	0.516	0.397	10.95		ma120300_rel_withdbg.cz12b_sync_c32r128
0.001	0.002	0.000	0.000	0.000	0.011	553.2	17452.1	4.061	1.820	0.512	41.78	0.263	1.061	0.000	0.000	0.414	1.105	88.54	0.494	0.178	5.002		ma120300_rel_withdbg.cz12c_sync_c32r128
qp500.L4
qp500.L4: point queries with 500 insert/s per client. Graphs for performance per 1-second interval are here.
Average throughput:
Query response time histogram: each cell has the percentage of responses that take <= the time in the header and max is the max response time in seconds. For max values in the top 25% of the range have a red background and in the bottom 25% of the range have a green background. The red background is not used when the min value is within 80% of the max value.
| dbms | 256us | 1ms | 4ms | 16ms | 64ms | 256ms | 1s | 4s | 16s | gt | max |
|---|---|---|---|---|---|---|---|---|---|---|---|
| ma120300_rel_withdbg.cz12b_c32r128 | 99.982 | 0.018 | nonzero | 0.003 | |||||||
| ma120300_rel_withdbg.cz12c_c32r128 | 99.984 | 0.016 | nonzero | 0.002 | |||||||
| ma120300_rel_withdbg.cz12b_sync_c32r128 | 99.970 | 0.029 | nonzero | nonzero | 0.007 | ||||||
| ma120300_rel_withdbg.cz12c_sync_c32r128 | 99.976 | 0.024 | nonzero | nonzero | 0.008 |
Insert response time histogram: each cell has the percentage of responses that take <= the time in the header and max is the max response time in seconds. For max values in the top 25% of the range have a red background and in the bottom 25% of the range have a green background. The red background is not used when the min value is within 80% of the max value.
| dbms | 256us | 1ms | 4ms | 16ms | 64ms | 256ms | 1s | 4s | 16s | gt | max |
|---|---|---|---|---|---|---|---|---|---|---|---|
| ma120300_rel_withdbg.cz12b_c32r128 | 1.026 | 98.683 | 0.288 | 0.003 | 0.019 | ||||||
| ma120300_rel_withdbg.cz12c_c32r128 | 0.963 | 98.789 | 0.243 | 0.005 | 0.027 | ||||||
| ma120300_rel_withdbg.cz12b_sync_c32r128 | 0.429 | 98.972 | 0.599 | 0.062 | |||||||
| ma120300_rel_withdbg.cz12c_sync_c32r128 | 93.888 | 5.132 | 0.957 | 0.023 | 0.098 |
Delete response time histogram: each cell has the percentage of responses that take <= the time in the header and max is the max response time in seconds. For max values in the top 25% of the range have a red background and in the bottom 25% of the range have a green background. The red background is not used when the min value is within 80% of the max value.
| dbms | 256us | 1ms | 4ms | 16ms | 64ms | 256ms | 1s | 4s | 16s | gt | max |
|---|---|---|---|---|---|---|---|---|---|---|---|
| ma120300_rel_withdbg.cz12b_c32r128 | 15.088 | 84.741 | 0.169 | 0.003 | 0.020 | ||||||
| ma120300_rel_withdbg.cz12c_c32r128 | 31.263 | 68.611 | 0.125 | 0.001 | 0.024 | ||||||
| ma120300_rel_withdbg.cz12b_sync_c32r128 | 0.421 | 99.031 | 0.549 | 0.062 | |||||||
| ma120300_rel_withdbg.cz12c_sync_c32r128 | 94.339 | 4.715 | 0.926 | 0.019 | 0.079 |
Performance metrics for the DBMS listed above. Some are normalized by throughput, others are not. Legend for results is here.
ips	qps	rps	rmbps	wps	wmbps	rpq	rkbpq	wpi	wkbpi	csps	cpups	cspq	cpupq	dbgb1	dbgb2	rss	maxop	p50	p99	tag
5964	84426	0	0.0	433.6	15.7	0.000	0.000	0.073	2.691	491852	39.9	5.826	151	27.1	129.2	30.2	0.003	7071	6991	ma120300_rel_withdbg.cz12b_c32r128
5960	83731	0	0.0	456.9	17.0	0.000	0.000	0.077	2.914	488327	39.9	5.832	152	27.1	129.8	30.2	0.002	7007	6911	ma120300_rel_withdbg.cz12c_c32r128
5964	83986	0	0.0	725.6	17.6	0.000	0.000	0.122	3.020	491189	39.9	5.848	152	22.3	123.1	24.0	0.007	7039	6927	ma120300_rel_withdbg.cz12b_sync_c32r128
5960	83615	0	0.0	566.5	17.2	0.000	0.000	0.095	2.955	487242	39.9	5.827	153	26.2	128.6	29.1	0.008	6975	6879	ma120300_rel_withdbg.cz12c_sync_c32r128
Average values from iostat.
r/s	rkB/s	rrqm/s	%rrqm	r_await	rareq-s	w/s	wkB/s	wrqm/s	%wrqm	w_await	wareq-s	d/s	dkB/s	drqm/s	%drqm	d_await	dareq-s	f/s	f_await	aqu-sz	%util
0.001	0.002	0.000	0.000	0.000	0.011	433.6	16047.6	1.989	1.333	2.109	98.98	0.052	25.77	0.000	0.000	0.201	77.08	18.71	0.511	0.156	1.557		ma120300_rel_withdbg.cz12b_c32r128
0.003	0.013	0.000	0.000	0.000	0.033	456.9	17368.7	5.396	4.956	2.081	97.69	0.515	8.230	0.000	0.000	0.566	8.451	21.92	0.584	0.190	2.004		ma120300_rel_withdbg.cz12c_c32r128
0.001	0.002	0.000	0.000	0.000	0.011	725.6	18008.3	261.9	38.26	0.525	24.78	2.806	44.05	0.000	0.000	0.246	2.916	160.2	0.505	0.355	9.592		ma120300_rel_withdbg.cz12b_sync_c32r128
0.000	0.000	0.000	0.000	0.000	0.000	566.5	17609.6	4.439	1.807	0.515	41.19	0.264	9.173	0.000	0.000	0.512	9.195	92.00	0.515	0.196	5.173		ma120300_rel_withdbg.cz12c_sync_c32r128
qr1000.L5
qr1000.L5: range queries with 1000 insert/s per client. Graphs for performance per 1-second interval are here.
Average throughput:
Query response time histogram: each cell has the percentage of responses that take <= the time in the header and max is the max response time in seconds. For max values in the top 25% of the range have a red background and in the bottom 25% of the range have a green background. The red background is not used when the min value is within 80% of the max value.
| dbms | 256us | 1ms | 4ms | 16ms | 64ms | 256ms | 1s | 4s | 16s | gt | max |
|---|---|---|---|---|---|---|---|---|---|---|---|
| ma120300_rel_withdbg.cz12b_c32r128 | 99.966 | 0.033 | 0.001 | nonzero | nonzero | 0.019 | |||||
| ma120300_rel_withdbg.cz12c_c32r128 | 99.962 | 0.037 | 0.001 | 0.001 | nonzero | nonzero | 0.170 | ||||
| ma120300_rel_withdbg.cz12b_sync_c32r128 | 99.942 | 0.057 | 0.001 | nonzero | nonzero | nonzero | 0.074 | ||||
| ma120300_rel_withdbg.cz12c_sync_c32r128 | 99.948 | 0.051 | 0.001 | 0.001 | nonzero | nonzero | 0.117 |
Insert response time histogram: each cell has the percentage of responses that take <= the time in the header and max is the max response time in seconds. For max values in the top 25% of the range have a red background and in the bottom 25% of the range have a green background. The red background is not used when the min value is within 80% of the max value.
| dbms | 256us | 1ms | 4ms | 16ms | 64ms | 256ms | 1s | 4s | 16s | gt | max |
|---|---|---|---|---|---|---|---|---|---|---|---|
| ma120300_rel_withdbg.cz12b_c32r128 | 0.706 | 98.542 | 0.735 | 0.016 | 0.036 | ||||||
| ma120300_rel_withdbg.cz12c_c32r128 | 0.908 | 98.158 | 0.908 | 0.021 | 0.005 | 0.172 | |||||
| ma120300_rel_withdbg.cz12b_sync_c32r128 | 0.395 | 98.513 | 1.085 | 0.007 | 0.097 | ||||||
| ma120300_rel_withdbg.cz12c_sync_c32r128 | 95.317 | 3.763 | 0.915 | 0.005 | 0.134 |
Delete response time histogram: each cell has the percentage of responses that take <= the time in the header and max is the max response time in seconds. For max values in the top 25% of the range have a red background and in the bottom 25% of the range have a green background. The red background is not used when the min value is within 80% of the max value.
| dbms | 256us | 1ms | 4ms | 16ms | 64ms | 256ms | 1s | 4s | 16s | gt | max |
|---|---|---|---|---|---|---|---|---|---|---|---|
| ma120300_rel_withdbg.cz12b_c32r128 | 8.014 | 91.385 | 0.588 | 0.013 | 0.040 | ||||||
| ma120300_rel_withdbg.cz12c_c32r128 | 10.215 | 89.104 | 0.667 | 0.010 | 0.003 | 0.172 | |||||
| ma120300_rel_withdbg.cz12b_sync_c32r128 | 0.387 | 98.653 | 0.955 | 0.005 | 0.092 | ||||||
| ma120300_rel_withdbg.cz12c_sync_c32r128 | 95.969 | 3.151 | 0.875 | 0.005 | 0.134 |
Performance metrics for the DBMS listed above. Some are normalized by throughput, others are not. Legend for results is here.
ips	qps	rps	rmbps	wps	wmbps	rpq	rkbpq	wpi	wkbpi	csps	cpups	cspq	cpupq	dbgb1	dbgb2	rss	maxop	p50	p99	tag
11920	90148	0	0.0	880.8	31.5	0.000	0.000	0.074	2.709	522482	41.0	5.796	146	27.1	129.2	30.2	0.019	7583	7455	ma120300_rel_withdbg.cz12b_c32r128
11927	88329	0	0.0	1215.1	41.6	0.000	0.000	0.102	3.575	512802	41.8	5.806	151	27.1	129.8	30.2	0.170	7374	7231	ma120300_rel_withdbg.cz12c_c32r128
11927	88403	0	0.0	1460.4	35.4	0.000	0.000	0.122	3.036	515193	41.8	5.828	151	22.3	123.1	24.0	0.074	7407	7231	ma120300_rel_withdbg.cz12b_sync_c32r128
11927	88449	0	0.0	1434.5	42.1	0.000	0.000	0.120	3.616	513610	41.8	5.807	151	26.2	128.6	29.1	0.117	7407	7263	ma120300_rel_withdbg.cz12c_sync_c32r128
Average values from iostat.
r/s	rkB/s	rrqm/s	%rrqm	r_await	rareq-s	w/s	wkB/s	wrqm/s	%wrqm	w_await	wareq-s	d/s	dkB/s	drqm/s	%drqm	d_await	dareq-s	f/s	f_await	aqu-sz	%util
0.002	0.009	0.000	0.000	0.003	0.044	880.8	32298.2	3.335	0.762	1.527	84.05	0.091	24.97	0.000	0.000	0.180	31.94	41.09	0.474	0.279	2.904		ma120300_rel_withdbg.cz12b_c32r128
0.008	0.031	0.000	0.000	0.001	0.088	1215.1	42638.8	7.233	1.800	1.324	76.25	0.375	18.95	0.000	0.000	0.497	20.28	58.16	0.444	0.420	4.444		ma120300_rel_withdbg.cz12c_c32r128
0.003	0.011	0.000	0.000	0.006	0.055	1460.4	36207.1	526.7	35.93	0.547	24.76	8.161	447.4	0.000	0.000	0.471	8.233	322.4	0.519	0.829	19.41		ma120300_rel_withdbg.cz12b_sync_c32r128
0.001	0.002	0.000	0.000	0.003	0.011	1434.5	43133.6	6.216	0.888	0.459	37.33	0.631	23.77	0.000	0.000	1.450	24.99	203.5	0.506	0.485	10.67		ma120300_rel_withdbg.cz12c_sync_c32r128
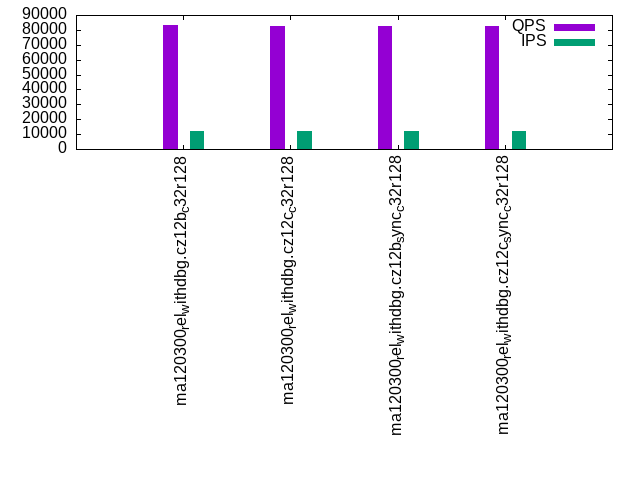
qp1000.L6
qp1000.L6: point queries with 1000 insert/s per client. Graphs for performance per 1-second interval are here.
Average throughput:
Query response time histogram: each cell has the percentage of responses that take <= the time in the header and max is the max response time in seconds. For max values in the top 25% of the range have a red background and in the bottom 25% of the range have a green background. The red background is not used when the min value is within 80% of the max value.
| dbms | 256us | 1ms | 4ms | 16ms | 64ms | 256ms | 1s | 4s | 16s | gt | max |
|---|---|---|---|---|---|---|---|---|---|---|---|
| ma120300_rel_withdbg.cz12b_c32r128 | 99.959 | 0.041 | 0.001 | nonzero | 0.008 | ||||||
| ma120300_rel_withdbg.cz12c_c32r128 | 99.957 | 0.042 | nonzero | nonzero | nonzero | 0.032 | |||||
| ma120300_rel_withdbg.cz12b_sync_c32r128 | 99.926 | 0.073 | 0.001 | nonzero | nonzero | 0.035 | |||||
| ma120300_rel_withdbg.cz12c_sync_c32r128 | 99.939 | 0.060 | 0.001 | nonzero | nonzero | 0.017 |
Insert response time histogram: each cell has the percentage of responses that take <= the time in the header and max is the max response time in seconds. For max values in the top 25% of the range have a red background and in the bottom 25% of the range have a green background. The red background is not used when the min value is within 80% of the max value.
| dbms | 256us | 1ms | 4ms | 16ms | 64ms | 256ms | 1s | 4s | 16s | gt | max |
|---|---|---|---|---|---|---|---|---|---|---|---|
| ma120300_rel_withdbg.cz12b_c32r128 | 0.499 | 98.241 | 1.239 | 0.019 | 0.003 | 0.081 | |||||
| ma120300_rel_withdbg.cz12c_c32r128 | 1.028 | 98.127 | 0.825 | 0.019 | nonzero | 0.070 | |||||
| ma120300_rel_withdbg.cz12b_sync_c32r128 | 0.183 | 98.629 | 1.184 | 0.005 | 0.099 | ||||||
| ma120300_rel_withdbg.cz12c_sync_c32r128 | 93.481 | 5.230 | 1.273 | 0.015 | 0.182 |
Delete response time histogram: each cell has the percentage of responses that take <= the time in the header and max is the max response time in seconds. For max values in the top 25% of the range have a red background and in the bottom 25% of the range have a green background. The red background is not used when the min value is within 80% of the max value.
| dbms | 256us | 1ms | 4ms | 16ms | 64ms | 256ms | 1s | 4s | 16s | gt | max |
|---|---|---|---|---|---|---|---|---|---|---|---|
| ma120300_rel_withdbg.cz12b_c32r128 | 3.125 | 95.797 | 1.059 | 0.016 | 0.003 | 0.080 | |||||
| ma120300_rel_withdbg.cz12c_c32r128 | 8.471 | 90.895 | 0.621 | 0.013 | nonzero | 0.064 | |||||
| ma120300_rel_withdbg.cz12b_sync_c32r128 | 0.200 | 98.790 | 1.007 | 0.004 | 0.099 | ||||||
| ma120300_rel_withdbg.cz12c_sync_c32r128 | 94.200 | 4.554 | 1.235 | 0.011 | 0.218 |
Performance metrics for the DBMS listed above. Some are normalized by throughput, others are not. Legend for results is here.
ips	qps	rps	rmbps	wps	wmbps	rpq	rkbpq	wpi	wkbpi	csps	cpups	cspq	cpupq	dbgb1	dbgb2	rss	maxop	p50	p99	tag
11920	83528	0	0.0	886.3	31.6	0.000	0.000	0.074	2.716	489414	41.0	5.859	157	27.1	129.2	30.2	0.008	7007	6879	ma120300_rel_withdbg.cz12b_c32r128
11927	82742	0	0.0	945.9	34.6	0.000	0.000	0.079	2.974	485292	41.2	5.865	159	27.1	129.8	30.2	0.032	6943	6831	ma120300_rel_withdbg.cz12c_c32r128
11927	82451	0	0.0	1420.4	35.2	0.000	0.000	0.119	3.021	487149	41.5	5.908	161	22.3	123.1	24.0	0.035	6895	6783	ma120300_rel_withdbg.cz12b_sync_c32r128
11927	82584	0	0.0	1160.6	35.3	0.000	0.000	0.097	3.030	484289	41.7	5.864	162	26.2	128.6	29.1	0.017	6927	6815	ma120300_rel_withdbg.cz12c_sync_c32r128
Average values from iostat.
r/s	rkB/s	rrqm/s	%rrqm	r_await	rareq-s	w/s	wkB/s	wrqm/s	%wrqm	w_await	wareq-s	d/s	dkB/s	drqm/s	%drqm	d_await	dareq-s	f/s	f_await	aqu-sz	%util
0.003	0.013	0.000	0.000	0.011	0.066	886.3	32376.7	3.353	0.733	1.530	77.92	0.069	36.34	0.000	0.000	0.260	86.33	43.94	0.514	0.370	3.397		ma120300_rel_withdbg.cz12b_c32r128
0.013	0.053	0.000	0.000	0.003	0.133	945.9	35474.1	6.417	1.794	1.478	74.50	0.376	6.000	0.000	0.000	0.647	6.495	47.00	0.522	0.463	3.891		ma120300_rel_withdbg.cz12c_c32r128
0.004	0.015	0.000	0.000	0.004	0.066	1420.4	36037.6	502.6	34.85	0.547	25.84	11.56	1748.9	0.000	0.000	0.459	55.02	303.4	0.522	0.793	18.20		ma120300_rel_withdbg.cz12b_sync_c32r128
0.001	0.002	0.000	0.000	0.000	0.011	1160.6	36141.6	5.826	0.875	0.473	37.69	0.594	20.95	0.000	0.000	1.482	22.00	182.8	0.526	0.504	10.30		ma120300_rel_withdbg.cz12c_sync_c32r128
l.i0
l.i0: load without secondary indexes
Performance metrics for all DBMS, not just the ones listed above. Some are normalized by throughput, others are not. Legend for results is here.
ips	qps	rps	rmbps	wps	wmbps	rpq	rkbpq	wpi	wkbpi	csps	cpups	cspq	cpupq	dbgb1	dbgb2	rss	maxop	p50	p99	tag
1034483	0	1	0.0	2423.6	217.3	0.000	0.000	0.002	0.215	151476	43.4	0.146	13	8.0	108.8	10.0	0.257	108085	94788	ma120300_rel_withdbg.cz12b_c32r128
1081081	0	1	0.0	5254.0	375.4	0.000	0.000	0.005	0.356	165938	46.8	0.153	14	8.0	109.3	8.4	0.248	111187	83789	ma120300_rel_withdbg.cz12c_c32r128
122449	0	0	0.0	3206.7	50.4	0.000	0.000	0.026	0.421	42023	6.4	0.343	17	8.0	108.8	9.9	0.242	10599	7199	ma120300_rel_withdbg.cz12b_sync_c32r128
442804	0	0	0.0	4455.2	175.4	0.000	0.000	0.010	0.406	95061	20.7	0.215	15	8.0	109.3	10.0	0.215	39895	37895	ma120300_rel_withdbg.cz12c_sync_c32r128
l.x
l.x: create secondary indexes
Performance metrics for all DBMS, not just the ones listed above. Some are normalized by throughput, others are not. Legend for results is here.
ips	qps	rps	rmbps	wps	wmbps	rpq	rkbpq	wpi	wkbpi	csps	cpups	cspq	cpupq	dbgb1	dbgb2	rss	maxop	p50	p99	tag
1578949	0	1	0.0	12328.0	1112.7	0.000	0.000	0.008	0.722	21977	28.5	0.014	6	16.9	117.7	17.5	0.002	NA	NA	ma120300_rel_withdbg.cz12b_c32r128
1818183	0	0	0.0	13497.3	1272.9	0.000	0.000	0.007	0.717	20905	31.1	0.011	5	16.9	118.2	17.8	0.001	NA	NA	ma120300_rel_withdbg.cz12c_c32r128
1846155	0	0	0.0	13242.5	1270.4	0.000	0.000	0.007	0.705	19670	31.1	0.011	5	16.9	117.7	17.9	0.017	NA	NA	ma120300_rel_withdbg.cz12b_sync_c32r128
1846155	0	0	0.0	12747.8	1262.5	0.000	0.000	0.007	0.700	17368	30.9	0.009	5	16.9	118.2	17.9	0.008	NA	NA	ma120300_rel_withdbg.cz12c_sync_c32r128
l.i1
l.i1: continue load after secondary indexes created with 50 inserts per transaction
Performance metrics for all DBMS, not just the ones listed above. Some are normalized by throughput, others are not. Legend for results is here.
ips	qps	rps	rmbps	wps	wmbps	rpq	rkbpq	wpi	wkbpi	csps	cpups	cspq	cpupq	dbgb1	dbgb2	rss	maxop	p50	p99	tag
160535	0	0	0.0	8620.4	288.8	0.000	0.000	0.054	1.842	121846	49.5	0.759	99	27.1	129.2	30.1	2.863	15440	150	ma120300_rel_withdbg.cz12b_c32r128
158025	0	0	0.0	8195.7	298.0	0.000	0.000	0.052	1.931	110195	47.1	0.697	95	27.1	129.8	30.2	2.029	16198	150	ma120300_rel_withdbg.cz12c_c32r128
63054	0	0	0.0	9010.2	240.8	0.000	0.000	0.143	3.910	80361	17.5	1.274	89	22.3	123.1	24.0	0.661	5849	2000	ma120300_rel_withdbg.cz12b_sync_c32r128
171735	0	0	0.0	13068.4	473.6	0.000	0.000	0.076	2.824	141148	50.3	0.822	94	26.2	128.6	29.1	0.239	15648	5149	ma120300_rel_withdbg.cz12c_sync_c32r128
l.i2
l.i2: continue load after secondary indexes created with 5 inserts per transaction
Performance metrics for all DBMS, not just the ones listed above. Some are normalized by throughput, others are not. Legend for results is here.
ips	qps	rps	rmbps	wps	wmbps	rpq	rkbpq	wpi	wkbpi	csps	cpups	cspq	cpupq	dbgb1	dbgb2	rss	maxop	p50	p99	tag
96192	0	0	0.0	8903.1	309.8	0.000	0.000	0.093	3.298	499355	61.0	5.191	203	27.1	129.2	30.2	0.607	9529	920	ma120300_rel_withdbg.cz12b_c32r128
92843	0	0	0.0	8432.3	312.7	0.000	0.000	0.091	3.449	443641	56.6	4.778	195	27.1	129.8	30.2	0.295	9658	625	ma120300_rel_withdbg.cz12c_c32r128
10690	0	0	0.0	4734.3	52.4	0.000	0.000	0.443	5.023	87304	7.3	8.167	219	22.3	123.1	24.0	0.169	945	300	ma120300_rel_withdbg.cz12b_sync_c32r128
38710	0	0	0.0	6400.9	151.4	0.000	0.000	0.165	4.004	230850	22.8	5.964	188	26.2	128.6	29.1	0.056	3860	1310	ma120300_rel_withdbg.cz12c_sync_c32r128
qr100.L1
qr100.L1: range queries with 100 insert/s per client
Performance metrics for all DBMS, not just the ones listed above. Some are normalized by throughput, others are not. Legend for results is here.
ips	qps	rps	rmbps	wps	wmbps	rpq	rkbpq	wpi	wkbpi	csps	cpups	cspq	cpupq	dbgb1	dbgb2	rss	maxop	p50	p99	tag
1192	92005	0	0.0	14.0	1.4	0.000	0.000	0.012	1.237	527660	38.9	5.735	135	27.1	129.2	30.2	0.002	7711	7615	ma120300_rel_withdbg.cz12b_c32r128
1193	90087	0	0.0	18.0	1.6	0.000	0.000	0.015	1.406	516398	38.9	5.732	138	27.1	129.8	30.2	0.002	7551	7487	ma120300_rel_withdbg.cz12c_c32r128
1192	90926	0	0.0	95.6	1.8	0.000	0.000	0.080	1.547	521899	38.9	5.740	137	22.3	123.1	24.0	0.004	7631	7567	ma120300_rel_withdbg.cz12b_sync_c32r128
1193	90487	0	0.0	59.5	1.6	0.000	0.000	0.050	1.372	518793	38.9	5.733	138	26.2	128.6	29.1	0.003	7487	7423	ma120300_rel_withdbg.cz12c_sync_c32r128
qp100.L2
qp100.L2: point queries with 100 insert/s per client
Performance metrics for all DBMS, not just the ones listed above. Some are normalized by throughput, others are not. Legend for results is here.
ips	qps	rps	rmbps	wps	wmbps	rpq	rkbpq	wpi	wkbpi	csps	cpups	cspq	cpupq	dbgb1	dbgb2	rss	maxop	p50	p99	tag
1192	84897	0	0.0	12.3	1.3	0.000	0.000	0.010	1.083	491840	38.6	5.793	145	27.1	129.2	30.1	0.003	7119	7039	ma120300_rel_withdbg.cz12b_c32r128
1193	84298	0	0.0	16.7	1.5	0.000	0.000	0.014	1.274	488129	38.9	5.791	148	27.1	129.8	30.2	0.002	7071	6991	ma120300_rel_withdbg.cz12c_c32r128
1192	84875	0	0.0	149.5	2.1	0.000	0.000	0.125	1.799	492472	38.5	5.802	145	22.3	123.1	24.0	0.001	7119	7055	ma120300_rel_withdbg.cz12b_sync_c32r128
1193	84249	0	0.0	60.1	1.6	0.000	0.000	0.050	1.369	487951	38.9	5.792	148	26.2	128.6	29.1	0.003	7055	6975	ma120300_rel_withdbg.cz12c_sync_c32r128
qr500.L3
qr500.L3: range queries with 500 insert/s per client
Performance metrics for all DBMS, not just the ones listed above. Some are normalized by throughput, others are not. Legend for results is here.
ips	qps	rps	rmbps	wps	wmbps	rpq	rkbpq	wpi	wkbpi	csps	cpups	cspq	cpupq	dbgb1	dbgb2	rss	maxop	p50	p99	tag
5960	91217	0	0.0	418.7	15.4	0.000	0.000	0.070	2.654	526203	39.9	5.769	140	27.1	129.2	30.2	0.012	7647	7535	ma120300_rel_withdbg.cz12b_c32r128
5964	89261	0	0.0	440.5	16.7	0.000	0.000	0.074	2.875	514158	39.9	5.760	143	27.1	129.8	30.2	0.019	7487	7391	ma120300_rel_withdbg.cz12c_c32r128
5964	89597	0	0.0	754.8	17.8	0.000	0.000	0.127	3.055	518170	39.9	5.783	143	22.3	123.1	24.0	0.027	7503	7391	ma120300_rel_withdbg.cz12b_sync_c32r128
5964	89501	0	0.0	553.2	17.0	0.000	0.000	0.093	2.926	515821	39.9	5.763	143	26.2	128.6	29.1	0.011	7551	7439	ma120300_rel_withdbg.cz12c_sync_c32r128
qp500.L4
qp500.L4: point queries with 500 insert/s per client
Performance metrics for all DBMS, not just the ones listed above. Some are normalized by throughput, others are not. Legend for results is here.
ips	qps	rps	rmbps	wps	wmbps	rpq	rkbpq	wpi	wkbpi	csps	cpups	cspq	cpupq	dbgb1	dbgb2	rss	maxop	p50	p99	tag
5964	84426	0	0.0	433.6	15.7	0.000	0.000	0.073	2.691	491852	39.9	5.826	151	27.1	129.2	30.2	0.003	7071	6991	ma120300_rel_withdbg.cz12b_c32r128
5960	83731	0	0.0	456.9	17.0	0.000	0.000	0.077	2.914	488327	39.9	5.832	152	27.1	129.8	30.2	0.002	7007	6911	ma120300_rel_withdbg.cz12c_c32r128
5964	83986	0	0.0	725.6	17.6	0.000	0.000	0.122	3.020	491189	39.9	5.848	152	22.3	123.1	24.0	0.007	7039	6927	ma120300_rel_withdbg.cz12b_sync_c32r128
5960	83615	0	0.0	566.5	17.2	0.000	0.000	0.095	2.955	487242	39.9	5.827	153	26.2	128.6	29.1	0.008	6975	6879	ma120300_rel_withdbg.cz12c_sync_c32r128
qr1000.L5
qr1000.L5: range queries with 1000 insert/s per client
Performance metrics for all DBMS, not just the ones listed above. Some are normalized by throughput, others are not. Legend for results is here.
ips	qps	rps	rmbps	wps	wmbps	rpq	rkbpq	wpi	wkbpi	csps	cpups	cspq	cpupq	dbgb1	dbgb2	rss	maxop	p50	p99	tag
11920	90148	0	0.0	880.8	31.5	0.000	0.000	0.074	2.709	522482	41.0	5.796	146	27.1	129.2	30.2	0.019	7583	7455	ma120300_rel_withdbg.cz12b_c32r128
11927	88329	0	0.0	1215.1	41.6	0.000	0.000	0.102	3.575	512802	41.8	5.806	151	27.1	129.8	30.2	0.170	7374	7231	ma120300_rel_withdbg.cz12c_c32r128
11927	88403	0	0.0	1460.4	35.4	0.000	0.000	0.122	3.036	515193	41.8	5.828	151	22.3	123.1	24.0	0.074	7407	7231	ma120300_rel_withdbg.cz12b_sync_c32r128
11927	88449	0	0.0	1434.5	42.1	0.000	0.000	0.120	3.616	513610	41.8	5.807	151	26.2	128.6	29.1	0.117	7407	7263	ma120300_rel_withdbg.cz12c_sync_c32r128
qp1000.L6
qp1000.L6: point queries with 1000 insert/s per client
Performance metrics for all DBMS, not just the ones listed above. Some are normalized by throughput, others are not. Legend for results is here.
ips	qps	rps	rmbps	wps	wmbps	rpq	rkbpq	wpi	wkbpi	csps	cpups	cspq	cpupq	dbgb1	dbgb2	rss	maxop	p50	p99	tag
11920	83528	0	0.0	886.3	31.6	0.000	0.000	0.074	2.716	489414	41.0	5.859	157	27.1	129.2	30.2	0.008	7007	6879	ma120300_rel_withdbg.cz12b_c32r128
11927	82742	0	0.0	945.9	34.6	0.000	0.000	0.079	2.974	485292	41.2	5.865	159	27.1	129.8	30.2	0.032	6943	6831	ma120300_rel_withdbg.cz12c_c32r128
11927	82451	0	0.0	1420.4	35.2	0.000	0.000	0.119	3.021	487149	41.5	5.908	161	22.3	123.1	24.0	0.035	6895	6783	ma120300_rel_withdbg.cz12b_sync_c32r128
11927	82584	0	0.0	1160.6	35.3	0.000	0.000	0.097	3.030	484289	41.7	5.864	162	26.2	128.6	29.1	0.017	6927	6815	ma120300_rel_withdbg.cz12c_sync_c32r128
l.i0
- l.i0: load without secondary indexes
- Legend for results is here.
- Each entry lists the percentage of responses that fit in that bucket (slower than max time for previous bucket, faster than min time for next bucket).
Insert response time histogram
256us	1ms	4ms	16ms	64ms	256ms	1s	4s	16s	gt	max	tag
0.000	97.491	2.429	0.026	0.005	0.048	0.001	0.000	0.000	0.000	0.257	ma120300_rel_withdbg.cz12b_c32r128
0.000	97.809	2.106	0.073	0.009	0.003	0.000	0.000	0.000	0.000	0.248	ma120300_rel_withdbg.cz12c_c32r128
0.000	0.000	0.285	99.664	0.050	0.001	0.000	0.000	0.000	0.000	0.242	ma120300_rel_withdbg.cz12b_sync_c32r128
0.000	0.000	98.445	1.552	0.001	0.002	0.000	0.000	0.000	0.000	0.215	ma120300_rel_withdbg.cz12c_sync_c32r128
l.x
- l.x: create secondary indexes
- Legend for results is here.
- Each entry lists the percentage of responses that fit in that bucket (slower than max time for previous bucket, faster than min time for next bucket).
TODO - determine whether there is data for create index response time
l.i1
- l.i1: continue load after secondary indexes created with 50 inserts per transaction
- Legend for results is here.
- Each entry lists the percentage of responses that fit in that bucket (slower than max time for previous bucket, faster than min time for next bucket).
Insert response time histogram
256us	1ms	4ms	16ms	64ms	256ms	1s	4s	16s	gt	max	tag
0.000	0.188	95.320	2.380	1.440	0.513	0.158	0.001	0.000	0.000	2.863	ma120300_rel_withdbg.cz12b_c32r128
0.000	0.299	95.446	2.172	1.360	0.508	0.214	nonzero	0.000	0.000	2.029	ma120300_rel_withdbg.cz12c_c32r128
0.000	0.000	0.007	94.710	5.264	0.017	0.002	0.000	0.000	0.000	0.661	ma120300_rel_withdbg.cz12b_sync_c32r128
0.000	0.000	84.740	14.809	0.446	0.005	0.000	0.000	0.000	0.000	0.239	ma120300_rel_withdbg.cz12c_sync_c32r128
Delete response time histogram
256us	1ms	4ms	16ms	64ms	256ms	1s	4s	16s	gt	max	tag
0.000	1.679	94.154	2.119	1.401	0.500	0.146	0.001	0.000	0.000	2.986	ma120300_rel_withdbg.cz12b_c32r128
0.000	1.809	94.232	1.930	1.327	0.496	0.206	nonzero	0.000	0.000	2.029	ma120300_rel_withdbg.cz12c_c32r128
0.000	0.000	0.063	95.126	4.795	0.014	0.002	0.000	0.000	0.000	0.874	ma120300_rel_withdbg.cz12b_sync_c32r128
0.000	0.000	88.063	11.552	0.381	0.004	0.000	0.000	0.000	0.000	0.239	ma120300_rel_withdbg.cz12c_sync_c32r128
l.i2
- l.i2: continue load after secondary indexes created with 5 inserts per transaction
- Legend for results is here.
- Each entry lists the percentage of responses that fit in that bucket (slower than max time for previous bucket, faster than min time for next bucket).
Insert response time histogram
256us	1ms	4ms	16ms	64ms	256ms	1s	4s	16s	gt	max	tag
6.812	91.264	1.306	0.245	0.353	0.021	0.001	0.000	0.000	0.000	0.607	ma120300_rel_withdbg.cz12b_c32r128
13.123	84.711	1.472	0.229	0.442	0.023	nonzero	0.000	0.000	0.000	0.295	ma120300_rel_withdbg.cz12c_c32r128
0.000	0.000	0.224	99.015	0.757	0.004	0.000	0.000	0.000	0.000	0.169	ma120300_rel_withdbg.cz12b_sync_c32r128
0.000	1.137	98.031	0.822	0.010	0.000	0.000	0.000	0.000	0.000	0.056	ma120300_rel_withdbg.cz12c_sync_c32r128
Delete response time histogram
256us	1ms	4ms	16ms	64ms	256ms	1s	4s	16s	gt	max	tag
6.522	91.568	1.313	0.231	0.347	0.018	0.001	0.000	0.000	0.000	0.607	ma120300_rel_withdbg.cz12b_c32r128
12.638	85.173	1.516	0.218	0.436	0.019	nonzero	0.000	0.000	0.000	0.306	ma120300_rel_withdbg.cz12c_c32r128
0.000	0.000	0.163	99.072	0.761	0.004	0.000	0.000	0.000	0.000	0.169	ma120300_rel_withdbg.cz12b_sync_c32r128
0.000	1.086	98.101	0.804	0.009	0.000	0.000	0.000	0.000	0.000	0.056	ma120300_rel_withdbg.cz12c_sync_c32r128
qr100.L1
- qr100.L1: range queries with 100 insert/s per client
- Legend for results is here.
- Each entry lists the percentage of responses that fit in that bucket (slower than max time for previous bucket, faster than min time for next bucket).
Query response time histogram
256us	1ms	4ms	16ms	64ms	256ms	1s	4s	16s	gt	max	tag
99.994	0.006	nonzero	0.000	0.000	0.000	0.000	0.000	0.000	0.000	0.002	ma120300_rel_withdbg.cz12b_c32r128
99.993	0.007	nonzero	0.000	0.000	0.000	0.000	0.000	0.000	0.000	0.002	ma120300_rel_withdbg.cz12c_c32r128
99.993	0.007	nonzero	0.000	0.000	0.000	0.000	0.000	0.000	0.000	0.004	ma120300_rel_withdbg.cz12b_sync_c32r128
99.993	0.007	nonzero	0.000	0.000	0.000	0.000	0.000	0.000	0.000	0.003	ma120300_rel_withdbg.cz12c_sync_c32r128
Insert response time histogram
256us	1ms	4ms	16ms	64ms	256ms	1s	4s	16s	gt	max	tag
0.000	2.245	97.444	0.310	0.000	0.000	0.000	0.000	0.000	0.000	0.013	ma120300_rel_withdbg.cz12b_c32r128
0.000	3.324	96.674	0.002	0.000	0.000	0.000	0.000	0.000	0.000	0.005	ma120300_rel_withdbg.cz12c_c32r128
0.000	0.000	0.134	99.769	0.083	0.014	0.000	0.000	0.000	0.000	0.074	ma120300_rel_withdbg.cz12b_sync_c32r128
0.000	0.000	94.012	5.743	0.245	0.000	0.000	0.000	0.000	0.000	0.059	ma120300_rel_withdbg.cz12c_sync_c32r128
Delete response time histogram
256us	1ms	4ms	16ms	64ms	256ms	1s	4s	16s	gt	max	tag
0.000	37.347	62.438	0.215	0.000	0.000	0.000	0.000	0.000	0.000	0.013	ma120300_rel_withdbg.cz12b_c32r128
0.000	43.542	56.456	0.002	0.000	0.000	0.000	0.000	0.000	0.000	0.005	ma120300_rel_withdbg.cz12c_c32r128
0.000	0.000	0.692	99.218	0.076	0.014	0.000	0.000	0.000	0.000	0.076	ma120300_rel_withdbg.cz12b_sync_c32r128
0.000	0.000	95.178	4.583	0.238	0.000	0.000	0.000	0.000	0.000	0.057	ma120300_rel_withdbg.cz12c_sync_c32r128
qp100.L2
- qp100.L2: point queries with 100 insert/s per client
- Legend for results is here.
- Each entry lists the percentage of responses that fit in that bucket (slower than max time for previous bucket, faster than min time for next bucket).
Query response time histogram
256us	1ms	4ms	16ms	64ms	256ms	1s	4s	16s	gt	max	tag
99.993	0.007	nonzero	0.000	0.000	0.000	0.000	0.000	0.000	0.000	0.003	ma120300_rel_withdbg.cz12b_c32r128
99.992	0.008	nonzero	0.000	0.000	0.000	0.000	0.000	0.000	0.000	0.002	ma120300_rel_withdbg.cz12c_c32r128
99.991	0.009	nonzero	0.000	0.000	0.000	0.000	0.000	0.000	0.000	0.001	ma120300_rel_withdbg.cz12b_sync_c32r128
99.990	0.010	nonzero	0.000	0.000	0.000	0.000	0.000	0.000	0.000	0.003	ma120300_rel_withdbg.cz12c_sync_c32r128
Insert response time histogram
256us	1ms	4ms	16ms	64ms	256ms	1s	4s	16s	gt	max	tag
0.000	2.125	97.391	0.484	0.000	0.000	0.000	0.000	0.000	0.000	0.012	ma120300_rel_withdbg.cz12b_c32r128
0.000	1.935	98.065	0.000	0.000	0.000	0.000	0.000	0.000	0.000	0.002	ma120300_rel_withdbg.cz12c_c32r128
0.000	0.000	4.380	95.551	0.067	0.002	0.000	0.000	0.000	0.000	0.065	ma120300_rel_withdbg.cz12b_sync_c32r128
0.000	0.000	92.002	7.359	0.639	0.000	0.000	0.000	0.000	0.000	0.059	ma120300_rel_withdbg.cz12c_sync_c32r128
Delete response time histogram
256us	1ms	4ms	16ms	64ms	256ms	1s	4s	16s	gt	max	tag
0.000	46.245	53.440	0.315	0.000	0.000	0.000	0.000	0.000	0.000	0.009	ma120300_rel_withdbg.cz12b_c32r128
0.000	44.072	55.928	0.000	0.000	0.000	0.000	0.000	0.000	0.000	0.002	ma120300_rel_withdbg.cz12c_c32r128
0.000	0.000	7.667	92.264	0.067	0.002	0.000	0.000	0.000	0.000	0.064	ma120300_rel_withdbg.cz12b_sync_c32r128
0.000	0.000	92.734	6.646	0.620	0.000	0.000	0.000	0.000	0.000	0.059	ma120300_rel_withdbg.cz12c_sync_c32r128
qr500.L3
- qr500.L3: range queries with 500 insert/s per client
- Legend for results is here.
- Each entry lists the percentage of responses that fit in that bucket (slower than max time for previous bucket, faster than min time for next bucket).
Query response time histogram
256us	1ms	4ms	16ms	64ms	256ms	1s	4s	16s	gt	max	tag
99.987	0.013	nonzero	nonzero	0.000	0.000	0.000	0.000	0.000	0.000	0.012	ma120300_rel_withdbg.cz12b_c32r128
99.981	0.018	0.001	nonzero	nonzero	0.000	0.000	0.000	0.000	0.000	0.019	ma120300_rel_withdbg.cz12c_c32r128
99.977	0.023	nonzero	nonzero	nonzero	0.000	0.000	0.000	0.000	0.000	0.027	ma120300_rel_withdbg.cz12b_sync_c32r128
99.980	0.020	nonzero	nonzero	0.000	0.000	0.000	0.000	0.000	0.000	0.011	ma120300_rel_withdbg.cz12c_sync_c32r128
Insert response time histogram
256us	1ms	4ms	16ms	64ms	256ms	1s	4s	16s	gt	max	tag
0.000	1.301	98.425	0.273	0.002	0.000	0.000	0.000	0.000	0.000	0.021	ma120300_rel_withdbg.cz12b_c32r128
0.000	0.676	99.100	0.219	0.006	0.000	0.000	0.000	0.000	0.000	0.041	ma120300_rel_withdbg.cz12c_c32r128
0.000	0.000	0.599	98.896	0.506	0.000	0.000	0.000	0.000	0.000	0.054	ma120300_rel_withdbg.cz12b_sync_c32r128
0.000	0.000	95.250	4.047	0.697	0.006	0.000	0.000	0.000	0.000	0.074	ma120300_rel_withdbg.cz12c_sync_c32r128
Delete response time histogram
256us	1ms	4ms	16ms	64ms	256ms	1s	4s	16s	gt	max	tag
0.000	32.373	67.457	0.168	0.002	0.000	0.000	0.000	0.000	0.000	0.017	ma120300_rel_withdbg.cz12b_c32r128
0.000	13.124	86.725	0.150	0.001	0.000	0.000	0.000	0.000	0.000	0.025	ma120300_rel_withdbg.cz12c_c32r128
0.000	0.000	0.783	98.745	0.472	0.000	0.000	0.000	0.000	0.000	0.058	ma120300_rel_withdbg.cz12b_sync_c32r128
0.000	0.000	95.558	3.772	0.665	0.005	0.000	0.000	0.000	0.000	0.073	ma120300_rel_withdbg.cz12c_sync_c32r128
qp500.L4
- qp500.L4: point queries with 500 insert/s per client
- Legend for results is here.
- Each entry lists the percentage of responses that fit in that bucket (slower than max time for previous bucket, faster than min time for next bucket).
Query response time histogram
256us	1ms	4ms	16ms	64ms	256ms	1s	4s	16s	gt	max	tag
99.982	0.018	nonzero	0.000	0.000	0.000	0.000	0.000	0.000	0.000	0.003	ma120300_rel_withdbg.cz12b_c32r128
99.984	0.016	nonzero	0.000	0.000	0.000	0.000	0.000	0.000	0.000	0.002	ma120300_rel_withdbg.cz12c_c32r128
99.970	0.029	nonzero	nonzero	0.000	0.000	0.000	0.000	0.000	0.000	0.007	ma120300_rel_withdbg.cz12b_sync_c32r128
99.976	0.024	nonzero	nonzero	0.000	0.000	0.000	0.000	0.000	0.000	0.008	ma120300_rel_withdbg.cz12c_sync_c32r128
Insert response time histogram
256us	1ms	4ms	16ms	64ms	256ms	1s	4s	16s	gt	max	tag
0.000	1.026	98.683	0.288	0.003	0.000	0.000	0.000	0.000	0.000	0.019	ma120300_rel_withdbg.cz12b_c32r128
0.000	0.963	98.789	0.243	0.005	0.000	0.000	0.000	0.000	0.000	0.027	ma120300_rel_withdbg.cz12c_c32r128
0.000	0.000	0.429	98.972	0.599	0.000	0.000	0.000	0.000	0.000	0.062	ma120300_rel_withdbg.cz12b_sync_c32r128
0.000	0.000	93.888	5.132	0.957	0.023	0.000	0.000	0.000	0.000	0.098	ma120300_rel_withdbg.cz12c_sync_c32r128
Delete response time histogram
256us	1ms	4ms	16ms	64ms	256ms	1s	4s	16s	gt	max	tag
0.000	15.088	84.741	0.169	0.003	0.000	0.000	0.000	0.000	0.000	0.020	ma120300_rel_withdbg.cz12b_c32r128
0.000	31.263	68.611	0.125	0.001	0.000	0.000	0.000	0.000	0.000	0.024	ma120300_rel_withdbg.cz12c_c32r128
0.000	0.000	0.421	99.031	0.549	0.000	0.000	0.000	0.000	0.000	0.062	ma120300_rel_withdbg.cz12b_sync_c32r128
0.000	0.000	94.339	4.715	0.926	0.019	0.000	0.000	0.000	0.000	0.079	ma120300_rel_withdbg.cz12c_sync_c32r128
qr1000.L5
- qr1000.L5: range queries with 1000 insert/s per client
- Legend for results is here.
- Each entry lists the percentage of responses that fit in that bucket (slower than max time for previous bucket, faster than min time for next bucket).
Query response time histogram
256us	1ms	4ms	16ms	64ms	256ms	1s	4s	16s	gt	max	tag
99.966	0.033	0.001	nonzero	nonzero	0.000	0.000	0.000	0.000	0.000	0.019	ma120300_rel_withdbg.cz12b_c32r128
99.962	0.037	0.001	0.001	nonzero	nonzero	0.000	0.000	0.000	0.000	0.170	ma120300_rel_withdbg.cz12c_c32r128
99.942	0.057	0.001	nonzero	nonzero	nonzero	0.000	0.000	0.000	0.000	0.074	ma120300_rel_withdbg.cz12b_sync_c32r128
99.948	0.051	0.001	0.001	nonzero	nonzero	0.000	0.000	0.000	0.000	0.117	ma120300_rel_withdbg.cz12c_sync_c32r128
Insert response time histogram
256us	1ms	4ms	16ms	64ms	256ms	1s	4s	16s	gt	max	tag
0.000	0.706	98.542	0.735	0.016	0.000	0.000	0.000	0.000	0.000	0.036	ma120300_rel_withdbg.cz12b_c32r128
0.000	0.908	98.158	0.908	0.021	0.005	0.000	0.000	0.000	0.000	0.172	ma120300_rel_withdbg.cz12c_c32r128
0.000	0.000	0.395	98.513	1.085	0.007	0.000	0.000	0.000	0.000	0.097	ma120300_rel_withdbg.cz12b_sync_c32r128
0.000	0.000	95.317	3.763	0.915	0.005	0.000	0.000	0.000	0.000	0.134	ma120300_rel_withdbg.cz12c_sync_c32r128
Delete response time histogram
256us	1ms	4ms	16ms	64ms	256ms	1s	4s	16s	gt	max	tag
0.000	8.014	91.385	0.588	0.013	0.000	0.000	0.000	0.000	0.000	0.040	ma120300_rel_withdbg.cz12b_c32r128
0.000	10.215	89.104	0.667	0.010	0.003	0.000	0.000	0.000	0.000	0.172	ma120300_rel_withdbg.cz12c_c32r128
0.000	0.000	0.387	98.653	0.955	0.005	0.000	0.000	0.000	0.000	0.092	ma120300_rel_withdbg.cz12b_sync_c32r128
0.000	0.000	95.969	3.151	0.875	0.005	0.000	0.000	0.000	0.000	0.134	ma120300_rel_withdbg.cz12c_sync_c32r128
qp1000.L6
- qp1000.L6: point queries with 1000 insert/s per client
- Legend for results is here.
- Each entry lists the percentage of responses that fit in that bucket (slower than max time for previous bucket, faster than min time for next bucket).
Query response time histogram
256us	1ms	4ms	16ms	64ms	256ms	1s	4s	16s	gt	max	tag
99.959	0.041	0.001	nonzero	0.000	0.000	0.000	0.000	0.000	0.000	0.008	ma120300_rel_withdbg.cz12b_c32r128
99.957	0.042	nonzero	nonzero	nonzero	0.000	0.000	0.000	0.000	0.000	0.032	ma120300_rel_withdbg.cz12c_c32r128
99.926	0.073	0.001	nonzero	nonzero	0.000	0.000	0.000	0.000	0.000	0.035	ma120300_rel_withdbg.cz12b_sync_c32r128
99.939	0.060	0.001	nonzero	nonzero	0.000	0.000	0.000	0.000	0.000	0.017	ma120300_rel_withdbg.cz12c_sync_c32r128
Insert response time histogram
256us	1ms	4ms	16ms	64ms	256ms	1s	4s	16s	gt	max	tag
0.000	0.499	98.241	1.239	0.019	0.003	0.000	0.000	0.000	0.000	0.081	ma120300_rel_withdbg.cz12b_c32r128
0.000	1.028	98.127	0.825	0.019	nonzero	0.000	0.000	0.000	0.000	0.070	ma120300_rel_withdbg.cz12c_c32r128
0.000	0.000	0.183	98.629	1.184	0.005	0.000	0.000	0.000	0.000	0.099	ma120300_rel_withdbg.cz12b_sync_c32r128
0.000	0.000	93.481	5.230	1.273	0.015	0.000	0.000	0.000	0.000	0.182	ma120300_rel_withdbg.cz12c_sync_c32r128
Delete response time histogram
256us	1ms	4ms	16ms	64ms	256ms	1s	4s	16s	gt	max	tag
0.000	3.125	95.797	1.059	0.016	0.003	0.000	0.000	0.000	0.000	0.080	ma120300_rel_withdbg.cz12b_c32r128
0.000	8.471	90.895	0.621	0.013	nonzero	0.000	0.000	0.000	0.000	0.064	ma120300_rel_withdbg.cz12c_c32r128
0.000	0.000	0.200	98.790	1.007	0.004	0.000	0.000	0.000	0.000	0.099	ma120300_rel_withdbg.cz12b_sync_c32r128
0.000	0.000	94.200	4.554	1.235	0.011	0.000	0.000	0.000	0.000	0.218	ma120300_rel_withdbg.cz12c_sync_c32r128