Introduction
This is a report for the insert benchmark with 3600M docs and 12 client(s). It is generated by scripts (bash, awk, sed) and Tufte might not be impressed. An overview of the insert benchmark is here and a short update is here. Below, by DBMS, I mean DBMS+version.config. An example is my8020.c10b40 where my means MySQL, 8020 is version 8.0.20 and c10b40 is the name for the configuration file.
The test server has 32 cores, 128G RAM and 1 NVMe device. The benchmark was run with 12 clients and there were 1 or 3 connections per client (1 for queries or inserts without rate limits, 1+1 for rate limited inserts+deletes). It uses 8 tables with a table per client. It loads 300M rows per table without secondary indexes, creates 3 secondary indexes per table, then inserts 4m+1m rows per table with a delete per insert to avoid growing the table. It then does 6 read+write tests for 1800s each that do queries as fast as possible with 100,100,500,500,1000,1000 inserts/s and the same for deletes/s per client concurrent with the queries. The database is larger than RAM and most tests are IO-bound except for the range query (qr*) tests that frequently have a cached working set. Clients and the DBMS share one server.
The tested DBMS are:
- ma120300_rel_withdbg.cz12b_c32r128 - MariaDB 12.3.0 with the z12b config, my standard config
- ma120300_rel_withdbg.cz12c_c32r128 - MariaDB 12.3.0 with the z12c config that uses the binlog storage engine
- ma120300_rel_withdbg.cz12b_sync_c32r128 - MariaDB 12.3.0 with the z12b_config that adds sync_binlog=1 and innodb_flush_log_at_trx_commit=1 to z12b
- ma120300_rel_withdbg.cz12c_sync_c32r128 - MariaDB 12.3.0 with the z12c_config that adds innodb_flush_log_at_trx_commit=1 to z12c
Contents
- Summary
- l.i0: load without secondary indexes
- l.x: create secondary indexes
- l.i1: continue load after secondary indexes created with 50 inserts per transaction
- l.i2: continue load after secondary indexes created with 5 inserts per transaction
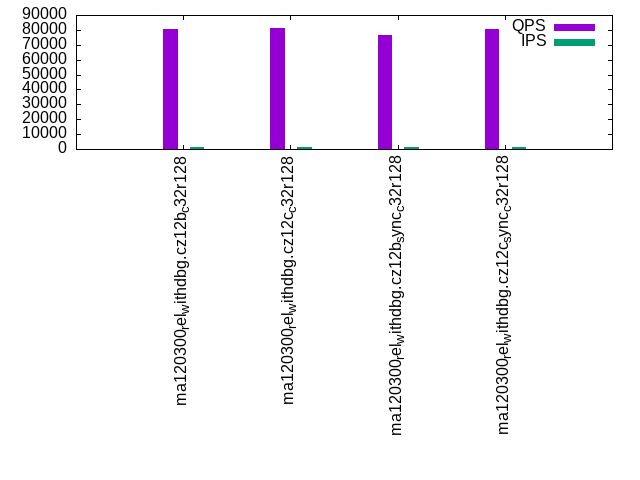
- qr100.L1: range queries with 100 insert/s per client
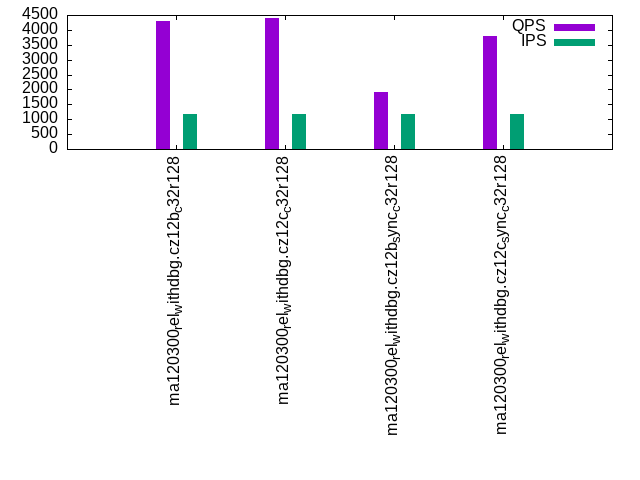
- qp100.L2: point queries with 100 insert/s per client
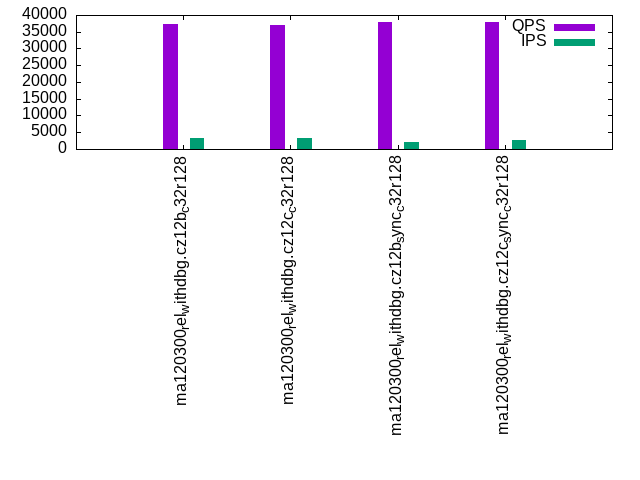
- qr500.L3: range queries with 500 insert/s per client
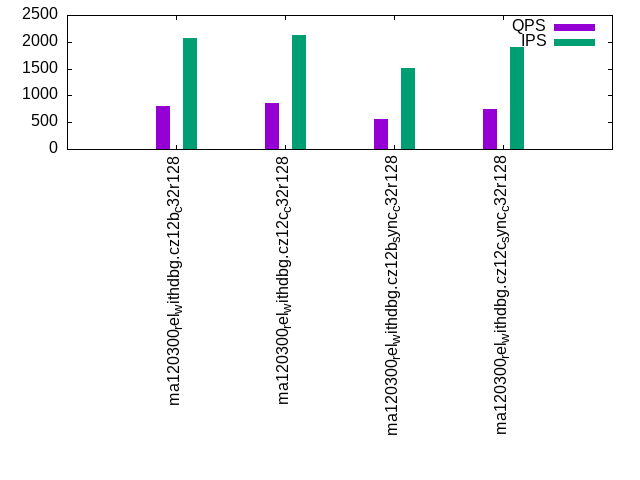
- qp500.L4: point queries with 500 insert/s per client
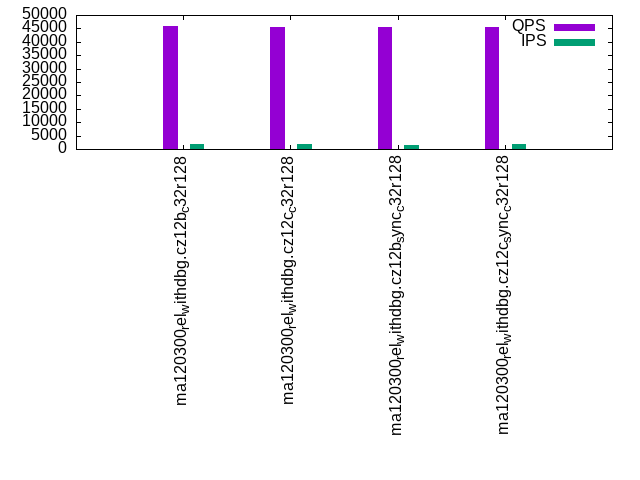
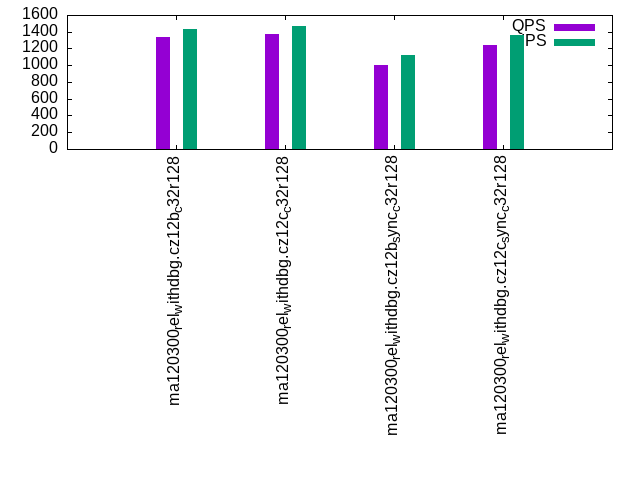
- qr1000.L5: range queries with 1000 insert/s per client
- qp1000.L6: point queries with 1000 insert/s per client
Summary
The numbers are inserts/s for l.i0, l.i1 and l.i2, indexed docs (or rows) /s for l.x and queries/s for qr100, qp100 thru qr1000, qp1000" The values are the average rate over the entire test for inserts (IPS) and queries (QPS). The range of values for IPS and QPS is split into 3 parts: bottom 25%, middle 50%, top 25%. Values in the bottom 25% have a red background, values in the top 25% have a green background and values in the middle have no color. A gray background is used for values that can be ignored because the DBMS did not sustain the target insert rate. Red backgrounds are not used when the minimum value is within 80% of the max value.
| dbms | l.i0 | l.x | l.i1 | l.i2 | qr100 | qp100 | qr500 | qp500 | qr1000 | qp1000 |
|---|---|---|---|---|---|---|---|---|---|---|
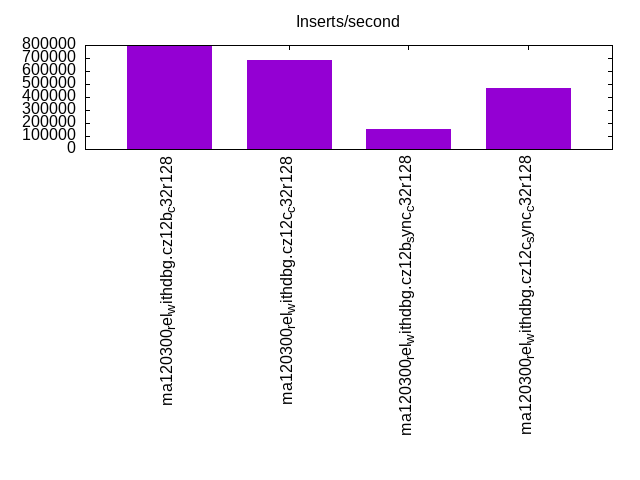
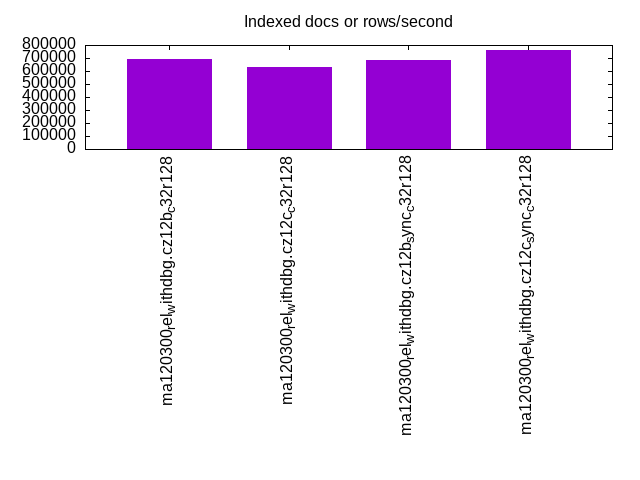
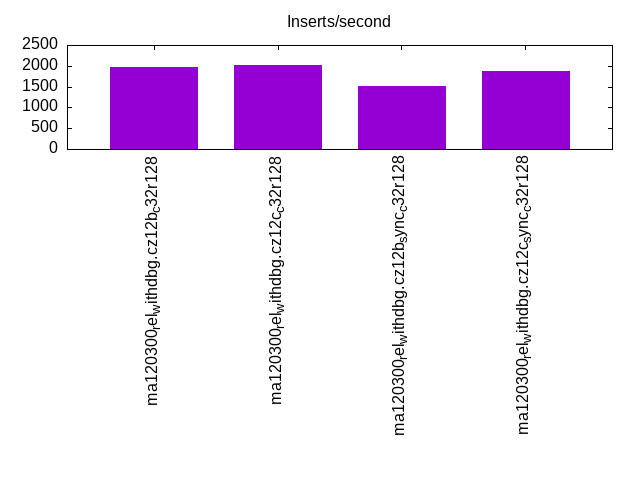
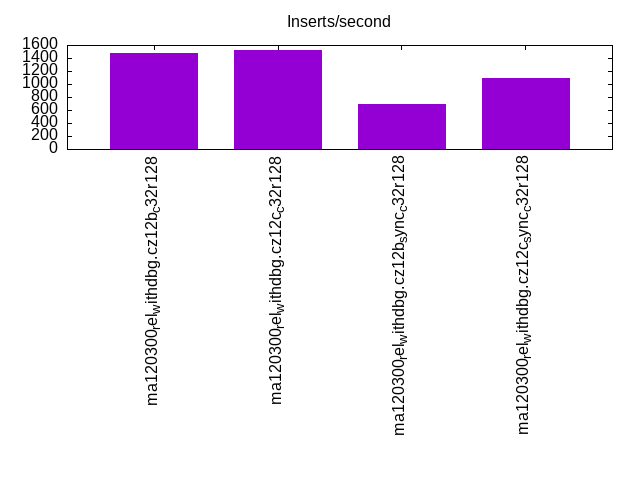
| ma120300_rel_withdbg.cz12b_c32r128 | 799112 | 693374 | 1976 | 1472 | 80838 | 4300 | 37317 | 807 | 45713 | 1332 |
| ma120300_rel_withdbg.cz12c_c32r128 | 684671 | 633245 | 2011 | 1530 | 81223 | 4384 | 36975 | 858 | 45619 | 1370 |
| ma120300_rel_withdbg.cz12b_sync_c32r128 | 153022 | 684671 | 1522 | 685 | 76784 | 1899 | 37954 | 564 | 45510 | 1003 |
| ma120300_rel_withdbg.cz12c_sync_c32r128 | 471081 | 764169 | 1864 | 1095 | 80859 | 3788 | 37825 | 738 | 45628 | 1242 |
This table has relative throughput, throughput for the DBMS relative to the DBMS in the first line, using the absolute throughput from the previous table. Values less than 0.95 have a yellow background. Values greater than 1.05 have a blue background.
| dbms | l.i0 | l.x | l.i1 | l.i2 | qr100 | qp100 | qr500 | qp500 | qr1000 | qp1000 |
|---|---|---|---|---|---|---|---|---|---|---|
| ma120300_rel_withdbg.cz12b_c32r128 | 1.00 | 1.00 | 1.00 | 1.00 | 1.00 | 1.00 | 1.00 | 1.00 | 1.00 | 1.00 |
| ma120300_rel_withdbg.cz12c_c32r128 | 0.86 | 0.91 | 1.02 | 1.04 | 1.00 | 1.02 | 0.99 | 1.06 | 1.00 | 1.03 |
| ma120300_rel_withdbg.cz12b_sync_c32r128 | 0.19 | 0.99 | 0.77 | 0.47 | 0.95 | 0.44 | 1.02 | 0.70 | 1.00 | 0.75 |
| ma120300_rel_withdbg.cz12c_sync_c32r128 | 0.59 | 1.10 | 0.94 | 0.74 | 1.00 | 0.88 | 1.01 | 0.91 | 1.00 | 0.93 |
This lists the average rate of inserts/s for the tests that do inserts concurrent with queries. For such tests the query rate is listed in the table above. The read+write tests are setup so that the insert rate should match the target rate every second. Cells that are not at least 95% of the target have a red background to indicate a failure to satisfy the target.
| dbms | qr100.L1 | qp100.L2 | qr500.L3 | qp500.L4 | qr1000.L5 | qp1000.L6 |
|---|---|---|---|---|---|---|
| ma120300_rel_withdbg.cz12b_c32r128 | 1192 | 1191 | 3161 | 2062 | 1969 | 1432 |
| ma120300_rel_withdbg.cz12c_c32r128 | 1193 | 1191 | 3263 | 2118 | 2019 | 1465 |
| ma120300_rel_withdbg.cz12b_sync_c32r128 | 1193 | 1185 | 2005 | 1505 | 1461 | 1121 |
| ma120300_rel_withdbg.cz12c_sync_c32r128 | 1193 | 1192 | 2802 | 1910 | 1852 | 1362 |
| target | 1200 | 1200 | 6000 | 6000 | 12000 | 12000 |
l.i0
l.i0: load without secondary indexes. Graphs for performance per 1-second interval are here.
Average throughput:
Insert response time histogram: each cell has the percentage of responses that take <= the time in the header and max is the max response time in seconds. For the max column values in the top 25% of the range have a red background and in the bottom 25% of the range have a green background. The red background is not used when the min value is within 80% of the max value.
| dbms | 256us | 1ms | 4ms | 16ms | 64ms | 256ms | 1s | 4s | 16s | gt | max |
|---|---|---|---|---|---|---|---|---|---|---|---|
| ma120300_rel_withdbg.cz12b_c32r128 | 74.954 | 24.756 | 0.093 | 0.095 | 0.075 | 0.018 | 0.008 | nonzero | 4.496 | ||
| ma120300_rel_withdbg.cz12c_c32r128 | 56.867 | 42.836 | 0.084 | 0.087 | 0.060 | 0.050 | 0.015 | nonzero | 7.927 | ||
| ma120300_rel_withdbg.cz12b_sync_c32r128 | 0.070 | 98.002 | 1.739 | 0.190 | nonzero | 0.353 | |||||
| ma120300_rel_withdbg.cz12c_sync_c32r128 | 98.272 | 0.860 | 0.827 | 0.040 | nonzero | nonzero | 1.047 |
Performance metrics for the DBMS listed above. Some are normalized by throughput, others are not. Legend for results is here.
ips	qps	rps	rmbps	wps	wmbps	rpq	rkbpq	wpi	wkbpi	csps	cpups	cspq	cpupq	dbgb1	dbgb2	rss	maxop	p50	p99	tag
799112	0	1	0.0	4140.1	204.1	0.000	0.000	0.005	0.262	189064	37.7	0.237	15	236.8	337.6	101.3	4.496	67892	0	ma120300_rel_withdbg.cz12b_c32r128
684671	0	1	0.0	4463.4	254.0	0.000	0.000	0.007	0.380	207318	34.8	0.303	16	236.8	338.2	101.4	7.927	61592	0	ma120300_rel_withdbg.cz12c_c32r128
153022	0	0	0.0	3842.6	62.5	0.000	0.000	0.025	0.418	46329	7.8	0.303	16	236.8	337.6	101.2	0.353	12898	1899	ma120300_rel_withdbg.cz12b_sync_c32r128
471081	0	1	0.0	5097.0	184.7	0.000	0.000	0.011	0.402	88894	23.3	0.189	16	236.8	338.1	101.2	1.047	46194	6897	ma120300_rel_withdbg.cz12c_sync_c32r128
Average values from iostat.
r/s	rkB/s	rrqm/s	%rrqm	r_await	rareq-s	w/s	wkB/s	wrqm/s	%wrqm	w_await	wareq-s	d/s	dkB/s	drqm/s	%drqm	d_await	dareq-s	f/s	f_await	aqu-sz	%util
0.975	7.663	0.000	0.000	31.27	3.813	4140.1	209008	159.6	3.896	75.93	54.13	2.902	39.40	0.000	0.000	14.58	15.87	78.23	5.228	201.1	42.97		ma120300_rel_withdbg.cz12b_c32r128
1.215	8.413	0.000	0.000	14.08	4.665	4463.4	260063	138.3	3.014	87.43	60.00	1.212	788.3	0.000	0.000	21.72	768.7	53.45	15.05	211.6	55.13		ma120300_rel_withdbg.cz12c_c32r128
0.257	1.703	0.001	0.016	0.310	3.147	3842.6	63970.6	3538.3	48.02	0.771	16.62	23.12	2771.0	0.000	0.000	0.682	42.15	1265.2	0.675	2.892	97.20		ma120300_rel_withdbg.cz12b_sync_c32r128
0.725	5.017	0.000	0.000	0.366	4.182	5097.0	189150	558.4	7.216	3.053	37.79	1.485	162.5	0.000	0.000	2.589	129.3	1102.2	0.821	8.888	74.23		ma120300_rel_withdbg.cz12c_sync_c32r128
l.x
l.x: create secondary indexes.
Average throughput:
Performance metrics for the DBMS listed above. Some are normalized by throughput, others are not. Legend for results is here.
ips	qps	rps	rmbps	wps	wmbps	rpq	rkbpq	wpi	wkbpi	csps	cpups	cspq	cpupq	dbgb1	dbgb2	rss	maxop	p50	p99	tag
693374	0	7793	642.3	8636.8	720.3	0.011	0.949	0.012	1.064	30824	17.6	0.044	8	501.7	602.5	101.5	0.005	NA	NA	ma120300_rel_withdbg.cz12b_c32r128
633245	0	7084	586.4	7607.7	653.2	0.011	0.948	0.012	1.056	27464	15.7	0.043	8	501.7	603.1	101.6	0.004	NA	NA	ma120300_rel_withdbg.cz12c_c32r128
684671	0	7664	634.5	7947.8	702.5	0.011	0.949	0.012	1.051	28172	16.8	0.041	8	501.7	602.5	101.5	1.339	NA	NA	ma120300_rel_withdbg.cz12b_sync_c32r128
764169	0	8596	711.8	8817.5	782.9	0.011	0.954	0.012	1.049	31038	19.2	0.041	8	501.7	603.0	101.5	0.116	NA	NA	ma120300_rel_withdbg.cz12c_sync_c32r128
Average values from iostat.
r/s	rkB/s	rrqm/s	%rrqm	r_await	rareq-s	w/s	wkB/s	wrqm/s	%wrqm	w_await	wareq-s	d/s	dkB/s	drqm/s	%drqm	d_await	dareq-s	f/s	f_await	aqu-sz	%util
7793.2	657682	0.000	0.000	4.193	103.6	8636.8	737599	190.3	2.073	48.25	93.43	6.839	57103.3	0.000	0.000	0.170	248.2	36.24	21.37	217.7	93.18		ma120300_rel_withdbg.cz12b_c32r128
7083.5	600440	0.000	0.000	2.263	109.6	7607.7	668894	162.8	1.969	55.96	99.19	5.881	54560.3	0.000	0.000	0.166	309.3	33.78	20.46	225.1	94.35		ma120300_rel_withdbg.cz12c_c32r128
7664.5	649718	0.000	0.000	4.945	109.1	7947.8	719319	167.0	2.134	64.47	99.63	6.951	56337.1	0.000	0.000	0.191	270.4	32.20	16.29	227.7	94.53		ma120300_rel_withdbg.cz12b_sync_c32r128
8596.0	728899	0.006	0.000	1.666	110.4	8817.5	801682	192.2	1.866	35.30	102.0	7.363	65506.6	0.000	0.000	0.077	142.8	37.80	17.44	184.3	94.12		ma120300_rel_withdbg.cz12c_sync_c32r128
l.i1
l.i1: continue load after secondary indexes created with 50 inserts per transaction. Graphs for performance per 1-second interval are here.
Average throughput:
Insert response time histogram: each cell has the percentage of responses that take <= the time in the header and max is the max response time in seconds. For the max column values in the top 25% of the range have a red background and in the bottom 25% of the range have a green background. The red background is not used when the min value is within 80% of the max value.
| dbms | 256us | 1ms | 4ms | 16ms | 64ms | 256ms | 1s | 4s | 16s | gt | max |
|---|---|---|---|---|---|---|---|---|---|---|---|
| ma120300_rel_withdbg.cz12b_c32r128 | 0.158 | 56.302 | 42.376 | 1.163 | 0.001 | 4.831 | |||||
| ma120300_rel_withdbg.cz12c_c32r128 | 0.153 | 56.062 | 43.120 | 0.662 | 0.003 | 5.514 | |||||
| ma120300_rel_withdbg.cz12b_sync_c32r128 | 0.022 | 15.585 | 81.178 | 3.204 | 0.012 | 6.908 | |||||
| ma120300_rel_withdbg.cz12c_sync_c32r128 | 0.018 | 47.091 | 51.759 | 1.129 | 0.004 | 5.789 |
Delete response time histogram: each cell has the percentage of responses that take <= the time in the header and max is the max response time in seconds. For the max column values in the top 25% of the range have a red background and in the bottom 25% of the range have a green background. The red background is not used when the min value is within 80% of the max value.
| dbms | 256us | 1ms | 4ms | 16ms | 64ms | 256ms | 1s | 4s | 16s | gt | max |
|---|---|---|---|---|---|---|---|---|---|---|---|
| ma120300_rel_withdbg.cz12b_c32r128 | 0.034 | 1.444 | 65.383 | 32.615 | 0.523 | 0.001 | 4.800 | ||||
| ma120300_rel_withdbg.cz12c_c32r128 | 0.029 | 1.329 | 65.817 | 32.574 | 0.249 | 0.003 | 5.442 | ||||
| ma120300_rel_withdbg.cz12b_sync_c32r128 | 0.758 | 53.447 | 44.432 | 1.352 | 0.010 | 6.855 | |||||
| ma120300_rel_withdbg.cz12c_sync_c32r128 | 0.001 | 1.334 | 63.899 | 34.355 | 0.409 | 0.002 | 4.839 |
Performance metrics for the DBMS listed above. Some are normalized by throughput, others are not. Legend for results is here.
ips	qps	rps	rmbps	wps	wmbps	rpq	rkbpq	wpi	wkbpi	csps	cpups	cspq	cpupq	dbgb1	dbgb2	rss	maxop	p50	p99	tag
1976	0	10507	164.2	10811.6	275.8	5.319	85.096	5.473	142.985	146003	4.4	73.907	713	648.6	751.0	101.3	4.831	150	50	ma120300_rel_withdbg.cz12b_c32r128
2011	0	10680	166.9	11002.3	280.8	5.311	84.975	5.471	142.981	147915	4.4	73.557	700	648.5	751.4	101.3	5.514	150	50	ma120300_rel_withdbg.cz12c_c32r128
1522	0	7972	124.6	8590.4	212.1	5.239	83.825	5.646	142.714	108292	3.5	71.170	736	645.8	748.2	101.3	6.908	150	0	ma120300_rel_withdbg.cz12b_sync_c32r128
1864	0	9858	154.0	10290.0	260.1	5.288	84.610	5.520	142.900	136776	4.1	73.378	704	647.3	750.2	100.3	5.789	150	50	ma120300_rel_withdbg.cz12c_sync_c32r128
Average values from iostat.
r/s	rkB/s	rrqm/s	%rrqm	r_await	rareq-s	w/s	wkB/s	wrqm/s	%wrqm	w_await	wareq-s	d/s	dkB/s	drqm/s	%drqm	d_await	dareq-s	f/s	f_await	aqu-sz	%util
10506.8	168108	0.000	0.000	0.865	16.00	10811.6	282467	570.7	4.727	0.620	26.16	0.016	1.429	0.000	0.000	0.390	6.622	815.0	1.032	13.26	97.45		ma120300_rel_withdbg.cz12b_c32r128
10679.7	170876	0.000	0.000	0.843	16.00	11002.3	287520	536.2	4.404	0.566	26.16	0.363	378.6	0.000	0.000	3.590	807.3	829.6	0.988	13.20	97.44		ma120300_rel_withdbg.cz12c_c32r128
7971.7	127548	0.000	0.000	1.348	16.00	8590.4	217154	685.2	7.203	1.384	25.28	0.006	0.075	0.000	0.000	0.163	0.367	780.0	1.735	19.78	98.65		ma120300_rel_withdbg.cz12b_sync_c32r128
9857.8	157714	0.000	0.000	1.081	16.00	10290.0	266366	519.4	4.428	1.022	25.92	0.253	184.9	0.000	0.000	2.654	419.8	836.6	1.234	17.97	97.85		ma120300_rel_withdbg.cz12c_sync_c32r128
l.i2
l.i2: continue load after secondary indexes created with 5 inserts per transaction. Graphs for performance per 1-second interval are here.
Average throughput:
Insert response time histogram: each cell has the percentage of responses that take <= the time in the header and max is the max response time in seconds. For the max column values in the top 25% of the range have a red background and in the bottom 25% of the range have a green background. The red background is not used when the min value is within 80% of the max value.
| dbms | 256us | 1ms | 4ms | 16ms | 64ms | 256ms | 1s | 4s | 16s | gt | max |
|---|---|---|---|---|---|---|---|---|---|---|---|
| ma120300_rel_withdbg.cz12b_c32r128 | 0.065 | 2.503 | 18.849 | 56.490 | 22.019 | 0.068 | 0.005 | nonzero | 4.505 | ||
| ma120300_rel_withdbg.cz12c_c32r128 | nonzero | 0.076 | 2.634 | 19.026 | 57.907 | 20.298 | 0.056 | 0.004 | nonzero | 4.305 | |
| ma120300_rel_withdbg.cz12b_sync_c32r128 | 0.006 | 44.333 | 54.961 | 0.699 | 0.001 | 1.587 | |||||
| ma120300_rel_withdbg.cz12c_sync_c32r128 | nonzero | 6.515 | 63.050 | 30.391 | 0.043 | 0.947 |
Delete response time histogram: each cell has the percentage of responses that take <= the time in the header and max is the max response time in seconds. For the max column values in the top 25% of the range have a red background and in the bottom 25% of the range have a green background. The red background is not used when the min value is within 80% of the max value.
| dbms | 256us | 1ms | 4ms | 16ms | 64ms | 256ms | 1s | 4s | 16s | gt | max |
|---|---|---|---|---|---|---|---|---|---|---|---|
| ma120300_rel_withdbg.cz12b_c32r128 | nonzero | 0.293 | 6.031 | 25.684 | 47.727 | 20.209 | 0.052 | 0.003 | 3.417 | ||
| ma120300_rel_withdbg.cz12c_c32r128 | nonzero | 0.330 | 6.280 | 25.834 | 48.942 | 18.571 | 0.039 | 0.003 | 3.920 | ||
| ma120300_rel_withdbg.cz12b_sync_c32r128 | 0.018 | 49.140 | 50.433 | 0.409 | 0.001 | 1.507 | |||||
| ma120300_rel_withdbg.cz12c_sync_c32r128 | 0.001 | 11.096 | 60.221 | 28.649 | 0.034 | 0.970 |
Performance metrics for the DBMS listed above. Some are normalized by throughput, others are not. Legend for results is here.
ips	qps	rps	rmbps	wps	wmbps	rpq	rkbpq	wpi	wkbpi	csps	cpups	cspq	cpupq	dbgb1	dbgb2	rss	maxop	p50	p99	tag
1472	0	11755	183.7	10859.0	281.7	7.988	127.806	7.379	195.984	139578	4.4	94.848	957	648.6	751.0	101.3	4.505	85	35	ma120300_rel_withdbg.cz12b_c32r128
1530	0	12235	191.2	11321.0	293.9	7.995	127.914	7.397	196.643	144978	4.6	94.732	962	648.5	751.4	101.3	4.305	90	40	ma120300_rel_withdbg.cz12c_c32r128
685	0	5529	86.4	5825.9	136.6	8.075	129.207	8.509	204.356	63720	2.3	93.062	1075	645.8	748.2	101.3	1.587	45	20	ma120300_rel_withdbg.cz12b_sync_c32r128
1095	0	8788	137.3	8554.4	212.8	8.024	128.383	7.811	198.984	102640	3.6	93.718	1052	647.3	750.2	100.3	0.947	65	30	ma120300_rel_withdbg.cz12c_sync_c32r128
Average values from iostat.
r/s	rkB/s	rrqm/s	%rrqm	r_await	rareq-s	w/s	wkB/s	wrqm/s	%wrqm	w_await	wareq-s	d/s	dkB/s	drqm/s	%drqm	d_await	dareq-s	f/s	f_await	aqu-sz	%util
11754.9	188079	0.000	0.000	0.786	16.00	10859.0	288411	34.86	0.323	0.489	26.59	0.009	0.172	0.000	0.000	0.208	0.785	860.9	1.060	12.08	98.45		ma120300_rel_withdbg.cz12b_c32r128
12235.0	195760	0.000	0.000	0.735	16.00	11321.0	300942	37.93	0.334	0.387	26.61	0.208	2.396	0.000	0.000	1.969	4.857	897.9	0.976	11.75	98.42		ma120300_rel_withdbg.cz12c_c32r128
5529.3	88468.3	0.000	0.000	1.952	16.00	5825.9	139922	423.1	6.866	2.725	24.00	0.003	0.017	0.000	0.000	0.083	0.079	719.5	2.594	24.12	99.86		ma120300_rel_withdbg.cz12b_sync_c32r128
8787.9	140606	0.000	0.000	1.301	16.00	8554.4	217928	28.04	0.329	1.651	25.48	0.105	0.420	0.000	0.000	1.327	1.105	873.6	1.803	21.55	99.52		ma120300_rel_withdbg.cz12c_sync_c32r128
qr100.L1
qr100.L1: range queries with 100 insert/s per client. Graphs for performance per 1-second interval are here.
Average throughput:
Query response time histogram: each cell has the percentage of responses that take <= the time in the header and max is the max response time in seconds. For max values in the top 25% of the range have a red background and in the bottom 25% of the range have a green background. The red background is not used when the min value is within 80% of the max value.
| dbms | 256us | 1ms | 4ms | 16ms | 64ms | 256ms | 1s | 4s | 16s | gt | max |
|---|---|---|---|---|---|---|---|---|---|---|---|
| ma120300_rel_withdbg.cz12b_c32r128 | 99.388 | 0.494 | 0.088 | 0.019 | 0.010 | 0.001 | nonzero | 0.661 | |||
| ma120300_rel_withdbg.cz12c_c32r128 | 99.403 | 0.481 | 0.092 | 0.017 | 0.007 | 0.001 | nonzero | nonzero | 1.539 | ||
| ma120300_rel_withdbg.cz12b_sync_c32r128 | 99.217 | 0.550 | 0.182 | 0.030 | 0.018 | 0.003 | nonzero | 0.785 | |||
| ma120300_rel_withdbg.cz12c_sync_c32r128 | 99.343 | 0.506 | 0.123 | 0.020 | 0.008 | 0.001 | nonzero | 0.439 |
Insert response time histogram: each cell has the percentage of responses that take <= the time in the header and max is the max response time in seconds. For max values in the top 25% of the range have a red background and in the bottom 25% of the range have a green background. The red background is not used when the min value is within 80% of the max value.
| dbms | 256us | 1ms | 4ms | 16ms | 64ms | 256ms | 1s | 4s | 16s | gt | max |
|---|---|---|---|---|---|---|---|---|---|---|---|
| ma120300_rel_withdbg.cz12b_c32r128 | 22.208 | 66.229 | 7.896 | 3.655 | 0.012 | 1.209 | |||||
| ma120300_rel_withdbg.cz12c_c32r128 | 19.579 | 68.502 | 9.606 | 2.206 | 0.106 | 1.835 | |||||
| ma120300_rel_withdbg.cz12b_sync_c32r128 | 0.042 | 70.359 | 20.764 | 8.303 | 0.532 | 1.890 | |||||
| ma120300_rel_withdbg.cz12c_sync_c32r128 | 4.681 | 80.241 | 11.731 | 3.301 | 0.046 | 1.430 |
Delete response time histogram: each cell has the percentage of responses that take <= the time in the header and max is the max response time in seconds. For max values in the top 25% of the range have a red background and in the bottom 25% of the range have a green background. The red background is not used when the min value is within 80% of the max value.
| dbms | 256us | 1ms | 4ms | 16ms | 64ms | 256ms | 1s | 4s | 16s | gt | max |
|---|---|---|---|---|---|---|---|---|---|---|---|
| ma120300_rel_withdbg.cz12b_c32r128 | 44.525 | 45.030 | 6.995 | 3.449 | 0.905 | ||||||
| ma120300_rel_withdbg.cz12c_c32r128 | 39.882 | 51.197 | 6.782 | 2.060 | 0.079 | 1.698 | |||||
| ma120300_rel_withdbg.cz12b_sync_c32r128 | 1.875 | 79.062 | 11.208 | 7.644 | 0.211 | 1.863 | |||||
| ma120300_rel_withdbg.cz12c_sync_c32r128 | 14.539 | 71.759 | 11.382 | 2.292 | 0.028 | 1.377 |
Performance metrics for the DBMS listed above. Some are normalized by throughput, others are not. Legend for results is here.
ips	qps	rps	rmbps	wps	wmbps	rpq	rkbpq	wpi	wkbpi	csps	cpups	cspq	cpupq	dbgb1	dbgb2	rss	maxop	p50	p99	tag
1192	80838	5422	84.7	2984.2	80.2	0.067	1.073	2.504	68.859	501844	38.1	6.208	151	648.6	751.0	101.3	0.661	7135	1232	ma120300_rel_withdbg.cz12b_c32r128
1193	81223	5423	84.7	3036.9	81.5	0.067	1.068	2.546	69.986	503335	38.5	6.197	152	648.5	751.4	101.3	1.539	7055	2048	ma120300_rel_withdbg.cz12c_c32r128
1193	76784	5454	85.2	3261.9	82.5	0.071	1.137	2.735	70.870	480554	36.9	6.258	154	645.8	748.2	101.3	0.785	6991	464	ma120300_rel_withdbg.cz12b_sync_c32r128
1193	80859	5436	84.9	3117.2	82.1	0.067	1.076	2.614	70.483	501670	38.4	6.204	152	647.3	750.2	100.3	0.439	7087	2480	ma120300_rel_withdbg.cz12c_sync_c32r128
Average values from iostat.
r/s	rkB/s	rrqm/s	%rrqm	r_await	rareq-s	w/s	wkB/s	wrqm/s	%wrqm	w_await	wareq-s	d/s	dkB/s	drqm/s	%drqm	d_await	dareq-s	f/s	f_await	aqu-sz	%util
5421.8	86749.5	0.000	0.000	0.280	16.00	2984.2	82080.3	10.17	0.531	0.350	37.52	0.010	0.336	0.000	0.000	0.061	1.160	221.6	0.691	2.513	29.38		ma120300_rel_withdbg.cz12b_c32r128
5422.7	86763.0	0.000	0.000	0.264	16.00	3036.9	83472.9	18.58	2.479	0.367	36.07	0.005	0.044	0.000	0.000	0.041	0.199	229.2	0.626	2.487	29.77		ma120300_rel_withdbg.cz12c_c32r128
5454.5	87271.7	0.000	0.000	0.675	16.00	3261.9	84526.9	206.4	12.18	0.780	25.99	0.007	0.126	0.000	0.000	0.073	0.575	335.0	1.051	5.951	37.95		ma120300_rel_withdbg.cz12b_sync_c32r128
5435.7	86970.0	0.000	0.000	0.416	16.00	3117.2	84064.9	18.20	1.685	0.417	30.61	0.003	0.044	0.000	0.000	0.023	0.188	270.8	0.770	3.677	32.06		ma120300_rel_withdbg.cz12c_sync_c32r128
qp100.L2
qp100.L2: point queries with 100 insert/s per client. Graphs for performance per 1-second interval are here.
Average throughput:
Query response time histogram: each cell has the percentage of responses that take <= the time in the header and max is the max response time in seconds. For max values in the top 25% of the range have a red background and in the bottom 25% of the range have a green background. The red background is not used when the min value is within 80% of the max value.
| dbms | 256us | 1ms | 4ms | 16ms | 64ms | 256ms | 1s | 4s | 16s | gt | max |
|---|---|---|---|---|---|---|---|---|---|---|---|
| ma120300_rel_withdbg.cz12b_c32r128 | 0.003 | 25.665 | 50.884 | 22.188 | 1.208 | 0.049 | 0.002 | 0.001 | 1.231 | ||
| ma120300_rel_withdbg.cz12c_c32r128 | 0.003 | 26.409 | 51.259 | 21.152 | 1.108 | 0.066 | 0.003 | nonzero | 2.028 | ||
| ma120300_rel_withdbg.cz12b_sync_c32r128 | nonzero | 7.992 | 36.983 | 49.997 | 4.494 | 0.525 | 0.009 | nonzero | 1.184 | ||
| ma120300_rel_withdbg.cz12c_sync_c32r128 | 0.002 | 21.524 | 52.092 | 24.778 | 1.518 | 0.083 | 0.003 | 0.954 |
Insert response time histogram: each cell has the percentage of responses that take <= the time in the header and max is the max response time in seconds. For max values in the top 25% of the range have a red background and in the bottom 25% of the range have a green background. The red background is not used when the min value is within 80% of the max value.
| dbms | 256us | 1ms | 4ms | 16ms | 64ms | 256ms | 1s | 4s | 16s | gt | max |
|---|---|---|---|---|---|---|---|---|---|---|---|
| ma120300_rel_withdbg.cz12b_c32r128 | 0.556 | 56.697 | 39.338 | 2.988 | 0.421 | 2.187 | |||||
| ma120300_rel_withdbg.cz12c_c32r128 | 0.507 | 52.720 | 41.484 | 4.889 | 0.400 | 2.353 | |||||
| ma120300_rel_withdbg.cz12b_sync_c32r128 | 0.002 | 10.130 | 71.681 | 16.595 | 1.593 | 2.230 | |||||
| ma120300_rel_withdbg.cz12c_sync_c32r128 | 0.023 | 48.565 | 44.560 | 6.574 | 0.278 | 1.586 |
Delete response time histogram: each cell has the percentage of responses that take <= the time in the header and max is the max response time in seconds. For max values in the top 25% of the range have a red background and in the bottom 25% of the range have a green background. The red background is not used when the min value is within 80% of the max value.
| dbms | 256us | 1ms | 4ms | 16ms | 64ms | 256ms | 1s | 4s | 16s | gt | max |
|---|---|---|---|---|---|---|---|---|---|---|---|
| ma120300_rel_withdbg.cz12b_c32r128 | 9.537 | 63.009 | 24.741 | 2.472 | 0.241 | 1.441 | |||||
| ma120300_rel_withdbg.cz12c_c32r128 | 7.301 | 62.412 | 25.931 | 4.155 | 0.201 | 2.264 | |||||
| ma120300_rel_withdbg.cz12b_sync_c32r128 | 0.002 | 18.410 | 64.465 | 16.282 | 0.840 | 2.001 | |||||
| ma120300_rel_withdbg.cz12c_sync_c32r128 | 1.234 | 63.553 | 29.722 | 5.391 | 0.100 | 1.430 |
Performance metrics for the DBMS listed above. Some are normalized by throughput, others are not. Legend for results is here.
ips	qps	rps	rmbps	wps	wmbps	rpq	rkbpq	wpi	wkbpi	csps	cpups	cspq	cpupq	dbgb1	dbgb2	rss	maxop	p50	p99	tag
1191	4300	36114	564.3	8738.9	226.4	8.399	134.387	7.336	194.645	164777	6.9	38.323	514	648.6	751.0	101.3	1.231	352	16	ma120300_rel_withdbg.cz12b_c32r128
1191	4384	36683	573.2	8779.7	226.8	8.368	133.881	7.374	195.053	168284	7.0	38.386	511	648.5	751.4	101.3	2.028	368	16	ma120300_rel_withdbg.cz12c_c32r128
1185	1899	20830	325.5	8351.5	208.8	10.970	175.517	7.049	180.444	122007	4.9	64.251	826	645.8	748.2	101.3	1.184	144	16	ma120300_rel_withdbg.cz12b_sync_c32r128
1192	3788	32940	514.7	8741.9	224.9	8.697	139.146	7.334	193.165	156880	6.5	41.418	549	647.3	750.2	100.3	0.954	304	16	ma120300_rel_withdbg.cz12c_sync_c32r128
Average values from iostat.
r/s	rkB/s	rrqm/s	%rrqm	r_await	rareq-s	w/s	wkB/s	wrqm/s	%wrqm	w_await	wareq-s	d/s	dkB/s	drqm/s	%drqm	d_await	dareq-s	f/s	f_await	aqu-sz	%util
36114.1	577825	0.000	0.000	0.464	16.00	8738.9	231880	25.89	0.294	0.381	26.70	0.014	0.192	0.000	0.000	0.220	0.729	517.7	1.276	16.14	99.36		ma120300_rel_withdbg.cz12b_c32r128
36683.4	586934	0.000	0.000	0.450	16.00	8779.7	232250	49.53	0.616	0.505	26.61	0.003	0.018	0.000	0.000	0.044	0.066	551.7	1.186	16.75	99.29		ma120300_rel_withdbg.cz12c_c32r128
20830.5	333288	0.000	0.000	1.058	16.00	8351.5	213790	269.2	3.482	1.397	25.61	0.012	0.149	0.000	0.000	0.191	0.654	674.3	1.845	25.30	99.48		ma120300_rel_withdbg.cz12b_sync_c32r128
32940.1	527042	0.000	0.000	0.550	16.00	8741.9	230253	54.43	0.685	0.860	26.47	0.003	0.013	0.000	0.000	0.050	0.066	565.2	1.406	19.93	99.42		ma120300_rel_withdbg.cz12c_sync_c32r128
qr500.L3
qr500.L3: range queries with 500 insert/s per client. Graphs for performance per 1-second interval are here.
Average throughput:
Query response time histogram: each cell has the percentage of responses that take <= the time in the header and max is the max response time in seconds. For max values in the top 25% of the range have a red background and in the bottom 25% of the range have a green background. The red background is not used when the min value is within 80% of the max value.
| dbms | 256us | 1ms | 4ms | 16ms | 64ms | 256ms | 1s | 4s | 16s | gt | max |
|---|---|---|---|---|---|---|---|---|---|---|---|
| ma120300_rel_withdbg.cz12b_c32r128 | 93.636 | 4.323 | 1.203 | 0.608 | 0.217 | 0.013 | nonzero | 0.524 | |||
| ma120300_rel_withdbg.cz12c_c32r128 | 93.423 | 4.491 | 1.213 | 0.636 | 0.227 | 0.010 | nonzero | 0.508 | |||
| ma120300_rel_withdbg.cz12b_sync_c32r128 | 94.226 | 3.583 | 1.469 | 0.470 | 0.235 | 0.016 | nonzero | 0.865 | |||
| ma120300_rel_withdbg.cz12c_sync_c32r128 | 93.610 | 4.006 | 1.590 | 0.582 | 0.201 | 0.011 | nonzero | 0.592 |
Insert response time histogram: each cell has the percentage of responses that take <= the time in the header and max is the max response time in seconds. For max values in the top 25% of the range have a red background and in the bottom 25% of the range have a green background. The red background is not used when the min value is within 80% of the max value.
| dbms | 256us | 1ms | 4ms | 16ms | 64ms | 256ms | 1s | 4s | 16s | gt | max |
|---|---|---|---|---|---|---|---|---|---|---|---|
| ma120300_rel_withdbg.cz12b_c32r128 | 0.056 | 5.357 | 80.376 | 14.142 | 0.069 | 1.617 | |||||
| ma120300_rel_withdbg.cz12c_c32r128 | 0.014 | 5.268 | 80.631 | 14.070 | 0.017 | 1.461 | |||||
| ma120300_rel_withdbg.cz12b_sync_c32r128 | 0.095 | 51.491 | 47.737 | 0.677 | 2.630 | ||||||
| ma120300_rel_withdbg.cz12c_sync_c32r128 | 0.001 | 1.864 | 81.623 | 16.436 | 0.075 | 1.504 |
Delete response time histogram: each cell has the percentage of responses that take <= the time in the header and max is the max response time in seconds. For max values in the top 25% of the range have a red background and in the bottom 25% of the range have a green background. The red background is not used when the min value is within 80% of the max value.
| dbms | 256us | 1ms | 4ms | 16ms | 64ms | 256ms | 1s | 4s | 16s | gt | max |
|---|---|---|---|---|---|---|---|---|---|---|---|
| ma120300_rel_withdbg.cz12b_c32r128 | 0.230 | 9.550 | 78.557 | 11.625 | 0.038 | 1.577 | |||||
| ma120300_rel_withdbg.cz12c_c32r128 | 0.076 | 9.204 | 80.324 | 10.391 | 0.005 | 1.231 | |||||
| ma120300_rel_withdbg.cz12b_sync_c32r128 | 0.421 | 73.971 | 25.378 | 0.230 | 2.233 | ||||||
| ma120300_rel_withdbg.cz12c_sync_c32r128 | 0.017 | 2.457 | 85.262 | 12.234 | 0.031 | 1.409 |
Performance metrics for the DBMS listed above. Some are normalized by throughput, others are not. Legend for results is here.
ips	qps	rps	rmbps	wps	wmbps	rpq	rkbpq	wpi	wkbpi	csps	cpups	cspq	cpupq	dbgb1	dbgb2	rss	maxop	p50	p99	tag
3161	37317	12056	188.4	11316.3	291.3	0.323	5.169	3.580	94.365	410380	26.5	10.997	227	648.6	751.0	101.3	0.524	3200	608	ma120300_rel_withdbg.cz12b_c32r128
3263	36975	12404	193.8	11690.3	301.1	0.335	5.368	3.583	94.487	417008	26.8	11.278	232	648.5	751.4	101.3	0.508	3136	896	ma120300_rel_withdbg.cz12c_c32r128
2005	37954	7739	120.9	7922.1	194.4	0.204	3.262	3.951	99.269	340309	25.0	8.966	211	645.8	748.2	101.3	0.865	3168	336	ma120300_rel_withdbg.cz12b_sync_c32r128
2802	37825	10749	168.0	10319.1	261.9	0.284	4.547	3.683	95.731	389351	26.7	10.293	226	647.3	750.2	100.3	0.592	3168	592	ma120300_rel_withdbg.cz12c_sync_c32r128
Average values from iostat.
r/s	rkB/s	rrqm/s	%rrqm	r_await	rareq-s	w/s	wkB/s	wrqm/s	%wrqm	w_await	wareq-s	d/s	dkB/s	drqm/s	%drqm	d_await	dareq-s	f/s	f_await	aqu-sz	%util
12056.2	192899	0.000	0.000	0.780	16.00	11316.3	298250	37.64	0.334	0.508	26.39	0.007	0.134	0.000	0.000	0.236	0.597	893.2	0.993	12.54	96.89		ma120300_rel_withdbg.cz12b_c32r128
12404.4	198471	0.000	0.000	0.736	16.00	11690.3	308291	40.29	0.347	0.428	26.40	0.219	2.515	0.000	0.000	2.045	5.087	928.4	0.914	12.25	96.81		ma120300_rel_withdbg.cz12c_c32r128
7739.0	123823	0.000	0.000	1.498	16.00	7922.1	199044	406.4	4.924	1.553	25.14	0.008	0.039	0.000	0.000	0.189	0.176	799.8	1.889	21.22	98.67		ma120300_rel_withdbg.cz12b_sync_c32r128
10749.0	171983	0.000	0.000	1.123	16.00	10319.1	268190	37.48	0.368	1.143	26.02	0.004	0.021	0.000	0.000	0.113	0.088	910.4	1.289	20.47	97.54		ma120300_rel_withdbg.cz12c_sync_c32r128
qp500.L4
qp500.L4: point queries with 500 insert/s per client. Graphs for performance per 1-second interval are here.
Average throughput:
Query response time histogram: each cell has the percentage of responses that take <= the time in the header and max is the max response time in seconds. For max values in the top 25% of the range have a red background and in the bottom 25% of the range have a green background. The red background is not used when the min value is within 80% of the max value.
| dbms | 256us | 1ms | 4ms | 16ms | 64ms | 256ms | 1s | 4s | 16s | gt | max |
|---|---|---|---|---|---|---|---|---|---|---|---|
| ma120300_rel_withdbg.cz12b_c32r128 | 0.070 | 6.353 | 61.568 | 29.945 | 2.057 | 0.007 | 0.887 | ||||
| ma120300_rel_withdbg.cz12c_c32r128 | 0.083 | 7.059 | 62.730 | 29.128 | 0.993 | 0.008 | nonzero | 1.273 | |||
| ma120300_rel_withdbg.cz12b_sync_c32r128 | nonzero | 0.031 | 3.429 | 46.396 | 46.632 | 3.498 | 0.014 | 0.986 | |||
| ma120300_rel_withdbg.cz12c_sync_c32r128 | 0.049 | 4.564 | 58.661 | 34.462 | 2.257 | 0.006 | 0.680 |
Insert response time histogram: each cell has the percentage of responses that take <= the time in the header and max is the max response time in seconds. For max values in the top 25% of the range have a red background and in the bottom 25% of the range have a green background. The red background is not used when the min value is within 80% of the max value.
| dbms | 256us | 1ms | 4ms | 16ms | 64ms | 256ms | 1s | 4s | 16s | gt | max |
|---|---|---|---|---|---|---|---|---|---|---|---|
| ma120300_rel_withdbg.cz12b_c32r128 | 0.036 | 60.456 | 38.521 | 0.988 | 2.144 | ||||||
| ma120300_rel_withdbg.cz12c_c32r128 | 0.055 | 59.461 | 40.156 | 0.329 | 3.274 | ||||||
| ma120300_rel_withdbg.cz12b_sync_c32r128 | nonzero | 18.431 | 78.400 | 3.168 | 2.559 | ||||||
| ma120300_rel_withdbg.cz12c_sync_c32r128 | 0.019 | 57.745 | 41.487 | 0.750 | 2.094 |
Delete response time histogram: each cell has the percentage of responses that take <= the time in the header and max is the max response time in seconds. For max values in the top 25% of the range have a red background and in the bottom 25% of the range have a green background. The red background is not used when the min value is within 80% of the max value.
| dbms | 256us | 1ms | 4ms | 16ms | 64ms | 256ms | 1s | 4s | 16s | gt | max |
|---|---|---|---|---|---|---|---|---|---|---|---|
| ma120300_rel_withdbg.cz12b_c32r128 | 0.041 | 61.290 | 38.041 | 0.628 | 2.079 | ||||||
| ma120300_rel_withdbg.cz12c_c32r128 | 0.091 | 60.423 | 39.276 | 0.210 | 2.952 | ||||||
| ma120300_rel_withdbg.cz12b_sync_c32r128 | 0.002 | 37.925 | 59.978 | 2.095 | 2.538 | ||||||
| ma120300_rel_withdbg.cz12c_sync_c32r128 | 0.001 | 0.020 | 60.796 | 38.769 | 0.413 | 2.012 |
Performance metrics for the DBMS listed above. Some are normalized by throughput, others are not. Legend for results is here.
ips	qps	rps	rmbps	wps	wmbps	rpq	rkbpq	wpi	wkbpi	csps	cpups	cspq	cpupq	dbgb1	dbgb2	rss	maxop	p50	p99	tag
2062	807	16592	259.3	10866.7	276.4	20.568	329.093	5.270	137.292	190683	5.6	236.374	2221	648.7	751.1	101.3	0.887	48	16	ma120300_rel_withdbg.cz12b_c32r128
2118	858	17403	271.9	11269.0	287.0	20.276	324.413	5.322	138.770	198452	5.8	231.215	2162	648.7	751.5	101.3	1.273	64	16	ma120300_rel_withdbg.cz12c_c32r128
1505	564	11942	186.6	8271.8	203.1	21.155	338.479	5.495	138.168	138280	4.1	244.960	2324	645.9	748.3	101.3	0.986	32	0	ma120300_rel_withdbg.cz12b_sync_c32r128
1910	738	15390	240.5	10222.8	257.7	20.862	333.785	5.353	138.158	177278	5.1	240.311	2212	647.4	750.3	100.3	0.680	48	16	ma120300_rel_withdbg.cz12c_sync_c32r128
Average values from iostat.
r/s	rkB/s	rrqm/s	%rrqm	r_await	rareq-s	w/s	wkB/s	wrqm/s	%wrqm	w_await	wareq-s	d/s	dkB/s	drqm/s	%drqm	d_await	dareq-s	f/s	f_await	aqu-sz	%util
16592.4	265479	0.000	0.000	0.939	16.00	10866.7	283068	40.28	0.374	0.528	26.05	0.005	0.052	0.000	0.000	0.104	0.210	880.5	1.047	18.45	98.03		ma120300_rel_withdbg.cz12b_c32r128
17402.8	278444	0.000	0.000	0.886	16.00	11269.0	293859	43.21	0.386	0.431	26.07	0.235	0.982	0.000	0.000	2.294	2.063	913.4	0.969	18.39	98.04		ma120300_rel_withdbg.cz12c_c32r128
11942.0	191072	0.000	0.000	1.375	16.00	8271.8	207998	327.9	3.839	1.334	25.14	0.005	0.024	0.000	0.000	0.128	0.111	800.0	1.747	24.46	99.00		ma120300_rel_withdbg.cz12b_sync_c32r128
15389.6	246233	0.000	0.000	1.192	16.00	10222.8	263854	38.00	0.373	1.193	25.81	0.004	0.021	0.000	0.000	0.195	0.097	889.6	1.250	26.49	98.46		ma120300_rel_withdbg.cz12c_sync_c32r128
qr1000.L5
qr1000.L5: range queries with 1000 insert/s per client. Graphs for performance per 1-second interval are here.
Average throughput:
Query response time histogram: each cell has the percentage of responses that take <= the time in the header and max is the max response time in seconds. For max values in the top 25% of the range have a red background and in the bottom 25% of the range have a green background. The red background is not used when the min value is within 80% of the max value.
| dbms | 256us | 1ms | 4ms | 16ms | 64ms | 256ms | 1s | 4s | 16s | gt | max |
|---|---|---|---|---|---|---|---|---|---|---|---|
| ma120300_rel_withdbg.cz12b_c32r128 | 92.906 | 5.373 | 1.249 | 0.380 | 0.090 | 0.003 | nonzero | nonzero | nonzero | 4.951 | |
| ma120300_rel_withdbg.cz12c_c32r128 | 92.690 | 5.575 | 1.257 | 0.387 | 0.088 | 0.002 | nonzero | nonzero | nonzero | 4.320 | |
| ma120300_rel_withdbg.cz12b_sync_c32r128 | 93.177 | 4.722 | 1.697 | 0.309 | 0.092 | 0.003 | nonzero | nonzero | 3.044 | ||
| ma120300_rel_withdbg.cz12c_sync_c32r128 | 92.643 | 5.306 | 1.608 | 0.360 | 0.080 | 0.003 | nonzero | nonzero | nonzero | 4.550 |
Insert response time histogram: each cell has the percentage of responses that take <= the time in the header and max is the max response time in seconds. For max values in the top 25% of the range have a red background and in the bottom 25% of the range have a green background. The red background is not used when the min value is within 80% of the max value.
| dbms | 256us | 1ms | 4ms | 16ms | 64ms | 256ms | 1s | 4s | 16s | gt | max |
|---|---|---|---|---|---|---|---|---|---|---|---|
| ma120300_rel_withdbg.cz12b_c32r128 | nonzero | 0.090 | 48.386 | 50.712 | 0.797 | 0.015 | 5.404 | ||||
| ma120300_rel_withdbg.cz12c_c32r128 | 0.094 | 48.934 | 50.576 | 0.380 | 0.017 | 5.542 | |||||
| ma120300_rel_withdbg.cz12b_sync_c32r128 | nonzero | 21.627 | 75.236 | 3.125 | 0.012 | 5.333 | |||||
| ma120300_rel_withdbg.cz12c_sync_c32r128 | 0.013 | 44.922 | 54.411 | 0.641 | 0.014 | 5.539 |
Delete response time histogram: each cell has the percentage of responses that take <= the time in the header and max is the max response time in seconds. For max values in the top 25% of the range have a red background and in the bottom 25% of the range have a green background. The red background is not used when the min value is within 80% of the max value.
| dbms | 256us | 1ms | 4ms | 16ms | 64ms | 256ms | 1s | 4s | 16s | gt | max |
|---|---|---|---|---|---|---|---|---|---|---|---|
| ma120300_rel_withdbg.cz12b_c32r128 | 0.001 | 0.277 | 49.570 | 49.663 | 0.478 | 0.011 | 5.294 | ||||
| ma120300_rel_withdbg.cz12c_c32r128 | 0.302 | 50.317 | 49.115 | 0.250 | 0.015 | 5.489 | |||||
| ma120300_rel_withdbg.cz12b_sync_c32r128 | 0.001 | 32.086 | 66.276 | 1.628 | 0.009 | 5.253 | |||||
| ma120300_rel_withdbg.cz12c_sync_c32r128 | 0.036 | 46.441 | 53.147 | 0.365 | 0.012 | 5.462 |
Performance metrics for the DBMS listed above. Some are normalized by throughput, others are not. Legend for results is here.
ips	qps	rps	rmbps	wps	wmbps	rpq	rkbpq	wpi	wkbpi	csps	cpups	cspq	cpupq	dbgb1	dbgb2	rss	maxop	p50	p99	tag
1969	45713	11551	180.5	10832.6	278.2	0.253	4.043	5.501	144.699	408065	31.7	8.927	222	648.8	751.2	101.3	4.951	4015	1232	ma120300_rel_withdbg.cz12b_c32r128
2019	45619	11849	185.1	11111.9	285.7	0.260	4.156	5.503	144.870	411968	32.0	9.031	224	648.7	751.6	101.3	4.320	3984	1120	ma120300_rel_withdbg.cz12c_c32r128
1461	45510	8619	134.7	8425.5	209.3	0.189	3.030	5.766	146.695	366897	30.6	8.062	215	645.9	748.3	101.3	3.044	3967	1344	ma120300_rel_withdbg.cz12b_sync_c32r128
1852	45628	10862	169.7	10305.4	262.4	0.238	3.809	5.563	145.039	396875	32.0	8.698	224	647.4	750.3	100.3	4.550	4015	1184	ma120300_rel_withdbg.cz12c_sync_c32r128
Average values from iostat.
r/s	rkB/s	rrqm/s	%rrqm	r_await	rareq-s	w/s	wkB/s	wrqm/s	%wrqm	w_await	wareq-s	d/s	dkB/s	drqm/s	%drqm	d_await	dareq-s	f/s	f_await	aqu-sz	%util
11550.8	184813	0.000	0.000	0.821	16.00	10832.6	284927	36.42	0.337	0.470	26.31	0.007	0.068	0.000	0.000	0.203	0.332	880.1	1.024	12.08	97.79		ma120300_rel_withdbg.cz12b_c32r128
11848.8	189581	0.000	0.000	0.790	16.00	11111.9	292549	39.75	0.357	0.398	26.33	0.283	1.134	0.000	0.000	2.694	2.364	902.7	0.974	11.83	97.74		ma120300_rel_withdbg.cz12c_c32r128
8619.1	137906	0.000	0.000	1.287	16.00	8425.5	214366	331.8	3.849	1.292	25.43	0.004	0.039	0.000	0.000	0.120	0.191	811.0	1.693	18.92	98.92		ma120300_rel_withdbg.cz12b_sync_c32r128
10862.5	173800	0.000	0.000	1.003	16.00	10305.4	268669	35.54	0.345	0.925	26.07	0.125	0.523	0.000	0.000	1.375	1.160	897.4	1.221	17.54	98.27		ma120300_rel_withdbg.cz12c_sync_c32r128
qp1000.L6
qp1000.L6: point queries with 1000 insert/s per client. Graphs for performance per 1-second interval are here.
Average throughput:
Query response time histogram: each cell has the percentage of responses that take <= the time in the header and max is the max response time in seconds. For max values in the top 25% of the range have a red background and in the bottom 25% of the range have a green background. The red background is not used when the min value is within 80% of the max value.
| dbms | 256us | 1ms | 4ms | 16ms | 64ms | 256ms | 1s | 4s | 16s | gt | max |
|---|---|---|---|---|---|---|---|---|---|---|---|
| ma120300_rel_withdbg.cz12b_c32r128 | nonzero | 0.185 | 12.051 | 78.517 | 9.129 | 0.117 | nonzero | nonzero | 5.360 | ||
| ma120300_rel_withdbg.cz12c_c32r128 | nonzero | 0.197 | 12.393 | 78.727 | 8.597 | 0.085 | nonzero | nonzero | 1.293 | ||
| ma120300_rel_withdbg.cz12b_sync_c32r128 | nonzero | 0.102 | 7.353 | 72.663 | 19.244 | 0.636 | 0.001 | nonzero | 1.367 | ||
| ma120300_rel_withdbg.cz12c_sync_c32r128 | nonzero | 0.119 | 8.753 | 81.725 | 9.296 | 0.107 | 0.001 | nonzero | 2.587 |
Insert response time histogram: each cell has the percentage of responses that take <= the time in the header and max is the max response time in seconds. For max values in the top 25% of the range have a red background and in the bottom 25% of the range have a green background. The red background is not used when the min value is within 80% of the max value.
| dbms | 256us | 1ms | 4ms | 16ms | 64ms | 256ms | 1s | 4s | 16s | gt | max |
|---|---|---|---|---|---|---|---|---|---|---|---|
| ma120300_rel_withdbg.cz12b_c32r128 | 0.003 | 9.845 | 88.618 | 1.529 | 0.006 | 6.302 | |||||
| ma120300_rel_withdbg.cz12c_c32r128 | 0.013 | 10.061 | 89.008 | 0.918 | 2.237 | ||||||
| ma120300_rel_withdbg.cz12b_sync_c32r128 | 0.002 | 0.071 | 91.477 | 8.451 | 2.774 | ||||||
| ma120300_rel_withdbg.cz12c_sync_c32r128 | 0.012 | 3.285 | 95.880 | 0.824 | 3.425 |
Delete response time histogram: each cell has the percentage of responses that take <= the time in the header and max is the max response time in seconds. For max values in the top 25% of the range have a red background and in the bottom 25% of the range have a green background. The red background is not used when the min value is within 80% of the max value.
| dbms | 256us | 1ms | 4ms | 16ms | 64ms | 256ms | 1s | 4s | 16s | gt | max |
|---|---|---|---|---|---|---|---|---|---|---|---|
| ma120300_rel_withdbg.cz12b_c32r128 | 0.002 | 10.038 | 89.096 | 0.859 | 0.005 | 6.266 | |||||
| ma120300_rel_withdbg.cz12c_c32r128 | 0.008 | 10.226 | 89.211 | 0.555 | 2.189 | ||||||
| ma120300_rel_withdbg.cz12b_sync_c32r128 | 0.003 | 0.137 | 93.868 | 5.992 | 2.647 | ||||||
| ma120300_rel_withdbg.cz12c_sync_c32r128 | 0.017 | 3.381 | 96.258 | 0.345 | 3.420 |
Performance metrics for the DBMS listed above. Some are normalized by throughput, others are not. Legend for results is here.
ips	qps	rps	rmbps	wps	wmbps	rpq	rkbpq	wpi	wkbpi	csps	cpups	cspq	cpupq	dbgb1	dbgb2	rss	maxop	p50	p99	tag
1432	1332	20893	326.5	10099.2	258.2	15.692	251.065	7.052	184.606	163161	5.5	122.539	1322	648.8	751.4	101.3	5.360	128	32	ma120300_rel_withdbg.cz12b_c32r128
1465	1370	21429	334.8	10346.6	264.7	15.646	250.341	7.062	184.985	167249	5.7	122.116	1332	648.7	751.8	101.3	1.293	128	32	ma120300_rel_withdbg.cz12c_c32r128
1121	1003	15993	249.9	8119.6	201.6	15.942	255.066	7.242	184.156	129111	4.5	128.699	1435	645.9	748.5	101.3	1.367	96	16	ma120300_rel_withdbg.cz12b_sync_c32r128
1362	1242	19682	307.5	9647.7	244.8	15.841	253.464	7.081	184.018	155661	5.0	125.291	1288	647.4	750.5	100.3	2.587	128	32	ma120300_rel_withdbg.cz12c_sync_c32r128
Average values from iostat.
r/s	rkB/s	rrqm/s	%rrqm	r_await	rareq-s	w/s	wkB/s	wrqm/s	%wrqm	w_await	wareq-s	d/s	dkB/s	drqm/s	%drqm	d_await	dareq-s	f/s	f_await	aqu-sz	%util
20893.3	334293	0.000	0.000	0.906	16.00	10099.2	264374	36.78	0.366	0.461	26.19	0.007	0.071	0.000	0.000	0.173	0.328	823.6	1.107	20.60	98.92		ma120300_rel_withdbg.cz12b_c32r128
21429.2	342868	0.000	0.000	0.873	16.00	10346.6	271021	39.18	0.378	0.394	26.20	0.252	1.015	0.000	0.000	2.583	2.263	843.8	1.055	20.43	98.93		ma120300_rel_withdbg.cz12c_c32r128
15992.6	255882	0.000	0.000	1.224	16.00	8119.6	206475	272.8	3.308	1.171	25.42	0.004	0.019	0.000	0.000	0.105	0.088	763.8	1.713	25.67	99.41		ma120300_rel_withdbg.cz12b_sync_c32r128
19681.5	314904	0.000	0.000	1.034	16.00	9647.7	250725	35.66	0.370	0.928	25.99	0.155	0.662	0.000	0.000	1.655	1.547	831.6	1.283	25.80	99.13		ma120300_rel_withdbg.cz12c_sync_c32r128
l.i0
l.i0: load without secondary indexes
Performance metrics for all DBMS, not just the ones listed above. Some are normalized by throughput, others are not. Legend for results is here.
ips	qps	rps	rmbps	wps	wmbps	rpq	rkbpq	wpi	wkbpi	csps	cpups	cspq	cpupq	dbgb1	dbgb2	rss	maxop	p50	p99	tag
799112	0	1	0.0	4140.1	204.1	0.000	0.000	0.005	0.262	189064	37.7	0.237	15	236.8	337.6	101.3	4.496	67892	0	ma120300_rel_withdbg.cz12b_c32r128
684671	0	1	0.0	4463.4	254.0	0.000	0.000	0.007	0.380	207318	34.8	0.303	16	236.8	338.2	101.4	7.927	61592	0	ma120300_rel_withdbg.cz12c_c32r128
153022	0	0	0.0	3842.6	62.5	0.000	0.000	0.025	0.418	46329	7.8	0.303	16	236.8	337.6	101.2	0.353	12898	1899	ma120300_rel_withdbg.cz12b_sync_c32r128
471081	0	1	0.0	5097.0	184.7	0.000	0.000	0.011	0.402	88894	23.3	0.189	16	236.8	338.1	101.2	1.047	46194	6897	ma120300_rel_withdbg.cz12c_sync_c32r128
l.x
l.x: create secondary indexes
Performance metrics for all DBMS, not just the ones listed above. Some are normalized by throughput, others are not. Legend for results is here.
ips	qps	rps	rmbps	wps	wmbps	rpq	rkbpq	wpi	wkbpi	csps	cpups	cspq	cpupq	dbgb1	dbgb2	rss	maxop	p50	p99	tag
693374	0	7793	642.3	8636.8	720.3	0.011	0.949	0.012	1.064	30824	17.6	0.044	8	501.7	602.5	101.5	0.005	NA	NA	ma120300_rel_withdbg.cz12b_c32r128
633245	0	7084	586.4	7607.7	653.2	0.011	0.948	0.012	1.056	27464	15.7	0.043	8	501.7	603.1	101.6	0.004	NA	NA	ma120300_rel_withdbg.cz12c_c32r128
684671	0	7664	634.5	7947.8	702.5	0.011	0.949	0.012	1.051	28172	16.8	0.041	8	501.7	602.5	101.5	1.339	NA	NA	ma120300_rel_withdbg.cz12b_sync_c32r128
764169	0	8596	711.8	8817.5	782.9	0.011	0.954	0.012	1.049	31038	19.2	0.041	8	501.7	603.0	101.5	0.116	NA	NA	ma120300_rel_withdbg.cz12c_sync_c32r128
l.i1
l.i1: continue load after secondary indexes created with 50 inserts per transaction
Performance metrics for all DBMS, not just the ones listed above. Some are normalized by throughput, others are not. Legend for results is here.
ips	qps	rps	rmbps	wps	wmbps	rpq	rkbpq	wpi	wkbpi	csps	cpups	cspq	cpupq	dbgb1	dbgb2	rss	maxop	p50	p99	tag
1976	0	10507	164.2	10811.6	275.8	5.319	85.096	5.473	142.985	146003	4.4	73.907	713	648.6	751.0	101.3	4.831	150	50	ma120300_rel_withdbg.cz12b_c32r128
2011	0	10680	166.9	11002.3	280.8	5.311	84.975	5.471	142.981	147915	4.4	73.557	700	648.5	751.4	101.3	5.514	150	50	ma120300_rel_withdbg.cz12c_c32r128
1522	0	7972	124.6	8590.4	212.1	5.239	83.825	5.646	142.714	108292	3.5	71.170	736	645.8	748.2	101.3	6.908	150	0	ma120300_rel_withdbg.cz12b_sync_c32r128
1864	0	9858	154.0	10290.0	260.1	5.288	84.610	5.520	142.900	136776	4.1	73.378	704	647.3	750.2	100.3	5.789	150	50	ma120300_rel_withdbg.cz12c_sync_c32r128
l.i2
l.i2: continue load after secondary indexes created with 5 inserts per transaction
Performance metrics for all DBMS, not just the ones listed above. Some are normalized by throughput, others are not. Legend for results is here.
ips	qps	rps	rmbps	wps	wmbps	rpq	rkbpq	wpi	wkbpi	csps	cpups	cspq	cpupq	dbgb1	dbgb2	rss	maxop	p50	p99	tag
1472	0	11755	183.7	10859.0	281.7	7.988	127.806	7.379	195.984	139578	4.4	94.848	957	648.6	751.0	101.3	4.505	85	35	ma120300_rel_withdbg.cz12b_c32r128
1530	0	12235	191.2	11321.0	293.9	7.995	127.914	7.397	196.643	144978	4.6	94.732	962	648.5	751.4	101.3	4.305	90	40	ma120300_rel_withdbg.cz12c_c32r128
685	0	5529	86.4	5825.9	136.6	8.075	129.207	8.509	204.356	63720	2.3	93.062	1075	645.8	748.2	101.3	1.587	45	20	ma120300_rel_withdbg.cz12b_sync_c32r128
1095	0	8788	137.3	8554.4	212.8	8.024	128.383	7.811	198.984	102640	3.6	93.718	1052	647.3	750.2	100.3	0.947	65	30	ma120300_rel_withdbg.cz12c_sync_c32r128
qr100.L1
qr100.L1: range queries with 100 insert/s per client
Performance metrics for all DBMS, not just the ones listed above. Some are normalized by throughput, others are not. Legend for results is here.
ips	qps	rps	rmbps	wps	wmbps	rpq	rkbpq	wpi	wkbpi	csps	cpups	cspq	cpupq	dbgb1	dbgb2	rss	maxop	p50	p99	tag
1192	80838	5422	84.7	2984.2	80.2	0.067	1.073	2.504	68.859	501844	38.1	6.208	151	648.6	751.0	101.3	0.661	7135	1232	ma120300_rel_withdbg.cz12b_c32r128
1193	81223	5423	84.7	3036.9	81.5	0.067	1.068	2.546	69.986	503335	38.5	6.197	152	648.5	751.4	101.3	1.539	7055	2048	ma120300_rel_withdbg.cz12c_c32r128
1193	76784	5454	85.2	3261.9	82.5	0.071	1.137	2.735	70.870	480554	36.9	6.258	154	645.8	748.2	101.3	0.785	6991	464	ma120300_rel_withdbg.cz12b_sync_c32r128
1193	80859	5436	84.9	3117.2	82.1	0.067	1.076	2.614	70.483	501670	38.4	6.204	152	647.3	750.2	100.3	0.439	7087	2480	ma120300_rel_withdbg.cz12c_sync_c32r128
qp100.L2
qp100.L2: point queries with 100 insert/s per client
Performance metrics for all DBMS, not just the ones listed above. Some are normalized by throughput, others are not. Legend for results is here.
ips	qps	rps	rmbps	wps	wmbps	rpq	rkbpq	wpi	wkbpi	csps	cpups	cspq	cpupq	dbgb1	dbgb2	rss	maxop	p50	p99	tag
1191	4300	36114	564.3	8738.9	226.4	8.399	134.387	7.336	194.645	164777	6.9	38.323	514	648.6	751.0	101.3	1.231	352	16	ma120300_rel_withdbg.cz12b_c32r128
1191	4384	36683	573.2	8779.7	226.8	8.368	133.881	7.374	195.053	168284	7.0	38.386	511	648.5	751.4	101.3	2.028	368	16	ma120300_rel_withdbg.cz12c_c32r128
1185	1899	20830	325.5	8351.5	208.8	10.970	175.517	7.049	180.444	122007	4.9	64.251	826	645.8	748.2	101.3	1.184	144	16	ma120300_rel_withdbg.cz12b_sync_c32r128
1192	3788	32940	514.7	8741.9	224.9	8.697	139.146	7.334	193.165	156880	6.5	41.418	549	647.3	750.2	100.3	0.954	304	16	ma120300_rel_withdbg.cz12c_sync_c32r128
qr500.L3
qr500.L3: range queries with 500 insert/s per client
Performance metrics for all DBMS, not just the ones listed above. Some are normalized by throughput, others are not. Legend for results is here.
ips	qps	rps	rmbps	wps	wmbps	rpq	rkbpq	wpi	wkbpi	csps	cpups	cspq	cpupq	dbgb1	dbgb2	rss	maxop	p50	p99	tag
3161	37317	12056	188.4	11316.3	291.3	0.323	5.169	3.580	94.365	410380	26.5	10.997	227	648.6	751.0	101.3	0.524	3200	608	ma120300_rel_withdbg.cz12b_c32r128
3263	36975	12404	193.8	11690.3	301.1	0.335	5.368	3.583	94.487	417008	26.8	11.278	232	648.5	751.4	101.3	0.508	3136	896	ma120300_rel_withdbg.cz12c_c32r128
2005	37954	7739	120.9	7922.1	194.4	0.204	3.262	3.951	99.269	340309	25.0	8.966	211	645.8	748.2	101.3	0.865	3168	336	ma120300_rel_withdbg.cz12b_sync_c32r128
2802	37825	10749	168.0	10319.1	261.9	0.284	4.547	3.683	95.731	389351	26.7	10.293	226	647.3	750.2	100.3	0.592	3168	592	ma120300_rel_withdbg.cz12c_sync_c32r128
qp500.L4
qp500.L4: point queries with 500 insert/s per client
Performance metrics for all DBMS, not just the ones listed above. Some are normalized by throughput, others are not. Legend for results is here.
ips	qps	rps	rmbps	wps	wmbps	rpq	rkbpq	wpi	wkbpi	csps	cpups	cspq	cpupq	dbgb1	dbgb2	rss	maxop	p50	p99	tag
2062	807	16592	259.3	10866.7	276.4	20.568	329.093	5.270	137.292	190683	5.6	236.374	2221	648.7	751.1	101.3	0.887	48	16	ma120300_rel_withdbg.cz12b_c32r128
2118	858	17403	271.9	11269.0	287.0	20.276	324.413	5.322	138.770	198452	5.8	231.215	2162	648.7	751.5	101.3	1.273	64	16	ma120300_rel_withdbg.cz12c_c32r128
1505	564	11942	186.6	8271.8	203.1	21.155	338.479	5.495	138.168	138280	4.1	244.960	2324	645.9	748.3	101.3	0.986	32	0	ma120300_rel_withdbg.cz12b_sync_c32r128
1910	738	15390	240.5	10222.8	257.7	20.862	333.785	5.353	138.158	177278	5.1	240.311	2212	647.4	750.3	100.3	0.680	48	16	ma120300_rel_withdbg.cz12c_sync_c32r128
qr1000.L5
qr1000.L5: range queries with 1000 insert/s per client
Performance metrics for all DBMS, not just the ones listed above. Some are normalized by throughput, others are not. Legend for results is here.
ips	qps	rps	rmbps	wps	wmbps	rpq	rkbpq	wpi	wkbpi	csps	cpups	cspq	cpupq	dbgb1	dbgb2	rss	maxop	p50	p99	tag
1969	45713	11551	180.5	10832.6	278.2	0.253	4.043	5.501	144.699	408065	31.7	8.927	222	648.8	751.2	101.3	4.951	4015	1232	ma120300_rel_withdbg.cz12b_c32r128
2019	45619	11849	185.1	11111.9	285.7	0.260	4.156	5.503	144.870	411968	32.0	9.031	224	648.7	751.6	101.3	4.320	3984	1120	ma120300_rel_withdbg.cz12c_c32r128
1461	45510	8619	134.7	8425.5	209.3	0.189	3.030	5.766	146.695	366897	30.6	8.062	215	645.9	748.3	101.3	3.044	3967	1344	ma120300_rel_withdbg.cz12b_sync_c32r128
1852	45628	10862	169.7	10305.4	262.4	0.238	3.809	5.563	145.039	396875	32.0	8.698	224	647.4	750.3	100.3	4.550	4015	1184	ma120300_rel_withdbg.cz12c_sync_c32r128
qp1000.L6
qp1000.L6: point queries with 1000 insert/s per client
Performance metrics for all DBMS, not just the ones listed above. Some are normalized by throughput, others are not. Legend for results is here.
ips	qps	rps	rmbps	wps	wmbps	rpq	rkbpq	wpi	wkbpi	csps	cpups	cspq	cpupq	dbgb1	dbgb2	rss	maxop	p50	p99	tag
1432	1332	20893	326.5	10099.2	258.2	15.692	251.065	7.052	184.606	163161	5.5	122.539	1322	648.8	751.4	101.3	5.360	128	32	ma120300_rel_withdbg.cz12b_c32r128
1465	1370	21429	334.8	10346.6	264.7	15.646	250.341	7.062	184.985	167249	5.7	122.116	1332	648.7	751.8	101.3	1.293	128	32	ma120300_rel_withdbg.cz12c_c32r128
1121	1003	15993	249.9	8119.6	201.6	15.942	255.066	7.242	184.156	129111	4.5	128.699	1435	645.9	748.5	101.3	1.367	96	16	ma120300_rel_withdbg.cz12b_sync_c32r128
1362	1242	19682	307.5	9647.7	244.8	15.841	253.464	7.081	184.018	155661	5.0	125.291	1288	647.4	750.5	100.3	2.587	128	32	ma120300_rel_withdbg.cz12c_sync_c32r128
l.i0
- l.i0: load without secondary indexes
- Legend for results is here.
- Each entry lists the percentage of responses that fit in that bucket (slower than max time for previous bucket, faster than min time for next bucket).
Insert response time histogram
256us	1ms	4ms	16ms	64ms	256ms	1s	4s	16s	gt	max	tag
0.000	74.954	24.756	0.093	0.095	0.075	0.018	0.008	nonzero	0.000	4.496	ma120300_rel_withdbg.cz12b_c32r128
0.000	56.867	42.836	0.084	0.087	0.060	0.050	0.015	nonzero	0.000	7.927	ma120300_rel_withdbg.cz12c_c32r128
0.000	0.000	0.070	98.002	1.739	0.190	nonzero	0.000	0.000	0.000	0.353	ma120300_rel_withdbg.cz12b_sync_c32r128
0.000	0.000	98.272	0.860	0.827	0.040	nonzero	nonzero	0.000	0.000	1.047	ma120300_rel_withdbg.cz12c_sync_c32r128
l.x
- l.x: create secondary indexes
- Legend for results is here.
- Each entry lists the percentage of responses that fit in that bucket (slower than max time for previous bucket, faster than min time for next bucket).
TODO - determine whether there is data for create index response time
l.i1
- l.i1: continue load after secondary indexes created with 50 inserts per transaction
- Legend for results is here.
- Each entry lists the percentage of responses that fit in that bucket (slower than max time for previous bucket, faster than min time for next bucket).
Insert response time histogram
256us	1ms	4ms	16ms	64ms	256ms	1s	4s	16s	gt	max	tag
0.000	0.000	0.000	0.000	0.158	56.302	42.376	1.163	0.001	0.000	4.831	ma120300_rel_withdbg.cz12b_c32r128
0.000	0.000	0.000	0.000	0.153	56.062	43.120	0.662	0.003	0.000	5.514	ma120300_rel_withdbg.cz12c_c32r128
0.000	0.000	0.000	0.000	0.022	15.585	81.178	3.204	0.012	0.000	6.908	ma120300_rel_withdbg.cz12b_sync_c32r128
0.000	0.000	0.000	0.000	0.018	47.091	51.759	1.129	0.004	0.000	5.789	ma120300_rel_withdbg.cz12c_sync_c32r128
Delete response time histogram
256us	1ms	4ms	16ms	64ms	256ms	1s	4s	16s	gt	max	tag
0.000	0.000	0.000	0.034	1.444	65.383	32.615	0.523	0.001	0.000	4.800	ma120300_rel_withdbg.cz12b_c32r128
0.000	0.000	0.000	0.029	1.329	65.817	32.574	0.249	0.003	0.000	5.442	ma120300_rel_withdbg.cz12c_c32r128
0.000	0.000	0.000	0.000	0.758	53.447	44.432	1.352	0.010	0.000	6.855	ma120300_rel_withdbg.cz12b_sync_c32r128
0.000	0.000	0.000	0.001	1.334	63.899	34.355	0.409	0.002	0.000	4.839	ma120300_rel_withdbg.cz12c_sync_c32r128
l.i2
- l.i2: continue load after secondary indexes created with 5 inserts per transaction
- Legend for results is here.
- Each entry lists the percentage of responses that fit in that bucket (slower than max time for previous bucket, faster than min time for next bucket).
Insert response time histogram
256us	1ms	4ms	16ms	64ms	256ms	1s	4s	16s	gt	max	tag
0.000	0.065	2.503	18.849	56.490	22.019	0.068	0.005	nonzero	0.000	4.505	ma120300_rel_withdbg.cz12b_c32r128
nonzero	0.076	2.634	19.026	57.907	20.298	0.056	0.004	nonzero	0.000	4.305	ma120300_rel_withdbg.cz12c_c32r128
0.000	0.000	0.000	0.006	44.333	54.961	0.699	0.001	0.000	0.000	1.587	ma120300_rel_withdbg.cz12b_sync_c32r128
0.000	0.000	nonzero	6.515	63.050	30.391	0.043	0.000	0.000	0.000	0.947	ma120300_rel_withdbg.cz12c_sync_c32r128
Delete response time histogram
256us	1ms	4ms	16ms	64ms	256ms	1s	4s	16s	gt	max	tag
nonzero	0.293	6.031	25.684	47.727	20.209	0.052	0.003	0.000	0.000	3.417	ma120300_rel_withdbg.cz12b_c32r128
nonzero	0.330	6.280	25.834	48.942	18.571	0.039	0.003	0.000	0.000	3.920	ma120300_rel_withdbg.cz12c_c32r128
0.000	0.000	0.000	0.018	49.140	50.433	0.409	0.001	0.000	0.000	1.507	ma120300_rel_withdbg.cz12b_sync_c32r128
0.000	0.000	0.001	11.096	60.221	28.649	0.034	0.000	0.000	0.000	0.970	ma120300_rel_withdbg.cz12c_sync_c32r128
qr100.L1
- qr100.L1: range queries with 100 insert/s per client
- Legend for results is here.
- Each entry lists the percentage of responses that fit in that bucket (slower than max time for previous bucket, faster than min time for next bucket).
Query response time histogram
256us	1ms	4ms	16ms	64ms	256ms	1s	4s	16s	gt	max	tag
99.388	0.494	0.088	0.019	0.010	0.001	nonzero	0.000	0.000	0.000	0.661	ma120300_rel_withdbg.cz12b_c32r128
99.403	0.481	0.092	0.017	0.007	0.001	nonzero	nonzero	0.000	0.000	1.539	ma120300_rel_withdbg.cz12c_c32r128
99.217	0.550	0.182	0.030	0.018	0.003	nonzero	0.000	0.000	0.000	0.785	ma120300_rel_withdbg.cz12b_sync_c32r128
99.343	0.506	0.123	0.020	0.008	0.001	nonzero	0.000	0.000	0.000	0.439	ma120300_rel_withdbg.cz12c_sync_c32r128
Insert response time histogram
256us	1ms	4ms	16ms	64ms	256ms	1s	4s	16s	gt	max	tag
0.000	0.000	0.000	22.208	66.229	7.896	3.655	0.012	0.000	0.000	1.209	ma120300_rel_withdbg.cz12b_c32r128
0.000	0.000	0.000	19.579	68.502	9.606	2.206	0.106	0.000	0.000	1.835	ma120300_rel_withdbg.cz12c_c32r128
0.000	0.000	0.000	0.042	70.359	20.764	8.303	0.532	0.000	0.000	1.890	ma120300_rel_withdbg.cz12b_sync_c32r128
0.000	0.000	0.000	4.681	80.241	11.731	3.301	0.046	0.000	0.000	1.430	ma120300_rel_withdbg.cz12c_sync_c32r128
Delete response time histogram
256us	1ms	4ms	16ms	64ms	256ms	1s	4s	16s	gt	max	tag
0.000	0.000	0.000	44.525	45.030	6.995	3.449	0.000	0.000	0.000	0.905	ma120300_rel_withdbg.cz12b_c32r128
0.000	0.000	0.000	39.882	51.197	6.782	2.060	0.079	0.000	0.000	1.698	ma120300_rel_withdbg.cz12c_c32r128
0.000	0.000	0.000	1.875	79.062	11.208	7.644	0.211	0.000	0.000	1.863	ma120300_rel_withdbg.cz12b_sync_c32r128
0.000	0.000	0.000	14.539	71.759	11.382	2.292	0.028	0.000	0.000	1.377	ma120300_rel_withdbg.cz12c_sync_c32r128
qp100.L2
- qp100.L2: point queries with 100 insert/s per client
- Legend for results is here.
- Each entry lists the percentage of responses that fit in that bucket (slower than max time for previous bucket, faster than min time for next bucket).
Query response time histogram
256us	1ms	4ms	16ms	64ms	256ms	1s	4s	16s	gt	max	tag
0.003	25.665	50.884	22.188	1.208	0.049	0.002	0.001	0.000	0.000	1.231	ma120300_rel_withdbg.cz12b_c32r128
0.003	26.409	51.259	21.152	1.108	0.066	0.003	nonzero	0.000	0.000	2.028	ma120300_rel_withdbg.cz12c_c32r128
nonzero	7.992	36.983	49.997	4.494	0.525	0.009	nonzero	0.000	0.000	1.184	ma120300_rel_withdbg.cz12b_sync_c32r128
0.002	21.524	52.092	24.778	1.518	0.083	0.003	0.000	0.000	0.000	0.954	ma120300_rel_withdbg.cz12c_sync_c32r128
Insert response time histogram
256us	1ms	4ms	16ms	64ms	256ms	1s	4s	16s	gt	max	tag
0.000	0.000	0.000	0.556	56.697	39.338	2.988	0.421	0.000	0.000	2.187	ma120300_rel_withdbg.cz12b_c32r128
0.000	0.000	0.000	0.507	52.720	41.484	4.889	0.400	0.000	0.000	2.353	ma120300_rel_withdbg.cz12c_c32r128
0.000	0.000	0.000	0.002	10.130	71.681	16.595	1.593	0.000	0.000	2.230	ma120300_rel_withdbg.cz12b_sync_c32r128
0.000	0.000	0.000	0.023	48.565	44.560	6.574	0.278	0.000	0.000	1.586	ma120300_rel_withdbg.cz12c_sync_c32r128
Delete response time histogram
256us	1ms	4ms	16ms	64ms	256ms	1s	4s	16s	gt	max	tag
0.000	0.000	0.000	9.537	63.009	24.741	2.472	0.241	0.000	0.000	1.441	ma120300_rel_withdbg.cz12b_c32r128
0.000	0.000	0.000	7.301	62.412	25.931	4.155	0.201	0.000	0.000	2.264	ma120300_rel_withdbg.cz12c_c32r128
0.000	0.000	0.000	0.002	18.410	64.465	16.282	0.840	0.000	0.000	2.001	ma120300_rel_withdbg.cz12b_sync_c32r128
0.000	0.000	0.000	1.234	63.553	29.722	5.391	0.100	0.000	0.000	1.430	ma120300_rel_withdbg.cz12c_sync_c32r128
qr500.L3
- qr500.L3: range queries with 500 insert/s per client
- Legend for results is here.
- Each entry lists the percentage of responses that fit in that bucket (slower than max time for previous bucket, faster than min time for next bucket).
Query response time histogram
256us	1ms	4ms	16ms	64ms	256ms	1s	4s	16s	gt	max	tag
93.636	4.323	1.203	0.608	0.217	0.013	nonzero	0.000	0.000	0.000	0.524	ma120300_rel_withdbg.cz12b_c32r128
93.423	4.491	1.213	0.636	0.227	0.010	nonzero	0.000	0.000	0.000	0.508	ma120300_rel_withdbg.cz12c_c32r128
94.226	3.583	1.469	0.470	0.235	0.016	nonzero	0.000	0.000	0.000	0.865	ma120300_rel_withdbg.cz12b_sync_c32r128
93.610	4.006	1.590	0.582	0.201	0.011	nonzero	0.000	0.000	0.000	0.592	ma120300_rel_withdbg.cz12c_sync_c32r128
Insert response time histogram
256us	1ms	4ms	16ms	64ms	256ms	1s	4s	16s	gt	max	tag
0.000	0.000	0.000	0.056	5.357	80.376	14.142	0.069	0.000	0.000	1.617	ma120300_rel_withdbg.cz12b_c32r128
0.000	0.000	0.000	0.014	5.268	80.631	14.070	0.017	0.000	0.000	1.461	ma120300_rel_withdbg.cz12c_c32r128
0.000	0.000	0.000	0.000	0.095	51.491	47.737	0.677	0.000	0.000	2.630	ma120300_rel_withdbg.cz12b_sync_c32r128
0.000	0.000	0.000	0.001	1.864	81.623	16.436	0.075	0.000	0.000	1.504	ma120300_rel_withdbg.cz12c_sync_c32r128
Delete response time histogram
256us	1ms	4ms	16ms	64ms	256ms	1s	4s	16s	gt	max	tag
0.000	0.000	0.000	0.230	9.550	78.557	11.625	0.038	0.000	0.000	1.577	ma120300_rel_withdbg.cz12b_c32r128
0.000	0.000	0.000	0.076	9.204	80.324	10.391	0.005	0.000	0.000	1.231	ma120300_rel_withdbg.cz12c_c32r128
0.000	0.000	0.000	0.000	0.421	73.971	25.378	0.230	0.000	0.000	2.233	ma120300_rel_withdbg.cz12b_sync_c32r128
0.000	0.000	0.000	0.017	2.457	85.262	12.234	0.031	0.000	0.000	1.409	ma120300_rel_withdbg.cz12c_sync_c32r128
qp500.L4
- qp500.L4: point queries with 500 insert/s per client
- Legend for results is here.
- Each entry lists the percentage of responses that fit in that bucket (slower than max time for previous bucket, faster than min time for next bucket).
Query response time histogram
256us	1ms	4ms	16ms	64ms	256ms	1s	4s	16s	gt	max	tag
0.000	0.070	6.353	61.568	29.945	2.057	0.007	0.000	0.000	0.000	0.887	ma120300_rel_withdbg.cz12b_c32r128
0.000	0.083	7.059	62.730	29.128	0.993	0.008	nonzero	0.000	0.000	1.273	ma120300_rel_withdbg.cz12c_c32r128
nonzero	0.031	3.429	46.396	46.632	3.498	0.014	0.000	0.000	0.000	0.986	ma120300_rel_withdbg.cz12b_sync_c32r128
0.000	0.049	4.564	58.661	34.462	2.257	0.006	0.000	0.000	0.000	0.680	ma120300_rel_withdbg.cz12c_sync_c32r128
Insert response time histogram
256us	1ms	4ms	16ms	64ms	256ms	1s	4s	16s	gt	max	tag
0.000	0.000	0.000	0.000	0.036	60.456	38.521	0.988	0.000	0.000	2.144	ma120300_rel_withdbg.cz12b_c32r128
0.000	0.000	0.000	0.000	0.055	59.461	40.156	0.329	0.000	0.000	3.274	ma120300_rel_withdbg.cz12c_c32r128
0.000	0.000	0.000	0.000	nonzero	18.431	78.400	3.168	0.000	0.000	2.559	ma120300_rel_withdbg.cz12b_sync_c32r128
0.000	0.000	0.000	0.000	0.019	57.745	41.487	0.750	0.000	0.000	2.094	ma120300_rel_withdbg.cz12c_sync_c32r128
Delete response time histogram
256us	1ms	4ms	16ms	64ms	256ms	1s	4s	16s	gt	max	tag
0.000	0.000	0.000	0.000	0.041	61.290	38.041	0.628	0.000	0.000	2.079	ma120300_rel_withdbg.cz12b_c32r128
0.000	0.000	0.000	0.000	0.091	60.423	39.276	0.210	0.000	0.000	2.952	ma120300_rel_withdbg.cz12c_c32r128
0.000	0.000	0.000	0.000	0.002	37.925	59.978	2.095	0.000	0.000	2.538	ma120300_rel_withdbg.cz12b_sync_c32r128
0.000	0.000	0.000	0.001	0.020	60.796	38.769	0.413	0.000	0.000	2.012	ma120300_rel_withdbg.cz12c_sync_c32r128
qr1000.L5
- qr1000.L5: range queries with 1000 insert/s per client
- Legend for results is here.
- Each entry lists the percentage of responses that fit in that bucket (slower than max time for previous bucket, faster than min time for next bucket).
Query response time histogram
256us	1ms	4ms	16ms	64ms	256ms	1s	4s	16s	gt	max	tag
92.906	5.373	1.249	0.380	0.090	0.003	nonzero	nonzero	nonzero	0.000	4.951	ma120300_rel_withdbg.cz12b_c32r128
92.690	5.575	1.257	0.387	0.088	0.002	nonzero	nonzero	nonzero	0.000	4.320	ma120300_rel_withdbg.cz12c_c32r128
93.177	4.722	1.697	0.309	0.092	0.003	nonzero	nonzero	0.000	0.000	3.044	ma120300_rel_withdbg.cz12b_sync_c32r128
92.643	5.306	1.608	0.360	0.080	0.003	nonzero	nonzero	nonzero	0.000	4.550	ma120300_rel_withdbg.cz12c_sync_c32r128
Insert response time histogram
256us	1ms	4ms	16ms	64ms	256ms	1s	4s	16s	gt	max	tag
0.000	0.000	0.000	nonzero	0.090	48.386	50.712	0.797	0.015	0.000	5.404	ma120300_rel_withdbg.cz12b_c32r128
0.000	0.000	0.000	0.000	0.094	48.934	50.576	0.380	0.017	0.000	5.542	ma120300_rel_withdbg.cz12c_c32r128
0.000	0.000	0.000	0.000	nonzero	21.627	75.236	3.125	0.012	0.000	5.333	ma120300_rel_withdbg.cz12b_sync_c32r128
0.000	0.000	0.000	0.000	0.013	44.922	54.411	0.641	0.014	0.000	5.539	ma120300_rel_withdbg.cz12c_sync_c32r128
Delete response time histogram
256us	1ms	4ms	16ms	64ms	256ms	1s	4s	16s	gt	max	tag
0.000	0.000	0.000	0.001	0.277	49.570	49.663	0.478	0.011	0.000	5.294	ma120300_rel_withdbg.cz12b_c32r128
0.000	0.000	0.000	0.000	0.302	50.317	49.115	0.250	0.015	0.000	5.489	ma120300_rel_withdbg.cz12c_c32r128
0.000	0.000	0.000	0.000	0.001	32.086	66.276	1.628	0.009	0.000	5.253	ma120300_rel_withdbg.cz12b_sync_c32r128
0.000	0.000	0.000	0.000	0.036	46.441	53.147	0.365	0.012	0.000	5.462	ma120300_rel_withdbg.cz12c_sync_c32r128
qp1000.L6
- qp1000.L6: point queries with 1000 insert/s per client
- Legend for results is here.
- Each entry lists the percentage of responses that fit in that bucket (slower than max time for previous bucket, faster than min time for next bucket).
Query response time histogram
256us	1ms	4ms	16ms	64ms	256ms	1s	4s	16s	gt	max	tag
nonzero	0.185	12.051	78.517	9.129	0.117	nonzero	0.000	nonzero	0.000	5.360	ma120300_rel_withdbg.cz12b_c32r128
nonzero	0.197	12.393	78.727	8.597	0.085	nonzero	nonzero	0.000	0.000	1.293	ma120300_rel_withdbg.cz12c_c32r128
nonzero	0.102	7.353	72.663	19.244	0.636	0.001	nonzero	0.000	0.000	1.367	ma120300_rel_withdbg.cz12b_sync_c32r128
nonzero	0.119	8.753	81.725	9.296	0.107	0.001	nonzero	0.000	0.000	2.587	ma120300_rel_withdbg.cz12c_sync_c32r128
Insert response time histogram
256us	1ms	4ms	16ms	64ms	256ms	1s	4s	16s	gt	max	tag
0.000	0.000	0.000	0.000	0.003	9.845	88.618	1.529	0.006	0.000	6.302	ma120300_rel_withdbg.cz12b_c32r128
0.000	0.000	0.000	0.000	0.013	10.061	89.008	0.918	0.000	0.000	2.237	ma120300_rel_withdbg.cz12c_c32r128
0.000	0.000	0.000	0.000	0.002	0.071	91.477	8.451	0.000	0.000	2.774	ma120300_rel_withdbg.cz12b_sync_c32r128
0.000	0.000	0.000	0.000	0.012	3.285	95.880	0.824	0.000	0.000	3.425	ma120300_rel_withdbg.cz12c_sync_c32r128
Delete response time histogram
256us	1ms	4ms	16ms	64ms	256ms	1s	4s	16s	gt	max	tag
0.000	0.000	0.000	0.000	0.002	10.038	89.096	0.859	0.005	0.000	6.266	ma120300_rel_withdbg.cz12b_c32r128
0.000	0.000	0.000	0.000	0.008	10.226	89.211	0.555	0.000	0.000	2.189	ma120300_rel_withdbg.cz12c_c32r128
0.000	0.000	0.000	0.000	0.003	0.137	93.868	5.992	0.000	0.000	2.647	ma120300_rel_withdbg.cz12b_sync_c32r128
0.000	0.000	0.000	0.000	0.017	3.381	96.258	0.345	0.000	0.000	3.420	ma120300_rel_withdbg.cz12c_sync_c32r128