Introduction
This is a report for the insert benchmark with 30M docs and 1 client(s). It is generated by scripts (bash, awk, sed) and Tufte might not be impressed. An overview of the insert benchmark is here and a short update is here. Below, by DBMS, I mean DBMS+version.config. An example is my8020.c10b40 where my means MySQL, 8020 is version 8.0.20 and c10b40 is the name for the configuration file.
The test server has 8 AMD cores, 32G RAM and an NVMe device for the database. The benchmark was run with 1 client and there were 1 or 3 connections per client (1 for queries or inserts without rate limits, 1+1 for rate limited inserts+deletes). It uses 1 table with a table per client. It loads 30M rows per table without secondary indexes, creates 3 secondary indexes per table, then inserts 40m+10m rows per table with a delete per insert to avoid growing the table. It then does 6 read+write tests for 3600s each that do queries as fast as possible with 100,100,500,500,1000,1000 inserts/s and the same for deletes/s per client concurrent with the queries. The database is cached by Postgres. Clients and the DBMS share one server.
The tested DBMS are:
- pg1222_o2nofp.cx10a_c8r32 - Postgres 12.22 with the x10a_c8r32 config
- pg1323_o2nofp.cx10a_c8r32 - Postgres 13.23 with the x10a_c8r32 config
- pg1420_o2nofp.cx10a_c8r32 - Postgres 14.20 with the x10a_c8r32 config
- pg1515_o2nofp.cx10a_c8r32 - Postgres 15.15 with the x10a_c8r32 config
- pg1611_o2nofp.cx10a_c8r32 - Postgres 16.11 with the x10a_c8r32 config
- pg177_o2nofp.cx10a_c8r32 - Postgres 17.7 with the x10b_c8r32 config
- pg181_o2nofp.cx10b_c8r32 - Postgres 18.1 with the x10b_c8r32 config
Contents
- Summary
- l.i0: load without secondary indexes
- l.x: create secondary indexes
- l.i1: continue load after secondary indexes created with 50 inserts per transaction
- l.i2: continue load after secondary indexes created with 5 inserts per transaction
- qr100.L1: range queries with 100 insert/s per client
- qp100.L2: point queries with 100 insert/s per client
- qr500.L3: range queries with 500 insert/s per client
- qp500.L4: point queries with 500 insert/s per client
- qr1000.L5: range queries with 1000 insert/s per client
- qp1000.L6: point queries with 1000 insert/s per client
Summary
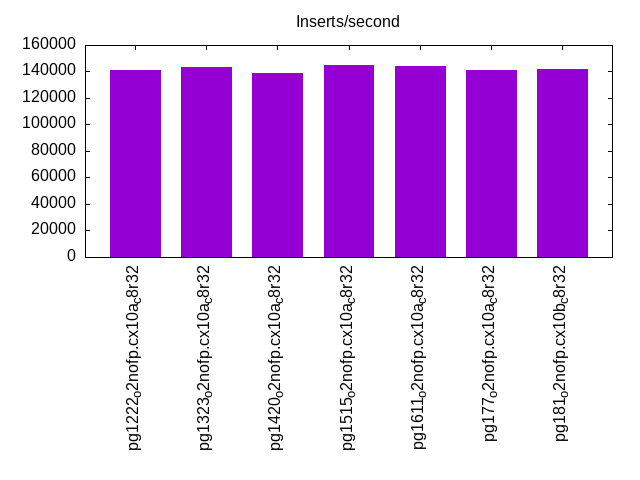
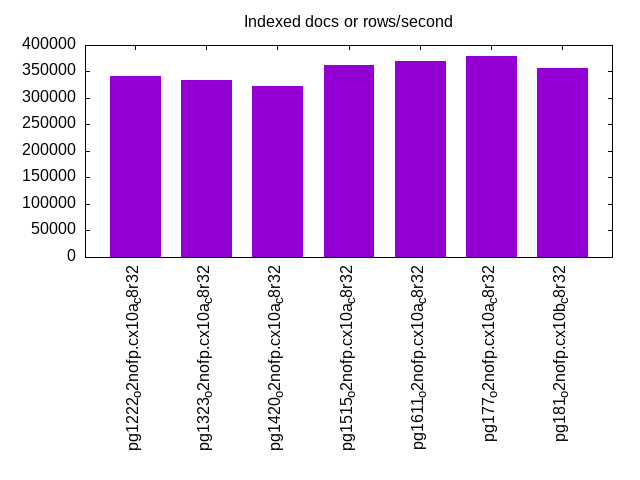
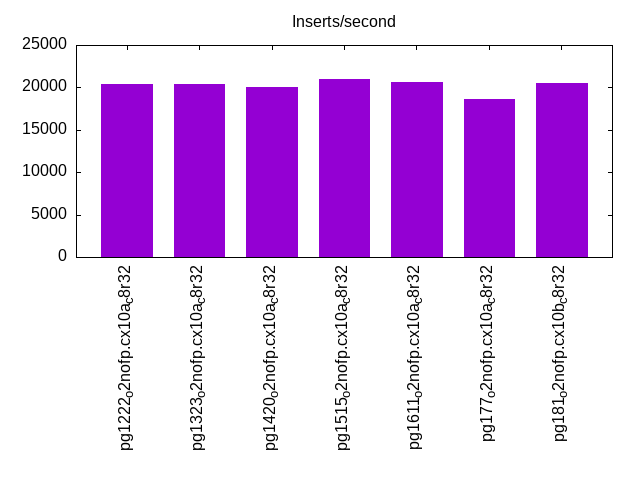
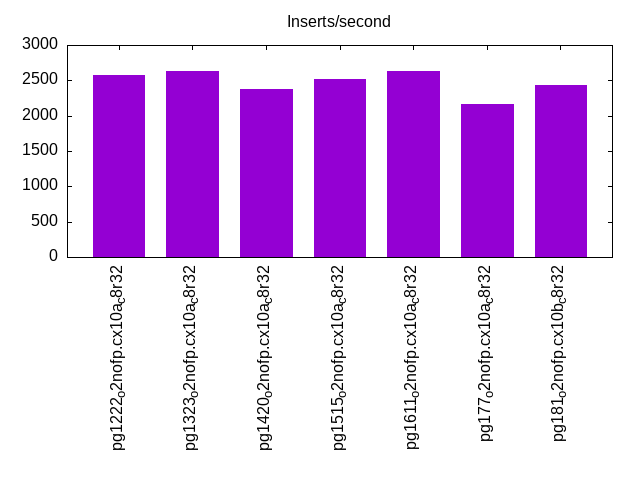
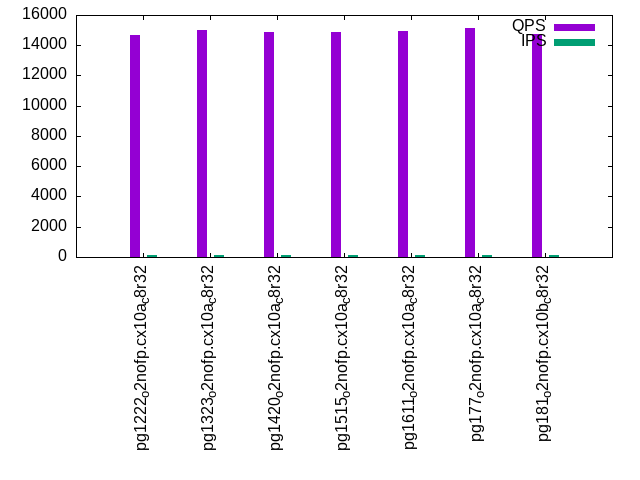
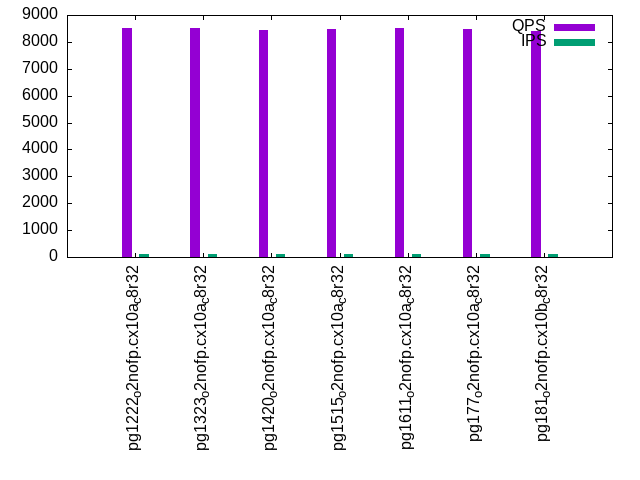
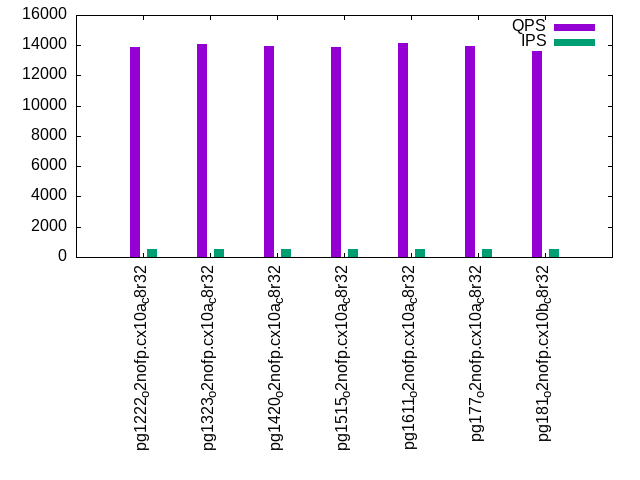
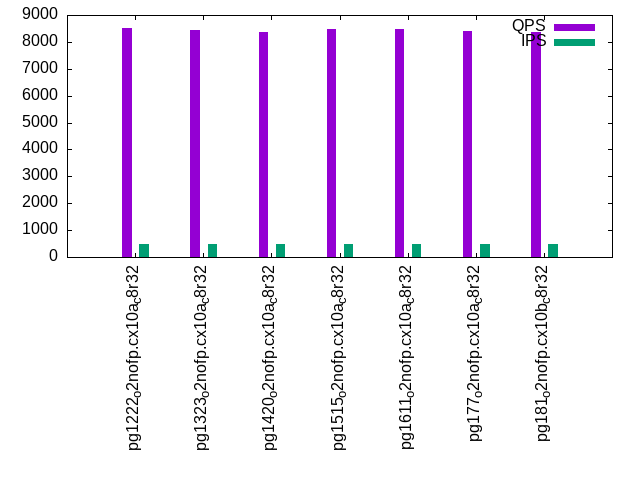
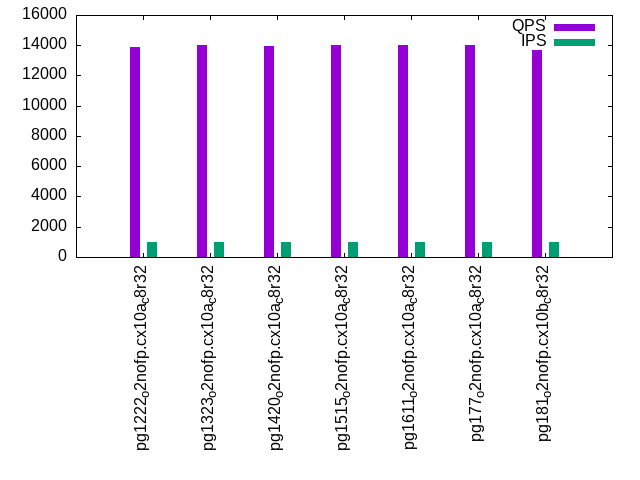
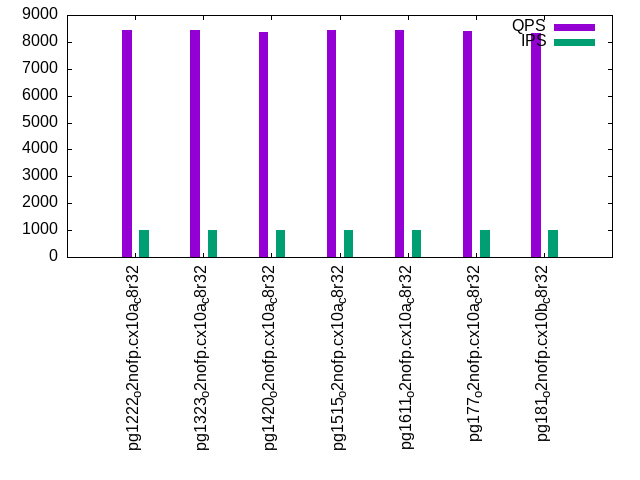
The numbers are inserts/s for l.i0, l.i1 and l.i2, indexed docs (or rows) /s for l.x and queries/s for qr100, qp100 thru qr1000, qp1000" The values are the average rate over the entire test for inserts (IPS) and queries (QPS). The range of values for IPS and QPS is split into 3 parts: bottom 25%, middle 50%, top 25%. Values in the bottom 25% have a red background, values in the top 25% have a green background and values in the middle have no color. A gray background is used for values that can be ignored because the DBMS did not sustain the target insert rate. Red backgrounds are not used when the minimum value is within 80% of the max value.
| dbms | l.i0 | l.x | l.i1 | l.i2 | qr100 | qp100 | qr500 | qp500 | qr1000 | qp1000 |
|---|---|---|---|---|---|---|---|---|---|---|
| pg1222_o2nofp.cx10a_c8r32 | 141509 | 340910 | 20418 | 2572 | 14702 | 8524 | 13901 | 8516 | 13893 | 8450 |
| pg1323_o2nofp.cx10a_c8r32 | 143541 | 333334 | 20439 | 2634 | 14977 | 8504 | 14082 | 8453 | 14007 | 8429 |
| pg1420_o2nofp.cx10a_c8r32 | 138889 | 322582 | 20070 | 2372 | 14884 | 8429 | 13950 | 8382 | 13942 | 8379 |
| pg1515_o2nofp.cx10a_c8r32 | 144928 | 361447 | 20964 | 2525 | 14897 | 8467 | 13905 | 8483 | 14006 | 8424 |
| pg1611_o2nofp.cx10a_c8r32 | 144231 | 370372 | 20682 | 2627 | 14912 | 8521 | 14133 | 8482 | 13998 | 8430 |
| pg177_o2nofp.cx10a_c8r32 | 141509 | 379748 | 18683 | 2172 | 15118 | 8465 | 13946 | 8413 | 13996 | 8393 |
| pg181_o2nofp.cx10b_c8r32 | 142180 | 357144 | 20471 | 2432 | 14736 | 8391 | 13609 | 8369 | 13673 | 8340 |
This table has relative throughput, throughput for the DBMS relative to the DBMS in the first line, using the absolute throughput from the previous table. Values less than 0.95 have a yellow background. Values greater than 1.05 have a blue background.
| dbms | l.i0 | l.x | l.i1 | l.i2 | qr100 | qp100 | qr500 | qp500 | qr1000 | qp1000 |
|---|---|---|---|---|---|---|---|---|---|---|
| pg1222_o2nofp.cx10a_c8r32 | 1.00 | 1.00 | 1.00 | 1.00 | 1.00 | 1.00 | 1.00 | 1.00 | 1.00 | 1.00 |
| pg1323_o2nofp.cx10a_c8r32 | 1.01 | 0.98 | 1.00 | 1.02 | 1.02 | 1.00 | 1.01 | 0.99 | 1.01 | 1.00 |
| pg1420_o2nofp.cx10a_c8r32 | 0.98 | 0.95 | 0.98 | 0.92 | 1.01 | 0.99 | 1.00 | 0.98 | 1.00 | 0.99 |
| pg1515_o2nofp.cx10a_c8r32 | 1.02 | 1.06 | 1.03 | 0.98 | 1.01 | 0.99 | 1.00 | 1.00 | 1.01 | 1.00 |
| pg1611_o2nofp.cx10a_c8r32 | 1.02 | 1.09 | 1.01 | 1.02 | 1.01 | 1.00 | 1.02 | 1.00 | 1.01 | 1.00 |
| pg177_o2nofp.cx10a_c8r32 | 1.00 | 1.11 | 0.92 | 0.84 | 1.03 | 0.99 | 1.00 | 0.99 | 1.01 | 0.99 |
| pg181_o2nofp.cx10b_c8r32 | 1.00 | 1.05 | 1.00 | 0.95 | 1.00 | 0.98 | 0.98 | 0.98 | 0.98 | 0.99 |
This lists the average rate of inserts/s for the tests that do inserts concurrent with queries. For such tests the query rate is listed in the table above. The read+write tests are setup so that the insert rate should match the target rate every second. Cells that are not at least 95% of the target have a red background to indicate a failure to satisfy the target.
| dbms | qr100.L1 | qp100.L2 | qr500.L3 | qp500.L4 | qr1000.L5 | qp1000.L6 |
|---|---|---|---|---|---|---|
| pg1222_o2nofp.cx10a_c8r32 | 100 | 100 | 500 | 500 | 1000 | 1000 |
| pg1323_o2nofp.cx10a_c8r32 | 100 | 100 | 500 | 500 | 999 | 999 |
| pg1420_o2nofp.cx10a_c8r32 | 100 | 100 | 500 | 500 | 1000 | 1000 |
| pg1515_o2nofp.cx10a_c8r32 | 100 | 100 | 500 | 500 | 999 | 999 |
| pg1611_o2nofp.cx10a_c8r32 | 100 | 100 | 500 | 500 | 1000 | 1000 |
| pg177_o2nofp.cx10a_c8r32 | 100 | 100 | 500 | 500 | 999 | 999 |
| pg181_o2nofp.cx10b_c8r32 | 100 | 100 | 500 | 500 | 1000 | 1000 |
| target | 100 | 100 | 500 | 500 | 1000 | 1000 |
l.i0
l.i0: load without secondary indexes. Graphs for performance per 1-second interval are here.
Average throughput:
Insert response time histogram: each cell has the percentage of responses that take <= the time in the header and max is the max response time in seconds. For the max column values in the top 25% of the range have a red background and in the bottom 25% of the range have a green background. The red background is not used when the min value is within 80% of the max value.
| dbms | 256us | 1ms | 4ms | 16ms | 64ms | 256ms | 1s | 4s | 16s | gt | max |
|---|---|---|---|---|---|---|---|---|---|---|---|
| pg1222_o2nofp.cx10a_c8r32 | 99.979 | 0.021 | nonzero | 0.004 | |||||||
| pg1323_o2nofp.cx10a_c8r32 | 99.983 | 0.017 | 0.003 | ||||||||
| pg1420_o2nofp.cx10a_c8r32 | 99.989 | 0.011 | 0.003 | ||||||||
| pg1515_o2nofp.cx10a_c8r32 | 99.985 | 0.014 | nonzero | 0.005 | |||||||
| pg1611_o2nofp.cx10a_c8r32 | 99.984 | 0.016 | nonzero | 0.008 | |||||||
| pg177_o2nofp.cx10a_c8r32 | 99.981 | 0.019 | 0.003 | ||||||||
| pg181_o2nofp.cx10b_c8r32 | 99.989 | 0.011 | 0.002 |
Performance metrics for the DBMS listed above. Some are normalized by throughput, others are not. Legend for results is here.
ips	qps	rps	rmbps	wps	wmbps	rpq	rkbpq	wpi	wkbpi	csps	cpups	cspq	cpupq	dbgb1	dbgb2	rss	maxop	p50	p99	tag
141509	0	0	0.0	528.4	59.7	0.000	0.000	0.004	0.432	17571	19.8	0.124	11	2.9	7.8	2.9	0.004	142082	140981	pg1222_o2nofp.cx10a_c8r32
143541	0	0	0.0	538.8	60.9	0.000	0.000	0.004	0.435	18282	20.7	0.127	12	2.9	7.8	2.9	0.003	144082	143180	pg1323_o2nofp.cx10a_c8r32
138889	0	0	0.0	516.6	58.4	0.000	0.000	0.004	0.431	16838	19.5	0.121	11	2.9	7.8	2.8	0.003	138883	138082	pg1420_o2nofp.cx10a_c8r32
144928	0	0	0.0	540.0	61.4	0.000	0.000	0.004	0.433	17854	20.6	0.123	11	2.9	7.8	3.0	0.005	145384	144482	pg1515_o2nofp.cx10a_c8r32
144231	0	0	0.0	537.5	61.0	0.000	0.000	0.004	0.433	17739	20.3	0.123	11	2.9	7.8	2.9	0.008	144580	143081	pg1611_o2nofp.cx10a_c8r32
141509	0	0	0.0	528.8	60.0	0.000	0.000	0.004	0.434	14737	20.0	0.104	11	2.9	7.8	2.9	0.003	142482	141582	pg177_o2nofp.cx10a_c8r32
142180	0	0	0.0	528.2	59.9	0.000	0.000	0.004	0.432	14723	20.0	0.104	11	2.9	7.8	2.9	0.002	142283	141280	pg181_o2nofp.cx10b_c8r32
Average values from iostat.
r/s	rkB/s	rrqm/s	%rrqm	r_await	rareq-s	w/s	wkB/s	wrqm/s	%wrqm	w_await	wareq-s	d/s	dkB/s	drqm/s	%drqm	d_await	dareq-s	f/s	f_await	aqu-sz	%util
0.302	1.210	0.000	0.000	0.148	3.610	531.2	61548.9	29.37	5.786	0.587	114.7	2.244	11.00	0.000	0.000	0.502	4.796	29.47	1.841	0.379	9.305		pg1222_o2nofp.cx10a_c8r32
0.300	1.200	0.000	0.000	0.092	3.600	541.8	62777.6	28.37	5.511	0.388	114.5	2.355	16.12	0.000	0.000	0.522	6.069	29.99	1.444	0.260	7.969		pg1323_o2nofp.cx10a_c8r32
0.238	0.952	0.000	0.000	0.080	3.333	519.2	60168.0	27.52	5.587	0.384	114.6	2.338	27.52	0.000	0.000	0.507	9.689	28.93	1.280	0.240	7.191		pg1420_o2nofp.cx10a_c8r32
0.305	1.220	0.000	0.000	0.160	4.000	543.8	63306.9	28.78	5.390	0.375	115.3	0.070	1.420	0.000	0.000	0.086	2.186	30.29	1.100	0.243	6.806		pg1515_o2nofp.cx10a_c8r32
0.310	1.240	0.000	0.000	0.160	3.800	541.3	62926.0	28.45	5.369	0.360	115.2	0.080	57.42	0.000	0.000	0.035	53.44	30.11	1.093	0.225	6.773		pg1611_o2nofp.cx10a_c8r32
0.307	1.229	0.000	0.000	0.117	3.610	532.4	61891.2	25.97	5.043	0.330	115.0	0.034	0.411	0.000	0.000	0.128	0.976	29.67	1.073	0.201	6.552		pg177_o2nofp.cx10a_c8r32
0.302	1.210	0.000	0.000	0.096	3.610	531.7	61830.7	25.99	5.052	0.342	115.1	0.029	0.390	0.000	0.000	0.061	0.976	29.62	1.076	0.214	6.570		pg181_o2nofp.cx10b_c8r32
l.x
l.x: create secondary indexes.
Average throughput:
Performance metrics for the DBMS listed above. Some are normalized by throughput, others are not. Legend for results is here.
ips	qps	rps	rmbps	wps	wmbps	rpq	rkbpq	wpi	wkbpi	csps	cpups	cspq	cpupq	dbgb1	dbgb2	rss	maxop	p50	p99	tag
340910	0	0	0.0	640.4	78.4	0.000	0.000	0.002	0.235	1894	12.1	0.006	3	5.8	13.3	3.0	0.002	NA	NA	pg1222_o2nofp.cx10a_c8r32
333334	0	0	0.0	622.5	76.2	0.000	0.000	0.002	0.234	1775	12.2	0.005	3	5.8	13.3	3.0	0.002	NA	NA	pg1323_o2nofp.cx10a_c8r32
322582	0	0	0.0	651.4	79.6	0.000	0.000	0.002	0.253	1921	12.2	0.006	3	5.8	13.3	3.0	0.002	NA	NA	pg1420_o2nofp.cx10a_c8r32
361447	0	0	0.0	696.3	85.5	0.000	0.000	0.002	0.242	1989	12.1	0.006	3	5.8	13.3	3.0	0.002	NA	NA	pg1515_o2nofp.cx10a_c8r32
370372	0	0	0.0	747.1	91.6	0.000	0.000	0.002	0.253	2238	12.1	0.006	3	5.8	13.3	3.1	0.002	NA	NA	pg1611_o2nofp.cx10a_c8r32
379748	0	0	0.0	645.5	79.1	0.000	0.000	0.002	0.213	1947	12.3	0.005	3	5.8	13.3	3.0	0.002	NA	NA	pg177_o2nofp.cx10a_c8r32
357144	0	0	0.0	676.4	83.0	0.000	0.000	0.002	0.238	1840	12.5	0.005	3	5.8	13.3	3.0	0.002	NA	NA	pg181_o2nofp.cx10b_c8r32
Average values from iostat.
r/s	rkB/s	rrqm/s	%rrqm	r_await	rareq-s	w/s	wkB/s	wrqm/s	%wrqm	w_await	wareq-s	d/s	dkB/s	drqm/s	%drqm	d_await	dareq-s	f/s	f_await	aqu-sz	%util
0.425	1.700	0.000	0.000	0.115	1.500	680.2	85283.3	24.46	24.65	2.474	58.40	2.263	23.60	0.000	0.000	1.824	7.879	7.513	2.009	1.251	5.612		pg1222_o2nofp.cx10a_c8r32
0.425	1.700	0.000	0.000	1.209	1.750	661.2	82902.9	24.04	19.85	2.280	65.96	2.175	11.05	0.000	0.000	1.766	5.017	7.250	1.709	1.316	5.353		pg1323_o2nofp.cx10a_c8r32
0.435	1.741	0.000	0.000	0.330	2.118	678.9	85015.7	25.95	21.96	1.965	76.89	2.506	78.35	0.000	0.000	1.726	23.29	8.118	1.954	0.823	5.620		pg1420_o2nofp.cx10a_c8r32
0.493	1.973	0.000	0.000	0.688	2.400	742.7	93350.1	25.45	17.84	3.351	86.40	0.227	82.08	0.000	0.000	0.151	68.53	8.427	1.226	1.427	5.240		pg1515_o2nofp.cx10a_c8r32
0.533	2.133	0.000	0.000	0.419	2.400	796.8	100076	27.67	18.50	3.525	86.84	0.133	2.027	0.000	0.000	0.067	2.533	9.493	1.595	1.427	5.891		pg1611_o2nofp.cx10a_c8r32
0.457	1.829	0.000	0.000	0.858	2.286	691.5	86763.2	25.06	24.13	3.710	75.95	0.071	0.286	0.000	0.000	0.309	0.857	8.586	0.999	1.067	4.996		pg177_o2nofp.cx10a_c8r32
0.493	1.973	0.000	0.000	0.743	1.867	721.4	90621.6	24.04	25.39	3.924	72.14	0.187	1.173	0.000	0.000	0.144	1.289	8.520	0.942	1.211	5.241		pg181_o2nofp.cx10b_c8r32
l.i1
l.i1: continue load after secondary indexes created with 50 inserts per transaction. Graphs for performance per 1-second interval are here.
Average throughput:
Insert response time histogram: each cell has the percentage of responses that take <= the time in the header and max is the max response time in seconds. For the max column values in the top 25% of the range have a red background and in the bottom 25% of the range have a green background. The red background is not used when the min value is within 80% of the max value.
| dbms | 256us | 1ms | 4ms | 16ms | 64ms | 256ms | 1s | 4s | 16s | gt | max |
|---|---|---|---|---|---|---|---|---|---|---|---|
| pg1222_o2nofp.cx10a_c8r32 | 46.971 | 53.019 | 0.005 | 0.005 | 0.029 | ||||||
| pg1323_o2nofp.cx10a_c8r32 | 33.383 | 66.608 | 0.004 | 0.005 | 0.035 | ||||||
| pg1420_o2nofp.cx10a_c8r32 | 41.446 | 58.553 | 0.001 | 0.013 | |||||||
| pg1515_o2nofp.cx10a_c8r32 | 32.089 | 67.897 | 0.005 | 0.009 | 0.040 | ||||||
| pg1611_o2nofp.cx10a_c8r32 | 31.139 | 68.849 | 0.005 | 0.007 | 0.031 | ||||||
| pg177_o2nofp.cx10a_c8r32 | 51.168 | 48.828 | 0.002 | 0.001 | 0.026 | ||||||
| pg181_o2nofp.cx10b_c8r32 | 37.144 | 62.852 | 0.004 | nonzero | 0.025 |
Delete response time histogram: each cell has the percentage of responses that take <= the time in the header and max is the max response time in seconds. For the max column values in the top 25% of the range have a red background and in the bottom 25% of the range have a green background. The red background is not used when the min value is within 80% of the max value.
| dbms | 256us | 1ms | 4ms | 16ms | 64ms | 256ms | 1s | 4s | 16s | gt | max |
|---|---|---|---|---|---|---|---|---|---|---|---|
| pg1222_o2nofp.cx10a_c8r32 | 24.762 | 56.847 | 18.386 | 0.005 | 0.028 | ||||||
| pg1323_o2nofp.cx10a_c8r32 | 21.750 | 66.503 | 11.743 | 0.004 | 0.035 | ||||||
| pg1420_o2nofp.cx10a_c8r32 | 20.972 | 65.556 | 13.471 | nonzero | 0.028 | ||||||
| pg1515_o2nofp.cx10a_c8r32 | 21.351 | 75.922 | 2.721 | 0.006 | 0.039 | ||||||
| pg1611_o2nofp.cx10a_c8r32 | 20.710 | 75.286 | 3.999 | 0.005 | 0.035 | ||||||
| pg177_o2nofp.cx10a_c8r32 | 20.745 | 63.159 | 16.095 | 0.001 | 0.025 | ||||||
| pg181_o2nofp.cx10b_c8r32 | 20.069 | 76.096 | 3.835 | 0.001 | 0.024 |
Performance metrics for the DBMS listed above. Some are normalized by throughput, others are not. Legend for results is here.
ips	qps	rps	rmbps	wps	wmbps	rpq	rkbpq	wpi	wkbpi	csps	cpups	cspq	cpupq	dbgb1	dbgb2	rss	maxop	p50	p99	tag
20418	0	0	0.0	251.9	27.2	0.000	0.000	0.012	1.363	10562	21.8	0.517	85	8.1	38.5	6.4	0.029	14498	8499	pg1222_o2nofp.cx10a_c8r32
20439	0	0	0.0	253.4	27.3	0.000	0.000	0.012	1.369	10637	22.2	0.520	87	8.1	38.6	6.4	0.035	14848	9949	pg1323_o2nofp.cx10a_c8r32
20070	0	0	0.0	247.7	26.7	0.000	0.000	0.012	1.360	9966	20.9	0.497	83	7.8	38.3	2.8	0.013	14398	9649	pg1420_o2nofp.cx10a_c8r32
20964	0	0	0.0	256.7	27.9	0.000	0.000	0.012	1.364	10860	20.8	0.518	79	7.8	38.4	7.6	0.040	17047	11848	pg1515_o2nofp.cx10a_c8r32
20682	0	0	0.0	253.2	27.5	0.000	0.000	0.012	1.362	10719	20.7	0.518	80	7.8	38.4	3.7	0.031	16847	11548	pg1611_o2nofp.cx10a_c8r32
18683	0	0	0.0	233.6	25.6	0.000	0.000	0.013	1.402	7927	19.7	0.424	84	7.8	38.3	3.6	0.026	15848	6199	pg177_o2nofp.cx10a_c8r32
20471	0	0	0.0	256.5	28.2	0.000	0.000	0.013	1.411	8670	20.8	0.424	81	7.8	38.2	4.3	0.025	16398	11698	pg181_o2nofp.cx10b_c8r32
Average values from iostat.
r/s	rkB/s	rrqm/s	%rrqm	r_await	rareq-s	w/s	wkB/s	wrqm/s	%wrqm	w_await	wareq-s	d/s	dkB/s	drqm/s	%drqm	d_await	dareq-s	f/s	f_await	aqu-sz	%util
0.101	0.402	0.000	0.000	0.095	1.754	251.8	27824.2	15.20	6.094	1.865	109.5	2.078	10.24	0.000	0.000	0.739	4.927	17.89	1.709	0.302	6.684		pg1222_o2nofp.cx10a_c8r32
0.102	0.406	0.000	0.000	0.087	1.795	253.3	27963.8	15.31	6.045	1.773	110.0	2.084	11.37	0.000	0.000	0.713	5.333	18.17	1.555	0.320	6.651		pg1323_o2nofp.cx10a_c8r32
0.104	0.417	0.000	0.000	0.091	1.814	247.6	27279.1	13.94	5.795	1.795	110.2	2.082	12.08	0.000	0.000	0.749	5.537	18.16	1.451	0.317	6.534		pg1420_o2nofp.cx10a_c8r32
0.108	0.432	0.000	0.000	0.066	1.853	256.6	28583.5	12.39	4.784	1.663	112.0	0.006	0.040	0.000	0.000	0.019	0.105	18.39	1.162	0.305	5.837		pg1515_o2nofp.cx10a_c8r32
0.102	0.409	0.000	0.000	0.068	1.777	253.1	28154.7	12.24	4.779	1.735	111.9	0.006	0.023	0.000	0.000	0.011	0.062	18.27	1.133	0.311	5.962		pg1611_o2nofp.cx10a_c8r32
0.097	0.390	0.000	0.000	0.437	1.705	227.8	25453.4	10.41	4.453	2.293	112.0	0.006	0.088	0.000	0.000	0.017	0.347	15.26	1.195	0.292	5.239		pg177_o2nofp.cx10a_c8r32
0.106	0.424	0.000	0.000	0.066	1.707	256.4	28869.1	11.66	4.629	1.774	113.4	0.012	4.409	0.000	0.000	0.022	11.02	17.22	1.194	0.315	5.909		pg181_o2nofp.cx10b_c8r32
l.i2
l.i2: continue load after secondary indexes created with 5 inserts per transaction. Graphs for performance per 1-second interval are here.
Average throughput:
Insert response time histogram: each cell has the percentage of responses that take <= the time in the header and max is the max response time in seconds. For the max column values in the top 25% of the range have a red background and in the bottom 25% of the range have a green background. The red background is not used when the min value is within 80% of the max value.
| dbms | 256us | 1ms | 4ms | 16ms | 64ms | 256ms | 1s | 4s | 16s | gt | max |
|---|---|---|---|---|---|---|---|---|---|---|---|
| pg1222_o2nofp.cx10a_c8r32 | 50.816 | 49.183 | 0.001 | nonzero | nonzero | 0.036 | |||||
| pg1323_o2nofp.cx10a_c8r32 | 50.100 | 49.900 | nonzero | nonzero | 0.007 | ||||||
| pg1420_o2nofp.cx10a_c8r32 | 41.043 | 58.956 | nonzero | nonzero | 0.009 | ||||||
| pg1515_o2nofp.cx10a_c8r32 | 45.707 | 54.293 | nonzero | nonzero | 0.007 | ||||||
| pg1611_o2nofp.cx10a_c8r32 | 49.617 | 50.383 | nonzero | 0.003 | |||||||
| pg177_o2nofp.cx10a_c8r32 | 52.887 | 47.112 | nonzero | nonzero | 0.009 | ||||||
| pg181_o2nofp.cx10b_c8r32 | 43.297 | 56.702 | nonzero | nonzero | 0.009 |
Delete response time histogram: each cell has the percentage of responses that take <= the time in the header and max is the max response time in seconds. For the max column values in the top 25% of the range have a red background and in the bottom 25% of the range have a green background. The red background is not used when the min value is within 80% of the max value.
| dbms | 256us | 1ms | 4ms | 16ms | 64ms | 256ms | 1s | 4s | 16s | gt | max |
|---|---|---|---|---|---|---|---|---|---|---|---|
| pg1222_o2nofp.cx10a_c8r32 | 1.487 | 31.014 | 63.272 | 4.227 | nonzero | 0.037 | |||||
| pg1323_o2nofp.cx10a_c8r32 | 1.169 | 28.074 | 70.726 | 0.031 | 0.015 | ||||||
| pg1420_o2nofp.cx10a_c8r32 | 1.142 | 26.188 | 71.345 | 1.325 | 0.013 | ||||||
| pg1515_o2nofp.cx10a_c8r32 | 1.262 | 26.013 | 72.712 | 0.013 | 0.015 | ||||||
| pg1611_o2nofp.cx10a_c8r32 | 0.894 | 20.143 | 78.947 | 0.017 | 0.014 | ||||||
| pg177_o2nofp.cx10a_c8r32 | 1.191 | 28.452 | 52.467 | 17.890 | 0.015 | ||||||
| pg181_o2nofp.cx10b_c8r32 | 0.768 | 21.115 | 78.101 | 0.016 | 0.007 |
Performance metrics for the DBMS listed above. Some are normalized by throughput, others are not. Legend for results is here.
ips	qps	rps	rmbps	wps	wmbps	rpq	rkbpq	wpi	wkbpi	csps	cpups	cspq	cpupq	dbgb1	dbgb2	rss	maxop	p50	p99	tag
2572	0	0	0.0	61.4	5.8	0.000	0.000	0.024	2.290	12490	15.4	4.856	479	8.1	40.2	6.6	0.036	1760	1020	pg1222_o2nofp.cx10a_c8r32
2634	0	0	0.0	62.6	5.9	0.000	0.000	0.024	2.300	12828	15.5	4.870	471	8.2	40.3	4.7	0.007	1930	1310	pg1323_o2nofp.cx10a_c8r32
2372	0	0	0.0	57.0	5.3	0.000	0.000	0.024	2.288	11134	15.0	4.694	506	7.9	39.7	0.9	0.009	1755	1130	pg1420_o2nofp.cx10a_c8r32
2525	0	0	0.0	58.0	5.6	0.000	0.000	0.023	2.271	11780	15.1	4.666	478	7.9	40.2	0.3	0.007	1940	1330	pg1515_o2nofp.cx10a_c8r32
2627	0	0	0.0	58.9	5.7	0.000	0.000	0.022	2.230	12247	15.3	4.663	466	7.9	40.2	5.3	0.003	2145	1335	pg1611_o2nofp.cx10a_c8r32
2172	0	0	0.0	52.3	5.1	0.000	0.000	0.024	2.385	8565	14.7	3.943	541	7.9	39.9	0.6	0.009	1355	710	pg177_o2nofp.cx10a_c8r32
2432	0	0	0.0	55.1	5.4	0.000	0.000	0.023	2.277	9546	15.1	3.925	497	7.9	39.8	0.4	0.009	1970	1355	pg181_o2nofp.cx10b_c8r32
Average values from iostat.
r/s	rkB/s	rrqm/s	%rrqm	r_await	rareq-s	w/s	wkB/s	wrqm/s	%wrqm	w_await	wareq-s	d/s	dkB/s	drqm/s	%drqm	d_await	dareq-s	f/s	f_await	aqu-sz	%util
0.003	0.013	0.000	0.000	0.003	0.062	60.97	5840.4	7.405	9.658	1.408	91.36	2.053	16.68	0.000	0.000	0.608	6.131	8.064	1.702	0.070	3.306		pg1222_o2nofp.cx10a_c8r32
0.004	0.017	0.000	0.000	0.003	0.079	62.66	6063.2	7.472	9.077	1.242	93.42	2.052	14.45	0.000	0.000	0.601	5.170	8.043	1.450	0.063	3.023		pg1323_o2nofp.cx10a_c8r32
0.003	0.013	0.000	0.000	0.001	0.057	57.04	5432.2	6.147	7.767	1.236	92.83	2.044	14.20	0.000	0.000	0.631	5.249	7.670	1.459	0.065	2.972		pg1420_o2nofp.cx10a_c8r32
0.004	0.017	0.000	0.000	0.003	0.076	58.01	5738.3	4.431	4.127	1.570	95.14	0.030	4.582	0.000	0.000	0.002	0.400	8.054	1.195	0.063	2.922		pg1515_o2nofp.cx10a_c8r32
0.004	0.015	0.000	0.000	0.014	0.074	58.41	5796.1	4.491	3.648	1.278	98.60	0.033	4.834	0.000	0.000	0.002	0.408	7.940	1.166	0.062	2.653		pg1611_o2nofp.cx10a_c8r32
0.003	0.011	0.000	0.000	0.011	0.057	52.32	5182.0	3.248	2.834	1.310	96.34	0.007	1.452	0.000	0.000	0.003	0.588	7.102	1.227	0.055	2.458		pg177_o2nofp.cx10a_c8r32
0.003	0.012	0.000	0.000	0.012	0.058	55.13	5542.1	3.431	3.024	1.298	99.07	0.008	1.590	0.000	0.000	0.003	0.511	7.274	1.199	0.060	2.434		pg181_o2nofp.cx10b_c8r32
qr100.L1
qr100.L1: range queries with 100 insert/s per client. Graphs for performance per 1-second interval are here.
Average throughput:
Query response time histogram: each cell has the percentage of responses that take <= the time in the header and max is the max response time in seconds. For max values in the top 25% of the range have a red background and in the bottom 25% of the range have a green background. The red background is not used when the min value is within 80% of the max value.
| dbms | 256us | 1ms | 4ms | 16ms | 64ms | 256ms | 1s | 4s | 16s | gt | max |
|---|---|---|---|---|---|---|---|---|---|---|---|
| pg1222_o2nofp.cx10a_c8r32 | 100.000 | nonzero | nonzero | 0.001 | |||||||
| pg1323_o2nofp.cx10a_c8r32 | 100.000 | nonzero | 0.001 | ||||||||
| pg1420_o2nofp.cx10a_c8r32 | 100.000 | nonzero | nonzero | nonzero | 0.010 | ||||||
| pg1515_o2nofp.cx10a_c8r32 | 100.000 | nonzero | 0.001 | ||||||||
| pg1611_o2nofp.cx10a_c8r32 | 100.000 | nonzero | nonzero | 0.001 | |||||||
| pg177_o2nofp.cx10a_c8r32 | 100.000 | nonzero | 0.001 | ||||||||
| pg181_o2nofp.cx10b_c8r32 | 100.000 | nonzero | nonzero | 0.001 |
Insert response time histogram: each cell has the percentage of responses that take <= the time in the header and max is the max response time in seconds. For max values in the top 25% of the range have a red background and in the bottom 25% of the range have a green background. The red background is not used when the min value is within 80% of the max value.
| dbms | 256us | 1ms | 4ms | 16ms | 64ms | 256ms | 1s | 4s | 16s | gt | max |
|---|---|---|---|---|---|---|---|---|---|---|---|
| pg1222_o2nofp.cx10a_c8r32 | 99.972 | 0.028 | 0.006 | ||||||||
| pg1323_o2nofp.cx10a_c8r32 | 99.972 | 0.028 | 0.006 | ||||||||
| pg1420_o2nofp.cx10a_c8r32 | 99.944 | 0.056 | 0.006 | ||||||||
| pg1515_o2nofp.cx10a_c8r32 | 0.028 | 99.917 | 0.056 | 0.006 | |||||||
| pg1611_o2nofp.cx10a_c8r32 | 0.083 | 99.861 | 0.056 | 0.006 | |||||||
| pg177_o2nofp.cx10a_c8r32 | 0.083 | 99.861 | 0.056 | 0.006 | |||||||
| pg181_o2nofp.cx10b_c8r32 | 0.111 | 99.833 | 0.056 | 0.006 |
Delete response time histogram: each cell has the percentage of responses that take <= the time in the header and max is the max response time in seconds. For max values in the top 25% of the range have a red background and in the bottom 25% of the range have a green background. The red background is not used when the min value is within 80% of the max value.
| dbms | 256us | 1ms | 4ms | 16ms | 64ms | 256ms | 1s | 4s | 16s | gt | max |
|---|---|---|---|---|---|---|---|---|---|---|---|
| pg1222_o2nofp.cx10a_c8r32 | 49.806 | 50.194 | 0.002 | ||||||||
| pg1323_o2nofp.cx10a_c8r32 | 55.611 | 44.389 | 0.002 | ||||||||
| pg1420_o2nofp.cx10a_c8r32 | 60.417 | 39.583 | 0.002 | ||||||||
| pg1515_o2nofp.cx10a_c8r32 | 51.694 | 48.306 | 0.002 | ||||||||
| pg1611_o2nofp.cx10a_c8r32 | 63.194 | 36.806 | 0.002 | ||||||||
| pg177_o2nofp.cx10a_c8r32 | 49.528 | 50.472 | 0.002 | ||||||||
| pg181_o2nofp.cx10b_c8r32 | 55.472 | 44.528 | 0.002 |
Performance metrics for the DBMS listed above. Some are normalized by throughput, others are not. Legend for results is here.
ips	qps	rps	rmbps	wps	wmbps	rpq	rkbpq	wpi	wkbpi	csps	cpups	cspq	cpupq	dbgb1	dbgb2	rss	maxop	p50	p99	tag
100	14702	0	0.0	14.9	0.8	0.000	0.000	0.149	7.746	56201	11.3	3.823	61	8.1	40.2	0.1	0.001	14686	14542	pg1222_o2nofp.cx10a_c8r32
100	14977	0	0.0	15.0	0.8	0.000	0.000	0.150	7.781	57258	12.5	3.823	67	8.2	40.3	0.1	0.001	14974	14782	pg1323_o2nofp.cx10a_c8r32
100	14884	0	0.0	15.4	0.8	0.000	0.000	0.154	7.928	56892	12.4	3.822	67	7.9	39.7	0.1	0.010	14894	14686	pg1420_o2nofp.cx10a_c8r32
100	14897	0	0.0	13.1	0.8	0.000	0.000	0.131	7.715	56891	12.4	3.819	67	7.9	40.1	0.1	0.001	14894	14686	pg1515_o2nofp.cx10a_c8r32
100	14912	0	0.0	13.1	0.8	0.000	0.000	0.131	7.708	56978	12.4	3.821	67	7.9	40.2	0.1	0.001	14926	14686	pg1611_o2nofp.cx10a_c8r32
100	15118	0	0.0	12.4	0.8	0.000	0.000	0.124	7.750	57721	12.4	3.818	66	7.9	39.9	0.1	0.001	15118	14894	pg177_o2nofp.cx10a_c8r32
100	14736	0	0.0	12.4	0.8	0.000	0.000	0.124	7.737	56290	12.4	3.820	67	7.9	39.8	0.1	0.001	14750	14510	pg181_o2nofp.cx10b_c8r32
Average values from iostat.
r/s	rkB/s	rrqm/s	%rrqm	r_await	rareq-s	w/s	wkB/s	wrqm/s	%wrqm	w_await	wareq-s	d/s	dkB/s	drqm/s	%drqm	d_await	dareq-s	f/s	f_await	aqu-sz	%util
0.000	0.000	0.000	0.000	0.000	0.000	14.87	772.8	2.788	16.78	5.606	52.49	2.000	9.598	0.000	0.000	1.679	4.799	3.433	2.170	0.093	3.928		pg1222_o2nofp.cx10a_c8r32
0.000	0.000	0.000	0.000	0.000	0.000	15.02	776.4	2.879	17.30	5.364	52.42	2.000	9.604	0.000	0.000	1.586	4.802	3.460	1.877	0.089	3.777		pg1323_o2nofp.cx10a_c8r32
0.000	0.000	0.000	0.000	0.000	0.000	15.35	790.0	2.514	15.17	5.390	52.44	2.001	10.01	0.000	0.000	1.819	5.002	3.477	1.903	0.091	3.822		pg1420_o2nofp.cx10a_c8r32
0.000	0.000	0.000	0.000	0.000	0.000	13.09	769.7	0.261	2.085	6.241	60.58	0.001	0.002	0.000	0.000	0.003	0.011	3.446	1.548	0.085	3.570		pg1515_o2nofp.cx10a_c8r32
0.000	0.000	0.000	0.000	0.000	0.000	13.10	768.2	0.250	1.986	6.258	60.62	0.001	0.002	0.000	0.000	0.000	0.011	3.452	1.478	0.085	3.512		pg1611_o2nofp.cx10a_c8r32
0.000	0.000	0.000	0.000	0.000	0.000	12.39	773.1	0.241	2.083	6.645	65.61	0.001	0.002	0.000	0.000	0.000	0.011	2.835	1.520	0.084	2.992		pg177_o2nofp.cx10a_c8r32
0.000	0.000	0.000	0.000	0.000	0.000	12.39	770.9	0.246	2.080	6.709	65.40	0.001	0.002	0.000	0.000	0.000	0.011	2.831	1.476	0.085	2.959		pg181_o2nofp.cx10b_c8r32
qp100.L2
qp100.L2: point queries with 100 insert/s per client. Graphs for performance per 1-second interval are here.
Average throughput:
Query response time histogram: each cell has the percentage of responses that take <= the time in the header and max is the max response time in seconds. For max values in the top 25% of the range have a red background and in the bottom 25% of the range have a green background. The red background is not used when the min value is within 80% of the max value.
| dbms | 256us | 1ms | 4ms | 16ms | 64ms | 256ms | 1s | 4s | 16s | gt | max |
|---|---|---|---|---|---|---|---|---|---|---|---|
| pg1222_o2nofp.cx10a_c8r32 | 99.999 | 0.001 | nonzero | 0.002 | |||||||
| pg1323_o2nofp.cx10a_c8r32 | 99.999 | 0.001 | 0.001 | ||||||||
| pg1420_o2nofp.cx10a_c8r32 | 99.998 | 0.002 | 0.001 | ||||||||
| pg1515_o2nofp.cx10a_c8r32 | 99.999 | 0.001 | nonzero | 0.001 | |||||||
| pg1611_o2nofp.cx10a_c8r32 | 99.999 | 0.001 | 0.001 | ||||||||
| pg177_o2nofp.cx10a_c8r32 | 99.999 | 0.001 | nonzero | 0.001 | |||||||
| pg181_o2nofp.cx10b_c8r32 | 99.999 | 0.001 | nonzero | 0.001 |
Insert response time histogram: each cell has the percentage of responses that take <= the time in the header and max is the max response time in seconds. For max values in the top 25% of the range have a red background and in the bottom 25% of the range have a green background. The red background is not used when the min value is within 80% of the max value.
| dbms | 256us | 1ms | 4ms | 16ms | 64ms | 256ms | 1s | 4s | 16s | gt | max |
|---|---|---|---|---|---|---|---|---|---|---|---|
| pg1222_o2nofp.cx10a_c8r32 | 99.944 | 0.056 | 0.006 | ||||||||
| pg1323_o2nofp.cx10a_c8r32 | 99.972 | 0.028 | 0.005 | ||||||||
| pg1420_o2nofp.cx10a_c8r32 | 99.972 | 0.028 | 0.006 | ||||||||
| pg1515_o2nofp.cx10a_c8r32 | 99.944 | 0.056 | 0.006 | ||||||||
| pg1611_o2nofp.cx10a_c8r32 | 99.944 | 0.056 | 0.006 | ||||||||
| pg177_o2nofp.cx10a_c8r32 | 99.944 | 0.056 | 0.005 | ||||||||
| pg181_o2nofp.cx10b_c8r32 | 99.972 | 0.028 | 0.006 |
Delete response time histogram: each cell has the percentage of responses that take <= the time in the header and max is the max response time in seconds. For max values in the top 25% of the range have a red background and in the bottom 25% of the range have a green background. The red background is not used when the min value is within 80% of the max value.
| dbms | 256us | 1ms | 4ms | 16ms | 64ms | 256ms | 1s | 4s | 16s | gt | max |
|---|---|---|---|---|---|---|---|---|---|---|---|
| pg1222_o2nofp.cx10a_c8r32 | 1.528 | 98.444 | 0.028 | 0.005 | |||||||
| pg1323_o2nofp.cx10a_c8r32 | 0.389 | 99.583 | 0.028 | 0.005 | |||||||
| pg1420_o2nofp.cx10a_c8r32 | 4.444 | 95.528 | 0.028 | 0.005 | |||||||
| pg1515_o2nofp.cx10a_c8r32 | 1.222 | 98.750 | 0.028 | 0.004 | |||||||
| pg1611_o2nofp.cx10a_c8r32 | 3.250 | 96.722 | 0.028 | 0.005 | |||||||
| pg177_o2nofp.cx10a_c8r32 | 0.417 | 99.556 | 0.028 | 0.004 | |||||||
| pg181_o2nofp.cx10b_c8r32 | 0.556 | 99.417 | 0.028 | 0.005 |
Performance metrics for the DBMS listed above. Some are normalized by throughput, others are not. Legend for results is here.
ips	qps	rps	rmbps	wps	wmbps	rpq	rkbpq	wpi	wkbpi	csps	cpups	cspq	cpupq	dbgb1	dbgb2	rss	maxop	p50	p99	tag
100	8524	0	0.0	63.4	1.7	0.000	0.000	0.634	17.041	33064	11.1	3.879	104	8.1	40.2	0.2	0.002	8527	8463	pg1222_o2nofp.cx10a_c8r32
100	8504	0	0.0	63.2	1.7	0.000	0.000	0.633	17.068	33023	12.4	3.883	117	8.2	40.3	0.2	0.001	8511	8431	pg1323_o2nofp.cx10a_c8r32
100	8429	0	0.0	62.3	1.7	0.000	0.000	0.624	17.016	32642	12.4	3.873	118	7.9	39.7	0.1	0.001	8431	8383	pg1420_o2nofp.cx10a_c8r32
100	8467	0	0.0	60.0	1.6	0.000	0.000	0.600	16.798	32735	12.4	3.866	117	7.9	40.1	0.1	0.001	8463	8399	pg1515_o2nofp.cx10a_c8r32
100	8521	0	0.0	60.0	1.6	0.000	0.000	0.600	16.813	32961	12.4	3.868	116	7.9	40.2	0.1	0.001	8527	8447	pg1611_o2nofp.cx10a_c8r32
100	8465	0	0.0	58.7	1.6	0.000	0.000	0.587	16.771	32714	12.4	3.865	117	7.9	39.9	0.1	0.001	8479	8383	pg177_o2nofp.cx10a_c8r32
100	8391	0	0.0	58.9	1.6	0.000	0.000	0.589	16.771	32428	12.4	3.865	118	7.9	39.8	0.1	0.001	8383	8335	pg181_o2nofp.cx10b_c8r32
Average values from iostat.
r/s	rkB/s	rrqm/s	%rrqm	r_await	rareq-s	w/s	wkB/s	wrqm/s	%wrqm	w_await	wareq-s	d/s	dkB/s	drqm/s	%drqm	d_await	dareq-s	f/s	f_await	aqu-sz	%util
0.000	0.000	0.000	0.000	0.000	0.000	63.31	1697.5	3.271	6.338	4.736	29.22	2.001	9.600	0.000	0.000	0.934	4.799	3.418	1.904	0.312	4.371		pg1222_o2nofp.cx10a_c8r32
0.000	0.000	0.000	0.000	0.000	0.000	63.14	1698.6	3.315	6.280	4.759	29.45	2.001	9.607	0.000	0.000	1.290	4.802	3.418	1.712	0.309	4.376		pg1323_o2nofp.cx10a_c8r32
0.000	0.000	0.000	0.000	0.000	0.000	62.28	1693.4	2.995	5.790	4.730	29.75	1.998	9.988	0.000	0.000	1.185	4.970	3.419	1.671	0.305	4.344		pg1420_o2nofp.cx10a_c8r32
0.000	0.000	0.000	0.000	0.000	0.000	59.92	1673.4	0.648	1.339	5.177	31.33	0.001	0.002	0.000	0.000	0.000	0.011	3.421	1.375	0.312	4.168		pg1515_o2nofp.cx10a_c8r32
0.000	0.000	0.000	0.000	0.000	0.000	59.89	1672.9	0.627	1.196	5.216	31.38	0.001	0.002	0.000	0.000	0.003	0.011	3.417	1.321	0.316	4.215		pg1611_o2nofp.cx10a_c8r32
0.000	0.000	0.000	0.000	0.000	0.000	58.60	1670.7	0.655	1.342	5.896	32.74	0.001	0.002	0.000	0.000	0.003	0.011	2.599	1.408	0.349	4.057		pg177_o2nofp.cx10a_c8r32
0.000	0.000	0.000	0.000	0.000	0.000	58.86	1670.8	0.641	1.299	5.924	32.29	0.001	0.002	0.000	0.000	0.000	0.011	2.598	1.361	0.352	4.017		pg181_o2nofp.cx10b_c8r32
qr500.L3
qr500.L3: range queries with 500 insert/s per client. Graphs for performance per 1-second interval are here.
Average throughput:
Query response time histogram: each cell has the percentage of responses that take <= the time in the header and max is the max response time in seconds. For max values in the top 25% of the range have a red background and in the bottom 25% of the range have a green background. The red background is not used when the min value is within 80% of the max value.
| dbms | 256us | 1ms | 4ms | 16ms | 64ms | 256ms | 1s | 4s | 16s | gt | max |
|---|---|---|---|---|---|---|---|---|---|---|---|
| pg1222_o2nofp.cx10a_c8r32 | 99.999 | 0.001 | nonzero | 0.002 | |||||||
| pg1323_o2nofp.cx10a_c8r32 | 100.000 | nonzero | nonzero | 0.002 | |||||||
| pg1420_o2nofp.cx10a_c8r32 | 99.999 | 0.001 | nonzero | 0.002 | |||||||
| pg1515_o2nofp.cx10a_c8r32 | 99.998 | 0.002 | nonzero | 0.003 | |||||||
| pg1611_o2nofp.cx10a_c8r32 | 99.999 | 0.001 | nonzero | 0.004 | |||||||
| pg177_o2nofp.cx10a_c8r32 | 100.000 | nonzero | nonzero | nonzero | 0.007 | ||||||
| pg181_o2nofp.cx10b_c8r32 | 99.999 | 0.001 | nonzero | 0.003 |
Insert response time histogram: each cell has the percentage of responses that take <= the time in the header and max is the max response time in seconds. For max values in the top 25% of the range have a red background and in the bottom 25% of the range have a green background. The red background is not used when the min value is within 80% of the max value.
| dbms | 256us | 1ms | 4ms | 16ms | 64ms | 256ms | 1s | 4s | 16s | gt | max |
|---|---|---|---|---|---|---|---|---|---|---|---|
| pg1222_o2nofp.cx10a_c8r32 | 22.633 | 77.328 | 0.039 | 0.010 | |||||||
| pg1323_o2nofp.cx10a_c8r32 | 24.278 | 75.672 | 0.050 | 0.009 | |||||||
| pg1420_o2nofp.cx10a_c8r32 | 27.833 | 72.133 | 0.033 | 0.009 | |||||||
| pg1515_o2nofp.cx10a_c8r32 | 24.922 | 74.956 | 0.122 | 0.010 | |||||||
| pg1611_o2nofp.cx10a_c8r32 | 25.756 | 74.072 | 0.172 | 0.010 | |||||||
| pg177_o2nofp.cx10a_c8r32 | 18.283 | 81.461 | 0.256 | 0.010 | |||||||
| pg181_o2nofp.cx10b_c8r32 | 23.850 | 76.117 | 0.033 | 0.009 |
Delete response time histogram: each cell has the percentage of responses that take <= the time in the header and max is the max response time in seconds. For max values in the top 25% of the range have a red background and in the bottom 25% of the range have a green background. The red background is not used when the min value is within 80% of the max value.
| dbms | 256us | 1ms | 4ms | 16ms | 64ms | 256ms | 1s | 4s | 16s | gt | max |
|---|---|---|---|---|---|---|---|---|---|---|---|
| pg1222_o2nofp.cx10a_c8r32 | 1.939 | 97.222 | 0.839 | 0.006 | |||||||
| pg1323_o2nofp.cx10a_c8r32 | 0.206 | 97.911 | 1.883 | 0.005 | |||||||
| pg1420_o2nofp.cx10a_c8r32 | 0.883 | 96.833 | 2.283 | 0.006 | |||||||
| pg1515_o2nofp.cx10a_c8r32 | 0.089 | 97.717 | 2.194 | 0.007 | |||||||
| pg1611_o2nofp.cx10a_c8r32 | 0.033 | 97.061 | 2.906 | 0.010 | |||||||
| pg177_o2nofp.cx10a_c8r32 | 93.561 | 6.439 | 0.011 | ||||||||
| pg181_o2nofp.cx10b_c8r32 | 0.206 | 96.039 | 3.756 | 0.006 |
Performance metrics for the DBMS listed above. Some are normalized by throughput, others are not. Legend for results is here.
ips	qps	rps	rmbps	wps	wmbps	rpq	rkbpq	wpi	wkbpi	csps	cpups	cspq	cpupq	dbgb1	dbgb2	rss	maxop	p50	p99	tag
500	13901	0	0.0	71.0	2.2	0.000	0.000	0.142	4.599	53379	11.1	3.840	64	8.2	39.0	0.4	0.002	13902	13342	pg1222_o2nofp.cx10a_c8r32
500	14082	0	0.0	70.5	2.2	0.000	0.000	0.141	4.606	54114	13.0	3.843	74	8.2	39.1	0.4	0.002	14078	13486	pg1323_o2nofp.cx10a_c8r32
500	13950	0	0.0	69.8	2.3	0.000	0.000	0.140	4.631	53509	13.0	3.836	75	7.9	38.5	0.3	0.002	13950	13406	pg1420_o2nofp.cx10a_c8r32
500	13905	0	0.0	67.8	2.3	0.000	0.000	0.136	4.625	53275	12.9	3.831	74	8.0	39.0	0.3	0.003	13902	13326	pg1515_o2nofp.cx10a_c8r32
500	14133	0	0.0	67.8	2.3	0.000	0.000	0.136	4.631	54175	13.0	3.833	74	8.0	39.1	4.0	0.004	14126	13566	pg1611_o2nofp.cx10a_c8r32
500	13946	0	0.0	67.4	2.3	0.000	0.000	0.135	4.642	53419	12.9	3.830	74	7.9	38.8	0.3	0.007	13950	13326	pg177_o2nofp.cx10a_c8r32
500	13609	0	0.0	67.2	2.2	0.000	0.000	0.134	4.584	52099	12.8	3.828	75	7.9	38.6	0.3	0.003	13598	12990	pg181_o2nofp.cx10b_c8r32
Average values from iostat.
r/s	rkB/s	rrqm/s	%rrqm	r_await	rareq-s	w/s	wkB/s	wrqm/s	%wrqm	w_await	wareq-s	d/s	dkB/s	drqm/s	%drqm	d_await	dareq-s	f/s	f_await	aqu-sz	%util
0.000	0.000	0.000	0.000	0.000	0.000	70.86	2285.8	4.071	6.612	3.964	33.00	2.044	683.7	0.000	0.000	1.157	42.73	4.265	1.919	0.285	4.430		pg1222_o2nofp.cx10a_c8r32
0.001	0.002	0.000	0.000	0.000	0.011	70.43	2288.2	3.975	6.593	4.098	33.15	2.045	685.0	0.000	0.000	1.089	44.31	4.247	1.705	0.294	4.334		pg1323_o2nofp.cx10a_c8r32
0.001	0.002	0.000	0.000	0.000	0.011	69.69	2300.6	3.490	5.805	4.077	33.70	2.045	694.6	0.000	0.000	1.146	43.02	4.244	1.713	0.288	4.353		pg1420_o2nofp.cx10a_c8r32
0.000	0.000	0.000	0.000	0.000	0.000	67.70	2298.7	1.595	2.895	4.412	35.37	0.046	684.6	0.000	0.000	0.005	41.75	4.241	1.423	0.296	4.159		pg1515_o2nofp.cx10a_c8r32
0.000	0.000	0.000	0.000	0.000	0.000	67.70	2300.7	1.554	2.922	4.440	35.41	0.045	679.7	0.000	0.000	0.004	87.73	4.236	1.419	0.299	4.190		pg1611_o2nofp.cx10a_c8r32
0.000	0.000	0.000	0.000	0.000	0.000	67.36	2306.6	1.452	2.623	4.678	35.94	0.044	684.6	0.000	0.000	0.005	43.89	3.940	1.409	0.313	4.193		pg177_o2nofp.cx10a_c8r32
0.000	0.000	0.000	0.000	0.000	0.000	67.12	2278.7	1.201	1.948	4.728	35.33	0.043	684.6	0.000	0.000	0.002	44.46	3.918	1.399	0.314	4.138		pg181_o2nofp.cx10b_c8r32
qp500.L4
qp500.L4: point queries with 500 insert/s per client. Graphs for performance per 1-second interval are here.
Average throughput:
Query response time histogram: each cell has the percentage of responses that take <= the time in the header and max is the max response time in seconds. For max values in the top 25% of the range have a red background and in the bottom 25% of the range have a green background. The red background is not used when the min value is within 80% of the max value.
| dbms | 256us | 1ms | 4ms | 16ms | 64ms | 256ms | 1s | 4s | 16s | gt | max |
|---|---|---|---|---|---|---|---|---|---|---|---|
| pg1222_o2nofp.cx10a_c8r32 | 99.996 | 0.004 | nonzero | 0.002 | |||||||
| pg1323_o2nofp.cx10a_c8r32 | 99.996 | 0.004 | nonzero | 0.002 | |||||||
| pg1420_o2nofp.cx10a_c8r32 | 99.996 | 0.004 | nonzero | 0.002 | |||||||
| pg1515_o2nofp.cx10a_c8r32 | 99.996 | 0.003 | nonzero | 0.002 | |||||||
| pg1611_o2nofp.cx10a_c8r32 | 99.996 | 0.004 | nonzero | 0.002 | |||||||
| pg177_o2nofp.cx10a_c8r32 | 99.997 | 0.003 | nonzero | 0.002 | |||||||
| pg181_o2nofp.cx10b_c8r32 | 99.997 | 0.003 | nonzero | 0.002 |
Insert response time histogram: each cell has the percentage of responses that take <= the time in the header and max is the max response time in seconds. For max values in the top 25% of the range have a red background and in the bottom 25% of the range have a green background. The red background is not used when the min value is within 80% of the max value.
| dbms | 256us | 1ms | 4ms | 16ms | 64ms | 256ms | 1s | 4s | 16s | gt | max |
|---|---|---|---|---|---|---|---|---|---|---|---|
| pg1222_o2nofp.cx10a_c8r32 | 24.639 | 75.344 | 0.006 | 0.011 | 0.020 | ||||||
| pg1323_o2nofp.cx10a_c8r32 | 28.889 | 71.100 | 0.011 | 0.006 | |||||||
| pg1420_o2nofp.cx10a_c8r32 | 29.083 | 70.900 | 0.006 | 0.011 | 0.023 | ||||||
| pg1515_o2nofp.cx10a_c8r32 | 29.894 | 70.050 | 0.044 | 0.011 | 0.021 | ||||||
| pg1611_o2nofp.cx10a_c8r32 | 32.811 | 67.161 | 0.017 | 0.011 | 0.019 | ||||||
| pg177_o2nofp.cx10a_c8r32 | 25.083 | 74.867 | 0.044 | 0.006 | 0.025 | ||||||
| pg181_o2nofp.cx10b_c8r32 | 26.261 | 73.567 | 0.161 | 0.011 | 0.021 |
Delete response time histogram: each cell has the percentage of responses that take <= the time in the header and max is the max response time in seconds. For max values in the top 25% of the range have a red background and in the bottom 25% of the range have a green background. The red background is not used when the min value is within 80% of the max value.
| dbms | 256us | 1ms | 4ms | 16ms | 64ms | 256ms | 1s | 4s | 16s | gt | max |
|---|---|---|---|---|---|---|---|---|---|---|---|
| pg1222_o2nofp.cx10a_c8r32 | 31.983 | 63.722 | 4.289 | 0.006 | 0.018 | ||||||
| pg1323_o2nofp.cx10a_c8r32 | 25.189 | 67.367 | 7.444 | 0.013 | |||||||
| pg1420_o2nofp.cx10a_c8r32 | 26.417 | 64.244 | 9.328 | 0.011 | 0.022 | ||||||
| pg1515_o2nofp.cx10a_c8r32 | 17.950 | 71.383 | 10.656 | 0.011 | 0.020 | ||||||
| pg1611_o2nofp.cx10a_c8r32 | 20.267 | 64.661 | 15.061 | 0.011 | 0.017 | ||||||
| pg177_o2nofp.cx10a_c8r32 | 18.150 | 59.767 | 22.078 | 0.006 | 0.023 | ||||||
| pg181_o2nofp.cx10b_c8r32 | 17.322 | 77.483 | 5.189 | 0.006 | 0.019 |
Performance metrics for the DBMS listed above. Some are normalized by throughput, others are not. Legend for results is here.
ips	qps	rps	rmbps	wps	wmbps	rpq	rkbpq	wpi	wkbpi	csps	cpups	cspq	cpupq	dbgb1	dbgb2	rss	maxop	p50	p99	tag
500	8516	0	0.0	45.8	3.0	0.000	0.000	0.092	6.141	33186	11.6	3.897	109	8.2	36.9	0.3	0.002	8511	8431	pg1222_o2nofp.cx10a_c8r32
500	8453	0	0.0	45.9	3.0	0.000	0.000	0.092	6.152	32978	12.6	3.902	119	8.2	37.0	0.3	0.002	8463	8399	pg1323_o2nofp.cx10a_c8r32
500	8382	0	0.0	45.3	3.0	0.000	0.000	0.091	6.089	32590	12.6	3.888	120	7.9	36.4	0.3	0.002	8383	8319	pg1420_o2nofp.cx10a_c8r32
500	8483	0	0.0	43.2	3.0	0.000	0.000	0.087	6.087	32956	12.6	3.885	119	8.0	36.9	0.3	0.002	8495	8399	pg1515_o2nofp.cx10a_c8r32
500	8482	0	0.0	43.1	3.0	0.000	0.000	0.086	6.085	32949	12.6	3.885	119	8.0	37.0	1.7	0.002	8495	8399	pg1611_o2nofp.cx10a_c8r32
500	8413	0	0.0	41.9	3.0	0.000	0.000	0.084	6.079	32645	12.7	3.880	121	8.0	36.7	0.3	0.002	8415	8335	pg177_o2nofp.cx10a_c8r32
500	8369	0	0.0	41.8	3.0	0.000	0.000	0.084	6.062	32462	12.6	3.879	120	7.9	36.5	0.2	0.002	8367	8271	pg181_o2nofp.cx10b_c8r32
Average values from iostat.
r/s	rkB/s	rrqm/s	%rrqm	r_await	rareq-s	w/s	wkB/s	wrqm/s	%wrqm	w_await	wareq-s	d/s	dkB/s	drqm/s	%drqm	d_await	dareq-s	f/s	f_await	aqu-sz	%util
0.000	0.000	0.000	0.000	0.000	0.000	45.53	3035.1	3.897	8.105	2.096	61.79	2.086	1251.1	0.000	0.000	0.839	43.45	3.992	1.824	0.091	3.241		pg1222_o2nofp.cx10a_c8r32
0.001	0.004	0.000	0.000	0.000	0.011	45.67	3038.5	4.219	8.826	2.093	61.58	2.087	1261.5	0.000	0.000	0.943	43.96	4.029	1.661	0.092	3.190		pg1323_o2nofp.cx10a_c8r32
0.003	0.011	0.000	0.000	0.000	0.011	45.05	3009.1	3.609	7.681	2.125	61.65	2.085	1251.5	0.000	0.000	1.017	43.81	4.002	1.487	0.092	3.245		pg1420_o2nofp.cx10a_c8r32
0.000	0.000	0.000	0.000	0.000	0.000	42.94	3005.8	1.532	2.592	2.422	65.19	0.084	1241.5	0.000	0.000	0.005	41.68	4.021	1.380	0.095	3.160		pg1515_o2nofp.cx10a_c8r32
0.000	0.000	0.000	0.000	0.000	0.000	42.85	3005.0	1.532	2.467	2.413	65.34	0.083	1241.5	0.000	0.000	0.008	42.25	3.986	1.372	0.093	3.147		pg1611_o2nofp.cx10a_c8r32
0.000	0.000	0.000	0.000	0.000	0.000	41.66	3002.3	1.461	2.443	2.626	67.53	0.085	1241.5	0.000	0.000	0.004	41.45	3.397	1.319	0.097	2.900		pg177_o2nofp.cx10a_c8r32
0.000	0.000	0.000	0.000	0.000	0.000	41.55	2996.1	1.614	3.445	2.688	66.65	0.085	1241.5	0.000	0.000	0.004	41.40	3.178	1.383	0.098	2.871		pg181_o2nofp.cx10b_c8r32
qr1000.L5
qr1000.L5: range queries with 1000 insert/s per client. Graphs for performance per 1-second interval are here.
Average throughput:
Query response time histogram: each cell has the percentage of responses that take <= the time in the header and max is the max response time in seconds. For max values in the top 25% of the range have a red background and in the bottom 25% of the range have a green background. The red background is not used when the min value is within 80% of the max value.
| dbms | 256us | 1ms | 4ms | 16ms | 64ms | 256ms | 1s | 4s | 16s | gt | max |
|---|---|---|---|---|---|---|---|---|---|---|---|
| pg1222_o2nofp.cx10a_c8r32 | 99.998 | 0.002 | nonzero | nonzero | 0.006 | ||||||
| pg1323_o2nofp.cx10a_c8r32 | 99.998 | 0.002 | nonzero | nonzero | 0.005 | ||||||
| pg1420_o2nofp.cx10a_c8r32 | 99.998 | 0.002 | nonzero | nonzero | 0.005 | ||||||
| pg1515_o2nofp.cx10a_c8r32 | 99.998 | 0.002 | nonzero | nonzero | 0.005 | ||||||
| pg1611_o2nofp.cx10a_c8r32 | 99.998 | 0.002 | nonzero | nonzero | 0.005 | ||||||
| pg177_o2nofp.cx10a_c8r32 | 99.998 | 0.002 | nonzero | nonzero | 0.005 | ||||||
| pg181_o2nofp.cx10b_c8r32 | 99.998 | 0.002 | nonzero | nonzero | 0.005 |
Insert response time histogram: each cell has the percentage of responses that take <= the time in the header and max is the max response time in seconds. For max values in the top 25% of the range have a red background and in the bottom 25% of the range have a green background. The red background is not used when the min value is within 80% of the max value.
| dbms | 256us | 1ms | 4ms | 16ms | 64ms | 256ms | 1s | 4s | 16s | gt | max |
|---|---|---|---|---|---|---|---|---|---|---|---|
| pg1222_o2nofp.cx10a_c8r32 | 39.497 | 60.492 | 0.011 | 0.010 | |||||||
| pg1323_o2nofp.cx10a_c8r32 | 44.081 | 55.917 | 0.003 | 0.005 | |||||||
| pg1420_o2nofp.cx10a_c8r32 | 47.342 | 52.647 | 0.011 | 0.015 | |||||||
| pg1515_o2nofp.cx10a_c8r32 | 45.494 | 54.497 | 0.008 | 0.007 | |||||||
| pg1611_o2nofp.cx10a_c8r32 | 46.425 | 53.561 | 0.014 | 0.009 | |||||||
| pg177_o2nofp.cx10a_c8r32 | 43.536 | 56.442 | 0.019 | 0.003 | 0.022 | ||||||
| pg181_o2nofp.cx10b_c8r32 | 48.981 | 50.981 | 0.039 | 0.010 |
Delete response time histogram: each cell has the percentage of responses that take <= the time in the header and max is the max response time in seconds. For max values in the top 25% of the range have a red background and in the bottom 25% of the range have a green background. The red background is not used when the min value is within 80% of the max value.
| dbms | 256us | 1ms | 4ms | 16ms | 64ms | 256ms | 1s | 4s | 16s | gt | max |
|---|---|---|---|---|---|---|---|---|---|---|---|
| pg1222_o2nofp.cx10a_c8r32 | 12.600 | 85.842 | 1.558 | 0.008 | |||||||
| pg1323_o2nofp.cx10a_c8r32 | 12.308 | 85.042 | 2.650 | 0.008 | |||||||
| pg1420_o2nofp.cx10a_c8r32 | 10.200 | 86.756 | 3.042 | 0.003 | 0.026 | ||||||
| pg1515_o2nofp.cx10a_c8r32 | 11.075 | 84.744 | 4.181 | 0.014 | |||||||
| pg1611_o2nofp.cx10a_c8r32 | 13.181 | 78.972 | 7.847 | 0.008 | |||||||
| pg177_o2nofp.cx10a_c8r32 | 9.503 | 79.394 | 11.100 | 0.003 | 0.026 | ||||||
| pg181_o2nofp.cx10b_c8r32 | 8.900 | 88.086 | 3.014 | 0.010 |
Performance metrics for the DBMS listed above. Some are normalized by throughput, others are not. Legend for results is here.
ips	qps	rps	rmbps	wps	wmbps	rpq	rkbpq	wpi	wkbpi	csps	cpups	cspq	cpupq	dbgb1	dbgb2	rss	maxop	p50	p99	tag
1000	13893	0	0.0	54.9	3.5	0.000	0.000	0.055	3.549	53604	11.8	3.858	68	8.2	34.5	0.4	0.006	13855	13038	pg1222_o2nofp.cx10a_c8r32
999	14007	0	0.0	54.7	3.5	0.000	0.000	0.055	3.551	54094	13.5	3.862	77	8.2	34.6	0.4	0.005	13966	13118	pg1323_o2nofp.cx10a_c8r32
1000	13942	0	0.0	53.7	3.4	0.000	0.000	0.054	3.497	53693	13.4	3.851	77	8.0	34.1	0.3	0.005	13918	13086	pg1420_o2nofp.cx10a_c8r32
999	14006	0	0.0	51.5	3.4	0.000	0.000	0.052	3.490	53921	13.4	3.850	77	8.0	34.6	0.4	0.005	13982	13134	pg1515_o2nofp.cx10a_c8r32
1000	13998	0	0.0	51.7	3.4	0.000	0.000	0.052	3.486	53856	13.5	3.847	77	8.0	34.6	3.2	0.005	13966	13118	pg1611_o2nofp.cx10a_c8r32
999	13996	0	0.0	51.1	3.4	0.000	0.000	0.051	3.501	53797	13.5	3.844	77	8.0	34.4	0.4	0.005	13950	13006	pg177_o2nofp.cx10a_c8r32
1000	13673	0	0.0	52.2	3.4	0.000	0.000	0.052	3.523	52540	13.4	3.843	78	8.0	34.2	0.3	0.005	13534	12862	pg181_o2nofp.cx10b_c8r32
Average values from iostat.
r/s	rkB/s	rrqm/s	%rrqm	r_await	rareq-s	w/s	wkB/s	wrqm/s	%wrqm	w_await	wareq-s	d/s	dkB/s	drqm/s	%drqm	d_await	dareq-s	f/s	f_await	aqu-sz	%util
0.000	0.000	0.000	0.000	0.000	0.000	54.69	3520.3	3.684	6.544	1.897	65.89	2.094	1387.9	0.000	0.000	0.808	43.51	4.771	1.821	0.097	3.340		pg1222_o2nofp.cx10a_c8r32
0.000	0.000	0.000	0.000	0.000	0.000	54.49	3519.9	4.057	7.572	1.904	66.42	2.098	1387.9	0.000	0.000	0.944	76.79	4.739	1.625	0.096	3.239		pg1323_o2nofp.cx10a_c8r32
0.001	0.004	0.000	0.000	0.000	0.011	53.46	3467.9	3.737	6.845	2.054	66.06	2.088	1388.3	0.000	0.000	0.902	60.73	4.749	1.476	0.102	3.315		pg1420_o2nofp.cx10a_c8r32
0.000	0.000	0.000	0.000	0.000	0.000	51.26	3458.4	1.652	2.553	2.232	69.55	0.092	1378.3	0.000	0.000	0.001	41.78	4.733	1.284	0.100	3.188		pg1515_o2nofp.cx10a_c8r32
0.000	0.000	0.000	0.000	0.000	0.000	51.53	3456.7	1.650	2.473	2.235	69.31	0.090	1378.3	0.000	0.000	0.005	42.82	4.742	1.346	0.101	3.209		pg1611_o2nofp.cx10a_c8r32
0.001	0.004	0.000	0.000	0.001	0.011	50.90	3470.0	1.618	2.661	2.404	70.24	0.094	1378.3	0.000	0.000	0.005	82.57	4.410	1.352	0.107	3.148		pg177_o2nofp.cx10a_c8r32
0.000	0.000	0.000	0.000	0.000	0.000	52.01	3491.6	1.850	3.070	2.414	67.98	0.090	1369.2	0.000	0.000	0.003	85.31	4.422	1.361	0.110	3.160		pg181_o2nofp.cx10b_c8r32
qp1000.L6
qp1000.L6: point queries with 1000 insert/s per client. Graphs for performance per 1-second interval are here.
Average throughput:
Query response time histogram: each cell has the percentage of responses that take <= the time in the header and max is the max response time in seconds. For max values in the top 25% of the range have a red background and in the bottom 25% of the range have a green background. The red background is not used when the min value is within 80% of the max value.
| dbms | 256us | 1ms | 4ms | 16ms | 64ms | 256ms | 1s | 4s | 16s | gt | max |
|---|---|---|---|---|---|---|---|---|---|---|---|
| pg1222_o2nofp.cx10a_c8r32 | 99.995 | 0.005 | nonzero | 0.002 | |||||||
| pg1323_o2nofp.cx10a_c8r32 | 99.995 | 0.005 | nonzero | 0.001 | |||||||
| pg1420_o2nofp.cx10a_c8r32 | 99.995 | 0.005 | nonzero | 0.001 | |||||||
| pg1515_o2nofp.cx10a_c8r32 | 99.995 | 0.005 | nonzero | 0.002 | |||||||
| pg1611_o2nofp.cx10a_c8r32 | 99.995 | 0.005 | 0.001 | ||||||||
| pg177_o2nofp.cx10a_c8r32 | 99.995 | 0.005 | nonzero | 0.002 | |||||||
| pg181_o2nofp.cx10b_c8r32 | 99.995 | 0.005 | nonzero | 0.002 |
Insert response time histogram: each cell has the percentage of responses that take <= the time in the header and max is the max response time in seconds. For max values in the top 25% of the range have a red background and in the bottom 25% of the range have a green background. The red background is not used when the min value is within 80% of the max value.
| dbms | 256us | 1ms | 4ms | 16ms | 64ms | 256ms | 1s | 4s | 16s | gt | max |
|---|---|---|---|---|---|---|---|---|---|---|---|
| pg1222_o2nofp.cx10a_c8r32 | 33.814 | 66.178 | 0.008 | 0.006 | |||||||
| pg1323_o2nofp.cx10a_c8r32 | 37.381 | 62.611 | 0.008 | 0.006 | |||||||
| pg1420_o2nofp.cx10a_c8r32 | 36.958 | 63.022 | 0.019 | 0.009 | |||||||
| pg1515_o2nofp.cx10a_c8r32 | 37.619 | 62.369 | 0.011 | 0.007 | |||||||
| pg1611_o2nofp.cx10a_c8r32 | 36.086 | 63.903 | 0.008 | 0.003 | 0.029 | ||||||
| pg177_o2nofp.cx10a_c8r32 | 32.992 | 66.989 | 0.019 | 0.009 | |||||||
| pg181_o2nofp.cx10b_c8r32 | 43.967 | 56.017 | 0.011 | 0.006 | 0.028 |
Delete response time histogram: each cell has the percentage of responses that take <= the time in the header and max is the max response time in seconds. For max values in the top 25% of the range have a red background and in the bottom 25% of the range have a green background. The red background is not used when the min value is within 80% of the max value.
| dbms | 256us | 1ms | 4ms | 16ms | 64ms | 256ms | 1s | 4s | 16s | gt | max |
|---|---|---|---|---|---|---|---|---|---|---|---|
| pg1222_o2nofp.cx10a_c8r32 | 15.597 | 82.672 | 1.731 | 0.011 | |||||||
| pg1323_o2nofp.cx10a_c8r32 | 10.047 | 85.889 | 4.064 | 0.010 | |||||||
| pg1420_o2nofp.cx10a_c8r32 | 10.192 | 85.639 | 4.169 | 0.011 | |||||||
| pg1515_o2nofp.cx10a_c8r32 | 10.000 | 84.331 | 5.669 | 0.011 | |||||||
| pg1611_o2nofp.cx10a_c8r32 | 10.519 | 80.181 | 9.297 | 0.003 | 0.027 | ||||||
| pg177_o2nofp.cx10a_c8r32 | 8.997 | 79.653 | 11.350 | 0.012 | |||||||
| pg181_o2nofp.cx10b_c8r32 | 23.042 | 73.225 | 3.728 | 0.006 | 0.026 |
Performance metrics for the DBMS listed above. Some are normalized by throughput, others are not. Legend for results is here.
ips	qps	rps	rmbps	wps	wmbps	rpq	rkbpq	wpi	wkbpi	csps	cpups	cspq	cpupq	dbgb1	dbgb2	rss	maxop	p50	p99	tag
1000	8450	0	0.0	44.8	3.6	0.000	0.000	0.045	3.643	33167	12.0	3.925	114	8.2	31.7	0.3	0.002	8447	8367	pg1222_o2nofp.cx10a_c8r32
999	8429	0	0.0	44.9	3.6	0.000	0.000	0.045	3.647	33123	13.3	3.930	126	8.2	31.9	6.5	0.001	8431	8367	pg1323_o2nofp.cx10a_c8r32
1000	8379	0	0.0	44.6	3.5	0.000	0.000	0.045	3.613	32812	13.2	3.916	126	8.0	31.4	0.3	0.001	8383	8303	pg1420_o2nofp.cx10a_c8r32
999	8424	0	0.0	42.5	3.5	0.000	0.000	0.042	3.589	32951	13.2	3.912	125	8.0	31.8	0.3	0.002	8431	8319	pg1515_o2nofp.cx10a_c8r32
1000	8430	0	0.0	42.8	3.5	0.000	0.000	0.043	3.617	32957	13.2	3.910	125	8.1	31.9	3.2	0.001	8431	8351	pg1611_o2nofp.cx10a_c8r32
999	8393	0	0.0	40.8	3.5	0.000	0.000	0.041	3.582	32757	13.3	3.903	127	8.0	31.7	0.3	0.002	8399	8319	pg177_o2nofp.cx10a_c8r32
1000	8340	0	0.0	41.4	3.5	0.000	0.000	0.041	3.629	32538	13.2	3.901	127	8.0	31.5	0.2	0.002	8335	8255	pg181_o2nofp.cx10b_c8r32
Average values from iostat.
r/s	rkB/s	rrqm/s	%rrqm	r_await	rareq-s	w/s	wkB/s	wrqm/s	%wrqm	w_await	wareq-s	d/s	dkB/s	drqm/s	%drqm	d_await	dareq-s	f/s	f_await	aqu-sz	%util
0.000	0.000	0.000	0.000	0.000	0.000	44.51	3608.0	3.589	7.217	1.638	79.15	2.110	1652.7	0.000	0.000	0.812	45.46	4.089	1.821	0.066	2.732		pg1222_o2nofp.cx10a_c8r32
0.000	0.000	0.000	0.000	0.000	0.000	44.55	3607.2	3.975	8.183	1.499	78.82	2.111	1643.5	0.000	0.000	0.833	80.62	4.098	1.632	0.062	2.609		pg1323_o2nofp.cx10a_c8r32
0.000	0.000	0.000	0.000	0.000	0.000	44.28	3574.7	3.548	7.227	1.690	78.92	2.106	1634.8	0.000	0.000	0.868	84.24	4.087	1.518	0.068	2.718		pg1420_o2nofp.cx10a_c8r32
0.000	0.000	0.000	0.000	0.000	0.000	42.15	3549.8	1.882	3.039	1.847	83.13	0.111	1624.8	0.000	0.000	0.002	40.83	4.096	1.344	0.065	2.577		pg1515_o2nofp.cx10a_c8r32
0.000	0.000	0.000	0.000	0.000	0.000	42.53	3578.9	1.944	3.183	1.803	82.84	0.106	1633.9	0.000	0.000	0.001	43.24	4.111	1.339	0.064	2.532		pg1611_o2nofp.cx10a_c8r32
0.000	0.000	0.000	0.000	0.000	0.000	40.47	3542.4	1.758	2.836	2.011	86.88	0.109	1624.8	0.000	0.000	0.004	41.89	3.398	1.312	0.068	2.372		pg177_o2nofp.cx10a_c8r32
0.000	0.000	0.000	0.000	0.000	0.000	41.03	3584.8	1.742	2.849	1.941	85.94	0.108	1643.0	0.000	0.000	0.005	79.06	3.240	1.324	0.068	2.276		pg181_o2nofp.cx10b_c8r32
l.i0
l.i0: load without secondary indexes
Performance metrics for all DBMS, not just the ones listed above. Some are normalized by throughput, others are not. Legend for results is here.
ips	qps	rps	rmbps	wps	wmbps	rpq	rkbpq	wpi	wkbpi	csps	cpups	cspq	cpupq	dbgb1	dbgb2	rss	maxop	p50	p99	tag
141509	0	0	0.0	528.4	59.7	0.000	0.000	0.004	0.432	17571	19.8	0.124	11	2.9	7.8	2.9	0.004	142082	140981	pg1222_o2nofp.cx10a_c8r32
143541	0	0	0.0	538.8	60.9	0.000	0.000	0.004	0.435	18282	20.7	0.127	12	2.9	7.8	2.9	0.003	144082	143180	pg1323_o2nofp.cx10a_c8r32
138889	0	0	0.0	516.6	58.4	0.000	0.000	0.004	0.431	16838	19.5	0.121	11	2.9	7.8	2.8	0.003	138883	138082	pg1420_o2nofp.cx10a_c8r32
144928	0	0	0.0	540.0	61.4	0.000	0.000	0.004	0.433	17854	20.6	0.123	11	2.9	7.8	3.0	0.005	145384	144482	pg1515_o2nofp.cx10a_c8r32
144231	0	0	0.0	537.5	61.0	0.000	0.000	0.004	0.433	17739	20.3	0.123	11	2.9	7.8	2.9	0.008	144580	143081	pg1611_o2nofp.cx10a_c8r32
141509	0	0	0.0	528.8	60.0	0.000	0.000	0.004	0.434	14737	20.0	0.104	11	2.9	7.8	2.9	0.003	142482	141582	pg177_o2nofp.cx10a_c8r32
142180	0	0	0.0	528.2	59.9	0.000	0.000	0.004	0.432	14723	20.0	0.104	11	2.9	7.8	2.9	0.002	142283	141280	pg181_o2nofp.cx10b_c8r32
l.x
l.x: create secondary indexes
Performance metrics for all DBMS, not just the ones listed above. Some are normalized by throughput, others are not. Legend for results is here.
ips	qps	rps	rmbps	wps	wmbps	rpq	rkbpq	wpi	wkbpi	csps	cpups	cspq	cpupq	dbgb1	dbgb2	rss	maxop	p50	p99	tag
340910	0	0	0.0	640.4	78.4	0.000	0.000	0.002	0.235	1894	12.1	0.006	3	5.8	13.3	3.0	0.002	NA	NA	pg1222_o2nofp.cx10a_c8r32
333334	0	0	0.0	622.5	76.2	0.000	0.000	0.002	0.234	1775	12.2	0.005	3	5.8	13.3	3.0	0.002	NA	NA	pg1323_o2nofp.cx10a_c8r32
322582	0	0	0.0	651.4	79.6	0.000	0.000	0.002	0.253	1921	12.2	0.006	3	5.8	13.3	3.0	0.002	NA	NA	pg1420_o2nofp.cx10a_c8r32
361447	0	0	0.0	696.3	85.5	0.000	0.000	0.002	0.242	1989	12.1	0.006	3	5.8	13.3	3.0	0.002	NA	NA	pg1515_o2nofp.cx10a_c8r32
370372	0	0	0.0	747.1	91.6	0.000	0.000	0.002	0.253	2238	12.1	0.006	3	5.8	13.3	3.1	0.002	NA	NA	pg1611_o2nofp.cx10a_c8r32
379748	0	0	0.0	645.5	79.1	0.000	0.000	0.002	0.213	1947	12.3	0.005	3	5.8	13.3	3.0	0.002	NA	NA	pg177_o2nofp.cx10a_c8r32
357144	0	0	0.0	676.4	83.0	0.000	0.000	0.002	0.238	1840	12.5	0.005	3	5.8	13.3	3.0	0.002	NA	NA	pg181_o2nofp.cx10b_c8r32
l.i1
l.i1: continue load after secondary indexes created with 50 inserts per transaction
Performance metrics for all DBMS, not just the ones listed above. Some are normalized by throughput, others are not. Legend for results is here.
ips	qps	rps	rmbps	wps	wmbps	rpq	rkbpq	wpi	wkbpi	csps	cpups	cspq	cpupq	dbgb1	dbgb2	rss	maxop	p50	p99	tag
20418	0	0	0.0	251.9	27.2	0.000	0.000	0.012	1.363	10562	21.8	0.517	85	8.1	38.5	6.4	0.029	14498	8499	pg1222_o2nofp.cx10a_c8r32
20439	0	0	0.0	253.4	27.3	0.000	0.000	0.012	1.369	10637	22.2	0.520	87	8.1	38.6	6.4	0.035	14848	9949	pg1323_o2nofp.cx10a_c8r32
20070	0	0	0.0	247.7	26.7	0.000	0.000	0.012	1.360	9966	20.9	0.497	83	7.8	38.3	2.8	0.013	14398	9649	pg1420_o2nofp.cx10a_c8r32
20964	0	0	0.0	256.7	27.9	0.000	0.000	0.012	1.364	10860	20.8	0.518	79	7.8	38.4	7.6	0.040	17047	11848	pg1515_o2nofp.cx10a_c8r32
20682	0	0	0.0	253.2	27.5	0.000	0.000	0.012	1.362	10719	20.7	0.518	80	7.8	38.4	3.7	0.031	16847	11548	pg1611_o2nofp.cx10a_c8r32
18683	0	0	0.0	233.6	25.6	0.000	0.000	0.013	1.402	7927	19.7	0.424	84	7.8	38.3	3.6	0.026	15848	6199	pg177_o2nofp.cx10a_c8r32
20471	0	0	0.0	256.5	28.2	0.000	0.000	0.013	1.411	8670	20.8	0.424	81	7.8	38.2	4.3	0.025	16398	11698	pg181_o2nofp.cx10b_c8r32
l.i2
l.i2: continue load after secondary indexes created with 5 inserts per transaction
Performance metrics for all DBMS, not just the ones listed above. Some are normalized by throughput, others are not. Legend for results is here.
ips	qps	rps	rmbps	wps	wmbps	rpq	rkbpq	wpi	wkbpi	csps	cpups	cspq	cpupq	dbgb1	dbgb2	rss	maxop	p50	p99	tag
2572	0	0	0.0	61.4	5.8	0.000	0.000	0.024	2.290	12490	15.4	4.856	479	8.1	40.2	6.6	0.036	1760	1020	pg1222_o2nofp.cx10a_c8r32
2634	0	0	0.0	62.6	5.9	0.000	0.000	0.024	2.300	12828	15.5	4.870	471	8.2	40.3	4.7	0.007	1930	1310	pg1323_o2nofp.cx10a_c8r32
2372	0	0	0.0	57.0	5.3	0.000	0.000	0.024	2.288	11134	15.0	4.694	506	7.9	39.7	0.9	0.009	1755	1130	pg1420_o2nofp.cx10a_c8r32
2525	0	0	0.0	58.0	5.6	0.000	0.000	0.023	2.271	11780	15.1	4.666	478	7.9	40.2	0.3	0.007	1940	1330	pg1515_o2nofp.cx10a_c8r32
2627	0	0	0.0	58.9	5.7	0.000	0.000	0.022	2.230	12247	15.3	4.663	466	7.9	40.2	5.3	0.003	2145	1335	pg1611_o2nofp.cx10a_c8r32
2172	0	0	0.0	52.3	5.1	0.000	0.000	0.024	2.385	8565	14.7	3.943	541	7.9	39.9	0.6	0.009	1355	710	pg177_o2nofp.cx10a_c8r32
2432	0	0	0.0	55.1	5.4	0.000	0.000	0.023	2.277	9546	15.1	3.925	497	7.9	39.8	0.4	0.009	1970	1355	pg181_o2nofp.cx10b_c8r32
qr100.L1
qr100.L1: range queries with 100 insert/s per client
Performance metrics for all DBMS, not just the ones listed above. Some are normalized by throughput, others are not. Legend for results is here.
ips	qps	rps	rmbps	wps	wmbps	rpq	rkbpq	wpi	wkbpi	csps	cpups	cspq	cpupq	dbgb1	dbgb2	rss	maxop	p50	p99	tag
100	14702	0	0.0	14.9	0.8	0.000	0.000	0.149	7.746	56201	11.3	3.823	61	8.1	40.2	0.1	0.001	14686	14542	pg1222_o2nofp.cx10a_c8r32
100	14977	0	0.0	15.0	0.8	0.000	0.000	0.150	7.781	57258	12.5	3.823	67	8.2	40.3	0.1	0.001	14974	14782	pg1323_o2nofp.cx10a_c8r32
100	14884	0	0.0	15.4	0.8	0.000	0.000	0.154	7.928	56892	12.4	3.822	67	7.9	39.7	0.1	0.010	14894	14686	pg1420_o2nofp.cx10a_c8r32
100	14897	0	0.0	13.1	0.8	0.000	0.000	0.131	7.715	56891	12.4	3.819	67	7.9	40.1	0.1	0.001	14894	14686	pg1515_o2nofp.cx10a_c8r32
100	14912	0	0.0	13.1	0.8	0.000	0.000	0.131	7.708	56978	12.4	3.821	67	7.9	40.2	0.1	0.001	14926	14686	pg1611_o2nofp.cx10a_c8r32
100	15118	0	0.0	12.4	0.8	0.000	0.000	0.124	7.750	57721	12.4	3.818	66	7.9	39.9	0.1	0.001	15118	14894	pg177_o2nofp.cx10a_c8r32
100	14736	0	0.0	12.4	0.8	0.000	0.000	0.124	7.737	56290	12.4	3.820	67	7.9	39.8	0.1	0.001	14750	14510	pg181_o2nofp.cx10b_c8r32
qp100.L2
qp100.L2: point queries with 100 insert/s per client
Performance metrics for all DBMS, not just the ones listed above. Some are normalized by throughput, others are not. Legend for results is here.
ips	qps	rps	rmbps	wps	wmbps	rpq	rkbpq	wpi	wkbpi	csps	cpups	cspq	cpupq	dbgb1	dbgb2	rss	maxop	p50	p99	tag
100	8524	0	0.0	63.4	1.7	0.000	0.000	0.634	17.041	33064	11.1	3.879	104	8.1	40.2	0.2	0.002	8527	8463	pg1222_o2nofp.cx10a_c8r32
100	8504	0	0.0	63.2	1.7	0.000	0.000	0.633	17.068	33023	12.4	3.883	117	8.2	40.3	0.2	0.001	8511	8431	pg1323_o2nofp.cx10a_c8r32
100	8429	0	0.0	62.3	1.7	0.000	0.000	0.624	17.016	32642	12.4	3.873	118	7.9	39.7	0.1	0.001	8431	8383	pg1420_o2nofp.cx10a_c8r32
100	8467	0	0.0	60.0	1.6	0.000	0.000	0.600	16.798	32735	12.4	3.866	117	7.9	40.1	0.1	0.001	8463	8399	pg1515_o2nofp.cx10a_c8r32
100	8521	0	0.0	60.0	1.6	0.000	0.000	0.600	16.813	32961	12.4	3.868	116	7.9	40.2	0.1	0.001	8527	8447	pg1611_o2nofp.cx10a_c8r32
100	8465	0	0.0	58.7	1.6	0.000	0.000	0.587	16.771	32714	12.4	3.865	117	7.9	39.9	0.1	0.001	8479	8383	pg177_o2nofp.cx10a_c8r32
100	8391	0	0.0	58.9	1.6	0.000	0.000	0.589	16.771	32428	12.4	3.865	118	7.9	39.8	0.1	0.001	8383	8335	pg181_o2nofp.cx10b_c8r32
qr500.L3
qr500.L3: range queries with 500 insert/s per client
Performance metrics for all DBMS, not just the ones listed above. Some are normalized by throughput, others are not. Legend for results is here.
ips	qps	rps	rmbps	wps	wmbps	rpq	rkbpq	wpi	wkbpi	csps	cpups	cspq	cpupq	dbgb1	dbgb2	rss	maxop	p50	p99	tag
500	13901	0	0.0	71.0	2.2	0.000	0.000	0.142	4.599	53379	11.1	3.840	64	8.2	39.0	0.4	0.002	13902	13342	pg1222_o2nofp.cx10a_c8r32
500	14082	0	0.0	70.5	2.2	0.000	0.000	0.141	4.606	54114	13.0	3.843	74	8.2	39.1	0.4	0.002	14078	13486	pg1323_o2nofp.cx10a_c8r32
500	13950	0	0.0	69.8	2.3	0.000	0.000	0.140	4.631	53509	13.0	3.836	75	7.9	38.5	0.3	0.002	13950	13406	pg1420_o2nofp.cx10a_c8r32
500	13905	0	0.0	67.8	2.3	0.000	0.000	0.136	4.625	53275	12.9	3.831	74	8.0	39.0	0.3	0.003	13902	13326	pg1515_o2nofp.cx10a_c8r32
500	14133	0	0.0	67.8	2.3	0.000	0.000	0.136	4.631	54175	13.0	3.833	74	8.0	39.1	4.0	0.004	14126	13566	pg1611_o2nofp.cx10a_c8r32
500	13946	0	0.0	67.4	2.3	0.000	0.000	0.135	4.642	53419	12.9	3.830	74	7.9	38.8	0.3	0.007	13950	13326	pg177_o2nofp.cx10a_c8r32
500	13609	0	0.0	67.2	2.2	0.000	0.000	0.134	4.584	52099	12.8	3.828	75	7.9	38.6	0.3	0.003	13598	12990	pg181_o2nofp.cx10b_c8r32
qp500.L4
qp500.L4: point queries with 500 insert/s per client
Performance metrics for all DBMS, not just the ones listed above. Some are normalized by throughput, others are not. Legend for results is here.
ips	qps	rps	rmbps	wps	wmbps	rpq	rkbpq	wpi	wkbpi	csps	cpups	cspq	cpupq	dbgb1	dbgb2	rss	maxop	p50	p99	tag
500	8516	0	0.0	45.8	3.0	0.000	0.000	0.092	6.141	33186	11.6	3.897	109	8.2	36.9	0.3	0.002	8511	8431	pg1222_o2nofp.cx10a_c8r32
500	8453	0	0.0	45.9	3.0	0.000	0.000	0.092	6.152	32978	12.6	3.902	119	8.2	37.0	0.3	0.002	8463	8399	pg1323_o2nofp.cx10a_c8r32
500	8382	0	0.0	45.3	3.0	0.000	0.000	0.091	6.089	32590	12.6	3.888	120	7.9	36.4	0.3	0.002	8383	8319	pg1420_o2nofp.cx10a_c8r32
500	8483	0	0.0	43.2	3.0	0.000	0.000	0.087	6.087	32956	12.6	3.885	119	8.0	36.9	0.3	0.002	8495	8399	pg1515_o2nofp.cx10a_c8r32
500	8482	0	0.0	43.1	3.0	0.000	0.000	0.086	6.085	32949	12.6	3.885	119	8.0	37.0	1.7	0.002	8495	8399	pg1611_o2nofp.cx10a_c8r32
500	8413	0	0.0	41.9	3.0	0.000	0.000	0.084	6.079	32645	12.7	3.880	121	8.0	36.7	0.3	0.002	8415	8335	pg177_o2nofp.cx10a_c8r32
500	8369	0	0.0	41.8	3.0	0.000	0.000	0.084	6.062	32462	12.6	3.879	120	7.9	36.5	0.2	0.002	8367	8271	pg181_o2nofp.cx10b_c8r32
qr1000.L5
qr1000.L5: range queries with 1000 insert/s per client
Performance metrics for all DBMS, not just the ones listed above. Some are normalized by throughput, others are not. Legend for results is here.
ips	qps	rps	rmbps	wps	wmbps	rpq	rkbpq	wpi	wkbpi	csps	cpups	cspq	cpupq	dbgb1	dbgb2	rss	maxop	p50	p99	tag
1000	13893	0	0.0	54.9	3.5	0.000	0.000	0.055	3.549	53604	11.8	3.858	68	8.2	34.5	0.4	0.006	13855	13038	pg1222_o2nofp.cx10a_c8r32
999	14007	0	0.0	54.7	3.5	0.000	0.000	0.055	3.551	54094	13.5	3.862	77	8.2	34.6	0.4	0.005	13966	13118	pg1323_o2nofp.cx10a_c8r32
1000	13942	0	0.0	53.7	3.4	0.000	0.000	0.054	3.497	53693	13.4	3.851	77	8.0	34.1	0.3	0.005	13918	13086	pg1420_o2nofp.cx10a_c8r32
999	14006	0	0.0	51.5	3.4	0.000	0.000	0.052	3.490	53921	13.4	3.850	77	8.0	34.6	0.4	0.005	13982	13134	pg1515_o2nofp.cx10a_c8r32
1000	13998	0	0.0	51.7	3.4	0.000	0.000	0.052	3.486	53856	13.5	3.847	77	8.0	34.6	3.2	0.005	13966	13118	pg1611_o2nofp.cx10a_c8r32
999	13996	0	0.0	51.1	3.4	0.000	0.000	0.051	3.501	53797	13.5	3.844	77	8.0	34.4	0.4	0.005	13950	13006	pg177_o2nofp.cx10a_c8r32
1000	13673	0	0.0	52.2	3.4	0.000	0.000	0.052	3.523	52540	13.4	3.843	78	8.0	34.2	0.3	0.005	13534	12862	pg181_o2nofp.cx10b_c8r32
qp1000.L6
qp1000.L6: point queries with 1000 insert/s per client
Performance metrics for all DBMS, not just the ones listed above. Some are normalized by throughput, others are not. Legend for results is here.
ips	qps	rps	rmbps	wps	wmbps	rpq	rkbpq	wpi	wkbpi	csps	cpups	cspq	cpupq	dbgb1	dbgb2	rss	maxop	p50	p99	tag
1000	8450	0	0.0	44.8	3.6	0.000	0.000	0.045	3.643	33167	12.0	3.925	114	8.2	31.7	0.3	0.002	8447	8367	pg1222_o2nofp.cx10a_c8r32
999	8429	0	0.0	44.9	3.6	0.000	0.000	0.045	3.647	33123	13.3	3.930	126	8.2	31.9	6.5	0.001	8431	8367	pg1323_o2nofp.cx10a_c8r32
1000	8379	0	0.0	44.6	3.5	0.000	0.000	0.045	3.613	32812	13.2	3.916	126	8.0	31.4	0.3	0.001	8383	8303	pg1420_o2nofp.cx10a_c8r32
999	8424	0	0.0	42.5	3.5	0.000	0.000	0.042	3.589	32951	13.2	3.912	125	8.0	31.8	0.3	0.002	8431	8319	pg1515_o2nofp.cx10a_c8r32
1000	8430	0	0.0	42.8	3.5	0.000	0.000	0.043	3.617	32957	13.2	3.910	125	8.1	31.9	3.2	0.001	8431	8351	pg1611_o2nofp.cx10a_c8r32
999	8393	0	0.0	40.8	3.5	0.000	0.000	0.041	3.582	32757	13.3	3.903	127	8.0	31.7	0.3	0.002	8399	8319	pg177_o2nofp.cx10a_c8r32
1000	8340	0	0.0	41.4	3.5	0.000	0.000	0.041	3.629	32538	13.2	3.901	127	8.0	31.5	0.2	0.002	8335	8255	pg181_o2nofp.cx10b_c8r32
l.i0
- l.i0: load without secondary indexes
- Legend for results is here.
- Each entry lists the percentage of responses that fit in that bucket (slower than max time for previous bucket, faster than min time for next bucket).
Insert response time histogram
256us	1ms	4ms	16ms	64ms	256ms	1s	4s	16s	gt	max	tag
0.000	99.979	0.021	nonzero	0.000	0.000	0.000	0.000	0.000	0.000	0.004	pg1222_o2nofp.cx10a_c8r32
0.000	99.983	0.017	0.000	0.000	0.000	0.000	0.000	0.000	0.000	0.003	pg1323_o2nofp.cx10a_c8r32
0.000	99.989	0.011	0.000	0.000	0.000	0.000	0.000	0.000	0.000	0.003	pg1420_o2nofp.cx10a_c8r32
0.000	99.985	0.014	nonzero	0.000	0.000	0.000	0.000	0.000	0.000	0.005	pg1515_o2nofp.cx10a_c8r32
0.000	99.984	0.016	nonzero	0.000	0.000	0.000	0.000	0.000	0.000	0.008	pg1611_o2nofp.cx10a_c8r32
0.000	99.981	0.019	0.000	0.000	0.000	0.000	0.000	0.000	0.000	0.003	pg177_o2nofp.cx10a_c8r32
0.000	99.989	0.011	0.000	0.000	0.000	0.000	0.000	0.000	0.000	0.002	pg181_o2nofp.cx10b_c8r32
l.x
- l.x: create secondary indexes
- Legend for results is here.
- Each entry lists the percentage of responses that fit in that bucket (slower than max time for previous bucket, faster than min time for next bucket).
TODO - determine whether there is data for create index response time
l.i1
- l.i1: continue load after secondary indexes created with 50 inserts per transaction
- Legend for results is here.
- Each entry lists the percentage of responses that fit in that bucket (slower than max time for previous bucket, faster than min time for next bucket).
Insert response time histogram
256us	1ms	4ms	16ms	64ms	256ms	1s	4s	16s	gt	max	tag
0.000	46.971	53.019	0.005	0.005	0.000	0.000	0.000	0.000	0.000	0.029	pg1222_o2nofp.cx10a_c8r32
0.000	33.383	66.608	0.004	0.005	0.000	0.000	0.000	0.000	0.000	0.035	pg1323_o2nofp.cx10a_c8r32
0.000	41.446	58.553	0.001	0.000	0.000	0.000	0.000	0.000	0.000	0.013	pg1420_o2nofp.cx10a_c8r32
0.000	32.089	67.897	0.005	0.009	0.000	0.000	0.000	0.000	0.000	0.040	pg1515_o2nofp.cx10a_c8r32
0.000	31.139	68.849	0.005	0.007	0.000	0.000	0.000	0.000	0.000	0.031	pg1611_o2nofp.cx10a_c8r32
0.000	51.168	48.828	0.002	0.001	0.000	0.000	0.000	0.000	0.000	0.026	pg177_o2nofp.cx10a_c8r32
0.000	37.144	62.852	0.004	nonzero	0.000	0.000	0.000	0.000	0.000	0.025	pg181_o2nofp.cx10b_c8r32
Delete response time histogram
256us	1ms	4ms	16ms	64ms	256ms	1s	4s	16s	gt	max	tag
0.000	24.762	56.847	18.386	0.005	0.000	0.000	0.000	0.000	0.000	0.028	pg1222_o2nofp.cx10a_c8r32
0.000	21.750	66.503	11.743	0.004	0.000	0.000	0.000	0.000	0.000	0.035	pg1323_o2nofp.cx10a_c8r32
0.000	20.972	65.556	13.471	nonzero	0.000	0.000	0.000	0.000	0.000	0.028	pg1420_o2nofp.cx10a_c8r32
0.000	21.351	75.922	2.721	0.006	0.000	0.000	0.000	0.000	0.000	0.039	pg1515_o2nofp.cx10a_c8r32
0.000	20.710	75.286	3.999	0.005	0.000	0.000	0.000	0.000	0.000	0.035	pg1611_o2nofp.cx10a_c8r32
0.000	20.745	63.159	16.095	0.001	0.000	0.000	0.000	0.000	0.000	0.025	pg177_o2nofp.cx10a_c8r32
0.000	20.069	76.096	3.835	0.001	0.000	0.000	0.000	0.000	0.000	0.024	pg181_o2nofp.cx10b_c8r32
l.i2
- l.i2: continue load after secondary indexes created with 5 inserts per transaction
- Legend for results is here.
- Each entry lists the percentage of responses that fit in that bucket (slower than max time for previous bucket, faster than min time for next bucket).
Insert response time histogram
256us	1ms	4ms	16ms	64ms	256ms	1s	4s	16s	gt	max	tag
50.816	49.183	0.001	nonzero	nonzero	0.000	0.000	0.000	0.000	0.000	0.036	pg1222_o2nofp.cx10a_c8r32
50.100	49.900	nonzero	nonzero	0.000	0.000	0.000	0.000	0.000	0.000	0.007	pg1323_o2nofp.cx10a_c8r32
41.043	58.956	nonzero	nonzero	0.000	0.000	0.000	0.000	0.000	0.000	0.009	pg1420_o2nofp.cx10a_c8r32
45.707	54.293	nonzero	nonzero	0.000	0.000	0.000	0.000	0.000	0.000	0.007	pg1515_o2nofp.cx10a_c8r32
49.617	50.383	nonzero	0.000	0.000	0.000	0.000	0.000	0.000	0.000	0.003	pg1611_o2nofp.cx10a_c8r32
52.887	47.112	nonzero	nonzero	0.000	0.000	0.000	0.000	0.000	0.000	0.009	pg177_o2nofp.cx10a_c8r32
43.297	56.702	nonzero	nonzero	0.000	0.000	0.000	0.000	0.000	0.000	0.009	pg181_o2nofp.cx10b_c8r32
Delete response time histogram
256us	1ms	4ms	16ms	64ms	256ms	1s	4s	16s	gt	max	tag
1.487	31.014	63.272	4.227	nonzero	0.000	0.000	0.000	0.000	0.000	0.037	pg1222_o2nofp.cx10a_c8r32
1.169	28.074	70.726	0.031	0.000	0.000	0.000	0.000	0.000	0.000	0.015	pg1323_o2nofp.cx10a_c8r32
1.142	26.188	71.345	1.325	0.000	0.000	0.000	0.000	0.000	0.000	0.013	pg1420_o2nofp.cx10a_c8r32
1.262	26.013	72.712	0.013	0.000	0.000	0.000	0.000	0.000	0.000	0.015	pg1515_o2nofp.cx10a_c8r32
0.894	20.143	78.947	0.017	0.000	0.000	0.000	0.000	0.000	0.000	0.014	pg1611_o2nofp.cx10a_c8r32
1.191	28.452	52.467	17.890	0.000	0.000	0.000	0.000	0.000	0.000	0.015	pg177_o2nofp.cx10a_c8r32
0.768	21.115	78.101	0.016	0.000	0.000	0.000	0.000	0.000	0.000	0.007	pg181_o2nofp.cx10b_c8r32
qr100.L1
- qr100.L1: range queries with 100 insert/s per client
- Legend for results is here.
- Each entry lists the percentage of responses that fit in that bucket (slower than max time for previous bucket, faster than min time for next bucket).
Query response time histogram
256us	1ms	4ms	16ms	64ms	256ms	1s	4s	16s	gt	max	tag
100.000	nonzero	nonzero	0.000	0.000	0.000	0.000	0.000	0.000	0.000	0.001	pg1222_o2nofp.cx10a_c8r32
100.000	nonzero	0.000	0.000	0.000	0.000	0.000	0.000	0.000	0.000	0.001	pg1323_o2nofp.cx10a_c8r32
100.000	nonzero	nonzero	nonzero	0.000	0.000	0.000	0.000	0.000	0.000	0.010	pg1420_o2nofp.cx10a_c8r32
100.000	nonzero	0.000	0.000	0.000	0.000	0.000	0.000	0.000	0.000	0.001	pg1515_o2nofp.cx10a_c8r32
100.000	nonzero	nonzero	0.000	0.000	0.000	0.000	0.000	0.000	0.000	0.001	pg1611_o2nofp.cx10a_c8r32
100.000	nonzero	0.000	0.000	0.000	0.000	0.000	0.000	0.000	0.000	0.001	pg177_o2nofp.cx10a_c8r32
100.000	nonzero	nonzero	0.000	0.000	0.000	0.000	0.000	0.000	0.000	0.001	pg181_o2nofp.cx10b_c8r32
Insert response time histogram
256us	1ms	4ms	16ms	64ms	256ms	1s	4s	16s	gt	max	tag
0.000	0.000	99.972	0.028	0.000	0.000	0.000	0.000	0.000	0.000	0.006	pg1222_o2nofp.cx10a_c8r32
0.000	0.000	99.972	0.028	0.000	0.000	0.000	0.000	0.000	0.000	0.006	pg1323_o2nofp.cx10a_c8r32
0.000	0.000	99.944	0.056	0.000	0.000	0.000	0.000	0.000	0.000	0.006	pg1420_o2nofp.cx10a_c8r32
0.000	0.028	99.917	0.056	0.000	0.000	0.000	0.000	0.000	0.000	0.006	pg1515_o2nofp.cx10a_c8r32
0.000	0.083	99.861	0.056	0.000	0.000	0.000	0.000	0.000	0.000	0.006	pg1611_o2nofp.cx10a_c8r32
0.000	0.083	99.861	0.056	0.000	0.000	0.000	0.000	0.000	0.000	0.006	pg177_o2nofp.cx10a_c8r32
0.000	0.111	99.833	0.056	0.000	0.000	0.000	0.000	0.000	0.000	0.006	pg181_o2nofp.cx10b_c8r32
Delete response time histogram
256us	1ms	4ms	16ms	64ms	256ms	1s	4s	16s	gt	max	tag
0.000	49.806	50.194	0.000	0.000	0.000	0.000	0.000	0.000	0.000	0.002	pg1222_o2nofp.cx10a_c8r32
0.000	55.611	44.389	0.000	0.000	0.000	0.000	0.000	0.000	0.000	0.002	pg1323_o2nofp.cx10a_c8r32
0.000	60.417	39.583	0.000	0.000	0.000	0.000	0.000	0.000	0.000	0.002	pg1420_o2nofp.cx10a_c8r32
0.000	51.694	48.306	0.000	0.000	0.000	0.000	0.000	0.000	0.000	0.002	pg1515_o2nofp.cx10a_c8r32
0.000	63.194	36.806	0.000	0.000	0.000	0.000	0.000	0.000	0.000	0.002	pg1611_o2nofp.cx10a_c8r32
0.000	49.528	50.472	0.000	0.000	0.000	0.000	0.000	0.000	0.000	0.002	pg177_o2nofp.cx10a_c8r32
0.000	55.472	44.528	0.000	0.000	0.000	0.000	0.000	0.000	0.000	0.002	pg181_o2nofp.cx10b_c8r32
qp100.L2
- qp100.L2: point queries with 100 insert/s per client
- Legend for results is here.
- Each entry lists the percentage of responses that fit in that bucket (slower than max time for previous bucket, faster than min time for next bucket).
Query response time histogram
256us	1ms	4ms	16ms	64ms	256ms	1s	4s	16s	gt	max	tag
99.999	0.001	nonzero	0.000	0.000	0.000	0.000	0.000	0.000	0.000	0.002	pg1222_o2nofp.cx10a_c8r32
99.999	0.001	0.000	0.000	0.000	0.000	0.000	0.000	0.000	0.000	0.001	pg1323_o2nofp.cx10a_c8r32
99.998	0.002	0.000	0.000	0.000	0.000	0.000	0.000	0.000	0.000	0.001	pg1420_o2nofp.cx10a_c8r32
99.999	0.001	nonzero	0.000	0.000	0.000	0.000	0.000	0.000	0.000	0.001	pg1515_o2nofp.cx10a_c8r32
99.999	0.001	0.000	0.000	0.000	0.000	0.000	0.000	0.000	0.000	0.001	pg1611_o2nofp.cx10a_c8r32
99.999	0.001	nonzero	0.000	0.000	0.000	0.000	0.000	0.000	0.000	0.001	pg177_o2nofp.cx10a_c8r32
99.999	0.001	nonzero	0.000	0.000	0.000	0.000	0.000	0.000	0.000	0.001	pg181_o2nofp.cx10b_c8r32
Insert response time histogram
256us	1ms	4ms	16ms	64ms	256ms	1s	4s	16s	gt	max	tag
0.000	0.000	99.944	0.056	0.000	0.000	0.000	0.000	0.000	0.000	0.006	pg1222_o2nofp.cx10a_c8r32
0.000	0.000	99.972	0.028	0.000	0.000	0.000	0.000	0.000	0.000	0.005	pg1323_o2nofp.cx10a_c8r32
0.000	0.000	99.972	0.028	0.000	0.000	0.000	0.000	0.000	0.000	0.006	pg1420_o2nofp.cx10a_c8r32
0.000	0.000	99.944	0.056	0.000	0.000	0.000	0.000	0.000	0.000	0.006	pg1515_o2nofp.cx10a_c8r32
0.000	0.000	99.944	0.056	0.000	0.000	0.000	0.000	0.000	0.000	0.006	pg1611_o2nofp.cx10a_c8r32
0.000	0.000	99.944	0.056	0.000	0.000	0.000	0.000	0.000	0.000	0.005	pg177_o2nofp.cx10a_c8r32
0.000	0.000	99.972	0.028	0.000	0.000	0.000	0.000	0.000	0.000	0.006	pg181_o2nofp.cx10b_c8r32
Delete response time histogram
256us	1ms	4ms	16ms	64ms	256ms	1s	4s	16s	gt	max	tag
0.000	1.528	98.444	0.028	0.000	0.000	0.000	0.000	0.000	0.000	0.005	pg1222_o2nofp.cx10a_c8r32
0.000	0.389	99.583	0.028	0.000	0.000	0.000	0.000	0.000	0.000	0.005	pg1323_o2nofp.cx10a_c8r32
0.000	4.444	95.528	0.028	0.000	0.000	0.000	0.000	0.000	0.000	0.005	pg1420_o2nofp.cx10a_c8r32
0.000	1.222	98.750	0.028	0.000	0.000	0.000	0.000	0.000	0.000	0.004	pg1515_o2nofp.cx10a_c8r32
0.000	3.250	96.722	0.028	0.000	0.000	0.000	0.000	0.000	0.000	0.005	pg1611_o2nofp.cx10a_c8r32
0.000	0.417	99.556	0.028	0.000	0.000	0.000	0.000	0.000	0.000	0.004	pg177_o2nofp.cx10a_c8r32
0.000	0.556	99.417	0.028	0.000	0.000	0.000	0.000	0.000	0.000	0.005	pg181_o2nofp.cx10b_c8r32
qr500.L3
- qr500.L3: range queries with 500 insert/s per client
- Legend for results is here.
- Each entry lists the percentage of responses that fit in that bucket (slower than max time for previous bucket, faster than min time for next bucket).
Query response time histogram
256us	1ms	4ms	16ms	64ms	256ms	1s	4s	16s	gt	max	tag
99.999	0.001	nonzero	0.000	0.000	0.000	0.000	0.000	0.000	0.000	0.002	pg1222_o2nofp.cx10a_c8r32
100.000	nonzero	nonzero	0.000	0.000	0.000	0.000	0.000	0.000	0.000	0.002	pg1323_o2nofp.cx10a_c8r32
99.999	0.001	nonzero	0.000	0.000	0.000	0.000	0.000	0.000	0.000	0.002	pg1420_o2nofp.cx10a_c8r32
99.998	0.002	nonzero	0.000	0.000	0.000	0.000	0.000	0.000	0.000	0.003	pg1515_o2nofp.cx10a_c8r32
99.999	0.001	nonzero	0.000	0.000	0.000	0.000	0.000	0.000	0.000	0.004	pg1611_o2nofp.cx10a_c8r32
100.000	nonzero	nonzero	nonzero	0.000	0.000	0.000	0.000	0.000	0.000	0.007	pg177_o2nofp.cx10a_c8r32
99.999	0.001	nonzero	0.000	0.000	0.000	0.000	0.000	0.000	0.000	0.003	pg181_o2nofp.cx10b_c8r32
Insert response time histogram
256us	1ms	4ms	16ms	64ms	256ms	1s	4s	16s	gt	max	tag
0.000	22.633	77.328	0.039	0.000	0.000	0.000	0.000	0.000	0.000	0.010	pg1222_o2nofp.cx10a_c8r32
0.000	24.278	75.672	0.050	0.000	0.000	0.000	0.000	0.000	0.000	0.009	pg1323_o2nofp.cx10a_c8r32
0.000	27.833	72.133	0.033	0.000	0.000	0.000	0.000	0.000	0.000	0.009	pg1420_o2nofp.cx10a_c8r32
0.000	24.922	74.956	0.122	0.000	0.000	0.000	0.000	0.000	0.000	0.010	pg1515_o2nofp.cx10a_c8r32
0.000	25.756	74.072	0.172	0.000	0.000	0.000	0.000	0.000	0.000	0.010	pg1611_o2nofp.cx10a_c8r32
0.000	18.283	81.461	0.256	0.000	0.000	0.000	0.000	0.000	0.000	0.010	pg177_o2nofp.cx10a_c8r32
0.000	23.850	76.117	0.033	0.000	0.000	0.000	0.000	0.000	0.000	0.009	pg181_o2nofp.cx10b_c8r32
Delete response time histogram
256us	1ms	4ms	16ms	64ms	256ms	1s	4s	16s	gt	max	tag
0.000	1.939	97.222	0.839	0.000	0.000	0.000	0.000	0.000	0.000	0.006	pg1222_o2nofp.cx10a_c8r32
0.000	0.206	97.911	1.883	0.000	0.000	0.000	0.000	0.000	0.000	0.005	pg1323_o2nofp.cx10a_c8r32
0.000	0.883	96.833	2.283	0.000	0.000	0.000	0.000	0.000	0.000	0.006	pg1420_o2nofp.cx10a_c8r32
0.000	0.089	97.717	2.194	0.000	0.000	0.000	0.000	0.000	0.000	0.007	pg1515_o2nofp.cx10a_c8r32
0.000	0.033	97.061	2.906	0.000	0.000	0.000	0.000	0.000	0.000	0.010	pg1611_o2nofp.cx10a_c8r32
0.000	0.000	93.561	6.439	0.000	0.000	0.000	0.000	0.000	0.000	0.011	pg177_o2nofp.cx10a_c8r32
0.000	0.206	96.039	3.756	0.000	0.000	0.000	0.000	0.000	0.000	0.006	pg181_o2nofp.cx10b_c8r32
qp500.L4
- qp500.L4: point queries with 500 insert/s per client
- Legend for results is here.
- Each entry lists the percentage of responses that fit in that bucket (slower than max time for previous bucket, faster than min time for next bucket).
Query response time histogram
256us	1ms	4ms	16ms	64ms	256ms	1s	4s	16s	gt	max	tag
99.996	0.004	nonzero	0.000	0.000	0.000	0.000	0.000	0.000	0.000	0.002	pg1222_o2nofp.cx10a_c8r32
99.996	0.004	nonzero	0.000	0.000	0.000	0.000	0.000	0.000	0.000	0.002	pg1323_o2nofp.cx10a_c8r32
99.996	0.004	nonzero	0.000	0.000	0.000	0.000	0.000	0.000	0.000	0.002	pg1420_o2nofp.cx10a_c8r32
99.996	0.003	nonzero	0.000	0.000	0.000	0.000	0.000	0.000	0.000	0.002	pg1515_o2nofp.cx10a_c8r32
99.996	0.004	nonzero	0.000	0.000	0.000	0.000	0.000	0.000	0.000	0.002	pg1611_o2nofp.cx10a_c8r32
99.997	0.003	nonzero	0.000	0.000	0.000	0.000	0.000	0.000	0.000	0.002	pg177_o2nofp.cx10a_c8r32
99.997	0.003	nonzero	0.000	0.000	0.000	0.000	0.000	0.000	0.000	0.002	pg181_o2nofp.cx10b_c8r32
Insert response time histogram
256us	1ms	4ms	16ms	64ms	256ms	1s	4s	16s	gt	max	tag
0.000	24.639	75.344	0.006	0.011	0.000	0.000	0.000	0.000	0.000	0.020	pg1222_o2nofp.cx10a_c8r32
0.000	28.889	71.100	0.011	0.000	0.000	0.000	0.000	0.000	0.000	0.006	pg1323_o2nofp.cx10a_c8r32
0.000	29.083	70.900	0.006	0.011	0.000	0.000	0.000	0.000	0.000	0.023	pg1420_o2nofp.cx10a_c8r32
0.000	29.894	70.050	0.044	0.011	0.000	0.000	0.000	0.000	0.000	0.021	pg1515_o2nofp.cx10a_c8r32
0.000	32.811	67.161	0.017	0.011	0.000	0.000	0.000	0.000	0.000	0.019	pg1611_o2nofp.cx10a_c8r32
0.000	25.083	74.867	0.044	0.006	0.000	0.000	0.000	0.000	0.000	0.025	pg177_o2nofp.cx10a_c8r32
0.000	26.261	73.567	0.161	0.011	0.000	0.000	0.000	0.000	0.000	0.021	pg181_o2nofp.cx10b_c8r32
Delete response time histogram
256us	1ms	4ms	16ms	64ms	256ms	1s	4s	16s	gt	max	tag
0.000	31.983	63.722	4.289	0.006	0.000	0.000	0.000	0.000	0.000	0.018	pg1222_o2nofp.cx10a_c8r32
0.000	25.189	67.367	7.444	0.000	0.000	0.000	0.000	0.000	0.000	0.013	pg1323_o2nofp.cx10a_c8r32
0.000	26.417	64.244	9.328	0.011	0.000	0.000	0.000	0.000	0.000	0.022	pg1420_o2nofp.cx10a_c8r32
0.000	17.950	71.383	10.656	0.011	0.000	0.000	0.000	0.000	0.000	0.020	pg1515_o2nofp.cx10a_c8r32
0.000	20.267	64.661	15.061	0.011	0.000	0.000	0.000	0.000	0.000	0.017	pg1611_o2nofp.cx10a_c8r32
0.000	18.150	59.767	22.078	0.006	0.000	0.000	0.000	0.000	0.000	0.023	pg177_o2nofp.cx10a_c8r32
0.000	17.322	77.483	5.189	0.006	0.000	0.000	0.000	0.000	0.000	0.019	pg181_o2nofp.cx10b_c8r32
qr1000.L5
- qr1000.L5: range queries with 1000 insert/s per client
- Legend for results is here.
- Each entry lists the percentage of responses that fit in that bucket (slower than max time for previous bucket, faster than min time for next bucket).
Query response time histogram
256us	1ms	4ms	16ms	64ms	256ms	1s	4s	16s	gt	max	tag
99.998	0.002	nonzero	nonzero	0.000	0.000	0.000	0.000	0.000	0.000	0.006	pg1222_o2nofp.cx10a_c8r32
99.998	0.002	nonzero	nonzero	0.000	0.000	0.000	0.000	0.000	0.000	0.005	pg1323_o2nofp.cx10a_c8r32
99.998	0.002	nonzero	nonzero	0.000	0.000	0.000	0.000	0.000	0.000	0.005	pg1420_o2nofp.cx10a_c8r32
99.998	0.002	nonzero	nonzero	0.000	0.000	0.000	0.000	0.000	0.000	0.005	pg1515_o2nofp.cx10a_c8r32
99.998	0.002	nonzero	nonzero	0.000	0.000	0.000	0.000	0.000	0.000	0.005	pg1611_o2nofp.cx10a_c8r32
99.998	0.002	nonzero	nonzero	0.000	0.000	0.000	0.000	0.000	0.000	0.005	pg177_o2nofp.cx10a_c8r32
99.998	0.002	nonzero	nonzero	0.000	0.000	0.000	0.000	0.000	0.000	0.005	pg181_o2nofp.cx10b_c8r32
Insert response time histogram
256us	1ms	4ms	16ms	64ms	256ms	1s	4s	16s	gt	max	tag
0.000	39.497	60.492	0.011	0.000	0.000	0.000	0.000	0.000	0.000	0.010	pg1222_o2nofp.cx10a_c8r32
0.000	44.081	55.917	0.003	0.000	0.000	0.000	0.000	0.000	0.000	0.005	pg1323_o2nofp.cx10a_c8r32
0.000	47.342	52.647	0.011	0.000	0.000	0.000	0.000	0.000	0.000	0.015	pg1420_o2nofp.cx10a_c8r32
0.000	45.494	54.497	0.008	0.000	0.000	0.000	0.000	0.000	0.000	0.007	pg1515_o2nofp.cx10a_c8r32
0.000	46.425	53.561	0.014	0.000	0.000	0.000	0.000	0.000	0.000	0.009	pg1611_o2nofp.cx10a_c8r32
0.000	43.536	56.442	0.019	0.003	0.000	0.000	0.000	0.000	0.000	0.022	pg177_o2nofp.cx10a_c8r32
0.000	48.981	50.981	0.039	0.000	0.000	0.000	0.000	0.000	0.000	0.010	pg181_o2nofp.cx10b_c8r32
Delete response time histogram
256us	1ms	4ms	16ms	64ms	256ms	1s	4s	16s	gt	max	tag
0.000	12.600	85.842	1.558	0.000	0.000	0.000	0.000	0.000	0.000	0.008	pg1222_o2nofp.cx10a_c8r32
0.000	12.308	85.042	2.650	0.000	0.000	0.000	0.000	0.000	0.000	0.008	pg1323_o2nofp.cx10a_c8r32
0.000	10.200	86.756	3.042	0.003	0.000	0.000	0.000	0.000	0.000	0.026	pg1420_o2nofp.cx10a_c8r32
0.000	11.075	84.744	4.181	0.000	0.000	0.000	0.000	0.000	0.000	0.014	pg1515_o2nofp.cx10a_c8r32
0.000	13.181	78.972	7.847	0.000	0.000	0.000	0.000	0.000	0.000	0.008	pg1611_o2nofp.cx10a_c8r32
0.000	9.503	79.394	11.100	0.003	0.000	0.000	0.000	0.000	0.000	0.026	pg177_o2nofp.cx10a_c8r32
0.000	8.900	88.086	3.014	0.000	0.000	0.000	0.000	0.000	0.000	0.010	pg181_o2nofp.cx10b_c8r32
qp1000.L6
- qp1000.L6: point queries with 1000 insert/s per client
- Legend for results is here.
- Each entry lists the percentage of responses that fit in that bucket (slower than max time for previous bucket, faster than min time for next bucket).
Query response time histogram
256us	1ms	4ms	16ms	64ms	256ms	1s	4s	16s	gt	max	tag
99.995	0.005	nonzero	0.000	0.000	0.000	0.000	0.000	0.000	0.000	0.002	pg1222_o2nofp.cx10a_c8r32
99.995	0.005	nonzero	0.000	0.000	0.000	0.000	0.000	0.000	0.000	0.001	pg1323_o2nofp.cx10a_c8r32
99.995	0.005	nonzero	0.000	0.000	0.000	0.000	0.000	0.000	0.000	0.001	pg1420_o2nofp.cx10a_c8r32
99.995	0.005	nonzero	0.000	0.000	0.000	0.000	0.000	0.000	0.000	0.002	pg1515_o2nofp.cx10a_c8r32
99.995	0.005	0.000	0.000	0.000	0.000	0.000	0.000	0.000	0.000	0.001	pg1611_o2nofp.cx10a_c8r32
99.995	0.005	nonzero	0.000	0.000	0.000	0.000	0.000	0.000	0.000	0.002	pg177_o2nofp.cx10a_c8r32
99.995	0.005	nonzero	0.000	0.000	0.000	0.000	0.000	0.000	0.000	0.002	pg181_o2nofp.cx10b_c8r32
Insert response time histogram
256us	1ms	4ms	16ms	64ms	256ms	1s	4s	16s	gt	max	tag
0.000	33.814	66.178	0.008	0.000	0.000	0.000	0.000	0.000	0.000	0.006	pg1222_o2nofp.cx10a_c8r32
0.000	37.381	62.611	0.008	0.000	0.000	0.000	0.000	0.000	0.000	0.006	pg1323_o2nofp.cx10a_c8r32
0.000	36.958	63.022	0.019	0.000	0.000	0.000	0.000	0.000	0.000	0.009	pg1420_o2nofp.cx10a_c8r32
0.000	37.619	62.369	0.011	0.000	0.000	0.000	0.000	0.000	0.000	0.007	pg1515_o2nofp.cx10a_c8r32
0.000	36.086	63.903	0.008	0.003	0.000	0.000	0.000	0.000	0.000	0.029	pg1611_o2nofp.cx10a_c8r32
0.000	32.992	66.989	0.019	0.000	0.000	0.000	0.000	0.000	0.000	0.009	pg177_o2nofp.cx10a_c8r32
0.000	43.967	56.017	0.011	0.006	0.000	0.000	0.000	0.000	0.000	0.028	pg181_o2nofp.cx10b_c8r32
Delete response time histogram
256us	1ms	4ms	16ms	64ms	256ms	1s	4s	16s	gt	max	tag
0.000	15.597	82.672	1.731	0.000	0.000	0.000	0.000	0.000	0.000	0.011	pg1222_o2nofp.cx10a_c8r32
0.000	10.047	85.889	4.064	0.000	0.000	0.000	0.000	0.000	0.000	0.010	pg1323_o2nofp.cx10a_c8r32
0.000	10.192	85.639	4.169	0.000	0.000	0.000	0.000	0.000	0.000	0.011	pg1420_o2nofp.cx10a_c8r32
0.000	10.000	84.331	5.669	0.000	0.000	0.000	0.000	0.000	0.000	0.011	pg1515_o2nofp.cx10a_c8r32
0.000	10.519	80.181	9.297	0.003	0.000	0.000	0.000	0.000	0.000	0.027	pg1611_o2nofp.cx10a_c8r32
0.000	8.997	79.653	11.350	0.000	0.000	0.000	0.000	0.000	0.000	0.012	pg177_o2nofp.cx10a_c8r32
0.000	23.042	73.225	3.728	0.006	0.000	0.000	0.000	0.000	0.000	0.026	pg181_o2nofp.cx10b_c8r32