Introduction
This is a report for the insert benchmark with 800M docs and 1 client(s). It is generated by scripts (bash, awk, sed) and Tufte might not be impressed. An overview of the insert benchmark is here and a short update is here. Below, by DBMS, I mean DBMS+version.config. An example is my8020.c10b40 where my means MySQL, 8020 is version 8.0.20 and c10b40 is the name for the configuration file.
The test server has 8 AMD cores, 32G RAM and an NVMe device for the database. The benchmark was run with 1 client and there were 1 or 3 connections per client (1 for queries or inserts without rate limits, 1+1 for rate limited inserts+deletes). It uses 1 table with a table per client. It loads 800M rows per table without secondary indexes, creates 3 secondary indexes per table, then inserts 4m+1m rows per table with a delete per insert to avoid growing the table. It then does 6 read+write tests for 1800s each that do queries as fast as possible with 100,100,500,500,1000,1000 inserts/s and the same for deletes/s per client concurrent with the queries. The database is larger than memory and the workload is IO-bound for except for the range query tests (qr*). Clients and the DBMS share one server.
The tested DBMS are:
- pg1222_o2nofp.cx10a_c8r32 - Postgres 12.22 with the x10a_c8r32 config
- pg1323_o2nofp.cx10a_c8r32 - Postgres 13.23 with the x10a_c8r32 config
- pg1420_o2nofp.cx10a_c8r32 - Postgres 14.20 with the x10a_c8r32 config
- pg1515_o2nofp.cx10a_c8r32 - Postgres 15.15 with the x10a_c8r32 config
- pg1611_o2nofp.cx10a_c8r32 - Postgres 16.11 with the x10a_c8r32 config
- pg177_o2nofp.cx10a_c8r32 - Postgres 17.7 with the x10b_c8r32 config
- pg181_o2nofp.cx10b_c8r32 - Postgres 18.1 with the x10b_c8r32 config
Contents
- Summary
- l.i0: load without secondary indexes
- l.x: create secondary indexes
- l.i1: continue load after secondary indexes created with 50 inserts per transaction
- l.i2: continue load after secondary indexes created with 5 inserts per transaction
- qr100.L1: range queries with 100 insert/s per client
- qp100.L2: point queries with 100 insert/s per client
- qr500.L3: range queries with 500 insert/s per client
- qp500.L4: point queries with 500 insert/s per client
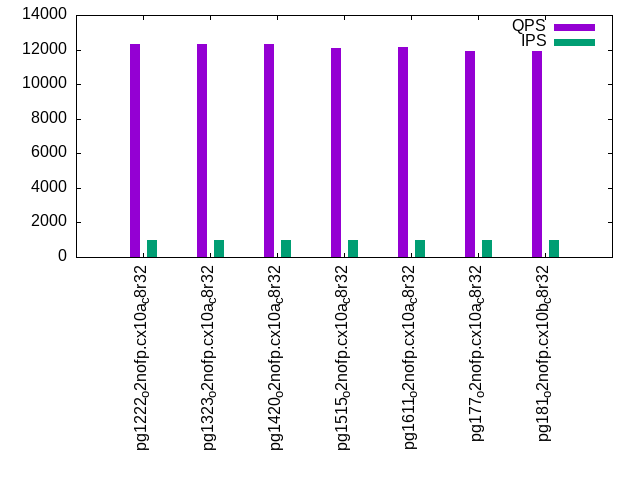
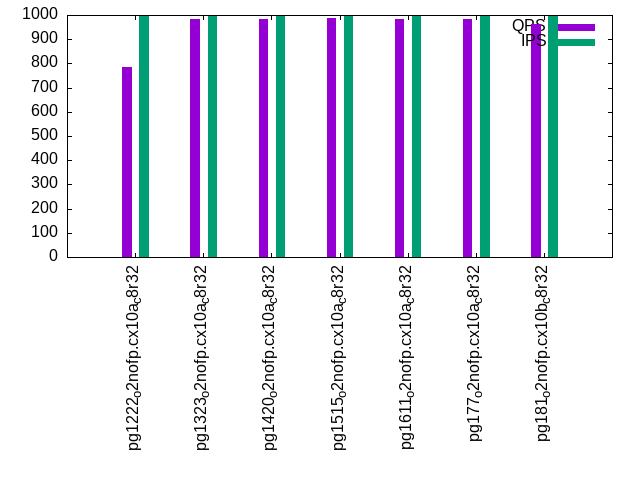
- qr1000.L5: range queries with 1000 insert/s per client
- qp1000.L6: point queries with 1000 insert/s per client
Summary
The numbers are inserts/s for l.i0, l.i1 and l.i2, indexed docs (or rows) /s for l.x and queries/s for qr100, qp100 thru qr1000, qp1000" The values are the average rate over the entire test for inserts (IPS) and queries (QPS). The range of values for IPS and QPS is split into 3 parts: bottom 25%, middle 50%, top 25%. Values in the bottom 25% have a red background, values in the top 25% have a green background and values in the middle have no color. A gray background is used for values that can be ignored because the DBMS did not sustain the target insert rate. Red backgrounds are not used when the minimum value is within 80% of the max value.
| dbms | l.i0 | l.x | l.i1 | l.i2 | qr100 | qp100 | qr500 | qp500 | qr1000 | qp1000 |
|---|---|---|---|---|---|---|---|---|---|---|
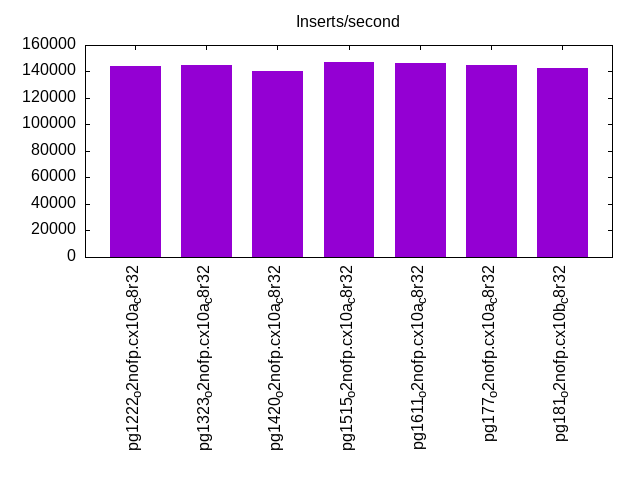
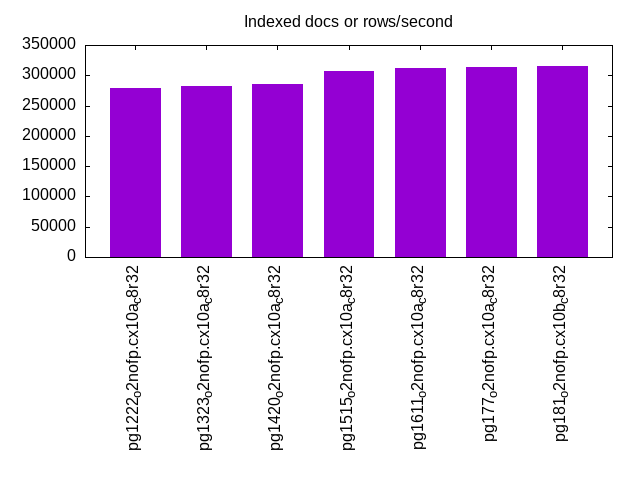
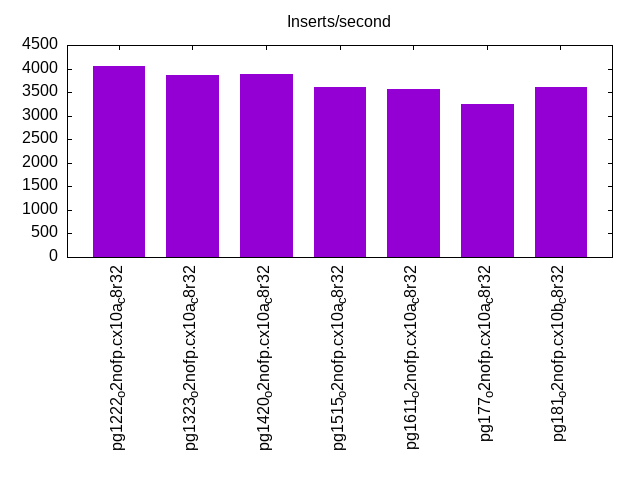
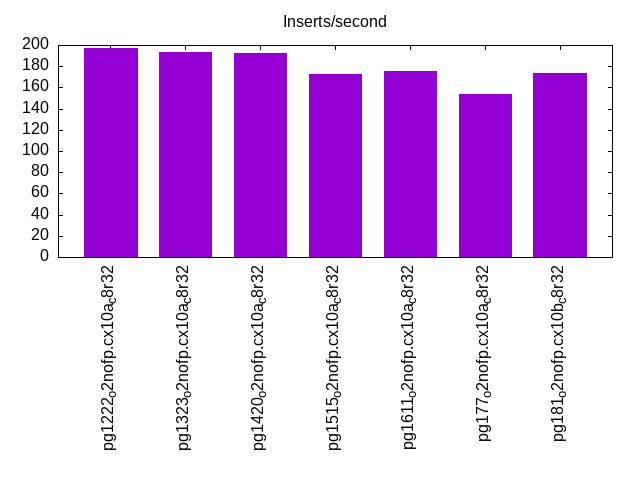
| pg1222_o2nofp.cx10a_c8r32 | 144144 | 278746 | 4048 | 197 | 14589 | 847 | 14035 | 823 | 12298 | 785 |
| pg1323_o2nofp.cx10a_c8r32 | 144718 | 282187 | 3868 | 193 | 14566 | 1053 | 13816 | 1024 | 12331 | 985 |
| pg1420_o2nofp.cx10a_c8r32 | 140130 | 285205 | 3876 | 192 | 14450 | 1055 | 13828 | 1026 | 12317 | 985 |
| pg1515_o2nofp.cx10a_c8r32 | 146843 | 307102 | 3617 | 173 | 14416 | 1060 | 13580 | 1027 | 12086 | 987 |
| pg1611_o2nofp.cx10a_c8r32 | 146493 | 311526 | 3575 | 175 | 14454 | 1059 | 13886 | 1030 | 12165 | 983 |
| pg177_o2nofp.cx10a_c8r32 | 144980 | 313480 | 3241 | 154 | 14404 | 1051 | 13724 | 1023 | 11946 | 983 |
| pg181_o2nofp.cx10b_c8r32 | 142577 | 315085 | 3607 | 174 | 14323 | 1037 | 13557 | 1006 | 11899 | 964 |
This table has relative throughput, throughput for the DBMS relative to the DBMS in the first line, using the absolute throughput from the previous table. Values less than 0.95 have a yellow background. Values greater than 1.05 have a blue background.
| dbms | l.i0 | l.x | l.i1 | l.i2 | qr100 | qp100 | qr500 | qp500 | qr1000 | qp1000 |
|---|---|---|---|---|---|---|---|---|---|---|
| pg1222_o2nofp.cx10a_c8r32 | 1.00 | 1.00 | 1.00 | 1.00 | 1.00 | 1.00 | 1.00 | 1.00 | 1.00 | 1.00 |
| pg1323_o2nofp.cx10a_c8r32 | 1.00 | 1.01 | 0.96 | 0.98 | 1.00 | 1.24 | 0.98 | 1.24 | 1.00 | 1.25 |
| pg1420_o2nofp.cx10a_c8r32 | 0.97 | 1.02 | 0.96 | 0.97 | 0.99 | 1.25 | 0.99 | 1.25 | 1.00 | 1.25 |
| pg1515_o2nofp.cx10a_c8r32 | 1.02 | 1.10 | 0.89 | 0.88 | 0.99 | 1.25 | 0.97 | 1.25 | 0.98 | 1.26 |
| pg1611_o2nofp.cx10a_c8r32 | 1.02 | 1.12 | 0.88 | 0.89 | 0.99 | 1.25 | 0.99 | 1.25 | 0.99 | 1.25 |
| pg177_o2nofp.cx10a_c8r32 | 1.01 | 1.12 | 0.80 | 0.78 | 0.99 | 1.24 | 0.98 | 1.24 | 0.97 | 1.25 |
| pg181_o2nofp.cx10b_c8r32 | 0.99 | 1.13 | 0.89 | 0.88 | 0.98 | 1.22 | 0.97 | 1.22 | 0.97 | 1.23 |
This lists the average rate of inserts/s for the tests that do inserts concurrent with queries. For such tests the query rate is listed in the table above. The read+write tests are setup so that the insert rate should match the target rate every second. Cells that are not at least 95% of the target have a red background to indicate a failure to satisfy the target.
| dbms | qr100.L1 | qp100.L2 | qr500.L3 | qp500.L4 | qr1000.L5 | qp1000.L6 |
|---|---|---|---|---|---|---|
| pg1222_o2nofp.cx10a_c8r32 | 100 | 100 | 500 | 500 | 999 | 999 |
| pg1323_o2nofp.cx10a_c8r32 | 100 | 100 | 500 | 500 | 999 | 999 |
| pg1420_o2nofp.cx10a_c8r32 | 100 | 100 | 500 | 500 | 999 | 999 |
| pg1515_o2nofp.cx10a_c8r32 | 100 | 100 | 500 | 500 | 999 | 999 |
| pg1611_o2nofp.cx10a_c8r32 | 100 | 100 | 500 | 500 | 999 | 999 |
| pg177_o2nofp.cx10a_c8r32 | 100 | 100 | 500 | 500 | 999 | 999 |
| pg181_o2nofp.cx10b_c8r32 | 100 | 100 | 500 | 500 | 999 | 999 |
| target | 100 | 100 | 500 | 500 | 1000 | 1000 |
l.i0
l.i0: load without secondary indexes. Graphs for performance per 1-second interval are here.
Average throughput:
Insert response time histogram: each cell has the percentage of responses that take <= the time in the header and max is the max response time in seconds. For the max column values in the top 25% of the range have a red background and in the bottom 25% of the range have a green background. The red background is not used when the min value is within 80% of the max value.
| dbms | 256us | 1ms | 4ms | 16ms | 64ms | 256ms | 1s | 4s | 16s | gt | max |
|---|---|---|---|---|---|---|---|---|---|---|---|
| pg1222_o2nofp.cx10a_c8r32 | 99.966 | 0.033 | nonzero | nonzero | 0.036 | ||||||
| pg1323_o2nofp.cx10a_c8r32 | 99.955 | 0.042 | 0.003 | 0.001 | 0.037 | ||||||
| pg1420_o2nofp.cx10a_c8r32 | 99.969 | 0.028 | 0.002 | nonzero | 0.037 | ||||||
| pg1515_o2nofp.cx10a_c8r32 | 99.970 | 0.025 | 0.004 | nonzero | 0.039 | ||||||
| pg1611_o2nofp.cx10a_c8r32 | 99.973 | 0.024 | 0.002 | nonzero | 0.037 | ||||||
| pg177_o2nofp.cx10a_c8r32 | 99.973 | 0.024 | 0.003 | nonzero | 0.036 | ||||||
| pg181_o2nofp.cx10b_c8r32 | 99.876 | 0.111 | 0.013 | nonzero | nonzero | 0.064 |
Performance metrics for the DBMS listed above. Some are normalized by throughput, others are not. Legend for results is here.
ips	qps	rps	rmbps	wps	wmbps	rpq	rkbpq	wpi	wkbpi	csps	cpups	cspq	cpupq	dbgb1	dbgb2	rss	maxop	p50	p99	tag
144144	0	29	0.2	587.2	59.2	0.000	0.002	0.004	0.420	17475	20.5	0.121	11	76.5	116.6	19.1	0.036	144782	141784	pg1222_o2nofp.cx10a_c8r32
144718	0	25	0.2	542.7	59.7	0.000	0.001	0.004	0.422	17566	20.9	0.121	12	76.5	116.6	19.3	0.037	145250	142382	pg1323_o2nofp.cx10a_c8r32
140130	0	25	0.2	524.0	57.5	0.000	0.001	0.004	0.420	16501	20.2	0.118	12	76.5	116.6	4.1	0.037	140482	138081	pg1420_o2nofp.cx10a_c8r32
146843	0	28	0.2	555.2	60.9	0.000	0.002	0.004	0.425	17213	20.6	0.117	11	76.5	116.6	2.5	0.039	147280	144583	pg1515_o2nofp.cx10a_c8r32
146493	0	28	0.2	548.7	60.2	0.000	0.002	0.004	0.421	17169	20.7	0.117	11	76.5	116.6	18.2	0.037	146883	144280	pg1611_o2nofp.cx10a_c8r32
144980	0	27	0.2	543.3	59.6	0.000	0.001	0.004	0.421	14438	20.4	0.100	11	76.5	116.6	18.5	0.036	145381	142682	pg177_o2nofp.cx10a_c8r32
142577	0	26	0.2	533.0	58.9	0.000	0.001	0.004	0.423	14427	20.4	0.101	11	76.5	116.6	2.3	0.064	144082	121486	pg181_o2nofp.cx10b_c8r32
Average values from iostat.
r/s	rkB/s	rrqm/s	%rrqm	r_await	rareq-s	w/s	wkB/s	wrqm/s	%wrqm	w_await	wareq-s	d/s	dkB/s	drqm/s	%drqm	d_await	dareq-s	f/s	f_await	aqu-sz	%util
28.66	231.6	0.031	0.402	0.055	2.160	587.3	60603.2	26.93	3.672	0.224	106.8	2.142	21.28	0.000	0.000	0.418	7.207	30.55	1.138	0.171	7.109		pg1222_o2nofp.cx10a_c8r32
25.39	204.4	0.026	0.340	0.053	2.156	542.8	61123.8	28.02	3.962	0.232	112.2	2.182	18.65	0.000	0.000	0.435	6.456	29.93	1.186	0.172	7.252		pg1323_o2nofp.cx10a_c8r32
24.85	198.3	0.008	0.110	0.048	1.767	524.1	58893.9	26.82	3.749	0.230	112.1	2.162	17.82	0.000	0.000	0.403	6.129	28.98	1.119	0.163	6.621		pg1420_o2nofp.cx10a_c8r32
27.75	221.5	0.010	0.253	0.053	1.971	555.4	62424.2	25.03	3.135	0.227	112.3	0.104	6.350	0.000	0.000	0.079	2.721	30.49	1.124	0.171	6.889		pg1515_o2nofp.cx10a_c8r32
27.65	220.9	0.007	0.129	0.048	2.057	548.9	61650.5	23.86	3.161	0.232	112.2	0.111	7.373	0.000	0.000	0.102	4.335	30.34	1.124	0.170	6.853		pg1611_o2nofp.cx10a_c8r32
26.82	215.6	0.002	0.055	0.056	2.019	543.4	61071.5	21.11	2.767	0.237	112.3	0.095	4.711	0.000	0.000	0.070	4.173	30.04	1.125	0.172	6.691		pg177_o2nofp.cx10a_c8r32
25.56	205.7	0.043	0.443	0.059	2.203	533.1	60284.1	20.22	2.732	0.231	112.8	0.090	5.555	0.000	0.000	0.060	2.783	29.60	1.123	0.164	6.590		pg181_o2nofp.cx10b_c8r32
l.x
l.x: create secondary indexes.
Average throughput:
Performance metrics for the DBMS listed above. Some are normalized by throughput, others are not. Legend for results is here.
ips	qps	rps	rmbps	wps	wmbps	rpq	rkbpq	wpi	wkbpi	csps	cpups	cspq	cpupq	dbgb1	dbgb2	rss	maxop	p50	p99	tag
278746	0	779	94.0	1365.0	140.0	0.003	0.345	0.005	0.514	627	13.6	0.002	4	153.8	193.8	23.5	0.003	NA	NA	pg1222_o2nofp.cx10a_c8r32
282187	0	747	92.6	860.1	103.2	0.003	0.336	0.003	0.375	542	13.0	0.002	4	153.6	193.7	23.4	0.004	NA	NA	pg1323_o2nofp.cx10a_c8r32
285205	0	755	93.6	881.4	104.1	0.003	0.336	0.003	0.374	505	13.0	0.002	4	153.6	193.7	23.4	0.004	NA	NA	pg1420_o2nofp.cx10a_c8r32
307102	0	834	103.4	956.6	114.5	0.003	0.345	0.003	0.382	658	13.0	0.002	3	153.6	193.7	23.4	0.004	NA	NA	pg1515_o2nofp.cx10a_c8r32
311526	0	845	104.9	969.8	116.2	0.003	0.345	0.003	0.382	650	13.1	0.002	3	153.6	193.7	23.5	0.004	NA	NA	pg1611_o2nofp.cx10a_c8r32
313480	0	849	105.5	994.6	117.1	0.003	0.345	0.003	0.383	661	13.1	0.002	3	153.6	193.7	23.4	0.003	NA	NA	pg177_o2nofp.cx10a_c8r32
315085	0	853	106.0	999.2	117.6	0.003	0.345	0.003	0.382	663	13.1	0.002	3	153.6	193.7	23.4	0.005	NA	NA	pg181_o2nofp.cx10b_c8r32
Average values from iostat.
r/s	rkB/s	rrqm/s	%rrqm	r_await	rareq-s	w/s	wkB/s	wrqm/s	%wrqm	w_await	wareq-s	d/s	dkB/s	drqm/s	%drqm	d_await	dareq-s	f/s	f_await	aqu-sz	%util
779.4	96225.5	0.014	0.002	0.119	109.1	1367.4	143616	30.46	10.91	0.552	98.75	2.652	16657.3	0.000	0.000	0.737	617.6	12.45	1.166	0.421	15.01		pg1222_o2nofp.cx10a_c8r32
746.6	94824.2	0.007	0.001	0.120	106.8	861.3	105853	20.67	13.50	0.767	99.53	2.890	22929.8	0.000	0.000	0.920	299.7	7.467	1.222	0.339	12.09		pg1323_o2nofp.cx10a_c8r32
754.9	95878.3	0.000	0.000	0.092	106.6	883.0	106749	20.81	13.64	0.749	97.27	2.722	15704.7	0.000	0.000	0.890	188.0	7.514	1.246	0.326	12.08		pg1420_o2nofp.cx10a_c8r32
834.5	105903	0.002	0.000	0.106	107.6	958.5	117482	19.06	11.50	1.235	105.3	0.927	26152.7	0.000	0.000	0.149	526.1	7.828	1.279	0.347	13.35		pg1515_o2nofp.cx10a_c8r32
844.9	107393	0.001	0.000	0.110	107.7	971.7	119270	19.64	11.26	1.198	109.0	0.803	17137.8	0.000	0.000	0.145	294.6	7.862	1.352	0.343	13.30		pg1611_o2nofp.cx10a_c8r32
849.3	108072	0.000	0.000	0.104	108.2	996.5	120143	19.71	11.45	1.161	107.7	0.808	18894.2	0.000	0.000	0.134	466.9	7.898	1.179	0.350	13.16		pg177_o2nofp.cx10a_c8r32
853.1	108560	0.003	0.000	0.094	108.1	1000.8	120578	19.65	12.48	1.152	106.3	0.806	17331.7	0.000	0.000	0.136	258.4	7.933	1.287	0.336	13.16		pg181_o2nofp.cx10b_c8r32
l.i1
l.i1: continue load after secondary indexes created with 50 inserts per transaction. Graphs for performance per 1-second interval are here.
Average throughput:
Insert response time histogram: each cell has the percentage of responses that take <= the time in the header and max is the max response time in seconds. For the max column values in the top 25% of the range have a red background and in the bottom 25% of the range have a green background. The red background is not used when the min value is within 80% of the max value.
| dbms | 256us | 1ms | 4ms | 16ms | 64ms | 256ms | 1s | 4s | 16s | gt | max |
|---|---|---|---|---|---|---|---|---|---|---|---|
| pg1222_o2nofp.cx10a_c8r32 | 0.016 | 99.897 | 0.085 | 0.001 | 0.075 | ||||||
| pg1323_o2nofp.cx10a_c8r32 | 99.941 | 0.059 | 0.037 | ||||||||
| pg1420_o2nofp.cx10a_c8r32 | 99.951 | 0.049 | 0.036 | ||||||||
| pg1515_o2nofp.cx10a_c8r32 | 99.944 | 0.056 | 0.036 | ||||||||
| pg1611_o2nofp.cx10a_c8r32 | 99.926 | 0.074 | 0.035 | ||||||||
| pg177_o2nofp.cx10a_c8r32 | 99.954 | 0.046 | 0.036 | ||||||||
| pg181_o2nofp.cx10b_c8r32 | 99.946 | 0.054 | 0.040 |
Delete response time histogram: each cell has the percentage of responses that take <= the time in the header and max is the max response time in seconds. For the max column values in the top 25% of the range have a red background and in the bottom 25% of the range have a green background. The red background is not used when the min value is within 80% of the max value.
| dbms | 256us | 1ms | 4ms | 16ms | 64ms | 256ms | 1s | 4s | 16s | gt | max |
|---|---|---|---|---|---|---|---|---|---|---|---|
| pg1222_o2nofp.cx10a_c8r32 | 1.144 | 18.168 | 54.024 | 26.664 | 0.001 | 0.074 | |||||
| pg1323_o2nofp.cx10a_c8r32 | 0.925 | 16.724 | 50.331 | 32.020 | 0.031 | ||||||
| pg1420_o2nofp.cx10a_c8r32 | 0.666 | 16.635 | 50.273 | 32.426 | 0.030 | ||||||
| pg1515_o2nofp.cx10a_c8r32 | 1.348 | 16.081 | 45.806 | 36.765 | 0.032 | ||||||
| pg1611_o2nofp.cx10a_c8r32 | 0.571 | 16.061 | 45.495 | 37.872 | 0.032 | ||||||
| pg177_o2nofp.cx10a_c8r32 | 0.537 | 16.544 | 38.741 | 44.177 | 0.035 | ||||||
| pg181_o2nofp.cx10b_c8r32 | 0.589 | 16.305 | 44.462 | 38.644 | 0.034 |
Performance metrics for the DBMS listed above. Some are normalized by throughput, others are not. Legend for results is here.
ips	qps	rps	rmbps	wps	wmbps	rpq	rkbpq	wpi	wkbpi	csps	cpups	cspq	cpupq	dbgb1	dbgb2	rss	maxop	p50	p99	tag
4048	0	5154	40.8	4652.9	81.7	1.273	10.326	1.149	20.663	12526	16.3	3.094	322	154.4	194.5	23.4	0.075	3350	2150	pg1222_o2nofp.cx10a_c8r32
3868	0	5566	44.0	4565.2	78.3	1.439	11.656	1.180	20.729	13298	16.6	3.438	343	154.3	194.3	22.9	0.037	3150	2150	pg1323_o2nofp.cx10a_c8r32
3876	0	5573	44.1	4597.8	79.1	1.438	11.654	1.186	20.908	12814	16.6	3.306	343	154.3	194.3	22.9	0.036	3200	2100	pg1420_o2nofp.cx10a_c8r32
3617	0	5198	41.1	4242.9	72.6	1.437	11.648	1.173	20.548	11927	16.3	3.298	361	154.3	194.3	23.2	0.036	2850	1950	pg1515_o2nofp.cx10a_c8r32
3575	0	5144	40.7	4253.8	73.0	1.439	11.665	1.190	20.922	11782	16.3	3.296	365	154.3	194.3	22.8	0.035	2750	1900	pg1611_o2nofp.cx10a_c8r32
3241	0	4666	36.9	3865.5	66.3	1.440	11.666	1.193	20.930	10540	15.9	3.252	392	154.3	194.3	22.6	0.036	2450	1700	pg177_o2nofp.cx10a_c8r32
3607	0	5188	41.1	4252.1	72.8	1.439	11.661	1.179	20.672	11713	16.1	3.248	357	154.3	194.3	23.0	0.040	2850	1950	pg181_o2nofp.cx10b_c8r32
Average values from iostat.
r/s	rkB/s	rrqm/s	%rrqm	r_await	rareq-s	w/s	wkB/s	wrqm/s	%wrqm	w_await	wareq-s	d/s	dkB/s	drqm/s	%drqm	d_await	dareq-s	f/s	f_await	aqu-sz	%util
5122.4	41551.1	0.000	0.000	0.051	8.124	4673.7	83792.0	18.69	0.756	0.102	44.67	2.024	14.83	0.000	0.000	0.418	6.961	41.17	1.169	0.617	34.03		pg1222_o2nofp.cx10a_c8r32
5534.3	44836.9	0.000	0.000	0.051	8.104	4585.0	80293.3	19.41	1.021	0.108	40.47	2.012	9.740	0.000	0.000	0.431	4.834	41.08	1.172	0.684	35.35		pg1323_o2nofp.cx10a_c8r32
5541.0	44913.4	0.000	0.000	0.052	8.107	4617.6	81141.1	22.88	0.928	0.097	38.09	2.008	10.11	0.000	0.000	0.413	5.027	41.41	1.172	0.694	35.24		pg1420_o2nofp.cx10a_c8r32
5165.4	41868.2	0.000	0.000	0.052	8.108	4259.7	74375.9	21.75	1.484	0.120	41.38	0.011	0.196	0.000	0.000	0.014	0.382	41.06	1.167	0.644	33.41		pg1515_o2nofp.cx10a_c8r32
5111.8	41439.3	0.000	0.000	0.052	8.109	4270.5	74852.1	16.95	0.759	0.103	38.28	0.019	0.195	0.000	0.000	0.029	0.658	38.16	1.202	0.647	32.72		pg1611_o2nofp.cx10a_c8r32
4635.1	37565.4	0.000	0.000	0.051	8.107	3879.1	67874.5	11.70	0.706	0.095	37.71	0.016	0.372	0.000	0.000	0.033	1.633	34.24	1.148	0.540	29.54		pg177_o2nofp.cx10a_c8r32
5156.9	41805.4	0.000	0.000	0.052	8.109	4269.0	74628.4	19.28	1.272	0.116	40.64	0.014	0.313	0.000	0.000	0.024	1.055	40.66	1.151	0.634	33.43		pg181_o2nofp.cx10b_c8r32
l.i2
l.i2: continue load after secondary indexes created with 5 inserts per transaction. Graphs for performance per 1-second interval are here.
Average throughput:
Insert response time histogram: each cell has the percentage of responses that take <= the time in the header and max is the max response time in seconds. For the max column values in the top 25% of the range have a red background and in the bottom 25% of the range have a green background. The red background is not used when the min value is within 80% of the max value.
| dbms | 256us | 1ms | 4ms | 16ms | 64ms | 256ms | 1s | 4s | 16s | gt | max |
|---|---|---|---|---|---|---|---|---|---|---|---|
| pg1222_o2nofp.cx10a_c8r32 | 52.012 | 47.952 | 0.036 | 0.013 | |||||||
| pg1323_o2nofp.cx10a_c8r32 | 55.883 | 44.048 | 0.069 | 0.016 | |||||||
| pg1420_o2nofp.cx10a_c8r32 | 53.168 | 46.767 | 0.065 | 0.013 | |||||||
| pg1515_o2nofp.cx10a_c8r32 | 50.270 | 49.679 | 0.051 | 0.013 | |||||||
| pg1611_o2nofp.cx10a_c8r32 | 47.752 | 52.190 | 0.057 | 0.013 | |||||||
| pg177_o2nofp.cx10a_c8r32 | 57.098 | 42.874 | 0.027 | 0.012 | |||||||
| pg181_o2nofp.cx10b_c8r32 | 57.139 | 42.847 | 0.014 | 0.012 |
Delete response time histogram: each cell has the percentage of responses that take <= the time in the header and max is the max response time in seconds. For the max column values in the top 25% of the range have a red background and in the bottom 25% of the range have a green background. The red background is not used when the min value is within 80% of the max value.
| dbms | 256us | 1ms | 4ms | 16ms | 64ms | 256ms | 1s | 4s | 16s | gt | max |
|---|---|---|---|---|---|---|---|---|---|---|---|
| pg1222_o2nofp.cx10a_c8r32 | 99.999 | 0.001 | 0.098 | ||||||||
| pg1323_o2nofp.cx10a_c8r32 | 99.999 | 0.001 | 0.104 | ||||||||
| pg1420_o2nofp.cx10a_c8r32 | 99.999 | 0.001 | 0.101 | ||||||||
| pg1515_o2nofp.cx10a_c8r32 | 99.999 | 0.001 | 0.100 | ||||||||
| pg1611_o2nofp.cx10a_c8r32 | 99.999 | 0.001 | 0.099 | ||||||||
| pg177_o2nofp.cx10a_c8r32 | 99.999 | 0.001 | 0.098 | ||||||||
| pg181_o2nofp.cx10b_c8r32 | 99.999 | 0.001 | 0.103 |
Performance metrics for the DBMS listed above. Some are normalized by throughput, others are not. Legend for results is here.
ips	qps	rps	rmbps	wps	wmbps	rpq	rkbpq	wpi	wkbpi	csps	cpups	cspq	cpupq	dbgb1	dbgb2	rss	maxop	p50	p99	tag
197	0	212	1.7	506.4	7.0	1.075	8.775	2.575	36.610	1823	13.1	9.267	5328	154.6	194.6	23.4	0.013	195	175	pg1222_o2nofp.cx10a_c8r32
193	0	207	1.7	557.6	7.6	1.072	8.753	2.888	40.181	1856	13.0	9.612	5386	154.4	194.5	23.4	0.016	190	170	pg1323_o2nofp.cx10a_c8r32
192	0	206	1.6	553.2	7.5	1.071	8.754	2.881	40.172	1513	12.9	7.881	5375	154.5	194.5	23.3	0.013	190	170	pg1420_o2nofp.cx10a_c8r32
173	0	186	1.5	503.4	7.0	1.072	8.766	2.907	41.636	1304	12.8	7.527	5912	154.4	194.5	23.3	0.013	170	155	pg1515_o2nofp.cx10a_c8r32
175	0	188	1.5	502.3	7.0	1.073	8.775	2.866	41.072	1328	12.8	7.576	5841	154.4	194.5	23.3	0.013	175	150	pg1611_o2nofp.cx10a_c8r32
154	0	166	1.3	450.8	6.3	1.073	8.771	2.920	41.861	1078	12.7	6.983	6580	154.4	191.5	23.4	0.012	155	135	pg177_o2nofp.cx10a_c8r32
174	0	186	1.5	505.6	7.0	1.071	8.759	2.904	41.165	1189	12.8	6.827	5882	154.5	194.5	23.3	0.012	175	145	pg181_o2nofp.cx10b_c8r32
Average values from iostat.
r/s	rkB/s	rrqm/s	%rrqm	r_await	rareq-s	w/s	wkB/s	wrqm/s	%wrqm	w_await	wareq-s	d/s	dkB/s	drqm/s	%drqm	d_await	dareq-s	f/s	f_await	aqu-sz	%util
211.5	1725.9	0.000	0.000	0.077	8.160	506.2	7199.5	6.600	1.849	0.051	17.40	2.008	9.770	0.000	0.000	0.383	4.822	5.871	1.165	0.043	2.864		pg1222_o2nofp.cx10a_c8r32
206.9	1690.0	0.000	0.000	0.078	8.166	558.1	7763.6	7.266	2.410	0.069	19.53	2.009	9.878	0.000	0.000	0.398	4.846	6.426	1.190	0.046	3.070		pg1323_o2nofp.cx10a_c8r32
205.7	1680.6	0.000	0.000	0.079	8.171	553.7	7718.5	7.775	2.304	0.061	19.10	2.010	10.22	0.000	0.000	0.393	5.034	6.423	1.183	0.046	3.091		pg1420_o2nofp.cx10a_c8r32
185.6	1518.0	0.000	0.000	0.081	8.180	503.9	7215.2	3.773	1.406	0.064	20.24	0.003	0.164	0.000	0.000	0.002	0.137	5.710	1.186	0.040	2.607		pg1515_o2nofp.cx10a_c8r32
188.0	1538.0	0.000	0.000	0.081	8.178	502.8	7204.6	5.184	1.559	0.065	19.46	0.008	0.203	0.000	0.000	0.005	0.108	6.213	1.195	0.043	2.771		pg1611_o2nofp.cx10a_c8r32
165.7	1354.1	0.000	0.000	0.060	8.172	451.1	6467.1	4.051	1.364	0.078	20.26	0.040	489.4	0.000	0.000	0.020	12.58	6.173	1.178	0.039	2.589		pg177_o2nofp.cx10a_c8r32
186.4	1524.8	0.000	0.000	0.059	8.179	506.0	7171.4	3.249	1.262	0.067	19.71	0.001	0.122	0.000	0.000	0.002	0.241	5.763	1.181	0.038	2.597		pg181_o2nofp.cx10b_c8r32
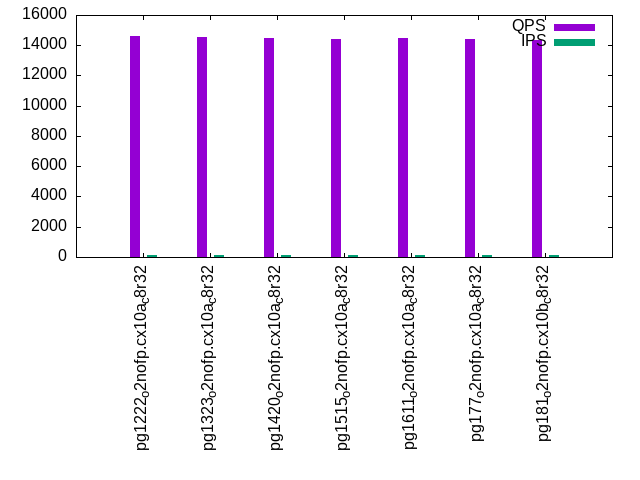
qr100.L1
qr100.L1: range queries with 100 insert/s per client. Graphs for performance per 1-second interval are here.
Average throughput:
Query response time histogram: each cell has the percentage of responses that take <= the time in the header and max is the max response time in seconds. For max values in the top 25% of the range have a red background and in the bottom 25% of the range have a green background. The red background is not used when the min value is within 80% of the max value.
| dbms | 256us | 1ms | 4ms | 16ms | 64ms | 256ms | 1s | 4s | 16s | gt | max |
|---|---|---|---|---|---|---|---|---|---|---|---|
| pg1222_o2nofp.cx10a_c8r32 | 99.997 | 0.002 | nonzero | nonzero | 0.009 | ||||||
| pg1323_o2nofp.cx10a_c8r32 | 99.998 | 0.002 | nonzero | nonzero | 0.009 | ||||||
| pg1420_o2nofp.cx10a_c8r32 | 99.998 | 0.002 | nonzero | nonzero | 0.009 | ||||||
| pg1515_o2nofp.cx10a_c8r32 | 99.998 | 0.002 | nonzero | nonzero | 0.010 | ||||||
| pg1611_o2nofp.cx10a_c8r32 | 99.998 | 0.002 | nonzero | nonzero | 0.009 | ||||||
| pg177_o2nofp.cx10a_c8r32 | 99.998 | 0.002 | nonzero | nonzero | 0.009 | ||||||
| pg181_o2nofp.cx10b_c8r32 | 99.999 | nonzero | nonzero | nonzero | 0.010 |
Insert response time histogram: each cell has the percentage of responses that take <= the time in the header and max is the max response time in seconds. For max values in the top 25% of the range have a red background and in the bottom 25% of the range have a green background. The red background is not used when the min value is within 80% of the max value.
| dbms | 256us | 1ms | 4ms | 16ms | 64ms | 256ms | 1s | 4s | 16s | gt | max |
|---|---|---|---|---|---|---|---|---|---|---|---|
| pg1222_o2nofp.cx10a_c8r32 | 58.111 | 41.889 | 0.021 | ||||||||
| pg1323_o2nofp.cx10a_c8r32 | 76.000 | 24.000 | 0.021 | ||||||||
| pg1420_o2nofp.cx10a_c8r32 | 76.250 | 23.750 | 0.022 | ||||||||
| pg1515_o2nofp.cx10a_c8r32 | 0.028 | 79.917 | 20.056 | 0.023 | |||||||
| pg1611_o2nofp.cx10a_c8r32 | 0.056 | 72.778 | 27.167 | 0.022 | |||||||
| pg177_o2nofp.cx10a_c8r32 | 99.750 | 0.250 | 0.021 | ||||||||
| pg181_o2nofp.cx10b_c8r32 | 0.056 | 99.667 | 0.278 | 0.023 |
Delete response time histogram: each cell has the percentage of responses that take <= the time in the header and max is the max response time in seconds. For max values in the top 25% of the range have a red background and in the bottom 25% of the range have a green background. The red background is not used when the min value is within 80% of the max value.
| dbms | 256us | 1ms | 4ms | 16ms | 64ms | 256ms | 1s | 4s | 16s | gt | max |
|---|---|---|---|---|---|---|---|---|---|---|---|
| pg1222_o2nofp.cx10a_c8r32 | 44.000 | 55.972 | 0.028 | 0.010 | |||||||
| pg1323_o2nofp.cx10a_c8r32 | 54.444 | 45.528 | 0.028 | 0.010 | |||||||
| pg1420_o2nofp.cx10a_c8r32 | 54.750 | 45.194 | 0.056 | 0.010 | |||||||
| pg1515_o2nofp.cx10a_c8r32 | 50.444 | 49.500 | 0.056 | 0.010 | |||||||
| pg1611_o2nofp.cx10a_c8r32 | 52.944 | 47.000 | 0.056 | 0.010 | |||||||
| pg177_o2nofp.cx10a_c8r32 | 50.694 | 49.250 | 0.056 | 0.010 | |||||||
| pg181_o2nofp.cx10b_c8r32 | 48.889 | 51.056 | 0.056 | 0.010 |
Performance metrics for the DBMS listed above. Some are normalized by throughput, others are not. Legend for results is here.
ips	qps	rps	rmbps	wps	wmbps	rpq	rkbpq	wpi	wkbpi	csps	cpups	cspq	cpupq	dbgb1	dbgb2	rss	maxop	p50	p99	tag
100	14589	113	0.9	24.1	1.5	0.008	0.065	0.241	15.600	56024	11.1	3.840	61	154.6	194.7	23.4	0.009	14558	14318	pg1222_o2nofp.cx10a_c8r32
100	14566	112	0.9	56.8	1.8	0.008	0.065	0.568	18.456	55969	12.6	3.842	69	154.5	192.7	23.4	0.009	14542	14334	pg1323_o2nofp.cx10a_c8r32
100	14450	112	0.9	64.5	1.9	0.008	0.066	0.645	19.123	55451	12.5	3.837	69	154.5	191.9	23.3	0.009	14462	14142	pg1420_o2nofp.cx10a_c8r32
100	14416	111	0.9	62.2	1.8	0.008	0.066	0.622	18.892	55280	12.6	3.835	70	154.5	191.9	23.3	0.010	14398	14174	pg1515_o2nofp.cx10a_c8r32
100	14454	112	0.9	62.1	1.8	0.008	0.066	0.622	18.909	55459	12.6	3.837	70	154.5	191.7	23.3	0.009	14478	14190	pg1611_o2nofp.cx10a_c8r32
100	14404	112	0.9	66.2	1.9	0.008	0.066	0.663	19.381	55257	12.5	3.836	69	154.5	190.5	23.4	0.009	14446	14174	pg177_o2nofp.cx10a_c8r32
100	14323	111	0.9	66.8	1.9	0.008	0.064	0.668	19.416	54917	12.5	3.834	70	154.5	193.1	23.3	0.010	14350	14046	pg181_o2nofp.cx10b_c8r32
Average values from iostat.
r/s	rkB/s	rrqm/s	%rrqm	r_await	rareq-s	w/s	wkB/s	wrqm/s	%wrqm	w_await	wareq-s	d/s	dkB/s	drqm/s	%drqm	d_await	dareq-s	f/s	f_await	aqu-sz	%util
109.7	924.1	0.000	0.000	0.163	8.423	24.08	1559.7	4.230	15.14	1.622	66.55	2.000	9.598	0.000	0.000	1.536	4.799	3.706	1.613	0.065	3.737		pg1222_o2nofp.cx10a_c8r32
108.6	923.2	0.000	0.000	0.139	8.497	56.89	1846.1	4.114	12.34	2.235	57.26	2.000	9.595	0.000	0.000	1.420	4.798	3.713	1.420	0.218	3.917		pg1323_o2nofp.cx10a_c8r32
108.6	927.3	0.000	0.000	0.136	8.534	64.66	1912.9	4.556	12.49	2.547	54.00	2.001	9.997	0.000	0.000	1.163	5.457	3.709	1.402	0.284	3.971		pg1420_o2nofp.cx10a_c8r32
108.4	921.8	0.000	0.000	0.134	8.501	62.35	1889.9	1.792	5.798	2.885	58.83	0.001	0.002	0.000	0.000	0.003	0.011	3.675	1.394	0.320	3.889		pg1515_o2nofp.cx10a_c8r32
108.8	920.0	0.000	0.000	0.140	8.448	62.20	1889.7	1.803	5.857	2.653	59.59	0.001	0.002	0.000	0.000	0.000	0.011	3.700	1.518	0.275	3.846		pg1611_o2nofp.cx10a_c8r32
108.5	895.4	0.000	0.000	0.121	8.254	66.31	1936.7	1.467	4.995	2.690	61.28	0.001	0.002	0.000	0.000	0.000	0.011	2.781	1.374	0.306	3.790		pg177_o2nofp.cx10a_c8r32
108.0	897.8	0.000	0.000	0.123	8.315	66.95	1942.4	1.621	5.312	2.696	60.29	0.001	0.002	0.000	0.000	0.000	0.011	2.804	1.347	0.302	3.755		pg181_o2nofp.cx10b_c8r32
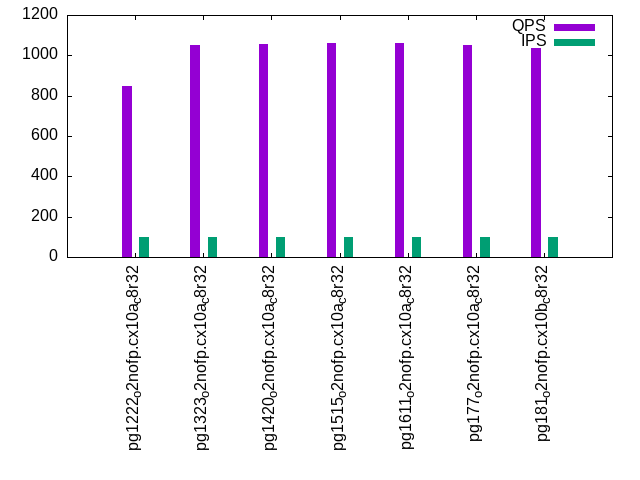
qp100.L2
qp100.L2: point queries with 100 insert/s per client. Graphs for performance per 1-second interval are here.
Average throughput:
Query response time histogram: each cell has the percentage of responses that take <= the time in the header and max is the max response time in seconds. For max values in the top 25% of the range have a red background and in the bottom 25% of the range have a green background. The red background is not used when the min value is within 80% of the max value.
| dbms | 256us | 1ms | 4ms | 16ms | 64ms | 256ms | 1s | 4s | 16s | gt | max |
|---|---|---|---|---|---|---|---|---|---|---|---|
| pg1222_o2nofp.cx10a_c8r32 | 22.661 | 77.330 | 0.009 | 0.014 | |||||||
| pg1323_o2nofp.cx10a_c8r32 | 68.011 | 31.984 | 0.006 | 0.013 | |||||||
| pg1420_o2nofp.cx10a_c8r32 | nonzero | 68.450 | 31.546 | 0.004 | 0.015 | ||||||
| pg1515_o2nofp.cx10a_c8r32 | nonzero | 69.079 | 30.916 | 0.005 | 0.013 | ||||||
| pg1611_o2nofp.cx10a_c8r32 | nonzero | 69.461 | 30.517 | 0.017 | 0.005 | 0.019 | |||||
| pg177_o2nofp.cx10a_c8r32 | nonzero | 67.738 | 32.259 | 0.003 | 0.013 | ||||||
| pg181_o2nofp.cx10b_c8r32 | nonzero | 65.091 | 34.893 | 0.009 | 0.006 | 0.021 |
Insert response time histogram: each cell has the percentage of responses that take <= the time in the header and max is the max response time in seconds. For max values in the top 25% of the range have a red background and in the bottom 25% of the range have a green background. The red background is not used when the min value is within 80% of the max value.
| dbms | 256us | 1ms | 4ms | 16ms | 64ms | 256ms | 1s | 4s | 16s | gt | max |
|---|---|---|---|---|---|---|---|---|---|---|---|
| pg1222_o2nofp.cx10a_c8r32 | 99.528 | 0.472 | 0.023 | ||||||||
| pg1323_o2nofp.cx10a_c8r32 | 99.917 | 0.083 | 0.024 | ||||||||
| pg1420_o2nofp.cx10a_c8r32 | 99.889 | 0.111 | 0.023 | ||||||||
| pg1515_o2nofp.cx10a_c8r32 | 99.806 | 0.194 | 0.022 | ||||||||
| pg1611_o2nofp.cx10a_c8r32 | 99.806 | 0.194 | 0.019 | ||||||||
| pg177_o2nofp.cx10a_c8r32 | 99.972 | 0.028 | 0.020 | ||||||||
| pg181_o2nofp.cx10b_c8r32 | 99.778 | 0.222 | 0.022 |
Delete response time histogram: each cell has the percentage of responses that take <= the time in the header and max is the max response time in seconds. For max values in the top 25% of the range have a red background and in the bottom 25% of the range have a green background. The red background is not used when the min value is within 80% of the max value.
| dbms | 256us | 1ms | 4ms | 16ms | 64ms | 256ms | 1s | 4s | 16s | gt | max |
|---|---|---|---|---|---|---|---|---|---|---|---|
| pg1222_o2nofp.cx10a_c8r32 | 6.250 | 93.694 | 0.056 | 0.008 | |||||||
| pg1323_o2nofp.cx10a_c8r32 | 0.167 | 99.806 | 0.028 | 0.009 | |||||||
| pg1420_o2nofp.cx10a_c8r32 | 0.194 | 99.778 | 0.028 | 0.009 | |||||||
| pg1515_o2nofp.cx10a_c8r32 | 0.361 | 99.611 | 0.028 | 0.009 | |||||||
| pg1611_o2nofp.cx10a_c8r32 | 99.861 | 0.139 | 0.010 | ||||||||
| pg177_o2nofp.cx10a_c8r32 | 99.972 | 0.028 | 0.009 | ||||||||
| pg181_o2nofp.cx10b_c8r32 | 99.806 | 0.194 | 0.010 |
Performance metrics for the DBMS listed above. Some are normalized by throughput, others are not. Legend for results is here.
ips	qps	rps	rmbps	wps	wmbps	rpq	rkbpq	wpi	wkbpi	csps	cpups	cspq	cpupq	dbgb1	dbgb2	rss	maxop	p50	p99	tag
100	847	10669	83.8	403.8	4.5	12.602	101.382	4.038	46.075	23904	3.9	28.236	369	154.6	193.6	23.4	0.014	880	560	pg1222_o2nofp.cx10a_c8r32
100	1053	13120	103.0	373.5	4.3	12.462	100.225	3.739	43.727	29392	5.4	27.918	410	154.5	192.7	23.4	0.013	1088	688	pg1323_o2nofp.cx10a_c8r32
100	1055	13143	103.3	366.0	4.2	12.454	100.245	3.663	43.139	29334	5.3	27.795	402	154.5	191.9	23.3	0.015	1088	704	pg1420_o2nofp.cx10a_c8r32
100	1060	13179	103.6	363.9	4.2	12.439	100.143	3.639	42.876	29364	5.2	27.715	393	154.5	191.9	23.3	0.013	1088	704	pg1515_o2nofp.cx10a_c8r32
100	1059	13181	103.7	364.4	4.2	12.447	100.265	3.644	42.928	29367	5.5	27.731	415	154.5	191.7	23.3	0.019	1088	704	pg1611_o2nofp.cx10a_c8r32
100	1051	13092	102.9	357.6	4.1	12.460	100.284	3.579	42.463	29151	5.5	27.744	419	154.5	190.6	23.4	0.013	1088	688	pg177_o2nofp.cx10a_c8r32
100	1037	12962	102.0	356.6	4.1	12.497	100.682	3.566	42.355	28851	5.7	27.816	440	154.5	193.1	23.3	0.021	1072	688	pg181_o2nofp.cx10b_c8r32
Average values from iostat.
r/s	rkB/s	rrqm/s	%rrqm	r_await	rareq-s	w/s	wkB/s	wrqm/s	%wrqm	w_await	wareq-s	d/s	dkB/s	drqm/s	%drqm	d_await	dareq-s	f/s	f_await	aqu-sz	%util
10669.0	85830.3	0.000	0.000	0.066	8.045	402.8	4597.9	5.897	2.452	0.051	14.26	2.041	648.5	0.000	0.000	0.369	42.82	4.163	1.206	0.715	70.66		pg1222_o2nofp.cx10a_c8r32
13120.2	105517	0.000	0.000	0.050	8.042	372.2	4358.2	5.705	2.361	0.049	14.03	2.001	18.73	0.000	0.000	0.375	8.945	4.286	1.221	0.646	60.47		pg1323_o2nofp.cx10a_c8r32
13143.4	105800	0.000	0.000	0.050	8.049	364.8	4300.7	6.204	2.570	0.049	14.02	2.002	19.12	0.000	0.000	0.373	8.797	4.301	1.223	0.646	60.35		pg1420_o2nofp.cx10a_c8r32
13178.9	106101	0.000	0.000	0.050	8.051	362.8	4278.9	3.050	1.271	0.048	14.06	0.001	0.002	0.000	0.000	0.000	0.011	4.335	1.227	0.645	60.38		pg1515_o2nofp.cx10a_c8r32
13181.0	106182	0.000	0.000	0.050	8.056	363.2	4283.7	3.384	1.432	0.050	14.12	0.001	0.002	0.000	0.000	0.000	0.011	4.324	1.228	0.643	60.11		pg1611_o2nofp.cx10a_c8r32
13091.6	105370	0.000	0.000	0.050	8.049	356.5	4234.0	2.364	0.990	0.049	14.18	0.002	9.132	0.000	0.000	0.003	45.66	3.643	1.214	0.641	60.42		pg177_o2nofp.cx10a_c8r32
12961.7	104428	0.000	0.000	0.050	8.056	355.6	4227.8	2.383	1.032	0.048	14.25	0.001	0.002	0.000	0.000	0.003	0.011	3.631	1.215	0.631	59.88		pg181_o2nofp.cx10b_c8r32
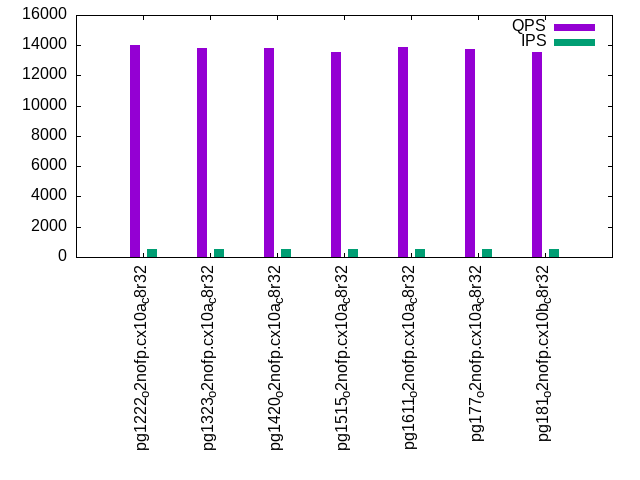
qr500.L3
qr500.L3: range queries with 500 insert/s per client. Graphs for performance per 1-second interval are here.
Average throughput:
Query response time histogram: each cell has the percentage of responses that take <= the time in the header and max is the max response time in seconds. For max values in the top 25% of the range have a red background and in the bottom 25% of the range have a green background. The red background is not used when the min value is within 80% of the max value.
| dbms | 256us | 1ms | 4ms | 16ms | 64ms | 256ms | 1s | 4s | 16s | gt | max |
|---|---|---|---|---|---|---|---|---|---|---|---|
| pg1222_o2nofp.cx10a_c8r32 | 99.992 | 0.007 | nonzero | 0.001 | nonzero | 0.033 | |||||
| pg1323_o2nofp.cx10a_c8r32 | 99.994 | 0.005 | nonzero | 0.001 | nonzero | 0.042 | |||||
| pg1420_o2nofp.cx10a_c8r32 | 99.995 | 0.004 | nonzero | 0.001 | nonzero | 0.022 | |||||
| pg1515_o2nofp.cx10a_c8r32 | 99.994 | 0.005 | 0.001 | 0.001 | nonzero | 0.026 | |||||
| pg1611_o2nofp.cx10a_c8r32 | 99.995 | 0.005 | nonzero | nonzero | nonzero | 0.024 | |||||
| pg177_o2nofp.cx10a_c8r32 | 99.995 | 0.004 | nonzero | nonzero | nonzero | 0.022 | |||||
| pg181_o2nofp.cx10b_c8r32 | 99.995 | 0.004 | nonzero | nonzero | nonzero | 0.030 |
Insert response time histogram: each cell has the percentage of responses that take <= the time in the header and max is the max response time in seconds. For max values in the top 25% of the range have a red background and in the bottom 25% of the range have a green background. The red background is not used when the min value is within 80% of the max value.
| dbms | 256us | 1ms | 4ms | 16ms | 64ms | 256ms | 1s | 4s | 16s | gt | max |
|---|---|---|---|---|---|---|---|---|---|---|---|
| pg1222_o2nofp.cx10a_c8r32 | 91.728 | 8.272 | 0.023 | ||||||||
| pg1323_o2nofp.cx10a_c8r32 | 93.306 | 6.694 | 0.025 | ||||||||
| pg1420_o2nofp.cx10a_c8r32 | 93.633 | 6.367 | 0.024 | ||||||||
| pg1515_o2nofp.cx10a_c8r32 | 93.361 | 6.639 | 0.030 | ||||||||
| pg1611_o2nofp.cx10a_c8r32 | 93.200 | 6.800 | 0.024 | ||||||||
| pg177_o2nofp.cx10a_c8r32 | 94.083 | 5.917 | 0.023 | ||||||||
| pg181_o2nofp.cx10b_c8r32 | 94.161 | 5.839 | 0.025 |
Delete response time histogram: each cell has the percentage of responses that take <= the time in the header and max is the max response time in seconds. For max values in the top 25% of the range have a red background and in the bottom 25% of the range have a green background. The red background is not used when the min value is within 80% of the max value.
| dbms | 256us | 1ms | 4ms | 16ms | 64ms | 256ms | 1s | 4s | 16s | gt | max |
|---|---|---|---|---|---|---|---|---|---|---|---|
| pg1222_o2nofp.cx10a_c8r32 | 49.756 | 50.244 | 0.015 | ||||||||
| pg1323_o2nofp.cx10a_c8r32 | 46.100 | 53.900 | 0.016 | ||||||||
| pg1420_o2nofp.cx10a_c8r32 | 45.972 | 54.028 | 0.015 | ||||||||
| pg1515_o2nofp.cx10a_c8r32 | 40.822 | 59.178 | 0.015 | ||||||||
| pg1611_o2nofp.cx10a_c8r32 | 45.050 | 54.950 | 0.015 | ||||||||
| pg177_o2nofp.cx10a_c8r32 | 42.761 | 57.239 | 0.015 | ||||||||
| pg181_o2nofp.cx10b_c8r32 | 45.367 | 54.633 | 0.015 |
Performance metrics for the DBMS listed above. Some are normalized by throughput, others are not. Legend for results is here.
ips	qps	rps	rmbps	wps	wmbps	rpq	rkbpq	wpi	wkbpi	csps	cpups	cspq	cpupq	dbgb1	dbgb2	rss	maxop	p50	p99	tag
500	14035	874	7.0	195.3	7.6	0.062	0.508	0.391	15.593	55596	12.1	3.961	69	154.7	191.1	23.4	0.033	14046	13519	pg1222_o2nofp.cx10a_c8r32
500	13816	876	7.0	300.2	8.8	0.063	0.517	0.601	18.126	54804	13.6	3.967	79	154.6	190.5	23.4	0.042	13822	13358	pg1323_o2nofp.cx10a_c8r32
500	13828	876	7.0	325.1	9.1	0.063	0.517	0.651	18.680	54737	13.6	3.958	79	154.6	190.1	23.3	0.022	13854	13342	pg1420_o2nofp.cx10a_c8r32
500	13580	876	7.0	322.7	9.1	0.065	0.526	0.645	18.615	53723	13.7	3.956	81	154.6	190.3	23.3	0.026	13582	13086	pg1515_o2nofp.cx10a_c8r32
500	13886	875	7.0	321.6	9.1	0.063	0.515	0.643	18.588	54891	13.7	3.953	79	154.6	190.3	23.3	0.024	13902	13438	pg1611_o2nofp.cx10a_c8r32
500	13724	875	7.0	339.0	9.3	0.064	0.520	0.678	18.975	54240	13.7	3.952	80	154.6	190.1	23.4	0.022	13742	13230	pg177_o2nofp.cx10a_c8r32
500	13557	874	7.0	341.5	9.3	0.065	0.527	0.684	19.037	53635	13.7	3.956	81	154.6	190.6	23.3	0.030	13567	13134	pg181_o2nofp.cx10b_c8r32
Average values from iostat.
r/s	rkB/s	rrqm/s	%rrqm	r_await	rareq-s	w/s	wkB/s	wrqm/s	%wrqm	w_await	wareq-s	d/s	dkB/s	drqm/s	%drqm	d_await	dareq-s	f/s	f_await	aqu-sz	%util
866.0	7032.1	0.000	0.000	0.080	8.121	195.4	7791.6	5.700	4.358	0.697	68.69	2.099	1488.4	0.000	0.000	1.384	67.17	8.127	1.223	0.155	9.322		pg1222_o2nofp.cx10a_c8r32
867.2	7046.2	0.000	0.000	0.063	8.127	300.7	9057.9	5.802	4.753	0.614	70.13	2.091	1342.3	0.000	0.000	1.038	43.53	8.229	1.256	0.150	7.672		pg1323_o2nofp.cx10a_c8r32
867.2	7056.2	0.000	0.000	0.063	8.138	325.7	9337.5	6.416	5.090	0.588	68.15	2.069	1068.9	0.000	0.000	1.125	44.79	8.264	1.250	0.154	7.595		pg1420_o2nofp.cx10a_c8r32
867.2	7051.8	0.000	0.000	0.062	8.134	323.1	9307.0	3.071	2.392	0.594	69.82	0.067	985.9	0.000	0.000	0.002	86.93	8.254	1.270	0.142	7.386		pg1515_o2nofp.cx10a_c8r32
866.6	7051.5	0.000	0.000	0.062	8.139	322.0	9295.8	3.198	2.427	0.590	70.25	0.061	885.5	0.000	0.000	0.004	41.01	8.286	1.262	0.142	7.430		pg1611_o2nofp.cx10a_c8r32
866.7	7048.5	0.000	0.000	0.059	8.135	339.5	9490.5	2.366	1.759	0.550	66.86	0.025	328.7	0.000	0.000	0.001	38.24	7.665	1.229	0.143	7.209		pg177_o2nofp.cx10a_c8r32
866.3	7055.3	0.000	0.000	0.059	8.146	342.2	9516.4	2.888	1.957	0.524	65.76	0.099	1478.8	0.000	0.000	0.005	42.30	7.593	1.217	0.141	7.156		pg181_o2nofp.cx10b_c8r32
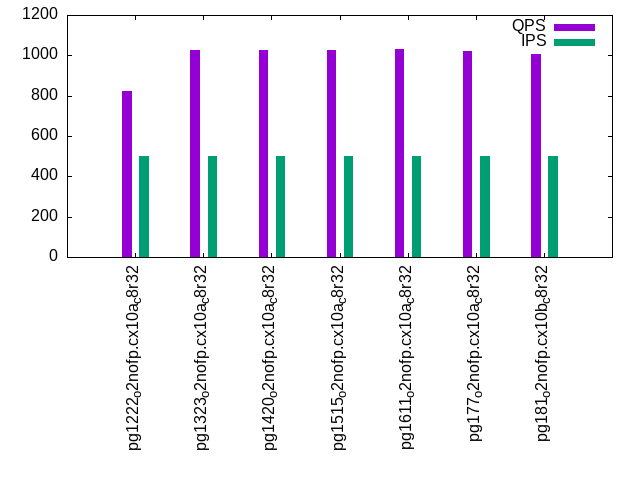
qp500.L4
qp500.L4: point queries with 500 insert/s per client. Graphs for performance per 1-second interval are here.
Average throughput:
Query response time histogram: each cell has the percentage of responses that take <= the time in the header and max is the max response time in seconds. For max values in the top 25% of the range have a red background and in the bottom 25% of the range have a green background. The red background is not used when the min value is within 80% of the max value.
| dbms | 256us | 1ms | 4ms | 16ms | 64ms | 256ms | 1s | 4s | 16s | gt | max |
|---|---|---|---|---|---|---|---|---|---|---|---|
| pg1222_o2nofp.cx10a_c8r32 | 17.474 | 82.511 | 0.015 | 0.016 | |||||||
| pg1323_o2nofp.cx10a_c8r32 | nonzero | 61.825 | 38.167 | 0.007 | 0.014 | ||||||
| pg1420_o2nofp.cx10a_c8r32 | nonzero | 62.646 | 37.346 | 0.008 | 0.013 | ||||||
| pg1515_o2nofp.cx10a_c8r32 | 62.777 | 37.217 | 0.006 | nonzero | 0.019 | ||||||
| pg1611_o2nofp.cx10a_c8r32 | nonzero | 63.329 | 36.646 | 0.021 | 0.004 | 0.019 | |||||
| pg177_o2nofp.cx10a_c8r32 | nonzero | 62.004 | 37.990 | 0.006 | nonzero | 0.023 | |||||
| pg181_o2nofp.cx10b_c8r32 | 57.592 | 42.400 | 0.007 | 0.014 |
Insert response time histogram: each cell has the percentage of responses that take <= the time in the header and max is the max response time in seconds. For max values in the top 25% of the range have a red background and in the bottom 25% of the range have a green background. The red background is not used when the min value is within 80% of the max value.
| dbms | 256us | 1ms | 4ms | 16ms | 64ms | 256ms | 1s | 4s | 16s | gt | max |
|---|---|---|---|---|---|---|---|---|---|---|---|
| pg1222_o2nofp.cx10a_c8r32 | 99.911 | 0.089 | 0.023 | ||||||||
| pg1323_o2nofp.cx10a_c8r32 | 99.933 | 0.067 | 0.023 | ||||||||
| pg1420_o2nofp.cx10a_c8r32 | 99.967 | 0.033 | 0.030 | ||||||||
| pg1515_o2nofp.cx10a_c8r32 | 99.961 | 0.039 | 0.024 | ||||||||
| pg1611_o2nofp.cx10a_c8r32 | 99.789 | 0.211 | 0.023 | ||||||||
| pg177_o2nofp.cx10a_c8r32 | 99.917 | 0.083 | 0.028 | ||||||||
| pg181_o2nofp.cx10b_c8r32 | 99.939 | 0.061 | 0.020 |
Delete response time histogram: each cell has the percentage of responses that take <= the time in the header and max is the max response time in seconds. For max values in the top 25% of the range have a red background and in the bottom 25% of the range have a green background. The red background is not used when the min value is within 80% of the max value.
| dbms | 256us | 1ms | 4ms | 16ms | 64ms | 256ms | 1s | 4s | 16s | gt | max |
|---|---|---|---|---|---|---|---|---|---|---|---|
| pg1222_o2nofp.cx10a_c8r32 | 99.917 | 0.083 | 0.042 | ||||||||
| pg1323_o2nofp.cx10a_c8r32 | 98.156 | 1.844 | 0.045 | ||||||||
| pg1420_o2nofp.cx10a_c8r32 | 98.300 | 1.700 | 0.043 | ||||||||
| pg1515_o2nofp.cx10a_c8r32 | 99.072 | 0.928 | 0.043 | ||||||||
| pg1611_o2nofp.cx10a_c8r32 | 97.983 | 2.017 | 0.043 | ||||||||
| pg177_o2nofp.cx10a_c8r32 | 95.572 | 4.428 | 0.042 | ||||||||
| pg181_o2nofp.cx10b_c8r32 | 97.822 | 2.178 | 0.043 |
Performance metrics for the DBMS listed above. Some are normalized by throughput, others are not. Legend for results is here.
ips	qps	rps	rmbps	wps	wmbps	rpq	rkbpq	wpi	wkbpi	csps	cpups	cspq	cpupq	dbgb1	dbgb2	rss	maxop	p50	p99	tag
500	823	11341	89.0	1760.9	19.9	13.773	110.664	3.522	40.746	25322	5.6	30.753	544	154.8	189.2	23.4	0.016	848	640	pg1222_o2nofp.cx10a_c8r32
500	1024	13730	107.7	1655.5	19.1	13.414	107.761	3.311	39.106	30683	7.0	29.975	547	154.6	189.0	23.4	0.014	1040	784	pg1323_o2nofp.cx10a_c8r32
500	1026	13771	108.1	1630.6	18.9	13.416	107.843	3.263	38.725	30595	6.9	29.805	538	154.6	188.6	23.3	0.013	1056	784	pg1420_o2nofp.cx10a_c8r32
500	1027	13775	108.1	1628.0	18.9	13.411	107.808	3.258	38.682	30551	7.0	29.745	545	154.6	188.7	23.3	0.019	1056	784	pg1515_o2nofp.cx10a_c8r32
500	1030	13799	108.4	1629.2	18.9	13.404	107.794	3.258	38.664	30608	7.7	29.731	598	154.6	188.7	23.3	0.019	1056	800	pg1611_o2nofp.cx10a_c8r32
500	1023	13730	107.8	1613.7	18.7	13.421	107.867	3.229	38.416	30417	7.2	29.733	563	154.6	188.4	23.4	0.023	1040	784	pg177_o2nofp.cx10a_c8r32
500	1006	13567	106.6	1609.5	18.7	13.485	108.451	3.221	38.343	30042	7.1	29.860	565	154.6	188.8	23.3	0.014	1024	784	pg181_o2nofp.cx10b_c8r32
Average values from iostat.
r/s	rkB/s	rrqm/s	%rrqm	r_await	rareq-s	w/s	wkB/s	wrqm/s	%wrqm	w_await	wareq-s	d/s	dkB/s	drqm/s	%drqm	d_await	dareq-s	f/s	f_await	aqu-sz	%util
11343.7	91143.7	0.000	0.000	0.069	8.035	1746.6	20243.5	7.955	0.611	0.036	13.23	2.079	1205.3	0.000	0.000	0.369	48.75	9.321	1.172	0.811	72.45		pg1222_o2nofp.cx10a_c8r32
13733.8	110334	0.000	0.000	0.050	8.033	1641.2	19438.6	7.570	0.593	0.037	13.35	2.061	940.6	0.000	0.000	0.385	79.48	9.300	1.189	0.732	62.87		pg1323_o2nofp.cx10a_c8r32
13774.6	110730	0.000	0.000	0.050	8.039	1617.7	19248.4	7.883	0.630	0.035	13.36	2.060	977.5	0.000	0.000	0.384	43.04	9.294	1.192	0.730	62.49		pg1420_o2nofp.cx10a_c8r32
13778.1	110758	0.000	0.000	0.050	8.039	1615.3	19228.7	4.937	0.396	0.035	13.38	0.062	976.7	0.000	0.000	0.001	44.00	9.301	1.185	0.727	62.46		pg1515_o2nofp.cx10a_c8r32
13802.4	110999	0.000	0.000	0.050	8.042	1616.1	19228.0	5.362	0.427	0.033	13.38	0.061	985.8	0.000	0.000	0.004	45.23	9.290	1.170	0.725	61.99		pg1611_o2nofp.cx10a_c8r32
13733.3	110375	0.000	0.000	0.050	8.037	1602.8	19110.9	4.196	0.340	0.037	13.37	0.068	1031.4	0.000	0.000	0.001	42.63	9.838	1.181	0.731	62.56		pg177_o2nofp.cx10a_c8r32
13570.0	109138	0.000	0.000	0.050	8.042	1598.9	19076.8	4.346	0.343	0.040	13.37	0.074	1140.9	0.000	0.000	0.005	86.15	9.919	1.179	0.726	62.84		pg181_o2nofp.cx10b_c8r32
qr1000.L5
qr1000.L5: range queries with 1000 insert/s per client. Graphs for performance per 1-second interval are here.
Average throughput:
Query response time histogram: each cell has the percentage of responses that take <= the time in the header and max is the max response time in seconds. For max values in the top 25% of the range have a red background and in the bottom 25% of the range have a green background. The red background is not used when the min value is within 80% of the max value.
| dbms | 256us | 1ms | 4ms | 16ms | 64ms | 256ms | 1s | 4s | 16s | gt | max |
|---|---|---|---|---|---|---|---|---|---|---|---|
| pg1222_o2nofp.cx10a_c8r32 | 99.978 | 0.018 | 0.003 | 0.002 | nonzero | nonzero | 0.093 | ||||
| pg1323_o2nofp.cx10a_c8r32 | 99.986 | 0.010 | 0.003 | 0.002 | nonzero | nonzero | 0.089 | ||||
| pg1420_o2nofp.cx10a_c8r32 | 99.986 | 0.009 | 0.003 | 0.001 | nonzero | nonzero | 0.094 | ||||
| pg1515_o2nofp.cx10a_c8r32 | 99.982 | 0.013 | 0.003 | 0.001 | nonzero | nonzero | 0.088 | ||||
| pg1611_o2nofp.cx10a_c8r32 | 99.982 | 0.014 | 0.003 | 0.002 | nonzero | nonzero | 0.093 | ||||
| pg177_o2nofp.cx10a_c8r32 | 99.983 | 0.013 | 0.003 | 0.001 | nonzero | nonzero | 0.106 | ||||
| pg181_o2nofp.cx10b_c8r32 | 99.984 | 0.012 | 0.003 | 0.001 | nonzero | nonzero | 0.099 |
Insert response time histogram: each cell has the percentage of responses that take <= the time in the header and max is the max response time in seconds. For max values in the top 25% of the range have a red background and in the bottom 25% of the range have a green background. The red background is not used when the min value is within 80% of the max value.
| dbms | 256us | 1ms | 4ms | 16ms | 64ms | 256ms | 1s | 4s | 16s | gt | max |
|---|---|---|---|---|---|---|---|---|---|---|---|
| pg1222_o2nofp.cx10a_c8r32 | 97.681 | 2.319 | 0.029 | ||||||||
| pg1323_o2nofp.cx10a_c8r32 | 98.342 | 1.658 | 0.022 | ||||||||
| pg1420_o2nofp.cx10a_c8r32 | 98.225 | 1.775 | 0.024 | ||||||||
| pg1515_o2nofp.cx10a_c8r32 | 98.264 | 1.736 | 0.027 | ||||||||
| pg1611_o2nofp.cx10a_c8r32 | 0.003 | 98.239 | 1.758 | 0.027 | |||||||
| pg177_o2nofp.cx10a_c8r32 | 98.050 | 1.950 | 0.030 | ||||||||
| pg181_o2nofp.cx10b_c8r32 | 98.031 | 1.969 | 0.022 |
Delete response time histogram: each cell has the percentage of responses that take <= the time in the header and max is the max response time in seconds. For max values in the top 25% of the range have a red background and in the bottom 25% of the range have a green background. The red background is not used when the min value is within 80% of the max value.
| dbms | 256us | 1ms | 4ms | 16ms | 64ms | 256ms | 1s | 4s | 16s | gt | max |
|---|---|---|---|---|---|---|---|---|---|---|---|
| pg1222_o2nofp.cx10a_c8r32 | 32.397 | 67.603 | 0.064 | ||||||||
| pg1323_o2nofp.cx10a_c8r32 | 23.097 | 76.900 | 0.003 | 0.065 | |||||||
| pg1420_o2nofp.cx10a_c8r32 | 22.725 | 77.275 | 0.064 | ||||||||
| pg1515_o2nofp.cx10a_c8r32 | 20.303 | 79.697 | 0.063 | ||||||||
| pg1611_o2nofp.cx10a_c8r32 | 13.956 | 86.044 | 0.063 | ||||||||
| pg177_o2nofp.cx10a_c8r32 | 4.461 | 95.539 | 0.061 | ||||||||
| pg181_o2nofp.cx10b_c8r32 | 14.536 | 85.461 | 0.003 | 0.065 |
Performance metrics for the DBMS listed above. Some are normalized by throughput, others are not. Legend for results is here.
ips	qps	rps	rmbps	wps	wmbps	rpq	rkbpq	wpi	wkbpi	csps	cpups	cspq	cpupq	dbgb1	dbgb2	rss	maxop	p50	p99	tag
999	12298	1503	12.0	767.0	16.8	0.122	1.003	0.768	17.199	50596	16.9	4.114	110	154.9	188.3	23.4	0.093	12303	11630	pg1222_o2nofp.cx10a_c8r32
999	12331	1505	12.1	896.2	18.6	0.122	1.002	0.897	19.076	50739	18.5	4.115	120	154.8	188.1	23.4	0.089	12334	11662	pg1323_o2nofp.cx10a_c8r32
999	12317	1506	12.1	916.5	18.9	0.122	1.004	0.917	19.364	50458	18.5	4.097	120	154.8	187.7	23.3	0.094	12319	11614	pg1420_o2nofp.cx10a_c8r32
999	12086	1506	12.1	913.4	18.9	0.125	1.023	0.914	19.333	49531	18.6	4.098	123	154.8	187.8	23.3	0.088	12094	11454	pg1515_o2nofp.cx10a_c8r32
999	12165	1506	12.1	914.8	18.9	0.124	1.018	0.916	19.357	49855	18.8	4.098	124	154.8	187.8	23.3	0.093	12190	11518	pg1611_o2nofp.cx10a_c8r32
999	11946	1506	12.1	921.9	19.0	0.126	1.036	0.923	19.484	48954	19.3	4.098	129	154.8	187.6	23.4	0.106	11966	11247	pg177_o2nofp.cx10a_c8r32
999	11899	1506	12.1	921.4	19.0	0.127	1.040	0.922	19.463	48756	18.9	4.097	127	154.8	187.9	23.3	0.099	11919	11262	pg181_o2nofp.cx10b_c8r32
Average values from iostat.
r/s	rkB/s	rrqm/s	%rrqm	r_await	rareq-s	w/s	wkB/s	wrqm/s	%wrqm	w_await	wareq-s	d/s	dkB/s	drqm/s	%drqm	d_await	dareq-s	f/s	f_await	aqu-sz	%util
1493.5	12161.2	0.000	0.000	0.069	8.146	766.8	17157.1	8.052	1.362	0.195	33.39	2.043	630.4	0.000	0.000	0.926	41.30	13.10	1.201	0.219	13.36		pg1222_o2nofp.cx10a_c8r32
1495.7	12185.9	0.000	0.000	0.059	8.152	897.1	19056.1	8.183	1.470	0.190	35.16	2.042	621.3	0.000	0.000	0.792	41.20	13.34	1.228	0.208	12.16		pg1323_o2nofp.cx10a_c8r32
1496.1	12194.6	0.000	0.000	0.059	8.157	916.9	19342.0	8.418	1.537	0.188	35.70	2.038	603.4	0.000	0.000	0.890	43.03	13.47	1.224	0.210	12.27		pg1420_o2nofp.cx10a_c8r32
1495.8	12196.0	0.000	0.000	0.059	8.159	913.9	19310.1	5.629	0.922	0.185	34.90	0.041	602.5	0.000	0.000	0.004	41.28	13.50	1.234	0.209	12.15		pg1515_o2nofp.cx10a_c8r32
1496.0	12204.5	0.000	0.000	0.059	8.164	915.3	19322.8	5.802	0.972	0.181	35.22	0.042	593.4	0.000	0.000	0.004	40.11	13.45	1.241	0.204	12.11		pg1611_o2nofp.cx10a_c8r32
1496.5	12201.4	0.000	0.000	0.059	8.159	922.8	19452.5	4.647	0.728	0.168	35.33	0.041	584.3	0.000	0.000	0.001	40.59	13.55	1.228	0.199	12.14		pg177_o2nofp.cx10a_c8r32
1496.0	12201.1	0.000	0.000	0.060	8.161	922.2	19442.2	4.894	0.816	0.188	36.46	0.041	611.7	0.000	0.000	0.002	42.49	13.55	1.200	0.207	12.26		pg181_o2nofp.cx10b_c8r32
qp1000.L6
qp1000.L6: point queries with 1000 insert/s per client. Graphs for performance per 1-second interval are here.
Average throughput:
Query response time histogram: each cell has the percentage of responses that take <= the time in the header and max is the max response time in seconds. For max values in the top 25% of the range have a red background and in the bottom 25% of the range have a green background. The red background is not used when the min value is within 80% of the max value.
| dbms | 256us | 1ms | 4ms | 16ms | 64ms | 256ms | 1s | 4s | 16s | gt | max |
|---|---|---|---|---|---|---|---|---|---|---|---|
| pg1222_o2nofp.cx10a_c8r32 | 12.350 | 87.618 | 0.033 | nonzero | 0.017 | ||||||
| pg1323_o2nofp.cx10a_c8r32 | nonzero | 54.511 | 45.477 | 0.012 | nonzero | 0.017 | |||||
| pg1420_o2nofp.cx10a_c8r32 | 54.998 | 44.986 | 0.016 | nonzero | 0.017 | ||||||
| pg1515_o2nofp.cx10a_c8r32 | 55.046 | 44.944 | 0.011 | nonzero | 0.016 | ||||||
| pg1611_o2nofp.cx10a_c8r32 | 54.667 | 45.303 | 0.027 | 0.003 | 0.019 | ||||||
| pg177_o2nofp.cx10a_c8r32 | nonzero | 54.033 | 45.955 | 0.012 | 0.015 | ||||||
| pg181_o2nofp.cx10b_c8r32 | 48.609 | 51.377 | 0.014 | nonzero | 0.019 |
Insert response time histogram: each cell has the percentage of responses that take <= the time in the header and max is the max response time in seconds. For max values in the top 25% of the range have a red background and in the bottom 25% of the range have a green background. The red background is not used when the min value is within 80% of the max value.
| dbms | 256us | 1ms | 4ms | 16ms | 64ms | 256ms | 1s | 4s | 16s | gt | max |
|---|---|---|---|---|---|---|---|---|---|---|---|
| pg1222_o2nofp.cx10a_c8r32 | 99.931 | 0.069 | 0.032 | ||||||||
| pg1323_o2nofp.cx10a_c8r32 | 99.958 | 0.042 | 0.031 | ||||||||
| pg1420_o2nofp.cx10a_c8r32 | 99.911 | 0.089 | 0.024 | ||||||||
| pg1515_o2nofp.cx10a_c8r32 | 99.961 | 0.039 | 0.024 | ||||||||
| pg1611_o2nofp.cx10a_c8r32 | 99.803 | 0.197 | 0.025 | ||||||||
| pg177_o2nofp.cx10a_c8r32 | 99.953 | 0.047 | 0.025 | ||||||||
| pg181_o2nofp.cx10b_c8r32 | 99.939 | 0.061 | 0.026 |
Delete response time histogram: each cell has the percentage of responses that take <= the time in the header and max is the max response time in seconds. For max values in the top 25% of the range have a red background and in the bottom 25% of the range have a green background. The red background is not used when the min value is within 80% of the max value.
| dbms | 256us | 1ms | 4ms | 16ms | 64ms | 256ms | 1s | 4s | 16s | gt | max |
|---|---|---|---|---|---|---|---|---|---|---|---|
| pg1222_o2nofp.cx10a_c8r32 | 99.997 | 0.003 | 0.099 | ||||||||
| pg1323_o2nofp.cx10a_c8r32 | 99.997 | 0.003 | 0.104 | ||||||||
| pg1420_o2nofp.cx10a_c8r32 | 99.997 | 0.003 | 0.100 | ||||||||
| pg1515_o2nofp.cx10a_c8r32 | 99.997 | 0.003 | 0.099 | ||||||||
| pg1611_o2nofp.cx10a_c8r32 | 99.997 | 0.003 | 0.099 | ||||||||
| pg177_o2nofp.cx10a_c8r32 | 99.997 | 0.003 | 0.098 | ||||||||
| pg181_o2nofp.cx10b_c8r32 | 99.997 | 0.003 | 0.104 |
Performance metrics for the DBMS listed above. Some are normalized by throughput, others are not. Legend for results is here.
ips	qps	rps	rmbps	wps	wmbps	rpq	rkbpq	wpi	wkbpi	csps	cpups	cspq	cpupq	dbgb1	dbgb2	rss	maxop	p50	p99	tag
999	785	12163	95.4	3011.9	37.2	15.502	124.492	3.016	38.179	27183	12.5	34.646	1275	155.2	193.6	23.4	0.017	816	544	pg1222_o2nofp.cx10a_c8r32
999	985	14607	114.5	2878.5	35.4	14.826	119.051	2.880	36.320	32675	14.4	33.166	1169	155.0	192.0	23.4	0.017	1008	687	pg1323_o2nofp.cx10a_c8r32
999	985	14610	114.6	2860.8	35.2	14.826	119.109	2.864	36.099	32365	14.4	32.845	1169	155.0	191.4	23.3	0.017	1008	672	pg1420_o2nofp.cx10a_c8r32
999	987	14618	114.7	2857.5	35.1	14.817	119.016	2.859	35.972	32335	14.6	32.774	1184	155.0	191.4	23.3	0.016	1008	687	pg1515_o2nofp.cx10a_c8r32
999	983	14587	114.5	2856.4	35.1	14.834	119.196	2.860	36.006	32287	15.3	32.832	1245	155.0	191.4	23.3	0.019	1008	688	pg1611_o2nofp.cx10a_c8r32
999	983	14578	114.3	2855.4	35.0	14.836	119.160	2.859	35.842	32132	15.8	32.701	1286	155.0	190.9	23.4	0.015	1008	688	pg177_o2nofp.cx10a_c8r32
999	964	14392	112.9	2852.3	34.7	14.921	119.879	2.854	35.569	31708	15.1	32.875	1252	155.0	190.8	23.3	0.019	992	672	pg181_o2nofp.cx10b_c8r32
Average values from iostat.
r/s	rkB/s	rrqm/s	%rrqm	r_await	rareq-s	w/s	wkB/s	wrqm/s	%wrqm	w_await	wareq-s	d/s	dkB/s	drqm/s	%drqm	d_await	dareq-s	f/s	f_await	aqu-sz	%util
12166.6	97707.3	0.000	0.000	0.062	8.031	2981.0	37868.8	14.64	0.622	0.041	14.02	1.999	9.736	0.000	0.000	0.372	4.850	14.21	1.164	0.915	73.48		pg1222_o2nofp.cx10a_c8r32
14611.1	117325	0.000	0.000	0.050	8.030	2848.6	36064.1	12.88	0.545	0.039	13.78	2.002	9.723	0.000	0.000	0.377	4.847	13.95	1.160	0.836	66.43		pg1323_o2nofp.cx10a_c8r32
14614.3	117406	0.000	0.000	0.050	8.034	2833.8	35846.4	13.22	0.566	0.038	13.75	2.003	10.12	0.000	0.000	0.385	5.044	13.89	1.164	0.835	66.31		pg1420_o2nofp.cx10a_c8r32
14622.2	117454	0.000	0.000	0.050	8.033	2830.5	35741.3	9.364	0.390	0.038	13.73	0.001	0.109	0.000	0.000	0.003	0.546	13.88	1.145	0.830	66.00		pg1515_o2nofp.cx10a_c8r32
14591.2	117248	0.000	0.000	0.050	8.036	2828.9	35748.7	9.756	0.415	0.039	13.74	0.002	0.114	0.000	0.000	0.003	0.568	13.80	1.156	0.830	65.84		pg1611_o2nofp.cx10a_c8r32
14581.4	117116	0.000	0.000	0.050	8.032	2831.1	35612.7	7.568	0.316	0.038	13.67	0.003	0.105	0.000	0.000	0.004	0.279	13.82	1.147	0.828	66.50		pg177_o2nofp.cx10a_c8r32
14395.3	115653	0.000	0.000	0.050	8.034	2828.5	35364.6	7.658	0.323	0.039	13.58	0.002	0.096	0.000	0.000	0.003	0.245	13.92	1.137	0.825	66.08		pg181_o2nofp.cx10b_c8r32
l.i0
l.i0: load without secondary indexes
Performance metrics for all DBMS, not just the ones listed above. Some are normalized by throughput, others are not. Legend for results is here.
ips	qps	rps	rmbps	wps	wmbps	rpq	rkbpq	wpi	wkbpi	csps	cpups	cspq	cpupq	dbgb1	dbgb2	rss	maxop	p50	p99	tag
144144	0	29	0.2	587.2	59.2	0.000	0.002	0.004	0.420	17475	20.5	0.121	11	76.5	116.6	19.1	0.036	144782	141784	pg1222_o2nofp.cx10a_c8r32
144718	0	25	0.2	542.7	59.7	0.000	0.001	0.004	0.422	17566	20.9	0.121	12	76.5	116.6	19.3	0.037	145250	142382	pg1323_o2nofp.cx10a_c8r32
140130	0	25	0.2	524.0	57.5	0.000	0.001	0.004	0.420	16501	20.2	0.118	12	76.5	116.6	4.1	0.037	140482	138081	pg1420_o2nofp.cx10a_c8r32
146843	0	28	0.2	555.2	60.9	0.000	0.002	0.004	0.425	17213	20.6	0.117	11	76.5	116.6	2.5	0.039	147280	144583	pg1515_o2nofp.cx10a_c8r32
146493	0	28	0.2	548.7	60.2	0.000	0.002	0.004	0.421	17169	20.7	0.117	11	76.5	116.6	18.2	0.037	146883	144280	pg1611_o2nofp.cx10a_c8r32
144980	0	27	0.2	543.3	59.6	0.000	0.001	0.004	0.421	14438	20.4	0.100	11	76.5	116.6	18.5	0.036	145381	142682	pg177_o2nofp.cx10a_c8r32
142577	0	26	0.2	533.0	58.9	0.000	0.001	0.004	0.423	14427	20.4	0.101	11	76.5	116.6	2.3	0.064	144082	121486	pg181_o2nofp.cx10b_c8r32
l.x
l.x: create secondary indexes
Performance metrics for all DBMS, not just the ones listed above. Some are normalized by throughput, others are not. Legend for results is here.
ips	qps	rps	rmbps	wps	wmbps	rpq	rkbpq	wpi	wkbpi	csps	cpups	cspq	cpupq	dbgb1	dbgb2	rss	maxop	p50	p99	tag
278746	0	779	94.0	1365.0	140.0	0.003	0.345	0.005	0.514	627	13.6	0.002	4	153.8	193.8	23.5	0.003	NA	NA	pg1222_o2nofp.cx10a_c8r32
282187	0	747	92.6	860.1	103.2	0.003	0.336	0.003	0.375	542	13.0	0.002	4	153.6	193.7	23.4	0.004	NA	NA	pg1323_o2nofp.cx10a_c8r32
285205	0	755	93.6	881.4	104.1	0.003	0.336	0.003	0.374	505	13.0	0.002	4	153.6	193.7	23.4	0.004	NA	NA	pg1420_o2nofp.cx10a_c8r32
307102	0	834	103.4	956.6	114.5	0.003	0.345	0.003	0.382	658	13.0	0.002	3	153.6	193.7	23.4	0.004	NA	NA	pg1515_o2nofp.cx10a_c8r32
311526	0	845	104.9	969.8	116.2	0.003	0.345	0.003	0.382	650	13.1	0.002	3	153.6	193.7	23.5	0.004	NA	NA	pg1611_o2nofp.cx10a_c8r32
313480	0	849	105.5	994.6	117.1	0.003	0.345	0.003	0.383	661	13.1	0.002	3	153.6	193.7	23.4	0.003	NA	NA	pg177_o2nofp.cx10a_c8r32
315085	0	853	106.0	999.2	117.6	0.003	0.345	0.003	0.382	663	13.1	0.002	3	153.6	193.7	23.4	0.005	NA	NA	pg181_o2nofp.cx10b_c8r32
l.i1
l.i1: continue load after secondary indexes created with 50 inserts per transaction
Performance metrics for all DBMS, not just the ones listed above. Some are normalized by throughput, others are not. Legend for results is here.
ips	qps	rps	rmbps	wps	wmbps	rpq	rkbpq	wpi	wkbpi	csps	cpups	cspq	cpupq	dbgb1	dbgb2	rss	maxop	p50	p99	tag
4048	0	5154	40.8	4652.9	81.7	1.273	10.326	1.149	20.663	12526	16.3	3.094	322	154.4	194.5	23.4	0.075	3350	2150	pg1222_o2nofp.cx10a_c8r32
3868	0	5566	44.0	4565.2	78.3	1.439	11.656	1.180	20.729	13298	16.6	3.438	343	154.3	194.3	22.9	0.037	3150	2150	pg1323_o2nofp.cx10a_c8r32
3876	0	5573	44.1	4597.8	79.1	1.438	11.654	1.186	20.908	12814	16.6	3.306	343	154.3	194.3	22.9	0.036	3200	2100	pg1420_o2nofp.cx10a_c8r32
3617	0	5198	41.1	4242.9	72.6	1.437	11.648	1.173	20.548	11927	16.3	3.298	361	154.3	194.3	23.2	0.036	2850	1950	pg1515_o2nofp.cx10a_c8r32
3575	0	5144	40.7	4253.8	73.0	1.439	11.665	1.190	20.922	11782	16.3	3.296	365	154.3	194.3	22.8	0.035	2750	1900	pg1611_o2nofp.cx10a_c8r32
3241	0	4666	36.9	3865.5	66.3	1.440	11.666	1.193	20.930	10540	15.9	3.252	392	154.3	194.3	22.6	0.036	2450	1700	pg177_o2nofp.cx10a_c8r32
3607	0	5188	41.1	4252.1	72.8	1.439	11.661	1.179	20.672	11713	16.1	3.248	357	154.3	194.3	23.0	0.040	2850	1950	pg181_o2nofp.cx10b_c8r32
l.i2
l.i2: continue load after secondary indexes created with 5 inserts per transaction
Performance metrics for all DBMS, not just the ones listed above. Some are normalized by throughput, others are not. Legend for results is here.
ips	qps	rps	rmbps	wps	wmbps	rpq	rkbpq	wpi	wkbpi	csps	cpups	cspq	cpupq	dbgb1	dbgb2	rss	maxop	p50	p99	tag
197	0	212	1.7	506.4	7.0	1.075	8.775	2.575	36.610	1823	13.1	9.267	5328	154.6	194.6	23.4	0.013	195	175	pg1222_o2nofp.cx10a_c8r32
193	0	207	1.7	557.6	7.6	1.072	8.753	2.888	40.181	1856	13.0	9.612	5386	154.4	194.5	23.4	0.016	190	170	pg1323_o2nofp.cx10a_c8r32
192	0	206	1.6	553.2	7.5	1.071	8.754	2.881	40.172	1513	12.9	7.881	5375	154.5	194.5	23.3	0.013	190	170	pg1420_o2nofp.cx10a_c8r32
173	0	186	1.5	503.4	7.0	1.072	8.766	2.907	41.636	1304	12.8	7.527	5912	154.4	194.5	23.3	0.013	170	155	pg1515_o2nofp.cx10a_c8r32
175	0	188	1.5	502.3	7.0	1.073	8.775	2.866	41.072	1328	12.8	7.576	5841	154.4	194.5	23.3	0.013	175	150	pg1611_o2nofp.cx10a_c8r32
154	0	166	1.3	450.8	6.3	1.073	8.771	2.920	41.861	1078	12.7	6.983	6580	154.4	191.5	23.4	0.012	155	135	pg177_o2nofp.cx10a_c8r32
174	0	186	1.5	505.6	7.0	1.071	8.759	2.904	41.165	1189	12.8	6.827	5882	154.5	194.5	23.3	0.012	175	145	pg181_o2nofp.cx10b_c8r32
qr100.L1
qr100.L1: range queries with 100 insert/s per client
Performance metrics for all DBMS, not just the ones listed above. Some are normalized by throughput, others are not. Legend for results is here.
ips	qps	rps	rmbps	wps	wmbps	rpq	rkbpq	wpi	wkbpi	csps	cpups	cspq	cpupq	dbgb1	dbgb2	rss	maxop	p50	p99	tag
100	14589	113	0.9	24.1	1.5	0.008	0.065	0.241	15.600	56024	11.1	3.840	61	154.6	194.7	23.4	0.009	14558	14318	pg1222_o2nofp.cx10a_c8r32
100	14566	112	0.9	56.8	1.8	0.008	0.065	0.568	18.456	55969	12.6	3.842	69	154.5	192.7	23.4	0.009	14542	14334	pg1323_o2nofp.cx10a_c8r32
100	14450	112	0.9	64.5	1.9	0.008	0.066	0.645	19.123	55451	12.5	3.837	69	154.5	191.9	23.3	0.009	14462	14142	pg1420_o2nofp.cx10a_c8r32
100	14416	111	0.9	62.2	1.8	0.008	0.066	0.622	18.892	55280	12.6	3.835	70	154.5	191.9	23.3	0.010	14398	14174	pg1515_o2nofp.cx10a_c8r32
100	14454	112	0.9	62.1	1.8	0.008	0.066	0.622	18.909	55459	12.6	3.837	70	154.5	191.7	23.3	0.009	14478	14190	pg1611_o2nofp.cx10a_c8r32
100	14404	112	0.9	66.2	1.9	0.008	0.066	0.663	19.381	55257	12.5	3.836	69	154.5	190.5	23.4	0.009	14446	14174	pg177_o2nofp.cx10a_c8r32
100	14323	111	0.9	66.8	1.9	0.008	0.064	0.668	19.416	54917	12.5	3.834	70	154.5	193.1	23.3	0.010	14350	14046	pg181_o2nofp.cx10b_c8r32
qp100.L2
qp100.L2: point queries with 100 insert/s per client
Performance metrics for all DBMS, not just the ones listed above. Some are normalized by throughput, others are not. Legend for results is here.
ips	qps	rps	rmbps	wps	wmbps	rpq	rkbpq	wpi	wkbpi	csps	cpups	cspq	cpupq	dbgb1	dbgb2	rss	maxop	p50	p99	tag
100	847	10669	83.8	403.8	4.5	12.602	101.382	4.038	46.075	23904	3.9	28.236	369	154.6	193.6	23.4	0.014	880	560	pg1222_o2nofp.cx10a_c8r32
100	1053	13120	103.0	373.5	4.3	12.462	100.225	3.739	43.727	29392	5.4	27.918	410	154.5	192.7	23.4	0.013	1088	688	pg1323_o2nofp.cx10a_c8r32
100	1055	13143	103.3	366.0	4.2	12.454	100.245	3.663	43.139	29334	5.3	27.795	402	154.5	191.9	23.3	0.015	1088	704	pg1420_o2nofp.cx10a_c8r32
100	1060	13179	103.6	363.9	4.2	12.439	100.143	3.639	42.876	29364	5.2	27.715	393	154.5	191.9	23.3	0.013	1088	704	pg1515_o2nofp.cx10a_c8r32
100	1059	13181	103.7	364.4	4.2	12.447	100.265	3.644	42.928	29367	5.5	27.731	415	154.5	191.7	23.3	0.019	1088	704	pg1611_o2nofp.cx10a_c8r32
100	1051	13092	102.9	357.6	4.1	12.460	100.284	3.579	42.463	29151	5.5	27.744	419	154.5	190.6	23.4	0.013	1088	688	pg177_o2nofp.cx10a_c8r32
100	1037	12962	102.0	356.6	4.1	12.497	100.682	3.566	42.355	28851	5.7	27.816	440	154.5	193.1	23.3	0.021	1072	688	pg181_o2nofp.cx10b_c8r32
qr500.L3
qr500.L3: range queries with 500 insert/s per client
Performance metrics for all DBMS, not just the ones listed above. Some are normalized by throughput, others are not. Legend for results is here.
ips	qps	rps	rmbps	wps	wmbps	rpq	rkbpq	wpi	wkbpi	csps	cpups	cspq	cpupq	dbgb1	dbgb2	rss	maxop	p50	p99	tag
500	14035	874	7.0	195.3	7.6	0.062	0.508	0.391	15.593	55596	12.1	3.961	69	154.7	191.1	23.4	0.033	14046	13519	pg1222_o2nofp.cx10a_c8r32
500	13816	876	7.0	300.2	8.8	0.063	0.517	0.601	18.126	54804	13.6	3.967	79	154.6	190.5	23.4	0.042	13822	13358	pg1323_o2nofp.cx10a_c8r32
500	13828	876	7.0	325.1	9.1	0.063	0.517	0.651	18.680	54737	13.6	3.958	79	154.6	190.1	23.3	0.022	13854	13342	pg1420_o2nofp.cx10a_c8r32
500	13580	876	7.0	322.7	9.1	0.065	0.526	0.645	18.615	53723	13.7	3.956	81	154.6	190.3	23.3	0.026	13582	13086	pg1515_o2nofp.cx10a_c8r32
500	13886	875	7.0	321.6	9.1	0.063	0.515	0.643	18.588	54891	13.7	3.953	79	154.6	190.3	23.3	0.024	13902	13438	pg1611_o2nofp.cx10a_c8r32
500	13724	875	7.0	339.0	9.3	0.064	0.520	0.678	18.975	54240	13.7	3.952	80	154.6	190.1	23.4	0.022	13742	13230	pg177_o2nofp.cx10a_c8r32
500	13557	874	7.0	341.5	9.3	0.065	0.527	0.684	19.037	53635	13.7	3.956	81	154.6	190.6	23.3	0.030	13567	13134	pg181_o2nofp.cx10b_c8r32
qp500.L4
qp500.L4: point queries with 500 insert/s per client
Performance metrics for all DBMS, not just the ones listed above. Some are normalized by throughput, others are not. Legend for results is here.
ips	qps	rps	rmbps	wps	wmbps	rpq	rkbpq	wpi	wkbpi	csps	cpups	cspq	cpupq	dbgb1	dbgb2	rss	maxop	p50	p99	tag
500	823	11341	89.0	1760.9	19.9	13.773	110.664	3.522	40.746	25322	5.6	30.753	544	154.8	189.2	23.4	0.016	848	640	pg1222_o2nofp.cx10a_c8r32
500	1024	13730	107.7	1655.5	19.1	13.414	107.761	3.311	39.106	30683	7.0	29.975	547	154.6	189.0	23.4	0.014	1040	784	pg1323_o2nofp.cx10a_c8r32
500	1026	13771	108.1	1630.6	18.9	13.416	107.843	3.263	38.725	30595	6.9	29.805	538	154.6	188.6	23.3	0.013	1056	784	pg1420_o2nofp.cx10a_c8r32
500	1027	13775	108.1	1628.0	18.9	13.411	107.808	3.258	38.682	30551	7.0	29.745	545	154.6	188.7	23.3	0.019	1056	784	pg1515_o2nofp.cx10a_c8r32
500	1030	13799	108.4	1629.2	18.9	13.404	107.794	3.258	38.664	30608	7.7	29.731	598	154.6	188.7	23.3	0.019	1056	800	pg1611_o2nofp.cx10a_c8r32
500	1023	13730	107.8	1613.7	18.7	13.421	107.867	3.229	38.416	30417	7.2	29.733	563	154.6	188.4	23.4	0.023	1040	784	pg177_o2nofp.cx10a_c8r32
500	1006	13567	106.6	1609.5	18.7	13.485	108.451	3.221	38.343	30042	7.1	29.860	565	154.6	188.8	23.3	0.014	1024	784	pg181_o2nofp.cx10b_c8r32
qr1000.L5
qr1000.L5: range queries with 1000 insert/s per client
Performance metrics for all DBMS, not just the ones listed above. Some are normalized by throughput, others are not. Legend for results is here.
ips	qps	rps	rmbps	wps	wmbps	rpq	rkbpq	wpi	wkbpi	csps	cpups	cspq	cpupq	dbgb1	dbgb2	rss	maxop	p50	p99	tag
999	12298	1503	12.0	767.0	16.8	0.122	1.003	0.768	17.199	50596	16.9	4.114	110	154.9	188.3	23.4	0.093	12303	11630	pg1222_o2nofp.cx10a_c8r32
999	12331	1505	12.1	896.2	18.6	0.122	1.002	0.897	19.076	50739	18.5	4.115	120	154.8	188.1	23.4	0.089	12334	11662	pg1323_o2nofp.cx10a_c8r32
999	12317	1506	12.1	916.5	18.9	0.122	1.004	0.917	19.364	50458	18.5	4.097	120	154.8	187.7	23.3	0.094	12319	11614	pg1420_o2nofp.cx10a_c8r32
999	12086	1506	12.1	913.4	18.9	0.125	1.023	0.914	19.333	49531	18.6	4.098	123	154.8	187.8	23.3	0.088	12094	11454	pg1515_o2nofp.cx10a_c8r32
999	12165	1506	12.1	914.8	18.9	0.124	1.018	0.916	19.357	49855	18.8	4.098	124	154.8	187.8	23.3	0.093	12190	11518	pg1611_o2nofp.cx10a_c8r32
999	11946	1506	12.1	921.9	19.0	0.126	1.036	0.923	19.484	48954	19.3	4.098	129	154.8	187.6	23.4	0.106	11966	11247	pg177_o2nofp.cx10a_c8r32
999	11899	1506	12.1	921.4	19.0	0.127	1.040	0.922	19.463	48756	18.9	4.097	127	154.8	187.9	23.3	0.099	11919	11262	pg181_o2nofp.cx10b_c8r32
qp1000.L6
qp1000.L6: point queries with 1000 insert/s per client
Performance metrics for all DBMS, not just the ones listed above. Some are normalized by throughput, others are not. Legend for results is here.
ips	qps	rps	rmbps	wps	wmbps	rpq	rkbpq	wpi	wkbpi	csps	cpups	cspq	cpupq	dbgb1	dbgb2	rss	maxop	p50	p99	tag
999	785	12163	95.4	3011.9	37.2	15.502	124.492	3.016	38.179	27183	12.5	34.646	1275	155.2	193.6	23.4	0.017	816	544	pg1222_o2nofp.cx10a_c8r32
999	985	14607	114.5	2878.5	35.4	14.826	119.051	2.880	36.320	32675	14.4	33.166	1169	155.0	192.0	23.4	0.017	1008	687	pg1323_o2nofp.cx10a_c8r32
999	985	14610	114.6	2860.8	35.2	14.826	119.109	2.864	36.099	32365	14.4	32.845	1169	155.0	191.4	23.3	0.017	1008	672	pg1420_o2nofp.cx10a_c8r32
999	987	14618	114.7	2857.5	35.1	14.817	119.016	2.859	35.972	32335	14.6	32.774	1184	155.0	191.4	23.3	0.016	1008	687	pg1515_o2nofp.cx10a_c8r32
999	983	14587	114.5	2856.4	35.1	14.834	119.196	2.860	36.006	32287	15.3	32.832	1245	155.0	191.4	23.3	0.019	1008	688	pg1611_o2nofp.cx10a_c8r32
999	983	14578	114.3	2855.4	35.0	14.836	119.160	2.859	35.842	32132	15.8	32.701	1286	155.0	190.9	23.4	0.015	1008	688	pg177_o2nofp.cx10a_c8r32
999	964	14392	112.9	2852.3	34.7	14.921	119.879	2.854	35.569	31708	15.1	32.875	1252	155.0	190.8	23.3	0.019	992	672	pg181_o2nofp.cx10b_c8r32
l.i0
- l.i0: load without secondary indexes
- Legend for results is here.
- Each entry lists the percentage of responses that fit in that bucket (slower than max time for previous bucket, faster than min time for next bucket).
Insert response time histogram
256us	1ms	4ms	16ms	64ms	256ms	1s	4s	16s	gt	max	tag
0.000	99.966	0.033	nonzero	nonzero	0.000	0.000	0.000	0.000	0.000	0.036	pg1222_o2nofp.cx10a_c8r32
0.000	99.955	0.042	0.003	0.001	0.000	0.000	0.000	0.000	0.000	0.037	pg1323_o2nofp.cx10a_c8r32
0.000	99.969	0.028	0.002	nonzero	0.000	0.000	0.000	0.000	0.000	0.037	pg1420_o2nofp.cx10a_c8r32
0.000	99.970	0.025	0.004	nonzero	0.000	0.000	0.000	0.000	0.000	0.039	pg1515_o2nofp.cx10a_c8r32
0.000	99.973	0.024	0.002	nonzero	0.000	0.000	0.000	0.000	0.000	0.037	pg1611_o2nofp.cx10a_c8r32
0.000	99.973	0.024	0.003	nonzero	0.000	0.000	0.000	0.000	0.000	0.036	pg177_o2nofp.cx10a_c8r32
0.000	99.876	0.111	0.013	nonzero	nonzero	0.000	0.000	0.000	0.000	0.064	pg181_o2nofp.cx10b_c8r32
l.x
- l.x: create secondary indexes
- Legend for results is here.
- Each entry lists the percentage of responses that fit in that bucket (slower than max time for previous bucket, faster than min time for next bucket).
TODO - determine whether there is data for create index response time
l.i1
- l.i1: continue load after secondary indexes created with 50 inserts per transaction
- Legend for results is here.
- Each entry lists the percentage of responses that fit in that bucket (slower than max time for previous bucket, faster than min time for next bucket).
Insert response time histogram
256us	1ms	4ms	16ms	64ms	256ms	1s	4s	16s	gt	max	tag
0.000	0.000	0.016	99.897	0.085	0.001	0.000	0.000	0.000	0.000	0.075	pg1222_o2nofp.cx10a_c8r32
0.000	0.000	0.000	99.941	0.059	0.000	0.000	0.000	0.000	0.000	0.037	pg1323_o2nofp.cx10a_c8r32
0.000	0.000	0.000	99.951	0.049	0.000	0.000	0.000	0.000	0.000	0.036	pg1420_o2nofp.cx10a_c8r32
0.000	0.000	0.000	99.944	0.056	0.000	0.000	0.000	0.000	0.000	0.036	pg1515_o2nofp.cx10a_c8r32
0.000	0.000	0.000	99.926	0.074	0.000	0.000	0.000	0.000	0.000	0.035	pg1611_o2nofp.cx10a_c8r32
0.000	0.000	0.000	99.954	0.046	0.000	0.000	0.000	0.000	0.000	0.036	pg177_o2nofp.cx10a_c8r32
0.000	0.000	0.000	99.946	0.054	0.000	0.000	0.000	0.000	0.000	0.040	pg181_o2nofp.cx10b_c8r32
Delete response time histogram
256us	1ms	4ms	16ms	64ms	256ms	1s	4s	16s	gt	max	tag
0.000	1.144	18.168	54.024	26.664	0.001	0.000	0.000	0.000	0.000	0.074	pg1222_o2nofp.cx10a_c8r32
0.000	0.925	16.724	50.331	32.020	0.000	0.000	0.000	0.000	0.000	0.031	pg1323_o2nofp.cx10a_c8r32
0.000	0.666	16.635	50.273	32.426	0.000	0.000	0.000	0.000	0.000	0.030	pg1420_o2nofp.cx10a_c8r32
0.000	1.348	16.081	45.806	36.765	0.000	0.000	0.000	0.000	0.000	0.032	pg1515_o2nofp.cx10a_c8r32
0.000	0.571	16.061	45.495	37.872	0.000	0.000	0.000	0.000	0.000	0.032	pg1611_o2nofp.cx10a_c8r32
0.000	0.537	16.544	38.741	44.177	0.000	0.000	0.000	0.000	0.000	0.035	pg177_o2nofp.cx10a_c8r32
0.000	0.589	16.305	44.462	38.644	0.000	0.000	0.000	0.000	0.000	0.034	pg181_o2nofp.cx10b_c8r32
l.i2
- l.i2: continue load after secondary indexes created with 5 inserts per transaction
- Legend for results is here.
- Each entry lists the percentage of responses that fit in that bucket (slower than max time for previous bucket, faster than min time for next bucket).
Insert response time histogram
256us	1ms	4ms	16ms	64ms	256ms	1s	4s	16s	gt	max	tag
0.000	52.012	47.952	0.036	0.000	0.000	0.000	0.000	0.000	0.000	0.013	pg1222_o2nofp.cx10a_c8r32
0.000	55.883	44.048	0.069	0.000	0.000	0.000	0.000	0.000	0.000	0.016	pg1323_o2nofp.cx10a_c8r32
0.000	53.168	46.767	0.065	0.000	0.000	0.000	0.000	0.000	0.000	0.013	pg1420_o2nofp.cx10a_c8r32
0.000	50.270	49.679	0.051	0.000	0.000	0.000	0.000	0.000	0.000	0.013	pg1515_o2nofp.cx10a_c8r32
0.000	47.752	52.190	0.057	0.000	0.000	0.000	0.000	0.000	0.000	0.013	pg1611_o2nofp.cx10a_c8r32
0.000	57.098	42.874	0.027	0.000	0.000	0.000	0.000	0.000	0.000	0.012	pg177_o2nofp.cx10a_c8r32
0.000	57.139	42.847	0.014	0.000	0.000	0.000	0.000	0.000	0.000	0.012	pg181_o2nofp.cx10b_c8r32
Delete response time histogram
256us	1ms	4ms	16ms	64ms	256ms	1s	4s	16s	gt	max	tag
0.000	0.000	0.000	0.000	99.999	0.001	0.000	0.000	0.000	0.000	0.098	pg1222_o2nofp.cx10a_c8r32
0.000	0.000	0.000	0.000	99.999	0.001	0.000	0.000	0.000	0.000	0.104	pg1323_o2nofp.cx10a_c8r32
0.000	0.000	0.000	0.000	99.999	0.001	0.000	0.000	0.000	0.000	0.101	pg1420_o2nofp.cx10a_c8r32
0.000	0.000	0.000	0.000	99.999	0.001	0.000	0.000	0.000	0.000	0.100	pg1515_o2nofp.cx10a_c8r32
0.000	0.000	0.000	0.000	99.999	0.001	0.000	0.000	0.000	0.000	0.099	pg1611_o2nofp.cx10a_c8r32
0.000	0.000	0.000	0.000	99.999	0.001	0.000	0.000	0.000	0.000	0.098	pg177_o2nofp.cx10a_c8r32
0.000	0.000	0.000	0.000	99.999	0.001	0.000	0.000	0.000	0.000	0.103	pg181_o2nofp.cx10b_c8r32
qr100.L1
- qr100.L1: range queries with 100 insert/s per client
- Legend for results is here.
- Each entry lists the percentage of responses that fit in that bucket (slower than max time for previous bucket, faster than min time for next bucket).
Query response time histogram
256us	1ms	4ms	16ms	64ms	256ms	1s	4s	16s	gt	max	tag
99.997	0.002	nonzero	nonzero	0.000	0.000	0.000	0.000	0.000	0.000	0.009	pg1222_o2nofp.cx10a_c8r32
99.998	0.002	nonzero	nonzero	0.000	0.000	0.000	0.000	0.000	0.000	0.009	pg1323_o2nofp.cx10a_c8r32
99.998	0.002	nonzero	nonzero	0.000	0.000	0.000	0.000	0.000	0.000	0.009	pg1420_o2nofp.cx10a_c8r32
99.998	0.002	nonzero	nonzero	0.000	0.000	0.000	0.000	0.000	0.000	0.010	pg1515_o2nofp.cx10a_c8r32
99.998	0.002	nonzero	nonzero	0.000	0.000	0.000	0.000	0.000	0.000	0.009	pg1611_o2nofp.cx10a_c8r32
99.998	0.002	nonzero	nonzero	0.000	0.000	0.000	0.000	0.000	0.000	0.009	pg177_o2nofp.cx10a_c8r32
99.999	nonzero	nonzero	nonzero	0.000	0.000	0.000	0.000	0.000	0.000	0.010	pg181_o2nofp.cx10b_c8r32
Insert response time histogram
256us	1ms	4ms	16ms	64ms	256ms	1s	4s	16s	gt	max	tag
0.000	0.000	0.000	58.111	41.889	0.000	0.000	0.000	0.000	0.000	0.021	pg1222_o2nofp.cx10a_c8r32
0.000	0.000	0.000	76.000	24.000	0.000	0.000	0.000	0.000	0.000	0.021	pg1323_o2nofp.cx10a_c8r32
0.000	0.000	0.000	76.250	23.750	0.000	0.000	0.000	0.000	0.000	0.022	pg1420_o2nofp.cx10a_c8r32
0.000	0.000	0.028	79.917	20.056	0.000	0.000	0.000	0.000	0.000	0.023	pg1515_o2nofp.cx10a_c8r32
0.000	0.000	0.056	72.778	27.167	0.000	0.000	0.000	0.000	0.000	0.022	pg1611_o2nofp.cx10a_c8r32
0.000	0.000	0.000	99.750	0.250	0.000	0.000	0.000	0.000	0.000	0.021	pg177_o2nofp.cx10a_c8r32
0.000	0.000	0.056	99.667	0.278	0.000	0.000	0.000	0.000	0.000	0.023	pg181_o2nofp.cx10b_c8r32
Delete response time histogram
256us	1ms	4ms	16ms	64ms	256ms	1s	4s	16s	gt	max	tag
0.000	44.000	55.972	0.028	0.000	0.000	0.000	0.000	0.000	0.000	0.010	pg1222_o2nofp.cx10a_c8r32
0.000	54.444	45.528	0.028	0.000	0.000	0.000	0.000	0.000	0.000	0.010	pg1323_o2nofp.cx10a_c8r32
0.000	54.750	45.194	0.056	0.000	0.000	0.000	0.000	0.000	0.000	0.010	pg1420_o2nofp.cx10a_c8r32
0.000	50.444	49.500	0.056	0.000	0.000	0.000	0.000	0.000	0.000	0.010	pg1515_o2nofp.cx10a_c8r32
0.000	52.944	47.000	0.056	0.000	0.000	0.000	0.000	0.000	0.000	0.010	pg1611_o2nofp.cx10a_c8r32
0.000	50.694	49.250	0.056	0.000	0.000	0.000	0.000	0.000	0.000	0.010	pg177_o2nofp.cx10a_c8r32
0.000	48.889	51.056	0.056	0.000	0.000	0.000	0.000	0.000	0.000	0.010	pg181_o2nofp.cx10b_c8r32
qp100.L2
- qp100.L2: point queries with 100 insert/s per client
- Legend for results is here.
- Each entry lists the percentage of responses that fit in that bucket (slower than max time for previous bucket, faster than min time for next bucket).
Query response time histogram
256us	1ms	4ms	16ms	64ms	256ms	1s	4s	16s	gt	max	tag
0.000	22.661	77.330	0.009	0.000	0.000	0.000	0.000	0.000	0.000	0.014	pg1222_o2nofp.cx10a_c8r32
0.000	68.011	31.984	0.006	0.000	0.000	0.000	0.000	0.000	0.000	0.013	pg1323_o2nofp.cx10a_c8r32
nonzero	68.450	31.546	0.004	0.000	0.000	0.000	0.000	0.000	0.000	0.015	pg1420_o2nofp.cx10a_c8r32
nonzero	69.079	30.916	0.005	0.000	0.000	0.000	0.000	0.000	0.000	0.013	pg1515_o2nofp.cx10a_c8r32
nonzero	69.461	30.517	0.017	0.005	0.000	0.000	0.000	0.000	0.000	0.019	pg1611_o2nofp.cx10a_c8r32
nonzero	67.738	32.259	0.003	0.000	0.000	0.000	0.000	0.000	0.000	0.013	pg177_o2nofp.cx10a_c8r32
nonzero	65.091	34.893	0.009	0.006	0.000	0.000	0.000	0.000	0.000	0.021	pg181_o2nofp.cx10b_c8r32
Insert response time histogram
256us	1ms	4ms	16ms	64ms	256ms	1s	4s	16s	gt	max	tag
0.000	0.000	0.000	99.528	0.472	0.000	0.000	0.000	0.000	0.000	0.023	pg1222_o2nofp.cx10a_c8r32
0.000	0.000	0.000	99.917	0.083	0.000	0.000	0.000	0.000	0.000	0.024	pg1323_o2nofp.cx10a_c8r32
0.000	0.000	0.000	99.889	0.111	0.000	0.000	0.000	0.000	0.000	0.023	pg1420_o2nofp.cx10a_c8r32
0.000	0.000	0.000	99.806	0.194	0.000	0.000	0.000	0.000	0.000	0.022	pg1515_o2nofp.cx10a_c8r32
0.000	0.000	0.000	99.806	0.194	0.000	0.000	0.000	0.000	0.000	0.019	pg1611_o2nofp.cx10a_c8r32
0.000	0.000	0.000	99.972	0.028	0.000	0.000	0.000	0.000	0.000	0.020	pg177_o2nofp.cx10a_c8r32
0.000	0.000	0.000	99.778	0.222	0.000	0.000	0.000	0.000	0.000	0.022	pg181_o2nofp.cx10b_c8r32
Delete response time histogram
256us	1ms	4ms	16ms	64ms	256ms	1s	4s	16s	gt	max	tag
0.000	6.250	93.694	0.056	0.000	0.000	0.000	0.000	0.000	0.000	0.008	pg1222_o2nofp.cx10a_c8r32
0.000	0.167	99.806	0.028	0.000	0.000	0.000	0.000	0.000	0.000	0.009	pg1323_o2nofp.cx10a_c8r32
0.000	0.194	99.778	0.028	0.000	0.000	0.000	0.000	0.000	0.000	0.009	pg1420_o2nofp.cx10a_c8r32
0.000	0.361	99.611	0.028	0.000	0.000	0.000	0.000	0.000	0.000	0.009	pg1515_o2nofp.cx10a_c8r32
0.000	0.000	99.861	0.139	0.000	0.000	0.000	0.000	0.000	0.000	0.010	pg1611_o2nofp.cx10a_c8r32
0.000	0.000	99.972	0.028	0.000	0.000	0.000	0.000	0.000	0.000	0.009	pg177_o2nofp.cx10a_c8r32
0.000	0.000	99.806	0.194	0.000	0.000	0.000	0.000	0.000	0.000	0.010	pg181_o2nofp.cx10b_c8r32
qr500.L3
- qr500.L3: range queries with 500 insert/s per client
- Legend for results is here.
- Each entry lists the percentage of responses that fit in that bucket (slower than max time for previous bucket, faster than min time for next bucket).
Query response time histogram
256us	1ms	4ms	16ms	64ms	256ms	1s	4s	16s	gt	max	tag
99.992	0.007	nonzero	0.001	nonzero	0.000	0.000	0.000	0.000	0.000	0.033	pg1222_o2nofp.cx10a_c8r32
99.994	0.005	nonzero	0.001	nonzero	0.000	0.000	0.000	0.000	0.000	0.042	pg1323_o2nofp.cx10a_c8r32
99.995	0.004	nonzero	0.001	nonzero	0.000	0.000	0.000	0.000	0.000	0.022	pg1420_o2nofp.cx10a_c8r32
99.994	0.005	0.001	0.001	nonzero	0.000	0.000	0.000	0.000	0.000	0.026	pg1515_o2nofp.cx10a_c8r32
99.995	0.005	nonzero	nonzero	nonzero	0.000	0.000	0.000	0.000	0.000	0.024	pg1611_o2nofp.cx10a_c8r32
99.995	0.004	nonzero	nonzero	nonzero	0.000	0.000	0.000	0.000	0.000	0.022	pg177_o2nofp.cx10a_c8r32
99.995	0.004	nonzero	nonzero	nonzero	0.000	0.000	0.000	0.000	0.000	0.030	pg181_o2nofp.cx10b_c8r32
Insert response time histogram
256us	1ms	4ms	16ms	64ms	256ms	1s	4s	16s	gt	max	tag
0.000	0.000	0.000	91.728	8.272	0.000	0.000	0.000	0.000	0.000	0.023	pg1222_o2nofp.cx10a_c8r32
0.000	0.000	0.000	93.306	6.694	0.000	0.000	0.000	0.000	0.000	0.025	pg1323_o2nofp.cx10a_c8r32
0.000	0.000	0.000	93.633	6.367	0.000	0.000	0.000	0.000	0.000	0.024	pg1420_o2nofp.cx10a_c8r32
0.000	0.000	0.000	93.361	6.639	0.000	0.000	0.000	0.000	0.000	0.030	pg1515_o2nofp.cx10a_c8r32
0.000	0.000	0.000	93.200	6.800	0.000	0.000	0.000	0.000	0.000	0.024	pg1611_o2nofp.cx10a_c8r32
0.000	0.000	0.000	94.083	5.917	0.000	0.000	0.000	0.000	0.000	0.023	pg177_o2nofp.cx10a_c8r32
0.000	0.000	0.000	94.161	5.839	0.000	0.000	0.000	0.000	0.000	0.025	pg181_o2nofp.cx10b_c8r32
Delete response time histogram
256us	1ms	4ms	16ms	64ms	256ms	1s	4s	16s	gt	max	tag
0.000	0.000	49.756	50.244	0.000	0.000	0.000	0.000	0.000	0.000	0.015	pg1222_o2nofp.cx10a_c8r32
0.000	0.000	46.100	53.900	0.000	0.000	0.000	0.000	0.000	0.000	0.016	pg1323_o2nofp.cx10a_c8r32
0.000	0.000	45.972	54.028	0.000	0.000	0.000	0.000	0.000	0.000	0.015	pg1420_o2nofp.cx10a_c8r32
0.000	0.000	40.822	59.178	0.000	0.000	0.000	0.000	0.000	0.000	0.015	pg1515_o2nofp.cx10a_c8r32
0.000	0.000	45.050	54.950	0.000	0.000	0.000	0.000	0.000	0.000	0.015	pg1611_o2nofp.cx10a_c8r32
0.000	0.000	42.761	57.239	0.000	0.000	0.000	0.000	0.000	0.000	0.015	pg177_o2nofp.cx10a_c8r32
0.000	0.000	45.367	54.633	0.000	0.000	0.000	0.000	0.000	0.000	0.015	pg181_o2nofp.cx10b_c8r32
qp500.L4
- qp500.L4: point queries with 500 insert/s per client
- Legend for results is here.
- Each entry lists the percentage of responses that fit in that bucket (slower than max time for previous bucket, faster than min time for next bucket).
Query response time histogram
256us	1ms	4ms	16ms	64ms	256ms	1s	4s	16s	gt	max	tag
0.000	17.474	82.511	0.015	0.000	0.000	0.000	0.000	0.000	0.000	0.016	pg1222_o2nofp.cx10a_c8r32
nonzero	61.825	38.167	0.007	0.000	0.000	0.000	0.000	0.000	0.000	0.014	pg1323_o2nofp.cx10a_c8r32
nonzero	62.646	37.346	0.008	0.000	0.000	0.000	0.000	0.000	0.000	0.013	pg1420_o2nofp.cx10a_c8r32
0.000	62.777	37.217	0.006	nonzero	0.000	0.000	0.000	0.000	0.000	0.019	pg1515_o2nofp.cx10a_c8r32
nonzero	63.329	36.646	0.021	0.004	0.000	0.000	0.000	0.000	0.000	0.019	pg1611_o2nofp.cx10a_c8r32
nonzero	62.004	37.990	0.006	nonzero	0.000	0.000	0.000	0.000	0.000	0.023	pg177_o2nofp.cx10a_c8r32
0.000	57.592	42.400	0.007	0.000	0.000	0.000	0.000	0.000	0.000	0.014	pg181_o2nofp.cx10b_c8r32
Insert response time histogram
256us	1ms	4ms	16ms	64ms	256ms	1s	4s	16s	gt	max	tag
0.000	0.000	0.000	99.911	0.089	0.000	0.000	0.000	0.000	0.000	0.023	pg1222_o2nofp.cx10a_c8r32
0.000	0.000	0.000	99.933	0.067	0.000	0.000	0.000	0.000	0.000	0.023	pg1323_o2nofp.cx10a_c8r32
0.000	0.000	0.000	99.967	0.033	0.000	0.000	0.000	0.000	0.000	0.030	pg1420_o2nofp.cx10a_c8r32
0.000	0.000	0.000	99.961	0.039	0.000	0.000	0.000	0.000	0.000	0.024	pg1515_o2nofp.cx10a_c8r32
0.000	0.000	0.000	99.789	0.211	0.000	0.000	0.000	0.000	0.000	0.023	pg1611_o2nofp.cx10a_c8r32
0.000	0.000	0.000	99.917	0.083	0.000	0.000	0.000	0.000	0.000	0.028	pg177_o2nofp.cx10a_c8r32
0.000	0.000	0.000	99.939	0.061	0.000	0.000	0.000	0.000	0.000	0.020	pg181_o2nofp.cx10b_c8r32
Delete response time histogram
256us	1ms	4ms	16ms	64ms	256ms	1s	4s	16s	gt	max	tag
0.000	0.000	0.000	99.917	0.083	0.000	0.000	0.000	0.000	0.000	0.042	pg1222_o2nofp.cx10a_c8r32
0.000	0.000	0.000	98.156	1.844	0.000	0.000	0.000	0.000	0.000	0.045	pg1323_o2nofp.cx10a_c8r32
0.000	0.000	0.000	98.300	1.700	0.000	0.000	0.000	0.000	0.000	0.043	pg1420_o2nofp.cx10a_c8r32
0.000	0.000	0.000	99.072	0.928	0.000	0.000	0.000	0.000	0.000	0.043	pg1515_o2nofp.cx10a_c8r32
0.000	0.000	0.000	97.983	2.017	0.000	0.000	0.000	0.000	0.000	0.043	pg1611_o2nofp.cx10a_c8r32
0.000	0.000	0.000	95.572	4.428	0.000	0.000	0.000	0.000	0.000	0.042	pg177_o2nofp.cx10a_c8r32
0.000	0.000	0.000	97.822	2.178	0.000	0.000	0.000	0.000	0.000	0.043	pg181_o2nofp.cx10b_c8r32
qr1000.L5
- qr1000.L5: range queries with 1000 insert/s per client
- Legend for results is here.
- Each entry lists the percentage of responses that fit in that bucket (slower than max time for previous bucket, faster than min time for next bucket).
Query response time histogram
256us	1ms	4ms	16ms	64ms	256ms	1s	4s	16s	gt	max	tag
99.978	0.018	0.003	0.002	nonzero	nonzero	0.000	0.000	0.000	0.000	0.093	pg1222_o2nofp.cx10a_c8r32
99.986	0.010	0.003	0.002	nonzero	nonzero	0.000	0.000	0.000	0.000	0.089	pg1323_o2nofp.cx10a_c8r32
99.986	0.009	0.003	0.001	nonzero	nonzero	0.000	0.000	0.000	0.000	0.094	pg1420_o2nofp.cx10a_c8r32
99.982	0.013	0.003	0.001	nonzero	nonzero	0.000	0.000	0.000	0.000	0.088	pg1515_o2nofp.cx10a_c8r32
99.982	0.014	0.003	0.002	nonzero	nonzero	0.000	0.000	0.000	0.000	0.093	pg1611_o2nofp.cx10a_c8r32
99.983	0.013	0.003	0.001	nonzero	nonzero	0.000	0.000	0.000	0.000	0.106	pg177_o2nofp.cx10a_c8r32
99.984	0.012	0.003	0.001	nonzero	nonzero	0.000	0.000	0.000	0.000	0.099	pg181_o2nofp.cx10b_c8r32
Insert response time histogram
256us	1ms	4ms	16ms	64ms	256ms	1s	4s	16s	gt	max	tag
0.000	0.000	0.000	97.681	2.319	0.000	0.000	0.000	0.000	0.000	0.029	pg1222_o2nofp.cx10a_c8r32
0.000	0.000	0.000	98.342	1.658	0.000	0.000	0.000	0.000	0.000	0.022	pg1323_o2nofp.cx10a_c8r32
0.000	0.000	0.000	98.225	1.775	0.000	0.000	0.000	0.000	0.000	0.024	pg1420_o2nofp.cx10a_c8r32
0.000	0.000	0.000	98.264	1.736	0.000	0.000	0.000	0.000	0.000	0.027	pg1515_o2nofp.cx10a_c8r32
0.000	0.000	0.003	98.239	1.758	0.000	0.000	0.000	0.000	0.000	0.027	pg1611_o2nofp.cx10a_c8r32
0.000	0.000	0.000	98.050	1.950	0.000	0.000	0.000	0.000	0.000	0.030	pg177_o2nofp.cx10a_c8r32
0.000	0.000	0.000	98.031	1.969	0.000	0.000	0.000	0.000	0.000	0.022	pg181_o2nofp.cx10b_c8r32
Delete response time histogram
256us	1ms	4ms	16ms	64ms	256ms	1s	4s	16s	gt	max	tag
0.000	0.000	0.000	32.397	67.603	0.000	0.000	0.000	0.000	0.000	0.064	pg1222_o2nofp.cx10a_c8r32
0.000	0.000	0.000	23.097	76.900	0.003	0.000	0.000	0.000	0.000	0.065	pg1323_o2nofp.cx10a_c8r32
0.000	0.000	0.000	22.725	77.275	0.000	0.000	0.000	0.000	0.000	0.064	pg1420_o2nofp.cx10a_c8r32
0.000	0.000	0.000	20.303	79.697	0.000	0.000	0.000	0.000	0.000	0.063	pg1515_o2nofp.cx10a_c8r32
0.000	0.000	0.000	13.956	86.044	0.000	0.000	0.000	0.000	0.000	0.063	pg1611_o2nofp.cx10a_c8r32
0.000	0.000	0.000	4.461	95.539	0.000	0.000	0.000	0.000	0.000	0.061	pg177_o2nofp.cx10a_c8r32
0.000	0.000	0.000	14.536	85.461	0.003	0.000	0.000	0.000	0.000	0.065	pg181_o2nofp.cx10b_c8r32
qp1000.L6
- qp1000.L6: point queries with 1000 insert/s per client
- Legend for results is here.
- Each entry lists the percentage of responses that fit in that bucket (slower than max time for previous bucket, faster than min time for next bucket).
Query response time histogram
256us	1ms	4ms	16ms	64ms	256ms	1s	4s	16s	gt	max	tag
0.000	12.350	87.618	0.033	nonzero	0.000	0.000	0.000	0.000	0.000	0.017	pg1222_o2nofp.cx10a_c8r32
nonzero	54.511	45.477	0.012	nonzero	0.000	0.000	0.000	0.000	0.000	0.017	pg1323_o2nofp.cx10a_c8r32
0.000	54.998	44.986	0.016	nonzero	0.000	0.000	0.000	0.000	0.000	0.017	pg1420_o2nofp.cx10a_c8r32
0.000	55.046	44.944	0.011	nonzero	0.000	0.000	0.000	0.000	0.000	0.016	pg1515_o2nofp.cx10a_c8r32
0.000	54.667	45.303	0.027	0.003	0.000	0.000	0.000	0.000	0.000	0.019	pg1611_o2nofp.cx10a_c8r32
nonzero	54.033	45.955	0.012	0.000	0.000	0.000	0.000	0.000	0.000	0.015	pg177_o2nofp.cx10a_c8r32
0.000	48.609	51.377	0.014	nonzero	0.000	0.000	0.000	0.000	0.000	0.019	pg181_o2nofp.cx10b_c8r32
Insert response time histogram
256us	1ms	4ms	16ms	64ms	256ms	1s	4s	16s	gt	max	tag
0.000	0.000	0.000	99.931	0.069	0.000	0.000	0.000	0.000	0.000	0.032	pg1222_o2nofp.cx10a_c8r32
0.000	0.000	0.000	99.958	0.042	0.000	0.000	0.000	0.000	0.000	0.031	pg1323_o2nofp.cx10a_c8r32
0.000	0.000	0.000	99.911	0.089	0.000	0.000	0.000	0.000	0.000	0.024	pg1420_o2nofp.cx10a_c8r32
0.000	0.000	0.000	99.961	0.039	0.000	0.000	0.000	0.000	0.000	0.024	pg1515_o2nofp.cx10a_c8r32
0.000	0.000	0.000	99.803	0.197	0.000	0.000	0.000	0.000	0.000	0.025	pg1611_o2nofp.cx10a_c8r32
0.000	0.000	0.000	99.953	0.047	0.000	0.000	0.000	0.000	0.000	0.025	pg177_o2nofp.cx10a_c8r32
0.000	0.000	0.000	99.939	0.061	0.000	0.000	0.000	0.000	0.000	0.026	pg181_o2nofp.cx10b_c8r32
Delete response time histogram
256us	1ms	4ms	16ms	64ms	256ms	1s	4s	16s	gt	max	tag
0.000	0.000	0.000	0.000	99.997	0.003	0.000	0.000	0.000	0.000	0.099	pg1222_o2nofp.cx10a_c8r32
0.000	0.000	0.000	0.000	99.997	0.003	0.000	0.000	0.000	0.000	0.104	pg1323_o2nofp.cx10a_c8r32
0.000	0.000	0.000	0.000	99.997	0.003	0.000	0.000	0.000	0.000	0.100	pg1420_o2nofp.cx10a_c8r32
0.000	0.000	0.000	0.000	99.997	0.003	0.000	0.000	0.000	0.000	0.099	pg1515_o2nofp.cx10a_c8r32
0.000	0.000	0.000	0.000	99.997	0.003	0.000	0.000	0.000	0.000	0.099	pg1611_o2nofp.cx10a_c8r32
0.000	0.000	0.000	0.000	99.997	0.003	0.000	0.000	0.000	0.000	0.098	pg177_o2nofp.cx10a_c8r32
0.000	0.000	0.000	0.000	99.997	0.003	0.000	0.000	0.000	0.000	0.104	pg181_o2nofp.cx10b_c8r32