Introduction
This is a report for the insert benchmark with 30M docs and 1 client(s). It is generated by scripts (bash, awk, sed) and Tufte might not be impressed. An overview of the insert benchmark is here and a short update is here. Below, by DBMS, I mean DBMS+version.config. An example is my8020.c10b40 where my means MySQL, 8020 is version 8.0.20 and c10b40 is the name for the configuration file.
The test server has 8 AMD cores, 32G RAM and an NVMe device for the database. The benchmark was run with 1 client and there were 1 or 3 connections per client (1 for queries or inserts without rate limits, 1+1 for rate limited inserts+deletes). It uses 1 table with a table per client. It loads 30M rows per table without secondary indexes, creates 3 secondary indexes per table, then inserts 40m+10m rows per table with a delete per insert to avoid growing the table. It then does 6 read+write tests for 1800s each that do queries as fast as possible with 100,100,500,500,1000,1000 inserts/s and the same for deletes/s per client concurrent with the queries. The database is cached by InnoDB. Clients and the DBMS share one server.
The tested DBMS are:
- my5651_rel_o2nofp.cz12a_c8r32 - MySQL 5.6.51 with the cz12a_c8r32 config
- my5744_rel_o2nofp.cz12a_c8r32 - MySQL 5.7.44 with the cz12a_c8r32 config
- my8044_rel_o2nofp.cz12a_c8r32 - MySQL 8.0.44 with the cz12a_c8r32 config
- my8407_rel_o2nofp.cz12a_c8r32 - MySQL 8.4.7 with the cz12a_c8r32 config
- my9400_rel_o2nofp.cz12a_c8r32 - MySQL 9.4.0 with the cz12a_c8r32 config
- my9500_rel_o2nofp.cz12a_c8r32 - MySQL 9.5.0 with the cz12a_c8r32 config
Contents
- Summary
- l.i0: load without secondary indexes
- l.x: create secondary indexes
- l.i1: continue load after secondary indexes created with 50 inserts per transaction
- l.i2: continue load after secondary indexes created with 5 inserts per transaction
- qr100.L1: range queries with 100 insert/s per client
- qp100.L2: point queries with 100 insert/s per client
- qr500.L3: range queries with 500 insert/s per client
- qp500.L4: point queries with 500 insert/s per client
- qr1000.L5: range queries with 1000 insert/s per client
- qp1000.L6: point queries with 1000 insert/s per client
Summary
The numbers are inserts/s for l.i0, l.i1 and l.i2, indexed docs (or rows) /s for l.x and queries/s for qr100, qp100 thru qr1000, qp1000" The values are the average rate over the entire test for inserts (IPS) and queries (QPS). The range of values for IPS and QPS is split into 3 parts: bottom 25%, middle 50%, top 25%. Values in the bottom 25% have a red background, values in the top 25% have a green background and values in the middle have no color. A gray background is used for values that can be ignored because the DBMS did not sustain the target insert rate. Red backgrounds are not used when the minimum value is within 80% of the max value.
| dbms | l.i0 | l.x | l.i1 | l.i2 | qr100 | qp100 | qr500 | qp500 | qr1000 | qp1000 |
|---|---|---|---|---|---|---|---|---|---|---|
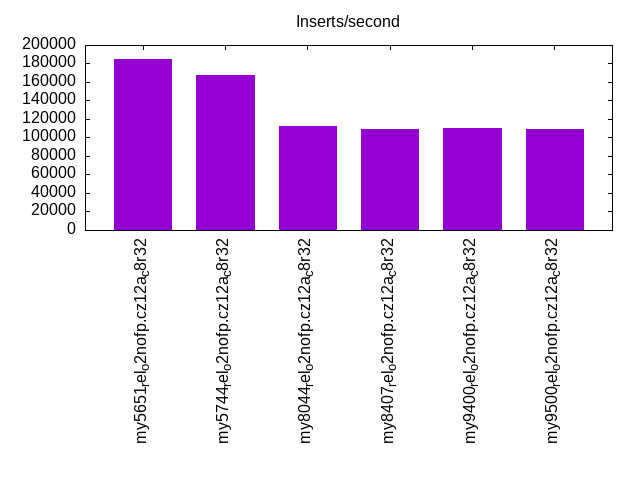
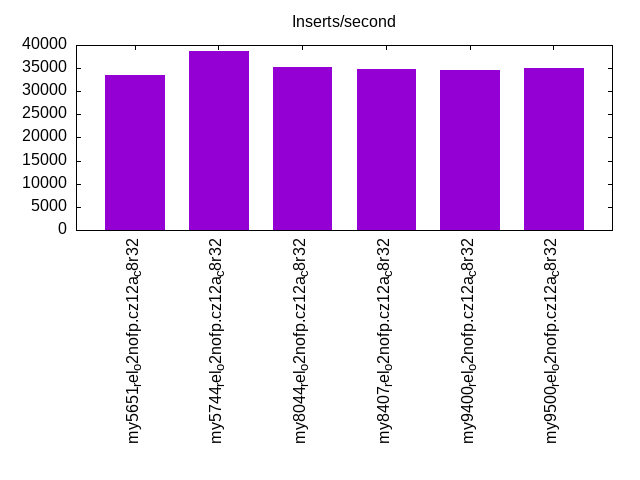
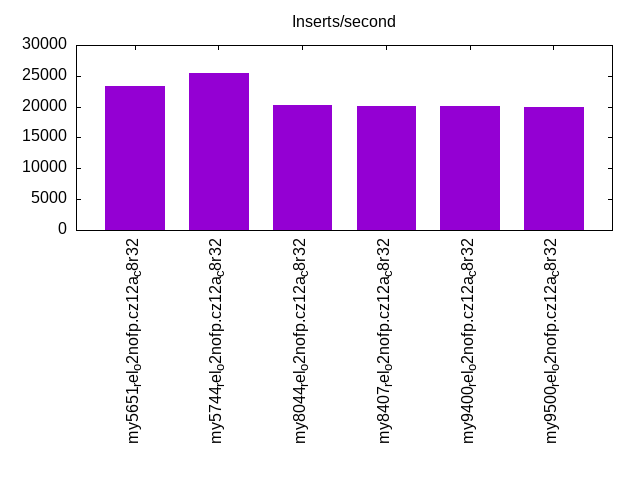
| my5651_rel_o2nofp.cz12a_c8r32 | 185185 | 145632 | 33473 | 23419 | 13136 | 11193 | 13110 | 11124 | 13020 | 11214 |
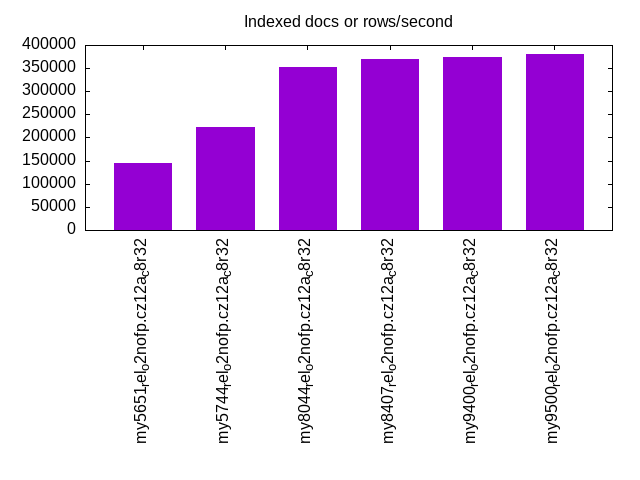
| my5744_rel_o2nofp.cz12a_c8r32 | 167598 | 222223 | 38797 | 25510 | 10838 | 9291 | 10885 | 9346 | 10864 | 9255 |
| my8044_rel_o2nofp.cz12a_c8r32 | 111940 | 352942 | 35180 | 20284 | 9128 | 6986 | 9132 | 6943 | 9097 | 6943 |
| my8407_rel_o2nofp.cz12a_c8r32 | 108696 | 370372 | 34752 | 20040 | 8874 | 6800 | 8884 | 6744 | 8768 | 6689 |
| my9400_rel_o2nofp.cz12a_c8r32 | 109890 | 375001 | 34632 | 20121 | 9022 | 6932 | 9024 | 6901 | 9101 | 6886 |
| my9500_rel_o2nofp.cz12a_c8r32 | 108696 | 379748 | 35026 | 19881 | 9046 | 6950 | 8992 | 6926 | 8965 | 6923 |
This table has relative throughput, throughput for the DBMS relative to the DBMS in the first line, using the absolute throughput from the previous table. Values less than 0.95 have a yellow background. Values greater than 1.05 have a blue background.
| dbms | l.i0 | l.x | l.i1 | l.i2 | qr100 | qp100 | qr500 | qp500 | qr1000 | qp1000 |
|---|---|---|---|---|---|---|---|---|---|---|
| my5651_rel_o2nofp.cz12a_c8r32 | 1.00 | 1.00 | 1.00 | 1.00 | 1.00 | 1.00 | 1.00 | 1.00 | 1.00 | 1.00 |
| my5744_rel_o2nofp.cz12a_c8r32 | 0.91 | 1.53 | 1.16 | 1.09 | 0.83 | 0.83 | 0.83 | 0.84 | 0.83 | 0.83 |
| my8044_rel_o2nofp.cz12a_c8r32 | 0.60 | 2.42 | 1.05 | 0.87 | 0.69 | 0.62 | 0.70 | 0.62 | 0.70 | 0.62 |
| my8407_rel_o2nofp.cz12a_c8r32 | 0.59 | 2.54 | 1.04 | 0.86 | 0.68 | 0.61 | 0.68 | 0.61 | 0.67 | 0.60 |
| my9400_rel_o2nofp.cz12a_c8r32 | 0.59 | 2.57 | 1.03 | 0.86 | 0.69 | 0.62 | 0.69 | 0.62 | 0.70 | 0.61 |
| my9500_rel_o2nofp.cz12a_c8r32 | 0.59 | 2.61 | 1.05 | 0.85 | 0.69 | 0.62 | 0.69 | 0.62 | 0.69 | 0.62 |
This lists the average rate of inserts/s for the tests that do inserts concurrent with queries. For such tests the query rate is listed in the table above. The read+write tests are setup so that the insert rate should match the target rate every second. Cells that are not at least 95% of the target have a red background to indicate a failure to satisfy the target.
| dbms | qr100.L1 | qp100.L2 | qr500.L3 | qp500.L4 | qr1000.L5 | qp1000.L6 |
|---|---|---|---|---|---|---|
| my5651_rel_o2nofp.cz12a_c8r32 | 100 | 100 | 500 | 500 | 999 | 999 |
| my5744_rel_o2nofp.cz12a_c8r32 | 100 | 100 | 500 | 500 | 1000 | 1000 |
| my8044_rel_o2nofp.cz12a_c8r32 | 100 | 100 | 500 | 500 | 1000 | 1000 |
| my8407_rel_o2nofp.cz12a_c8r32 | 100 | 100 | 500 | 500 | 999 | 999 |
| my9400_rel_o2nofp.cz12a_c8r32 | 100 | 100 | 500 | 500 | 999 | 999 |
| my9500_rel_o2nofp.cz12a_c8r32 | 100 | 100 | 500 | 500 | 1000 | 1000 |
| target | 100 | 100 | 500 | 500 | 1000 | 1000 |
l.i0
l.i0: load without secondary indexes. Graphs for performance per 1-second interval are here.
Average throughput:
Insert response time histogram: each cell has the percentage of responses that take <= the time in the header and max is the max response time in seconds. For the max column values in the top 25% of the range have a red background and in the bottom 25% of the range have a green background. The red background is not used when the min value is within 80% of the max value.
| dbms | 256us | 1ms | 4ms | 16ms | 64ms | 256ms | 1s | 4s | 16s | gt | max |
|---|---|---|---|---|---|---|---|---|---|---|---|
| my5651_rel_o2nofp.cz12a_c8r32 | 99.719 | 0.225 | 0.050 | 0.005 | 0.001 | 0.127 | |||||
| my5744_rel_o2nofp.cz12a_c8r32 | 99.717 | 0.094 | 0.108 | 0.080 | 0.001 | 0.130 | |||||
| my8044_rel_o2nofp.cz12a_c8r32 | 99.503 | 0.304 | 0.080 | 0.112 | 0.001 | 0.074 | |||||
| my8407_rel_o2nofp.cz12a_c8r32 | 99.501 | 0.306 | 0.086 | 0.106 | 0.002 | 0.073 | |||||
| my9400_rel_o2nofp.cz12a_c8r32 | 99.496 | 0.311 | 0.079 | 0.113 | 0.002 | 0.074 | |||||
| my9500_rel_o2nofp.cz12a_c8r32 | 99.436 | 0.368 | 0.071 | 0.124 | 0.002 | 0.088 |
Performance metrics for the DBMS listed above. Some are normalized by throughput, others are not. Legend for results is here.
ips	qps	rps	rmbps	wps	wmbps	rpq	rkbpq	wpi	wkbpi	csps	cpups	cspq	cpupq	dbgb1	dbgb2	rss	maxop	p50	p99	tag
185185	0	1620	6.3	474.8	45.4	0.009	0.035	0.003	0.251	24151	20.2	0.130	9	2.0	32.5	3.5	0.127	185678	163682	my5651_rel_o2nofp.cz12a_c8r32
167598	0	0	0.0	510.9	43.1	0.000	0.000	0.003	0.263	19318	20.1	0.115	10	2.0	32.5	4.0	0.130	167876	149588	my5744_rel_o2nofp.cz12a_c8r32
111940	0	0	0.0	412.3	31.9	0.000	0.000	0.004	0.292	13853	17.2	0.124	12	2.0	32.6	4.3	0.074	112584	103785	my8044_rel_o2nofp.cz12a_c8r32
108696	0	0	0.0	402.0	31.0	0.000	0.000	0.004	0.292	13496	17.3	0.124	13	2.0	34.0	4.2	0.073	109183	100887	my8407_rel_o2nofp.cz12a_c8r32
109890	0	0	0.0	406.4	31.4	0.000	0.000	0.004	0.293	13646	17.2	0.124	13	2.0	34.0	4.3	0.074	110686	101484	my9400_rel_o2nofp.cz12a_c8r32
108696	0	0	0.0	418.0	31.7	0.000	0.000	0.004	0.299	14430	17.3	0.133	13	2.0	34.0	4.4	0.088	109283	100784	my9500_rel_o2nofp.cz12a_c8r32
Average values from iostat.
r/s	rkB/s	rrqm/s	%rrqm	r_await	rareq-s	w/s	wkB/s	wrqm/s	%wrqm	w_await	wareq-s	d/s	dkB/s	drqm/s	%drqm	d_await	dareq-s	f/s	f_await	aqu-sz	%util
1620.4	6481.7	0.000	0.000	0.040	4.000	481.4	46933.6	8.026	1.900	0.196	111.9	0.413	9.600	0.000	0.000	0.068	3.757	1.303	1.145	0.150	9.921		my5651_rel_o2nofp.cz12a_c8r32
0.159	0.635	0.000	0.000	2.993	2.235	517.2	44483.9	18.74	3.777	2.141	86.85	0.318	6.047	0.000	0.000	0.097	2.800	4.471	1.286	1.006	6.250		my5744_rel_o2nofp.cz12a_c8r32
0.096	0.385	0.000	0.000	2.183	1.692	415.7	32873.9	20.88	5.163	2.495	80.91	0.123	3.815	0.000	0.000	0.156	7.192	4.523	1.362	0.969	5.443		my8044_rel_o2nofp.cz12a_c8r32
0.089	0.356	0.000	0.000	1.278	1.407	405.1	31916.4	18.90	4.829	2.628	80.46	0.081	2.963	0.000	0.000	0.114	7.728	4.485	1.299	0.985	5.379		my8407_rel_o2nofp.cz12a_c8r32
0.098	0.392	0.000	0.000	1.755	1.736	409.8	32373.7	19.48	4.856	2.626	80.92	0.143	2.294	0.000	0.000	0.098	2.830	4.491	1.360	0.994	5.531		my9400_rel_o2nofp.cz12a_c8r32
0.111	0.622	0.000	0.000	1.481	2.148	421.2	32674.0	20.58	5.158	2.589	80.33	0.133	1.793	0.000	0.000	0.147	2.522	4.585	1.401	1.010	5.523		my9500_rel_o2nofp.cz12a_c8r32
l.x
l.x: create secondary indexes.
Average throughput:
Performance metrics for the DBMS listed above. Some are normalized by throughput, others are not. Legend for results is here.
ips	qps	rps	rmbps	wps	wmbps	rpq	rkbpq	wpi	wkbpi	csps	cpups	cspq	cpupq	dbgb1	dbgb2	rss	maxop	p50	p99	tag
145632	0	32	0.1	2360.6	158.2	0.000	0.001	0.016	1.113	1939	10.7	0.013	6	4.2	34.7	5.1	0.002	NA	NA	my5651_rel_o2nofp.cz12a_c8r32
222223	0	0	0.0	3539.9	221.6	0.000	0.000	0.016	1.021	9583	12.1	0.043	4	4.6	35.1	5.5	0.001	NA	NA	my5744_rel_o2nofp.cz12a_c8r32
352942	0	1	0.0	10021.1	448.8	0.000	0.000	0.028	1.302	22641	41.9	0.064	9	4.5	35.1	4.8	0.001	NA	NA	my8044_rel_o2nofp.cz12a_c8r32
370372	0	1	0.0	11512.3	473.5	0.000	0.000	0.031	1.309	25409	40.9	0.069	9	4.5	36.5	5.0	0.001	NA	NA	my8407_rel_o2nofp.cz12a_c8r32
375001	0	1	0.0	12002.3	481.3	0.000	0.000	0.032	1.314	25695	39.9	0.069	9	4.5	36.5	5.1	0.002	NA	NA	my9400_rel_o2nofp.cz12a_c8r32
379748	0	1	0.0	10966.2	484.7	0.000	0.000	0.029	1.307	24664	41.3	0.065	9	4.5	36.5	5.4	0.002	NA	NA	my9500_rel_o2nofp.cz12a_c8r32
Average values from iostat.
r/s	rkB/s	rrqm/s	%rrqm	r_await	rareq-s	w/s	wkB/s	wrqm/s	%wrqm	w_await	wareq-s	d/s	dkB/s	drqm/s	%drqm	d_await	dareq-s	f/s	f_await	aqu-sz	%util
32.62	130.5	0.000	0.000	0.036	2.800	2120.5	156846	151.9	5.927	0.213	82.41	0.530	6156.9	0.000	0.000	0.021	684.9	51.80	1.102	0.541	28.50		my5651_rel_o2nofp.cz12a_c8r32
0.232	0.928	0.000	0.000	0.048	1.920	3441.9	228121	20.89	0.668	0.080	106.0	0.976	9852.8	0.000	0.000	0.058	957.7	5.000	1.358	0.203	7.647		my5744_rel_o2nofp.cz12a_c8r32
0.867	12.80	0.000	0.000	0.054	14.56	9529.0	476104	45.75	2.509	0.083	79.57	10.15	64985.5	0.000	0.000	0.191	1803.5	10.93	1.377	0.355	22.99		my8044_rel_o2nofp.cz12a_c8r32
1.293	26.07	0.000	0.000	0.076	25.86	11103.3	501134	45.78	2.211	0.071	73.29	10.46	64889.6	0.000	0.000	0.275	2389.0	10.96	1.436	0.369	23.44		my8407_rel_o2nofp.cz12a_c8r32
1.080	24.80	0.000	0.000	0.119	27.48	11648.0	509901	44.91	2.203	0.071	71.53	10.47	64999.8	0.000	0.000	0.313	1837.1	10.95	1.402	0.381	24.91		my9400_rel_o2nofp.cz12a_c8r32
1.142	18.50	0.000	0.000	0.075	23.34	10519.2	516824	49.45	2.475	0.080	76.85	11.45	69515.8	0.000	0.000	0.375	2191.5	11.54	1.474	0.393	24.16		my9500_rel_o2nofp.cz12a_c8r32
l.i1
l.i1: continue load after secondary indexes created with 50 inserts per transaction. Graphs for performance per 1-second interval are here.
Average throughput:
Insert response time histogram: each cell has the percentage of responses that take <= the time in the header and max is the max response time in seconds. For the max column values in the top 25% of the range have a red background and in the bottom 25% of the range have a green background. The red background is not used when the min value is within 80% of the max value.
| dbms | 256us | 1ms | 4ms | 16ms | 64ms | 256ms | 1s | 4s | 16s | gt | max |
|---|---|---|---|---|---|---|---|---|---|---|---|
| my5651_rel_o2nofp.cz12a_c8r32 | 10.762 | 87.330 | 1.760 | 0.148 | nonzero | 0.081 | |||||
| my5744_rel_o2nofp.cz12a_c8r32 | 19.701 | 79.770 | 0.499 | 0.029 | 0.001 | 0.086 | |||||
| my8044_rel_o2nofp.cz12a_c8r32 | 99.376 | 0.556 | 0.067 | 0.001 | nonzero | 0.318 | |||||
| my8407_rel_o2nofp.cz12a_c8r32 | 99.355 | 0.578 | 0.066 | 0.001 | nonzero | 0.321 | |||||
| my9400_rel_o2nofp.cz12a_c8r32 | 99.352 | 0.579 | 0.068 | 0.001 | nonzero | 0.331 | |||||
| my9500_rel_o2nofp.cz12a_c8r32 | 99.361 | 0.567 | 0.072 | nonzero | nonzero | 0.326 |
Delete response time histogram: each cell has the percentage of responses that take <= the time in the header and max is the max response time in seconds. For the max column values in the top 25% of the range have a red background and in the bottom 25% of the range have a green background. The red background is not used when the min value is within 80% of the max value.
| dbms | 256us | 1ms | 4ms | 16ms | 64ms | 256ms | 1s | 4s | 16s | gt | max |
|---|---|---|---|---|---|---|---|---|---|---|---|
| my5651_rel_o2nofp.cz12a_c8r32 | 76.242 | 22.643 | 1.000 | 0.115 | nonzero | 0.081 | |||||
| my5744_rel_o2nofp.cz12a_c8r32 | 68.825 | 31.043 | 0.123 | 0.009 | 0.001 | 0.086 | |||||
| my8044_rel_o2nofp.cz12a_c8r32 | 85.471 | 14.347 | 0.166 | 0.016 | nonzero | 0.240 | |||||
| my8407_rel_o2nofp.cz12a_c8r32 | 83.089 | 16.719 | 0.175 | 0.017 | nonzero | 0.101 | |||||
| my9400_rel_o2nofp.cz12a_c8r32 | 82.798 | 17.011 | 0.173 | 0.017 | nonzero | nonzero | 0.283 | ||||
| my9500_rel_o2nofp.cz12a_c8r32 | 88.682 | 11.126 | 0.175 | 0.016 | 0.001 | nonzero | 0.326 |
Performance metrics for the DBMS listed above. Some are normalized by throughput, others are not. Legend for results is here.
ips	qps	rps	rmbps	wps	wmbps	rpq	rkbpq	wpi	wkbpi	csps	cpups	cspq	cpupq	dbgb1	dbgb2	rss	maxop	p50	p99	tag
33473	0	856	3.3	2507.9	109.3	0.026	0.102	0.075	3.342	34559	40.9	1.032	98	6.2	36.7	7.9	0.081	35546	9199	my5651_rel_o2nofp.cz12a_c8r32
38797	0	0	0.0	2862.5	125.6	0.000	0.000	0.074	3.314	24434	47.5	0.630	98	6.3	36.8	8.3	0.086	40445	11349	my5744_rel_o2nofp.cz12a_c8r32
35180	0	128	2.0	2795.8	116.5	0.004	0.058	0.079	3.391	43717	36.6	1.243	83	6.9	37.9	9.5	0.318	36296	6549	my8044_rel_o2nofp.cz12a_c8r32
34752	0	126	2.0	2739.7	114.8	0.004	0.058	0.079	3.381	43403	36.3	1.249	84	6.8	43.1	9.4	0.321	35995	6649	my8407_rel_o2nofp.cz12a_c8r32
34632	0	126	2.0	2724.8	114.2	0.004	0.058	0.079	3.376	43391	36.1	1.253	83	6.8	43.1	9.4	0.331	35896	6649	my9400_rel_o2nofp.cz12a_c8r32
35026	0	127	2.0	2712.2	114.5	0.004	0.058	0.077	3.346	43260	36.3	1.235	83	6.8	42.9	9.4	0.326	36146	4749	my9500_rel_o2nofp.cz12a_c8r32
Average values from iostat.
r/s	rkB/s	rrqm/s	%rrqm	r_await	rareq-s	w/s	wkB/s	wrqm/s	%wrqm	w_await	wareq-s	d/s	dkB/s	drqm/s	%drqm	d_await	dareq-s	f/s	f_await	aqu-sz	%util
858.6	3434.3	0.000	0.000	0.059	3.797	2508.4	111120	29.60	1.176	0.219	45.28	0.141	4.486	0.000	0.000	0.081	4.848	9.098	1.109	0.553	12.41		my5651_rel_o2nofp.cz12a_c8r32
0.062	0.250	0.000	0.000	0.895	1.073	2863.1	128032	38.68	1.367	0.982	44.77	0.160	1.947	0.000	0.000	0.082	1.651	11.75	1.072	2.780	9.151		my5744_rel_o2nofp.cz12a_c8r32
76.34	1220.8	0.000	0.000	3.432	12.40	2804.4	119396	20.88	0.715	0.779	43.49	0.088	4.131	0.000	0.000	0.135	10.46	8.146	1.358	2.319	6.909		my8044_rel_o2nofp.cz12a_c8r32
75.48	1207.0	0.000	0.000	3.019	12.25	2747.8	117588	21.04	0.732	0.777	43.72	0.095	4.940	0.000	0.000	0.140	11.40	8.125	1.502	2.252	6.929		my8407_rel_o2nofp.cz12a_c8r32
75.30	1204.2	0.000	0.000	2.908	12.25	2732.8	116987	21.42	0.745	0.829	43.69	0.097	3.002	0.000	0.000	0.137	5.777	8.144	1.542	2.375	7.033		my9400_rel_o2nofp.cz12a_c8r32
81.53	1303.8	0.000	0.000	3.180	12.40	2720.6	117346	20.76	0.744	0.789	44.11	0.107	5.152	0.000	0.000	0.116	8.504	8.188	1.511	2.262	7.093		my9500_rel_o2nofp.cz12a_c8r32
l.i2
l.i2: continue load after secondary indexes created with 5 inserts per transaction. Graphs for performance per 1-second interval are here.
Average throughput:
Insert response time histogram: each cell has the percentage of responses that take <= the time in the header and max is the max response time in seconds. For the max column values in the top 25% of the range have a red background and in the bottom 25% of the range have a green background. The red background is not used when the min value is within 80% of the max value.
| dbms | 256us | 1ms | 4ms | 16ms | 64ms | 256ms | 1s | 4s | 16s | gt | max |
|---|---|---|---|---|---|---|---|---|---|---|---|
| my5651_rel_o2nofp.cz12a_c8r32 | 88.489 | 11.387 | 0.020 | 0.100 | 0.003 | 0.047 | |||||
| my5744_rel_o2nofp.cz12a_c8r32 | 93.613 | 6.335 | 0.043 | 0.009 | nonzero | nonzero | 0.081 | ||||
| my8044_rel_o2nofp.cz12a_c8r32 | 82.366 | 17.602 | 0.023 | 0.008 | 0.001 | nonzero | 0.101 | ||||
| my8407_rel_o2nofp.cz12a_c8r32 | 82.028 | 17.940 | 0.023 | 0.008 | 0.001 | nonzero | 0.101 | ||||
| my9400_rel_o2nofp.cz12a_c8r32 | 81.969 | 18.001 | 0.021 | 0.008 | 0.001 | nonzero | 0.074 | ||||
| my9500_rel_o2nofp.cz12a_c8r32 | 82.211 | 17.759 | 0.020 | 0.009 | 0.001 | nonzero | 0.101 |
Delete response time histogram: each cell has the percentage of responses that take <= the time in the header and max is the max response time in seconds. For the max column values in the top 25% of the range have a red background and in the bottom 25% of the range have a green background. The red background is not used when the min value is within 80% of the max value.
| dbms | 256us | 1ms | 4ms | 16ms | 64ms | 256ms | 1s | 4s | 16s | gt | max |
|---|---|---|---|---|---|---|---|---|---|---|---|
| my5651_rel_o2nofp.cz12a_c8r32 | 96.796 | 3.081 | 0.020 | 0.100 | 0.003 | 0.047 | |||||
| my5744_rel_o2nofp.cz12a_c8r32 | 94.418 | 5.557 | 0.018 | 0.006 | nonzero | nonzero | 0.080 | ||||
| my8044_rel_o2nofp.cz12a_c8r32 | 96.196 | 3.781 | 0.016 | 0.006 | 0.001 | nonzero | 0.101 | ||||
| my8407_rel_o2nofp.cz12a_c8r32 | 95.742 | 4.233 | 0.017 | 0.007 | 0.001 | nonzero | 0.101 | ||||
| my9400_rel_o2nofp.cz12a_c8r32 | 95.774 | 4.203 | 0.016 | 0.006 | 0.001 | nonzero | 0.070 | ||||
| my9500_rel_o2nofp.cz12a_c8r32 | 97.256 | 2.717 | 0.018 | 0.008 | 0.001 | nonzero | 0.101 |
Performance metrics for the DBMS listed above. Some are normalized by throughput, others are not. Legend for results is here.
ips	qps	rps	rmbps	wps	wmbps	rpq	rkbpq	wpi	wkbpi	csps	cpups	cspq	cpupq	dbgb1	dbgb2	rss	maxop	p50	p99	tag
23419	0	4150	16.2	1633.3	67.9	0.177	0.709	0.070	2.970	203223	42.9	8.678	147	6.2	36.7	7.9	0.047	23477	22327	my5651_rel_o2nofp.cz12a_c8r32
25510	0	0	0.0	1886.0	78.1	0.000	0.000	0.074	3.136	114152	41.7	4.475	131	6.3	36.8	8.3	0.081	25567	23837	my5744_rel_o2nofp.cz12a_c8r32
20284	0	0	0.0	1698.8	68.2	0.000	0.000	0.084	3.443	106835	35.3	5.267	139	6.9	37.9	9.5	0.101	20328	19333	my8044_rel_o2nofp.cz12a_c8r32
20040	0	0	0.0	1694.2	67.9	0.000	0.000	0.085	3.471	105652	35.2	5.272	141	6.8	45.0	9.4	0.101	20103	19128	my8407_rel_o2nofp.cz12a_c8r32
20121	0	0	0.0	1616.4	65.9	0.000	0.000	0.080	3.353	105802	35.2	5.258	140	6.8	45.0	9.4	0.074	20153	19408	my9400_rel_o2nofp.cz12a_c8r32
19881	0	0	0.0	1650.6	67.7	0.000	0.000	0.083	3.488	114027	34.8	5.736	140	6.8	44.8	9.4	0.101	19978	18988	my9500_rel_o2nofp.cz12a_c8r32
Average values from iostat.
r/s	rkB/s	rrqm/s	%rrqm	r_await	rareq-s	w/s	wkB/s	wrqm/s	%wrqm	w_await	wareq-s	d/s	dkB/s	drqm/s	%drqm	d_await	dareq-s	f/s	f_await	aqu-sz	%util
4152.7	16610.8	0.000	0.000	0.018	4.000	1611.9	69006.5	15.02	0.930	0.068	43.45	0.224	5.152	0.000	0.000	0.099	3.334	5.250	1.119	0.179	12.17		my5651_rel_o2nofp.cz12a_c8r32
0.049	0.198	0.000	0.000	0.387	0.623	1880.0	79904.2	19.97	1.050	0.933	42.43	0.257	5.043	0.000	0.000	0.104	3.107	7.257	1.171	1.751	6.266		my5744_rel_o2nofp.cz12a_c8r32
0.045	0.181	0.000	0.000	0.742	0.866	1694.0	69739.5	1.849	0.107	1.180	41.10	0.130	5.493	0.000	0.000	0.131	6.043	5.388	1.388	1.998	3.886		my8044_rel_o2nofp.cz12a_c8r32
0.043	0.171	0.000	0.000	0.699	0.776	1690.0	69504.0	1.814	0.105	1.194	41.02	0.151	6.849	0.000	0.000	0.109	7.529	5.365	1.506	2.023	3.956		my8407_rel_o2nofp.cz12a_c8r32
0.033	0.131	0.000	0.000	0.816	0.612	1609.4	67337.2	1.849	0.113	1.279	41.77	0.149	1.404	0.000	0.000	0.103	1.502	5.226	1.512	2.054	3.877		my9400_rel_o2nofp.cz12a_c8r32
0.042	0.170	0.000	0.000	0.944	0.768	1646.1	69250.9	1.855	0.110	1.275	41.98	0.180	7.362	0.000	0.000	0.113	6.905	5.366	1.564	2.101	4.011		my9500_rel_o2nofp.cz12a_c8r32
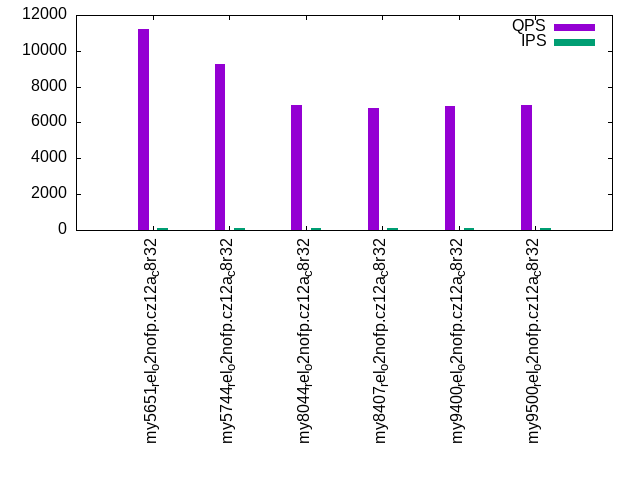
qr100.L1
qr100.L1: range queries with 100 insert/s per client. Graphs for performance per 1-second interval are here.
Average throughput:

Query response time histogram: each cell has the percentage of responses that take <= the time in the header and max is the max response time in seconds. For max values in the top 25% of the range have a red background and in the bottom 25% of the range have a green background. The red background is not used when the min value is within 80% of the max value.
| dbms | 256us | 1ms | 4ms | 16ms | 64ms | 256ms | 1s | 4s | 16s | gt | max |
|---|---|---|---|---|---|---|---|---|---|---|---|
| my5651_rel_o2nofp.cz12a_c8r32 | 99.985 | 0.008 | 0.002 | 0.005 | nonzero | 0.022 | |||||
| my5744_rel_o2nofp.cz12a_c8r32 | 99.998 | 0.002 | nonzero | nonzero | 0.010 | ||||||
| my8044_rel_o2nofp.cz12a_c8r32 | 99.990 | 0.010 | nonzero | 0.001 | |||||||
| my8407_rel_o2nofp.cz12a_c8r32 | 99.989 | 0.011 | nonzero | 0.001 | |||||||
| my9400_rel_o2nofp.cz12a_c8r32 | 99.989 | 0.011 | nonzero | 0.001 | |||||||
| my9500_rel_o2nofp.cz12a_c8r32 | 99.990 | 0.010 | nonzero | nonzero | 0.004 |
Insert response time histogram: each cell has the percentage of responses that take <= the time in the header and max is the max response time in seconds. For max values in the top 25% of the range have a red background and in the bottom 25% of the range have a green background. The red background is not used when the min value is within 80% of the max value.
| dbms | 256us | 1ms | 4ms | 16ms | 64ms | 256ms | 1s | 4s | 16s | gt | max |
|---|---|---|---|---|---|---|---|---|---|---|---|
| my5651_rel_o2nofp.cz12a_c8r32 | 0.750 | 49.667 | 46.778 | 2.806 | 0.054 | ||||||
| my5744_rel_o2nofp.cz12a_c8r32 | 7.444 | 92.528 | 0.028 | 0.010 | |||||||
| my8044_rel_o2nofp.cz12a_c8r32 | 90.250 | 9.750 | 0.012 | ||||||||
| my8407_rel_o2nofp.cz12a_c8r32 | 99.944 | 0.028 | 0.028 | 0.029 | |||||||
| my9400_rel_o2nofp.cz12a_c8r32 | 99.944 | 0.028 | 0.028 | 0.032 | |||||||
| my9500_rel_o2nofp.cz12a_c8r32 | 91.444 | 8.528 | 0.028 | 0.048 |
Delete response time histogram: each cell has the percentage of responses that take <= the time in the header and max is the max response time in seconds. For max values in the top 25% of the range have a red background and in the bottom 25% of the range have a green background. The red background is not used when the min value is within 80% of the max value.
| dbms | 256us | 1ms | 4ms | 16ms | 64ms | 256ms | 1s | 4s | 16s | gt | max |
|---|---|---|---|---|---|---|---|---|---|---|---|
| my5651_rel_o2nofp.cz12a_c8r32 | 3.806 | 46.333 | 48.139 | 1.722 | 0.043 | ||||||
| my5744_rel_o2nofp.cz12a_c8r32 | 59.250 | 40.750 | 0.002 | ||||||||
| my8044_rel_o2nofp.cz12a_c8r32 | 46.306 | 44.028 | 9.667 | 0.012 | |||||||
| my8407_rel_o2nofp.cz12a_c8r32 | 52.222 | 47.722 | 0.028 | 0.028 | 0.032 | ||||||
| my9400_rel_o2nofp.cz12a_c8r32 | 50.028 | 49.917 | 0.028 | 0.028 | 0.028 | ||||||
| my9500_rel_o2nofp.cz12a_c8r32 | 46.139 | 45.333 | 8.500 | 0.028 | 0.044 |
Performance metrics for the DBMS listed above. Some are normalized by throughput, others are not. Legend for results is here.
ips	qps	rps	rmbps	wps	wmbps	rpq	rkbpq	wpi	wkbpi	csps	cpups	cspq	cpupq	dbgb1	dbgb2	rss	maxop	p50	p99	tag
100	13136	4	0.0	736.4	20.3	0.000	0.001	7.372	207.768	75447	11.5	5.743	70	6.2	36.7	7.9	0.022	13150	12862	my5651_rel_o2nofp.cz12a_c8r32
100	10838	0	0.0	156.2	4.2	0.000	0.000	1.564	43.554	62256	12.4	5.744	92	6.3	36.8	8.3	0.010	10847	10735	my5744_rel_o2nofp.cz12a_c8r32
100	9128	0	0.0	199.0	5.5	0.000	0.000	1.990	56.292	52799	12.4	5.784	109	6.9	37.9	9.5	0.001	9135	9039	my8044_rel_o2nofp.cz12a_c8r32
100	8874	0	0.0	162.0	4.5	0.000	0.000	1.620	45.883	51303	13.3	5.781	120	6.8	45.0	9.4	0.001	8879	8783	my8407_rel_o2nofp.cz12a_c8r32
100	9022	0	0.0	170.0	4.7	0.000	0.000	1.700	48.161	52165	12.4	5.782	110	6.8	45.0	9.4	0.001	9023	8959	my9400_rel_o2nofp.cz12a_c8r32
100	9046	0	0.0	153.3	4.2	0.000	0.000	1.534	43.427	52315	12.4	5.784	110	6.8	44.9	9.4	0.004	9055	8975	my9500_rel_o2nofp.cz12a_c8r32
Average values from iostat.
r/s	rkB/s	rrqm/s	%rrqm	r_await	rareq-s	w/s	wkB/s	wrqm/s	%wrqm	w_await	wareq-s	d/s	dkB/s	drqm/s	%drqm	d_await	dareq-s	f/s	f_await	aqu-sz	%util
3.782	15.13	0.000	0.000	2.447	4.000	736.8	20765.8	7.311	8.465	0.432	26.41	0.004	0.018	0.000	0.000	0.011	0.089	2.769	1.124	0.053	3.737		my5651_rel_o2nofp.cz12a_c8r32
0.001	0.004	0.000	0.000	0.000	0.011	155.6	4334.3	4.479	5.145	0.363	27.28	0.000	0.000	0.000	0.000	0.000	0.000	1.534	1.362	0.032	2.326		my5744_rel_o2nofp.cz12a_c8r32
0.000	0.000	0.000	0.000	0.000	0.000	198.3	5610.4	1.384	1.244	0.212	28.17	0.000	0.000	0.000	0.000	0.000	0.000	1.874	1.599	0.037	1.627		my8044_rel_o2nofp.cz12a_c8r32
0.001	0.002	0.000	0.000	0.000	0.011	161.6	4575.8	1.565	1.953	0.387	28.16	0.002	0.013	0.000	0.000	0.005	0.037	1.520	1.829	0.055	2.693		my8407_rel_o2nofp.cz12a_c8r32
0.000	0.000	0.000	0.000	0.000	0.000	169.6	4804.9	1.374	1.545	0.485	28.24	0.005	0.036	0.000	0.000	0.015	0.149	1.549	1.916	0.069	3.747		my9400_rel_o2nofp.cz12a_c8r32
0.000	0.000	0.000	0.000	0.000	0.000	152.5	4316.3	1.509	2.038	0.379	28.11	0.006	0.040	0.000	0.000	0.019	0.171	1.590	1.985	0.042	1.848		my9500_rel_o2nofp.cz12a_c8r32
qp100.L2
qp100.L2: point queries with 100 insert/s per client. Graphs for performance per 1-second interval are here.
Average throughput:
Query response time histogram: each cell has the percentage of responses that take <= the time in the header and max is the max response time in seconds. For max values in the top 25% of the range have a red background and in the bottom 25% of the range have a green background. The red background is not used when the min value is within 80% of the max value.
| dbms | 256us | 1ms | 4ms | 16ms | 64ms | 256ms | 1s | 4s | 16s | gt | max |
|---|---|---|---|---|---|---|---|---|---|---|---|
| my5651_rel_o2nofp.cz12a_c8r32 | 99.982 | 0.013 | 0.002 | 0.004 | nonzero | 0.028 | |||||
| my5744_rel_o2nofp.cz12a_c8r32 | 99.991 | 0.009 | nonzero | 0.001 | |||||||
| my8044_rel_o2nofp.cz12a_c8r32 | 99.964 | 0.036 | nonzero | 0.001 | |||||||
| my8407_rel_o2nofp.cz12a_c8r32 | 99.954 | 0.046 | nonzero | 0.002 | |||||||
| my9400_rel_o2nofp.cz12a_c8r32 | 99.958 | 0.042 | nonzero | 0.001 | |||||||
| my9500_rel_o2nofp.cz12a_c8r32 | 99.961 | 0.039 | nonzero | 0.001 |
Insert response time histogram: each cell has the percentage of responses that take <= the time in the header and max is the max response time in seconds. For max values in the top 25% of the range have a red background and in the bottom 25% of the range have a green background. The red background is not used when the min value is within 80% of the max value.
| dbms | 256us | 1ms | 4ms | 16ms | 64ms | 256ms | 1s | 4s | 16s | gt | max |
|---|---|---|---|---|---|---|---|---|---|---|---|
| my5651_rel_o2nofp.cz12a_c8r32 | 0.111 | 52.750 | 45.472 | 1.667 | 0.057 | ||||||
| my5744_rel_o2nofp.cz12a_c8r32 | 0.028 | 99.972 | 0.002 | ||||||||
| my8044_rel_o2nofp.cz12a_c8r32 | 99.944 | 0.056 | 0.005 | ||||||||
| my8407_rel_o2nofp.cz12a_c8r32 | 99.917 | 0.083 | 0.013 | ||||||||
| my9400_rel_o2nofp.cz12a_c8r32 | 91.000 | 8.972 | 0.028 | 0.023 | |||||||
| my9500_rel_o2nofp.cz12a_c8r32 | 90.472 | 9.528 | 0.011 |
Delete response time histogram: each cell has the percentage of responses that take <= the time in the header and max is the max response time in seconds. For max values in the top 25% of the range have a red background and in the bottom 25% of the range have a green background. The red background is not used when the min value is within 80% of the max value.
| dbms | 256us | 1ms | 4ms | 16ms | 64ms | 256ms | 1s | 4s | 16s | gt | max |
|---|---|---|---|---|---|---|---|---|---|---|---|
| my5651_rel_o2nofp.cz12a_c8r32 | 3.194 | 49.250 | 46.194 | 1.361 | 0.056 | ||||||
| my5744_rel_o2nofp.cz12a_c8r32 | 50.028 | 49.972 | 0.002 | ||||||||
| my8044_rel_o2nofp.cz12a_c8r32 | 28.306 | 71.667 | 0.028 | 0.005 | |||||||
| my8407_rel_o2nofp.cz12a_c8r32 | 21.111 | 78.861 | 0.028 | 0.013 | |||||||
| my9400_rel_o2nofp.cz12a_c8r32 | 9.778 | 81.278 | 8.917 | 0.028 | 0.022 | ||||||
| my9500_rel_o2nofp.cz12a_c8r32 | 11.167 | 79.333 | 9.500 | 0.011 |
Performance metrics for the DBMS listed above. Some are normalized by throughput, others are not. Legend for results is here.
ips	qps	rps	rmbps	wps	wmbps	rpq	rkbpq	wpi	wkbpi	csps	cpups	cspq	cpupq	dbgb1	dbgb2	rss	maxop	p50	p99	tag
100	11193	4	0.0	747.2	20.6	0.000	0.001	7.472	210.665	64935	12.4	5.801	89	6.2	36.7	7.9	0.028	11199	10974	my5651_rel_o2nofp.cz12a_c8r32
100	9291	0	0.0	37.7	1.0	0.000	0.000	0.377	9.830	53909	11.7	5.802	101	6.3	36.8	8.3	0.001	9295	9215	my5744_rel_o2nofp.cz12a_c8r32
100	6986	0	0.0	33.5	0.9	0.000	0.000	0.335	9.569	40825	12.4	5.844	142	6.9	37.9	9.5	0.001	6991	6927	my8044_rel_o2nofp.cz12a_c8r32
100	6800	0	0.0	35.7	1.0	0.000	0.000	0.357	10.109	39755	12.8	5.847	151	6.8	45.0	9.4	0.002	6799	6719	my8407_rel_o2nofp.cz12a_c8r32
100	6932	0	0.0	41.0	1.1	0.000	0.000	0.410	11.287	40526	11.9	5.846	137	6.8	45.0	9.4	0.001	6927	6911	my9400_rel_o2nofp.cz12a_c8r32
100	6950	0	0.0	41.5	1.1	0.000	0.000	0.416	11.710	40654	12.4	5.849	143	6.8	44.9	9.4	0.001	6959	6911	my9500_rel_o2nofp.cz12a_c8r32
Average values from iostat.
r/s	rkB/s	rrqm/s	%rrqm	r_await	rareq-s	w/s	wkB/s	wrqm/s	%wrqm	w_await	wareq-s	d/s	dkB/s	drqm/s	%drqm	d_await	dareq-s	f/s	f_await	aqu-sz	%util
3.724	14.89	0.000	0.000	2.557	4.000	746.5	21045.2	6.534	9.796	0.547	25.96	0.001	0.002	0.000	0.000	0.000	0.011	2.476	1.329	0.053	3.666		my5651_rel_o2nofp.cz12a_c8r32
0.001	0.002	0.000	0.000	0.000	0.011	37.56	978.8	3.936	10.26	0.747	25.78	0.004	0.018	0.000	0.000	0.008	0.089	1.341	1.170	0.027	2.175		my5744_rel_o2nofp.cz12a_c8r32
0.000	0.000	0.000	0.000	0.000	0.000	33.46	955.1	1.452	4.228	0.677	28.54	0.004	0.250	0.000	0.000	0.011	1.248	1.537	1.435	0.024	3.619		my8044_rel_o2nofp.cz12a_c8r32
0.001	0.002	0.000	0.000	0.000	0.011	35.65	1010.2	1.491	4.096	0.643	28.40	0.000	0.000	0.000	0.000	0.000	0.000	1.537	1.886	0.025	3.999		my8407_rel_o2nofp.cz12a_c8r32
0.001	0.002	0.000	0.000	0.025	0.011	40.99	1128.8	1.189	2.912	0.538	27.59	0.002	0.013	0.000	0.000	0.008	0.067	2.314	2.139	0.026	1.888		my9400_rel_o2nofp.cz12a_c8r32
0.000	0.000	0.000	0.000	0.000	0.000	41.49	1169.4	1.456	3.476	0.538	28.28	0.002	0.018	0.000	0.000	0.006	0.089	1.578	1.893	0.025	1.950		my9500_rel_o2nofp.cz12a_c8r32
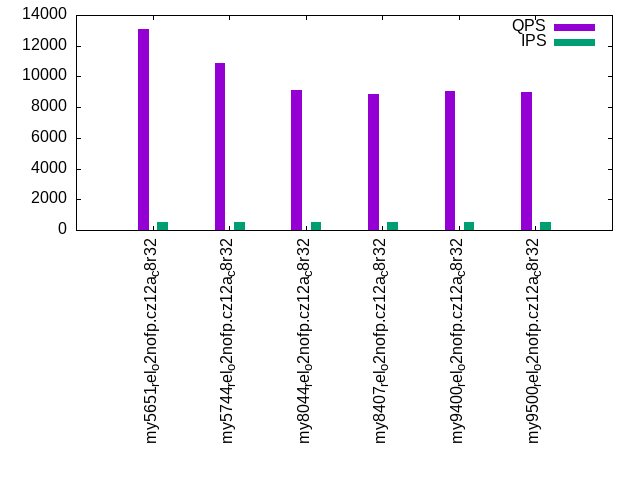
qr500.L3
qr500.L3: range queries with 500 insert/s per client. Graphs for performance per 1-second interval are here.
Average throughput:
Query response time histogram: each cell has the percentage of responses that take <= the time in the header and max is the max response time in seconds. For max values in the top 25% of the range have a red background and in the bottom 25% of the range have a green background. The red background is not used when the min value is within 80% of the max value.
| dbms | 256us | 1ms | 4ms | 16ms | 64ms | 256ms | 1s | 4s | 16s | gt | max |
|---|---|---|---|---|---|---|---|---|---|---|---|
| my5651_rel_o2nofp.cz12a_c8r32 | 99.979 | 0.014 | 0.003 | 0.005 | nonzero | 0.022 | |||||
| my5744_rel_o2nofp.cz12a_c8r32 | 99.997 | 0.003 | nonzero | nonzero | 0.004 | ||||||
| my8044_rel_o2nofp.cz12a_c8r32 | 99.988 | 0.012 | nonzero | 0.002 | |||||||
| my8407_rel_o2nofp.cz12a_c8r32 | 99.986 | 0.014 | nonzero | 0.002 | |||||||
| my9400_rel_o2nofp.cz12a_c8r32 | 99.987 | 0.013 | nonzero | 0.002 | |||||||
| my9500_rel_o2nofp.cz12a_c8r32 | 99.986 | 0.014 | nonzero | 0.002 |
Insert response time histogram: each cell has the percentage of responses that take <= the time in the header and max is the max response time in seconds. For max values in the top 25% of the range have a red background and in the bottom 25% of the range have a green background. The red background is not used when the min value is within 80% of the max value.
| dbms | 256us | 1ms | 4ms | 16ms | 64ms | 256ms | 1s | 4s | 16s | gt | max |
|---|---|---|---|---|---|---|---|---|---|---|---|
| my5651_rel_o2nofp.cz12a_c8r32 | 11.217 | 71.978 | 15.206 | 1.600 | 0.051 | ||||||
| my5744_rel_o2nofp.cz12a_c8r32 | 44.683 | 55.306 | 0.011 | 0.010 | |||||||
| my8044_rel_o2nofp.cz12a_c8r32 | 98.111 | 1.889 | 0.011 | ||||||||
| my8407_rel_o2nofp.cz12a_c8r32 | 99.967 | 0.033 | 0.013 | ||||||||
| my9400_rel_o2nofp.cz12a_c8r32 | 98.172 | 1.822 | 0.006 | 0.022 | |||||||
| my9500_rel_o2nofp.cz12a_c8r32 | 98.067 | 1.933 | 0.011 |
Delete response time histogram: each cell has the percentage of responses that take <= the time in the header and max is the max response time in seconds. For max values in the top 25% of the range have a red background and in the bottom 25% of the range have a green background. The red background is not used when the min value is within 80% of the max value.
| dbms | 256us | 1ms | 4ms | 16ms | 64ms | 256ms | 1s | 4s | 16s | gt | max |
|---|---|---|---|---|---|---|---|---|---|---|---|
| my5651_rel_o2nofp.cz12a_c8r32 | 19.717 | 63.883 | 14.978 | 1.422 | 0.049 | ||||||
| my5744_rel_o2nofp.cz12a_c8r32 | 89.350 | 10.639 | 0.011 | 0.010 | |||||||
| my8044_rel_o2nofp.cz12a_c8r32 | 88.661 | 9.450 | 1.889 | 0.011 | |||||||
| my8407_rel_o2nofp.cz12a_c8r32 | 85.750 | 14.233 | 0.017 | 0.012 | |||||||
| my9400_rel_o2nofp.cz12a_c8r32 | 86.633 | 11.550 | 1.811 | 0.006 | 0.022 | ||||||
| my9500_rel_o2nofp.cz12a_c8r32 | 88.644 | 9.428 | 1.928 | 0.011 |
Performance metrics for the DBMS listed above. Some are normalized by throughput, others are not. Legend for results is here.
ips	qps	rps	rmbps	wps	wmbps	rpq	rkbpq	wpi	wkbpi	csps	cpups	cspq	cpupq	dbgb1	dbgb2	rss	maxop	p50	p99	tag
500	13110	17	0.1	2083.7	58.1	0.001	0.005	4.167	118.890	75728	12.0	5.776	73	6.2	36.7	7.9	0.022	13167	12190	my5651_rel_o2nofp.cz12a_c8r32
500	10885	0	0.0	62.9	2.0	0.000	0.000	0.126	4.142	62640	12.4	5.755	91	6.3	36.8	8.3	0.004	10894	10799	my5744_rel_o2nofp.cz12a_c8r32
500	9132	0	0.0	74.9	2.4	0.000	0.000	0.150	4.964	53082	12.8	5.813	112	6.9	37.9	9.5	0.002	9135	9055	my8044_rel_o2nofp.cz12a_c8r32
500	8884	0	0.0	66.6	2.2	0.000	0.000	0.133	4.483	51624	13.3	5.811	120	6.8	45.1	9.4	0.002	8879	8799	my8407_rel_o2nofp.cz12a_c8r32
500	9024	0	0.0	76.7	2.5	0.000	0.000	0.153	5.020	52441	12.7	5.811	113	6.8	45.1	9.4	0.002	9023	8959	my9400_rel_o2nofp.cz12a_c8r32
500	8992	0	0.0	63.7	2.1	0.000	0.000	0.127	4.323	52240	12.6	5.810	112	6.8	45.0	9.4	0.002	8991	8927	my9500_rel_o2nofp.cz12a_c8r32
Average values from iostat.
r/s	rkB/s	rrqm/s	%rrqm	r_await	rareq-s	w/s	wkB/s	wrqm/s	%wrqm	w_await	wareq-s	d/s	dkB/s	drqm/s	%drqm	d_await	dareq-s	f/s	f_await	aqu-sz	%util
16.62	66.49	0.000	0.000	0.493	4.000	2085.1	59486.4	7.560	12.41	1.501	39.80	0.007	0.027	0.000	0.000	0.014	0.134	2.826	1.042	0.100	4.801		my5651_rel_o2nofp.cz12a_c8r32
0.000	0.000	0.000	0.000	0.000	0.000	63.01	2073.0	3.547	5.692	0.667	33.22	0.000	0.000	0.000	0.000	0.000	0.000	1.290	1.033	0.040	1.796		my5744_rel_o2nofp.cz12a_c8r32
0.001	0.002	0.000	0.000	0.000	0.011	75.04	2484.1	1.011	1.624	0.943	34.27	0.000	0.000	0.000	0.000	0.000	0.000	1.538	1.769	0.062	1.913		my8044_rel_o2nofp.cz12a_c8r32
0.001	0.002	0.000	0.000	0.000	0.011	66.76	2245.1	1.009	1.640	0.978	34.23	0.000	0.000	0.000	0.000	0.000	0.000	1.549	1.731	0.062	2.091		my8407_rel_o2nofp.cz12a_c8r32
0.001	0.004	0.000	0.000	0.047	0.022	76.83	2512.5	0.981	1.708	0.801	34.31	0.027	0.218	0.000	0.000	0.097	1.092	2.314	1.812	0.052	1.860		my9400_rel_o2nofp.cz12a_c8r32
0.001	0.002	0.000	0.000	0.022	0.011	63.84	2164.3	1.026	1.803	1.019	34.80	0.006	0.049	0.000	0.000	0.022	0.245	1.587	1.812	0.060	1.950		my9500_rel_o2nofp.cz12a_c8r32
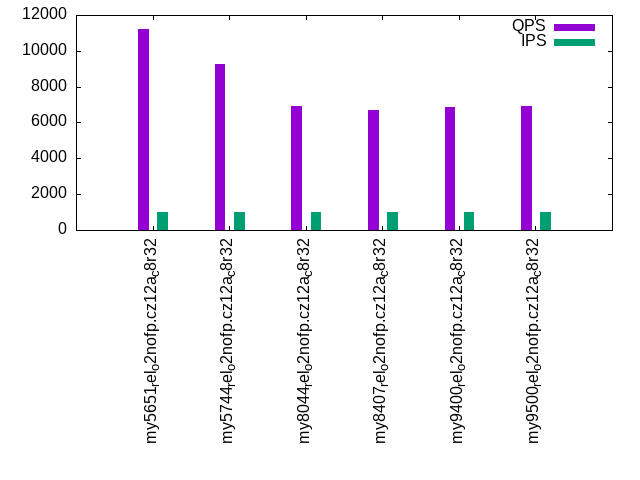
qp500.L4
qp500.L4: point queries with 500 insert/s per client. Graphs for performance per 1-second interval are here.
Average throughput:
Query response time histogram: each cell has the percentage of responses that take <= the time in the header and max is the max response time in seconds. For max values in the top 25% of the range have a red background and in the bottom 25% of the range have a green background. The red background is not used when the min value is within 80% of the max value.
| dbms | 256us | 1ms | 4ms | 16ms | 64ms | 256ms | 1s | 4s | 16s | gt | max |
|---|---|---|---|---|---|---|---|---|---|---|---|
| my5651_rel_o2nofp.cz12a_c8r32 | 99.967 | 0.029 | 0.001 | 0.003 | nonzero | 0.024 | |||||
| my5744_rel_o2nofp.cz12a_c8r32 | 99.992 | 0.008 | nonzero | 0.004 | |||||||
| my8044_rel_o2nofp.cz12a_c8r32 | 99.952 | 0.048 | nonzero | 0.002 | |||||||
| my8407_rel_o2nofp.cz12a_c8r32 | 99.945 | 0.055 | nonzero | 0.002 | |||||||
| my9400_rel_o2nofp.cz12a_c8r32 | 99.943 | 0.057 | nonzero | 0.002 | |||||||
| my9500_rel_o2nofp.cz12a_c8r32 | 99.949 | 0.051 | nonzero | 0.002 |
Insert response time histogram: each cell has the percentage of responses that take <= the time in the header and max is the max response time in seconds. For max values in the top 25% of the range have a red background and in the bottom 25% of the range have a green background. The red background is not used when the min value is within 80% of the max value.
| dbms | 256us | 1ms | 4ms | 16ms | 64ms | 256ms | 1s | 4s | 16s | gt | max |
|---|---|---|---|---|---|---|---|---|---|---|---|
| my5651_rel_o2nofp.cz12a_c8r32 | 10.933 | 72.694 | 14.939 | 1.428 | 0.006 | 0.071 | |||||
| my5744_rel_o2nofp.cz12a_c8r32 | 21.839 | 78.161 | 0.003 | ||||||||
| my8044_rel_o2nofp.cz12a_c8r32 | 98.133 | 1.861 | 0.006 | 0.020 | |||||||
| my8407_rel_o2nofp.cz12a_c8r32 | 98.206 | 1.789 | 0.006 | 0.022 | |||||||
| my9400_rel_o2nofp.cz12a_c8r32 | 98.178 | 1.822 | 0.011 | ||||||||
| my9500_rel_o2nofp.cz12a_c8r32 | 98.178 | 1.817 | 0.006 | 0.019 |
Delete response time histogram: each cell has the percentage of responses that take <= the time in the header and max is the max response time in seconds. For max values in the top 25% of the range have a red background and in the bottom 25% of the range have a green background. The red background is not used when the min value is within 80% of the max value.
| dbms | 256us | 1ms | 4ms | 16ms | 64ms | 256ms | 1s | 4s | 16s | gt | max |
|---|---|---|---|---|---|---|---|---|---|---|---|
| my5651_rel_o2nofp.cz12a_c8r32 | 23.794 | 60.150 | 14.794 | 1.261 | 0.056 | ||||||
| my5744_rel_o2nofp.cz12a_c8r32 | 88.578 | 11.422 | 0.002 | ||||||||
| my8044_rel_o2nofp.cz12a_c8r32 | 81.906 | 16.239 | 1.850 | 0.006 | 0.021 | ||||||
| my8407_rel_o2nofp.cz12a_c8r32 | 62.528 | 35.689 | 1.783 | 0.011 | |||||||
| my9400_rel_o2nofp.cz12a_c8r32 | 56.028 | 42.156 | 1.817 | 0.011 | |||||||
| my9500_rel_o2nofp.cz12a_c8r32 | 84.039 | 14.156 | 1.800 | 0.006 | 0.018 |
Performance metrics for the DBMS listed above. Some are normalized by throughput, others are not. Legend for results is here.
ips	qps	rps	rmbps	wps	wmbps	rpq	rkbpq	wpi	wkbpi	csps	cpups	cspq	cpupq	dbgb1	dbgb2	rss	maxop	p50	p99	tag
500	11124	16	0.1	2127.6	59.3	0.001	0.006	4.255	121.394	64979	12.6	5.842	91	6.2	36.7	7.9	0.024	11135	10671	my5651_rel_o2nofp.cz12a_c8r32
500	9346	0	0.0	39.6	1.4	0.000	0.000	0.079	2.788	54338	12.5	5.814	107	6.3	36.8	8.3	0.004	9343	9263	my5744_rel_o2nofp.cz12a_c8r32
500	6943	0	0.0	31.8	1.2	0.000	0.000	0.064	2.510	40944	12.8	5.897	147	6.9	37.9	9.5	0.002	6943	6895	my8044_rel_o2nofp.cz12a_c8r32
500	6744	0	0.0	35.2	1.3	0.000	0.000	0.070	2.740	39783	12.9	5.899	153	6.8	45.2	9.4	0.002	6751	6687	my8407_rel_o2nofp.cz12a_c8r32
500	6901	0	0.0	34.3	1.3	0.000	0.000	0.069	2.620	40715	12.2	5.900	141	6.8	45.2	9.4	0.002	6911	6863	my9400_rel_o2nofp.cz12a_c8r32
500	6926	0	0.0	36.2	1.4	0.000	0.000	0.072	2.806	40835	12.7	5.896	147	6.8	45.1	9.4	0.002	6927	6895	my9500_rel_o2nofp.cz12a_c8r32
Average values from iostat.
r/s	rkB/s	rrqm/s	%rrqm	r_await	rareq-s	w/s	wkB/s	wrqm/s	%wrqm	w_await	wareq-s	d/s	dkB/s	drqm/s	%drqm	d_await	dareq-s	f/s	f_await	aqu-sz	%util
15.75	63.01	0.000	0.000	0.522	4.000	2108.4	60151.2	7.374	11.17	1.406	38.74	0.000	0.000	0.000	0.000	0.000	0.000	2.765	1.106	0.102	4.816		my5651_rel_o2nofp.cz12a_c8r32
0.000	0.000	0.000	0.000	0.000	0.000	39.62	1393.8	3.971	9.288	1.283	35.38	0.000	0.000	0.000	0.000	0.000	0.000	1.479	1.304	0.052	2.265		my5744_rel_o2nofp.cz12a_c8r32
0.001	0.002	0.000	0.000	0.025	0.011	31.84	1254.2	0.947	2.904	1.672	39.37	0.001	0.062	0.000	0.000	0.006	0.312	1.570	1.605	0.056	2.098		my8044_rel_o2nofp.cz12a_c8r32
0.001	0.002	0.000	0.000	0.025	0.011	35.16	1369.9	0.981	2.731	1.552	38.94	0.005	0.040	0.000	0.000	0.017	0.201	1.541	1.759	0.057	2.672		my8407_rel_o2nofp.cz12a_c8r32
0.001	0.004	0.000	0.000	0.050	0.022	34.27	1309.0	1.118	3.172	1.310	38.21	0.020	0.160	0.000	0.000	0.058	0.802	2.167	1.836	0.048	1.773		my9400_rel_o2nofp.cz12a_c8r32
0.001	0.004	0.000	0.000	0.025	0.022	36.24	1403.2	1.067	2.858	1.513	38.70	0.028	0.227	0.000	0.000	0.097	1.136	1.573	1.805	0.057	1.826		my9500_rel_o2nofp.cz12a_c8r32
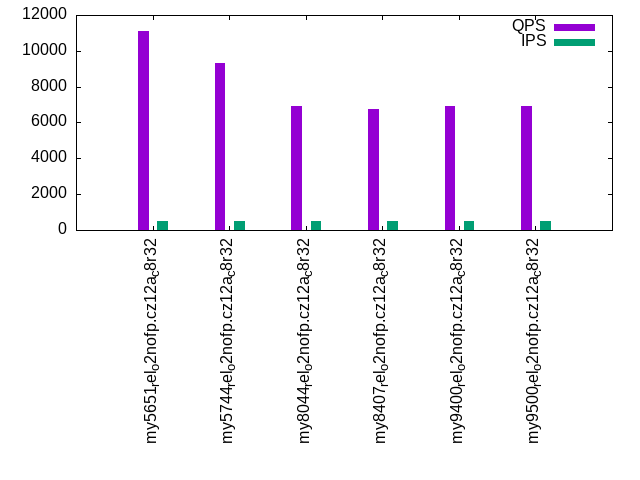
qr1000.L5
qr1000.L5: range queries with 1000 insert/s per client. Graphs for performance per 1-second interval are here.
Average throughput:

Query response time histogram: each cell has the percentage of responses that take <= the time in the header and max is the max response time in seconds. For max values in the top 25% of the range have a red background and in the bottom 25% of the range have a green background. The red background is not used when the min value is within 80% of the max value.
| dbms | 256us | 1ms | 4ms | 16ms | 64ms | 256ms | 1s | 4s | 16s | gt | max |
|---|---|---|---|---|---|---|---|---|---|---|---|
| my5651_rel_o2nofp.cz12a_c8r32 | 99.975 | 0.019 | 0.002 | 0.004 | nonzero | 0.020 | |||||
| my5744_rel_o2nofp.cz12a_c8r32 | 99.996 | 0.004 | nonzero | nonzero | 0.006 | ||||||
| my8044_rel_o2nofp.cz12a_c8r32 | 99.986 | 0.014 | nonzero | 0.002 | |||||||
| my8407_rel_o2nofp.cz12a_c8r32 | 99.982 | 0.018 | nonzero | 0.002 | |||||||
| my9400_rel_o2nofp.cz12a_c8r32 | 99.986 | 0.014 | nonzero | 0.002 | |||||||
| my9500_rel_o2nofp.cz12a_c8r32 | 99.984 | 0.016 | nonzero | 0.002 |
Insert response time histogram: each cell has the percentage of responses that take <= the time in the header and max is the max response time in seconds. For max values in the top 25% of the range have a red background and in the bottom 25% of the range have a green background. The red background is not used when the min value is within 80% of the max value.
| dbms | 256us | 1ms | 4ms | 16ms | 64ms | 256ms | 1s | 4s | 16s | gt | max |
|---|---|---|---|---|---|---|---|---|---|---|---|
| my5651_rel_o2nofp.cz12a_c8r32 | 15.244 | 76.281 | 8.325 | 0.150 | 0.035 | ||||||
| my5744_rel_o2nofp.cz12a_c8r32 | 49.247 | 50.753 | 0.002 | ||||||||
| my8044_rel_o2nofp.cz12a_c8r32 | 99.042 | 0.956 | 0.003 | 0.022 | |||||||
| my8407_rel_o2nofp.cz12a_c8r32 | 99.036 | 0.958 | 0.006 | 0.037 | |||||||
| my9400_rel_o2nofp.cz12a_c8r32 | 99.100 | 0.894 | 0.006 | 0.038 | |||||||
| my9500_rel_o2nofp.cz12a_c8r32 | 99.094 | 0.903 | 0.003 | 0.048 |
Delete response time histogram: each cell has the percentage of responses that take <= the time in the header and max is the max response time in seconds. For max values in the top 25% of the range have a red background and in the bottom 25% of the range have a green background. The red background is not used when the min value is within 80% of the max value.
| dbms | 256us | 1ms | 4ms | 16ms | 64ms | 256ms | 1s | 4s | 16s | gt | max |
|---|---|---|---|---|---|---|---|---|---|---|---|
| my5651_rel_o2nofp.cz12a_c8r32 | 27.403 | 64.650 | 7.811 | 0.136 | 0.031 | ||||||
| my5744_rel_o2nofp.cz12a_c8r32 | 92.761 | 7.239 | 0.002 | ||||||||
| my8044_rel_o2nofp.cz12a_c8r32 | 91.894 | 7.147 | 0.956 | 0.003 | 0.021 | ||||||
| my8407_rel_o2nofp.cz12a_c8r32 | 90.981 | 8.108 | 0.906 | 0.006 | 0.035 | ||||||
| my9400_rel_o2nofp.cz12a_c8r32 | 90.372 | 8.736 | 0.886 | 0.006 | 0.040 | ||||||
| my9500_rel_o2nofp.cz12a_c8r32 | 92.611 | 6.492 | 0.894 | 0.003 | 0.045 |
Performance metrics for the DBMS listed above. Some are normalized by throughput, others are not. Legend for results is here.
ips	qps	rps	rmbps	wps	wmbps	rpq	rkbpq	wpi	wkbpi	csps	cpups	cspq	cpupq	dbgb1	dbgb2	rss	maxop	p50	p99	tag
999	13020	28	0.1	1847.5	52.0	0.002	0.009	1.849	53.273	75625	12.8	5.808	79	6.2	36.7	7.9	0.020	13054	12366	my5651_rel_o2nofp.cz12a_c8r32
1000	10864	0	0.0	89.5	3.2	0.000	0.000	0.090	3.257	62710	13.1	5.773	96	6.3	36.8	8.3	0.006	10863	10767	my5744_rel_o2nofp.cz12a_c8r32
1000	9097	0	0.0	99.4	3.5	0.000	0.000	0.099	3.632	53323	13.4	5.862	118	6.9	37.9	9.5	0.002	9103	9023	my8044_rel_o2nofp.cz12a_c8r32
999	8768	0	0.0	97.9	3.5	0.000	0.000	0.098	3.601	51473	14.1	5.871	129	6.8	45.4	9.5	0.002	8767	8703	my8407_rel_o2nofp.cz12a_c8r32
999	9101	0	0.0	101.3	3.6	0.000	0.000	0.101	3.657	53417	13.4	5.870	118	6.8	45.4	9.4	0.002	9103	9039	my9400_rel_o2nofp.cz12a_c8r32
1000	8965	0	0.0	97.1	3.5	0.000	0.000	0.097	3.577	52584	13.8	5.865	123	6.8	45.2	9.4	0.002	8959	8895	my9500_rel_o2nofp.cz12a_c8r32
Average values from iostat.
r/s	rkB/s	rrqm/s	%rrqm	r_await	rareq-s	w/s	wkB/s	wrqm/s	%wrqm	w_await	wareq-s	d/s	dkB/s	drqm/s	%drqm	d_await	dareq-s	f/s	f_await	aqu-sz	%util
28.19	112.8	0.000	0.000	0.332	4.000	1821.2	52495.0	5.928	11.33	2.657	61.87	0.002	0.007	0.000	0.000	0.003	0.033	2.147	0.978	0.113	4.273		my5651_rel_o2nofp.cz12a_c8r32
0.001	0.002	0.000	0.000	0.000	0.011	89.69	3262.6	4.581	6.547	1.186	39.92	0.003	0.013	0.000	0.000	0.006	0.067	1.662	1.023	0.075	2.301		my5744_rel_o2nofp.cz12a_c8r32
0.001	0.004	0.000	0.000	0.047	0.022	99.63	3638.1	1.110	1.638	1.441	40.77	0.012	0.655	0.000	0.000	0.036	3.276	1.589	1.454	0.100	1.648		my8044_rel_o2nofp.cz12a_c8r32
0.002	0.007	0.000	0.000	0.025	0.033	98.06	3604.7	1.063	1.553	1.464	40.77	0.011	0.080	0.000	0.000	0.034	0.371	1.552	1.638	0.102	2.073		my8407_rel_o2nofp.cz12a_c8r32
0.001	0.004	0.000	0.000	0.047	0.022	101.5	3660.7	1.088	1.417	1.058	38.63	0.001	0.004	0.000	0.000	0.003	0.011	2.775	1.755	0.090	2.065		my9400_rel_o2nofp.cz12a_c8r32
0.002	0.009	0.000	0.000	0.075	0.045	97.22	3580.9	1.051	1.457	1.371	39.98	0.001	0.004	0.000	0.000	0.003	0.011	1.577	1.648	0.103	1.789		my9500_rel_o2nofp.cz12a_c8r32
qp1000.L6
qp1000.L6: point queries with 1000 insert/s per client. Graphs for performance per 1-second interval are here.
Average throughput:
Query response time histogram: each cell has the percentage of responses that take <= the time in the header and max is the max response time in seconds. For max values in the top 25% of the range have a red background and in the bottom 25% of the range have a green background. The red background is not used when the min value is within 80% of the max value.
| dbms | 256us | 1ms | 4ms | 16ms | 64ms | 256ms | 1s | 4s | 16s | gt | max |
|---|---|---|---|---|---|---|---|---|---|---|---|
| my5651_rel_o2nofp.cz12a_c8r32 | 99.958 | 0.039 | 0.001 | 0.002 | 0.010 | ||||||
| my5744_rel_o2nofp.cz12a_c8r32 | 99.986 | 0.014 | nonzero | 0.002 | |||||||
| my8044_rel_o2nofp.cz12a_c8r32 | 99.942 | 0.058 | nonzero | 0.002 | |||||||
| my8407_rel_o2nofp.cz12a_c8r32 | 99.935 | 0.065 | nonzero | 0.003 | |||||||
| my9400_rel_o2nofp.cz12a_c8r32 | 99.931 | 0.069 | nonzero | 0.002 | |||||||
| my9500_rel_o2nofp.cz12a_c8r32 | 99.936 | 0.064 | nonzero | 0.002 |
Insert response time histogram: each cell has the percentage of responses that take <= the time in the header and max is the max response time in seconds. For max values in the top 25% of the range have a red background and in the bottom 25% of the range have a green background. The red background is not used when the min value is within 80% of the max value.
| dbms | 256us | 1ms | 4ms | 16ms | 64ms | 256ms | 1s | 4s | 16s | gt | max |
|---|---|---|---|---|---|---|---|---|---|---|---|
| my5651_rel_o2nofp.cz12a_c8r32 | 17.767 | 77.483 | 4.742 | 0.008 | 0.017 | ||||||
| my5744_rel_o2nofp.cz12a_c8r32 | 34.367 | 65.631 | 0.003 | 0.004 | |||||||
| my8044_rel_o2nofp.cz12a_c8r32 | 99.039 | 0.961 | 0.012 | ||||||||
| my8407_rel_o2nofp.cz12a_c8r32 | 99.031 | 0.961 | 0.008 | 0.042 | |||||||
| my9400_rel_o2nofp.cz12a_c8r32 | 99.072 | 0.925 | 0.003 | 0.041 | |||||||
| my9500_rel_o2nofp.cz12a_c8r32 | 99.042 | 0.956 | 0.003 | 0.040 |
Delete response time histogram: each cell has the percentage of responses that take <= the time in the header and max is the max response time in seconds. For max values in the top 25% of the range have a red background and in the bottom 25% of the range have a green background. The red background is not used when the min value is within 80% of the max value.
| dbms | 256us | 1ms | 4ms | 16ms | 64ms | 256ms | 1s | 4s | 16s | gt | max |
|---|---|---|---|---|---|---|---|---|---|---|---|
| my5651_rel_o2nofp.cz12a_c8r32 | 33.461 | 61.822 | 4.708 | 0.008 | 0.016 | ||||||
| my5744_rel_o2nofp.cz12a_c8r32 | 92.050 | 7.950 | 0.002 | ||||||||
| my8044_rel_o2nofp.cz12a_c8r32 | 86.808 | 12.236 | 0.956 | 0.012 | |||||||
| my8407_rel_o2nofp.cz12a_c8r32 | 80.222 | 18.817 | 0.953 | 0.008 | 0.045 | ||||||
| my9400_rel_o2nofp.cz12a_c8r32 | 85.175 | 13.906 | 0.917 | 0.003 | 0.038 | ||||||
| my9500_rel_o2nofp.cz12a_c8r32 | 89.928 | 9.119 | 0.950 | 0.003 | 0.037 |
Performance metrics for the DBMS listed above. Some are normalized by throughput, others are not. Legend for results is here.
ips	qps	rps	rmbps	wps	wmbps	rpq	rkbpq	wpi	wkbpi	csps	cpups	cspq	cpupq	dbgb1	dbgb2	rss	maxop	p50	p99	tag
999	11214	29	0.1	11.6	1.1	0.003	0.010	0.012	1.154	65703	12.4	5.859	88	6.2	36.7	7.9	0.010	11230	11087	my5651_rel_o2nofp.cz12a_c8r32
1000	9255	0	0.0	69.5	2.6	0.000	0.000	0.070	2.694	54033	12.7	5.838	110	6.3	36.8	8.3	0.002	9247	9183	my5744_rel_o2nofp.cz12a_c8r32
1000	6943	0	0.0	91.7	3.3	0.000	0.000	0.092	3.418	41435	13.1	5.968	151	6.9	37.9	9.5	0.002	6943	6895	my8044_rel_o2nofp.cz12a_c8r32
999	6689	0	0.0	91.6	3.3	0.000	0.000	0.092	3.426	39997	13.4	5.980	160	6.8	45.6	9.5	0.003	6687	6639	my8407_rel_o2nofp.cz12a_c8r32
999	6886	0	0.0	95.5	3.4	0.000	0.000	0.096	3.521	41138	12.7	5.975	148	6.8	45.6	9.4	0.002	6895	6831	my9400_rel_o2nofp.cz12a_c8r32
1000	6923	0	0.0	95.5	3.5	0.000	0.000	0.096	3.539	41337	13.2	5.971	153	6.8	45.4	9.4	0.002	6927	6879	my9500_rel_o2nofp.cz12a_c8r32
Average values from iostat.
r/s	rkB/s	rrqm/s	%rrqm	r_await	rareq-s	w/s	wkB/s	wrqm/s	%wrqm	w_await	wareq-s	d/s	dkB/s	drqm/s	%drqm	d_await	dareq-s	f/s	f_await	aqu-sz	%util
28.59	114.4	0.000	0.000	0.354	4.000	11.58	1153.9	2.108	15.53	5.244	99.34	0.002	0.009	0.000	0.000	0.008	0.045	0.988	1.147	0.070	2.094		my5651_rel_o2nofp.cz12a_c8r32
0.001	0.004	0.000	0.000	0.022	0.022	69.61	2696.9	4.186	7.669	1.573	43.41	0.006	0.022	0.000	0.000	0.014	0.111	1.523	1.049	0.076	2.262		my5744_rel_o2nofp.cz12a_c8r32
0.002	0.007	0.000	0.000	0.025	0.033	91.87	3423.0	1.100	1.858	1.639	42.42	0.005	0.281	0.000	0.000	0.017	1.404	1.598	1.520	0.101	1.663		my8044_rel_o2nofp.cz12a_c8r32
0.002	0.009	0.000	0.000	0.095	0.045	91.71	3428.4	1.081	1.744	1.571	41.80	0.020	0.156	0.000	0.000	0.067	0.750	1.566	1.693	0.102	2.185		my8407_rel_o2nofp.cz12a_c8r32
0.001	0.004	0.000	0.000	0.028	0.022	95.65	3523.4	1.062	1.584	1.225	40.83	0.010	0.040	0.000	0.000	0.029	0.178	1.986	1.763	0.086	1.679		my9400_rel_o2nofp.cz12a_c8r32
0.000	0.000	0.000	0.000	0.000	0.000	95.46	3537.7	1.057	1.584	1.472	40.96	0.010	0.040	0.000	0.000	0.032	0.178	1.593	1.663	0.103	2.119		my9500_rel_o2nofp.cz12a_c8r32
l.i0
l.i0: load without secondary indexes
Performance metrics for all DBMS, not just the ones listed above. Some are normalized by throughput, others are not. Legend for results is here.
ips	qps	rps	rmbps	wps	wmbps	rpq	rkbpq	wpi	wkbpi	csps	cpups	cspq	cpupq	dbgb1	dbgb2	rss	maxop	p50	p99	tag
185185	0	1620	6.3	474.8	45.4	0.009	0.035	0.003	0.251	24151	20.2	0.130	9	2.0	32.5	3.5	0.127	185678	163682	my5651_rel_o2nofp.cz12a_c8r32
167598	0	0	0.0	510.9	43.1	0.000	0.000	0.003	0.263	19318	20.1	0.115	10	2.0	32.5	4.0	0.130	167876	149588	my5744_rel_o2nofp.cz12a_c8r32
111940	0	0	0.0	412.3	31.9	0.000	0.000	0.004	0.292	13853	17.2	0.124	12	2.0	32.6	4.3	0.074	112584	103785	my8044_rel_o2nofp.cz12a_c8r32
108696	0	0	0.0	402.0	31.0	0.000	0.000	0.004	0.292	13496	17.3	0.124	13	2.0	34.0	4.2	0.073	109183	100887	my8407_rel_o2nofp.cz12a_c8r32
109890	0	0	0.0	406.4	31.4	0.000	0.000	0.004	0.293	13646	17.2	0.124	13	2.0	34.0	4.3	0.074	110686	101484	my9400_rel_o2nofp.cz12a_c8r32
108696	0	0	0.0	418.0	31.7	0.000	0.000	0.004	0.299	14430	17.3	0.133	13	2.0	34.0	4.4	0.088	109283	100784	my9500_rel_o2nofp.cz12a_c8r32
l.x
l.x: create secondary indexes
Performance metrics for all DBMS, not just the ones listed above. Some are normalized by throughput, others are not. Legend for results is here.
ips	qps	rps	rmbps	wps	wmbps	rpq	rkbpq	wpi	wkbpi	csps	cpups	cspq	cpupq	dbgb1	dbgb2	rss	maxop	p50	p99	tag
145632	0	32	0.1	2360.6	158.2	0.000	0.001	0.016	1.113	1939	10.7	0.013	6	4.2	34.7	5.1	0.002	NA	NA	my5651_rel_o2nofp.cz12a_c8r32
222223	0	0	0.0	3539.9	221.6	0.000	0.000	0.016	1.021	9583	12.1	0.043	4	4.6	35.1	5.5	0.001	NA	NA	my5744_rel_o2nofp.cz12a_c8r32
352942	0	1	0.0	10021.1	448.8	0.000	0.000	0.028	1.302	22641	41.9	0.064	9	4.5	35.1	4.8	0.001	NA	NA	my8044_rel_o2nofp.cz12a_c8r32
370372	0	1	0.0	11512.3	473.5	0.000	0.000	0.031	1.309	25409	40.9	0.069	9	4.5	36.5	5.0	0.001	NA	NA	my8407_rel_o2nofp.cz12a_c8r32
375001	0	1	0.0	12002.3	481.3	0.000	0.000	0.032	1.314	25695	39.9	0.069	9	4.5	36.5	5.1	0.002	NA	NA	my9400_rel_o2nofp.cz12a_c8r32
379748	0	1	0.0	10966.2	484.7	0.000	0.000	0.029	1.307	24664	41.3	0.065	9	4.5	36.5	5.4	0.002	NA	NA	my9500_rel_o2nofp.cz12a_c8r32
l.i1
l.i1: continue load after secondary indexes created with 50 inserts per transaction
Performance metrics for all DBMS, not just the ones listed above. Some are normalized by throughput, others are not. Legend for results is here.
ips	qps	rps	rmbps	wps	wmbps	rpq	rkbpq	wpi	wkbpi	csps	cpups	cspq	cpupq	dbgb1	dbgb2	rss	maxop	p50	p99	tag
33473	0	856	3.3	2507.9	109.3	0.026	0.102	0.075	3.342	34559	40.9	1.032	98	6.2	36.7	7.9	0.081	35546	9199	my5651_rel_o2nofp.cz12a_c8r32
38797	0	0	0.0	2862.5	125.6	0.000	0.000	0.074	3.314	24434	47.5	0.630	98	6.3	36.8	8.3	0.086	40445	11349	my5744_rel_o2nofp.cz12a_c8r32
35180	0	128	2.0	2795.8	116.5	0.004	0.058	0.079	3.391	43717	36.6	1.243	83	6.9	37.9	9.5	0.318	36296	6549	my8044_rel_o2nofp.cz12a_c8r32
34752	0	126	2.0	2739.7	114.8	0.004	0.058	0.079	3.381	43403	36.3	1.249	84	6.8	43.1	9.4	0.321	35995	6649	my8407_rel_o2nofp.cz12a_c8r32
34632	0	126	2.0	2724.8	114.2	0.004	0.058	0.079	3.376	43391	36.1	1.253	83	6.8	43.1	9.4	0.331	35896	6649	my9400_rel_o2nofp.cz12a_c8r32
35026	0	127	2.0	2712.2	114.5	0.004	0.058	0.077	3.346	43260	36.3	1.235	83	6.8	42.9	9.4	0.326	36146	4749	my9500_rel_o2nofp.cz12a_c8r32
l.i2
l.i2: continue load after secondary indexes created with 5 inserts per transaction
Performance metrics for all DBMS, not just the ones listed above. Some are normalized by throughput, others are not. Legend for results is here.
ips	qps	rps	rmbps	wps	wmbps	rpq	rkbpq	wpi	wkbpi	csps	cpups	cspq	cpupq	dbgb1	dbgb2	rss	maxop	p50	p99	tag
23419	0	4150	16.2	1633.3	67.9	0.177	0.709	0.070	2.970	203223	42.9	8.678	147	6.2	36.7	7.9	0.047	23477	22327	my5651_rel_o2nofp.cz12a_c8r32
25510	0	0	0.0	1886.0	78.1	0.000	0.000	0.074	3.136	114152	41.7	4.475	131	6.3	36.8	8.3	0.081	25567	23837	my5744_rel_o2nofp.cz12a_c8r32
20284	0	0	0.0	1698.8	68.2	0.000	0.000	0.084	3.443	106835	35.3	5.267	139	6.9	37.9	9.5	0.101	20328	19333	my8044_rel_o2nofp.cz12a_c8r32
20040	0	0	0.0	1694.2	67.9	0.000	0.000	0.085	3.471	105652	35.2	5.272	141	6.8	45.0	9.4	0.101	20103	19128	my8407_rel_o2nofp.cz12a_c8r32
20121	0	0	0.0	1616.4	65.9	0.000	0.000	0.080	3.353	105802	35.2	5.258	140	6.8	45.0	9.4	0.074	20153	19408	my9400_rel_o2nofp.cz12a_c8r32
19881	0	0	0.0	1650.6	67.7	0.000	0.000	0.083	3.488	114027	34.8	5.736	140	6.8	44.8	9.4	0.101	19978	18988	my9500_rel_o2nofp.cz12a_c8r32
qr100.L1
qr100.L1: range queries with 100 insert/s per client
Performance metrics for all DBMS, not just the ones listed above. Some are normalized by throughput, others are not. Legend for results is here.
ips	qps	rps	rmbps	wps	wmbps	rpq	rkbpq	wpi	wkbpi	csps	cpups	cspq	cpupq	dbgb1	dbgb2	rss	maxop	p50	p99	tag
100	13136	4	0.0	736.4	20.3	0.000	0.001	7.372	207.768	75447	11.5	5.743	70	6.2	36.7	7.9	0.022	13150	12862	my5651_rel_o2nofp.cz12a_c8r32
100	10838	0	0.0	156.2	4.2	0.000	0.000	1.564	43.554	62256	12.4	5.744	92	6.3	36.8	8.3	0.010	10847	10735	my5744_rel_o2nofp.cz12a_c8r32
100	9128	0	0.0	199.0	5.5	0.000	0.000	1.990	56.292	52799	12.4	5.784	109	6.9	37.9	9.5	0.001	9135	9039	my8044_rel_o2nofp.cz12a_c8r32
100	8874	0	0.0	162.0	4.5	0.000	0.000	1.620	45.883	51303	13.3	5.781	120	6.8	45.0	9.4	0.001	8879	8783	my8407_rel_o2nofp.cz12a_c8r32
100	9022	0	0.0	170.0	4.7	0.000	0.000	1.700	48.161	52165	12.4	5.782	110	6.8	45.0	9.4	0.001	9023	8959	my9400_rel_o2nofp.cz12a_c8r32
100	9046	0	0.0	153.3	4.2	0.000	0.000	1.534	43.427	52315	12.4	5.784	110	6.8	44.9	9.4	0.004	9055	8975	my9500_rel_o2nofp.cz12a_c8r32
qp100.L2
qp100.L2: point queries with 100 insert/s per client
Performance metrics for all DBMS, not just the ones listed above. Some are normalized by throughput, others are not. Legend for results is here.
ips	qps	rps	rmbps	wps	wmbps	rpq	rkbpq	wpi	wkbpi	csps	cpups	cspq	cpupq	dbgb1	dbgb2	rss	maxop	p50	p99	tag
100	11193	4	0.0	747.2	20.6	0.000	0.001	7.472	210.665	64935	12.4	5.801	89	6.2	36.7	7.9	0.028	11199	10974	my5651_rel_o2nofp.cz12a_c8r32
100	9291	0	0.0	37.7	1.0	0.000	0.000	0.377	9.830	53909	11.7	5.802	101	6.3	36.8	8.3	0.001	9295	9215	my5744_rel_o2nofp.cz12a_c8r32
100	6986	0	0.0	33.5	0.9	0.000	0.000	0.335	9.569	40825	12.4	5.844	142	6.9	37.9	9.5	0.001	6991	6927	my8044_rel_o2nofp.cz12a_c8r32
100	6800	0	0.0	35.7	1.0	0.000	0.000	0.357	10.109	39755	12.8	5.847	151	6.8	45.0	9.4	0.002	6799	6719	my8407_rel_o2nofp.cz12a_c8r32
100	6932	0	0.0	41.0	1.1	0.000	0.000	0.410	11.287	40526	11.9	5.846	137	6.8	45.0	9.4	0.001	6927	6911	my9400_rel_o2nofp.cz12a_c8r32
100	6950	0	0.0	41.5	1.1	0.000	0.000	0.416	11.710	40654	12.4	5.849	143	6.8	44.9	9.4	0.001	6959	6911	my9500_rel_o2nofp.cz12a_c8r32
qr500.L3
qr500.L3: range queries with 500 insert/s per client
Performance metrics for all DBMS, not just the ones listed above. Some are normalized by throughput, others are not. Legend for results is here.
ips	qps	rps	rmbps	wps	wmbps	rpq	rkbpq	wpi	wkbpi	csps	cpups	cspq	cpupq	dbgb1	dbgb2	rss	maxop	p50	p99	tag
500	13110	17	0.1	2083.7	58.1	0.001	0.005	4.167	118.890	75728	12.0	5.776	73	6.2	36.7	7.9	0.022	13167	12190	my5651_rel_o2nofp.cz12a_c8r32
500	10885	0	0.0	62.9	2.0	0.000	0.000	0.126	4.142	62640	12.4	5.755	91	6.3	36.8	8.3	0.004	10894	10799	my5744_rel_o2nofp.cz12a_c8r32
500	9132	0	0.0	74.9	2.4	0.000	0.000	0.150	4.964	53082	12.8	5.813	112	6.9	37.9	9.5	0.002	9135	9055	my8044_rel_o2nofp.cz12a_c8r32
500	8884	0	0.0	66.6	2.2	0.000	0.000	0.133	4.483	51624	13.3	5.811	120	6.8	45.1	9.4	0.002	8879	8799	my8407_rel_o2nofp.cz12a_c8r32
500	9024	0	0.0	76.7	2.5	0.000	0.000	0.153	5.020	52441	12.7	5.811	113	6.8	45.1	9.4	0.002	9023	8959	my9400_rel_o2nofp.cz12a_c8r32
500	8992	0	0.0	63.7	2.1	0.000	0.000	0.127	4.323	52240	12.6	5.810	112	6.8	45.0	9.4	0.002	8991	8927	my9500_rel_o2nofp.cz12a_c8r32
qp500.L4
qp500.L4: point queries with 500 insert/s per client
Performance metrics for all DBMS, not just the ones listed above. Some are normalized by throughput, others are not. Legend for results is here.
ips	qps	rps	rmbps	wps	wmbps	rpq	rkbpq	wpi	wkbpi	csps	cpups	cspq	cpupq	dbgb1	dbgb2	rss	maxop	p50	p99	tag
500	11124	16	0.1	2127.6	59.3	0.001	0.006	4.255	121.394	64979	12.6	5.842	91	6.2	36.7	7.9	0.024	11135	10671	my5651_rel_o2nofp.cz12a_c8r32
500	9346	0	0.0	39.6	1.4	0.000	0.000	0.079	2.788	54338	12.5	5.814	107	6.3	36.8	8.3	0.004	9343	9263	my5744_rel_o2nofp.cz12a_c8r32
500	6943	0	0.0	31.8	1.2	0.000	0.000	0.064	2.510	40944	12.8	5.897	147	6.9	37.9	9.5	0.002	6943	6895	my8044_rel_o2nofp.cz12a_c8r32
500	6744	0	0.0	35.2	1.3	0.000	0.000	0.070	2.740	39783	12.9	5.899	153	6.8	45.2	9.4	0.002	6751	6687	my8407_rel_o2nofp.cz12a_c8r32
500	6901	0	0.0	34.3	1.3	0.000	0.000	0.069	2.620	40715	12.2	5.900	141	6.8	45.2	9.4	0.002	6911	6863	my9400_rel_o2nofp.cz12a_c8r32
500	6926	0	0.0	36.2	1.4	0.000	0.000	0.072	2.806	40835	12.7	5.896	147	6.8	45.1	9.4	0.002	6927	6895	my9500_rel_o2nofp.cz12a_c8r32
qr1000.L5
qr1000.L5: range queries with 1000 insert/s per client
Performance metrics for all DBMS, not just the ones listed above. Some are normalized by throughput, others are not. Legend for results is here.
ips	qps	rps	rmbps	wps	wmbps	rpq	rkbpq	wpi	wkbpi	csps	cpups	cspq	cpupq	dbgb1	dbgb2	rss	maxop	p50	p99	tag
999	13020	28	0.1	1847.5	52.0	0.002	0.009	1.849	53.273	75625	12.8	5.808	79	6.2	36.7	7.9	0.020	13054	12366	my5651_rel_o2nofp.cz12a_c8r32
1000	10864	0	0.0	89.5	3.2	0.000	0.000	0.090	3.257	62710	13.1	5.773	96	6.3	36.8	8.3	0.006	10863	10767	my5744_rel_o2nofp.cz12a_c8r32
1000	9097	0	0.0	99.4	3.5	0.000	0.000	0.099	3.632	53323	13.4	5.862	118	6.9	37.9	9.5	0.002	9103	9023	my8044_rel_o2nofp.cz12a_c8r32
999	8768	0	0.0	97.9	3.5	0.000	0.000	0.098	3.601	51473	14.1	5.871	129	6.8	45.4	9.5	0.002	8767	8703	my8407_rel_o2nofp.cz12a_c8r32
999	9101	0	0.0	101.3	3.6	0.000	0.000	0.101	3.657	53417	13.4	5.870	118	6.8	45.4	9.4	0.002	9103	9039	my9400_rel_o2nofp.cz12a_c8r32
1000	8965	0	0.0	97.1	3.5	0.000	0.000	0.097	3.577	52584	13.8	5.865	123	6.8	45.2	9.4	0.002	8959	8895	my9500_rel_o2nofp.cz12a_c8r32
qp1000.L6
qp1000.L6: point queries with 1000 insert/s per client
Performance metrics for all DBMS, not just the ones listed above. Some are normalized by throughput, others are not. Legend for results is here.
ips	qps	rps	rmbps	wps	wmbps	rpq	rkbpq	wpi	wkbpi	csps	cpups	cspq	cpupq	dbgb1	dbgb2	rss	maxop	p50	p99	tag
999	11214	29	0.1	11.6	1.1	0.003	0.010	0.012	1.154	65703	12.4	5.859	88	6.2	36.7	7.9	0.010	11230	11087	my5651_rel_o2nofp.cz12a_c8r32
1000	9255	0	0.0	69.5	2.6	0.000	0.000	0.070	2.694	54033	12.7	5.838	110	6.3	36.8	8.3	0.002	9247	9183	my5744_rel_o2nofp.cz12a_c8r32
1000	6943	0	0.0	91.7	3.3	0.000	0.000	0.092	3.418	41435	13.1	5.968	151	6.9	37.9	9.5	0.002	6943	6895	my8044_rel_o2nofp.cz12a_c8r32
999	6689	0	0.0	91.6	3.3	0.000	0.000	0.092	3.426	39997	13.4	5.980	160	6.8	45.6	9.5	0.003	6687	6639	my8407_rel_o2nofp.cz12a_c8r32
999	6886	0	0.0	95.5	3.4	0.000	0.000	0.096	3.521	41138	12.7	5.975	148	6.8	45.6	9.4	0.002	6895	6831	my9400_rel_o2nofp.cz12a_c8r32
1000	6923	0	0.0	95.5	3.5	0.000	0.000	0.096	3.539	41337	13.2	5.971	153	6.8	45.4	9.4	0.002	6927	6879	my9500_rel_o2nofp.cz12a_c8r32
l.i0
- l.i0: load without secondary indexes
- Legend for results is here.
- Each entry lists the percentage of responses that fit in that bucket (slower than max time for previous bucket, faster than min time for next bucket).
Insert response time histogram
256us	1ms	4ms	16ms	64ms	256ms	1s	4s	16s	gt	max	tag
0.000	99.719	0.225	0.050	0.005	0.001	0.000	0.000	0.000	0.000	0.127	my5651_rel_o2nofp.cz12a_c8r32
0.000	99.717	0.094	0.108	0.080	0.001	0.000	0.000	0.000	0.000	0.130	my5744_rel_o2nofp.cz12a_c8r32
0.000	99.503	0.304	0.080	0.112	0.001	0.000	0.000	0.000	0.000	0.074	my8044_rel_o2nofp.cz12a_c8r32
0.000	99.501	0.306	0.086	0.106	0.002	0.000	0.000	0.000	0.000	0.073	my8407_rel_o2nofp.cz12a_c8r32
0.000	99.496	0.311	0.079	0.113	0.002	0.000	0.000	0.000	0.000	0.074	my9400_rel_o2nofp.cz12a_c8r32
0.000	99.436	0.368	0.071	0.124	0.002	0.000	0.000	0.000	0.000	0.088	my9500_rel_o2nofp.cz12a_c8r32
l.x
- l.x: create secondary indexes
- Legend for results is here.
- Each entry lists the percentage of responses that fit in that bucket (slower than max time for previous bucket, faster than min time for next bucket).
TODO - determine whether there is data for create index response time
l.i1
- l.i1: continue load after secondary indexes created with 50 inserts per transaction
- Legend for results is here.
- Each entry lists the percentage of responses that fit in that bucket (slower than max time for previous bucket, faster than min time for next bucket).
Insert response time histogram
256us	1ms	4ms	16ms	64ms	256ms	1s	4s	16s	gt	max	tag
0.000	10.762	87.330	1.760	0.148	nonzero	0.000	0.000	0.000	0.000	0.081	my5651_rel_o2nofp.cz12a_c8r32
0.000	19.701	79.770	0.499	0.029	0.001	0.000	0.000	0.000	0.000	0.086	my5744_rel_o2nofp.cz12a_c8r32
0.000	0.000	99.376	0.556	0.067	0.001	nonzero	0.000	0.000	0.000	0.318	my8044_rel_o2nofp.cz12a_c8r32
0.000	0.000	99.355	0.578	0.066	0.001	nonzero	0.000	0.000	0.000	0.321	my8407_rel_o2nofp.cz12a_c8r32
0.000	0.000	99.352	0.579	0.068	0.001	nonzero	0.000	0.000	0.000	0.331	my9400_rel_o2nofp.cz12a_c8r32
0.000	0.000	99.361	0.567	0.072	nonzero	nonzero	0.000	0.000	0.000	0.326	my9500_rel_o2nofp.cz12a_c8r32
Delete response time histogram
256us	1ms	4ms	16ms	64ms	256ms	1s	4s	16s	gt	max	tag
0.000	76.242	22.643	1.000	0.115	nonzero	0.000	0.000	0.000	0.000	0.081	my5651_rel_o2nofp.cz12a_c8r32
0.000	68.825	31.043	0.123	0.009	0.001	0.000	0.000	0.000	0.000	0.086	my5744_rel_o2nofp.cz12a_c8r32
0.000	85.471	14.347	0.166	0.016	nonzero	0.000	0.000	0.000	0.000	0.240	my8044_rel_o2nofp.cz12a_c8r32
0.000	83.089	16.719	0.175	0.017	nonzero	0.000	0.000	0.000	0.000	0.101	my8407_rel_o2nofp.cz12a_c8r32
0.000	82.798	17.011	0.173	0.017	nonzero	nonzero	0.000	0.000	0.000	0.283	my9400_rel_o2nofp.cz12a_c8r32
0.000	88.682	11.126	0.175	0.016	0.001	nonzero	0.000	0.000	0.000	0.326	my9500_rel_o2nofp.cz12a_c8r32
l.i2
- l.i2: continue load after secondary indexes created with 5 inserts per transaction
- Legend for results is here.
- Each entry lists the percentage of responses that fit in that bucket (slower than max time for previous bucket, faster than min time for next bucket).
Insert response time histogram
256us	1ms	4ms	16ms	64ms	256ms	1s	4s	16s	gt	max	tag
88.489	11.387	0.020	0.100	0.003	0.000	0.000	0.000	0.000	0.000	0.047	my5651_rel_o2nofp.cz12a_c8r32
93.613	6.335	0.043	0.009	nonzero	nonzero	0.000	0.000	0.000	0.000	0.081	my5744_rel_o2nofp.cz12a_c8r32
82.366	17.602	0.023	0.008	0.001	nonzero	0.000	0.000	0.000	0.000	0.101	my8044_rel_o2nofp.cz12a_c8r32
82.028	17.940	0.023	0.008	0.001	nonzero	0.000	0.000	0.000	0.000	0.101	my8407_rel_o2nofp.cz12a_c8r32
81.969	18.001	0.021	0.008	0.001	nonzero	0.000	0.000	0.000	0.000	0.074	my9400_rel_o2nofp.cz12a_c8r32
82.211	17.759	0.020	0.009	0.001	nonzero	0.000	0.000	0.000	0.000	0.101	my9500_rel_o2nofp.cz12a_c8r32
Delete response time histogram
256us	1ms	4ms	16ms	64ms	256ms	1s	4s	16s	gt	max	tag
96.796	3.081	0.020	0.100	0.003	0.000	0.000	0.000	0.000	0.000	0.047	my5651_rel_o2nofp.cz12a_c8r32
94.418	5.557	0.018	0.006	nonzero	nonzero	0.000	0.000	0.000	0.000	0.080	my5744_rel_o2nofp.cz12a_c8r32
96.196	3.781	0.016	0.006	0.001	nonzero	0.000	0.000	0.000	0.000	0.101	my8044_rel_o2nofp.cz12a_c8r32
95.742	4.233	0.017	0.007	0.001	nonzero	0.000	0.000	0.000	0.000	0.101	my8407_rel_o2nofp.cz12a_c8r32
95.774	4.203	0.016	0.006	0.001	nonzero	0.000	0.000	0.000	0.000	0.070	my9400_rel_o2nofp.cz12a_c8r32
97.256	2.717	0.018	0.008	0.001	nonzero	0.000	0.000	0.000	0.000	0.101	my9500_rel_o2nofp.cz12a_c8r32
qr100.L1
- qr100.L1: range queries with 100 insert/s per client
- Legend for results is here.
- Each entry lists the percentage of responses that fit in that bucket (slower than max time for previous bucket, faster than min time for next bucket).
Query response time histogram
256us	1ms	4ms	16ms	64ms	256ms	1s	4s	16s	gt	max	tag
99.985	0.008	0.002	0.005	nonzero	0.000	0.000	0.000	0.000	0.000	0.022	my5651_rel_o2nofp.cz12a_c8r32
99.998	0.002	nonzero	nonzero	0.000	0.000	0.000	0.000	0.000	0.000	0.010	my5744_rel_o2nofp.cz12a_c8r32
99.990	0.010	nonzero	0.000	0.000	0.000	0.000	0.000	0.000	0.000	0.001	my8044_rel_o2nofp.cz12a_c8r32
99.989	0.011	nonzero	0.000	0.000	0.000	0.000	0.000	0.000	0.000	0.001	my8407_rel_o2nofp.cz12a_c8r32
99.989	0.011	nonzero	0.000	0.000	0.000	0.000	0.000	0.000	0.000	0.001	my9400_rel_o2nofp.cz12a_c8r32
99.990	0.010	nonzero	nonzero	0.000	0.000	0.000	0.000	0.000	0.000	0.004	my9500_rel_o2nofp.cz12a_c8r32
Insert response time histogram
256us	1ms	4ms	16ms	64ms	256ms	1s	4s	16s	gt	max	tag
0.000	0.750	49.667	46.778	2.806	0.000	0.000	0.000	0.000	0.000	0.054	my5651_rel_o2nofp.cz12a_c8r32
0.000	7.444	92.528	0.028	0.000	0.000	0.000	0.000	0.000	0.000	0.010	my5744_rel_o2nofp.cz12a_c8r32
0.000	0.000	90.250	9.750	0.000	0.000	0.000	0.000	0.000	0.000	0.012	my8044_rel_o2nofp.cz12a_c8r32
0.000	0.000	99.944	0.028	0.028	0.000	0.000	0.000	0.000	0.000	0.029	my8407_rel_o2nofp.cz12a_c8r32
0.000	0.000	99.944	0.028	0.028	0.000	0.000	0.000	0.000	0.000	0.032	my9400_rel_o2nofp.cz12a_c8r32
0.000	0.000	91.444	8.528	0.028	0.000	0.000	0.000	0.000	0.000	0.048	my9500_rel_o2nofp.cz12a_c8r32
Delete response time histogram
256us	1ms	4ms	16ms	64ms	256ms	1s	4s	16s	gt	max	tag
0.000	3.806	46.333	48.139	1.722	0.000	0.000	0.000	0.000	0.000	0.043	my5651_rel_o2nofp.cz12a_c8r32
0.000	59.250	40.750	0.000	0.000	0.000	0.000	0.000	0.000	0.000	0.002	my5744_rel_o2nofp.cz12a_c8r32
0.000	46.306	44.028	9.667	0.000	0.000	0.000	0.000	0.000	0.000	0.012	my8044_rel_o2nofp.cz12a_c8r32
0.000	52.222	47.722	0.028	0.028	0.000	0.000	0.000	0.000	0.000	0.032	my8407_rel_o2nofp.cz12a_c8r32
0.000	50.028	49.917	0.028	0.028	0.000	0.000	0.000	0.000	0.000	0.028	my9400_rel_o2nofp.cz12a_c8r32
0.000	46.139	45.333	8.500	0.028	0.000	0.000	0.000	0.000	0.000	0.044	my9500_rel_o2nofp.cz12a_c8r32
qp100.L2
- qp100.L2: point queries with 100 insert/s per client
- Legend for results is here.
- Each entry lists the percentage of responses that fit in that bucket (slower than max time for previous bucket, faster than min time for next bucket).
Query response time histogram
256us	1ms	4ms	16ms	64ms	256ms	1s	4s	16s	gt	max	tag
99.982	0.013	0.002	0.004	nonzero	0.000	0.000	0.000	0.000	0.000	0.028	my5651_rel_o2nofp.cz12a_c8r32
99.991	0.009	nonzero	0.000	0.000	0.000	0.000	0.000	0.000	0.000	0.001	my5744_rel_o2nofp.cz12a_c8r32
99.964	0.036	nonzero	0.000	0.000	0.000	0.000	0.000	0.000	0.000	0.001	my8044_rel_o2nofp.cz12a_c8r32
99.954	0.046	nonzero	0.000	0.000	0.000	0.000	0.000	0.000	0.000	0.002	my8407_rel_o2nofp.cz12a_c8r32
99.958	0.042	nonzero	0.000	0.000	0.000	0.000	0.000	0.000	0.000	0.001	my9400_rel_o2nofp.cz12a_c8r32
99.961	0.039	nonzero	0.000	0.000	0.000	0.000	0.000	0.000	0.000	0.001	my9500_rel_o2nofp.cz12a_c8r32
Insert response time histogram
256us	1ms	4ms	16ms	64ms	256ms	1s	4s	16s	gt	max	tag
0.000	0.111	52.750	45.472	1.667	0.000	0.000	0.000	0.000	0.000	0.057	my5651_rel_o2nofp.cz12a_c8r32
0.000	0.028	99.972	0.000	0.000	0.000	0.000	0.000	0.000	0.000	0.002	my5744_rel_o2nofp.cz12a_c8r32
0.000	0.000	99.944	0.056	0.000	0.000	0.000	0.000	0.000	0.000	0.005	my8044_rel_o2nofp.cz12a_c8r32
0.000	0.000	99.917	0.083	0.000	0.000	0.000	0.000	0.000	0.000	0.013	my8407_rel_o2nofp.cz12a_c8r32
0.000	0.000	91.000	8.972	0.028	0.000	0.000	0.000	0.000	0.000	0.023	my9400_rel_o2nofp.cz12a_c8r32
0.000	0.000	90.472	9.528	0.000	0.000	0.000	0.000	0.000	0.000	0.011	my9500_rel_o2nofp.cz12a_c8r32
Delete response time histogram
256us	1ms	4ms	16ms	64ms	256ms	1s	4s	16s	gt	max	tag
0.000	3.194	49.250	46.194	1.361	0.000	0.000	0.000	0.000	0.000	0.056	my5651_rel_o2nofp.cz12a_c8r32
0.000	50.028	49.972	0.000	0.000	0.000	0.000	0.000	0.000	0.000	0.002	my5744_rel_o2nofp.cz12a_c8r32
0.000	28.306	71.667	0.028	0.000	0.000	0.000	0.000	0.000	0.000	0.005	my8044_rel_o2nofp.cz12a_c8r32
0.000	21.111	78.861	0.028	0.000	0.000	0.000	0.000	0.000	0.000	0.013	my8407_rel_o2nofp.cz12a_c8r32
0.000	9.778	81.278	8.917	0.028	0.000	0.000	0.000	0.000	0.000	0.022	my9400_rel_o2nofp.cz12a_c8r32
0.000	11.167	79.333	9.500	0.000	0.000	0.000	0.000	0.000	0.000	0.011	my9500_rel_o2nofp.cz12a_c8r32
qr500.L3
- qr500.L3: range queries with 500 insert/s per client
- Legend for results is here.
- Each entry lists the percentage of responses that fit in that bucket (slower than max time for previous bucket, faster than min time for next bucket).
Query response time histogram
256us	1ms	4ms	16ms	64ms	256ms	1s	4s	16s	gt	max	tag
99.979	0.014	0.003	0.005	nonzero	0.000	0.000	0.000	0.000	0.000	0.022	my5651_rel_o2nofp.cz12a_c8r32
99.997	0.003	nonzero	nonzero	0.000	0.000	0.000	0.000	0.000	0.000	0.004	my5744_rel_o2nofp.cz12a_c8r32
99.988	0.012	nonzero	0.000	0.000	0.000	0.000	0.000	0.000	0.000	0.002	my8044_rel_o2nofp.cz12a_c8r32
99.986	0.014	nonzero	0.000	0.000	0.000	0.000	0.000	0.000	0.000	0.002	my8407_rel_o2nofp.cz12a_c8r32
99.987	0.013	nonzero	0.000	0.000	0.000	0.000	0.000	0.000	0.000	0.002	my9400_rel_o2nofp.cz12a_c8r32
99.986	0.014	nonzero	0.000	0.000	0.000	0.000	0.000	0.000	0.000	0.002	my9500_rel_o2nofp.cz12a_c8r32
Insert response time histogram
256us	1ms	4ms	16ms	64ms	256ms	1s	4s	16s	gt	max	tag
0.000	11.217	71.978	15.206	1.600	0.000	0.000	0.000	0.000	0.000	0.051	my5651_rel_o2nofp.cz12a_c8r32
0.000	44.683	55.306	0.011	0.000	0.000	0.000	0.000	0.000	0.000	0.010	my5744_rel_o2nofp.cz12a_c8r32
0.000	0.000	98.111	1.889	0.000	0.000	0.000	0.000	0.000	0.000	0.011	my8044_rel_o2nofp.cz12a_c8r32
0.000	0.000	99.967	0.033	0.000	0.000	0.000	0.000	0.000	0.000	0.013	my8407_rel_o2nofp.cz12a_c8r32
0.000	0.000	98.172	1.822	0.006	0.000	0.000	0.000	0.000	0.000	0.022	my9400_rel_o2nofp.cz12a_c8r32
0.000	0.000	98.067	1.933	0.000	0.000	0.000	0.000	0.000	0.000	0.011	my9500_rel_o2nofp.cz12a_c8r32
Delete response time histogram
256us	1ms	4ms	16ms	64ms	256ms	1s	4s	16s	gt	max	tag
0.000	19.717	63.883	14.978	1.422	0.000	0.000	0.000	0.000	0.000	0.049	my5651_rel_o2nofp.cz12a_c8r32
0.000	89.350	10.639	0.011	0.000	0.000	0.000	0.000	0.000	0.000	0.010	my5744_rel_o2nofp.cz12a_c8r32
0.000	88.661	9.450	1.889	0.000	0.000	0.000	0.000	0.000	0.000	0.011	my8044_rel_o2nofp.cz12a_c8r32
0.000	85.750	14.233	0.017	0.000	0.000	0.000	0.000	0.000	0.000	0.012	my8407_rel_o2nofp.cz12a_c8r32
0.000	86.633	11.550	1.811	0.006	0.000	0.000	0.000	0.000	0.000	0.022	my9400_rel_o2nofp.cz12a_c8r32
0.000	88.644	9.428	1.928	0.000	0.000	0.000	0.000	0.000	0.000	0.011	my9500_rel_o2nofp.cz12a_c8r32
qp500.L4
- qp500.L4: point queries with 500 insert/s per client
- Legend for results is here.
- Each entry lists the percentage of responses that fit in that bucket (slower than max time for previous bucket, faster than min time for next bucket).
Query response time histogram
256us	1ms	4ms	16ms	64ms	256ms	1s	4s	16s	gt	max	tag
99.967	0.029	0.001	0.003	nonzero	0.000	0.000	0.000	0.000	0.000	0.024	my5651_rel_o2nofp.cz12a_c8r32
99.992	0.008	nonzero	0.000	0.000	0.000	0.000	0.000	0.000	0.000	0.004	my5744_rel_o2nofp.cz12a_c8r32
99.952	0.048	nonzero	0.000	0.000	0.000	0.000	0.000	0.000	0.000	0.002	my8044_rel_o2nofp.cz12a_c8r32
99.945	0.055	nonzero	0.000	0.000	0.000	0.000	0.000	0.000	0.000	0.002	my8407_rel_o2nofp.cz12a_c8r32
99.943	0.057	nonzero	0.000	0.000	0.000	0.000	0.000	0.000	0.000	0.002	my9400_rel_o2nofp.cz12a_c8r32
99.949	0.051	nonzero	0.000	0.000	0.000	0.000	0.000	0.000	0.000	0.002	my9500_rel_o2nofp.cz12a_c8r32
Insert response time histogram
256us	1ms	4ms	16ms	64ms	256ms	1s	4s	16s	gt	max	tag
0.000	10.933	72.694	14.939	1.428	0.006	0.000	0.000	0.000	0.000	0.071	my5651_rel_o2nofp.cz12a_c8r32
0.000	21.839	78.161	0.000	0.000	0.000	0.000	0.000	0.000	0.000	0.003	my5744_rel_o2nofp.cz12a_c8r32
0.000	0.000	98.133	1.861	0.006	0.000	0.000	0.000	0.000	0.000	0.020	my8044_rel_o2nofp.cz12a_c8r32
0.000	0.000	98.206	1.789	0.006	0.000	0.000	0.000	0.000	0.000	0.022	my8407_rel_o2nofp.cz12a_c8r32
0.000	0.000	98.178	1.822	0.000	0.000	0.000	0.000	0.000	0.000	0.011	my9400_rel_o2nofp.cz12a_c8r32
0.000	0.000	98.178	1.817	0.006	0.000	0.000	0.000	0.000	0.000	0.019	my9500_rel_o2nofp.cz12a_c8r32
Delete response time histogram
256us	1ms	4ms	16ms	64ms	256ms	1s	4s	16s	gt	max	tag
0.000	23.794	60.150	14.794	1.261	0.000	0.000	0.000	0.000	0.000	0.056	my5651_rel_o2nofp.cz12a_c8r32
0.000	88.578	11.422	0.000	0.000	0.000	0.000	0.000	0.000	0.000	0.002	my5744_rel_o2nofp.cz12a_c8r32
0.000	81.906	16.239	1.850	0.006	0.000	0.000	0.000	0.000	0.000	0.021	my8044_rel_o2nofp.cz12a_c8r32
0.000	62.528	35.689	1.783	0.000	0.000	0.000	0.000	0.000	0.000	0.011	my8407_rel_o2nofp.cz12a_c8r32
0.000	56.028	42.156	1.817	0.000	0.000	0.000	0.000	0.000	0.000	0.011	my9400_rel_o2nofp.cz12a_c8r32
0.000	84.039	14.156	1.800	0.006	0.000	0.000	0.000	0.000	0.000	0.018	my9500_rel_o2nofp.cz12a_c8r32
qr1000.L5
- qr1000.L5: range queries with 1000 insert/s per client
- Legend for results is here.
- Each entry lists the percentage of responses that fit in that bucket (slower than max time for previous bucket, faster than min time for next bucket).
Query response time histogram
256us	1ms	4ms	16ms	64ms	256ms	1s	4s	16s	gt	max	tag
99.975	0.019	0.002	0.004	nonzero	0.000	0.000	0.000	0.000	0.000	0.020	my5651_rel_o2nofp.cz12a_c8r32
99.996	0.004	nonzero	nonzero	0.000	0.000	0.000	0.000	0.000	0.000	0.006	my5744_rel_o2nofp.cz12a_c8r32
99.986	0.014	nonzero	0.000	0.000	0.000	0.000	0.000	0.000	0.000	0.002	my8044_rel_o2nofp.cz12a_c8r32
99.982	0.018	nonzero	0.000	0.000	0.000	0.000	0.000	0.000	0.000	0.002	my8407_rel_o2nofp.cz12a_c8r32
99.986	0.014	nonzero	0.000	0.000	0.000	0.000	0.000	0.000	0.000	0.002	my9400_rel_o2nofp.cz12a_c8r32
99.984	0.016	nonzero	0.000	0.000	0.000	0.000	0.000	0.000	0.000	0.002	my9500_rel_o2nofp.cz12a_c8r32
Insert response time histogram
256us	1ms	4ms	16ms	64ms	256ms	1s	4s	16s	gt	max	tag
0.000	15.244	76.281	8.325	0.150	0.000	0.000	0.000	0.000	0.000	0.035	my5651_rel_o2nofp.cz12a_c8r32
0.000	49.247	50.753	0.000	0.000	0.000	0.000	0.000	0.000	0.000	0.002	my5744_rel_o2nofp.cz12a_c8r32
0.000	0.000	99.042	0.956	0.003	0.000	0.000	0.000	0.000	0.000	0.022	my8044_rel_o2nofp.cz12a_c8r32
0.000	0.000	99.036	0.958	0.006	0.000	0.000	0.000	0.000	0.000	0.037	my8407_rel_o2nofp.cz12a_c8r32
0.000	0.000	99.100	0.894	0.006	0.000	0.000	0.000	0.000	0.000	0.038	my9400_rel_o2nofp.cz12a_c8r32
0.000	0.000	99.094	0.903	0.003	0.000	0.000	0.000	0.000	0.000	0.048	my9500_rel_o2nofp.cz12a_c8r32
Delete response time histogram
256us	1ms	4ms	16ms	64ms	256ms	1s	4s	16s	gt	max	tag
0.000	27.403	64.650	7.811	0.136	0.000	0.000	0.000	0.000	0.000	0.031	my5651_rel_o2nofp.cz12a_c8r32
0.000	92.761	7.239	0.000	0.000	0.000	0.000	0.000	0.000	0.000	0.002	my5744_rel_o2nofp.cz12a_c8r32
0.000	91.894	7.147	0.956	0.003	0.000	0.000	0.000	0.000	0.000	0.021	my8044_rel_o2nofp.cz12a_c8r32
0.000	90.981	8.108	0.906	0.006	0.000	0.000	0.000	0.000	0.000	0.035	my8407_rel_o2nofp.cz12a_c8r32
0.000	90.372	8.736	0.886	0.006	0.000	0.000	0.000	0.000	0.000	0.040	my9400_rel_o2nofp.cz12a_c8r32
0.000	92.611	6.492	0.894	0.003	0.000	0.000	0.000	0.000	0.000	0.045	my9500_rel_o2nofp.cz12a_c8r32
qp1000.L6
- qp1000.L6: point queries with 1000 insert/s per client
- Legend for results is here.
- Each entry lists the percentage of responses that fit in that bucket (slower than max time for previous bucket, faster than min time for next bucket).
Query response time histogram
256us	1ms	4ms	16ms	64ms	256ms	1s	4s	16s	gt	max	tag
99.958	0.039	0.001	0.002	0.000	0.000	0.000	0.000	0.000	0.000	0.010	my5651_rel_o2nofp.cz12a_c8r32
99.986	0.014	nonzero	0.000	0.000	0.000	0.000	0.000	0.000	0.000	0.002	my5744_rel_o2nofp.cz12a_c8r32
99.942	0.058	nonzero	0.000	0.000	0.000	0.000	0.000	0.000	0.000	0.002	my8044_rel_o2nofp.cz12a_c8r32
99.935	0.065	nonzero	0.000	0.000	0.000	0.000	0.000	0.000	0.000	0.003	my8407_rel_o2nofp.cz12a_c8r32
99.931	0.069	nonzero	0.000	0.000	0.000	0.000	0.000	0.000	0.000	0.002	my9400_rel_o2nofp.cz12a_c8r32
99.936	0.064	nonzero	0.000	0.000	0.000	0.000	0.000	0.000	0.000	0.002	my9500_rel_o2nofp.cz12a_c8r32
Insert response time histogram
256us	1ms	4ms	16ms	64ms	256ms	1s	4s	16s	gt	max	tag
0.000	17.767	77.483	4.742	0.008	0.000	0.000	0.000	0.000	0.000	0.017	my5651_rel_o2nofp.cz12a_c8r32
0.000	34.367	65.631	0.003	0.000	0.000	0.000	0.000	0.000	0.000	0.004	my5744_rel_o2nofp.cz12a_c8r32
0.000	0.000	99.039	0.961	0.000	0.000	0.000	0.000	0.000	0.000	0.012	my8044_rel_o2nofp.cz12a_c8r32
0.000	0.000	99.031	0.961	0.008	0.000	0.000	0.000	0.000	0.000	0.042	my8407_rel_o2nofp.cz12a_c8r32
0.000	0.000	99.072	0.925	0.003	0.000	0.000	0.000	0.000	0.000	0.041	my9400_rel_o2nofp.cz12a_c8r32
0.000	0.000	99.042	0.956	0.003	0.000	0.000	0.000	0.000	0.000	0.040	my9500_rel_o2nofp.cz12a_c8r32
Delete response time histogram
256us	1ms	4ms	16ms	64ms	256ms	1s	4s	16s	gt	max	tag
0.000	33.461	61.822	4.708	0.008	0.000	0.000	0.000	0.000	0.000	0.016	my5651_rel_o2nofp.cz12a_c8r32
0.000	92.050	7.950	0.000	0.000	0.000	0.000	0.000	0.000	0.000	0.002	my5744_rel_o2nofp.cz12a_c8r32
0.000	86.808	12.236	0.956	0.000	0.000	0.000	0.000	0.000	0.000	0.012	my8044_rel_o2nofp.cz12a_c8r32
0.000	80.222	18.817	0.953	0.008	0.000	0.000	0.000	0.000	0.000	0.045	my8407_rel_o2nofp.cz12a_c8r32
0.000	85.175	13.906	0.917	0.003	0.000	0.000	0.000	0.000	0.000	0.038	my9400_rel_o2nofp.cz12a_c8r32
0.000	89.928	9.119	0.950	0.003	0.000	0.000	0.000	0.000	0.000	0.037	my9500_rel_o2nofp.cz12a_c8r32