Introduction
This is a report for the insert benchmark with 800M docs and 1 client(s). It is generated by scripts (bash, awk, sed) and Tufte might not be impressed. An overview of the insert benchmark is here and a short update is here. Below, by DBMS, I mean DBMS+version.config. An example is my8020.c10b40 where my means MySQL, 8020 is version 8.0.20 and c10b40 is the name for the configuration file.
The test server has 8 AMD cores, 32G RAM and an NVMe device for the database. The benchmark was run with 1 client and there were 1 or 3 connections per client (1 for queries or inserts without rate limits, 1+1 for rate limited inserts+deletes). It uses 1 table with a table per client. It loads 800M rows per table without secondary indexes, creates 3 secondary indexes per table, then inserts 4m+1m rows per table with a delete per insert to avoid growing the table. It then does 6 read+write tests for 1800s each that do queries as fast as possible with 100,100,500,500,1000,1000 inserts/s and the same for deletes/s per client concurrent with the queries. The database is larger than memory and the workload is IO-bound for except for the range query tests (qr*). Clients and the DBMS share one server.
The tested DBMS are:
- my5651_rel_o2nofp.cz12a_c8r32 - MySQL 5.6.51 with the cz12a_c8r32 config
- my5744_rel_o2nofp.cz12a_c8r32 - MySQL 5.7.44 with the cz12a_c8r32 config
- my8044_rel_o2nofp.cz12a_c8r32 - MySQL 8.0.44 with the cz12a_c8r32 config
- my8407_rel_o2nofp.cz12a_c8r32 - MySQL 8.4.7 with the cz12a_c8r32 config
- my9400_rel_o2nofp.cz12a_c8r32 - MySQL 9.4.0 with the cz12a_c8r32 config
- my9500_rel_o2nofp.cz12a_c8r32 - MySQL 9.5.0 with the cz12a_c8r32 config
Contents
- Summary
- l.i0: load without secondary indexes
- l.x: create secondary indexes
- l.i1: continue load after secondary indexes created with 50 inserts per transaction
- l.i2: continue load after secondary indexes created with 5 inserts per transaction
- qr100.L1: range queries with 100 insert/s per client
- qp100.L2: point queries with 100 insert/s per client
- qr500.L3: range queries with 500 insert/s per client
- qp500.L4: point queries with 500 insert/s per client
- qr1000.L5: range queries with 1000 insert/s per client
- qp1000.L6: point queries with 1000 insert/s per client
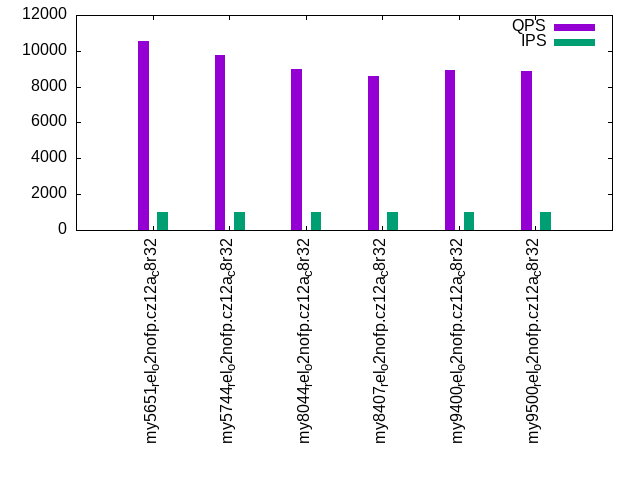
Summary
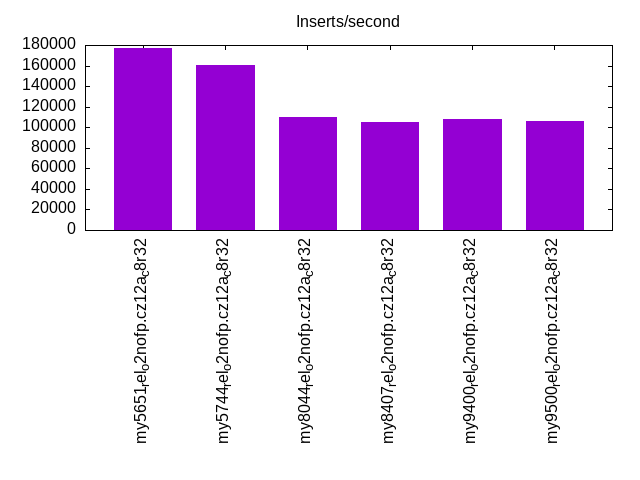
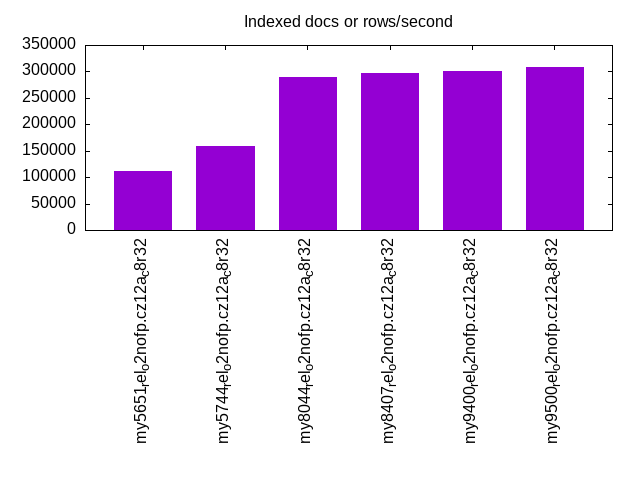
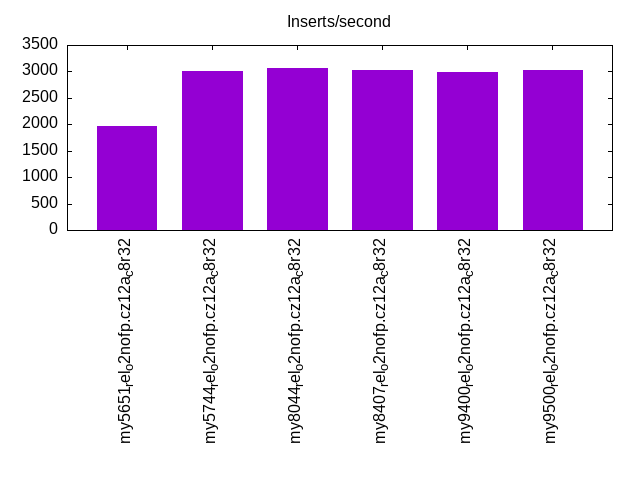
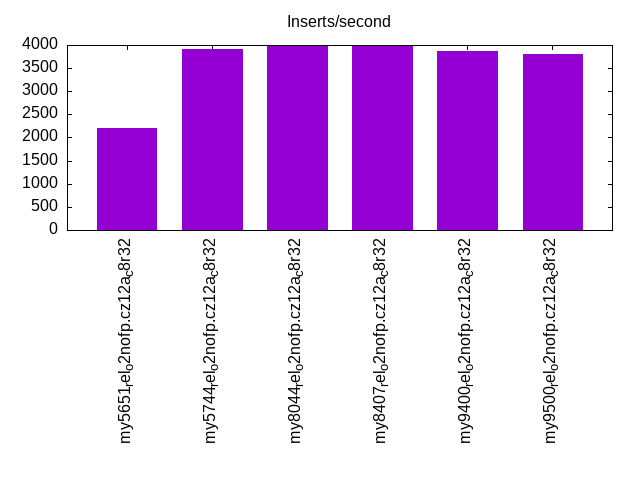
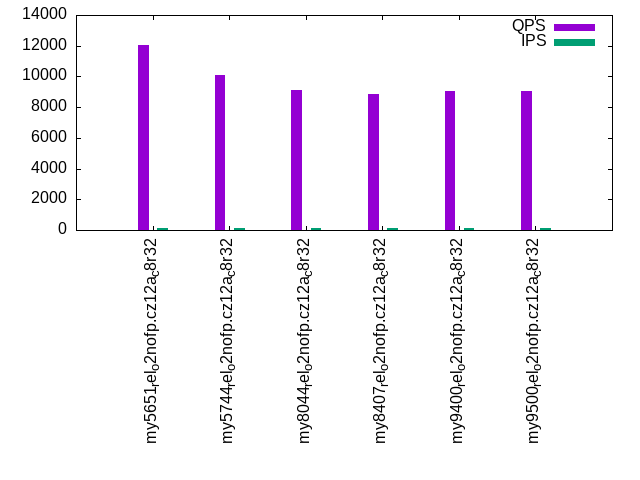
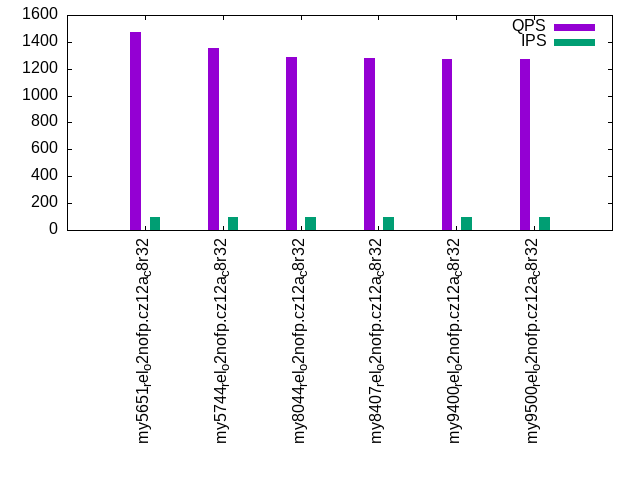
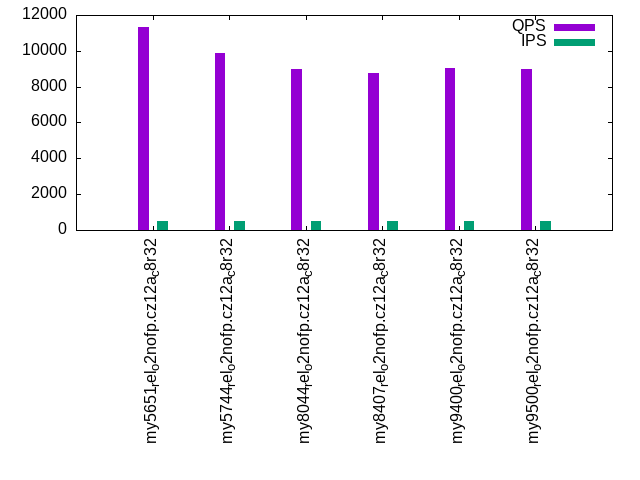
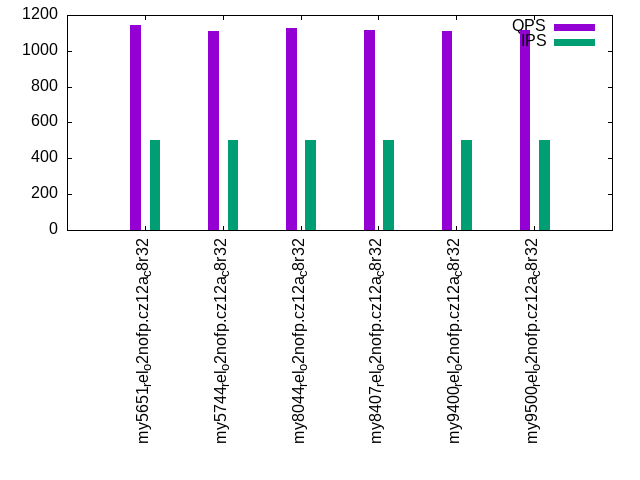
The numbers are inserts/s for l.i0, l.i1 and l.i2, indexed docs (or rows) /s for l.x and queries/s for qr100, qp100 thru qr1000, qp1000" The values are the average rate over the entire test for inserts (IPS) and queries (QPS). The range of values for IPS and QPS is split into 3 parts: bottom 25%, middle 50%, top 25%. Values in the bottom 25% have a red background, values in the top 25% have a green background and values in the middle have no color. A gray background is used for values that can be ignored because the DBMS did not sustain the target insert rate. Red backgrounds are not used when the minimum value is within 80% of the max value.
| dbms | l.i0 | l.x | l.i1 | l.i2 | qr100 | qp100 | qr500 | qp500 | qr1000 | qp1000 |
|---|---|---|---|---|---|---|---|---|---|---|
| my5651_rel_o2nofp.cz12a_c8r32 | 177148 | 112233 | 1975 | 2198 | 12027 | 1471 | 11348 | 1145 | 10547 | 856 |
| my5744_rel_o2nofp.cz12a_c8r32 | 160642 | 159077 | 3003 | 3906 | 10067 | 1351 | 9902 | 1110 | 9779 | 1001 |
| my8044_rel_o2nofp.cz12a_c8r32 | 110072 | 289855 | 3074 | 3968 | 9115 | 1289 | 9012 | 1128 | 8965 | 1010 |
| my8407_rel_o2nofp.cz12a_c8r32 | 105416 | 297398 | 3035 | 4000 | 8850 | 1279 | 8759 | 1117 | 8612 | 999 |
| my9400_rel_o2nofp.cz12a_c8r32 | 108430 | 300526 | 2994 | 3861 | 9075 | 1269 | 9059 | 1112 | 8953 | 997 |
| my9500_rel_o2nofp.cz12a_c8r32 | 106482 | 309119 | 3026 | 3802 | 9080 | 1275 | 8965 | 1115 | 8894 | 999 |
This table has relative throughput, throughput for the DBMS relative to the DBMS in the first line, using the absolute throughput from the previous table. Values less than 0.95 have a yellow background. Values greater than 1.05 have a blue background.
| dbms | l.i0 | l.x | l.i1 | l.i2 | qr100 | qp100 | qr500 | qp500 | qr1000 | qp1000 |
|---|---|---|---|---|---|---|---|---|---|---|
| my5651_rel_o2nofp.cz12a_c8r32 | 1.00 | 1.00 | 1.00 | 1.00 | 1.00 | 1.00 | 1.00 | 1.00 | 1.00 | 1.00 |
| my5744_rel_o2nofp.cz12a_c8r32 | 0.91 | 1.42 | 1.52 | 1.78 | 0.84 | 0.92 | 0.87 | 0.97 | 0.93 | 1.17 |
| my8044_rel_o2nofp.cz12a_c8r32 | 0.62 | 2.58 | 1.56 | 1.81 | 0.76 | 0.88 | 0.79 | 0.99 | 0.85 | 1.18 |
| my8407_rel_o2nofp.cz12a_c8r32 | 0.60 | 2.65 | 1.54 | 1.82 | 0.74 | 0.87 | 0.77 | 0.98 | 0.82 | 1.17 |
| my9400_rel_o2nofp.cz12a_c8r32 | 0.61 | 2.68 | 1.52 | 1.76 | 0.75 | 0.86 | 0.80 | 0.97 | 0.85 | 1.16 |
| my9500_rel_o2nofp.cz12a_c8r32 | 0.60 | 2.75 | 1.53 | 1.73 | 0.75 | 0.87 | 0.79 | 0.97 | 0.84 | 1.17 |
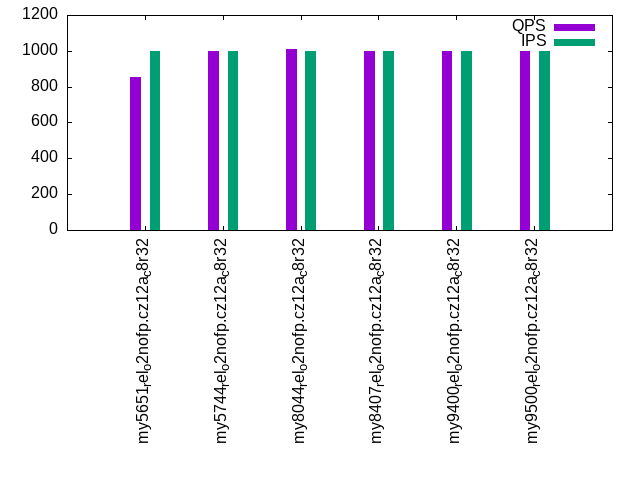
This lists the average rate of inserts/s for the tests that do inserts concurrent with queries. For such tests the query rate is listed in the table above. The read+write tests are setup so that the insert rate should match the target rate every second. Cells that are not at least 95% of the target have a red background to indicate a failure to satisfy the target.
| dbms | qr100.L1 | qp100.L2 | qr500.L3 | qp500.L4 | qr1000.L5 | qp1000.L6 |
|---|---|---|---|---|---|---|
| my5651_rel_o2nofp.cz12a_c8r32 | 100 | 100 | 500 | 500 | 999 | 999 |
| my5744_rel_o2nofp.cz12a_c8r32 | 100 | 100 | 500 | 500 | 999 | 999 |
| my8044_rel_o2nofp.cz12a_c8r32 | 100 | 100 | 500 | 500 | 1000 | 1000 |
| my8407_rel_o2nofp.cz12a_c8r32 | 100 | 100 | 500 | 500 | 1000 | 1000 |
| my9400_rel_o2nofp.cz12a_c8r32 | 100 | 100 | 500 | 500 | 1000 | 1000 |
| my9500_rel_o2nofp.cz12a_c8r32 | 100 | 100 | 500 | 500 | 1000 | 1000 |
| target | 100 | 100 | 500 | 500 | 1000 | 1000 |
l.i0
l.i0: load without secondary indexes. Graphs for performance per 1-second interval are here.
Average throughput:
Insert response time histogram: each cell has the percentage of responses that take <= the time in the header and max is the max response time in seconds. For the max column values in the top 25% of the range have a red background and in the bottom 25% of the range have a green background. The red background is not used when the min value is within 80% of the max value.
| dbms | 256us | 1ms | 4ms | 16ms | 64ms | 256ms | 1s | 4s | 16s | gt | max |
|---|---|---|---|---|---|---|---|---|---|---|---|
| my5651_rel_o2nofp.cz12a_c8r32 | 99.555 | 0.380 | 0.022 | 0.041 | 0.002 | 0.222 | |||||
| my5744_rel_o2nofp.cz12a_c8r32 | 99.711 | 0.115 | 0.059 | 0.114 | 0.001 | 0.161 | |||||
| my8044_rel_o2nofp.cz12a_c8r32 | 99.574 | 0.250 | 0.056 | 0.118 | 0.001 | nonzero | 0.334 | ||||
| my8407_rel_o2nofp.cz12a_c8r32 | 99.551 | 0.271 | 0.053 | 0.123 | 0.002 | nonzero | 0.337 | ||||
| my9400_rel_o2nofp.cz12a_c8r32 | 99.569 | 0.256 | 0.116 | 0.057 | 0.001 | nonzero | 0.318 | ||||
| my9500_rel_o2nofp.cz12a_c8r32 | 99.494 | 0.330 | 0.085 | 0.089 | 0.002 | nonzero | 0.325 |
Performance metrics for the DBMS listed above. Some are normalized by throughput, others are not. Legend for results is here.
ips	qps	rps	rmbps	wps	wmbps	rpq	rkbpq	wpi	wkbpi	csps	cpups	cspq	cpupq	dbgb1	dbgb2	rss	maxop	p50	p99	tag
177148	0	1496	5.8	1159.6	63.5	0.008	0.034	0.007	0.367	23812	19.6	0.134	9	52.6	83.1	24.7	0.222	177976	143381	my5651_rel_o2nofp.cz12a_c8r32
160642	0	0	0.0	1063.3	57.8	0.000	0.000	0.007	0.369	18897	19.4	0.118	10	52.6	83.1	25.0	0.161	160578	149979	my5744_rel_o2nofp.cz12a_c8r32
110072	0	0	0.0	746.5	41.3	0.000	0.000	0.007	0.384	13604	17.2	0.124	13	52.4	83.0	25.3	0.334	110082	102785	my8044_rel_o2nofp.cz12a_c8r32
105416	0	0	0.0	715.5	39.6	0.000	0.000	0.007	0.384	13046	17.2	0.124	13	52.4	120.1	25.3	0.337	105288	98187	my8407_rel_o2nofp.cz12a_c8r32
108430	0	0	0.0	735.6	40.7	0.000	0.000	0.007	0.384	13422	17.2	0.124	13	52.4	120.1	25.3	0.318	108386	101387	my9400_rel_o2nofp.cz12a_c8r32
106482	0	0	0.0	730.4	40.4	0.000	0.000	0.007	0.388	14060	17.2	0.132	13	52.4	120.1	25.4	0.325	106485	98787	my9500_rel_o2nofp.cz12a_c8r32
Average values from iostat.
r/s	rkB/s	rrqm/s	%rrqm	r_await	rareq-s	w/s	wkB/s	wrqm/s	%wrqm	w_await	wareq-s	d/s	dkB/s	drqm/s	%drqm	d_await	dareq-s	f/s	f_await	aqu-sz	%util
1496.0	5984.6	0.000	0.000	0.106	3.965	1160.6	65078.2	10.29	0.902	0.479	57.06	0.263	1.999	0.000	0.000	0.150	1.122	1.528	2.558	0.763	11.78		my5651_rel_o2nofp.cz12a_c8r32
0.244	1.878	0.000	0.000	2.385	2.347	1064.1	59247.2	21.88	2.057	0.889	55.32	0.315	4.446	0.000	0.000	0.126	2.328	4.393	1.533	0.918	6.915		my5744_rel_o2nofp.cz12a_c8r32
0.204	1.737	0.002	0.044	1.912	2.033	746.9	42301.9	15.87	2.131	1.460	56.33	0.215	1.990	0.000	0.000	0.127	1.643	4.550	1.528	1.070	5.121		my8044_rel_o2nofp.cz12a_c8r32
0.190	1.608	0.002	0.045	1.970	1.985	715.8	40513.8	15.13	2.115	1.452	56.28	0.151	2.796	0.000	0.000	0.129	3.897	4.463	1.564	1.022	5.046		my8407_rel_o2nofp.cz12a_c8r32
0.198	1.732	0.000	0.000	2.051	1.976	735.9	41674.3	15.66	2.140	1.402	56.32	0.236	1.923	0.000	0.000	0.099	1.420	4.514	1.076	1.015	4.770		my9400_rel_o2nofp.cz12a_c8r32
0.192	1.601	0.000	0.000	1.931	1.984	730.7	41370.8	15.82	2.165	1.443	56.33	0.158	2.067	0.000	0.000	0.117	2.756	4.591	1.264	1.038	4.858		my9500_rel_o2nofp.cz12a_c8r32
l.x
l.x: create secondary indexes.
Average throughput:
Performance metrics for the DBMS listed above. Some are normalized by throughput, others are not. Legend for results is here.
ips	qps	rps	rmbps	wps	wmbps	rpq	rkbpq	wpi	wkbpi	csps	cpups	cspq	cpupq	dbgb1	dbgb2	rss	maxop	p50	p99	tag
112233	0	1216	111.6	1791.4	145.3	0.011	1.019	0.016	1.325	2299	10.1	0.020	7	111.4	141.9	24.8	0.004	NA	NA	my5651_rel_o2nofp.cz12a_c8r32
159077	0	1677	155.8	2412.2	189.5	0.011	1.003	0.015	1.220	8900	11.6	0.056	6	121.1	151.7	25.1	0.001	NA	NA	my5744_rel_o2nofp.cz12a_c8r32
289855	0	4016	395.3	8753.0	442.0	0.014	1.396	0.030	1.562	20348	41.5	0.070	11	120.7	151.3	25.4	0.002	NA	NA	my8044_rel_o2nofp.cz12a_c8r32
297398	0	4121	407.3	8983.2	453.6	0.014	1.402	0.030	1.562	21046	41.5	0.071	11	120.7	188.4	25.4	0.001	NA	NA	my8407_rel_o2nofp.cz12a_c8r32
300526	0	4115	401.0	9087.4	458.6	0.014	1.366	0.030	1.563	21351	41.2	0.071	11	120.7	188.4	25.4	0.002	NA	NA	my9400_rel_o2nofp.cz12a_c8r32
309119	0	4291	423.9	9351.9	471.9	0.014	1.404	0.030	1.563	21635	41.5	0.070	11	120.7	188.4	25.6	0.002	NA	NA	my9500_rel_o2nofp.cz12a_c8r32
Average values from iostat.
r/s	rkB/s	rrqm/s	%rrqm	r_await	rareq-s	w/s	wkB/s	wrqm/s	%wrqm	w_await	wareq-s	d/s	dkB/s	drqm/s	%drqm	d_await	dareq-s	f/s	f_await	aqu-sz	%util
1215.0	114372	0.000	0.000	0.154	94.59	1792.5	148842	85.30	4.005	0.239	90.66	0.169	4609.8	0.000	0.000	0.001	38.81	31.03	2.666	0.686	38.15		my5651_rel_o2nofp.cz12a_c8r32
1676.1	159695	0.000	0.000	0.153	97.72	2407.9	194037	15.94	0.484	0.139	117.9	0.527	10119.4	0.000	0.000	0.004	85.61	3.851	2.804	0.579	23.64		my5744_rel_o2nofp.cz12a_c8r32
4010.5	405300	0.000	0.000	0.334	114.4	8738.2	453109	34.01	0.435	0.544	70.94	4.553	47124.1	0.000	0.000	0.022	316.1	7.745	3.002	5.316	63.42		my8044_rel_o2nofp.cz12a_c8r32
4114.8	417601	0.000	0.000	0.350	114.7	8968.0	464928	34.94	0.437	0.572	70.33	4.883	48389.5	0.000	0.000	0.017	290.8	7.913	3.236	5.751	65.62		my8407_rel_o2nofp.cz12a_c8r32
4109.0	411197	0.013	0.001	0.282	111.9	9072.5	470084	34.89	0.459	0.608	69.48	4.773	44110.2	0.000	0.000	0.017	296.2	8.039	2.509	5.425	59.74		my9400_rel_o2nofp.cz12a_c8r32
4285.7	434654	0.000	0.000	0.304	114.2	9337.4	483717	35.44	0.441	0.594	69.42	4.679	42574.9	0.000	0.000	0.017	213.6	8.229	2.694	5.688	62.21		my9500_rel_o2nofp.cz12a_c8r32
l.i1
l.i1: continue load after secondary indexes created with 50 inserts per transaction. Graphs for performance per 1-second interval are here.
Average throughput:
Insert response time histogram: each cell has the percentage of responses that take <= the time in the header and max is the max response time in seconds. For the max column values in the top 25% of the range have a red background and in the bottom 25% of the range have a green background. The red background is not used when the min value is within 80% of the max value.
| dbms | 256us | 1ms | 4ms | 16ms | 64ms | 256ms | 1s | 4s | 16s | gt | max |
|---|---|---|---|---|---|---|---|---|---|---|---|
| my5651_rel_o2nofp.cz12a_c8r32 | 14.247 | 84.720 | 1.031 | 0.001 | 0.697 | ||||||
| my5744_rel_o2nofp.cz12a_c8r32 | 64.752 | 34.836 | 0.411 | 0.113 | |||||||
| my8044_rel_o2nofp.cz12a_c8r32 | 68.450 | 30.118 | 1.430 | 0.003 | 0.474 | ||||||
| my8407_rel_o2nofp.cz12a_c8r32 | 0.001 | 67.840 | 30.610 | 1.546 | 0.003 | 0.500 | |||||
| my9400_rel_o2nofp.cz12a_c8r32 | 67.406 | 30.990 | 1.601 | 0.003 | 0.477 | ||||||
| my9500_rel_o2nofp.cz12a_c8r32 | 68.093 | 30.406 | 1.499 | 0.003 | 0.493 |
Delete response time histogram: each cell has the percentage of responses that take <= the time in the header and max is the max response time in seconds. For the max column values in the top 25% of the range have a red background and in the bottom 25% of the range have a green background. The red background is not used when the min value is within 80% of the max value.
| dbms | 256us | 1ms | 4ms | 16ms | 64ms | 256ms | 1s | 4s | 16s | gt | max |
|---|---|---|---|---|---|---|---|---|---|---|---|
| my5651_rel_o2nofp.cz12a_c8r32 | 0.024 | 94.983 | 4.772 | 0.219 | 0.001 | 0.001 | 0.574 | ||||
| my5744_rel_o2nofp.cz12a_c8r32 | 0.004 | 99.677 | 0.285 | 0.034 | 0.049 | ||||||
| my8044_rel_o2nofp.cz12a_c8r32 | 99.404 | 0.544 | 0.051 | 0.001 | 0.466 | ||||||
| my8407_rel_o2nofp.cz12a_c8r32 | 99.369 | 0.585 | 0.044 | 0.001 | 0.001 | 0.468 | |||||
| my9400_rel_o2nofp.cz12a_c8r32 | 99.350 | 0.599 | 0.046 | 0.005 | 0.104 | ||||||
| my9500_rel_o2nofp.cz12a_c8r32 | 99.364 | 0.583 | 0.051 | 0.003 | 0.492 |
Performance metrics for the DBMS listed above. Some are normalized by throughput, others are not. Legend for results is here.
ips	qps	rps	rmbps	wps	wmbps	rpq	rkbpq	wpi	wkbpi	csps	cpups	cspq	cpupq	dbgb1	dbgb2	rss	maxop	p50	p99	tag
1975	0	9384	145.8	16394.7	382.2	4.751	75.581	8.300	198.112	45500	16.5	23.034	668	144.5	175.0	24.7	0.697	1850	1200	my5651_rel_o2nofp.cz12a_c8r32
3003	0	13870	216.7	18840.3	560.2	4.619	73.901	6.274	191.029	36919	22.2	12.294	591	144.6	175.1	25.1	0.113	3000	1600	my5744_rel_o2nofp.cz12a_c8r32
3074	0	11435	178.7	16790.9	505.3	3.719	59.506	5.461	168.300	75710	21.7	24.625	565	148.8	179.6	25.4	0.474	2900	1750	my8044_rel_o2nofp.cz12a_c8r32
3035	0	11308	176.7	16592.3	498.6	3.726	59.614	5.467	168.240	76794	21.6	25.304	569	148.7	217.1	25.4	0.500	2850	1700	my8407_rel_o2nofp.cz12a_c8r32
2994	0	11170	174.5	16392.6	493.1	3.731	59.694	5.475	168.660	75995	21.4	25.383	572	148.7	217.0	24.5	0.477	2850	1650	my9400_rel_o2nofp.cz12a_c8r32
3026	0	11282	176.3	16545.3	497.1	3.729	59.659	5.468	168.228	76245	21.7	25.199	574	148.8	217.1	25.5	0.493	2850	1700	my9500_rel_o2nofp.cz12a_c8r32
Average values from iostat.
r/s	rkB/s	rrqm/s	%rrqm	r_await	rareq-s	w/s	wkB/s	wrqm/s	%wrqm	w_await	wareq-s	d/s	dkB/s	drqm/s	%drqm	d_await	dareq-s	f/s	f_await	aqu-sz	%util
9397.2	149511	0.000	0.000	0.102	15.91	16407.4	389368	16.42	0.142	0.038	24.98	0.002	0.083	0.000	0.000	0.007	0.406	3.948	2.508	1.496	72.27		my5651_rel_o2nofp.cz12a_c8r32
13880.7	222090	0.000	0.000	0.151	16.00	18905.8	575401	37.25	0.331	0.143	31.39	0.004	0.027	0.000	0.000	0.009	0.121	9.795	3.264	4.791	79.65		my5744_rel_o2nofp.cz12a_c8r32
11446.2	183137	0.000	0.000	0.152	16.00	16846.7	518881	48.20	0.396	1.890	31.43	0.013	0.432	0.000	0.000	0.017	0.726	10.18	3.548	33.80	74.31		my8044_rel_o2nofp.cz12a_c8r32
11319.1	181103	0.000	0.000	0.150	16.00	16644.7	511942	63.69	0.481	2.098	31.34	0.018	0.791	0.000	0.000	0.025	2.116	10.02	3.633	36.86	74.03		my8407_rel_o2nofp.cz12a_c8r32
11182.6	178921	0.007	0.000	0.156	16.00	16446.0	506362	36.51	0.348	2.087	31.52	0.015	0.956	0.000	0.000	0.019	2.078	9.928	3.635	36.48	73.65		my9400_rel_o2nofp.cz12a_c8r32
11292.6	180680	0.000	0.000	0.157	16.00	16599.8	510419	50.51	0.413	2.106	31.45	0.014	0.855	0.000	0.000	0.022	1.825	10.11	3.689	37.10	73.77		my9500_rel_o2nofp.cz12a_c8r32
l.i2
l.i2: continue load after secondary indexes created with 5 inserts per transaction. Graphs for performance per 1-second interval are here.
Average throughput:
Insert response time histogram: each cell has the percentage of responses that take <= the time in the header and max is the max response time in seconds. For the max column values in the top 25% of the range have a red background and in the bottom 25% of the range have a green background. The red background is not used when the min value is within 80% of the max value.
| dbms | 256us | 1ms | 4ms | 16ms | 64ms | 256ms | 1s | 4s | 16s | gt | max |
|---|---|---|---|---|---|---|---|---|---|---|---|
| my5651_rel_o2nofp.cz12a_c8r32 | 0.386 | 16.956 | 72.162 | 10.281 | 0.215 | 0.035 | |||||
| my5744_rel_o2nofp.cz12a_c8r32 | 0.789 | 56.744 | 38.871 | 3.562 | 0.034 | 0.039 | |||||
| my8044_rel_o2nofp.cz12a_c8r32 | 0.001 | 55.420 | 41.381 | 3.159 | 0.039 | 0.048 | |||||
| my8407_rel_o2nofp.cz12a_c8r32 | 55.695 | 41.160 | 3.110 | 0.036 | 0.044 | ||||||
| my9400_rel_o2nofp.cz12a_c8r32 | 53.611 | 43.108 | 3.228 | 0.053 | 0.052 | ||||||
| my9500_rel_o2nofp.cz12a_c8r32 | 50.318 | 46.282 | 3.349 | 0.051 | 0.031 |
Delete response time histogram: each cell has the percentage of responses that take <= the time in the header and max is the max response time in seconds. For the max column values in the top 25% of the range have a red background and in the bottom 25% of the range have a green background. The red background is not used when the min value is within 80% of the max value.
| dbms | 256us | 1ms | 4ms | 16ms | 64ms | 256ms | 1s | 4s | 16s | gt | max |
|---|---|---|---|---|---|---|---|---|---|---|---|
| my5651_rel_o2nofp.cz12a_c8r32 | 4.109 | 74.066 | 20.787 | 0.988 | 0.051 | 0.031 | |||||
| my5744_rel_o2nofp.cz12a_c8r32 | 38.399 | 61.453 | 0.122 | 0.025 | 0.001 | 0.024 | |||||
| my8044_rel_o2nofp.cz12a_c8r32 | 98.119 | 1.758 | 0.113 | 0.009 | 0.029 | ||||||
| my8407_rel_o2nofp.cz12a_c8r32 | 0.001 | 98.276 | 1.615 | 0.102 | 0.006 | 0.032 | |||||
| my9400_rel_o2nofp.cz12a_c8r32 | 98.145 | 1.720 | 0.127 | 0.009 | 0.040 | ||||||
| my9500_rel_o2nofp.cz12a_c8r32 | 97.744 | 2.097 | 0.149 | 0.010 | 0.062 |
Performance metrics for the DBMS listed above. Some are normalized by throughput, others are not. Legend for results is here.
ips	qps	rps	rmbps	wps	wmbps	rpq	rkbpq	wpi	wkbpi	csps	cpups	cspq	cpupq	dbgb1	dbgb2	rss	maxop	p50	p99	tag
2198	0	9893	146.5	15586.5	366.3	4.501	68.240	7.092	170.668	59892	24.2	27.251	881	144.5	175.0	24.7	0.035	2190	1940	my5651_rel_o2nofp.cz12a_c8r32
3906	0	15695	245.2	21534.2	621.1	4.018	64.288	5.513	162.808	59863	31.0	15.325	635	144.6	175.1	25.1	0.039	3970	3055	my5744_rel_o2nofp.cz12a_c8r32
3968	0	10903	170.4	16728.2	486.3	2.748	43.962	4.216	125.498	96100	29.2	24.218	589	148.9	179.8	25.4	0.048	3925	3535	my8044_rel_o2nofp.cz12a_c8r32
4000	0	10852	169.6	16704.9	484.9	2.713	43.408	4.176	124.136	97172	29.6	24.293	592	148.9	217.5	25.4	0.044	3925	3545	my8407_rel_o2nofp.cz12a_c8r32
3861	0	10658	166.5	16315.4	474.5	2.760	44.165	4.226	125.843	95973	28.9	24.857	599	148.9	217.5	24.5	0.052	3805	3375	my9400_rel_o2nofp.cz12a_c8r32
3802	0	10686	167.0	16372.4	475.2	2.811	44.968	4.306	127.973	96428	29.4	25.361	619	148.8	217.4	25.5	0.031	3750	3435	my9500_rel_o2nofp.cz12a_c8r32
Average values from iostat.
r/s	rkB/s	rrqm/s	%rrqm	r_await	rareq-s	w/s	wkB/s	wrqm/s	%wrqm	w_await	wareq-s	d/s	dkB/s	drqm/s	%drqm	d_await	dareq-s	f/s	f_await	aqu-sz	%util
9866.7	149567	0.000	0.000	0.118	15.16	15550.4	374683	10.42	0.067	0.041	24.10	0.038	1.467	0.000	0.000	0.100	3.867	3.769	3.050	1.797	75.27		my5651_rel_o2nofp.cz12a_c8r32
15697.2	251155	0.000	0.000	0.176	16.00	21560.0	636728	19.36	0.090	0.117	29.53	0.032	0.320	0.000	0.000	0.130	1.280	6.420	3.680	5.259	81.04		my5744_rel_o2nofp.cz12a_c8r32
10892.1	174272	0.000	0.000	0.174	16.00	16723.9	497891	12.16	0.072	1.894	29.77	0.008	0.033	0.000	0.000	0.020	0.082	5.682	4.022	33.57	69.69		my8044_rel_o2nofp.cz12a_c8r32
10846.8	173548	0.000	0.000	0.158	16.00	16689.7	496121	26.98	0.161	2.025	29.72	0.008	0.473	0.000	0.000	0.010	1.184	5.910	4.065	35.54	69.45		my8407_rel_o2nofp.cz12a_c8r32
10650.3	170404	0.000	0.000	0.175	16.00	16309.1	485680	2.412	0.016	2.055	29.78	0.000	0.000	0.000	0.000	0.000	0.000	5.656	4.239	35.41	68.86		my9400_rel_o2nofp.cz12a_c8r32
10675.7	170810	0.000	0.000	0.170	16.00	16359.0	486209	14.15	0.087	2.060	29.72	0.000	0.000	0.000	0.000	0.000	0.000	5.447	4.157	35.54	68.53		my9500_rel_o2nofp.cz12a_c8r32
qr100.L1
qr100.L1: range queries with 100 insert/s per client. Graphs for performance per 1-second interval are here.
Average throughput:
Query response time histogram: each cell has the percentage of responses that take <= the time in the header and max is the max response time in seconds. For max values in the top 25% of the range have a red background and in the bottom 25% of the range have a green background. The red background is not used when the min value is within 80% of the max value.
| dbms | 256us | 1ms | 4ms | 16ms | 64ms | 256ms | 1s | 4s | 16s | gt | max |
|---|---|---|---|---|---|---|---|---|---|---|---|
| my5651_rel_o2nofp.cz12a_c8r32 | 99.759 | 0.205 | 0.026 | 0.009 | nonzero | 0.032 | |||||
| my5744_rel_o2nofp.cz12a_c8r32 | 99.917 | 0.074 | 0.004 | 0.005 | 0.011 | ||||||
| my8044_rel_o2nofp.cz12a_c8r32 | 99.981 | 0.018 | nonzero | nonzero | 0.009 | ||||||
| my8407_rel_o2nofp.cz12a_c8r32 | 99.979 | 0.020 | nonzero | nonzero | 0.010 | ||||||
| my9400_rel_o2nofp.cz12a_c8r32 | 99.979 | 0.020 | nonzero | 0.001 | 0.012 | ||||||
| my9500_rel_o2nofp.cz12a_c8r32 | 99.980 | 0.020 | nonzero | nonzero | 0.012 |
Insert response time histogram: each cell has the percentage of responses that take <= the time in the header and max is the max response time in seconds. For max values in the top 25% of the range have a red background and in the bottom 25% of the range have a green background. The red background is not used when the min value is within 80% of the max value.
| dbms | 256us | 1ms | 4ms | 16ms | 64ms | 256ms | 1s | 4s | 16s | gt | max |
|---|---|---|---|---|---|---|---|---|---|---|---|
| my5651_rel_o2nofp.cz12a_c8r32 | 47.500 | 51.083 | 1.417 | 0.131 | |||||||
| my5744_rel_o2nofp.cz12a_c8r32 | 78.778 | 21.222 | 0.022 | ||||||||
| my8044_rel_o2nofp.cz12a_c8r32 | 65.722 | 34.278 | 0.027 | ||||||||
| my8407_rel_o2nofp.cz12a_c8r32 | 68.194 | 31.806 | 0.027 | ||||||||
| my9400_rel_o2nofp.cz12a_c8r32 | 58.889 | 41.111 | 0.027 | ||||||||
| my9500_rel_o2nofp.cz12a_c8r32 | 57.111 | 42.889 | 0.027 |
Delete response time histogram: each cell has the percentage of responses that take <= the time in the header and max is the max response time in seconds. For max values in the top 25% of the range have a red background and in the bottom 25% of the range have a green background. The red background is not used when the min value is within 80% of the max value.
| dbms | 256us | 1ms | 4ms | 16ms | 64ms | 256ms | 1s | 4s | 16s | gt | max |
|---|---|---|---|---|---|---|---|---|---|---|---|
| my5651_rel_o2nofp.cz12a_c8r32 | 1.250 | 14.972 | 75.611 | 7.889 | 0.278 | 0.101 | |||||
| my5744_rel_o2nofp.cz12a_c8r32 | 31.917 | 67.333 | 0.750 | 0.012 | |||||||
| my8044_rel_o2nofp.cz12a_c8r32 | 92.194 | 7.806 | 0.012 | ||||||||
| my8407_rel_o2nofp.cz12a_c8r32 | 92.972 | 7.028 | 0.011 | ||||||||
| my9400_rel_o2nofp.cz12a_c8r32 | 90.583 | 9.417 | 0.012 | ||||||||
| my9500_rel_o2nofp.cz12a_c8r32 | 90.861 | 9.111 | 0.028 | 0.021 |
Performance metrics for the DBMS listed above. Some are normalized by throughput, others are not. Legend for results is here.
ips	qps	rps	rmbps	wps	wmbps	rpq	rkbpq	wpi	wkbpi	csps	cpups	cspq	cpupq	dbgb1	dbgb2	rss	maxop	p50	p99	tag
100	12027	468	7.3	1112.3	31.2	0.039	0.618	11.135	320.022	70529	12.1	5.864	80	144.5	175.0	24.7	0.032	12126	10719	my5651_rel_o2nofp.cz12a_c8r32
100	10067	466	7.3	286.0	8.3	0.046	0.740	2.860	85.385	58593	12.6	5.820	100	144.6	175.1	25.1	0.011	10127	9375	my5744_rel_o2nofp.cz12a_c8r32
100	9115	417	6.5	305.0	8.8	0.046	0.732	3.050	90.362	53993	12.7	5.923	111	148.9	179.8	25.3	0.009	9119	8943	my8044_rel_o2nofp.cz12a_c8r32
100	8850	418	6.5	306.8	8.9	0.047	0.755	3.068	90.764	52489	13.4	5.931	121	148.9	217.5	25.4	0.010	8863	8703	my8407_rel_o2nofp.cz12a_c8r32
100	9075	418	6.5	306.0	8.9	0.046	0.737	3.063	90.972	53787	13.2	5.927	116	148.9	217.5	24.5	0.012	9087	8943	my9400_rel_o2nofp.cz12a_c8r32
100	9080	419	6.5	312.9	9.0	0.046	0.738	3.132	92.563	53837	12.9	5.929	114	148.8	217.4	25.5	0.012	9103	8911	my9500_rel_o2nofp.cz12a_c8r32
Average values from iostat.
r/s	rkB/s	rrqm/s	%rrqm	r_await	rareq-s	w/s	wkB/s	wrqm/s	%wrqm	w_await	wareq-s	d/s	dkB/s	drqm/s	%drqm	d_await	dareq-s	f/s	f_await	aqu-sz	%util
448.5	7120.9	0.000	0.000	0.673	15.87	1111.6	31947.8	6.544	7.080	1.122	42.03	0.000	0.000	0.000	0.000	0.000	0.000	2.860	1.464	0.363	6.294		my5651_rel_o2nofp.cz12a_c8r32
446.4	7141.9	0.000	0.000	2.070	16.00	283.4	8465.4	3.811	2.158	0.263	30.87	0.000	0.000	0.000	0.000	0.000	0.000	1.403	1.629	0.922	4.131		my5744_rel_o2nofp.cz12a_c8r32
414.5	6631.9	0.000	0.000	0.698	16.00	302.2	8956.0	0.942	0.484	0.524	30.41	0.000	0.000	0.000	0.000	0.000	0.000	2.208	1.887	0.407	5.886		my8044_rel_o2nofp.cz12a_c8r32
414.8	6637.4	0.000	0.000	0.622	16.00	304.6	9011.5	1.051	0.519	0.541	30.37	0.000	0.000	0.000	0.000	0.000	0.000	2.328	1.806	0.385	6.280		my8407_rel_o2nofp.cz12a_c8r32
415.6	6649.1	0.000	0.000	1.018	16.00	303.4	9014.9	0.903	0.490	0.225	30.56	0.000	0.000	0.000	0.000	0.000	0.000	1.774	1.854	0.485	4.527		my9400_rel_o2nofp.cz12a_c8r32
416.3	6660.3	0.000	0.000	0.794	16.00	310.3	9172.2	1.017	0.510	0.171	30.34	0.000	0.000	0.000	0.000	0.000	0.000	2.603	1.795	0.392	4.039		my9500_rel_o2nofp.cz12a_c8r32
qp100.L2
qp100.L2: point queries with 100 insert/s per client. Graphs for performance per 1-second interval are here.
Average throughput:
Query response time histogram: each cell has the percentage of responses that take <= the time in the header and max is the max response time in seconds. For max values in the top 25% of the range have a red background and in the bottom 25% of the range have a green background. The red background is not used when the min value is within 80% of the max value.
| dbms | 256us | 1ms | 4ms | 16ms | 64ms | 256ms | 1s | 4s | 16s | gt | max |
|---|---|---|---|---|---|---|---|---|---|---|---|
| my5651_rel_o2nofp.cz12a_c8r32 | 0.159 | 98.393 | 1.442 | 0.005 | 0.011 | ||||||
| my5744_rel_o2nofp.cz12a_c8r32 | 0.118 | 94.857 | 4.981 | 0.044 | 0.015 | ||||||
| my8044_rel_o2nofp.cz12a_c8r32 | 0.010 | 93.790 | 6.098 | 0.103 | nonzero | 0.025 | |||||
| my8407_rel_o2nofp.cz12a_c8r32 | 0.008 | 92.662 | 7.275 | 0.056 | 0.014 | ||||||
| my9400_rel_o2nofp.cz12a_c8r32 | 0.009 | 91.696 | 8.173 | 0.123 | nonzero | 0.016 | |||||
| my9500_rel_o2nofp.cz12a_c8r32 | 0.008 | 92.875 | 6.996 | 0.120 | nonzero | 0.018 |
Insert response time histogram: each cell has the percentage of responses that take <= the time in the header and max is the max response time in seconds. For max values in the top 25% of the range have a red background and in the bottom 25% of the range have a green background. The red background is not used when the min value is within 80% of the max value.
| dbms | 256us | 1ms | 4ms | 16ms | 64ms | 256ms | 1s | 4s | 16s | gt | max |
|---|---|---|---|---|---|---|---|---|---|---|---|
| my5651_rel_o2nofp.cz12a_c8r32 | 47.611 | 52.389 | 0.054 | ||||||||
| my5744_rel_o2nofp.cz12a_c8r32 | 75.250 | 24.750 | 0.039 | ||||||||
| my8044_rel_o2nofp.cz12a_c8r32 | 97.694 | 2.306 | 0.022 | ||||||||
| my8407_rel_o2nofp.cz12a_c8r32 | 98.944 | 1.056 | 0.038 | ||||||||
| my9400_rel_o2nofp.cz12a_c8r32 | 92.778 | 7.222 | 0.049 | ||||||||
| my9500_rel_o2nofp.cz12a_c8r32 | 94.361 | 5.639 | 0.045 |
Delete response time histogram: each cell has the percentage of responses that take <= the time in the header and max is the max response time in seconds. For max values in the top 25% of the range have a red background and in the bottom 25% of the range have a green background. The red background is not used when the min value is within 80% of the max value.
| dbms | 256us | 1ms | 4ms | 16ms | 64ms | 256ms | 1s | 4s | 16s | gt | max |
|---|---|---|---|---|---|---|---|---|---|---|---|
| my5651_rel_o2nofp.cz12a_c8r32 | 0.222 | 88.167 | 11.056 | 0.556 | 0.025 | ||||||
| my5744_rel_o2nofp.cz12a_c8r32 | 99.917 | 0.083 | 0.005 | ||||||||
| my8044_rel_o2nofp.cz12a_c8r32 | 99.750 | 0.250 | 0.005 | ||||||||
| my8407_rel_o2nofp.cz12a_c8r32 | 99.750 | 0.250 | 0.010 | ||||||||
| my9400_rel_o2nofp.cz12a_c8r32 | 99.694 | 0.306 | 0.006 | ||||||||
| my9500_rel_o2nofp.cz12a_c8r32 | 99.750 | 0.222 | 0.028 | 0.046 |
Performance metrics for the DBMS listed above. Some are normalized by throughput, others are not. Legend for results is here.
ips	qps	rps	rmbps	wps	wmbps	rpq	rkbpq	wpi	wkbpi	csps	cpups	cspq	cpupq	dbgb1	dbgb2	rss	maxop	p50	p99	tag
100	1471	9971	155.7	1051.4	29.3	6.778	108.418	10.524	299.980	28281	3.9	19.226	212	144.5	175.0	24.7	0.011	1552	1024	my5651_rel_o2nofp.cz12a_c8r32
100	1351	9293	145.2	1410.5	35.1	6.879	110.069	14.105	358.969	27635	4.6	20.456	272	144.6	175.1	25.1	0.015	1408	992	my5744_rel_o2nofp.cz12a_c8r32
100	1289	8967	140.1	1276.7	35.7	6.957	111.308	12.767	365.175	27189	5.7	21.093	354	148.9	179.8	25.3	0.025	1360	944	my8044_rel_o2nofp.cz12a_c8r32
100	1279	8908	139.2	1276.0	35.6	6.966	111.449	12.760	364.706	26681	5.6	20.864	350	148.9	217.5	25.4	0.014	1344	928	my8407_rel_o2nofp.cz12a_c8r32
100	1269	8827	137.9	1280.7	35.7	6.956	111.299	12.807	366.041	26933	5.0	21.224	315	148.9	217.5	24.5	0.016	1344	928	my9400_rel_o2nofp.cz12a_c8r32
100	1275	8882	138.8	1280.4	35.6	6.964	111.425	12.816	365.242	27116	5.6	21.260	351	148.8	217.5	25.5	0.018	1344	944	my9500_rel_o2nofp.cz12a_c8r32
Average values from iostat.
r/s	rkB/s	rrqm/s	%rrqm	r_await	rareq-s	w/s	wkB/s	wrqm/s	%wrqm	w_await	wareq-s	d/s	dkB/s	drqm/s	%drqm	d_await	dareq-s	f/s	f_await	aqu-sz	%util
9969.6	159464	0.000	0.000	0.070	15.99	1054.3	30049.5	2.905	8.881	0.313	53.87	0.000	0.000	0.000	0.000	0.000	0.000	1.209	1.352	0.752	70.89		my5651_rel_o2nofp.cz12a_c8r32
9292.1	148673	0.000	0.000	0.078	16.00	1394.2	35422.9	3.293	0.320	0.037	25.29	0.003	0.040	0.000	0.000	0.011	0.201	1.131	2.740	0.761	68.43		my5744_rel_o2nofp.cz12a_c8r32
8966.0	143456	0.000	0.000	0.077	16.00	1260.8	36065.4	2.002	0.170	0.830	28.71	0.004	0.016	0.000	0.000	0.011	0.078	1.955	2.397	1.602	63.28		my8044_rel_o2nofp.cz12a_c8r32
8906.2	142499	0.000	0.000	0.074	16.00	1259.8	36010.7	3.560	0.266	0.670	28.70	0.001	0.007	0.000	0.000	0.001	0.017	1.843	1.966	1.309	62.68		my8407_rel_o2nofp.cz12a_c8r32
8826.1	141218	0.000	0.000	0.078	16.00	1265.7	36177.6	0.910	0.097	0.937	28.67	0.001	0.007	0.000	0.000	0.001	0.017	2.527	2.467	1.730	64.50		my9400_rel_o2nofp.cz12a_c8r32
8880.7	142090	0.000	0.000	0.078	16.00	1265.4	36064.7	2.513	0.210	1.017	28.59	0.001	0.007	0.000	0.000	0.001	0.017	2.604	2.451	1.796	63.07		my9500_rel_o2nofp.cz12a_c8r32
qr500.L3
qr500.L3: range queries with 500 insert/s per client. Graphs for performance per 1-second interval are here.
Average throughput:
Query response time histogram: each cell has the percentage of responses that take <= the time in the header and max is the max response time in seconds. For max values in the top 25% of the range have a red background and in the bottom 25% of the range have a green background. The red background is not used when the min value is within 80% of the max value.
| dbms | 256us | 1ms | 4ms | 16ms | 64ms | 256ms | 1s | 4s | 16s | gt | max |
|---|---|---|---|---|---|---|---|---|---|---|---|
| my5651_rel_o2nofp.cz12a_c8r32 | 99.061 | 0.826 | 0.101 | 0.013 | 0.011 | ||||||
| my5744_rel_o2nofp.cz12a_c8r32 | 99.892 | 0.079 | 0.018 | 0.011 | 0.011 | ||||||
| my8044_rel_o2nofp.cz12a_c8r32 | 99.967 | 0.032 | 0.001 | nonzero | 0.010 | ||||||
| my8407_rel_o2nofp.cz12a_c8r32 | 99.964 | 0.035 | 0.001 | nonzero | 0.009 | ||||||
| my9400_rel_o2nofp.cz12a_c8r32 | 99.963 | 0.035 | 0.001 | 0.001 | 0.011 | ||||||
| my9500_rel_o2nofp.cz12a_c8r32 | 99.964 | 0.034 | 0.001 | 0.001 | 0.011 |
Insert response time histogram: each cell has the percentage of responses that take <= the time in the header and max is the max response time in seconds. For max values in the top 25% of the range have a red background and in the bottom 25% of the range have a green background. The red background is not used when the min value is within 80% of the max value.
| dbms | 256us | 1ms | 4ms | 16ms | 64ms | 256ms | 1s | 4s | 16s | gt | max |
|---|---|---|---|---|---|---|---|---|---|---|---|
| my5651_rel_o2nofp.cz12a_c8r32 | 0.067 | 61.700 | 38.233 | 0.056 | |||||||
| my5744_rel_o2nofp.cz12a_c8r32 | 0.167 | 96.978 | 2.856 | 0.028 | |||||||
| my8044_rel_o2nofp.cz12a_c8r32 | 93.511 | 6.483 | 0.006 | 0.318 | |||||||
| my8407_rel_o2nofp.cz12a_c8r32 | 99.839 | 0.161 | 0.053 | ||||||||
| my9400_rel_o2nofp.cz12a_c8r32 | 91.844 | 8.156 | 0.027 | ||||||||
| my9500_rel_o2nofp.cz12a_c8r32 | 92.144 | 7.850 | 0.006 | 0.345 |
Delete response time histogram: each cell has the percentage of responses that take <= the time in the header and max is the max response time in seconds. For max values in the top 25% of the range have a red background and in the bottom 25% of the range have a green background. The red background is not used when the min value is within 80% of the max value.
| dbms | 256us | 1ms | 4ms | 16ms | 64ms | 256ms | 1s | 4s | 16s | gt | max |
|---|---|---|---|---|---|---|---|---|---|---|---|
| my5651_rel_o2nofp.cz12a_c8r32 | 2.672 | 7.344 | 88.867 | 1.117 | 0.028 | ||||||
| my5744_rel_o2nofp.cz12a_c8r32 | 30.089 | 69.678 | 0.233 | 0.013 | |||||||
| my8044_rel_o2nofp.cz12a_c8r32 | 99.117 | 0.883 | 0.014 | ||||||||
| my8407_rel_o2nofp.cz12a_c8r32 | 99.967 | 0.028 | 0.006 | 0.052 | |||||||
| my9400_rel_o2nofp.cz12a_c8r32 | 99.283 | 0.717 | 0.011 | ||||||||
| my9500_rel_o2nofp.cz12a_c8r32 | 99.000 | 0.994 | 0.006 | 0.022 |
Performance metrics for the DBMS listed above. Some are normalized by throughput, others are not. Legend for results is here.
ips	qps	rps	rmbps	wps	wmbps	rpq	rkbpq	wpi	wkbpi	csps	cpups	cspq	cpupq	dbgb1	dbgb2	rss	maxop	p50	p99	tag
500	11348	2408	37.4	2379.5	68.5	0.212	3.379	4.762	140.294	72992	15.0	6.432	106	144.5	175.0	24.7	0.011	11439	9999	my5651_rel_o2nofp.cz12a_c8r32
500	9902	2377	37.1	2346.4	67.7	0.240	3.841	4.693	138.577	61762	14.3	6.237	116	144.6	175.1	25.1	0.011	9967	8383	my5744_rel_o2nofp.cz12a_c8r32
500	9012	2412	37.7	2470.5	71.2	0.268	4.282	4.944	145.851	61428	15.4	6.816	137	148.9	179.8	25.3	0.010	9023	8879	my8044_rel_o2nofp.cz12a_c8r32
500	8759	2413	37.7	2480.6	71.3	0.275	4.407	4.961	146.097	60016	15.4	6.852	141	148.9	217.6	25.3	0.009	8767	8639	my8407_rel_o2nofp.cz12a_c8r32
500	9059	2412	37.7	2468.4	71.1	0.266	4.261	4.937	145.635	61885	15.2	6.831	134	148.9	217.6	24.5	0.011	9071	8927	my9400_rel_o2nofp.cz12a_c8r32
500	8965	2412	37.7	2478.9	71.2	0.269	4.304	4.961	145.920	61793	15.6	6.893	139	148.8	217.5	25.5	0.011	8975	8815	my9500_rel_o2nofp.cz12a_c8r32
Average values from iostat.
r/s	rkB/s	rrqm/s	%rrqm	r_await	rareq-s	w/s	wkB/s	wrqm/s	%wrqm	w_await	wareq-s	d/s	dkB/s	drqm/s	%drqm	d_await	dareq-s	f/s	f_await	aqu-sz	%util
2383.1	37942.1	0.000	0.000	0.325	15.92	2384.7	70250.9	4.287	0.343	0.071	31.63	0.007	0.027	0.000	0.000	0.017	0.134	1.460	1.390	0.859	13.03		my5651_rel_o2nofp.cz12a_c8r32
2353.4	37654.9	0.000	0.000	0.686	16.00	2350.4	69407.1	4.328	0.264	0.065	30.09	0.003	0.033	0.000	0.000	0.011	0.167	1.530	1.726	1.673	12.01		my5744_rel_o2nofp.cz12a_c8r32
2406.3	38500.2	0.000	0.000	0.517	16.00	2476.1	73044.6	3.346	0.152	0.343	30.09	0.006	0.025	0.000	0.000	0.022	0.123	2.049	1.637	1.895	13.88		my8044_rel_o2nofp.cz12a_c8r32
2407.2	38515.5	0.000	0.000	0.430	16.00	2486.4	73214.7	6.686	0.280	0.374	30.04	0.003	0.027	0.000	0.000	0.011	0.134	2.426	1.761	1.790	13.28		my8407_rel_o2nofp.cz12a_c8r32
2406.9	38510.4	0.000	0.000	0.590	16.00	2474.0	72979.4	1.084	0.063	0.226	30.10	0.003	0.011	0.000	0.000	0.006	0.056	1.982	1.592	1.882	13.12		my9400_rel_o2nofp.cz12a_c8r32
2406.1	38497.3	0.000	0.000	0.493	16.00	2484.6	73079.5	3.988	0.179	0.281	29.98	0.000	0.000	0.000	0.000	0.000	0.000	2.785	1.695	1.737	12.81		my9500_rel_o2nofp.cz12a_c8r32
qp500.L4
qp500.L4: point queries with 500 insert/s per client. Graphs for performance per 1-second interval are here.
Average throughput:
Query response time histogram: each cell has the percentage of responses that take <= the time in the header and max is the max response time in seconds. For max values in the top 25% of the range have a red background and in the bottom 25% of the range have a green background. The red background is not used when the min value is within 80% of the max value.
| dbms | 256us | 1ms | 4ms | 16ms | 64ms | 256ms | 1s | 4s | 16s | gt | max |
|---|---|---|---|---|---|---|---|---|---|---|---|
| my5651_rel_o2nofp.cz12a_c8r32 | 0.011 | 81.780 | 17.988 | 0.220 | nonzero | 0.020 | |||||
| my5744_rel_o2nofp.cz12a_c8r32 | 0.005 | 82.675 | 17.012 | 0.308 | 0.001 | 0.024 | |||||
| my8044_rel_o2nofp.cz12a_c8r32 | nonzero | 87.710 | 11.708 | 0.581 | 0.001 | 0.038 | |||||
| my8407_rel_o2nofp.cz12a_c8r32 | nonzero | 85.994 | 13.403 | 0.601 | 0.001 | 0.023 | |||||
| my9400_rel_o2nofp.cz12a_c8r32 | nonzero | 85.694 | 13.697 | 0.607 | 0.002 | 0.029 | |||||
| my9500_rel_o2nofp.cz12a_c8r32 | nonzero | 85.798 | 13.601 | 0.599 | 0.002 | nonzero | 0.128 |
Insert response time histogram: each cell has the percentage of responses that take <= the time in the header and max is the max response time in seconds. For max values in the top 25% of the range have a red background and in the bottom 25% of the range have a green background. The red background is not used when the min value is within 80% of the max value.
| dbms | 256us | 1ms | 4ms | 16ms | 64ms | 256ms | 1s | 4s | 16s | gt | max |
|---|---|---|---|---|---|---|---|---|---|---|---|
| my5651_rel_o2nofp.cz12a_c8r32 | 0.006 | 53.756 | 44.156 | 2.083 | 0.095 | ||||||
| my5744_rel_o2nofp.cz12a_c8r32 | 0.006 | 89.361 | 10.628 | 0.006 | 0.077 | ||||||
| my8044_rel_o2nofp.cz12a_c8r32 | 89.972 | 10.028 | 0.057 | ||||||||
| my8407_rel_o2nofp.cz12a_c8r32 | 93.217 | 6.783 | 0.046 | ||||||||
| my9400_rel_o2nofp.cz12a_c8r32 | 94.839 | 5.161 | 0.058 | ||||||||
| my9500_rel_o2nofp.cz12a_c8r32 | 93.239 | 6.761 | 0.047 |
Delete response time histogram: each cell has the percentage of responses that take <= the time in the header and max is the max response time in seconds. For max values in the top 25% of the range have a red background and in the bottom 25% of the range have a green background. The red background is not used when the min value is within 80% of the max value.
| dbms | 256us | 1ms | 4ms | 16ms | 64ms | 256ms | 1s | 4s | 16s | gt | max |
|---|---|---|---|---|---|---|---|---|---|---|---|
| my5651_rel_o2nofp.cz12a_c8r32 | 0.067 | 21.783 | 62.294 | 15.844 | 0.011 | 0.065 | |||||
| my5744_rel_o2nofp.cz12a_c8r32 | 0.644 | 99.056 | 0.300 | 0.012 | |||||||
| my8044_rel_o2nofp.cz12a_c8r32 | 99.917 | 0.078 | 0.006 | 0.017 | |||||||
| my8407_rel_o2nofp.cz12a_c8r32 | 99.617 | 0.378 | 0.006 | 0.017 | |||||||
| my9400_rel_o2nofp.cz12a_c8r32 | 99.867 | 0.128 | 0.006 | 0.019 | |||||||
| my9500_rel_o2nofp.cz12a_c8r32 | 99.883 | 0.111 | 0.006 | 0.022 |
Performance metrics for the DBMS listed above. Some are normalized by throughput, others are not. Legend for results is here.
ips	qps	rps	rmbps	wps	wmbps	rpq	rkbpq	wpi	wkbpi	csps	cpups	cspq	cpupq	dbgb1	dbgb2	rss	maxop	p50	p99	tag
500	1145	11219	175.1	4112.1	113.2	9.798	156.577	8.229	232.056	32298	9.2	28.208	643	144.5	175.0	24.7	0.020	1168	800	my5651_rel_o2nofp.cz12a_c8r32
500	1110	11052	172.7	4533.6	111.1	9.953	159.251	9.073	227.608	33894	6.7	30.524	483	144.6	175.1	25.1	0.024	1120	832	my5744_rel_o2nofp.cz12a_c8r32
500	1128	11173	174.6	4026.6	114.0	9.909	158.548	8.058	233.597	38289	7.8	33.960	553	148.9	179.8	25.3	0.038	1152	928	my8044_rel_o2nofp.cz12a_c8r32
500	1117	11089	173.3	4035.6	114.1	9.928	158.851	8.071	233.686	38611	7.8	34.570	559	148.9	217.7	25.3	0.023	1152	928	my8407_rel_o2nofp.cz12a_c8r32
500	1112	11078	173.1	4021.7	113.9	9.958	159.336	8.043	233.222	38227	7.7	34.364	554	148.9	217.7	24.5	0.029	1136	928	my9400_rel_o2nofp.cz12a_c8r32
500	1115	11082	173.2	4037.5	114.0	9.935	158.965	8.075	233.436	38360	7.8	34.391	559	148.8	217.6	25.5	0.128	1152	912	my9500_rel_o2nofp.cz12a_c8r32
Average values from iostat.
r/s	rkB/s	rrqm/s	%rrqm	r_await	rareq-s	w/s	wkB/s	wrqm/s	%wrqm	w_await	wareq-s	d/s	dkB/s	drqm/s	%drqm	d_await	dareq-s	f/s	f_await	aqu-sz	%util
11223.2	179352	0.000	0.000	0.076	15.98	4096.3	115716	4.256	0.109	0.042	28.75	0.007	0.027	0.000	0.000	0.019	0.134	1.486	2.368	1.031	71.48		my5651_rel_o2nofp.cz12a_c8r32
11052.5	176840	0.000	0.000	0.087	16.00	4520.9	113370	4.521	0.101	0.059	25.44	0.003	0.033	0.000	0.000	0.014	0.167	1.842	3.096	1.237	73.36		my5744_rel_o2nofp.cz12a_c8r32
11174.0	178784	0.000	0.000	0.085	16.00	4014.0	116374	5.229	0.131	1.327	29.01	0.003	0.013	0.000	0.000	0.008	0.067	2.359	2.858	6.094	69.38		my8044_rel_o2nofp.cz12a_c8r32
11089.7	177435	0.000	0.000	0.085	16.00	4021.5	116445	11.31	0.280	1.435	28.97	0.010	0.080	0.000	0.000	0.042	0.401	2.587	2.903	6.523	69.11		my8407_rel_o2nofp.cz12a_c8r32
11078.9	177262	0.000	0.000	0.085	16.00	4007.8	116219	1.152	0.030	1.428	29.02	0.008	0.031	0.000	0.000	0.036	0.156	2.467	2.971	6.440	70.70		my9400_rel_o2nofp.cz12a_c8r32
11082.9	177326	0.000	0.000	0.084	16.00	4024.8	116359	6.599	0.165	1.456	28.93	0.004	0.203	0.000	0.000	0.011	1.014	2.563	2.939	6.582	69.37		my9500_rel_o2nofp.cz12a_c8r32
qr1000.L5
qr1000.L5: range queries with 1000 insert/s per client. Graphs for performance per 1-second interval are here.
Average throughput:
Query response time histogram: each cell has the percentage of responses that take <= the time in the header and max is the max response time in seconds. For max values in the top 25% of the range have a red background and in the bottom 25% of the range have a green background. The red background is not used when the min value is within 80% of the max value.
| dbms | 256us | 1ms | 4ms | 16ms | 64ms | 256ms | 1s | 4s | 16s | gt | max |
|---|---|---|---|---|---|---|---|---|---|---|---|
| my5651_rel_o2nofp.cz12a_c8r32 | 98.144 | 1.650 | 0.192 | 0.014 | 0.016 | ||||||
| my5744_rel_o2nofp.cz12a_c8r32 | 99.877 | 0.098 | 0.014 | 0.011 | 0.012 | ||||||
| my8044_rel_o2nofp.cz12a_c8r32 | 99.948 | 0.050 | 0.002 | nonzero | 0.010 | ||||||
| my8407_rel_o2nofp.cz12a_c8r32 | 99.940 | 0.058 | 0.002 | 0.001 | 0.009 | ||||||
| my9400_rel_o2nofp.cz12a_c8r32 | 99.945 | 0.053 | 0.002 | nonzero | nonzero | 0.036 | |||||
| my9500_rel_o2nofp.cz12a_c8r32 | 99.943 | 0.055 | 0.002 | nonzero | 0.009 |
Insert response time histogram: each cell has the percentage of responses that take <= the time in the header and max is the max response time in seconds. For max values in the top 25% of the range have a red background and in the bottom 25% of the range have a green background. The red background is not used when the min value is within 80% of the max value.
| dbms | 256us | 1ms | 4ms | 16ms | 64ms | 256ms | 1s | 4s | 16s | gt | max |
|---|---|---|---|---|---|---|---|---|---|---|---|
| my5651_rel_o2nofp.cz12a_c8r32 | 0.239 | 73.417 | 26.311 | 0.033 | 0.094 | ||||||
| my5744_rel_o2nofp.cz12a_c8r32 | 0.775 | 98.764 | 0.461 | 0.036 | |||||||
| my8044_rel_o2nofp.cz12a_c8r32 | 0.053 | 98.231 | 1.717 | 0.032 | |||||||
| my8407_rel_o2nofp.cz12a_c8r32 | 0.022 | 97.731 | 2.247 | 0.033 | |||||||
| my9400_rel_o2nofp.cz12a_c8r32 | 0.022 | 98.494 | 1.483 | 0.041 | |||||||
| my9500_rel_o2nofp.cz12a_c8r32 | 0.044 | 98.469 | 1.486 | 0.035 |
Delete response time histogram: each cell has the percentage of responses that take <= the time in the header and max is the max response time in seconds. For max values in the top 25% of the range have a red background and in the bottom 25% of the range have a green background. The red background is not used when the min value is within 80% of the max value.
| dbms | 256us | 1ms | 4ms | 16ms | 64ms | 256ms | 1s | 4s | 16s | gt | max |
|---|---|---|---|---|---|---|---|---|---|---|---|
| my5651_rel_o2nofp.cz12a_c8r32 | 0.450 | 28.556 | 69.825 | 1.169 | 0.041 | ||||||
| my5744_rel_o2nofp.cz12a_c8r32 | 13.308 | 84.708 | 1.983 | 0.015 | |||||||
| my8044_rel_o2nofp.cz12a_c8r32 | 99.667 | 0.333 | 0.011 | ||||||||
| my8407_rel_o2nofp.cz12a_c8r32 | 99.744 | 0.256 | 0.011 | ||||||||
| my9400_rel_o2nofp.cz12a_c8r32 | 99.639 | 0.353 | 0.008 | 0.039 | |||||||
| my9500_rel_o2nofp.cz12a_c8r32 | 99.775 | 0.219 | 0.006 | 0.038 |
Performance metrics for the DBMS listed above. Some are normalized by throughput, others are not. Legend for results is here.
ips	qps	rps	rmbps	wps	wmbps	rpq	rkbpq	wpi	wkbpi	csps	cpups	cspq	cpupq	dbgb1	dbgb2	rss	maxop	p50	p99	tag
999	10547	4290	66.6	5092.2	145.5	0.407	6.467	5.095	149.086	75136	17.7	7.124	134	144.5	175.0	24.7	0.016	10687	7775	my5651_rel_o2nofp.cz12a_c8r32
999	9779	4240	66.2	5157.8	147.4	0.434	6.937	5.161	151.017	66282	17.2	6.778	141	144.6	175.1	25.1	0.012	9855	8415	my5744_rel_o2nofp.cz12a_c8r32
1000	8965	4244	66.3	5206.1	149.1	0.473	7.574	5.206	152.674	70734	18.5	7.890	165	148.9	179.8	25.3	0.010	8975	8799	my8044_rel_o2nofp.cz12a_c8r32
1000	8612	4250	66.4	5226.2	149.4	0.493	7.895	5.226	153.028	68764	18.4	7.985	171	148.9	217.9	25.3	0.009	8623	8463	my8407_rel_o2nofp.cz12a_c8r32
1000	8953	4247	66.4	5213.8	149.3	0.474	7.590	5.214	152.871	71036	17.9	7.935	160	148.9	217.8	24.5	0.036	8959	8783	my9400_rel_o2nofp.cz12a_c8r32
1000	8894	4248	66.4	5222.1	149.2	0.478	7.642	5.222	152.800	70301	18.6	7.904	167	148.8	217.8	25.5	0.009	8911	8735	my9500_rel_o2nofp.cz12a_c8r32
Average values from iostat.
r/s	rkB/s	rrqm/s	%rrqm	r_await	rareq-s	w/s	wkB/s	wrqm/s	%wrqm	w_await	wareq-s	d/s	dkB/s	drqm/s	%drqm	d_await	dareq-s	f/s	f_await	aqu-sz	%util
4268.2	67864.5	0.000	0.000	0.173	15.90	5087.3	148857	6.525	0.130	0.034	29.34	0.014	0.058	0.000	0.000	0.042	0.290	2.240	1.504	0.892	21.93		my5651_rel_o2nofp.cz12a_c8r32
4217.2	67475.5	0.000	0.000	0.357	16.00	5161.9	151046	5.646	0.112	0.048	29.32	0.002	0.027	0.000	0.000	0.006	0.134	2.170	1.514	1.713	18.95		my5744_rel_o2nofp.cz12a_c8r32
4238.7	67818.9	0.000	0.000	0.317	16.00	5214.5	152914	5.220	0.103	0.268	29.39	0.001	0.004	0.000	0.000	0.003	0.022	2.238	1.456	2.563	21.39		my8044_rel_o2nofp.cz12a_c8r32
4244.5	67912.4	0.000	0.000	0.381	16.00	5235.3	153289	11.53	0.224	0.257	29.34	0.017	0.136	0.000	0.000	0.042	0.643	2.219	1.358	2.781	21.23		my8407_rel_o2nofp.cz12a_c8r32
4242.0	67871.1	0.000	0.000	0.303	16.00	5222.4	153119	1.182	0.025	0.279	29.39	0.013	0.056	0.000	0.000	0.039	0.249	2.298	1.503	2.512	21.63		my9400_rel_o2nofp.cz12a_c8r32
4242.7	67883.4	0.000	0.000	0.274	16.00	5230.7	153044	6.422	0.126	0.300	29.32	0.013	0.615	0.000	0.000	0.045	2.956	2.345	1.560	2.538	21.89		my9500_rel_o2nofp.cz12a_c8r32
qp1000.L6
qp1000.L6: point queries with 1000 insert/s per client. Graphs for performance per 1-second interval are here.
Average throughput:
Query response time histogram: each cell has the percentage of responses that take <= the time in the header and max is the max response time in seconds. For max values in the top 25% of the range have a red background and in the bottom 25% of the range have a green background. The red background is not used when the min value is within 80% of the max value.
| dbms | 256us | 1ms | 4ms | 16ms | 64ms | 256ms | 1s | 4s | 16s | gt | max |
|---|---|---|---|---|---|---|---|---|---|---|---|
| my5651_rel_o2nofp.cz12a_c8r32 | nonzero | 48.812 | 50.301 | 0.885 | 0.001 | 0.033 | |||||
| my5744_rel_o2nofp.cz12a_c8r32 | nonzero | 75.463 | 23.835 | 0.700 | 0.001 | 0.026 | |||||
| my8044_rel_o2nofp.cz12a_c8r32 | 75.943 | 22.987 | 1.063 | 0.007 | 0.028 | ||||||
| my8407_rel_o2nofp.cz12a_c8r32 | 72.709 | 26.208 | 1.078 | 0.005 | 0.027 | ||||||
| my9400_rel_o2nofp.cz12a_c8r32 | 72.755 | 26.150 | 1.087 | 0.008 | 0.041 | ||||||
| my9500_rel_o2nofp.cz12a_c8r32 | 72.809 | 26.106 | 1.079 | 0.006 | nonzero | 0.122 |
Insert response time histogram: each cell has the percentage of responses that take <= the time in the header and max is the max response time in seconds. For max values in the top 25% of the range have a red background and in the bottom 25% of the range have a green background. The red background is not used when the min value is within 80% of the max value.
| dbms | 256us | 1ms | 4ms | 16ms | 64ms | 256ms | 1s | 4s | 16s | gt | max |
|---|---|---|---|---|---|---|---|---|---|---|---|
| my5651_rel_o2nofp.cz12a_c8r32 | 0.006 | 56.381 | 40.925 | 2.689 | 0.172 | ||||||
| my5744_rel_o2nofp.cz12a_c8r32 | 0.006 | 91.736 | 8.258 | 0.055 | |||||||
| my8044_rel_o2nofp.cz12a_c8r32 | 93.872 | 6.128 | 0.057 | ||||||||
| my8407_rel_o2nofp.cz12a_c8r32 | 94.661 | 5.336 | 0.003 | 0.300 | |||||||
| my9400_rel_o2nofp.cz12a_c8r32 | 94.944 | 5.047 | 0.006 | 0.003 | 0.444 | ||||||
| my9500_rel_o2nofp.cz12a_c8r32 | 95.133 | 4.864 | 0.003 | 0.245 |
Delete response time histogram: each cell has the percentage of responses that take <= the time in the header and max is the max response time in seconds. For max values in the top 25% of the range have a red background and in the bottom 25% of the range have a green background. The red background is not used when the min value is within 80% of the max value.
| dbms | 256us | 1ms | 4ms | 16ms | 64ms | 256ms | 1s | 4s | 16s | gt | max |
|---|---|---|---|---|---|---|---|---|---|---|---|
| my5651_rel_o2nofp.cz12a_c8r32 | 0.303 | 33.011 | 49.806 | 16.850 | 0.031 | 0.090 | |||||
| my5744_rel_o2nofp.cz12a_c8r32 | 0.217 | 97.244 | 2.536 | 0.003 | 0.018 | ||||||
| my8044_rel_o2nofp.cz12a_c8r32 | 99.803 | 0.197 | 0.016 | ||||||||
| my8407_rel_o2nofp.cz12a_c8r32 | 99.814 | 0.181 | 0.003 | 0.003 | 0.300 | ||||||
| my9400_rel_o2nofp.cz12a_c8r32 | 99.772 | 0.225 | 0.003 | 0.026 | |||||||
| my9500_rel_o2nofp.cz12a_c8r32 | 99.864 | 0.128 | 0.008 | 0.046 |
Performance metrics for the DBMS listed above. Some are normalized by throughput, others are not. Legend for results is here.
ips	qps	rps	rmbps	wps	wmbps	rpq	rkbpq	wpi	wkbpi	csps	cpups	cspq	cpupq	dbgb1	dbgb2	rss	maxop	p50	p99	tag
999	856	12077	188.3	8946.4	180.6	14.107	225.216	8.952	185.090	45697	12.0	53.379	1121	144.5	175.0	24.7	0.033	848	720	my5651_rel_o2nofp.cz12a_c8r32
999	1001	13212	206.4	6860.8	181.9	13.204	211.259	6.865	186.377	37070	9.2	37.048	736	144.6	175.1	25.1	0.026	1008	864	my5744_rel_o2nofp.cz12a_c8r32
1000	1010	13257	207.1	6532.4	185.1	13.132	210.115	6.532	189.574	50222	10.5	49.749	832	148.9	179.8	25.3	0.028	1024	928	my8044_rel_o2nofp.cz12a_c8r32
1000	999	13171	205.8	6531.0	184.8	13.190	211.034	6.531	189.258	50854	10.6	50.925	849	148.9	218.0	25.3	0.027	1008	912	my8407_rel_o2nofp.cz12a_c8r32
1000	997	13162	205.7	6516.9	184.7	13.201	211.222	6.517	189.130	50715	10.6	50.867	851	148.9	218.0	24.5	0.041	1008	912	my9400_rel_o2nofp.cz12a_c8r32
1000	999	13174	205.8	6545.3	185.0	13.188	211.015	6.545	189.391	50819	10.7	50.875	857	148.8	218.0	25.5	0.122	1008	912	my9500_rel_o2nofp.cz12a_c8r32
Average values from iostat.
r/s	rkB/s	rrqm/s	%rrqm	r_await	rareq-s	w/s	wkB/s	wrqm/s	%wrqm	w_await	wareq-s	d/s	dkB/s	drqm/s	%drqm	d_await	dareq-s	f/s	f_await	aqu-sz	%util
12081.6	192876	0.000	0.000	0.095	15.96	8930.4	184625	5.477	0.062	0.031	20.77	0.026	0.103	0.000	0.000	0.072	0.513	2.016	3.038	1.424	76.56		my5651_rel_o2nofp.cz12a_c8r32
13213.8	211421	0.000	0.000	0.096	16.00	6849.6	185997	6.064	0.090	0.070	27.25	0.002	0.027	0.000	0.000	0.006	0.134	2.126	3.100	1.752	77.70		my5744_rel_o2nofp.cz12a_c8r32
13259.9	212159	0.000	0.000	0.097	16.00	6520.7	189245	7.914	0.122	1.426	29.03	0.002	0.007	0.000	0.000	0.003	0.033	2.548	2.908	10.46	74.63		my8044_rel_o2nofp.cz12a_c8r32
13173.9	210782	0.000	0.000	0.093	16.00	6521.5	188994	17.93	0.274	1.604	28.99	0.020	0.158	0.000	0.000	0.074	0.754	2.508	2.878	11.55	74.33		my8407_rel_o2nofp.cz12a_c8r32
13164.4	210631	0.000	0.000	0.094	16.00	6506.2	188829	1.168	0.018	1.603	29.03	0.010	0.042	0.000	0.000	0.028	0.182	2.519	2.971	11.53	75.57		my9400_rel_o2nofp.cz12a_c8r32
13176.8	210828	0.000	0.000	0.097	16.00	6532.8	189041	10.08	0.154	1.604	28.94	0.018	0.905	0.000	0.000	0.057	4.405	2.547	2.896	11.62	74.56		my9500_rel_o2nofp.cz12a_c8r32
l.i0
l.i0: load without secondary indexes
Performance metrics for all DBMS, not just the ones listed above. Some are normalized by throughput, others are not. Legend for results is here.
ips	qps	rps	rmbps	wps	wmbps	rpq	rkbpq	wpi	wkbpi	csps	cpups	cspq	cpupq	dbgb1	dbgb2	rss	maxop	p50	p99	tag
177148	0	1496	5.8	1159.6	63.5	0.008	0.034	0.007	0.367	23812	19.6	0.134	9	52.6	83.1	24.7	0.222	177976	143381	my5651_rel_o2nofp.cz12a_c8r32
160642	0	0	0.0	1063.3	57.8	0.000	0.000	0.007	0.369	18897	19.4	0.118	10	52.6	83.1	25.0	0.161	160578	149979	my5744_rel_o2nofp.cz12a_c8r32
110072	0	0	0.0	746.5	41.3	0.000	0.000	0.007	0.384	13604	17.2	0.124	13	52.4	83.0	25.3	0.334	110082	102785	my8044_rel_o2nofp.cz12a_c8r32
105416	0	0	0.0	715.5	39.6	0.000	0.000	0.007	0.384	13046	17.2	0.124	13	52.4	120.1	25.3	0.337	105288	98187	my8407_rel_o2nofp.cz12a_c8r32
108430	0	0	0.0	735.6	40.7	0.000	0.000	0.007	0.384	13422	17.2	0.124	13	52.4	120.1	25.3	0.318	108386	101387	my9400_rel_o2nofp.cz12a_c8r32
106482	0	0	0.0	730.4	40.4	0.000	0.000	0.007	0.388	14060	17.2	0.132	13	52.4	120.1	25.4	0.325	106485	98787	my9500_rel_o2nofp.cz12a_c8r32
l.x
l.x: create secondary indexes
Performance metrics for all DBMS, not just the ones listed above. Some are normalized by throughput, others are not. Legend for results is here.
ips	qps	rps	rmbps	wps	wmbps	rpq	rkbpq	wpi	wkbpi	csps	cpups	cspq	cpupq	dbgb1	dbgb2	rss	maxop	p50	p99	tag
112233	0	1216	111.6	1791.4	145.3	0.011	1.019	0.016	1.325	2299	10.1	0.020	7	111.4	141.9	24.8	0.004	NA	NA	my5651_rel_o2nofp.cz12a_c8r32
159077	0	1677	155.8	2412.2	189.5	0.011	1.003	0.015	1.220	8900	11.6	0.056	6	121.1	151.7	25.1	0.001	NA	NA	my5744_rel_o2nofp.cz12a_c8r32
289855	0	4016	395.3	8753.0	442.0	0.014	1.396	0.030	1.562	20348	41.5	0.070	11	120.7	151.3	25.4	0.002	NA	NA	my8044_rel_o2nofp.cz12a_c8r32
297398	0	4121	407.3	8983.2	453.6	0.014	1.402	0.030	1.562	21046	41.5	0.071	11	120.7	188.4	25.4	0.001	NA	NA	my8407_rel_o2nofp.cz12a_c8r32
300526	0	4115	401.0	9087.4	458.6	0.014	1.366	0.030	1.563	21351	41.2	0.071	11	120.7	188.4	25.4	0.002	NA	NA	my9400_rel_o2nofp.cz12a_c8r32
309119	0	4291	423.9	9351.9	471.9	0.014	1.404	0.030	1.563	21635	41.5	0.070	11	120.7	188.4	25.6	0.002	NA	NA	my9500_rel_o2nofp.cz12a_c8r32
l.i1
l.i1: continue load after secondary indexes created with 50 inserts per transaction
Performance metrics for all DBMS, not just the ones listed above. Some are normalized by throughput, others are not. Legend for results is here.
ips	qps	rps	rmbps	wps	wmbps	rpq	rkbpq	wpi	wkbpi	csps	cpups	cspq	cpupq	dbgb1	dbgb2	rss	maxop	p50	p99	tag
1975	0	9384	145.8	16394.7	382.2	4.751	75.581	8.300	198.112	45500	16.5	23.034	668	144.5	175.0	24.7	0.697	1850	1200	my5651_rel_o2nofp.cz12a_c8r32
3003	0	13870	216.7	18840.3	560.2	4.619	73.901	6.274	191.029	36919	22.2	12.294	591	144.6	175.1	25.1	0.113	3000	1600	my5744_rel_o2nofp.cz12a_c8r32
3074	0	11435	178.7	16790.9	505.3	3.719	59.506	5.461	168.300	75710	21.7	24.625	565	148.8	179.6	25.4	0.474	2900	1750	my8044_rel_o2nofp.cz12a_c8r32
3035	0	11308	176.7	16592.3	498.6	3.726	59.614	5.467	168.240	76794	21.6	25.304	569	148.7	217.1	25.4	0.500	2850	1700	my8407_rel_o2nofp.cz12a_c8r32
2994	0	11170	174.5	16392.6	493.1	3.731	59.694	5.475	168.660	75995	21.4	25.383	572	148.7	217.0	24.5	0.477	2850	1650	my9400_rel_o2nofp.cz12a_c8r32
3026	0	11282	176.3	16545.3	497.1	3.729	59.659	5.468	168.228	76245	21.7	25.199	574	148.8	217.1	25.5	0.493	2850	1700	my9500_rel_o2nofp.cz12a_c8r32
l.i2
l.i2: continue load after secondary indexes created with 5 inserts per transaction
Performance metrics for all DBMS, not just the ones listed above. Some are normalized by throughput, others are not. Legend for results is here.
ips	qps	rps	rmbps	wps	wmbps	rpq	rkbpq	wpi	wkbpi	csps	cpups	cspq	cpupq	dbgb1	dbgb2	rss	maxop	p50	p99	tag
2198	0	9893	146.5	15586.5	366.3	4.501	68.240	7.092	170.668	59892	24.2	27.251	881	144.5	175.0	24.7	0.035	2190	1940	my5651_rel_o2nofp.cz12a_c8r32
3906	0	15695	245.2	21534.2	621.1	4.018	64.288	5.513	162.808	59863	31.0	15.325	635	144.6	175.1	25.1	0.039	3970	3055	my5744_rel_o2nofp.cz12a_c8r32
3968	0	10903	170.4	16728.2	486.3	2.748	43.962	4.216	125.498	96100	29.2	24.218	589	148.9	179.8	25.4	0.048	3925	3535	my8044_rel_o2nofp.cz12a_c8r32
4000	0	10852	169.6	16704.9	484.9	2.713	43.408	4.176	124.136	97172	29.6	24.293	592	148.9	217.5	25.4	0.044	3925	3545	my8407_rel_o2nofp.cz12a_c8r32
3861	0	10658	166.5	16315.4	474.5	2.760	44.165	4.226	125.843	95973	28.9	24.857	599	148.9	217.5	24.5	0.052	3805	3375	my9400_rel_o2nofp.cz12a_c8r32
3802	0	10686	167.0	16372.4	475.2	2.811	44.968	4.306	127.973	96428	29.4	25.361	619	148.8	217.4	25.5	0.031	3750	3435	my9500_rel_o2nofp.cz12a_c8r32
qr100.L1
qr100.L1: range queries with 100 insert/s per client
Performance metrics for all DBMS, not just the ones listed above. Some are normalized by throughput, others are not. Legend for results is here.
ips	qps	rps	rmbps	wps	wmbps	rpq	rkbpq	wpi	wkbpi	csps	cpups	cspq	cpupq	dbgb1	dbgb2	rss	maxop	p50	p99	tag
100	12027	468	7.3	1112.3	31.2	0.039	0.618	11.135	320.022	70529	12.1	5.864	80	144.5	175.0	24.7	0.032	12126	10719	my5651_rel_o2nofp.cz12a_c8r32
100	10067	466	7.3	286.0	8.3	0.046	0.740	2.860	85.385	58593	12.6	5.820	100	144.6	175.1	25.1	0.011	10127	9375	my5744_rel_o2nofp.cz12a_c8r32
100	9115	417	6.5	305.0	8.8	0.046	0.732	3.050	90.362	53993	12.7	5.923	111	148.9	179.8	25.3	0.009	9119	8943	my8044_rel_o2nofp.cz12a_c8r32
100	8850	418	6.5	306.8	8.9	0.047	0.755	3.068	90.764	52489	13.4	5.931	121	148.9	217.5	25.4	0.010	8863	8703	my8407_rel_o2nofp.cz12a_c8r32
100	9075	418	6.5	306.0	8.9	0.046	0.737	3.063	90.972	53787	13.2	5.927	116	148.9	217.5	24.5	0.012	9087	8943	my9400_rel_o2nofp.cz12a_c8r32
100	9080	419	6.5	312.9	9.0	0.046	0.738	3.132	92.563	53837	12.9	5.929	114	148.8	217.4	25.5	0.012	9103	8911	my9500_rel_o2nofp.cz12a_c8r32
qp100.L2
qp100.L2: point queries with 100 insert/s per client
Performance metrics for all DBMS, not just the ones listed above. Some are normalized by throughput, others are not. Legend for results is here.
ips	qps	rps	rmbps	wps	wmbps	rpq	rkbpq	wpi	wkbpi	csps	cpups	cspq	cpupq	dbgb1	dbgb2	rss	maxop	p50	p99	tag
100	1471	9971	155.7	1051.4	29.3	6.778	108.418	10.524	299.980	28281	3.9	19.226	212	144.5	175.0	24.7	0.011	1552	1024	my5651_rel_o2nofp.cz12a_c8r32
100	1351	9293	145.2	1410.5	35.1	6.879	110.069	14.105	358.969	27635	4.6	20.456	272	144.6	175.1	25.1	0.015	1408	992	my5744_rel_o2nofp.cz12a_c8r32
100	1289	8967	140.1	1276.7	35.7	6.957	111.308	12.767	365.175	27189	5.7	21.093	354	148.9	179.8	25.3	0.025	1360	944	my8044_rel_o2nofp.cz12a_c8r32
100	1279	8908	139.2	1276.0	35.6	6.966	111.449	12.760	364.706	26681	5.6	20.864	350	148.9	217.5	25.4	0.014	1344	928	my8407_rel_o2nofp.cz12a_c8r32
100	1269	8827	137.9	1280.7	35.7	6.956	111.299	12.807	366.041	26933	5.0	21.224	315	148.9	217.5	24.5	0.016	1344	928	my9400_rel_o2nofp.cz12a_c8r32
100	1275	8882	138.8	1280.4	35.6	6.964	111.425	12.816	365.242	27116	5.6	21.260	351	148.8	217.5	25.5	0.018	1344	944	my9500_rel_o2nofp.cz12a_c8r32
qr500.L3
qr500.L3: range queries with 500 insert/s per client
Performance metrics for all DBMS, not just the ones listed above. Some are normalized by throughput, others are not. Legend for results is here.
ips	qps	rps	rmbps	wps	wmbps	rpq	rkbpq	wpi	wkbpi	csps	cpups	cspq	cpupq	dbgb1	dbgb2	rss	maxop	p50	p99	tag
500	11348	2408	37.4	2379.5	68.5	0.212	3.379	4.762	140.294	72992	15.0	6.432	106	144.5	175.0	24.7	0.011	11439	9999	my5651_rel_o2nofp.cz12a_c8r32
500	9902	2377	37.1	2346.4	67.7	0.240	3.841	4.693	138.577	61762	14.3	6.237	116	144.6	175.1	25.1	0.011	9967	8383	my5744_rel_o2nofp.cz12a_c8r32
500	9012	2412	37.7	2470.5	71.2	0.268	4.282	4.944	145.851	61428	15.4	6.816	137	148.9	179.8	25.3	0.010	9023	8879	my8044_rel_o2nofp.cz12a_c8r32
500	8759	2413	37.7	2480.6	71.3	0.275	4.407	4.961	146.097	60016	15.4	6.852	141	148.9	217.6	25.3	0.009	8767	8639	my8407_rel_o2nofp.cz12a_c8r32
500	9059	2412	37.7	2468.4	71.1	0.266	4.261	4.937	145.635	61885	15.2	6.831	134	148.9	217.6	24.5	0.011	9071	8927	my9400_rel_o2nofp.cz12a_c8r32
500	8965	2412	37.7	2478.9	71.2	0.269	4.304	4.961	145.920	61793	15.6	6.893	139	148.8	217.5	25.5	0.011	8975	8815	my9500_rel_o2nofp.cz12a_c8r32
qp500.L4
qp500.L4: point queries with 500 insert/s per client
Performance metrics for all DBMS, not just the ones listed above. Some are normalized by throughput, others are not. Legend for results is here.
ips	qps	rps	rmbps	wps	wmbps	rpq	rkbpq	wpi	wkbpi	csps	cpups	cspq	cpupq	dbgb1	dbgb2	rss	maxop	p50	p99	tag
500	1145	11219	175.1	4112.1	113.2	9.798	156.577	8.229	232.056	32298	9.2	28.208	643	144.5	175.0	24.7	0.020	1168	800	my5651_rel_o2nofp.cz12a_c8r32
500	1110	11052	172.7	4533.6	111.1	9.953	159.251	9.073	227.608	33894	6.7	30.524	483	144.6	175.1	25.1	0.024	1120	832	my5744_rel_o2nofp.cz12a_c8r32
500	1128	11173	174.6	4026.6	114.0	9.909	158.548	8.058	233.597	38289	7.8	33.960	553	148.9	179.8	25.3	0.038	1152	928	my8044_rel_o2nofp.cz12a_c8r32
500	1117	11089	173.3	4035.6	114.1	9.928	158.851	8.071	233.686	38611	7.8	34.570	559	148.9	217.7	25.3	0.023	1152	928	my8407_rel_o2nofp.cz12a_c8r32
500	1112	11078	173.1	4021.7	113.9	9.958	159.336	8.043	233.222	38227	7.7	34.364	554	148.9	217.7	24.5	0.029	1136	928	my9400_rel_o2nofp.cz12a_c8r32
500	1115	11082	173.2	4037.5	114.0	9.935	158.965	8.075	233.436	38360	7.8	34.391	559	148.8	217.6	25.5	0.128	1152	912	my9500_rel_o2nofp.cz12a_c8r32
qr1000.L5
qr1000.L5: range queries with 1000 insert/s per client
Performance metrics for all DBMS, not just the ones listed above. Some are normalized by throughput, others are not. Legend for results is here.
ips	qps	rps	rmbps	wps	wmbps	rpq	rkbpq	wpi	wkbpi	csps	cpups	cspq	cpupq	dbgb1	dbgb2	rss	maxop	p50	p99	tag
999	10547	4290	66.6	5092.2	145.5	0.407	6.467	5.095	149.086	75136	17.7	7.124	134	144.5	175.0	24.7	0.016	10687	7775	my5651_rel_o2nofp.cz12a_c8r32
999	9779	4240	66.2	5157.8	147.4	0.434	6.937	5.161	151.017	66282	17.2	6.778	141	144.6	175.1	25.1	0.012	9855	8415	my5744_rel_o2nofp.cz12a_c8r32
1000	8965	4244	66.3	5206.1	149.1	0.473	7.574	5.206	152.674	70734	18.5	7.890	165	148.9	179.8	25.3	0.010	8975	8799	my8044_rel_o2nofp.cz12a_c8r32
1000	8612	4250	66.4	5226.2	149.4	0.493	7.895	5.226	153.028	68764	18.4	7.985	171	148.9	217.9	25.3	0.009	8623	8463	my8407_rel_o2nofp.cz12a_c8r32
1000	8953	4247	66.4	5213.8	149.3	0.474	7.590	5.214	152.871	71036	17.9	7.935	160	148.9	217.8	24.5	0.036	8959	8783	my9400_rel_o2nofp.cz12a_c8r32
1000	8894	4248	66.4	5222.1	149.2	0.478	7.642	5.222	152.800	70301	18.6	7.904	167	148.8	217.8	25.5	0.009	8911	8735	my9500_rel_o2nofp.cz12a_c8r32
qp1000.L6
qp1000.L6: point queries with 1000 insert/s per client
Performance metrics for all DBMS, not just the ones listed above. Some are normalized by throughput, others are not. Legend for results is here.
ips	qps	rps	rmbps	wps	wmbps	rpq	rkbpq	wpi	wkbpi	csps	cpups	cspq	cpupq	dbgb1	dbgb2	rss	maxop	p50	p99	tag
999	856	12077	188.3	8946.4	180.6	14.107	225.216	8.952	185.090	45697	12.0	53.379	1121	144.5	175.0	24.7	0.033	848	720	my5651_rel_o2nofp.cz12a_c8r32
999	1001	13212	206.4	6860.8	181.9	13.204	211.259	6.865	186.377	37070	9.2	37.048	736	144.6	175.1	25.1	0.026	1008	864	my5744_rel_o2nofp.cz12a_c8r32
1000	1010	13257	207.1	6532.4	185.1	13.132	210.115	6.532	189.574	50222	10.5	49.749	832	148.9	179.8	25.3	0.028	1024	928	my8044_rel_o2nofp.cz12a_c8r32
1000	999	13171	205.8	6531.0	184.8	13.190	211.034	6.531	189.258	50854	10.6	50.925	849	148.9	218.0	25.3	0.027	1008	912	my8407_rel_o2nofp.cz12a_c8r32
1000	997	13162	205.7	6516.9	184.7	13.201	211.222	6.517	189.130	50715	10.6	50.867	851	148.9	218.0	24.5	0.041	1008	912	my9400_rel_o2nofp.cz12a_c8r32
1000	999	13174	205.8	6545.3	185.0	13.188	211.015	6.545	189.391	50819	10.7	50.875	857	148.8	218.0	25.5	0.122	1008	912	my9500_rel_o2nofp.cz12a_c8r32
l.i0
- l.i0: load without secondary indexes
- Legend for results is here.
- Each entry lists the percentage of responses that fit in that bucket (slower than max time for previous bucket, faster than min time for next bucket).
Insert response time histogram
256us	1ms	4ms	16ms	64ms	256ms	1s	4s	16s	gt	max	tag
0.000	99.555	0.380	0.022	0.041	0.002	0.000	0.000	0.000	0.000	0.222	my5651_rel_o2nofp.cz12a_c8r32
0.000	99.711	0.115	0.059	0.114	0.001	0.000	0.000	0.000	0.000	0.161	my5744_rel_o2nofp.cz12a_c8r32
0.000	99.574	0.250	0.056	0.118	0.001	nonzero	0.000	0.000	0.000	0.334	my8044_rel_o2nofp.cz12a_c8r32
0.000	99.551	0.271	0.053	0.123	0.002	nonzero	0.000	0.000	0.000	0.337	my8407_rel_o2nofp.cz12a_c8r32
0.000	99.569	0.256	0.116	0.057	0.001	nonzero	0.000	0.000	0.000	0.318	my9400_rel_o2nofp.cz12a_c8r32
0.000	99.494	0.330	0.085	0.089	0.002	nonzero	0.000	0.000	0.000	0.325	my9500_rel_o2nofp.cz12a_c8r32
l.x
- l.x: create secondary indexes
- Legend for results is here.
- Each entry lists the percentage of responses that fit in that bucket (slower than max time for previous bucket, faster than min time for next bucket).
TODO - determine whether there is data for create index response time
l.i1
- l.i1: continue load after secondary indexes created with 50 inserts per transaction
- Legend for results is here.
- Each entry lists the percentage of responses that fit in that bucket (slower than max time for previous bucket, faster than min time for next bucket).
Insert response time histogram
256us	1ms	4ms	16ms	64ms	256ms	1s	4s	16s	gt	max	tag
0.000	0.000	0.000	14.247	84.720	1.031	0.001	0.000	0.000	0.000	0.697	my5651_rel_o2nofp.cz12a_c8r32
0.000	0.000	0.000	64.752	34.836	0.411	0.000	0.000	0.000	0.000	0.113	my5744_rel_o2nofp.cz12a_c8r32
0.000	0.000	0.000	68.450	30.118	1.430	0.003	0.000	0.000	0.000	0.474	my8044_rel_o2nofp.cz12a_c8r32
0.000	0.000	0.001	67.840	30.610	1.546	0.003	0.000	0.000	0.000	0.500	my8407_rel_o2nofp.cz12a_c8r32
0.000	0.000	0.000	67.406	30.990	1.601	0.003	0.000	0.000	0.000	0.477	my9400_rel_o2nofp.cz12a_c8r32
0.000	0.000	0.000	68.093	30.406	1.499	0.003	0.000	0.000	0.000	0.493	my9500_rel_o2nofp.cz12a_c8r32
Delete response time histogram
256us	1ms	4ms	16ms	64ms	256ms	1s	4s	16s	gt	max	tag
0.000	0.024	94.983	4.772	0.219	0.001	0.001	0.000	0.000	0.000	0.574	my5651_rel_o2nofp.cz12a_c8r32
0.000	0.004	99.677	0.285	0.034	0.000	0.000	0.000	0.000	0.000	0.049	my5744_rel_o2nofp.cz12a_c8r32
0.000	0.000	99.404	0.544	0.051	0.000	0.001	0.000	0.000	0.000	0.466	my8044_rel_o2nofp.cz12a_c8r32
0.000	0.000	99.369	0.585	0.044	0.001	0.001	0.000	0.000	0.000	0.468	my8407_rel_o2nofp.cz12a_c8r32
0.000	0.000	99.350	0.599	0.046	0.005	0.000	0.000	0.000	0.000	0.104	my9400_rel_o2nofp.cz12a_c8r32
0.000	0.000	99.364	0.583	0.051	0.000	0.003	0.000	0.000	0.000	0.492	my9500_rel_o2nofp.cz12a_c8r32
l.i2
- l.i2: continue load after secondary indexes created with 5 inserts per transaction
- Legend for results is here.
- Each entry lists the percentage of responses that fit in that bucket (slower than max time for previous bucket, faster than min time for next bucket).
Insert response time histogram
256us	1ms	4ms	16ms	64ms	256ms	1s	4s	16s	gt	max	tag
0.386	16.956	72.162	10.281	0.215	0.000	0.000	0.000	0.000	0.000	0.035	my5651_rel_o2nofp.cz12a_c8r32
0.789	56.744	38.871	3.562	0.034	0.000	0.000	0.000	0.000	0.000	0.039	my5744_rel_o2nofp.cz12a_c8r32
0.001	55.420	41.381	3.159	0.039	0.000	0.000	0.000	0.000	0.000	0.048	my8044_rel_o2nofp.cz12a_c8r32
0.000	55.695	41.160	3.110	0.036	0.000	0.000	0.000	0.000	0.000	0.044	my8407_rel_o2nofp.cz12a_c8r32
0.000	53.611	43.108	3.228	0.053	0.000	0.000	0.000	0.000	0.000	0.052	my9400_rel_o2nofp.cz12a_c8r32
0.000	50.318	46.282	3.349	0.051	0.000	0.000	0.000	0.000	0.000	0.031	my9500_rel_o2nofp.cz12a_c8r32
Delete response time histogram
256us	1ms	4ms	16ms	64ms	256ms	1s	4s	16s	gt	max	tag
4.109	74.066	20.787	0.988	0.051	0.000	0.000	0.000	0.000	0.000	0.031	my5651_rel_o2nofp.cz12a_c8r32
38.399	61.453	0.122	0.025	0.001	0.000	0.000	0.000	0.000	0.000	0.024	my5744_rel_o2nofp.cz12a_c8r32
0.000	98.119	1.758	0.113	0.009	0.000	0.000	0.000	0.000	0.000	0.029	my8044_rel_o2nofp.cz12a_c8r32
0.001	98.276	1.615	0.102	0.006	0.000	0.000	0.000	0.000	0.000	0.032	my8407_rel_o2nofp.cz12a_c8r32
0.000	98.145	1.720	0.127	0.009	0.000	0.000	0.000	0.000	0.000	0.040	my9400_rel_o2nofp.cz12a_c8r32
0.000	97.744	2.097	0.149	0.010	0.000	0.000	0.000	0.000	0.000	0.062	my9500_rel_o2nofp.cz12a_c8r32
qr100.L1
- qr100.L1: range queries with 100 insert/s per client
- Legend for results is here.
- Each entry lists the percentage of responses that fit in that bucket (slower than max time for previous bucket, faster than min time for next bucket).
Query response time histogram
256us	1ms	4ms	16ms	64ms	256ms	1s	4s	16s	gt	max	tag
99.759	0.205	0.026	0.009	nonzero	0.000	0.000	0.000	0.000	0.000	0.032	my5651_rel_o2nofp.cz12a_c8r32
99.917	0.074	0.004	0.005	0.000	0.000	0.000	0.000	0.000	0.000	0.011	my5744_rel_o2nofp.cz12a_c8r32
99.981	0.018	nonzero	nonzero	0.000	0.000	0.000	0.000	0.000	0.000	0.009	my8044_rel_o2nofp.cz12a_c8r32
99.979	0.020	nonzero	nonzero	0.000	0.000	0.000	0.000	0.000	0.000	0.010	my8407_rel_o2nofp.cz12a_c8r32
99.979	0.020	nonzero	0.001	0.000	0.000	0.000	0.000	0.000	0.000	0.012	my9400_rel_o2nofp.cz12a_c8r32
99.980	0.020	nonzero	nonzero	0.000	0.000	0.000	0.000	0.000	0.000	0.012	my9500_rel_o2nofp.cz12a_c8r32
Insert response time histogram
256us	1ms	4ms	16ms	64ms	256ms	1s	4s	16s	gt	max	tag
0.000	0.000	0.000	47.500	51.083	1.417	0.000	0.000	0.000	0.000	0.131	my5651_rel_o2nofp.cz12a_c8r32
0.000	0.000	0.000	78.778	21.222	0.000	0.000	0.000	0.000	0.000	0.022	my5744_rel_o2nofp.cz12a_c8r32
0.000	0.000	0.000	65.722	34.278	0.000	0.000	0.000	0.000	0.000	0.027	my8044_rel_o2nofp.cz12a_c8r32
0.000	0.000	0.000	68.194	31.806	0.000	0.000	0.000	0.000	0.000	0.027	my8407_rel_o2nofp.cz12a_c8r32
0.000	0.000	0.000	58.889	41.111	0.000	0.000	0.000	0.000	0.000	0.027	my9400_rel_o2nofp.cz12a_c8r32
0.000	0.000	0.000	57.111	42.889	0.000	0.000	0.000	0.000	0.000	0.027	my9500_rel_o2nofp.cz12a_c8r32
Delete response time histogram
256us	1ms	4ms	16ms	64ms	256ms	1s	4s	16s	gt	max	tag
0.000	1.250	14.972	75.611	7.889	0.278	0.000	0.000	0.000	0.000	0.101	my5651_rel_o2nofp.cz12a_c8r32
0.000	31.917	67.333	0.750	0.000	0.000	0.000	0.000	0.000	0.000	0.012	my5744_rel_o2nofp.cz12a_c8r32
0.000	0.000	92.194	7.806	0.000	0.000	0.000	0.000	0.000	0.000	0.012	my8044_rel_o2nofp.cz12a_c8r32
0.000	0.000	92.972	7.028	0.000	0.000	0.000	0.000	0.000	0.000	0.011	my8407_rel_o2nofp.cz12a_c8r32
0.000	0.000	90.583	9.417	0.000	0.000	0.000	0.000	0.000	0.000	0.012	my9400_rel_o2nofp.cz12a_c8r32
0.000	0.000	90.861	9.111	0.028	0.000	0.000	0.000	0.000	0.000	0.021	my9500_rel_o2nofp.cz12a_c8r32
qp100.L2
- qp100.L2: point queries with 100 insert/s per client
- Legend for results is here.
- Each entry lists the percentage of responses that fit in that bucket (slower than max time for previous bucket, faster than min time for next bucket).
Query response time histogram
256us	1ms	4ms	16ms	64ms	256ms	1s	4s	16s	gt	max	tag
0.159	98.393	1.442	0.005	0.000	0.000	0.000	0.000	0.000	0.000	0.011	my5651_rel_o2nofp.cz12a_c8r32
0.118	94.857	4.981	0.044	0.000	0.000	0.000	0.000	0.000	0.000	0.015	my5744_rel_o2nofp.cz12a_c8r32
0.010	93.790	6.098	0.103	nonzero	0.000	0.000	0.000	0.000	0.000	0.025	my8044_rel_o2nofp.cz12a_c8r32
0.008	92.662	7.275	0.056	0.000	0.000	0.000	0.000	0.000	0.000	0.014	my8407_rel_o2nofp.cz12a_c8r32
0.009	91.696	8.173	0.123	nonzero	0.000	0.000	0.000	0.000	0.000	0.016	my9400_rel_o2nofp.cz12a_c8r32
0.008	92.875	6.996	0.120	nonzero	0.000	0.000	0.000	0.000	0.000	0.018	my9500_rel_o2nofp.cz12a_c8r32
Insert response time histogram
256us	1ms	4ms	16ms	64ms	256ms	1s	4s	16s	gt	max	tag
0.000	0.000	0.000	47.611	52.389	0.000	0.000	0.000	0.000	0.000	0.054	my5651_rel_o2nofp.cz12a_c8r32
0.000	0.000	0.000	75.250	24.750	0.000	0.000	0.000	0.000	0.000	0.039	my5744_rel_o2nofp.cz12a_c8r32
0.000	0.000	0.000	97.694	2.306	0.000	0.000	0.000	0.000	0.000	0.022	my8044_rel_o2nofp.cz12a_c8r32
0.000	0.000	0.000	98.944	1.056	0.000	0.000	0.000	0.000	0.000	0.038	my8407_rel_o2nofp.cz12a_c8r32
0.000	0.000	0.000	92.778	7.222	0.000	0.000	0.000	0.000	0.000	0.049	my9400_rel_o2nofp.cz12a_c8r32
0.000	0.000	0.000	94.361	5.639	0.000	0.000	0.000	0.000	0.000	0.045	my9500_rel_o2nofp.cz12a_c8r32
Delete response time histogram
256us	1ms	4ms	16ms	64ms	256ms	1s	4s	16s	gt	max	tag
0.000	0.222	88.167	11.056	0.556	0.000	0.000	0.000	0.000	0.000	0.025	my5651_rel_o2nofp.cz12a_c8r32
0.000	0.000	99.917	0.083	0.000	0.000	0.000	0.000	0.000	0.000	0.005	my5744_rel_o2nofp.cz12a_c8r32
0.000	0.000	99.750	0.250	0.000	0.000	0.000	0.000	0.000	0.000	0.005	my8044_rel_o2nofp.cz12a_c8r32
0.000	0.000	99.750	0.250	0.000	0.000	0.000	0.000	0.000	0.000	0.010	my8407_rel_o2nofp.cz12a_c8r32
0.000	0.000	99.694	0.306	0.000	0.000	0.000	0.000	0.000	0.000	0.006	my9400_rel_o2nofp.cz12a_c8r32
0.000	0.000	99.750	0.222	0.028	0.000	0.000	0.000	0.000	0.000	0.046	my9500_rel_o2nofp.cz12a_c8r32
qr500.L3
- qr500.L3: range queries with 500 insert/s per client
- Legend for results is here.
- Each entry lists the percentage of responses that fit in that bucket (slower than max time for previous bucket, faster than min time for next bucket).
Query response time histogram
256us	1ms	4ms	16ms	64ms	256ms	1s	4s	16s	gt	max	tag
99.061	0.826	0.101	0.013	0.000	0.000	0.000	0.000	0.000	0.000	0.011	my5651_rel_o2nofp.cz12a_c8r32
99.892	0.079	0.018	0.011	0.000	0.000	0.000	0.000	0.000	0.000	0.011	my5744_rel_o2nofp.cz12a_c8r32
99.967	0.032	0.001	nonzero	0.000	0.000	0.000	0.000	0.000	0.000	0.010	my8044_rel_o2nofp.cz12a_c8r32
99.964	0.035	0.001	nonzero	0.000	0.000	0.000	0.000	0.000	0.000	0.009	my8407_rel_o2nofp.cz12a_c8r32
99.963	0.035	0.001	0.001	0.000	0.000	0.000	0.000	0.000	0.000	0.011	my9400_rel_o2nofp.cz12a_c8r32
99.964	0.034	0.001	0.001	0.000	0.000	0.000	0.000	0.000	0.000	0.011	my9500_rel_o2nofp.cz12a_c8r32
Insert response time histogram
256us	1ms	4ms	16ms	64ms	256ms	1s	4s	16s	gt	max	tag
0.000	0.000	0.067	61.700	38.233	0.000	0.000	0.000	0.000	0.000	0.056	my5651_rel_o2nofp.cz12a_c8r32
0.000	0.000	0.167	96.978	2.856	0.000	0.000	0.000	0.000	0.000	0.028	my5744_rel_o2nofp.cz12a_c8r32
0.000	0.000	0.000	93.511	6.483	0.000	0.006	0.000	0.000	0.000	0.318	my8044_rel_o2nofp.cz12a_c8r32
0.000	0.000	0.000	99.839	0.161	0.000	0.000	0.000	0.000	0.000	0.053	my8407_rel_o2nofp.cz12a_c8r32
0.000	0.000	0.000	91.844	8.156	0.000	0.000	0.000	0.000	0.000	0.027	my9400_rel_o2nofp.cz12a_c8r32
0.000	0.000	0.000	92.144	7.850	0.000	0.006	0.000	0.000	0.000	0.345	my9500_rel_o2nofp.cz12a_c8r32
Delete response time histogram
256us	1ms	4ms	16ms	64ms	256ms	1s	4s	16s	gt	max	tag
0.000	2.672	7.344	88.867	1.117	0.000	0.000	0.000	0.000	0.000	0.028	my5651_rel_o2nofp.cz12a_c8r32
0.000	30.089	69.678	0.233	0.000	0.000	0.000	0.000	0.000	0.000	0.013	my5744_rel_o2nofp.cz12a_c8r32
0.000	0.000	99.117	0.883	0.000	0.000	0.000	0.000	0.000	0.000	0.014	my8044_rel_o2nofp.cz12a_c8r32
0.000	0.000	99.967	0.028	0.006	0.000	0.000	0.000	0.000	0.000	0.052	my8407_rel_o2nofp.cz12a_c8r32
0.000	0.000	99.283	0.717	0.000	0.000	0.000	0.000	0.000	0.000	0.011	my9400_rel_o2nofp.cz12a_c8r32
0.000	0.000	99.000	0.994	0.006	0.000	0.000	0.000	0.000	0.000	0.022	my9500_rel_o2nofp.cz12a_c8r32
qp500.L4
- qp500.L4: point queries with 500 insert/s per client
- Legend for results is here.
- Each entry lists the percentage of responses that fit in that bucket (slower than max time for previous bucket, faster than min time for next bucket).
Query response time histogram
256us	1ms	4ms	16ms	64ms	256ms	1s	4s	16s	gt	max	tag
0.011	81.780	17.988	0.220	nonzero	0.000	0.000	0.000	0.000	0.000	0.020	my5651_rel_o2nofp.cz12a_c8r32
0.005	82.675	17.012	0.308	0.001	0.000	0.000	0.000	0.000	0.000	0.024	my5744_rel_o2nofp.cz12a_c8r32
nonzero	87.710	11.708	0.581	0.001	0.000	0.000	0.000	0.000	0.000	0.038	my8044_rel_o2nofp.cz12a_c8r32
nonzero	85.994	13.403	0.601	0.001	0.000	0.000	0.000	0.000	0.000	0.023	my8407_rel_o2nofp.cz12a_c8r32
nonzero	85.694	13.697	0.607	0.002	0.000	0.000	0.000	0.000	0.000	0.029	my9400_rel_o2nofp.cz12a_c8r32
nonzero	85.798	13.601	0.599	0.002	nonzero	0.000	0.000	0.000	0.000	0.128	my9500_rel_o2nofp.cz12a_c8r32
Insert response time histogram
256us	1ms	4ms	16ms	64ms	256ms	1s	4s	16s	gt	max	tag
0.000	0.000	0.006	53.756	44.156	2.083	0.000	0.000	0.000	0.000	0.095	my5651_rel_o2nofp.cz12a_c8r32
0.000	0.000	0.006	89.361	10.628	0.006	0.000	0.000	0.000	0.000	0.077	my5744_rel_o2nofp.cz12a_c8r32
0.000	0.000	0.000	89.972	10.028	0.000	0.000	0.000	0.000	0.000	0.057	my8044_rel_o2nofp.cz12a_c8r32
0.000	0.000	0.000	93.217	6.783	0.000	0.000	0.000	0.000	0.000	0.046	my8407_rel_o2nofp.cz12a_c8r32
0.000	0.000	0.000	94.839	5.161	0.000	0.000	0.000	0.000	0.000	0.058	my9400_rel_o2nofp.cz12a_c8r32
0.000	0.000	0.000	93.239	6.761	0.000	0.000	0.000	0.000	0.000	0.047	my9500_rel_o2nofp.cz12a_c8r32
Delete response time histogram
256us	1ms	4ms	16ms	64ms	256ms	1s	4s	16s	gt	max	tag
0.000	0.067	21.783	62.294	15.844	0.011	0.000	0.000	0.000	0.000	0.065	my5651_rel_o2nofp.cz12a_c8r32
0.000	0.644	99.056	0.300	0.000	0.000	0.000	0.000	0.000	0.000	0.012	my5744_rel_o2nofp.cz12a_c8r32
0.000	0.000	99.917	0.078	0.006	0.000	0.000	0.000	0.000	0.000	0.017	my8044_rel_o2nofp.cz12a_c8r32
0.000	0.000	99.617	0.378	0.006	0.000	0.000	0.000	0.000	0.000	0.017	my8407_rel_o2nofp.cz12a_c8r32
0.000	0.000	99.867	0.128	0.006	0.000	0.000	0.000	0.000	0.000	0.019	my9400_rel_o2nofp.cz12a_c8r32
0.000	0.000	99.883	0.111	0.006	0.000	0.000	0.000	0.000	0.000	0.022	my9500_rel_o2nofp.cz12a_c8r32
qr1000.L5
- qr1000.L5: range queries with 1000 insert/s per client
- Legend for results is here.
- Each entry lists the percentage of responses that fit in that bucket (slower than max time for previous bucket, faster than min time for next bucket).
Query response time histogram
256us	1ms	4ms	16ms	64ms	256ms	1s	4s	16s	gt	max	tag
98.144	1.650	0.192	0.014	0.000	0.000	0.000	0.000	0.000	0.000	0.016	my5651_rel_o2nofp.cz12a_c8r32
99.877	0.098	0.014	0.011	0.000	0.000	0.000	0.000	0.000	0.000	0.012	my5744_rel_o2nofp.cz12a_c8r32
99.948	0.050	0.002	nonzero	0.000	0.000	0.000	0.000	0.000	0.000	0.010	my8044_rel_o2nofp.cz12a_c8r32
99.940	0.058	0.002	0.001	0.000	0.000	0.000	0.000	0.000	0.000	0.009	my8407_rel_o2nofp.cz12a_c8r32
99.945	0.053	0.002	nonzero	nonzero	0.000	0.000	0.000	0.000	0.000	0.036	my9400_rel_o2nofp.cz12a_c8r32
99.943	0.055	0.002	nonzero	0.000	0.000	0.000	0.000	0.000	0.000	0.009	my9500_rel_o2nofp.cz12a_c8r32
Insert response time histogram
256us	1ms	4ms	16ms	64ms	256ms	1s	4s	16s	gt	max	tag
0.000	0.000	0.239	73.417	26.311	0.033	0.000	0.000	0.000	0.000	0.094	my5651_rel_o2nofp.cz12a_c8r32
0.000	0.000	0.775	98.764	0.461	0.000	0.000	0.000	0.000	0.000	0.036	my5744_rel_o2nofp.cz12a_c8r32
0.000	0.000	0.053	98.231	1.717	0.000	0.000	0.000	0.000	0.000	0.032	my8044_rel_o2nofp.cz12a_c8r32
0.000	0.000	0.022	97.731	2.247	0.000	0.000	0.000	0.000	0.000	0.033	my8407_rel_o2nofp.cz12a_c8r32
0.000	0.000	0.022	98.494	1.483	0.000	0.000	0.000	0.000	0.000	0.041	my9400_rel_o2nofp.cz12a_c8r32
0.000	0.000	0.044	98.469	1.486	0.000	0.000	0.000	0.000	0.000	0.035	my9500_rel_o2nofp.cz12a_c8r32
Delete response time histogram
256us	1ms	4ms	16ms	64ms	256ms	1s	4s	16s	gt	max	tag
0.000	0.450	28.556	69.825	1.169	0.000	0.000	0.000	0.000	0.000	0.041	my5651_rel_o2nofp.cz12a_c8r32
0.000	13.308	84.708	1.983	0.000	0.000	0.000	0.000	0.000	0.000	0.015	my5744_rel_o2nofp.cz12a_c8r32
0.000	0.000	99.667	0.333	0.000	0.000	0.000	0.000	0.000	0.000	0.011	my8044_rel_o2nofp.cz12a_c8r32
0.000	0.000	99.744	0.256	0.000	0.000	0.000	0.000	0.000	0.000	0.011	my8407_rel_o2nofp.cz12a_c8r32
0.000	0.000	99.639	0.353	0.008	0.000	0.000	0.000	0.000	0.000	0.039	my9400_rel_o2nofp.cz12a_c8r32
0.000	0.000	99.775	0.219	0.006	0.000	0.000	0.000	0.000	0.000	0.038	my9500_rel_o2nofp.cz12a_c8r32
qp1000.L6
- qp1000.L6: point queries with 1000 insert/s per client
- Legend for results is here.
- Each entry lists the percentage of responses that fit in that bucket (slower than max time for previous bucket, faster than min time for next bucket).
Query response time histogram
256us	1ms	4ms	16ms	64ms	256ms	1s	4s	16s	gt	max	tag
nonzero	48.812	50.301	0.885	0.001	0.000	0.000	0.000	0.000	0.000	0.033	my5651_rel_o2nofp.cz12a_c8r32
nonzero	75.463	23.835	0.700	0.001	0.000	0.000	0.000	0.000	0.000	0.026	my5744_rel_o2nofp.cz12a_c8r32
0.000	75.943	22.987	1.063	0.007	0.000	0.000	0.000	0.000	0.000	0.028	my8044_rel_o2nofp.cz12a_c8r32
0.000	72.709	26.208	1.078	0.005	0.000	0.000	0.000	0.000	0.000	0.027	my8407_rel_o2nofp.cz12a_c8r32
0.000	72.755	26.150	1.087	0.008	0.000	0.000	0.000	0.000	0.000	0.041	my9400_rel_o2nofp.cz12a_c8r32
0.000	72.809	26.106	1.079	0.006	nonzero	0.000	0.000	0.000	0.000	0.122	my9500_rel_o2nofp.cz12a_c8r32
Insert response time histogram
256us	1ms	4ms	16ms	64ms	256ms	1s	4s	16s	gt	max	tag
0.000	0.000	0.006	56.381	40.925	2.689	0.000	0.000	0.000	0.000	0.172	my5651_rel_o2nofp.cz12a_c8r32
0.000	0.000	0.006	91.736	8.258	0.000	0.000	0.000	0.000	0.000	0.055	my5744_rel_o2nofp.cz12a_c8r32
0.000	0.000	0.000	93.872	6.128	0.000	0.000	0.000	0.000	0.000	0.057	my8044_rel_o2nofp.cz12a_c8r32
0.000	0.000	0.000	94.661	5.336	0.000	0.003	0.000	0.000	0.000	0.300	my8407_rel_o2nofp.cz12a_c8r32
0.000	0.000	0.000	94.944	5.047	0.006	0.003	0.000	0.000	0.000	0.444	my9400_rel_o2nofp.cz12a_c8r32
0.000	0.000	0.000	95.133	4.864	0.003	0.000	0.000	0.000	0.000	0.245	my9500_rel_o2nofp.cz12a_c8r32
Delete response time histogram
256us	1ms	4ms	16ms	64ms	256ms	1s	4s	16s	gt	max	tag
0.000	0.303	33.011	49.806	16.850	0.031	0.000	0.000	0.000	0.000	0.090	my5651_rel_o2nofp.cz12a_c8r32
0.000	0.217	97.244	2.536	0.003	0.000	0.000	0.000	0.000	0.000	0.018	my5744_rel_o2nofp.cz12a_c8r32
0.000	0.000	99.803	0.197	0.000	0.000	0.000	0.000	0.000	0.000	0.016	my8044_rel_o2nofp.cz12a_c8r32
0.000	0.000	99.814	0.181	0.003	0.000	0.003	0.000	0.000	0.000	0.300	my8407_rel_o2nofp.cz12a_c8r32
0.000	0.000	99.772	0.225	0.003	0.000	0.000	0.000	0.000	0.000	0.026	my9400_rel_o2nofp.cz12a_c8r32
0.000	0.000	99.864	0.128	0.008	0.000	0.000	0.000	0.000	0.000	0.046	my9500_rel_o2nofp.cz12a_c8r32