Introduction
This is a report for the insert benchmark with 30M docs and 1 client(s). It is generated by scripts (bash, awk, sed) and Tufte might not be impressed. An overview of the insert benchmark is here and a short update is here. Below, by DBMS, I mean DBMS+version.config. An example is my8020.c10b40 where my means MySQL, 8020 is version 8.0.20 and c10b40 is the name for the configuration file.
The test server has 8 AMD cores, 32G RAM and an NVMe device for the database. The benchmark was run with 1 client and there were 1 or 3 connections per client (1 for queries or inserts without rate limits, 1+1 for rate limited inserts+deletes). It uses 1 table with a table per client. It loads 30M rows per table without secondary indexes, creates 3 secondary indexes per table, then inserts 40m+10m rows per table with a delete per insert to avoid growing the table. It then does 6 read+write tests for 1800s each that do queries as fast as possible with 100,100,500,500,1000,1000 inserts/s and the same for deletes/s per client concurrent with the queries. The database is cached by InnoDB. Clients and the DBMS share one server.
The tested DBMS are:
- ma101115_rel_withdbg.cz12a_c8r32 - MariaDB 10.11.15 with the z12a_c8r32 config that uses innodb_flush_method=O_DIRECT_NO_FSYNC
- ma101115_rel_withdbg.cz12b_c8r32 - MariaDB 10.11.15 with the z12b_c8r32 config that uses innodb_flush_method=O_DIRECT
Contents
- Summary
- l.i0: load without secondary indexes
- l.x: create secondary indexes
- l.i1: continue load after secondary indexes created with 50 inserts per transaction
- l.i2: continue load after secondary indexes created with 5 inserts per transaction
- qr100.L1: range queries with 100 insert/s per client
- qp100.L2: point queries with 100 insert/s per client
- qr500.L3: range queries with 500 insert/s per client
- qp500.L4: point queries with 500 insert/s per client
- qr1000.L5: range queries with 1000 insert/s per client
- qp1000.L6: point queries with 1000 insert/s per client
Summary
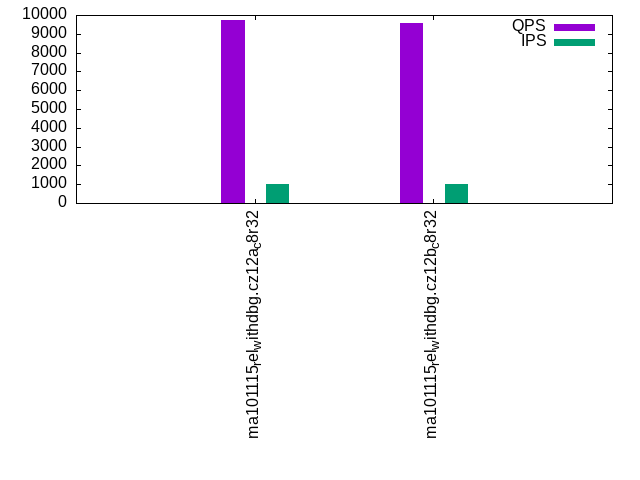
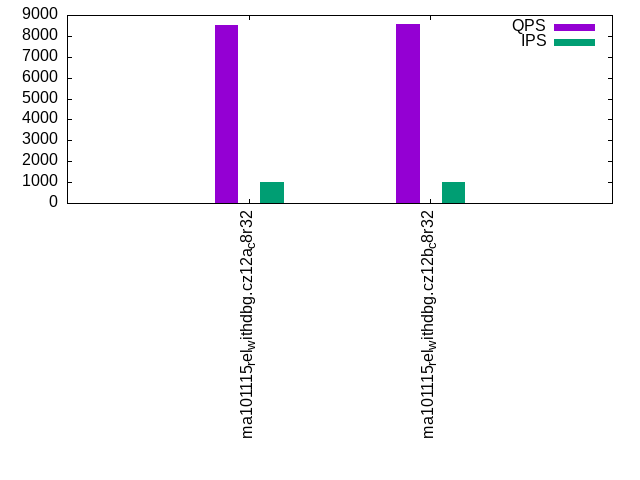
The numbers are inserts/s for l.i0, l.i1 and l.i2, indexed docs (or rows) /s for l.x and queries/s for qr100, qp100 thru qr1000, qp1000" The values are the average rate over the entire test for inserts (IPS) and queries (QPS). The range of values for IPS and QPS is split into 3 parts: bottom 25%, middle 50%, top 25%. Values in the bottom 25% have a red background, values in the top 25% have a green background and values in the middle have no color. A gray background is used for values that can be ignored because the DBMS did not sustain the target insert rate. Red backgrounds are not used when the minimum value is within 80% of the max value.
| dbms | l.i0 | l.x | l.i1 | l.i2 | qr100 | qp100 | qr500 | qp500 | qr1000 | qp1000 |
|---|---|---|---|---|---|---|---|---|---|---|
| ma101115_rel_withdbg.cz12a_c8r32 | 164835 | 187501 | 40650 | 27933 | 9710 | 8579 | 9653 | 8579 | 9709 | 8507 |
| ma101115_rel_withdbg.cz12b_c8r32 | 166667 | 187501 | 38424 | 27174 | 9654 | 8619 | 9611 | 8635 | 9584 | 8592 |
This table has relative throughput, throughput for the DBMS relative to the DBMS in the first line, using the absolute throughput from the previous table. Values less than 0.95 have a yellow background. Values greater than 1.05 have a blue background.
| dbms | l.i0 | l.x | l.i1 | l.i2 | qr100 | qp100 | qr500 | qp500 | qr1000 | qp1000 |
|---|---|---|---|---|---|---|---|---|---|---|
| ma101115_rel_withdbg.cz12a_c8r32 | 1.00 | 1.00 | 1.00 | 1.00 | 1.00 | 1.00 | 1.00 | 1.00 | 1.00 | 1.00 |
| ma101115_rel_withdbg.cz12b_c8r32 | 1.01 | 1.00 | 0.95 | 0.97 | 0.99 | 1.00 | 1.00 | 1.01 | 0.99 | 1.01 |
This lists the average rate of inserts/s for the tests that do inserts concurrent with queries. For such tests the query rate is listed in the table above. The read+write tests are setup so that the insert rate should match the target rate every second. Cells that are not at least 95% of the target have a red background to indicate a failure to satisfy the target.
| dbms | qr100.L1 | qp100.L2 | qr500.L3 | qp500.L4 | qr1000.L5 | qp1000.L6 |
|---|---|---|---|---|---|---|
| ma101115_rel_withdbg.cz12a_c8r32 | 100 | 100 | 500 | 500 | 999 | 999 |
| ma101115_rel_withdbg.cz12b_c8r32 | 100 | 100 | 500 | 500 | 1000 | 1000 |
| target | 100 | 100 | 500 | 500 | 1000 | 1000 |
l.i0
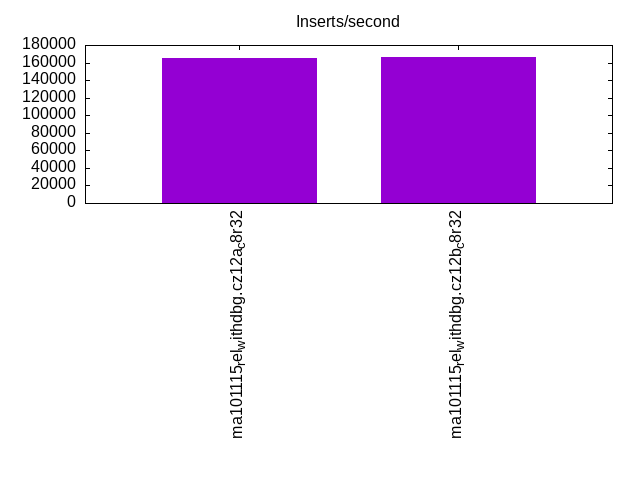
l.i0: load without secondary indexes. Graphs for performance per 1-second interval are here.
Average throughput:
Insert response time histogram: each cell has the percentage of responses that take <= the time in the header and max is the max response time in seconds. For the max column values in the top 25% of the range have a red background and in the bottom 25% of the range have a green background. The red background is not used when the min value is within 80% of the max value.
| dbms | 256us | 1ms | 4ms | 16ms | 64ms | 256ms | 1s | 4s | 16s | gt | max |
|---|---|---|---|---|---|---|---|---|---|---|---|
| ma101115_rel_withdbg.cz12a_c8r32 | 99.714 | 0.096 | 0.051 | 0.134 | 0.004 | 0.119 | |||||
| ma101115_rel_withdbg.cz12b_c8r32 | 99.706 | 0.105 | 0.062 | 0.124 | 0.004 | 0.116 |
Performance metrics for the DBMS listed above. Some are normalized by throughput, others are not. Legend for results is here.
ips	qps	rps	rmbps	wps	wmbps	rpq	rkbpq	wpi	wkbpi	csps	cpups	cspq	cpupq	dbgb1	dbgb2	rss	maxop	p50	p99	tag
164835	0	0	0.0	279.3	32.3	0.000	0.000	0.002	0.201	20508	20.1	0.124	10	2.0	32.8	2.5	0.119	166483	145680	ma101115_rel_withdbg.cz12a_c8r32
166667	0	0	0.0	279.9	32.5	0.000	0.000	0.002	0.199	20682	20.4	0.124	10	2.0	32.8	2.6	0.116	168578	147282	ma101115_rel_withdbg.cz12b_c8r32
Average values from iostat.
r/s	rkB/s	rrqm/s	%rrqm	r_await	rareq-s	w/s	wkB/s	wrqm/s	%wrqm	w_await	wareq-s	d/s	dkB/s	drqm/s	%drqm	d_await	dareq-s	f/s	f_await	aqu-sz	%util
0.211	0.846	0.000	0.000	2.962	2.400	282.8	33671.6	19.36	8.711	4.065	116.8	0.543	5.239	0.000	0.000	0.353	3.349	6.903	1.758	0.809	6.373		ma101115_rel_withdbg.cz12a_c8r32
0.223	0.891	0.000	0.000	2.729	2.400	283.5	33830.7	19.67	8.776	4.330	117.2	0.617	5.803	0.000	0.000	0.326	3.273	6.948	1.733	0.874	6.342		ma101115_rel_withdbg.cz12b_c8r32
l.x
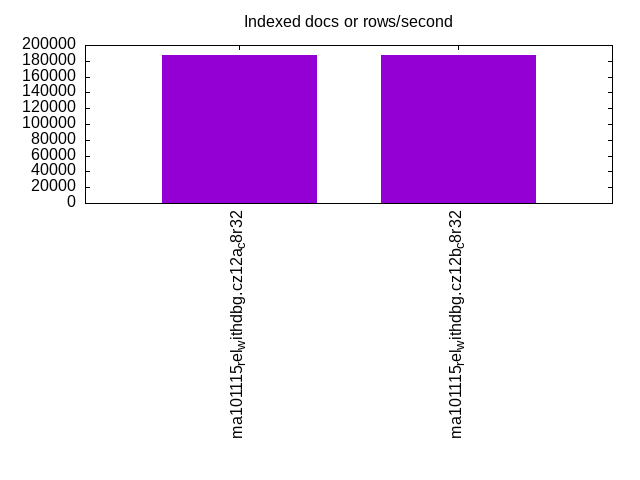
l.x: create secondary indexes.
Average throughput:
Performance metrics for the DBMS listed above. Some are normalized by throughput, others are not. Legend for results is here.
ips	qps	rps	rmbps	wps	wmbps	rpq	rkbpq	wpi	wkbpi	csps	cpups	cspq	cpupq	dbgb1	dbgb2	rss	maxop	p50	p99	tag
187501	0	0	0.0	2503.0	166.2	0.000	0.000	0.013	0.908	7580	12.5	0.040	5	4.2	35.0	4.1	0.001	NA	NA	ma101115_rel_withdbg.cz12a_c8r32
187501	0	0	0.0	2568.9	169.9	0.000	0.000	0.014	0.928	7856	12.5	0.042	5	4.2	35.0	4.1	0.001	NA	NA	ma101115_rel_withdbg.cz12b_c8r32
Average values from iostat.
r/s	rkB/s	rrqm/s	%rrqm	r_await	rareq-s	w/s	wkB/s	wrqm/s	%wrqm	w_await	wareq-s	d/s	dkB/s	drqm/s	%drqm	d_await	dareq-s	f/s	f_await	aqu-sz	%util
0.142	0.568	0.000	0.000	0.016	1.419	2446.1	172566	18.83	1.819	0.180	101.2	0.774	7969.5	0.000	0.000	0.075	777.3	7.961	1.491	0.264	6.974		ma101115_rel_withdbg.cz12a_c8r32
0.160	0.640	0.000	0.000	0.028	1.467	2512.4	176519	17.92	1.585	0.144	100.4	0.913	8206.3	0.000	0.000	0.038	631.6	7.413	2.000	0.239	7.027		ma101115_rel_withdbg.cz12b_c8r32
l.i1
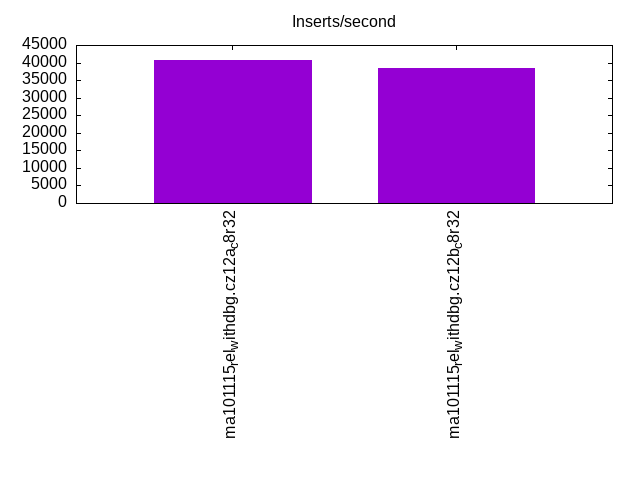
l.i1: continue load after secondary indexes created with 50 inserts per transaction. Graphs for performance per 1-second interval are here.
Average throughput:
Insert response time histogram: each cell has the percentage of responses that take <= the time in the header and max is the max response time in seconds. For the max column values in the top 25% of the range have a red background and in the bottom 25% of the range have a green background. The red background is not used when the min value is within 80% of the max value.
| dbms | 256us | 1ms | 4ms | 16ms | 64ms | 256ms | 1s | 4s | 16s | gt | max |
|---|---|---|---|---|---|---|---|---|---|---|---|
| ma101115_rel_withdbg.cz12a_c8r32 | 22.581 | 76.567 | 0.783 | 0.068 | 0.001 | nonzero | 0.264 | ||||
| ma101115_rel_withdbg.cz12b_c8r32 | 23.989 | 74.584 | 1.190 | 0.233 | 0.004 | 0.205 |
Delete response time histogram: each cell has the percentage of responses that take <= the time in the header and max is the max response time in seconds. For the max column values in the top 25% of the range have a red background and in the bottom 25% of the range have a green background. The red background is not used when the min value is within 80% of the max value.
| dbms | 256us | 1ms | 4ms | 16ms | 64ms | 256ms | 1s | 4s | 16s | gt | max |
|---|---|---|---|---|---|---|---|---|---|---|---|
| ma101115_rel_withdbg.cz12a_c8r32 | 86.579 | 12.809 | 0.557 | 0.054 | 0.001 | nonzero | 0.264 | ||||
| ma101115_rel_withdbg.cz12b_c8r32 | 86.570 | 12.279 | 0.956 | 0.193 | 0.002 | 0.190 |
Performance metrics for the DBMS listed above. Some are normalized by throughput, others are not. Legend for results is here.
ips	qps	rps	rmbps	wps	wmbps	rpq	rkbpq	wpi	wkbpi	csps	cpups	cspq	cpupq	dbgb1	dbgb2	rss	maxop	p50	p99	tag
40650	0	0	0.0	3654.6	136.6	0.000	0.000	0.090	3.440	35919	33.5	0.884	66	5.8	36.7	6.4	0.264	42545	14198	ma101115_rel_withdbg.cz12a_c8r32
38424	0	0	0.0	3479.1	128.8	0.000	0.000	0.091	3.432	31596	31.9	0.822	66	5.8	36.7	6.4	0.205	39346	13798	ma101115_rel_withdbg.cz12b_c8r32
Average values from iostat.
r/s	rkB/s	rrqm/s	%rrqm	r_await	rareq-s	w/s	wkB/s	wrqm/s	%wrqm	w_await	wareq-s	d/s	dkB/s	drqm/s	%drqm	d_await	dareq-s	f/s	f_await	aqu-sz	%util
0.058	0.234	0.000	0.000	0.167	0.697	3659.0	139929	22.87	0.548	0.927	39.24	0.330	9.079	0.000	0.000	0.350	5.668	11.96	1.613	3.220	10.08		ma101115_rel_withdbg.cz12a_c8r32
0.059	0.236	0.000	0.000	0.316	0.792	3484.3	131933	37.90	1.006	1.035	38.96	0.335	2.626	0.000	0.000	0.245	1.782	44.60	1.601	3.532	16.17		ma101115_rel_withdbg.cz12b_c8r32
l.i2
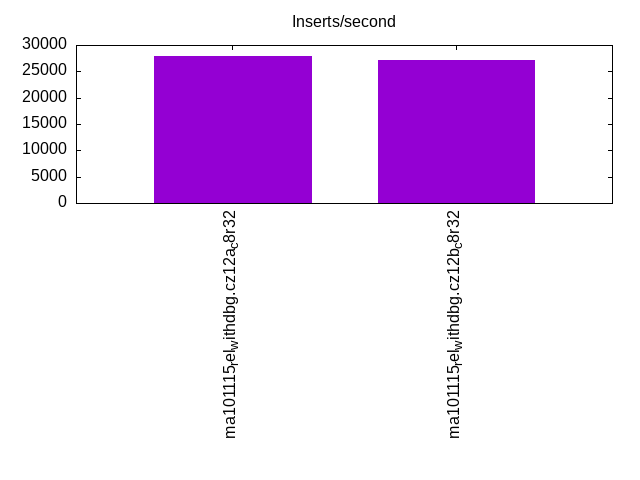
l.i2: continue load after secondary indexes created with 5 inserts per transaction. Graphs for performance per 1-second interval are here.
Average throughput:
Insert response time histogram: each cell has the percentage of responses that take <= the time in the header and max is the max response time in seconds. For the max column values in the top 25% of the range have a red background and in the bottom 25% of the range have a green background. The red background is not used when the min value is within 80% of the max value.
| dbms | 256us | 1ms | 4ms | 16ms | 64ms | 256ms | 1s | 4s | 16s | gt | max |
|---|---|---|---|---|---|---|---|---|---|---|---|
| ma101115_rel_withdbg.cz12a_c8r32 | 98.455 | 1.472 | 0.054 | 0.018 | 0.001 | 0.049 | |||||
| ma101115_rel_withdbg.cz12b_c8r32 | 98.291 | 1.599 | 0.041 | 0.066 | 0.003 | 0.048 |
Delete response time histogram: each cell has the percentage of responses that take <= the time in the header and max is the max response time in seconds. For the max column values in the top 25% of the range have a red background and in the bottom 25% of the range have a green background. The red background is not used when the min value is within 80% of the max value.
| dbms | 256us | 1ms | 4ms | 16ms | 64ms | 256ms | 1s | 4s | 16s | gt | max |
|---|---|---|---|---|---|---|---|---|---|---|---|
| ma101115_rel_withdbg.cz12a_c8r32 | 99.635 | 0.302 | 0.047 | 0.016 | 0.001 | 0.049 | |||||
| ma101115_rel_withdbg.cz12b_c8r32 | 99.548 | 0.355 | 0.034 | 0.060 | 0.003 | 0.048 |
Performance metrics for the DBMS listed above. Some are normalized by throughput, others are not. Legend for results is here.
ips	qps	rps	rmbps	wps	wmbps	rpq	rkbpq	wpi	wkbpi	csps	cpups	cspq	cpupq	dbgb1	dbgb2	rss	maxop	p50	p99	tag
27933	0	0	0.0	2032.0	77.6	0.000	0.000	0.073	2.846	133623	34.5	4.784	99	5.8	36.7	6.4	0.049	28242	25887	ma101115_rel_withdbg.cz12a_c8r32
27174	0	0	0.0	2015.7	76.2	0.000	0.000	0.074	2.871	128396	34.1	4.725	100	5.8	36.7	6.4	0.048	27957	23123	ma101115_rel_withdbg.cz12b_c8r32
Average values from iostat.
r/s	rkB/s	rrqm/s	%rrqm	r_await	rareq-s	w/s	wkB/s	wrqm/s	%wrqm	w_await	wareq-s	d/s	dkB/s	drqm/s	%drqm	d_await	dareq-s	f/s	f_await	aqu-sz	%util
0.020	0.080	0.000	0.000	0.150	0.286	2058.0	80275.2	2.117	0.111	1.027	39.56	0.289	8.091	0.000	0.000	0.161	5.304	6.474	1.626	1.982	5.241		ma101115_rel_withdbg.cz12a_c8r32
0.028	0.111	0.000	0.000	0.007	0.333	2040.6	78735.3	2.078	0.108	1.126	39.73	0.231	2.212	0.000	0.000	0.194	1.820	27.20	1.582	2.223	8.220		ma101115_rel_withdbg.cz12b_c8r32
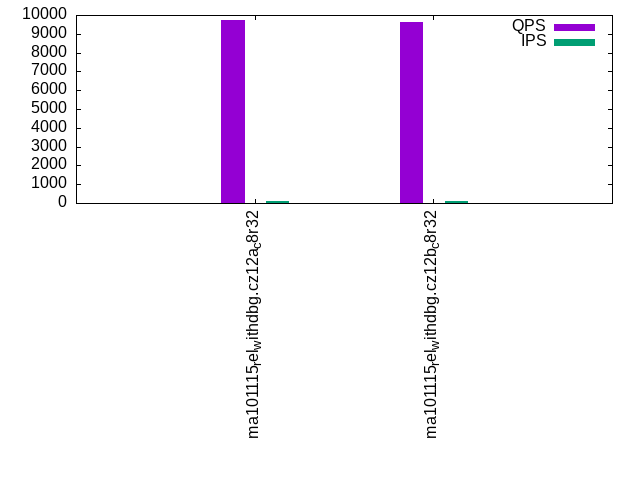
qr100.L1
qr100.L1: range queries with 100 insert/s per client. Graphs for performance per 1-second interval are here.
Average throughput:
Query response time histogram: each cell has the percentage of responses that take <= the time in the header and max is the max response time in seconds. For max values in the top 25% of the range have a red background and in the bottom 25% of the range have a green background. The red background is not used when the min value is within 80% of the max value.
| dbms | 256us | 1ms | 4ms | 16ms | 64ms | 256ms | 1s | 4s | 16s | gt | max |
|---|---|---|---|---|---|---|---|---|---|---|---|
| ma101115_rel_withdbg.cz12a_c8r32 | 99.999 | 0.001 | 0.001 | ||||||||
| ma101115_rel_withdbg.cz12b_c8r32 | 99.998 | 0.002 | nonzero | 0.002 |
Insert response time histogram: each cell has the percentage of responses that take <= the time in the header and max is the max response time in seconds. For max values in the top 25% of the range have a red background and in the bottom 25% of the range have a green background. The red background is not used when the min value is within 80% of the max value.
| dbms | 256us | 1ms | 4ms | 16ms | 64ms | 256ms | 1s | 4s | 16s | gt | max |
|---|---|---|---|---|---|---|---|---|---|---|---|
| ma101115_rel_withdbg.cz12a_c8r32 | 21.167 | 69.917 | 8.889 | 0.028 | 0.026 | ||||||
| ma101115_rel_withdbg.cz12b_c8r32 | 24.222 | 66.944 | 8.806 | 0.028 | 0.026 |
Delete response time histogram: each cell has the percentage of responses that take <= the time in the header and max is the max response time in seconds. For max values in the top 25% of the range have a red background and in the bottom 25% of the range have a green background. The red background is not used when the min value is within 80% of the max value.
| dbms | 256us | 1ms | 4ms | 16ms | 64ms | 256ms | 1s | 4s | 16s | gt | max |
|---|---|---|---|---|---|---|---|---|---|---|---|
| ma101115_rel_withdbg.cz12a_c8r32 | 48.778 | 42.500 | 8.694 | 0.028 | 0.021 | ||||||
| ma101115_rel_withdbg.cz12b_c8r32 | 46.750 | 44.528 | 8.722 | 0.012 |
Performance metrics for the DBMS listed above. Some are normalized by throughput, others are not. Legend for results is here.
ips	qps	rps	rmbps	wps	wmbps	rpq	rkbpq	wpi	wkbpi	csps	cpups	cspq	cpupq	dbgb1	dbgb2	rss	maxop	p50	p99	tag
100	9710	0	0.0	9.0	0.3	0.000	0.000	0.090	2.966	55651	13.1	5.732	108	5.8	36.7	6.4	0.001	9695	9583	ma101115_rel_withdbg.cz12a_c8r32
100	9654	0	0.0	9.1	0.3	0.000	0.000	0.091	2.980	55332	12.8	5.732	106	5.8	36.7	6.4	0.002	9663	9535	ma101115_rel_withdbg.cz12b_c8r32
Average values from iostat.
r/s	rkB/s	rrqm/s	%rrqm	r_await	rareq-s	w/s	wkB/s	wrqm/s	%wrqm	w_await	wareq-s	d/s	dkB/s	drqm/s	%drqm	d_await	dareq-s	f/s	f_await	aqu-sz	%util
0.000	0.000	0.000	0.000	0.000	0.000	9.052	297.2	0.945	25.17	6.151	43.44	0.001	0.002	0.000	0.000	0.003	0.011	1.194	2.733	0.021	1.436		ma101115_rel_withdbg.cz12a_c8r32
0.000	0.000	0.000	0.000	0.000	0.000	9.165	298.7	0.889	23.85	6.114	43.90	0.001	0.002	0.000	0.000	0.000	0.011	1.331	2.749	0.021	1.457		ma101115_rel_withdbg.cz12b_c8r32
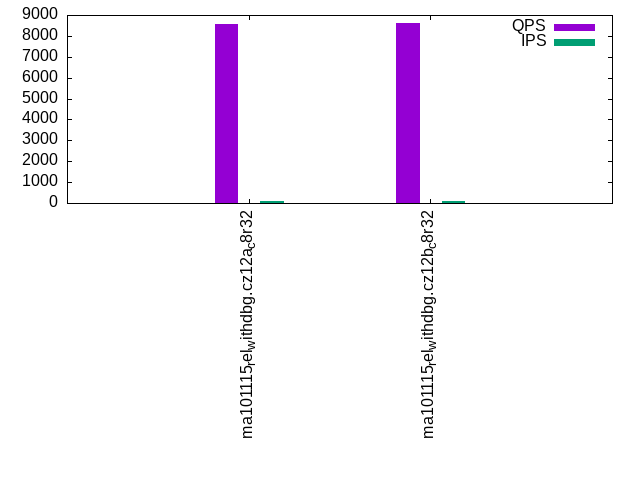
qp100.L2
qp100.L2: point queries with 100 insert/s per client. Graphs for performance per 1-second interval are here.
Average throughput:
Query response time histogram: each cell has the percentage of responses that take <= the time in the header and max is the max response time in seconds. For max values in the top 25% of the range have a red background and in the bottom 25% of the range have a green background. The red background is not used when the min value is within 80% of the max value.
| dbms | 256us | 1ms | 4ms | 16ms | 64ms | 256ms | 1s | 4s | 16s | gt | max |
|---|---|---|---|---|---|---|---|---|---|---|---|
| ma101115_rel_withdbg.cz12a_c8r32 | 99.997 | 0.003 | nonzero | 0.001 | |||||||
| ma101115_rel_withdbg.cz12b_c8r32 | 99.997 | 0.003 | nonzero | 0.001 |
Insert response time histogram: each cell has the percentage of responses that take <= the time in the header and max is the max response time in seconds. For max values in the top 25% of the range have a red background and in the bottom 25% of the range have a green background. The red background is not used when the min value is within 80% of the max value.
| dbms | 256us | 1ms | 4ms | 16ms | 64ms | 256ms | 1s | 4s | 16s | gt | max |
|---|---|---|---|---|---|---|---|---|---|---|---|
| ma101115_rel_withdbg.cz12a_c8r32 | 2.528 | 88.667 | 8.806 | 0.011 | |||||||
| ma101115_rel_withdbg.cz12b_c8r32 | 0.333 | 90.861 | 8.806 | 0.012 |
Delete response time histogram: each cell has the percentage of responses that take <= the time in the header and max is the max response time in seconds. For max values in the top 25% of the range have a red background and in the bottom 25% of the range have a green background. The red background is not used when the min value is within 80% of the max value.
| dbms | 256us | 1ms | 4ms | 16ms | 64ms | 256ms | 1s | 4s | 16s | gt | max |
|---|---|---|---|---|---|---|---|---|---|---|---|
| ma101115_rel_withdbg.cz12a_c8r32 | 43.778 | 47.472 | 8.750 | 0.011 | |||||||
| ma101115_rel_withdbg.cz12b_c8r32 | 41.417 | 49.889 | 8.694 | 0.012 |
Performance metrics for the DBMS listed above. Some are normalized by throughput, others are not. Legend for results is here.
ips	qps	rps	rmbps	wps	wmbps	rpq	rkbpq	wpi	wkbpi	csps	cpups	cspq	cpupq	dbgb1	dbgb2	rss	maxop	p50	p99	tag
100	8579	0	0.0	21.5	0.6	0.000	0.000	0.216	6.481	49758	12.4	5.800	116	5.8	36.7	6.4	0.001	8591	8479	ma101115_rel_withdbg.cz12a_c8r32
100	8619	0	0.0	21.8	0.6	0.000	0.000	0.218	6.493	49989	12.5	5.800	116	5.8	36.7	6.4	0.001	8623	8511	ma101115_rel_withdbg.cz12b_c8r32
Average values from iostat.
r/s	rkB/s	rrqm/s	%rrqm	r_await	rareq-s	w/s	wkB/s	wrqm/s	%wrqm	w_await	wareq-s	d/s	dkB/s	drqm/s	%drqm	d_await	dareq-s	f/s	f_await	aqu-sz	%util
0.000	0.000	0.000	0.000	0.000	0.000	21.60	649.0	0.875	23.43	6.069	43.07	0.004	0.548	0.000	0.000	0.019	2.741	1.196	2.664	0.022	1.439		ma101115_rel_withdbg.cz12a_c8r32
0.000	0.000	0.000	0.000	0.000	0.000	15.45	473.6	0.905	24.10	6.107	43.53	0.006	0.042	0.000	0.000	0.022	0.212	1.367	2.729	0.022	1.468		ma101115_rel_withdbg.cz12b_c8r32
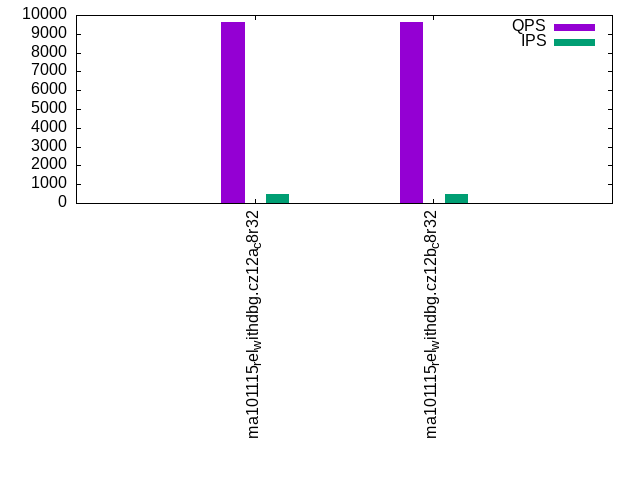
qr500.L3
qr500.L3: range queries with 500 insert/s per client. Graphs for performance per 1-second interval are here.
Average throughput:
Query response time histogram: each cell has the percentage of responses that take <= the time in the header and max is the max response time in seconds. For max values in the top 25% of the range have a red background and in the bottom 25% of the range have a green background. The red background is not used when the min value is within 80% of the max value.
| dbms | 256us | 1ms | 4ms | 16ms | 64ms | 256ms | 1s | 4s | 16s | gt | max |
|---|---|---|---|---|---|---|---|---|---|---|---|
| ma101115_rel_withdbg.cz12a_c8r32 | 99.996 | 0.004 | nonzero | nonzero | 0.007 | ||||||
| ma101115_rel_withdbg.cz12b_c8r32 | 99.996 | 0.004 | nonzero | nonzero | 0.006 |
Insert response time histogram: each cell has the percentage of responses that take <= the time in the header and max is the max response time in seconds. For max values in the top 25% of the range have a red background and in the bottom 25% of the range have a green background. The red background is not used when the min value is within 80% of the max value.
| dbms | 256us | 1ms | 4ms | 16ms | 64ms | 256ms | 1s | 4s | 16s | gt | max |
|---|---|---|---|---|---|---|---|---|---|---|---|
| ma101115_rel_withdbg.cz12a_c8r32 | 54.622 | 43.600 | 1.778 | 0.011 | |||||||
| ma101115_rel_withdbg.cz12b_c8r32 | 54.233 | 43.939 | 1.817 | 0.011 | 0.016 |
Delete response time histogram: each cell has the percentage of responses that take <= the time in the header and max is the max response time in seconds. For max values in the top 25% of the range have a red background and in the bottom 25% of the range have a green background. The red background is not used when the min value is within 80% of the max value.
| dbms | 256us | 1ms | 4ms | 16ms | 64ms | 256ms | 1s | 4s | 16s | gt | max |
|---|---|---|---|---|---|---|---|---|---|---|---|
| ma101115_rel_withdbg.cz12a_c8r32 | 88.806 | 9.428 | 1.767 | 0.011 | |||||||
| ma101115_rel_withdbg.cz12b_c8r32 | 88.478 | 9.722 | 1.800 | 0.016 |
Performance metrics for the DBMS listed above. Some are normalized by throughput, others are not. Legend for results is here.
ips	qps	rps	rmbps	wps	wmbps	rpq	rkbpq	wpi	wkbpi	csps	cpups	cspq	cpupq	dbgb1	dbgb2	rss	maxop	p50	p99	tag
500	9653	0	0.0	75.0	2.4	0.000	0.000	0.150	4.920	55831	13.0	5.784	108	5.8	36.7	6.4	0.007	9647	9534	ma101115_rel_withdbg.cz12a_c8r32
500	9611	0	0.0	62.8	2.1	0.000	0.000	0.126	4.228	55473	12.7	5.772	106	5.8	36.7	6.4	0.006	9615	9487	ma101115_rel_withdbg.cz12b_c8r32
Average values from iostat.
r/s	rkB/s	rrqm/s	%rrqm	r_await	rareq-s	w/s	wkB/s	wrqm/s	%wrqm	w_await	wareq-s	d/s	dkB/s	drqm/s	%drqm	d_await	dareq-s	f/s	f_await	aqu-sz	%util
0.000	0.000	0.000	0.000	0.000	0.000	68.90	2288.6	0.514	7.421	7.090	85.34	0.003	0.314	0.000	0.000	0.011	1.571	1.223	2.175	0.052	1.461		ma101115_rel_withdbg.cz12a_c8r32
0.000	0.000	0.000	0.000	0.000	0.000	56.91	1948.6	0.511	7.481	7.160	85.66	0.002	0.016	0.000	0.000	0.011	0.078	1.873	2.170	0.054	1.547		ma101115_rel_withdbg.cz12b_c8r32
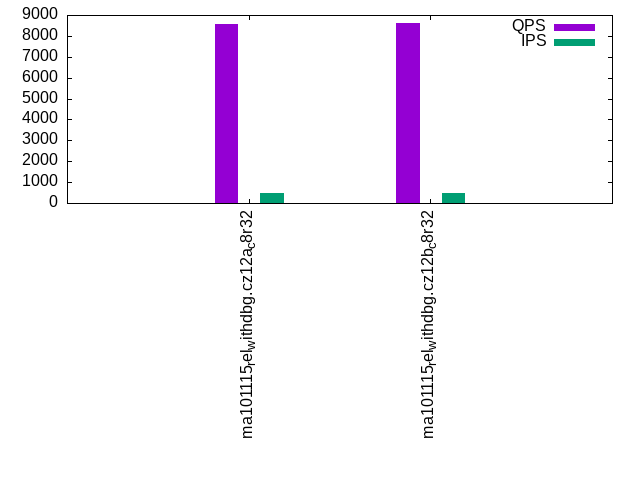
qp500.L4
qp500.L4: point queries with 500 insert/s per client. Graphs for performance per 1-second interval are here.
Average throughput:
Query response time histogram: each cell has the percentage of responses that take <= the time in the header and max is the max response time in seconds. For max values in the top 25% of the range have a red background and in the bottom 25% of the range have a green background. The red background is not used when the min value is within 80% of the max value.
| dbms | 256us | 1ms | 4ms | 16ms | 64ms | 256ms | 1s | 4s | 16s | gt | max |
|---|---|---|---|---|---|---|---|---|---|---|---|
| ma101115_rel_withdbg.cz12a_c8r32 | 99.994 | 0.006 | nonzero | 0.002 | |||||||
| ma101115_rel_withdbg.cz12b_c8r32 | 99.992 | 0.007 | nonzero | 0.002 |
Insert response time histogram: each cell has the percentage of responses that take <= the time in the header and max is the max response time in seconds. For max values in the top 25% of the range have a red background and in the bottom 25% of the range have a green background. The red background is not used when the min value is within 80% of the max value.
| dbms | 256us | 1ms | 4ms | 16ms | 64ms | 256ms | 1s | 4s | 16s | gt | max |
|---|---|---|---|---|---|---|---|---|---|---|---|
| ma101115_rel_withdbg.cz12a_c8r32 | 19.717 | 78.456 | 1.828 | 0.011 | |||||||
| ma101115_rel_withdbg.cz12b_c8r32 | 22.389 | 75.756 | 1.856 | 0.015 |
Delete response time histogram: each cell has the percentage of responses that take <= the time in the header and max is the max response time in seconds. For max values in the top 25% of the range have a red background and in the bottom 25% of the range have a green background. The red background is not used when the min value is within 80% of the max value.
| dbms | 256us | 1ms | 4ms | 16ms | 64ms | 256ms | 1s | 4s | 16s | gt | max |
|---|---|---|---|---|---|---|---|---|---|---|---|
| ma101115_rel_withdbg.cz12a_c8r32 | 87.100 | 11.100 | 1.800 | 0.013 | |||||||
| ma101115_rel_withdbg.cz12b_c8r32 | 86.822 | 11.367 | 1.811 | 0.015 |
Performance metrics for the DBMS listed above. Some are normalized by throughput, others are not. Legend for results is here.
ips	qps	rps	rmbps	wps	wmbps	rpq	rkbpq	wpi	wkbpi	csps	cpups	cspq	cpupq	dbgb1	dbgb2	rss	maxop	p50	p99	tag
500	8579	0	0.0	62.2	2.0	0.000	0.000	0.124	4.152	50102	13.0	5.840	121	5.8	36.7	6.4	0.002	8575	8479	ma101115_rel_withdbg.cz12a_c8r32
500	8635	0	0.0	56.5	1.9	0.000	0.000	0.113	3.795	50337	12.6	5.829	117	5.8	36.7	6.4	0.002	8639	8527	ma101115_rel_withdbg.cz12b_c8r32
Average values from iostat.
r/s	rkB/s	rrqm/s	%rrqm	r_await	rareq-s	w/s	wkB/s	wrqm/s	%wrqm	w_await	wareq-s	d/s	dkB/s	drqm/s	%drqm	d_await	dareq-s	f/s	f_await	aqu-sz	%util
0.001	0.002	0.000	0.000	0.025	0.011	56.14	1911.9	0.537	7.731	7.120	85.80	0.002	0.236	0.000	0.000	0.008	1.181	1.217	2.143	0.051	1.443		ma101115_rel_withdbg.cz12a_c8r32
0.001	0.002	0.000	0.000	0.022	0.011	56.63	1901.9	0.546	7.840	7.140	85.14	0.006	0.047	0.000	0.000	0.022	0.234	1.913	2.200	0.056	1.559		ma101115_rel_withdbg.cz12b_c8r32
qr1000.L5
qr1000.L5: range queries with 1000 insert/s per client. Graphs for performance per 1-second interval are here.
Average throughput:
Query response time histogram: each cell has the percentage of responses that take <= the time in the header and max is the max response time in seconds. For max values in the top 25% of the range have a red background and in the bottom 25% of the range have a green background. The red background is not used when the min value is within 80% of the max value.
| dbms | 256us | 1ms | 4ms | 16ms | 64ms | 256ms | 1s | 4s | 16s | gt | max |
|---|---|---|---|---|---|---|---|---|---|---|---|
| ma101115_rel_withdbg.cz12a_c8r32 | 99.995 | 0.005 | nonzero | nonzero | 0.008 | ||||||
| ma101115_rel_withdbg.cz12b_c8r32 | 99.995 | 0.005 | nonzero | nonzero | nonzero | 0.018 |
Insert response time histogram: each cell has the percentage of responses that take <= the time in the header and max is the max response time in seconds. For max values in the top 25% of the range have a red background and in the bottom 25% of the range have a green background. The red background is not used when the min value is within 80% of the max value.
| dbms | 256us | 1ms | 4ms | 16ms | 64ms | 256ms | 1s | 4s | 16s | gt | max |
|---|---|---|---|---|---|---|---|---|---|---|---|
| ma101115_rel_withdbg.cz12a_c8r32 | 69.694 | 29.417 | 0.886 | 0.003 | 0.028 | ||||||
| ma101115_rel_withdbg.cz12b_c8r32 | 65.492 | 33.586 | 0.917 | 0.006 | 0.040 |
Delete response time histogram: each cell has the percentage of responses that take <= the time in the header and max is the max response time in seconds. For max values in the top 25% of the range have a red background and in the bottom 25% of the range have a green background. The red background is not used when the min value is within 80% of the max value.
| dbms | 256us | 1ms | 4ms | 16ms | 64ms | 256ms | 1s | 4s | 16s | gt | max |
|---|---|---|---|---|---|---|---|---|---|---|---|
| ma101115_rel_withdbg.cz12a_c8r32 | 93.089 | 6.028 | 0.881 | 0.003 | 0.029 | ||||||
| ma101115_rel_withdbg.cz12b_c8r32 | 93.025 | 6.067 | 0.900 | 0.008 | 0.040 |
Performance metrics for the DBMS listed above. Some are normalized by throughput, others are not. Legend for results is here.
ips	qps	rps	rmbps	wps	wmbps	rpq	rkbpq	wpi	wkbpi	csps	cpups	cspq	cpupq	dbgb1	dbgb2	rss	maxop	p50	p99	tag
999	9709	0	0.0	22.6	1.4	0.000	0.000	0.023	1.445	56063	13.7	5.774	113	5.8	36.7	6.4	0.008	9727	9535	ma101115_rel_withdbg.cz12a_c8r32
1000	9584	0	0.0	26.9	1.5	0.000	0.000	0.027	1.532	55328	13.6	5.773	114	5.8	36.7	6.4	0.018	9583	9455	ma101115_rel_withdbg.cz12b_c8r32
Average values from iostat.
r/s	rkB/s	rrqm/s	%rrqm	r_await	rareq-s	w/s	wkB/s	wrqm/s	%wrqm	w_await	wareq-s	d/s	dkB/s	drqm/s	%drqm	d_await	dareq-s	f/s	f_await	aqu-sz	%util
0.001	0.002	0.000	0.000	0.019	0.011	16.49	1281.1	0.576	5.159	7.671	102.5	0.012	1.350	0.000	0.000	0.045	6.752	1.198	1.970	0.087	1.398		ma101115_rel_withdbg.cz12a_c8r32
0.001	0.002	0.000	0.000	0.022	0.011	26.76	1529.9	0.568	5.097	7.567	101.0	0.011	0.076	0.000	0.000	0.042	0.379	1.400	2.032	0.089	1.449		ma101115_rel_withdbg.cz12b_c8r32
qp1000.L6
qp1000.L6: point queries with 1000 insert/s per client. Graphs for performance per 1-second interval are here.
Average throughput:
Query response time histogram: each cell has the percentage of responses that take <= the time in the header and max is the max response time in seconds. For max values in the top 25% of the range have a red background and in the bottom 25% of the range have a green background. The red background is not used when the min value is within 80% of the max value.
| dbms | 256us | 1ms | 4ms | 16ms | 64ms | 256ms | 1s | 4s | 16s | gt | max |
|---|---|---|---|---|---|---|---|---|---|---|---|
| ma101115_rel_withdbg.cz12a_c8r32 | 99.991 | 0.009 | nonzero | 0.003 | |||||||
| ma101115_rel_withdbg.cz12b_c8r32 | 99.990 | 0.010 | nonzero | 0.002 |
Insert response time histogram: each cell has the percentage of responses that take <= the time in the header and max is the max response time in seconds. For max values in the top 25% of the range have a red background and in the bottom 25% of the range have a green background. The red background is not used when the min value is within 80% of the max value.
| dbms | 256us | 1ms | 4ms | 16ms | 64ms | 256ms | 1s | 4s | 16s | gt | max |
|---|---|---|---|---|---|---|---|---|---|---|---|
| ma101115_rel_withdbg.cz12a_c8r32 | 48.564 | 50.475 | 0.956 | 0.006 | 0.037 | ||||||
| ma101115_rel_withdbg.cz12b_c8r32 | 49.461 | 49.522 | 1.008 | 0.008 | 0.039 |
Delete response time histogram: each cell has the percentage of responses that take <= the time in the header and max is the max response time in seconds. For max values in the top 25% of the range have a red background and in the bottom 25% of the range have a green background. The red background is not used when the min value is within 80% of the max value.
| dbms | 256us | 1ms | 4ms | 16ms | 64ms | 256ms | 1s | 4s | 16s | gt | max |
|---|---|---|---|---|---|---|---|---|---|---|---|
| ma101115_rel_withdbg.cz12a_c8r32 | 92.556 | 6.519 | 0.925 | 0.015 | |||||||
| ma101115_rel_withdbg.cz12b_c8r32 | 92.347 | 6.717 | 0.925 | 0.011 | 0.037 |
Performance metrics for the DBMS listed above. Some are normalized by throughput, others are not. Legend for results is here.
ips	qps	rps	rmbps	wps	wmbps	rpq	rkbpq	wpi	wkbpi	csps	cpups	cspq	cpupq	dbgb1	dbgb2	rss	maxop	p50	p99	tag
999	8507	0	0.0	91.5	3.1	0.000	0.000	0.092	3.215	50037	13.4	5.882	126	5.8	36.7	6.4	0.003	8511	8415	ma101115_rel_withdbg.cz12a_c8r32
1000	8592	0	0.0	89.1	3.0	0.000	0.000	0.089	3.122	50406	13.4	5.867	125	5.8	36.7	6.4	0.002	8591	8479	ma101115_rel_withdbg.cz12b_c8r32
Average values from iostat.
r/s	rkB/s	rrqm/s	%rrqm	r_await	rareq-s	w/s	wkB/s	wrqm/s	%wrqm	w_await	wareq-s	d/s	dkB/s	drqm/s	%drqm	d_await	dareq-s	f/s	f_await	aqu-sz	%util
0.001	0.002	0.000	0.000	0.025	0.011	91.75	3220.5	0.578	4.629	6.909	94.57	0.011	1.364	0.000	0.000	0.050	6.819	1.320	1.972	0.097	1.508		ma101115_rel_withdbg.cz12a_c8r32
0.001	0.002	0.000	0.000	0.019	0.011	89.34	3128.9	0.575	4.667	6.969	94.67	0.011	0.082	0.000	0.000	0.058	0.412	2.284	2.013	0.104	1.649		ma101115_rel_withdbg.cz12b_c8r32
l.i0
l.i0: load without secondary indexes
Performance metrics for all DBMS, not just the ones listed above. Some are normalized by throughput, others are not. Legend for results is here.
ips	qps	rps	rmbps	wps	wmbps	rpq	rkbpq	wpi	wkbpi	csps	cpups	cspq	cpupq	dbgb1	dbgb2	rss	maxop	p50	p99	tag
164835	0	0	0.0	279.3	32.3	0.000	0.000	0.002	0.201	20508	20.1	0.124	10	2.0	32.8	2.5	0.119	166483	145680	ma101115_rel_withdbg.cz12a_c8r32
166667	0	0	0.0	279.9	32.5	0.000	0.000	0.002	0.199	20682	20.4	0.124	10	2.0	32.8	2.6	0.116	168578	147282	ma101115_rel_withdbg.cz12b_c8r32
l.x
l.x: create secondary indexes
Performance metrics for all DBMS, not just the ones listed above. Some are normalized by throughput, others are not. Legend for results is here.
ips	qps	rps	rmbps	wps	wmbps	rpq	rkbpq	wpi	wkbpi	csps	cpups	cspq	cpupq	dbgb1	dbgb2	rss	maxop	p50	p99	tag
187501	0	0	0.0	2503.0	166.2	0.000	0.000	0.013	0.908	7580	12.5	0.040	5	4.2	35.0	4.1	0.001	NA	NA	ma101115_rel_withdbg.cz12a_c8r32
187501	0	0	0.0	2568.9	169.9	0.000	0.000	0.014	0.928	7856	12.5	0.042	5	4.2	35.0	4.1	0.001	NA	NA	ma101115_rel_withdbg.cz12b_c8r32
l.i1
l.i1: continue load after secondary indexes created with 50 inserts per transaction
Performance metrics for all DBMS, not just the ones listed above. Some are normalized by throughput, others are not. Legend for results is here.
ips	qps	rps	rmbps	wps	wmbps	rpq	rkbpq	wpi	wkbpi	csps	cpups	cspq	cpupq	dbgb1	dbgb2	rss	maxop	p50	p99	tag
40650	0	0	0.0	3654.6	136.6	0.000	0.000	0.090	3.440	35919	33.5	0.884	66	5.8	36.7	6.4	0.264	42545	14198	ma101115_rel_withdbg.cz12a_c8r32
38424	0	0	0.0	3479.1	128.8	0.000	0.000	0.091	3.432	31596	31.9	0.822	66	5.8	36.7	6.4	0.205	39346	13798	ma101115_rel_withdbg.cz12b_c8r32
l.i2
l.i2: continue load after secondary indexes created with 5 inserts per transaction
Performance metrics for all DBMS, not just the ones listed above. Some are normalized by throughput, others are not. Legend for results is here.
ips	qps	rps	rmbps	wps	wmbps	rpq	rkbpq	wpi	wkbpi	csps	cpups	cspq	cpupq	dbgb1	dbgb2	rss	maxop	p50	p99	tag
27933	0	0	0.0	2032.0	77.6	0.000	0.000	0.073	2.846	133623	34.5	4.784	99	5.8	36.7	6.4	0.049	28242	25887	ma101115_rel_withdbg.cz12a_c8r32
27174	0	0	0.0	2015.7	76.2	0.000	0.000	0.074	2.871	128396	34.1	4.725	100	5.8	36.7	6.4	0.048	27957	23123	ma101115_rel_withdbg.cz12b_c8r32
qr100.L1
qr100.L1: range queries with 100 insert/s per client
Performance metrics for all DBMS, not just the ones listed above. Some are normalized by throughput, others are not. Legend for results is here.
ips	qps	rps	rmbps	wps	wmbps	rpq	rkbpq	wpi	wkbpi	csps	cpups	cspq	cpupq	dbgb1	dbgb2	rss	maxop	p50	p99	tag
100	9710	0	0.0	9.0	0.3	0.000	0.000	0.090	2.966	55651	13.1	5.732	108	5.8	36.7	6.4	0.001	9695	9583	ma101115_rel_withdbg.cz12a_c8r32
100	9654	0	0.0	9.1	0.3	0.000	0.000	0.091	2.980	55332	12.8	5.732	106	5.8	36.7	6.4	0.002	9663	9535	ma101115_rel_withdbg.cz12b_c8r32
qp100.L2
qp100.L2: point queries with 100 insert/s per client
Performance metrics for all DBMS, not just the ones listed above. Some are normalized by throughput, others are not. Legend for results is here.
ips	qps	rps	rmbps	wps	wmbps	rpq	rkbpq	wpi	wkbpi	csps	cpups	cspq	cpupq	dbgb1	dbgb2	rss	maxop	p50	p99	tag
100	8579	0	0.0	21.5	0.6	0.000	0.000	0.216	6.481	49758	12.4	5.800	116	5.8	36.7	6.4	0.001	8591	8479	ma101115_rel_withdbg.cz12a_c8r32
100	8619	0	0.0	21.8	0.6	0.000	0.000	0.218	6.493	49989	12.5	5.800	116	5.8	36.7	6.4	0.001	8623	8511	ma101115_rel_withdbg.cz12b_c8r32
qr500.L3
qr500.L3: range queries with 500 insert/s per client
Performance metrics for all DBMS, not just the ones listed above. Some are normalized by throughput, others are not. Legend for results is here.
ips	qps	rps	rmbps	wps	wmbps	rpq	rkbpq	wpi	wkbpi	csps	cpups	cspq	cpupq	dbgb1	dbgb2	rss	maxop	p50	p99	tag
500	9653	0	0.0	75.0	2.4	0.000	0.000	0.150	4.920	55831	13.0	5.784	108	5.8	36.7	6.4	0.007	9647	9534	ma101115_rel_withdbg.cz12a_c8r32
500	9611	0	0.0	62.8	2.1	0.000	0.000	0.126	4.228	55473	12.7	5.772	106	5.8	36.7	6.4	0.006	9615	9487	ma101115_rel_withdbg.cz12b_c8r32
qp500.L4
qp500.L4: point queries with 500 insert/s per client
Performance metrics for all DBMS, not just the ones listed above. Some are normalized by throughput, others are not. Legend for results is here.
ips	qps	rps	rmbps	wps	wmbps	rpq	rkbpq	wpi	wkbpi	csps	cpups	cspq	cpupq	dbgb1	dbgb2	rss	maxop	p50	p99	tag
500	8579	0	0.0	62.2	2.0	0.000	0.000	0.124	4.152	50102	13.0	5.840	121	5.8	36.7	6.4	0.002	8575	8479	ma101115_rel_withdbg.cz12a_c8r32
500	8635	0	0.0	56.5	1.9	0.000	0.000	0.113	3.795	50337	12.6	5.829	117	5.8	36.7	6.4	0.002	8639	8527	ma101115_rel_withdbg.cz12b_c8r32
qr1000.L5
qr1000.L5: range queries with 1000 insert/s per client
Performance metrics for all DBMS, not just the ones listed above. Some are normalized by throughput, others are not. Legend for results is here.
ips	qps	rps	rmbps	wps	wmbps	rpq	rkbpq	wpi	wkbpi	csps	cpups	cspq	cpupq	dbgb1	dbgb2	rss	maxop	p50	p99	tag
999	9709	0	0.0	22.6	1.4	0.000	0.000	0.023	1.445	56063	13.7	5.774	113	5.8	36.7	6.4	0.008	9727	9535	ma101115_rel_withdbg.cz12a_c8r32
1000	9584	0	0.0	26.9	1.5	0.000	0.000	0.027	1.532	55328	13.6	5.773	114	5.8	36.7	6.4	0.018	9583	9455	ma101115_rel_withdbg.cz12b_c8r32
qp1000.L6
qp1000.L6: point queries with 1000 insert/s per client
Performance metrics for all DBMS, not just the ones listed above. Some are normalized by throughput, others are not. Legend for results is here.
ips	qps	rps	rmbps	wps	wmbps	rpq	rkbpq	wpi	wkbpi	csps	cpups	cspq	cpupq	dbgb1	dbgb2	rss	maxop	p50	p99	tag
999	8507	0	0.0	91.5	3.1	0.000	0.000	0.092	3.215	50037	13.4	5.882	126	5.8	36.7	6.4	0.003	8511	8415	ma101115_rel_withdbg.cz12a_c8r32
1000	8592	0	0.0	89.1	3.0	0.000	0.000	0.089	3.122	50406	13.4	5.867	125	5.8	36.7	6.4	0.002	8591	8479	ma101115_rel_withdbg.cz12b_c8r32
l.i0
- l.i0: load without secondary indexes
- Legend for results is here.
- Each entry lists the percentage of responses that fit in that bucket (slower than max time for previous bucket, faster than min time for next bucket).
Insert response time histogram
256us	1ms	4ms	16ms	64ms	256ms	1s	4s	16s	gt	max	tag
0.000	99.714	0.096	0.051	0.134	0.004	0.000	0.000	0.000	0.000	0.119	ma101115_rel_withdbg.cz12a_c8r32
0.000	99.706	0.105	0.062	0.124	0.004	0.000	0.000	0.000	0.000	0.116	ma101115_rel_withdbg.cz12b_c8r32
l.x
- l.x: create secondary indexes
- Legend for results is here.
- Each entry lists the percentage of responses that fit in that bucket (slower than max time for previous bucket, faster than min time for next bucket).
TODO - determine whether there is data for create index response time
l.i1
- l.i1: continue load after secondary indexes created with 50 inserts per transaction
- Legend for results is here.
- Each entry lists the percentage of responses that fit in that bucket (slower than max time for previous bucket, faster than min time for next bucket).
Insert response time histogram
256us	1ms	4ms	16ms	64ms	256ms	1s	4s	16s	gt	max	tag
0.000	22.581	76.567	0.783	0.068	0.001	nonzero	0.000	0.000	0.000	0.264	ma101115_rel_withdbg.cz12a_c8r32
0.000	23.989	74.584	1.190	0.233	0.004	0.000	0.000	0.000	0.000	0.205	ma101115_rel_withdbg.cz12b_c8r32
Delete response time histogram
256us	1ms	4ms	16ms	64ms	256ms	1s	4s	16s	gt	max	tag
0.000	86.579	12.809	0.557	0.054	0.001	nonzero	0.000	0.000	0.000	0.264	ma101115_rel_withdbg.cz12a_c8r32
0.000	86.570	12.279	0.956	0.193	0.002	0.000	0.000	0.000	0.000	0.190	ma101115_rel_withdbg.cz12b_c8r32
l.i2
- l.i2: continue load after secondary indexes created with 5 inserts per transaction
- Legend for results is here.
- Each entry lists the percentage of responses that fit in that bucket (slower than max time for previous bucket, faster than min time for next bucket).
Insert response time histogram
256us	1ms	4ms	16ms	64ms	256ms	1s	4s	16s	gt	max	tag
98.455	1.472	0.054	0.018	0.001	0.000	0.000	0.000	0.000	0.000	0.049	ma101115_rel_withdbg.cz12a_c8r32
98.291	1.599	0.041	0.066	0.003	0.000	0.000	0.000	0.000	0.000	0.048	ma101115_rel_withdbg.cz12b_c8r32
Delete response time histogram
256us	1ms	4ms	16ms	64ms	256ms	1s	4s	16s	gt	max	tag
99.635	0.302	0.047	0.016	0.001	0.000	0.000	0.000	0.000	0.000	0.049	ma101115_rel_withdbg.cz12a_c8r32
99.548	0.355	0.034	0.060	0.003	0.000	0.000	0.000	0.000	0.000	0.048	ma101115_rel_withdbg.cz12b_c8r32
qr100.L1
- qr100.L1: range queries with 100 insert/s per client
- Legend for results is here.
- Each entry lists the percentage of responses that fit in that bucket (slower than max time for previous bucket, faster than min time for next bucket).
Query response time histogram
256us	1ms	4ms	16ms	64ms	256ms	1s	4s	16s	gt	max	tag
99.999	0.001	0.000	0.000	0.000	0.000	0.000	0.000	0.000	0.000	0.001	ma101115_rel_withdbg.cz12a_c8r32
99.998	0.002	nonzero	0.000	0.000	0.000	0.000	0.000	0.000	0.000	0.002	ma101115_rel_withdbg.cz12b_c8r32
Insert response time histogram
256us	1ms	4ms	16ms	64ms	256ms	1s	4s	16s	gt	max	tag
0.000	21.167	69.917	8.889	0.028	0.000	0.000	0.000	0.000	0.000	0.026	ma101115_rel_withdbg.cz12a_c8r32
0.000	24.222	66.944	8.806	0.028	0.000	0.000	0.000	0.000	0.000	0.026	ma101115_rel_withdbg.cz12b_c8r32
Delete response time histogram
256us	1ms	4ms	16ms	64ms	256ms	1s	4s	16s	gt	max	tag
0.000	48.778	42.500	8.694	0.028	0.000	0.000	0.000	0.000	0.000	0.021	ma101115_rel_withdbg.cz12a_c8r32
0.000	46.750	44.528	8.722	0.000	0.000	0.000	0.000	0.000	0.000	0.012	ma101115_rel_withdbg.cz12b_c8r32
qp100.L2
- qp100.L2: point queries with 100 insert/s per client
- Legend for results is here.
- Each entry lists the percentage of responses that fit in that bucket (slower than max time for previous bucket, faster than min time for next bucket).
Query response time histogram
256us	1ms	4ms	16ms	64ms	256ms	1s	4s	16s	gt	max	tag
99.997	0.003	nonzero	0.000	0.000	0.000	0.000	0.000	0.000	0.000	0.001	ma101115_rel_withdbg.cz12a_c8r32
99.997	0.003	nonzero	0.000	0.000	0.000	0.000	0.000	0.000	0.000	0.001	ma101115_rel_withdbg.cz12b_c8r32
Insert response time histogram
256us	1ms	4ms	16ms	64ms	256ms	1s	4s	16s	gt	max	tag
0.000	2.528	88.667	8.806	0.000	0.000	0.000	0.000	0.000	0.000	0.011	ma101115_rel_withdbg.cz12a_c8r32
0.000	0.333	90.861	8.806	0.000	0.000	0.000	0.000	0.000	0.000	0.012	ma101115_rel_withdbg.cz12b_c8r32
Delete response time histogram
256us	1ms	4ms	16ms	64ms	256ms	1s	4s	16s	gt	max	tag
0.000	43.778	47.472	8.750	0.000	0.000	0.000	0.000	0.000	0.000	0.011	ma101115_rel_withdbg.cz12a_c8r32
0.000	41.417	49.889	8.694	0.000	0.000	0.000	0.000	0.000	0.000	0.012	ma101115_rel_withdbg.cz12b_c8r32
qr500.L3
- qr500.L3: range queries with 500 insert/s per client
- Legend for results is here.
- Each entry lists the percentage of responses that fit in that bucket (slower than max time for previous bucket, faster than min time for next bucket).
Query response time histogram
256us	1ms	4ms	16ms	64ms	256ms	1s	4s	16s	gt	max	tag
99.996	0.004	nonzero	nonzero	0.000	0.000	0.000	0.000	0.000	0.000	0.007	ma101115_rel_withdbg.cz12a_c8r32
99.996	0.004	nonzero	nonzero	0.000	0.000	0.000	0.000	0.000	0.000	0.006	ma101115_rel_withdbg.cz12b_c8r32
Insert response time histogram
256us	1ms	4ms	16ms	64ms	256ms	1s	4s	16s	gt	max	tag
0.000	54.622	43.600	1.778	0.000	0.000	0.000	0.000	0.000	0.000	0.011	ma101115_rel_withdbg.cz12a_c8r32
0.000	54.233	43.939	1.817	0.011	0.000	0.000	0.000	0.000	0.000	0.016	ma101115_rel_withdbg.cz12b_c8r32
Delete response time histogram
256us	1ms	4ms	16ms	64ms	256ms	1s	4s	16s	gt	max	tag
0.000	88.806	9.428	1.767	0.000	0.000	0.000	0.000	0.000	0.000	0.011	ma101115_rel_withdbg.cz12a_c8r32
0.000	88.478	9.722	1.800	0.000	0.000	0.000	0.000	0.000	0.000	0.016	ma101115_rel_withdbg.cz12b_c8r32
qp500.L4
- qp500.L4: point queries with 500 insert/s per client
- Legend for results is here.
- Each entry lists the percentage of responses that fit in that bucket (slower than max time for previous bucket, faster than min time for next bucket).
Query response time histogram
256us	1ms	4ms	16ms	64ms	256ms	1s	4s	16s	gt	max	tag
99.994	0.006	nonzero	0.000	0.000	0.000	0.000	0.000	0.000	0.000	0.002	ma101115_rel_withdbg.cz12a_c8r32
99.992	0.007	nonzero	0.000	0.000	0.000	0.000	0.000	0.000	0.000	0.002	ma101115_rel_withdbg.cz12b_c8r32
Insert response time histogram
256us	1ms	4ms	16ms	64ms	256ms	1s	4s	16s	gt	max	tag
0.000	19.717	78.456	1.828	0.000	0.000	0.000	0.000	0.000	0.000	0.011	ma101115_rel_withdbg.cz12a_c8r32
0.000	22.389	75.756	1.856	0.000	0.000	0.000	0.000	0.000	0.000	0.015	ma101115_rel_withdbg.cz12b_c8r32
Delete response time histogram
256us	1ms	4ms	16ms	64ms	256ms	1s	4s	16s	gt	max	tag
0.000	87.100	11.100	1.800	0.000	0.000	0.000	0.000	0.000	0.000	0.013	ma101115_rel_withdbg.cz12a_c8r32
0.000	86.822	11.367	1.811	0.000	0.000	0.000	0.000	0.000	0.000	0.015	ma101115_rel_withdbg.cz12b_c8r32
qr1000.L5
- qr1000.L5: range queries with 1000 insert/s per client
- Legend for results is here.
- Each entry lists the percentage of responses that fit in that bucket (slower than max time for previous bucket, faster than min time for next bucket).
Query response time histogram
256us	1ms	4ms	16ms	64ms	256ms	1s	4s	16s	gt	max	tag
99.995	0.005	nonzero	nonzero	0.000	0.000	0.000	0.000	0.000	0.000	0.008	ma101115_rel_withdbg.cz12a_c8r32
99.995	0.005	nonzero	nonzero	nonzero	0.000	0.000	0.000	0.000	0.000	0.018	ma101115_rel_withdbg.cz12b_c8r32
Insert response time histogram
256us	1ms	4ms	16ms	64ms	256ms	1s	4s	16s	gt	max	tag
0.000	69.694	29.417	0.886	0.003	0.000	0.000	0.000	0.000	0.000	0.028	ma101115_rel_withdbg.cz12a_c8r32
0.000	65.492	33.586	0.917	0.006	0.000	0.000	0.000	0.000	0.000	0.040	ma101115_rel_withdbg.cz12b_c8r32
Delete response time histogram
256us	1ms	4ms	16ms	64ms	256ms	1s	4s	16s	gt	max	tag
0.000	93.089	6.028	0.881	0.003	0.000	0.000	0.000	0.000	0.000	0.029	ma101115_rel_withdbg.cz12a_c8r32
0.000	93.025	6.067	0.900	0.008	0.000	0.000	0.000	0.000	0.000	0.040	ma101115_rel_withdbg.cz12b_c8r32
qp1000.L6
- qp1000.L6: point queries with 1000 insert/s per client
- Legend for results is here.
- Each entry lists the percentage of responses that fit in that bucket (slower than max time for previous bucket, faster than min time for next bucket).
Query response time histogram
256us	1ms	4ms	16ms	64ms	256ms	1s	4s	16s	gt	max	tag
99.991	0.009	nonzero	0.000	0.000	0.000	0.000	0.000	0.000	0.000	0.003	ma101115_rel_withdbg.cz12a_c8r32
99.990	0.010	nonzero	0.000	0.000	0.000	0.000	0.000	0.000	0.000	0.002	ma101115_rel_withdbg.cz12b_c8r32
Insert response time histogram
256us	1ms	4ms	16ms	64ms	256ms	1s	4s	16s	gt	max	tag
0.000	48.564	50.475	0.956	0.006	0.000	0.000	0.000	0.000	0.000	0.037	ma101115_rel_withdbg.cz12a_c8r32
0.000	49.461	49.522	1.008	0.008	0.000	0.000	0.000	0.000	0.000	0.039	ma101115_rel_withdbg.cz12b_c8r32
Delete response time histogram
256us	1ms	4ms	16ms	64ms	256ms	1s	4s	16s	gt	max	tag
0.000	92.556	6.519	0.925	0.000	0.000	0.000	0.000	0.000	0.000	0.015	ma101115_rel_withdbg.cz12a_c8r32
0.000	92.347	6.717	0.925	0.011	0.000	0.000	0.000	0.000	0.000	0.037	ma101115_rel_withdbg.cz12b_c8r32