Introduction
This is a report for the insert benchmark with 800M docs and 1 client(s). It is generated by scripts (bash, awk, sed) and Tufte might not be impressed. An overview of the insert benchmark is here and a short update is here. Below, by DBMS, I mean DBMS+version.config. An example is my8020.c10b40 where my means MySQL, 8020 is version 8.0.20 and c10b40 is the name for the configuration file.
The test server has 8 AMD cores, 32G RAM and an NVMe device for the database. The benchmark was run with 1 client and there were 1 or 3 connections per client (1 for queries or inserts without rate limits, 1+1 for rate limited inserts+deletes). It uses 1 table with a table per client. t loads 800M rows per table without secondary indexes, creates 3 secondary indexes per table, then inserts 4m+1m rows per table with a delete per insert to avoid growing the table. It then does 6 read+write tests for 1800s each that do queries as fast as possible with 100,100,500,500,1000,1000 inserts/s and the same for deletes/s per client concurrent with the queries. The database is larger than memory and the workload is IO-bound for except for the range query tests (qr*). Clients and the DBMS share one server.
The tested DBMS are:
- ma101115_rel_withdbg.cz12a_c8r32 - MariaDB 10.11.15 with the z12a_c8r32 config that uses innodb_flush_method=O_DIRECT_NO_FSYNC
- ma101115_rel_withdbg.cz12b_c8r32 - MariaDB 10.11.15 with the z12b_c8r32 config that uses innodb_flush_method=O_DIRECT
Contents
- Summary
- l.i0: load without secondary indexes
- l.x: create secondary indexes
- l.i1: continue load after secondary indexes created with 50 inserts per transaction
- l.i2: continue load after secondary indexes created with 5 inserts per transaction
- qr100.L1: range queries with 100 insert/s per client
- qp100.L2: point queries with 100 insert/s per client
- qr500.L3: range queries with 500 insert/s per client
- qp500.L4: point queries with 500 insert/s per client
- qr1000.L5: range queries with 1000 insert/s per client
- qp1000.L6: point queries with 1000 insert/s per client
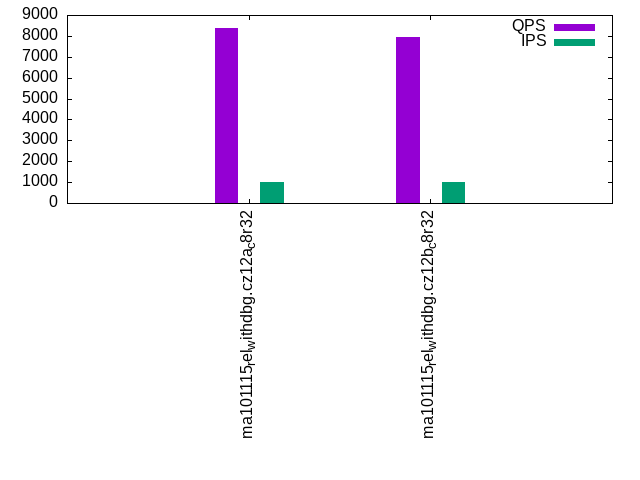
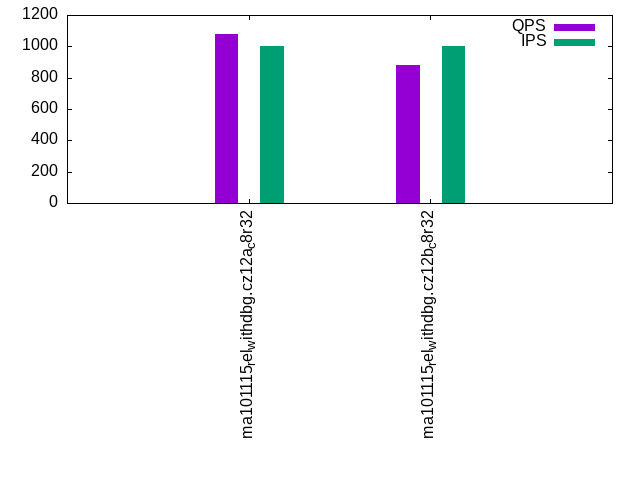
Summary
The numbers are inserts/s for l.i0, l.i1 and l.i2, indexed docs (or rows) /s for l.x and queries/s for qr100, qp100 thru qr1000, qp1000" The values are the average rate over the entire test for inserts (IPS) and queries (QPS). The range of values for IPS and QPS is split into 3 parts: bottom 25%, middle 50%, top 25%. Values in the bottom 25% have a red background, values in the top 25% have a green background and values in the middle have no color. A gray background is used for values that can be ignored because the DBMS did not sustain the target insert rate. Red backgrounds are not used when the minimum value is within 80% of the max value.
| dbms | l.i0 | l.x | l.i1 | l.i2 | qr100 | qp100 | qr500 | qp500 | qr1000 | qp1000 |
|---|---|---|---|---|---|---|---|---|---|---|
| ma101115_rel_withdbg.cz12a_c8r32 | 156280 | 132604 | 2478 | 3067 | 8978 | 1382 | 8701 | 1206 | 8395 | 1078 |
| ma101115_rel_withdbg.cz12b_c8r32 | 160096 | 134862 | 1729 | 2070 | 8931 | 1350 | 8475 | 1074 | 7930 | 882 |
This table has relative throughput, throughput for the DBMS relative to the DBMS in the first line, using the absolute throughput from the previous table. Values less than 0.95 have a yellow background. Values greater than 1.05 have a blue background.
| dbms | l.i0 | l.x | l.i1 | l.i2 | qr100 | qp100 | qr500 | qp500 | qr1000 | qp1000 |
|---|---|---|---|---|---|---|---|---|---|---|
| ma101115_rel_withdbg.cz12a_c8r32 | 1.00 | 1.00 | 1.00 | 1.00 | 1.00 | 1.00 | 1.00 | 1.00 | 1.00 | 1.00 |
| ma101115_rel_withdbg.cz12b_c8r32 | 1.02 | 1.02 | 0.70 | 0.67 | 0.99 | 0.98 | 0.97 | 0.89 | 0.94 | 0.82 |
This lists the average rate of inserts/s for the tests that do inserts concurrent with queries. For such tests the query rate is listed in the table above. The read+write tests are setup so that the insert rate should match the target rate every second. Cells that are not at least 95% of the target have a red background to indicate a failure to satisfy the target.
| dbms | qr100.L1 | qp100.L2 | qr500.L3 | qp500.L4 | qr1000.L5 | qp1000.L6 |
|---|---|---|---|---|---|---|
| ma101115_rel_withdbg.cz12a_c8r32 | 100 | 100 | 500 | 500 | 999 | 999 |
| ma101115_rel_withdbg.cz12b_c8r32 | 100 | 100 | 500 | 500 | 999 | 999 |
| target | 100 | 100 | 500 | 500 | 1000 | 1000 |
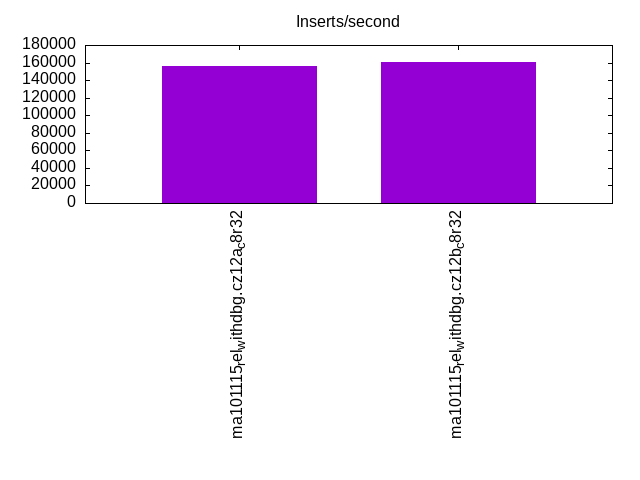
l.i0
l.i0: load without secondary indexes. Graphs for performance per 1-second interval are here.
Average throughput:
Insert response time histogram: each cell has the percentage of responses that take <= the time in the header and max is the max response time in seconds. For the max column values in the top 25% of the range have a red background and in the bottom 25% of the range have a green background. The red background is not used when the min value is within 80% of the max value.
| dbms | 256us | 1ms | 4ms | 16ms | 64ms | 256ms | 1s | 4s | 16s | gt | max |
|---|---|---|---|---|---|---|---|---|---|---|---|
| ma101115_rel_withdbg.cz12a_c8r32 | 99.588 | 0.210 | 0.058 | 0.136 | 0.009 | nonzero | 0.482 | ||||
| ma101115_rel_withdbg.cz12b_c8r32 | 99.680 | 0.127 | 0.070 | 0.119 | 0.005 | 0.199 |
Performance metrics for the DBMS listed above. Some are normalized by throughput, others are not. Legend for results is here.
ips	qps	rps	rmbps	wps	wmbps	rpq	rkbpq	wpi	wkbpi	csps	cpups	cspq	cpupq	dbgb1	dbgb2	rss	maxop	p50	p99	tag
156280	0	0	0.0	929.5	42.0	0.000	0.000	0.006	0.275	21466	19.7	0.137	10	52.6	83.4	23.1	0.482	161280	116283	ma101115_rel_withdbg.cz12a_c8r32
160096	0	0	0.0	959.3	43.0	0.000	0.000	0.006	0.275	21275	20.1	0.133	10	52.6	83.4	23.4	0.199	160980	140878	ma101115_rel_withdbg.cz12b_c8r32
Average values from iostat.
r/s	rkB/s	rrqm/s	%rrqm	r_await	rareq-s	w/s	wkB/s	wrqm/s	%wrqm	w_await	wareq-s	d/s	dkB/s	drqm/s	%drqm	d_await	dareq-s	f/s	f_await	aqu-sz	%util
0.276	1.356	0.000	0.000	2.546	2.658	930.3	43002.0	23.65	3.363	1.641	51.56	0.714	17.58	0.000	0.000	0.460	21.71	7.264	1.794	1.171	6.949		ma101115_rel_withdbg.cz12a_c8r32
0.261	1.325	0.003	0.073	2.450	2.699	960.1	44049.6	25.25	3.321	1.473	50.30	0.765	6.177	0.000	0.000	0.448	3.810	14.94	1.408	1.158	7.643		ma101115_rel_withdbg.cz12b_c8r32
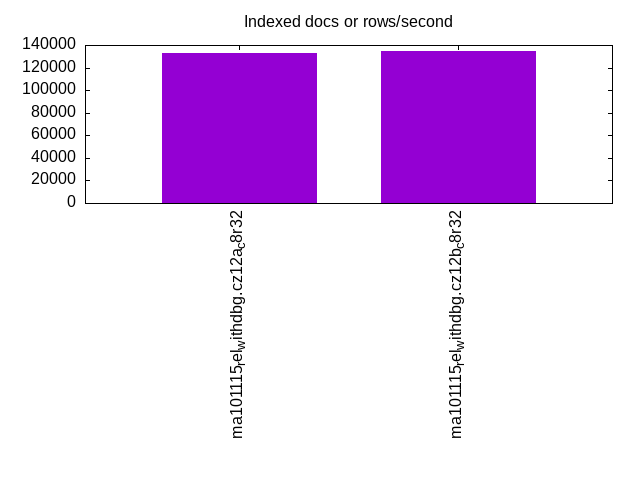
l.x
l.x: create secondary indexes.
Average throughput:
Performance metrics for the DBMS listed above. Some are normalized by throughput, others are not. Legend for results is here.
ips	qps	rps	rmbps	wps	wmbps	rpq	rkbpq	wpi	wkbpi	csps	cpups	cspq	cpupq	dbgb1	dbgb2	rss	maxop	p50	p99	tag
132604	0	1413	131.5	1587.7	146.4	0.011	1.016	0.012	1.131	4352	12.0	0.033	7	111.5	142.3	23.1	0.001	NA	NA	ma101115_rel_withdbg.cz12a_c8r32
134862	0	1434	133.6	1614.3	148.9	0.011	1.014	0.012	1.131	4458	11.9	0.033	7	111.5	142.3	23.4	0.001	NA	NA	ma101115_rel_withdbg.cz12b_c8r32
Average values from iostat.
r/s	rkB/s	rrqm/s	%rrqm	r_await	rareq-s	w/s	wkB/s	wrqm/s	%wrqm	w_await	wareq-s	d/s	dkB/s	drqm/s	%drqm	d_await	dareq-s	f/s	f_await	aqu-sz	%util
1412.7	134785	0.000	0.000	0.143	103.2	1585.5	150010	14.24	1.360	0.598	117.5	0.416	5448.2	0.000	0.000	0.004	32.20	5.713	3.283	0.870	20.03		ma101115_rel_withdbg.cz12a_c8r32
1433.3	136889	0.000	0.000	0.132	102.9	1613.9	152557	15.01	1.347	0.333	117.5	0.356	5538.2	0.000	0.000	0.001	27.78	6.334	1.858	0.581	18.53		ma101115_rel_withdbg.cz12b_c8r32
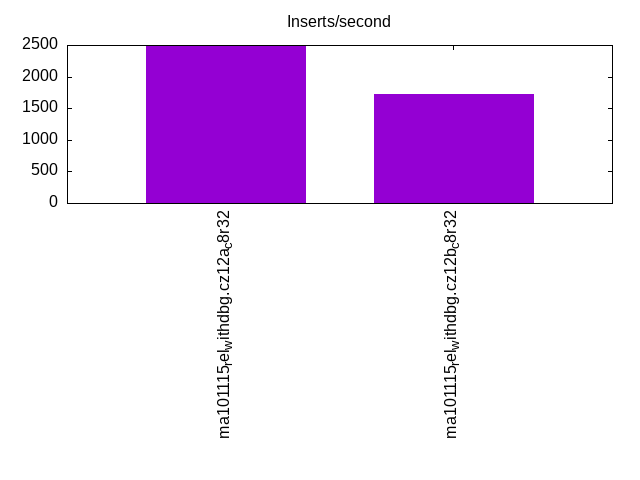
l.i1
l.i1: continue load after secondary indexes created with 50 inserts per transaction. Graphs for performance per 1-second interval are here.
Average throughput:
Insert response time histogram: each cell has the percentage of responses that take <= the time in the header and max is the max response time in seconds. For the max column values in the top 25% of the range have a red background and in the bottom 25% of the range have a green background. The red background is not used when the min value is within 80% of the max value.
| dbms | 256us | 1ms | 4ms | 16ms | 64ms | 256ms | 1s | 4s | 16s | gt | max |
|---|---|---|---|---|---|---|---|---|---|---|---|
| ma101115_rel_withdbg.cz12a_c8r32 | 59.775 | 38.289 | 1.929 | 0.006 | 0.001 | 3.042 | |||||
| ma101115_rel_withdbg.cz12b_c8r32 | 46.706 | 43.899 | 9.355 | 0.039 | 0.001 | 2.466 |
Delete response time histogram: each cell has the percentage of responses that take <= the time in the header and max is the max response time in seconds. For the max column values in the top 25% of the range have a red background and in the bottom 25% of the range have a green background. The red background is not used when the min value is within 80% of the max value.
| dbms | 256us | 1ms | 4ms | 16ms | 64ms | 256ms | 1s | 4s | 16s | gt | max |
|---|---|---|---|---|---|---|---|---|---|---|---|
| ma101115_rel_withdbg.cz12a_c8r32 | 84.324 | 15.664 | 0.009 | 0.003 | 0.001 | 3.001 | |||||
| ma101115_rel_withdbg.cz12b_c8r32 | 68.819 | 30.912 | 0.258 | 0.010 | 0.001 | 2.425 |
Performance metrics for the DBMS listed above. Some are normalized by throughput, others are not. Legend for results is here.
ips	qps	rps	rmbps	wps	wmbps	rpq	rkbpq	wpi	wkbpi	csps	cpups	cspq	cpupq	dbgb1	dbgb2	rss	maxop	p50	p99	tag
2478	0	11494	179.6	13959.7	373.4	4.638	74.203	5.633	154.274	98772	18.0	39.855	581	133.0	163.8	23.2	3.042	2500	1200	ma101115_rel_withdbg.cz12a_c8r32
1729	0	8016	125.3	9865.7	260.0	4.636	74.169	5.705	153.985	69637	13.5	40.269	625	133.0	163.8	23.4	2.466	1650	650	ma101115_rel_withdbg.cz12b_c8r32
Average values from iostat.
r/s	rkB/s	rrqm/s	%rrqm	r_await	rareq-s	w/s	wkB/s	wrqm/s	%wrqm	w_await	wareq-s	d/s	dkB/s	drqm/s	%drqm	d_await	dareq-s	f/s	f_await	aqu-sz	%util
11516.6	184264	0.000	0.000	0.097	16.00	13991.5	383315	65.29	0.689	0.130	27.65	0.007	0.030	0.000	0.000	0.022	0.112	17.17	2.826	2.946	75.87		ma101115_rel_withdbg.cz12a_c8r32
8021.9	128350	0.000	0.000	0.164	16.00	9877.0	266678	75.94	0.779	0.307	27.01	0.006	0.024	0.000	0.000	0.025	0.113	127.4	2.918	4.788	84.46		ma101115_rel_withdbg.cz12b_c8r32
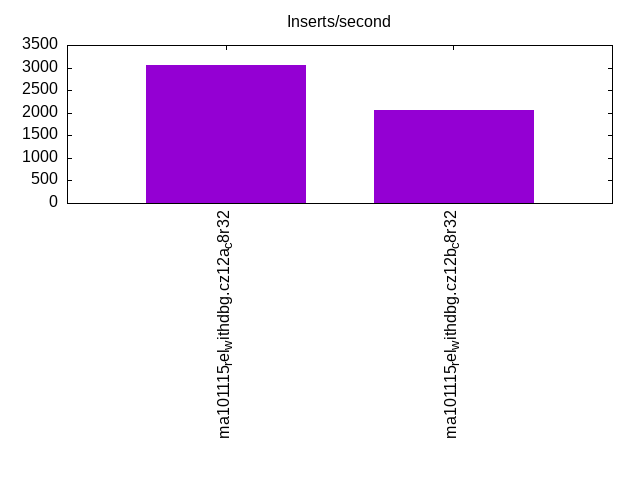
l.i2
l.i2: continue load after secondary indexes created with 5 inserts per transaction. Graphs for performance per 1-second interval are here.
Average throughput:
Insert response time histogram: each cell has the percentage of responses that take <= the time in the header and max is the max response time in seconds. For the max column values in the top 25% of the range have a red background and in the bottom 25% of the range have a green background. The red background is not used when the min value is within 80% of the max value.
| dbms | 256us | 1ms | 4ms | 16ms | 64ms | 256ms | 1s | 4s | 16s | gt | max |
|---|---|---|---|---|---|---|---|---|---|---|---|
| ma101115_rel_withdbg.cz12a_c8r32 | 0.001 | 20.322 | 73.823 | 5.790 | 0.063 | 0.038 | |||||
| ma101115_rel_withdbg.cz12b_c8r32 | 0.001 | 16.645 | 66.037 | 16.728 | 0.589 | 0.001 | 0.112 |
Delete response time histogram: each cell has the percentage of responses that take <= the time in the header and max is the max response time in seconds. For the max column values in the top 25% of the range have a red background and in the bottom 25% of the range have a green background. The red background is not used when the min value is within 80% of the max value.
| dbms | 256us | 1ms | 4ms | 16ms | 64ms | 256ms | 1s | 4s | 16s | gt | max |
|---|---|---|---|---|---|---|---|---|---|---|---|
| ma101115_rel_withdbg.cz12a_c8r32 | 0.009 | 57.694 | 39.279 | 2.994 | 0.023 | 0.037 | |||||
| ma101115_rel_withdbg.cz12b_c8r32 | 0.005 | 50.216 | 38.680 | 10.777 | 0.323 | 0.001 | 0.102 |
Performance metrics for the DBMS listed above. Some are normalized by throughput, others are not. Legend for results is here.
ips	qps	rps	rmbps	wps	wmbps	rpq	rkbpq	wpi	wkbpi	csps	cpups	cspq	cpupq	dbgb1	dbgb2	rss	maxop	p50	p99	tag
3067	0	12794	199.9	14035.2	390.8	4.171	66.738	4.576	130.465	112007	21.1	36.515	550	133.0	163.8	23.2	0.038	3060	2030	ma101115_rel_withdbg.cz12a_c8r32
2070	0	8630	134.9	9611.8	263.3	4.169	66.699	4.643	130.250	79048	15.8	38.182	611	133.0	163.8	23.5	0.112	2035	870	ma101115_rel_withdbg.cz12b_c8r32
Average values from iostat.
r/s	rkB/s	rrqm/s	%rrqm	r_await	rareq-s	w/s	wkB/s	wrqm/s	%wrqm	w_await	wareq-s	d/s	dkB/s	drqm/s	%drqm	d_await	dareq-s	f/s	f_await	aqu-sz	%util
12794.4	204710	0.000	0.000	0.099	16.00	14070.9	401205	43.16	0.307	0.115	28.54	0.034	0.263	0.000	0.000	0.133	1.219	10.12	3.200	2.901	76.18		ma101115_rel_withdbg.cz12a_c8r32
8621.1	137938	0.000	0.000	0.178	16.00	9618.8	269848	32.05	0.331	0.208	28.10	0.015	0.059	0.000	0.000	0.074	0.295	128.7	3.110	3.905	84.29		ma101115_rel_withdbg.cz12b_c8r32
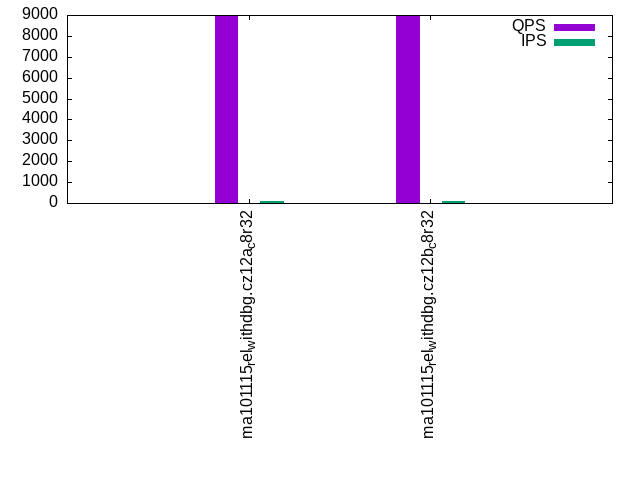
qr100.L1
qr100.L1: range queries with 100 insert/s per client. Graphs for performance per 1-second interval are here.
Average throughput:
Query response time histogram: each cell has the percentage of responses that take <= the time in the header and max is the max response time in seconds. For max values in the top 25% of the range have a red background and in the bottom 25% of the range have a green background. The red background is not used when the min value is within 80% of the max value.
| dbms | 256us | 1ms | 4ms | 16ms | 64ms | 256ms | 1s | 4s | 16s | gt | max |
|---|---|---|---|---|---|---|---|---|---|---|---|
| ma101115_rel_withdbg.cz12a_c8r32 | 99.800 | 0.173 | 0.013 | 0.014 | 0.014 | ||||||
| ma101115_rel_withdbg.cz12b_c8r32 | 99.774 | 0.194 | 0.017 | 0.015 | nonzero | 0.016 |
Insert response time histogram: each cell has the percentage of responses that take <= the time in the header and max is the max response time in seconds. For max values in the top 25% of the range have a red background and in the bottom 25% of the range have a green background. The red background is not used when the min value is within 80% of the max value.
| dbms | 256us | 1ms | 4ms | 16ms | 64ms | 256ms | 1s | 4s | 16s | gt | max |
|---|---|---|---|---|---|---|---|---|---|---|---|
| ma101115_rel_withdbg.cz12a_c8r32 | 55.889 | 44.111 | 0.033 | ||||||||
| ma101115_rel_withdbg.cz12b_c8r32 | 54.694 | 45.306 | 0.055 |
Delete response time histogram: each cell has the percentage of responses that take <= the time in the header and max is the max response time in seconds. For max values in the top 25% of the range have a red background and in the bottom 25% of the range have a green background. The red background is not used when the min value is within 80% of the max value.
| dbms | 256us | 1ms | 4ms | 16ms | 64ms | 256ms | 1s | 4s | 16s | gt | max |
|---|---|---|---|---|---|---|---|---|---|---|---|
| ma101115_rel_withdbg.cz12a_c8r32 | 66.389 | 33.611 | 0.043 | ||||||||
| ma101115_rel_withdbg.cz12b_c8r32 | 60.833 | 39.167 | 0.036 |
Performance metrics for the DBMS listed above. Some are normalized by throughput, others are not. Legend for results is here.
ips	qps	rps	rmbps	wps	wmbps	rpq	rkbpq	wpi	wkbpi	csps	cpups	cspq	cpupq	dbgb1	dbgb2	rss	maxop	p50	p99	tag
100	8978	453	7.1	91.4	3.0	0.050	0.808	0.914	30.554	53391	12.4	5.947	110	133.0	163.8	23.2	0.014	9023	8367	ma101115_rel_withdbg.cz12a_c8r32
100	8931	454	7.1	93.1	3.0	0.051	0.813	0.931	30.540	53090	12.4	5.945	111	133.0	163.8	23.4	0.016	8975	8367	ma101115_rel_withdbg.cz12b_c8r32
Average values from iostat.
r/s	rkB/s	rrqm/s	%rrqm	r_await	rareq-s	w/s	wkB/s	wrqm/s	%wrqm	w_await	wareq-s	d/s	dkB/s	drqm/s	%drqm	d_await	dareq-s	f/s	f_await	aqu-sz	%util
434.2	6947.0	0.000	0.000	0.141	16.00	91.59	3059.3	0.796	2.585	1.495	52.05	0.001	0.002	0.000	0.000	0.003	0.011	1.427	1.853	0.096	4.724		ma101115_rel_withdbg.cz12a_c8r32
435.3	6964.3	0.000	0.000	0.152	16.00	93.37	3060.9	0.930	3.074	1.782	52.48	0.009	0.038	0.000	0.000	0.033	0.189	2.950	2.167	0.111	5.196		ma101115_rel_withdbg.cz12b_c8r32
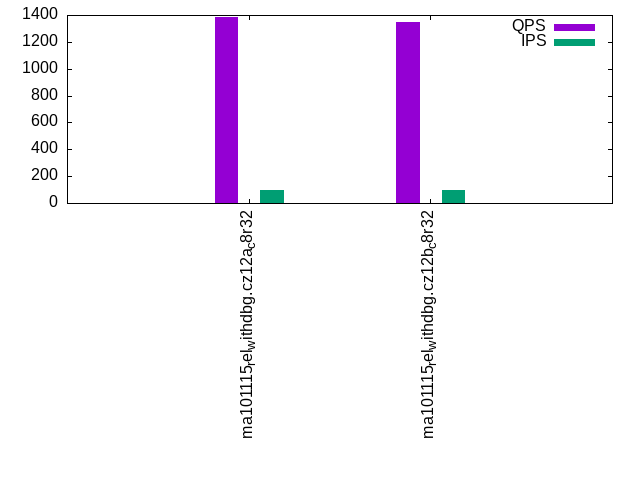
qp100.L2
qp100.L2: point queries with 100 insert/s per client. Graphs for performance per 1-second interval are here.
Average throughput:
Query response time histogram: each cell has the percentage of responses that take <= the time in the header and max is the max response time in seconds. For max values in the top 25% of the range have a red background and in the bottom 25% of the range have a green background. The red background is not used when the min value is within 80% of the max value.
| dbms | 256us | 1ms | 4ms | 16ms | 64ms | 256ms | 1s | 4s | 16s | gt | max |
|---|---|---|---|---|---|---|---|---|---|---|---|
| ma101115_rel_withdbg.cz12a_c8r32 | 0.093 | 96.576 | 3.327 | 0.004 | nonzero | 0.021 | |||||
| ma101115_rel_withdbg.cz12b_c8r32 | 0.096 | 95.877 | 3.908 | 0.119 | nonzero | 0.019 |
Insert response time histogram: each cell has the percentage of responses that take <= the time in the header and max is the max response time in seconds. For max values in the top 25% of the range have a red background and in the bottom 25% of the range have a green background. The red background is not used when the min value is within 80% of the max value.
| dbms | 256us | 1ms | 4ms | 16ms | 64ms | 256ms | 1s | 4s | 16s | gt | max |
|---|---|---|---|---|---|---|---|---|---|---|---|
| ma101115_rel_withdbg.cz12a_c8r32 | 89.694 | 10.306 | 0.032 | ||||||||
| ma101115_rel_withdbg.cz12b_c8r32 | 84.417 | 15.583 | 0.051 |
Delete response time histogram: each cell has the percentage of responses that take <= the time in the header and max is the max response time in seconds. For max values in the top 25% of the range have a red background and in the bottom 25% of the range have a green background. The red background is not used when the min value is within 80% of the max value.
| dbms | 256us | 1ms | 4ms | 16ms | 64ms | 256ms | 1s | 4s | 16s | gt | max |
|---|---|---|---|---|---|---|---|---|---|---|---|
| ma101115_rel_withdbg.cz12a_c8r32 | 98.944 | 1.056 | 0.026 | ||||||||
| ma101115_rel_withdbg.cz12b_c8r32 | 93.000 | 7.000 | 0.036 |
Performance metrics for the DBMS listed above. Some are normalized by throughput, others are not. Legend for results is here.
ips	qps	rps	rmbps	wps	wmbps	rpq	rkbpq	wpi	wkbpi	csps	cpups	cspq	cpupq	dbgb1	dbgb2	rss	maxop	p50	p99	tag
100	1382	9570	149.5	979.8	26.7	6.925	110.802	9.808	274.107	31021	5.1	22.446	295	133.0	163.8	23.2	0.021	1456	992	ma101115_rel_withdbg.cz12a_c8r32
100	1350	9377	146.5	996.1	26.7	6.943	111.090	9.961	272.909	30184	4.9	22.350	290	133.0	163.8	23.4	0.019	1424	912	ma101115_rel_withdbg.cz12b_c8r32
Average values from iostat.
r/s	rkB/s	rrqm/s	%rrqm	r_await	rareq-s	w/s	wkB/s	wrqm/s	%wrqm	w_await	wareq-s	d/s	dkB/s	drqm/s	%drqm	d_await	dareq-s	f/s	f_await	aqu-sz	%util
9569.6	153113	0.000	0.000	0.070	16.00	969.9	27108.9	3.105	0.331	0.037	28.23	0.001	0.002	0.000	0.000	0.000	0.011	1.937	1.608	0.742	66.44		ma101115_rel_withdbg.cz12a_c8r32
9377.4	150038	0.000	0.000	0.079	16.00	986.0	27013.3	3.362	0.359	0.075	27.61	0.009	0.038	0.000	0.000	0.039	0.189	18.73	1.493	0.819	67.56		ma101115_rel_withdbg.cz12b_c8r32
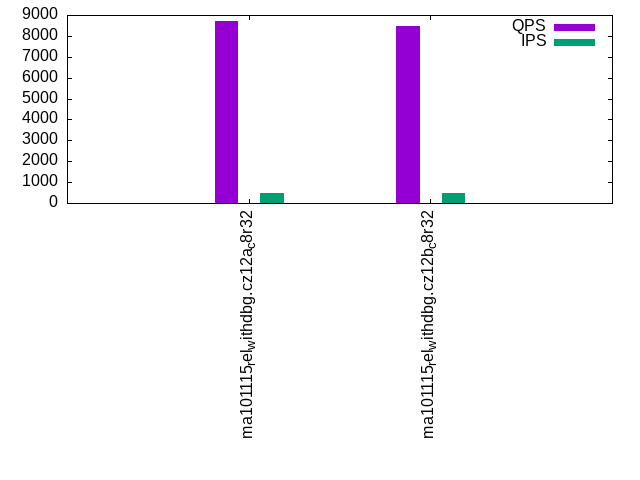
qr500.L3
qr500.L3: range queries with 500 insert/s per client. Graphs for performance per 1-second interval are here.
Average throughput:
Query response time histogram: each cell has the percentage of responses that take <= the time in the header and max is the max response time in seconds. For max values in the top 25% of the range have a red background and in the bottom 25% of the range have a green background. The red background is not used when the min value is within 80% of the max value.
| dbms | 256us | 1ms | 4ms | 16ms | 64ms | 256ms | 1s | 4s | 16s | gt | max |
|---|---|---|---|---|---|---|---|---|---|---|---|
| ma101115_rel_withdbg.cz12a_c8r32 | 99.523 | 0.425 | 0.026 | 0.026 | nonzero | 0.049 | |||||
| ma101115_rel_withdbg.cz12b_c8r32 | 99.312 | 0.534 | 0.126 | 0.028 | nonzero | 0.042 |
Insert response time histogram: each cell has the percentage of responses that take <= the time in the header and max is the max response time in seconds. For max values in the top 25% of the range have a red background and in the bottom 25% of the range have a green background. The red background is not used when the min value is within 80% of the max value.
| dbms | 256us | 1ms | 4ms | 16ms | 64ms | 256ms | 1s | 4s | 16s | gt | max |
|---|---|---|---|---|---|---|---|---|---|---|---|
| ma101115_rel_withdbg.cz12a_c8r32 | 84.294 | 15.700 | 0.006 | 0.064 | |||||||
| ma101115_rel_withdbg.cz12b_c8r32 | 77.006 | 22.856 | 0.139 | 0.107 |
Delete response time histogram: each cell has the percentage of responses that take <= the time in the header and max is the max response time in seconds. For max values in the top 25% of the range have a red background and in the bottom 25% of the range have a green background. The red background is not used when the min value is within 80% of the max value.
| dbms | 256us | 1ms | 4ms | 16ms | 64ms | 256ms | 1s | 4s | 16s | gt | max |
|---|---|---|---|---|---|---|---|---|---|---|---|
| ma101115_rel_withdbg.cz12a_c8r32 | 93.894 | 6.106 | 0.046 | ||||||||
| ma101115_rel_withdbg.cz12b_c8r32 | 84.372 | 15.628 | 0.054 |
Performance metrics for the DBMS listed above. Some are normalized by throughput, others are not. Legend for results is here.
ips	qps	rps	rmbps	wps	wmbps	rpq	rkbpq	wpi	wkbpi	csps	cpups	cspq	cpupq	dbgb1	dbgb2	rss	maxop	p50	p99	tag
500	8701	2375	37.1	1729.5	48.8	0.273	4.367	3.461	100.020	65626	14.8	7.542	136	133.0	163.8	23.2	0.049	8751	7375	ma101115_rel_withdbg.cz12a_c8r32
500	8475	2374	37.1	1776.5	49.1	0.280	4.482	3.553	100.529	63470	14.5	7.489	137	133.0	163.8	23.5	0.042	8575	6879	ma101115_rel_withdbg.cz12b_c8r32
Average values from iostat.
r/s	rkB/s	rrqm/s	%rrqm	r_await	rareq-s	w/s	wkB/s	wrqm/s	%wrqm	w_await	wareq-s	d/s	dkB/s	drqm/s	%drqm	d_await	dareq-s	f/s	f_await	aqu-sz	%util
2350.5	37608.0	0.000	0.000	0.079	16.00	1732.5	50063.9	6.080	0.362	0.078	29.69	0.004	0.016	0.000	0.000	0.017	0.078	2.711	1.609	0.314	14.76		ma101115_rel_withdbg.cz12a_c8r32
2350.7	37610.9	0.000	0.000	0.105	16.00	1773.2	50170.6	6.224	0.363	0.131	29.09	0.004	0.016	0.000	0.000	0.017	0.078	33.90	1.398	0.520	19.14		ma101115_rel_withdbg.cz12b_c8r32
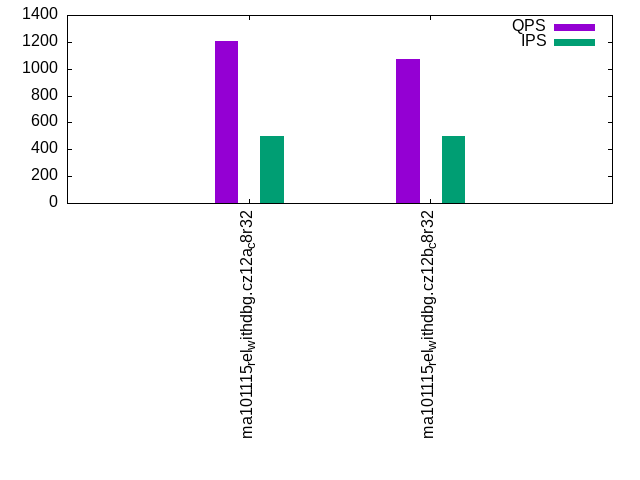
qp500.L4
qp500.L4: point queries with 500 insert/s per client. Graphs for performance per 1-second interval are here.
Average throughput:
Query response time histogram: each cell has the percentage of responses that take <= the time in the header and max is the max response time in seconds. For max values in the top 25% of the range have a red background and in the bottom 25% of the range have a green background. The red background is not used when the min value is within 80% of the max value.
| dbms | 256us | 1ms | 4ms | 16ms | 64ms | 256ms | 1s | 4s | 16s | gt | max |
|---|---|---|---|---|---|---|---|---|---|---|---|
| ma101115_rel_withdbg.cz12a_c8r32 | 0.007 | 92.534 | 7.248 | 0.211 | nonzero | 0.037 | |||||
| ma101115_rel_withdbg.cz12b_c8r32 | 0.005 | 89.571 | 8.754 | 1.669 | 0.002 | nonzero | nonzero | 0.349 |
Insert response time histogram: each cell has the percentage of responses that take <= the time in the header and max is the max response time in seconds. For max values in the top 25% of the range have a red background and in the bottom 25% of the range have a green background. The red background is not used when the min value is within 80% of the max value.
| dbms | 256us | 1ms | 4ms | 16ms | 64ms | 256ms | 1s | 4s | 16s | gt | max |
|---|---|---|---|---|---|---|---|---|---|---|---|
| ma101115_rel_withdbg.cz12a_c8r32 | 90.839 | 9.156 | 0.006 | 0.084 | |||||||
| ma101115_rel_withdbg.cz12b_c8r32 | 77.317 | 21.139 | 1.544 | 0.236 |
Delete response time histogram: each cell has the percentage of responses that take <= the time in the header and max is the max response time in seconds. For max values in the top 25% of the range have a red background and in the bottom 25% of the range have a green background. The red background is not used when the min value is within 80% of the max value.
| dbms | 256us | 1ms | 4ms | 16ms | 64ms | 256ms | 1s | 4s | 16s | gt | max |
|---|---|---|---|---|---|---|---|---|---|---|---|
| ma101115_rel_withdbg.cz12a_c8r32 | 96.350 | 3.650 | 0.054 | ||||||||
| ma101115_rel_withdbg.cz12b_c8r32 | 80.006 | 19.922 | 0.072 | 0.086 |
Performance metrics for the DBMS listed above. Some are normalized by throughput, others are not. Legend for results is here.
ips	qps	rps	rmbps	wps	wmbps	rpq	rkbpq	wpi	wkbpi	csps	cpups	cspq	cpupq	dbgb1	dbgb2	rss	maxop	p50	p99	tag
500	1206	11714	183.0	2961.5	81.9	9.712	155.393	5.927	167.902	43847	7.0	36.355	464	133.0	163.8	23.2	0.037	1232	992	ma101115_rel_withdbg.cz12a_c8r32
500	1074	10831	169.2	2962.6	80.6	10.088	161.413	5.925	165.022	41448	6.9	38.606	514	133.0	163.8	23.5	0.349	1088	816	ma101115_rel_withdbg.cz12b_c8r32
Average values from iostat.
r/s	rkB/s	rrqm/s	%rrqm	r_await	rareq-s	w/s	wkB/s	wrqm/s	%wrqm	w_await	wareq-s	d/s	dkB/s	drqm/s	%drqm	d_await	dareq-s	f/s	f_await	aqu-sz	%util
11715.2	187443	0.000	0.000	0.078	16.00	2953.9	83689.0	9.335	0.315	0.071	28.37	0.002	0.009	0.000	0.000	0.011	0.045	2.995	2.981	1.100	72.61		ma101115_rel_withdbg.cz12a_c8r32
10831.6	173306	0.000	0.000	0.093	16.00	2956.0	82330.4	9.384	0.316	0.127	27.89	0.023	0.874	0.000	0.000	0.114	4.368	45.84	2.799	1.501	76.16		ma101115_rel_withdbg.cz12b_c8r32
qr1000.L5
qr1000.L5: range queries with 1000 insert/s per client. Graphs for performance per 1-second interval are here.
Average throughput:
Query response time histogram: each cell has the percentage of responses that take <= the time in the header and max is the max response time in seconds. For max values in the top 25% of the range have a red background and in the bottom 25% of the range have a green background. The red background is not used when the min value is within 80% of the max value.
| dbms | 256us | 1ms | 4ms | 16ms | 64ms | 256ms | 1s | 4s | 16s | gt | max |
|---|---|---|---|---|---|---|---|---|---|---|---|
| ma101115_rel_withdbg.cz12a_c8r32 | 99.147 | 0.779 | 0.042 | 0.031 | nonzero | 0.036 | |||||
| ma101115_rel_withdbg.cz12b_c8r32 | 98.654 | 1.023 | 0.286 | 0.037 | nonzero | 0.033 |
Insert response time histogram: each cell has the percentage of responses that take <= the time in the header and max is the max response time in seconds. For max values in the top 25% of the range have a red background and in the bottom 25% of the range have a green background. The red background is not used when the min value is within 80% of the max value.
| dbms | 256us | 1ms | 4ms | 16ms | 64ms | 256ms | 1s | 4s | 16s | gt | max |
|---|---|---|---|---|---|---|---|---|---|---|---|
| ma101115_rel_withdbg.cz12a_c8r32 | 88.747 | 11.247 | 0.006 | 0.066 | |||||||
| ma101115_rel_withdbg.cz12b_c8r32 | 77.619 | 22.331 | 0.050 | 0.099 |
Delete response time histogram: each cell has the percentage of responses that take <= the time in the header and max is the max response time in seconds. For max values in the top 25% of the range have a red background and in the bottom 25% of the range have a green background. The red background is not used when the min value is within 80% of the max value.
| dbms | 256us | 1ms | 4ms | 16ms | 64ms | 256ms | 1s | 4s | 16s | gt | max |
|---|---|---|---|---|---|---|---|---|---|---|---|
| ma101115_rel_withdbg.cz12a_c8r32 | 0.003 | 96.758 | 3.239 | 0.051 | |||||||
| ma101115_rel_withdbg.cz12b_c8r32 | 85.119 | 14.881 | 0.057 |
Performance metrics for the DBMS listed above. Some are normalized by throughput, others are not. Legend for results is here.
ips	qps	rps	rmbps	wps	wmbps	rpq	rkbpq	wpi	wkbpi	csps	cpups	cspq	cpupq	dbgb1	dbgb2	rss	maxop	p50	p99	tag
999	8395	4228	66.1	3716.2	104.1	0.504	8.058	3.721	106.711	79962	17.0	9.525	162	133.0	163.9	23.2	0.036	8463	6783	ma101115_rel_withdbg.cz12a_c8r32
999	7930	4221	66.0	3807.9	104.7	0.532	8.517	3.810	107.292	75484	16.9	9.519	171	133.0	163.8	23.5	0.033	8111	5375	ma101115_rel_withdbg.cz12b_c8r32
Average values from iostat.
r/s	rkB/s	rrqm/s	%rrqm	r_await	rareq-s	w/s	wkB/s	wrqm/s	%wrqm	w_await	wareq-s	d/s	dkB/s	drqm/s	%drqm	d_await	dareq-s	f/s	f_await	aqu-sz	%util
4205.5	67287.6	0.000	0.000	0.075	16.00	3719.2	106666	12.35	0.333	0.054	28.86	0.007	0.045	0.000	0.000	0.021	0.189	4.220	1.680	0.520	24.09		ma101115_rel_withdbg.cz12a_c8r32
4201.0	67216.4	0.000	0.000	0.106	16.00	3809.9	107284	12.85	0.336	0.105	28.32	0.006	0.098	0.000	0.000	0.031	0.396	60.07	1.507	0.931	31.73		ma101115_rel_withdbg.cz12b_c8r32
qp1000.L6
qp1000.L6: point queries with 1000 insert/s per client. Graphs for performance per 1-second interval are here.
Average throughput:
Query response time histogram: each cell has the percentage of responses that take <= the time in the header and max is the max response time in seconds. For max values in the top 25% of the range have a red background and in the bottom 25% of the range have a green background. The red background is not used when the min value is within 80% of the max value.
| dbms | 256us | 1ms | 4ms | 16ms | 64ms | 256ms | 1s | 4s | 16s | gt | max |
|---|---|---|---|---|---|---|---|---|---|---|---|
| ma101115_rel_withdbg.cz12a_c8r32 | nonzero | 85.468 | 13.993 | 0.538 | nonzero | 0.041 | |||||
| ma101115_rel_withdbg.cz12b_c8r32 | nonzero | 78.183 | 18.001 | 3.813 | 0.003 | 0.052 |
Insert response time histogram: each cell has the percentage of responses that take <= the time in the header and max is the max response time in seconds. For max values in the top 25% of the range have a red background and in the bottom 25% of the range have a green background. The red background is not used when the min value is within 80% of the max value.
| dbms | 256us | 1ms | 4ms | 16ms | 64ms | 256ms | 1s | 4s | 16s | gt | max |
|---|---|---|---|---|---|---|---|---|---|---|---|
| ma101115_rel_withdbg.cz12a_c8r32 | 85.578 | 14.389 | 0.033 | 0.076 | |||||||
| ma101115_rel_withdbg.cz12b_c8r32 | 75.653 | 23.556 | 0.792 | 0.166 |
Delete response time histogram: each cell has the percentage of responses that take <= the time in the header and max is the max response time in seconds. For max values in the top 25% of the range have a red background and in the bottom 25% of the range have a green background. The red background is not used when the min value is within 80% of the max value.
| dbms | 256us | 1ms | 4ms | 16ms | 64ms | 256ms | 1s | 4s | 16s | gt | max |
|---|---|---|---|---|---|---|---|---|---|---|---|
| ma101115_rel_withdbg.cz12a_c8r32 | 90.489 | 9.503 | 0.008 | 0.073 | |||||||
| ma101115_rel_withdbg.cz12b_c8r32 | 75.658 | 24.294 | 0.047 | 0.086 |
Performance metrics for the DBMS listed above. Some are normalized by throughput, others are not. Legend for results is here.
ips	qps	rps	rmbps	wps	wmbps	rpq	rkbpq	wpi	wkbpi	csps	cpups	cspq	cpupq	dbgb1	dbgb2	rss	maxop	p50	p99	tag
999	1078	13815	215.9	4849.7	134.7	12.818	205.080	4.853	138.023	57557	9.1	53.402	675	133.0	163.9	23.2	0.041	1088	944	ma101115_rel_withdbg.cz12a_c8r32
999	882	12299	192.2	4808.0	131.4	13.938	223.004	4.811	134.583	53854	9.3	61.031	843	133.0	163.8	23.5	0.052	896	624	ma101115_rel_withdbg.cz12b_c8r32
Average values from iostat.
r/s	rkB/s	rrqm/s	%rrqm	r_await	rareq-s	w/s	wkB/s	wrqm/s	%wrqm	w_await	wareq-s	d/s	dkB/s	drqm/s	%drqm	d_await	dareq-s	f/s	f_await	aqu-sz	%util
13818.8	221100	0.000	0.000	0.080	16.00	4838.0	137620	15.40	0.317	0.079	28.47	0.007	0.045	0.000	0.000	0.018	0.167	4.926	3.179	1.521	77.73		ma101115_rel_withdbg.cz12a_c8r32
12302.3	196837	0.000	0.000	0.110	16.00	4797.1	134210	15.61	0.324	0.136	27.99	0.006	0.069	0.000	0.000	0.018	0.240	71.88	2.930	2.198	82.97		ma101115_rel_withdbg.cz12b_c8r32
l.i0
l.i0: load without secondary indexes
Performance metrics for all DBMS, not just the ones listed above. Some are normalized by throughput, others are not. Legend for results is here.
ips	qps	rps	rmbps	wps	wmbps	rpq	rkbpq	wpi	wkbpi	csps	cpups	cspq	cpupq	dbgb1	dbgb2	rss	maxop	p50	p99	tag
156280	0	0	0.0	929.5	42.0	0.000	0.000	0.006	0.275	21466	19.7	0.137	10	52.6	83.4	23.1	0.482	161280	116283	ma101115_rel_withdbg.cz12a_c8r32
160096	0	0	0.0	959.3	43.0	0.000	0.000	0.006	0.275	21275	20.1	0.133	10	52.6	83.4	23.4	0.199	160980	140878	ma101115_rel_withdbg.cz12b_c8r32
l.x
l.x: create secondary indexes
Performance metrics for all DBMS, not just the ones listed above. Some are normalized by throughput, others are not. Legend for results is here.
ips	qps	rps	rmbps	wps	wmbps	rpq	rkbpq	wpi	wkbpi	csps	cpups	cspq	cpupq	dbgb1	dbgb2	rss	maxop	p50	p99	tag
132604	0	1413	131.5	1587.7	146.4	0.011	1.016	0.012	1.131	4352	12.0	0.033	7	111.5	142.3	23.1	0.001	NA	NA	ma101115_rel_withdbg.cz12a_c8r32
134862	0	1434	133.6	1614.3	148.9	0.011	1.014	0.012	1.131	4458	11.9	0.033	7	111.5	142.3	23.4	0.001	NA	NA	ma101115_rel_withdbg.cz12b_c8r32
l.i1
l.i1: continue load after secondary indexes created with 50 inserts per transaction
Performance metrics for all DBMS, not just the ones listed above. Some are normalized by throughput, others are not. Legend for results is here.
ips	qps	rps	rmbps	wps	wmbps	rpq	rkbpq	wpi	wkbpi	csps	cpups	cspq	cpupq	dbgb1	dbgb2	rss	maxop	p50	p99	tag
2478	0	11494	179.6	13959.7	373.4	4.638	74.203	5.633	154.274	98772	18.0	39.855	581	133.0	163.8	23.2	3.042	2500	1200	ma101115_rel_withdbg.cz12a_c8r32
1729	0	8016	125.3	9865.7	260.0	4.636	74.169	5.705	153.985	69637	13.5	40.269	625	133.0	163.8	23.4	2.466	1650	650	ma101115_rel_withdbg.cz12b_c8r32
l.i2
l.i2: continue load after secondary indexes created with 5 inserts per transaction
Performance metrics for all DBMS, not just the ones listed above. Some are normalized by throughput, others are not. Legend for results is here.
ips	qps	rps	rmbps	wps	wmbps	rpq	rkbpq	wpi	wkbpi	csps	cpups	cspq	cpupq	dbgb1	dbgb2	rss	maxop	p50	p99	tag
3067	0	12794	199.9	14035.2	390.8	4.171	66.738	4.576	130.465	112007	21.1	36.515	550	133.0	163.8	23.2	0.038	3060	2030	ma101115_rel_withdbg.cz12a_c8r32
2070	0	8630	134.9	9611.8	263.3	4.169	66.699	4.643	130.250	79048	15.8	38.182	611	133.0	163.8	23.5	0.112	2035	870	ma101115_rel_withdbg.cz12b_c8r32
qr100.L1
qr100.L1: range queries with 100 insert/s per client
Performance metrics for all DBMS, not just the ones listed above. Some are normalized by throughput, others are not. Legend for results is here.
ips	qps	rps	rmbps	wps	wmbps	rpq	rkbpq	wpi	wkbpi	csps	cpups	cspq	cpupq	dbgb1	dbgb2	rss	maxop	p50	p99	tag
100	8978	453	7.1	91.4	3.0	0.050	0.808	0.914	30.554	53391	12.4	5.947	110	133.0	163.8	23.2	0.014	9023	8367	ma101115_rel_withdbg.cz12a_c8r32
100	8931	454	7.1	93.1	3.0	0.051	0.813	0.931	30.540	53090	12.4	5.945	111	133.0	163.8	23.4	0.016	8975	8367	ma101115_rel_withdbg.cz12b_c8r32
qp100.L2
qp100.L2: point queries with 100 insert/s per client
Performance metrics for all DBMS, not just the ones listed above. Some are normalized by throughput, others are not. Legend for results is here.
ips	qps	rps	rmbps	wps	wmbps	rpq	rkbpq	wpi	wkbpi	csps	cpups	cspq	cpupq	dbgb1	dbgb2	rss	maxop	p50	p99	tag
100	1382	9570	149.5	979.8	26.7	6.925	110.802	9.808	274.107	31021	5.1	22.446	295	133.0	163.8	23.2	0.021	1456	992	ma101115_rel_withdbg.cz12a_c8r32
100	1350	9377	146.5	996.1	26.7	6.943	111.090	9.961	272.909	30184	4.9	22.350	290	133.0	163.8	23.4	0.019	1424	912	ma101115_rel_withdbg.cz12b_c8r32
qr500.L3
qr500.L3: range queries with 500 insert/s per client
Performance metrics for all DBMS, not just the ones listed above. Some are normalized by throughput, others are not. Legend for results is here.
ips	qps	rps	rmbps	wps	wmbps	rpq	rkbpq	wpi	wkbpi	csps	cpups	cspq	cpupq	dbgb1	dbgb2	rss	maxop	p50	p99	tag
500	8701	2375	37.1	1729.5	48.8	0.273	4.367	3.461	100.020	65626	14.8	7.542	136	133.0	163.8	23.2	0.049	8751	7375	ma101115_rel_withdbg.cz12a_c8r32
500	8475	2374	37.1	1776.5	49.1	0.280	4.482	3.553	100.529	63470	14.5	7.489	137	133.0	163.8	23.5	0.042	8575	6879	ma101115_rel_withdbg.cz12b_c8r32
qp500.L4
qp500.L4: point queries with 500 insert/s per client
Performance metrics for all DBMS, not just the ones listed above. Some are normalized by throughput, others are not. Legend for results is here.
ips	qps	rps	rmbps	wps	wmbps	rpq	rkbpq	wpi	wkbpi	csps	cpups	cspq	cpupq	dbgb1	dbgb2	rss	maxop	p50	p99	tag
500	1206	11714	183.0	2961.5	81.9	9.712	155.393	5.927	167.902	43847	7.0	36.355	464	133.0	163.8	23.2	0.037	1232	992	ma101115_rel_withdbg.cz12a_c8r32
500	1074	10831	169.2	2962.6	80.6	10.088	161.413	5.925	165.022	41448	6.9	38.606	514	133.0	163.8	23.5	0.349	1088	816	ma101115_rel_withdbg.cz12b_c8r32
qr1000.L5
qr1000.L5: range queries with 1000 insert/s per client
Performance metrics for all DBMS, not just the ones listed above. Some are normalized by throughput, others are not. Legend for results is here.
ips	qps	rps	rmbps	wps	wmbps	rpq	rkbpq	wpi	wkbpi	csps	cpups	cspq	cpupq	dbgb1	dbgb2	rss	maxop	p50	p99	tag
999	8395	4228	66.1	3716.2	104.1	0.504	8.058	3.721	106.711	79962	17.0	9.525	162	133.0	163.9	23.2	0.036	8463	6783	ma101115_rel_withdbg.cz12a_c8r32
999	7930	4221	66.0	3807.9	104.7	0.532	8.517	3.810	107.292	75484	16.9	9.519	171	133.0	163.8	23.5	0.033	8111	5375	ma101115_rel_withdbg.cz12b_c8r32
qp1000.L6
qp1000.L6: point queries with 1000 insert/s per client
Performance metrics for all DBMS, not just the ones listed above. Some are normalized by throughput, others are not. Legend for results is here.
ips	qps	rps	rmbps	wps	wmbps	rpq	rkbpq	wpi	wkbpi	csps	cpups	cspq	cpupq	dbgb1	dbgb2	rss	maxop	p50	p99	tag
999	1078	13815	215.9	4849.7	134.7	12.818	205.080	4.853	138.023	57557	9.1	53.402	675	133.0	163.9	23.2	0.041	1088	944	ma101115_rel_withdbg.cz12a_c8r32
999	882	12299	192.2	4808.0	131.4	13.938	223.004	4.811	134.583	53854	9.3	61.031	843	133.0	163.8	23.5	0.052	896	624	ma101115_rel_withdbg.cz12b_c8r32
l.i0
- l.i0: load without secondary indexes
- Legend for results is here.
- Each entry lists the percentage of responses that fit in that bucket (slower than max time for previous bucket, faster than min time for next bucket).
Insert response time histogram
256us	1ms	4ms	16ms	64ms	256ms	1s	4s	16s	gt	max	tag
0.000	99.588	0.210	0.058	0.136	0.009	nonzero	0.000	0.000	0.000	0.482	ma101115_rel_withdbg.cz12a_c8r32
0.000	99.680	0.127	0.070	0.119	0.005	0.000	0.000	0.000	0.000	0.199	ma101115_rel_withdbg.cz12b_c8r32
l.x
- l.x: create secondary indexes
- Legend for results is here.
- Each entry lists the percentage of responses that fit in that bucket (slower than max time for previous bucket, faster than min time for next bucket).
TODO - determine whether there is data for create index response time
l.i1
- l.i1: continue load after secondary indexes created with 50 inserts per transaction
- Legend for results is here.
- Each entry lists the percentage of responses that fit in that bucket (slower than max time for previous bucket, faster than min time for next bucket).
Insert response time histogram
256us	1ms	4ms	16ms	64ms	256ms	1s	4s	16s	gt	max	tag
0.000	0.000	0.000	59.775	38.289	1.929	0.006	0.001	0.000	0.000	3.042	ma101115_rel_withdbg.cz12a_c8r32
0.000	0.000	0.000	46.706	43.899	9.355	0.039	0.001	0.000	0.000	2.466	ma101115_rel_withdbg.cz12b_c8r32
Delete response time histogram
256us	1ms	4ms	16ms	64ms	256ms	1s	4s	16s	gt	max	tag
0.000	0.000	0.000	84.324	15.664	0.009	0.003	0.001	0.000	0.000	3.001	ma101115_rel_withdbg.cz12a_c8r32
0.000	0.000	0.000	68.819	30.912	0.258	0.010	0.001	0.000	0.000	2.425	ma101115_rel_withdbg.cz12b_c8r32
l.i2
- l.i2: continue load after secondary indexes created with 5 inserts per transaction
- Legend for results is here.
- Each entry lists the percentage of responses that fit in that bucket (slower than max time for previous bucket, faster than min time for next bucket).
Insert response time histogram
256us	1ms	4ms	16ms	64ms	256ms	1s	4s	16s	gt	max	tag
0.001	20.322	73.823	5.790	0.063	0.000	0.000	0.000	0.000	0.000	0.038	ma101115_rel_withdbg.cz12a_c8r32
0.001	16.645	66.037	16.728	0.589	0.001	0.000	0.000	0.000	0.000	0.112	ma101115_rel_withdbg.cz12b_c8r32
Delete response time histogram
256us	1ms	4ms	16ms	64ms	256ms	1s	4s	16s	gt	max	tag
0.009	57.694	39.279	2.994	0.023	0.000	0.000	0.000	0.000	0.000	0.037	ma101115_rel_withdbg.cz12a_c8r32
0.005	50.216	38.680	10.777	0.323	0.001	0.000	0.000	0.000	0.000	0.102	ma101115_rel_withdbg.cz12b_c8r32
qr100.L1
- qr100.L1: range queries with 100 insert/s per client
- Legend for results is here.
- Each entry lists the percentage of responses that fit in that bucket (slower than max time for previous bucket, faster than min time for next bucket).
Query response time histogram
256us	1ms	4ms	16ms	64ms	256ms	1s	4s	16s	gt	max	tag
99.800	0.173	0.013	0.014	0.000	0.000	0.000	0.000	0.000	0.000	0.014	ma101115_rel_withdbg.cz12a_c8r32
99.774	0.194	0.017	0.015	nonzero	0.000	0.000	0.000	0.000	0.000	0.016	ma101115_rel_withdbg.cz12b_c8r32
Insert response time histogram
256us	1ms	4ms	16ms	64ms	256ms	1s	4s	16s	gt	max	tag
0.000	0.000	0.000	55.889	44.111	0.000	0.000	0.000	0.000	0.000	0.033	ma101115_rel_withdbg.cz12a_c8r32
0.000	0.000	0.000	54.694	45.306	0.000	0.000	0.000	0.000	0.000	0.055	ma101115_rel_withdbg.cz12b_c8r32
Delete response time histogram
256us	1ms	4ms	16ms	64ms	256ms	1s	4s	16s	gt	max	tag
0.000	0.000	0.000	66.389	33.611	0.000	0.000	0.000	0.000	0.000	0.043	ma101115_rel_withdbg.cz12a_c8r32
0.000	0.000	0.000	60.833	39.167	0.000	0.000	0.000	0.000	0.000	0.036	ma101115_rel_withdbg.cz12b_c8r32
qp100.L2
- qp100.L2: point queries with 100 insert/s per client
- Legend for results is here.
- Each entry lists the percentage of responses that fit in that bucket (slower than max time for previous bucket, faster than min time for next bucket).
Query response time histogram
256us	1ms	4ms	16ms	64ms	256ms	1s	4s	16s	gt	max	tag
0.093	96.576	3.327	0.004	nonzero	0.000	0.000	0.000	0.000	0.000	0.021	ma101115_rel_withdbg.cz12a_c8r32
0.096	95.877	3.908	0.119	nonzero	0.000	0.000	0.000	0.000	0.000	0.019	ma101115_rel_withdbg.cz12b_c8r32
Insert response time histogram
256us	1ms	4ms	16ms	64ms	256ms	1s	4s	16s	gt	max	tag
0.000	0.000	0.000	89.694	10.306	0.000	0.000	0.000	0.000	0.000	0.032	ma101115_rel_withdbg.cz12a_c8r32
0.000	0.000	0.000	84.417	15.583	0.000	0.000	0.000	0.000	0.000	0.051	ma101115_rel_withdbg.cz12b_c8r32
Delete response time histogram
256us	1ms	4ms	16ms	64ms	256ms	1s	4s	16s	gt	max	tag
0.000	0.000	0.000	98.944	1.056	0.000	0.000	0.000	0.000	0.000	0.026	ma101115_rel_withdbg.cz12a_c8r32
0.000	0.000	0.000	93.000	7.000	0.000	0.000	0.000	0.000	0.000	0.036	ma101115_rel_withdbg.cz12b_c8r32
qr500.L3
- qr500.L3: range queries with 500 insert/s per client
- Legend for results is here.
- Each entry lists the percentage of responses that fit in that bucket (slower than max time for previous bucket, faster than min time for next bucket).
Query response time histogram
256us	1ms	4ms	16ms	64ms	256ms	1s	4s	16s	gt	max	tag
99.523	0.425	0.026	0.026	nonzero	0.000	0.000	0.000	0.000	0.000	0.049	ma101115_rel_withdbg.cz12a_c8r32
99.312	0.534	0.126	0.028	nonzero	0.000	0.000	0.000	0.000	0.000	0.042	ma101115_rel_withdbg.cz12b_c8r32
Insert response time histogram
256us	1ms	4ms	16ms	64ms	256ms	1s	4s	16s	gt	max	tag
0.000	0.000	0.000	84.294	15.700	0.006	0.000	0.000	0.000	0.000	0.064	ma101115_rel_withdbg.cz12a_c8r32
0.000	0.000	0.000	77.006	22.856	0.139	0.000	0.000	0.000	0.000	0.107	ma101115_rel_withdbg.cz12b_c8r32
Delete response time histogram
256us	1ms	4ms	16ms	64ms	256ms	1s	4s	16s	gt	max	tag
0.000	0.000	0.000	93.894	6.106	0.000	0.000	0.000	0.000	0.000	0.046	ma101115_rel_withdbg.cz12a_c8r32
0.000	0.000	0.000	84.372	15.628	0.000	0.000	0.000	0.000	0.000	0.054	ma101115_rel_withdbg.cz12b_c8r32
qp500.L4
- qp500.L4: point queries with 500 insert/s per client
- Legend for results is here.
- Each entry lists the percentage of responses that fit in that bucket (slower than max time for previous bucket, faster than min time for next bucket).
Query response time histogram
256us	1ms	4ms	16ms	64ms	256ms	1s	4s	16s	gt	max	tag
0.007	92.534	7.248	0.211	nonzero	0.000	0.000	0.000	0.000	0.000	0.037	ma101115_rel_withdbg.cz12a_c8r32
0.005	89.571	8.754	1.669	0.002	nonzero	nonzero	0.000	0.000	0.000	0.349	ma101115_rel_withdbg.cz12b_c8r32
Insert response time histogram
256us	1ms	4ms	16ms	64ms	256ms	1s	4s	16s	gt	max	tag
0.000	0.000	0.000	90.839	9.156	0.006	0.000	0.000	0.000	0.000	0.084	ma101115_rel_withdbg.cz12a_c8r32
0.000	0.000	0.000	77.317	21.139	1.544	0.000	0.000	0.000	0.000	0.236	ma101115_rel_withdbg.cz12b_c8r32
Delete response time histogram
256us	1ms	4ms	16ms	64ms	256ms	1s	4s	16s	gt	max	tag
0.000	0.000	0.000	96.350	3.650	0.000	0.000	0.000	0.000	0.000	0.054	ma101115_rel_withdbg.cz12a_c8r32
0.000	0.000	0.000	80.006	19.922	0.072	0.000	0.000	0.000	0.000	0.086	ma101115_rel_withdbg.cz12b_c8r32
qr1000.L5
- qr1000.L5: range queries with 1000 insert/s per client
- Legend for results is here.
- Each entry lists the percentage of responses that fit in that bucket (slower than max time for previous bucket, faster than min time for next bucket).
Query response time histogram
256us	1ms	4ms	16ms	64ms	256ms	1s	4s	16s	gt	max	tag
99.147	0.779	0.042	0.031	nonzero	0.000	0.000	0.000	0.000	0.000	0.036	ma101115_rel_withdbg.cz12a_c8r32
98.654	1.023	0.286	0.037	nonzero	0.000	0.000	0.000	0.000	0.000	0.033	ma101115_rel_withdbg.cz12b_c8r32
Insert response time histogram
256us	1ms	4ms	16ms	64ms	256ms	1s	4s	16s	gt	max	tag
0.000	0.000	0.000	88.747	11.247	0.006	0.000	0.000	0.000	0.000	0.066	ma101115_rel_withdbg.cz12a_c8r32
0.000	0.000	0.000	77.619	22.331	0.050	0.000	0.000	0.000	0.000	0.099	ma101115_rel_withdbg.cz12b_c8r32
Delete response time histogram
256us	1ms	4ms	16ms	64ms	256ms	1s	4s	16s	gt	max	tag
0.000	0.000	0.003	96.758	3.239	0.000	0.000	0.000	0.000	0.000	0.051	ma101115_rel_withdbg.cz12a_c8r32
0.000	0.000	0.000	85.119	14.881	0.000	0.000	0.000	0.000	0.000	0.057	ma101115_rel_withdbg.cz12b_c8r32
qp1000.L6
- qp1000.L6: point queries with 1000 insert/s per client
- Legend for results is here.
- Each entry lists the percentage of responses that fit in that bucket (slower than max time for previous bucket, faster than min time for next bucket).
Query response time histogram
256us	1ms	4ms	16ms	64ms	256ms	1s	4s	16s	gt	max	tag
nonzero	85.468	13.993	0.538	nonzero	0.000	0.000	0.000	0.000	0.000	0.041	ma101115_rel_withdbg.cz12a_c8r32
nonzero	78.183	18.001	3.813	0.003	0.000	0.000	0.000	0.000	0.000	0.052	ma101115_rel_withdbg.cz12b_c8r32
Insert response time histogram
256us	1ms	4ms	16ms	64ms	256ms	1s	4s	16s	gt	max	tag
0.000	0.000	0.000	85.578	14.389	0.033	0.000	0.000	0.000	0.000	0.076	ma101115_rel_withdbg.cz12a_c8r32
0.000	0.000	0.000	75.653	23.556	0.792	0.000	0.000	0.000	0.000	0.166	ma101115_rel_withdbg.cz12b_c8r32
Delete response time histogram
256us	1ms	4ms	16ms	64ms	256ms	1s	4s	16s	gt	max	tag
0.000	0.000	0.000	90.489	9.503	0.008	0.000	0.000	0.000	0.000	0.073	ma101115_rel_withdbg.cz12a_c8r32
0.000	0.000	0.000	75.658	24.294	0.047	0.000	0.000	0.000	0.000	0.086	ma101115_rel_withdbg.cz12b_c8r32