Introduction
This is a report for the insert benchmark with 4000M docs and 20 client(s). It is generated by scripts (bash, awk, sed) and Tufte might not be impressed. An overview of the insert benchmark is here and a short update is here. Below, by DBMS, I mean DBMS+version.config. An example is my8020.c10b40 where my means MySQL, 8020 is version 8.0.20 and c10b40 is the name for the configuration file.
The test server has 48 AMD cores, 128G RAM and RAID 10 with 2 NVMe devices. It is described here. The benchmark was run with 20 clients and there were 1 or 3 connections per client (1 for queries or inserts without rate limits, 1+1 for rate limited inserts+deletes). It uses 1 table with a table per client. It loads 200M rows per table without secondary indexes, creates 3 secondary indexes per table, then inserts 4m+1m rows per table with a delete per insert to avoid growing the table. It then does 6 read+write tests for 3600s each that do queries as fast as possible with 100,100,500,500,1000,1000 inserts/s and the same for deletes/s per client concurrent with the queries. The database is larger than memory. Clients and the DBMS share one server. The per-database configs are in the per-database subdirectories here.
The tested DBMS are:
- ma120101_rel_withdbg.cz12b_c32r128 - MariaDB 12.1.1 with the cz12a_c32r128 config
- my8406_rel_o2nofp.cz12a_c32r128 - MySQL 8.4.6 with the cz12a_c32r128 config
- pg180_o2nofp.cx10b_c32r128 - Postgres 18.0 with the cx10b_c32r128 config
Contents
- Summary
- l.i0: load without secondary indexes
- l.x: create secondary indexes
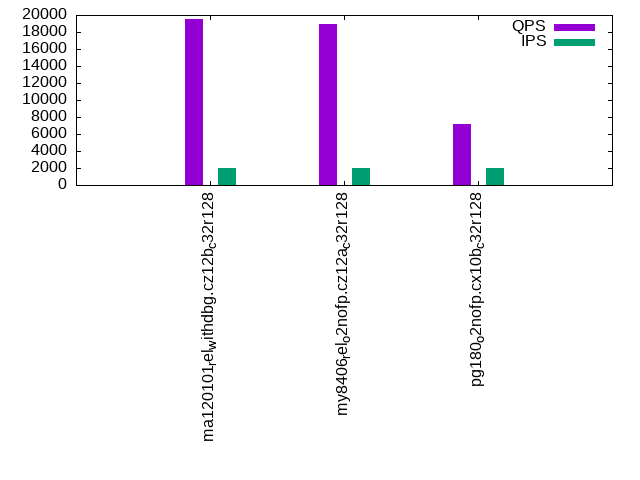
- l.i1: continue load after secondary indexes created with 50 inserts per transaction
- l.i2: continue load after secondary indexes created with 5 inserts per transaction
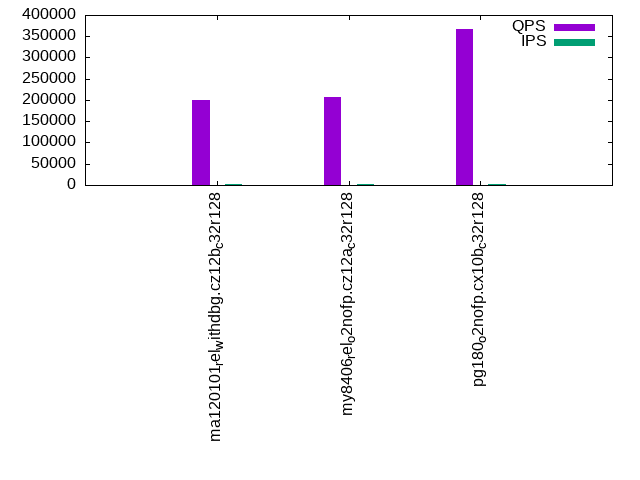
- qr100.L1: range queries with 100 insert/s per client
- qp100.L2: point queries with 100 insert/s per client
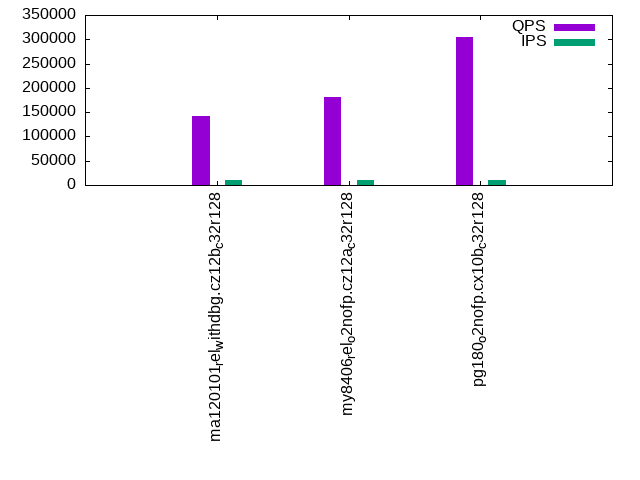
- qr500.L3: range queries with 500 insert/s per client
- qp500.L4: point queries with 500 insert/s per client
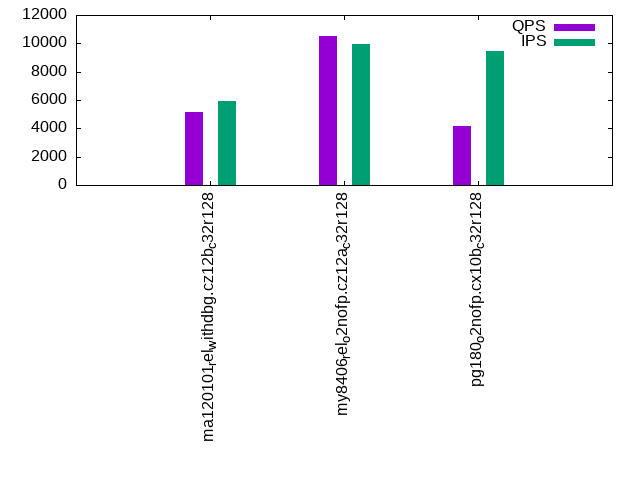
- qr1000.L5: range queries with 1000 insert/s per client
- qp1000.L6: point queries with 1000 insert/s per client
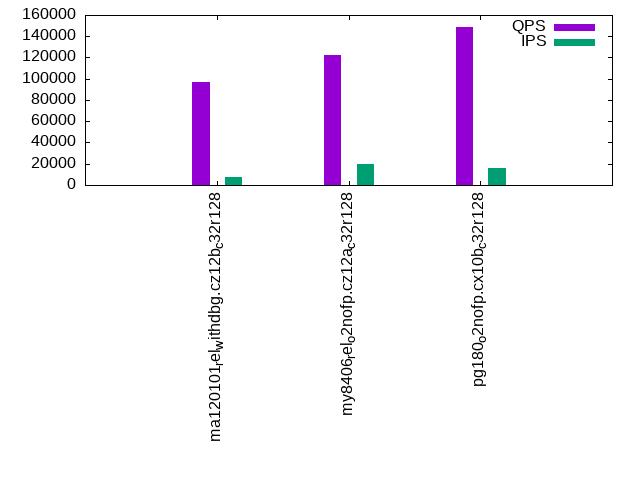
Summary
The numbers are inserts/s for l.i0, l.i1 and l.i2, indexed docs (or rows) /s for l.x and queries/s for qr100, qp100 thru qr1000, qp1000" The values are the average rate over the entire test for inserts (IPS) and queries (QPS). The range of values for IPS and QPS is split into 3 parts: bottom 25%, middle 50%, top 25%. Values in the bottom 25% have a red background, values in the top 25% have a green background and values in the middle have no color. A gray background is used for values that can be ignored because the DBMS did not sustain the target insert rate. Red backgrounds are not used when the minimum value is within 80% of the max value.
| dbms | l.i0 | l.x | l.i1 | l.i2 | qr100 | qp100 | qr500 | qp500 | qr1000 | qp1000 |
|---|---|---|---|---|---|---|---|---|---|---|
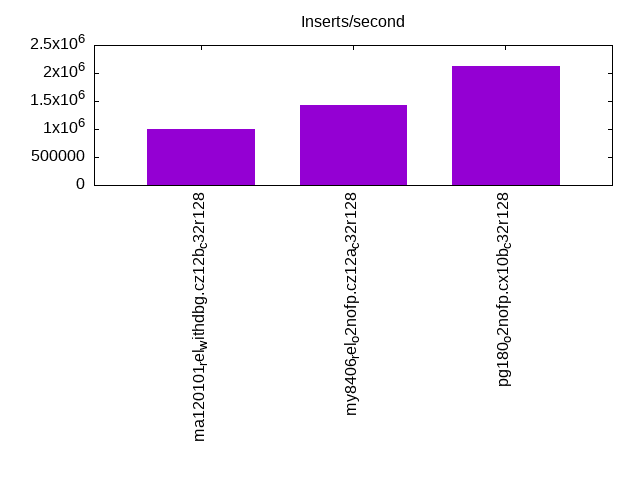
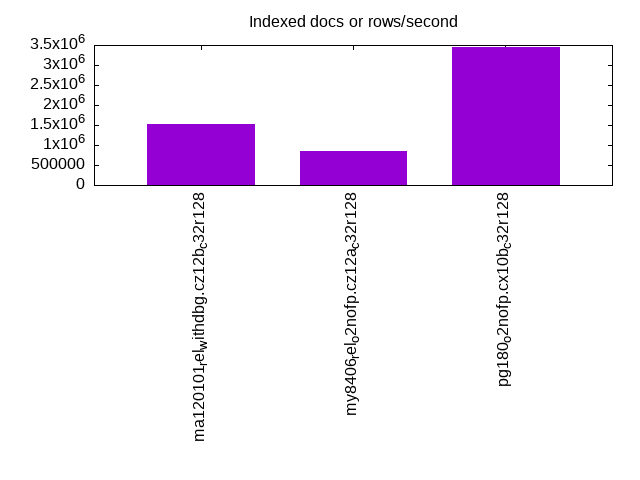
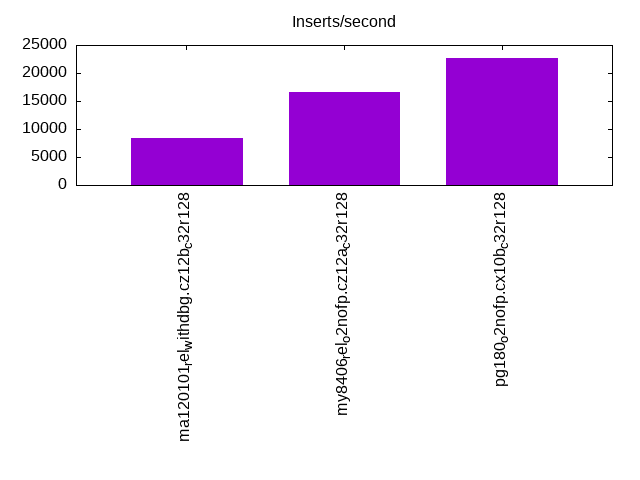
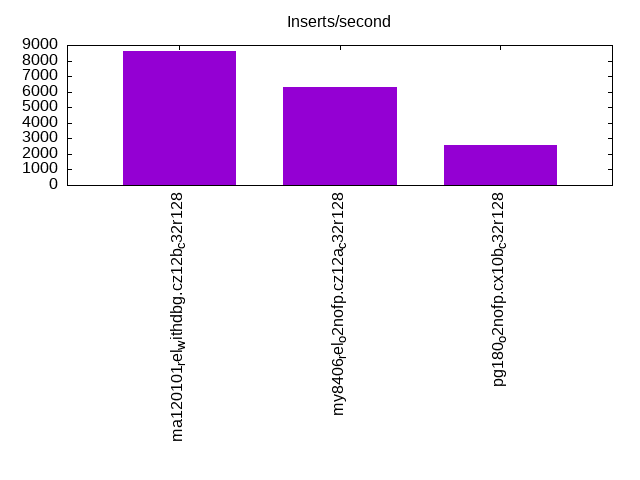
| ma120101_rel_withdbg.cz12b_c32r128 | 1004268 | 1537279 | 8305 | 8602 | 199066 | 19507 | 142687 | 5152 | 97256 | 7599 |
| my8406_rel_o2nofp.cz12a_c32r128 | 1428571 | 848716 | 16556 | 6307 | 206207 | 18931 | 181940 | 10514 | 122238 | 10199 |
| pg180_o2nofp.cx10b_c32r128 | 2117522 | 3454232 | 22637 | 2572 | 366335 | 7212 | 304725 | 4132 | 149143 | 2301 |
This table has relative throughput, throughput for the DBMS relative to the DBMS in the first line, using the absolute throughput from the previous table. Values less than 0.95 have a yellow background. Values greater than 1.05 have a blue background.
| dbms | l.i0 | l.x | l.i1 | l.i2 | qr100 | qp100 | qr500 | qp500 | qr1000 | qp1000 |
|---|---|---|---|---|---|---|---|---|---|---|
| ma120101_rel_withdbg.cz12b_c32r128 | 1.00 | 1.00 | 1.00 | 1.00 | 1.00 | 1.00 | 1.00 | 1.00 | 1.00 | 1.00 |
| my8406_rel_o2nofp.cz12a_c32r128 | 1.42 | 0.55 | 1.99 | 0.73 | 1.04 | 0.97 | 1.28 | 2.04 | 1.26 | 1.34 |
| pg180_o2nofp.cx10b_c32r128 | 2.11 | 2.25 | 2.73 | 0.30 | 1.84 | 0.37 | 2.14 | 0.80 | 1.53 | 0.30 |
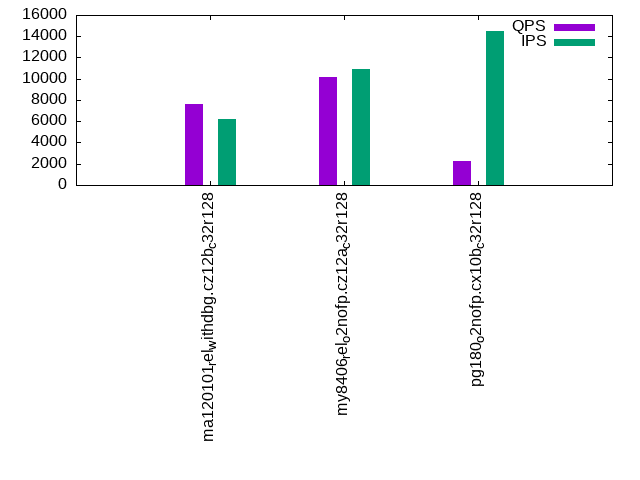
This lists the average rate of inserts/s for the tests that do inserts concurrent with queries. For such tests the query rate is listed in the table above. The read+write tests are setup so that the insert rate should match the target rate every second. Cells that are not at least 95% of the target have a red background to indicate a failure to satisfy the target.
| dbms | qr100.L1 | qp100.L2 | qr500.L3 | qp500.L4 | qr1000.L5 | qp1000.L6 |
|---|---|---|---|---|---|---|
| ma120101_rel_withdbg.cz12b_c32r128 | 1987 | 1987 | 9936 | 5912 | 7663 | 6205 |
| my8406_rel_o2nofp.cz12a_c32r128 | 1987 | 1988 | 9936 | 9936 | 19350 | 10939 |
| pg180_o2nofp.cx10b_c32r128 | 1987 | 1987 | 9912 | 9464 | 15772 | 14466 |
| target | 2000 | 2000 | 10000 | 10000 | 20000 | 20000 |
l.i0
l.i0: load without secondary indexes. Graphs for performance per 1-second interval are here.
Average throughput:
Insert response time histogram: each cell has the percentage of responses that take <= the time in the header and max is the max response time in seconds. For the max column values in the top 25% of the range have a red background and in the bottom 25% of the range have a green background. The red background is not used when the min value is within 80% of the max value.
| dbms | 256us | 1ms | 4ms | 16ms | 64ms | 256ms | 1s | 4s | 16s | gt | max |
|---|---|---|---|---|---|---|---|---|---|---|---|
| ma120101_rel_withdbg.cz12b_c32r128 | 0.786 | 98.601 | 0.356 | 0.168 | 0.088 | nonzero | 0.713 | ||||
| my8406_rel_o2nofp.cz12a_c32r128 | 0.115 | 99.738 | 0.086 | 0.023 | 0.039 | nonzero | 0.270 | ||||
| pg180_o2nofp.cx10b_c32r128 | 92.755 | 6.924 | 0.241 | 0.070 | 0.007 | 0.003 | nonzero | 1.424 |
Performance metrics for the DBMS listed above. Some are normalized by throughput, others are not. Legend for results is here.
ips	qps	rps	rmbps	wps	wmbps	rpq	rkbpq	wpi	wkbpi	csps	cpups	cspq	cpupq	dbgb1	dbgb2	rss	maxop	p50	p99	tag
1004268	0	5	0.1	6179.4	287.3	0.000	0.000	0.006	0.293	178307	59.0	0.178	28	263.2	365.1	101.2	0.713	50645	41355	ma120101_rel_withdbg.cz12b_c32r128
1428571	0	5	0.1	9661.7	528.6	0.000	0.000	0.007	0.379	323499	54.0	0.226	18	262.3	548.6	108.8	0.270	74220	60634	my8406_rel_o2nofp.cz12a_c32r128
2117522	0	1751	14.1	8835.5	844.3	0.001	0.007	0.004	0.408	355213	59.1	0.168	13	382.7	478.8	95.5	1.424	114177	49846	pg180_o2nofp.cx10b_c32r128
Average values from iostat.
r/s	rkB/s	rrqm/s	%rrqm	r_await	rareq-s	w/s	wkB/s	wrqm/s	%wrqm	w_await	wareq-s	d/s	dkB/s	drqm/s	%drqm	d_await	dareq-s	f/s	f_await	aqu-sz	%util
5.164	68.51	0.000	0.000	0.146	10.67	6179.4	294240	0.000	0.000	10.88	57.36	0.000	0.000	0.000	0.000	0.000	0.000	0.000	0.000	54.04	21.52		ma120101_rel_withdbg.cz12b_c32r128
4.990	73.32	0.000	0.000	0.167	10.47	9661.7	541276	0.000	0.000	9.567	56.89	0.000	0.000	0.000	0.000	0.000	0.000	0.000	0.000	91.77	29.80		my8406_rel_o2nofp.cz12a_c32r128
1750.9	14400.0	0.000	0.000	0.210	9.156	8835.5	864608	0.000	0.000	25.26	100.4	0.000	0.000	0.000	0.000	0.000	0.000	0.000	0.000	257.2	93.56		pg180_o2nofp.cx10b_c32r128
l.x
l.x: create secondary indexes.
Average throughput:
Performance metrics for the DBMS listed above. Some are normalized by throughput, others are not. Legend for results is here.
ips	qps	rps	rmbps	wps	wmbps	rpq	rkbpq	wpi	wkbpi	csps	cpups	cspq	cpupq	dbgb1	dbgb2	rss	maxop	p50	p99	tag
1537279	0	16749	1373.8	20104.5	1549.2	0.011	0.915	0.013	1.032	108785	24.7	0.071	8	557.5	659.4	100.7	0.004	NA	NA	ma120101_rel_withdbg.cz12b_c32r128
848716	0	16867	1022.5	38465.0	1178.5	0.020	1.234	0.045	1.422	342574	56.9	0.404	32	603.6	889.9	106.7	0.008	NA	NA	my8406_rel_o2nofp.cz12a_c32r128
3454232	0	11305	1100.4	8923.4	990.4	0.003	0.326	0.003	0.294	89741	24.2	0.026	3	768.4	863.7	31.8	0.149	NA	NA	pg180_o2nofp.cx10b_c32r128
Average values from iostat.
r/s	rkB/s	rrqm/s	%rrqm	r_await	rareq-s	w/s	wkB/s	wrqm/s	%wrqm	w_await	wareq-s	d/s	dkB/s	drqm/s	%drqm	d_await	dareq-s	f/s	f_await	aqu-sz	%util
11304.7	1126847	0.000	0.000	0.432	92.67	8923.4	1014132	0.000	0.000	64.72	115.4	0.000	0.000	0.000	0.000	0.000	0.000	0.000	0.000	556.1	97.01		pg180_o2nofp.cx10b_c32r128
l.i1
l.i1: continue load after secondary indexes created with 50 inserts per transaction. Graphs for performance per 1-second interval are here.
Average throughput:
Insert response time histogram: each cell has the percentage of responses that take <= the time in the header and max is the max response time in seconds. For the max column values in the top 25% of the range have a red background and in the bottom 25% of the range have a green background. The red background is not used when the min value is within 80% of the max value.
| dbms | 256us | 1ms | 4ms | 16ms | 64ms | 256ms | 1s | 4s | 16s | gt | max |
|---|---|---|---|---|---|---|---|---|---|---|---|
| ma120101_rel_withdbg.cz12b_c32r128 | 0.335 | 28.373 | 52.121 | 19.170 | 0.790 | ||||||
| my8406_rel_o2nofp.cz12a_c32r128 | 0.146 | 15.703 | 41.572 | 42.101 | 0.477 | 0.520 | |||||
| pg180_o2nofp.cx10b_c32r128 | 18.998 | 62.949 | 17.860 | 0.073 | 0.120 | nonzero | 4.078 |
Delete response time histogram: each cell has the percentage of responses that take <= the time in the header and max is the max response time in seconds. For the max column values in the top 25% of the range have a red background and in the bottom 25% of the range have a green background. The red background is not used when the min value is within 80% of the max value.
| dbms | 256us | 1ms | 4ms | 16ms | 64ms | 256ms | 1s | 4s | 16s | gt | max |
|---|---|---|---|---|---|---|---|---|---|---|---|
| ma120101_rel_withdbg.cz12b_c32r128 | 2.529 | 48.789 | 29.895 | 18.787 | 0.736 | ||||||
| my8406_rel_o2nofp.cz12a_c32r128 | 18.418 | 19.191 | 34.993 | 27.395 | 0.003 | 0.293 | |||||
| pg180_o2nofp.cx10b_c32r128 | 2.489 | 8.647 | 20.642 | 62.623 | 5.508 | 0.028 | 0.063 | 3.157 |
Performance metrics for the DBMS listed above. Some are normalized by throughput, others are not. Legend for results is here.
ips	qps	rps	rmbps	wps	wmbps	rpq	rkbpq	wpi	wkbpi	csps	cpups	cspq	cpupq	dbgb1	dbgb2	rss	maxop	p50	p99	tag
8305	0	50159	783.7	49755.5	1339.8	6.040	96.634	5.991	165.198	1012811	16.5	121.956	954	730.2	832.5	100.5	0.790	450	150	ma120101_rel_withdbg.cz12b_c32r128
16556	0	37539	586.6	52297.5	1516.5	2.267	36.278	3.159	93.796	333931	20.7	20.170	600	818.5	1128.5	107.5	0.520	699	300	my8406_rel_o2nofp.cz12a_c32r128
22637	0	28697	229.5	33466.2	742.0	1.268	10.383	1.478	33.566	80347	32.0	3.549	679	781.5	918.4	81.8	4.078	1099	0	pg180_o2nofp.cx10b_c32r128
Average values from iostat.
r/s	rkB/s	rrqm/s	%rrqm	r_await	rareq-s	w/s	wkB/s	wrqm/s	%wrqm	w_await	wareq-s	d/s	dkB/s	drqm/s	%drqm	d_await	dareq-s	f/s	f_await	aqu-sz	%util
50159.2	802513	0.000	0.000	0.184	16.00	49755.5	1371921	0.000	0.000	0.146	27.70	0.000	0.000	0.000	0.000	0.000	0.000	0.000	0.000	16.49	100.00		ma120101_rel_withdbg.cz12b_c32r128
37539.0	600633	0.000	0.000	0.207	16.00	52297.5	1552902	0.000	0.000	2.463	30.02	0.000	0.000	0.000	0.000	0.000	0.000	0.000	0.000	135.7	99.99		my8406_rel_o2nofp.cz12a_c32r128
28696.8	235035	0.000	0.000	0.101	8.213	33466.2	759834	0.000	0.000	135.1	25.38	0.000	0.000	0.000	0.000	0.000	0.000	0.000	0.000	6161.4	87.84		pg180_o2nofp.cx10b_c32r128
l.i2
l.i2: continue load after secondary indexes created with 5 inserts per transaction. Graphs for performance per 1-second interval are here.
Average throughput:
Insert response time histogram: each cell has the percentage of responses that take <= the time in the header and max is the max response time in seconds. For the max column values in the top 25% of the range have a red background and in the bottom 25% of the range have a green background. The red background is not used when the min value is within 80% of the max value.
| dbms | 256us | 1ms | 4ms | 16ms | 64ms | 256ms | 1s | 4s | 16s | gt | max |
|---|---|---|---|---|---|---|---|---|---|---|---|
| ma120101_rel_withdbg.cz12b_c32r128 | nonzero | 0.787 | 57.216 | 13.444 | 28.448 | 0.105 | 0.218 | ||||
| my8406_rel_o2nofp.cz12a_c32r128 | 0.139 | 74.397 | 25.410 | 0.055 | 0.103 | ||||||
| pg180_o2nofp.cx10b_c32r128 | 0.088 | 37.304 | 62.059 | 0.137 | 0.309 | 0.025 | 0.051 | 0.026 | nonzero | 4.508 |
Delete response time histogram: each cell has the percentage of responses that take <= the time in the header and max is the max response time in seconds. For the max column values in the top 25% of the range have a red background and in the bottom 25% of the range have a green background. The red background is not used when the min value is within 80% of the max value.
| dbms | 256us | 1ms | 4ms | 16ms | 64ms | 256ms | 1s | 4s | 16s | gt | max |
|---|---|---|---|---|---|---|---|---|---|---|---|
| ma120101_rel_withdbg.cz12b_c32r128 | nonzero | 1.760 | 62.332 | 7.638 | 28.195 | 0.075 | 0.217 | ||||
| my8406_rel_o2nofp.cz12a_c32r128 | 1.298 | 74.233 | 24.448 | 0.020 | 0.117 | ||||||
| pg180_o2nofp.cx10b_c32r128 | 0.201 | 3.386 | 0.853 | 0.186 | 95.368 | 0.003 | 0.002 | nonzero | 2.062 |
Performance metrics for the DBMS listed above. Some are normalized by throughput, others are not. Legend for results is here.
ips	qps	rps	rmbps	wps	wmbps	rpq	rkbpq	wpi	wkbpi	csps	cpups	cspq	cpupq	dbgb1	dbgb2	rss	maxop	p50	p99	tag
8602	0	58307	911.0	51129.7	1428.7	6.778	108.451	5.944	170.072	696756	16.1	80.998	898	730.2	832.5	100.3	0.218	579	95	ma120101_rel_withdbg.cz12b_c32r128
6307	0	42612	665.8	54515.3	1544.4	6.756	108.100	8.643	250.745	362906	18.7	57.539	1423	818.5	1129.4	106.0	0.103	155	90	my8406_rel_o2nofp.cz12a_c32r128
2572	0	3376	32.7	5223.0	82.4	1.313	13.026	2.031	32.806	19506	27.3	7.584	5095	784.8	880.9	86.5	4.508	135	55	pg180_o2nofp.cx10b_c32r128
Average values from iostat.
r/s	rkB/s	rrqm/s	%rrqm	r_await	rareq-s	w/s	wkB/s	wrqm/s	%wrqm	w_await	wareq-s	d/s	dkB/s	drqm/s	%drqm	d_await	dareq-s	f/s	f_await	aqu-sz	%util
58306.9	932910	0.000	0.000	0.187	16.00	51129.7	1462975	0.000	0.000	0.111	28.64	0.000	0.000	0.000	0.000	0.000	0.000	0.000	0.000	16.99	100.00		ma120101_rel_withdbg.cz12b_c32r128
42611.9	681799	0.000	0.000	0.185	16.00	54515.3	1581475	0.000	0.000	2.156	29.00	0.000	0.000	0.000	0.000	0.000	0.000	0.000	0.000	126.0	100.00		my8406_rel_o2nofp.cz12a_c32r128
3376.0	33502.3	0.000	0.000	0.077	8.822	5223.0	84377.1	0.000	0.000	3.696	18.19	0.000	0.000	0.000	0.000	0.000	0.000	0.000	0.000	92.32	78.53		pg180_o2nofp.cx10b_c32r128
qr100.L1
qr100.L1: range queries with 100 insert/s per client. Graphs for performance per 1-second interval are here.
Average throughput:
Query response time histogram: each cell has the percentage of responses that take <= the time in the header and max is the max response time in seconds. For max values in the top 25% of the range have a red background and in the bottom 25% of the range have a green background. The red background is not used when the min value is within 80% of the max value.
| dbms | 256us | 1ms | 4ms | 16ms | 64ms | 256ms | 1s | 4s | 16s | gt | max |
|---|---|---|---|---|---|---|---|---|---|---|---|
| ma120101_rel_withdbg.cz12b_c32r128 | 99.607 | 0.369 | 0.024 | 0.001 | nonzero | nonzero | 0.084 | ||||
| my8406_rel_o2nofp.cz12a_c32r128 | 99.911 | 0.085 | 0.004 | nonzero | nonzero | 0.027 | |||||
| pg180_o2nofp.cx10b_c32r128 | 99.996 | 0.004 | 0.001 | nonzero | nonzero | nonzero | nonzero | nonzero | 1.121 |
Insert response time histogram: each cell has the percentage of responses that take <= the time in the header and max is the max response time in seconds. For max values in the top 25% of the range have a red background and in the bottom 25% of the range have a green background. The red background is not used when the min value is within 80% of the max value.
| dbms | 256us | 1ms | 4ms | 16ms | 64ms | 256ms | 1s | 4s | 16s | gt | max |
|---|---|---|---|---|---|---|---|---|---|---|---|
| ma120101_rel_withdbg.cz12b_c32r128 | 45.364 | 54.476 | 0.160 | 0.128 | |||||||
| my8406_rel_o2nofp.cz12a_c32r128 | 83.550 | 16.450 | 0.055 | ||||||||
| pg180_o2nofp.cx10b_c32r128 | 98.308 | 1.601 | 0.037 | 0.053 | 0.001 | 1.162 |
Delete response time histogram: each cell has the percentage of responses that take <= the time in the header and max is the max response time in seconds. For max values in the top 25% of the range have a red background and in the bottom 25% of the range have a green background. The red background is not used when the min value is within 80% of the max value.
| dbms | 256us | 1ms | 4ms | 16ms | 64ms | 256ms | 1s | 4s | 16s | gt | max |
|---|---|---|---|---|---|---|---|---|---|---|---|
| ma120101_rel_withdbg.cz12b_c32r128 | 68.112 | 31.790 | 0.097 | 0.123 | |||||||
| my8406_rel_o2nofp.cz12a_c32r128 | 89.622 | 10.307 | 0.072 | 0.028 | |||||||
| pg180_o2nofp.cx10b_c32r128 | 23.008 | 74.472 | 2.516 | 0.001 | 0.001 | 0.002 | 0.514 |
Performance metrics for the DBMS listed above. Some are normalized by throughput, others are not. Legend for results is here.
ips	qps	rps	rmbps	wps	wmbps	rpq	rkbpq	wpi	wkbpi	csps	cpups	cspq	cpupq	dbgb1	dbgb2	rss	maxop	p50	p99	tag
1987	199066	8797	137.5	7099.8	198.1	0.044	0.707	3.574	102.107	1215692	44.4	6.107	107	730.2	832.5	100.4	0.084	10085	9366	ma120101_rel_withdbg.cz12b_c32r128
1987	206207	8240	128.7	10136.1	286.9	0.040	0.639	5.100	147.827	1223329	45.1	5.933	105	818.5	1130.1	106.0	0.027	10373	9737	my8406_rel_o2nofp.cz12a_c32r128
1987	366335	2623	21.1	2296.1	45.0	0.007	0.059	1.155	23.172	1398663	43.7	3.818	57	785.0	881.1	95.4	1.121	18322	17485	pg180_o2nofp.cx10b_c32r128
Average values from iostat.
r/s	rkB/s	rrqm/s	%rrqm	r_await	rareq-s	w/s	wkB/s	wrqm/s	%wrqm	w_await	wareq-s	d/s	dkB/s	drqm/s	%drqm	d_await	dareq-s	f/s	f_await	aqu-sz	%util
8797.2	140751	0.000	0.000	0.131	16.00	7099.8	202856	0.000	0.000	0.108	30.41	0.000	0.000	0.000	0.000	0.000	0.000	0.000	0.000	1.703	25.67		ma120101_rel_withdbg.cz12b_c32r128
8239.9	131839	0.000	0.000	0.107	16.00	10136.1	293776	0.000	0.000	0.985	29.02	0.000	0.000	0.000	0.000	0.000	0.000	0.000	0.000	11.27	25.48		my8406_rel_o2nofp.cz12a_c32r128
2623.3	21642.1	0.000	0.000	0.090	8.247	2296.1	46048.8	0.000	0.000	0.106	35.62	0.000	0.000	0.000	0.000	0.000	0.000	0.000	0.000	0.349	16.67		pg180_o2nofp.cx10b_c32r128
qp100.L2
qp100.L2: point queries with 100 insert/s per client. Graphs for performance per 1-second interval are here.
Average throughput:
Query response time histogram: each cell has the percentage of responses that take <= the time in the header and max is the max response time in seconds. For max values in the top 25% of the range have a red background and in the bottom 25% of the range have a green background. The red background is not used when the min value is within 80% of the max value.
| dbms | 256us | 1ms | 4ms | 16ms | 64ms | 256ms | 1s | 4s | 16s | gt | max |
|---|---|---|---|---|---|---|---|---|---|---|---|
| ma120101_rel_withdbg.cz12b_c32r128 | 0.017 | 65.494 | 34.417 | 0.067 | 0.004 | nonzero | 0.134 | ||||
| my8406_rel_o2nofp.cz12a_c32r128 | 0.003 | 59.984 | 39.752 | 0.261 | nonzero | 0.034 | |||||
| pg180_o2nofp.cx10b_c32r128 | nonzero | 2.288 | 94.373 | 0.227 | 3.003 | 0.073 | 0.030 | 0.006 | 0.001 | 5.566 |
Insert response time histogram: each cell has the percentage of responses that take <= the time in the header and max is the max response time in seconds. For max values in the top 25% of the range have a red background and in the bottom 25% of the range have a green background. The red background is not used when the min value is within 80% of the max value.
| dbms | 256us | 1ms | 4ms | 16ms | 64ms | 256ms | 1s | 4s | 16s | gt | max |
|---|---|---|---|---|---|---|---|---|---|---|---|
| ma120101_rel_withdbg.cz12b_c32r128 | 0.110 | 99.060 | 0.817 | 0.013 | 0.356 | ||||||
| my8406_rel_o2nofp.cz12a_c32r128 | 47.613 | 52.362 | 0.026 | 0.098 | |||||||
| pg180_o2nofp.cx10b_c32r128 | 68.346 | 29.679 | 0.902 | 0.489 | 0.520 | 0.064 | 5.349 |
Delete response time histogram: each cell has the percentage of responses that take <= the time in the header and max is the max response time in seconds. For max values in the top 25% of the range have a red background and in the bottom 25% of the range have a green background. The red background is not used when the min value is within 80% of the max value.
| dbms | 256us | 1ms | 4ms | 16ms | 64ms | 256ms | 1s | 4s | 16s | gt | max |
|---|---|---|---|---|---|---|---|---|---|---|---|
| ma120101_rel_withdbg.cz12b_c32r128 | 0.149 | 99.152 | 0.696 | 0.003 | 0.309 | ||||||
| my8406_rel_o2nofp.cz12a_c32r128 | 91.709 | 8.263 | 0.028 | 0.034 | |||||||
| pg180_o2nofp.cx10b_c32r128 | 49.385 | 45.971 | 4.584 | 0.009 | 0.030 | 0.020 | 0.001 | 5.240 |
Performance metrics for the DBMS listed above. Some are normalized by throughput, others are not. Legend for results is here.
ips	qps	rps	rmbps	wps	wmbps	rpq	rkbpq	wpi	wkbpi	csps	cpups	cspq	cpupq	dbgb1	dbgb2	rss	maxop	p50	p99	tag
1987	19507	140662	2198.0	11446.2	316.4	7.211	115.379	5.761	163.106	574056	15.6	29.428	384	730.2	832.5	100.4	0.134	991	543	ma120101_rel_withdbg.cz12b_c32r128
1988	18931	136713	2136.2	16013.6	445.2	7.222	115.550	8.056	229.344	427047	16.2	22.558	411	818.5	1130.8	106.0	0.034	959	606	my8406_rel_o2nofp.cz12a_c32r128
1987	7212	101152	793.4	5581.6	68.5	14.025	112.649	2.809	35.294	225451	23.3	31.259	1551	785.2	881.2	86.8	5.566	384	0	pg180_o2nofp.cx10b_c32r128
Average values from iostat.
r/s	rkB/s	rrqm/s	%rrqm	r_await	rareq-s	w/s	wkB/s	wrqm/s	%wrqm	w_await	wareq-s	d/s	dkB/s	drqm/s	%drqm	d_await	dareq-s	f/s	f_await	aqu-sz	%util
140662	2250707	0.000	0.000	0.107	16.00	11446.2	324044	0.000	0.000	0.098	28.36	0.000	0.000	0.000	0.000	0.000	0.000	0.000	0.000	16.14	99.94		ma120101_rel_withdbg.cz12b_c32r128
136713	2187483	0.000	0.000	0.113	16.00	16013.6	455891	0.000	0.000	1.121	28.48	0.000	0.000	0.000	0.000	0.000	0.000	0.000	0.000	34.44	100.00		my8406_rel_o2nofp.cz12a_c32r128
101152	812466	0.000	0.000	0.079	8.040	5581.6	70119.5	0.000	0.000	29.69	13.79	0.000	0.000	0.000	0.000	0.000	0.000	0.000	0.000	1044.6	83.40		pg180_o2nofp.cx10b_c32r128
qr500.L3
qr500.L3: range queries with 500 insert/s per client. Graphs for performance per 1-second interval are here.
Average throughput:
Query response time histogram: each cell has the percentage of responses that take <= the time in the header and max is the max response time in seconds. For max values in the top 25% of the range have a red background and in the bottom 25% of the range have a green background. The red background is not used when the min value is within 80% of the max value.
| dbms | 256us | 1ms | 4ms | 16ms | 64ms | 256ms | 1s | 4s | 16s | gt | max |
|---|---|---|---|---|---|---|---|---|---|---|---|
| ma120101_rel_withdbg.cz12b_c32r128 | 96.533 | 3.130 | 0.255 | 0.064 | 0.017 | nonzero | 0.221 | ||||
| my8406_rel_o2nofp.cz12a_c32r128 | 99.420 | 0.548 | 0.030 | 0.002 | nonzero | 0.046 | |||||
| pg180_o2nofp.cx10b_c32r128 | 99.973 | 0.021 | 0.004 | 0.001 | 0.001 | nonzero | nonzero | nonzero | 2.170 |
Insert response time histogram: each cell has the percentage of responses that take <= the time in the header and max is the max response time in seconds. For max values in the top 25% of the range have a red background and in the bottom 25% of the range have a green background. The red background is not used when the min value is within 80% of the max value.
| dbms | 256us | 1ms | 4ms | 16ms | 64ms | 256ms | 1s | 4s | 16s | gt | max |
|---|---|---|---|---|---|---|---|---|---|---|---|
| ma120101_rel_withdbg.cz12b_c32r128 | 13.401 | 70.476 | 16.049 | 0.074 | 0.500 | ||||||
| my8406_rel_o2nofp.cz12a_c32r128 | 34.033 | 65.777 | 0.189 | 0.116 | |||||||
| pg180_o2nofp.cx10b_c32r128 | 83.580 | 15.677 | 0.457 | 0.228 | 0.058 | 3.544 |
Delete response time histogram: each cell has the percentage of responses that take <= the time in the header and max is the max response time in seconds. For max values in the top 25% of the range have a red background and in the bottom 25% of the range have a green background. The red background is not used when the min value is within 80% of the max value.
| dbms | 256us | 1ms | 4ms | 16ms | 64ms | 256ms | 1s | 4s | 16s | gt | max |
|---|---|---|---|---|---|---|---|---|---|---|---|
| ma120101_rel_withdbg.cz12b_c32r128 | 30.503 | 55.440 | 14.029 | 0.028 | 0.399 | ||||||
| my8406_rel_o2nofp.cz12a_c32r128 | 49.395 | 48.629 | 1.974 | 0.002 | 0.073 | ||||||
| pg180_o2nofp.cx10b_c32r128 | 3.517 | 87.230 | 9.234 | 0.011 | 0.004 | 0.003 | 3.348 |
Performance metrics for the DBMS listed above. Some are normalized by throughput, others are not. Legend for results is here.
ips	qps	rps	rmbps	wps	wmbps	rpq	rkbpq	wpi	wkbpi	csps	cpups	cspq	cpupq	dbgb1	dbgb2	rss	maxop	p50	p99	tag
9936	142687	41769	652.6	36713.4	1023.3	0.293	4.684	3.695	105.451	1435983	49.1	10.064	165	730.2	832.5	100.4	0.221	7592	3581	ma120101_rel_withdbg.cz12b_c32r128
9936	181940	36392	568.6	44858.1	1265.0	0.200	3.200	4.514	130.359	1204319	55.0	6.619	145	818.5	1134.3	106.0	0.046	9193	8023	my8406_rel_o2nofp.cz12a_c32r128
9912	304725	13223	106.7	16041.6	257.2	0.043	0.359	1.618	26.572	1131403	52.3	3.713	82	786.3	882.4	85.6	2.170	15407	13248	pg180_o2nofp.cx10b_c32r128
Average values from iostat.
r/s	rkB/s	rrqm/s	%rrqm	r_await	rareq-s	w/s	wkB/s	wrqm/s	%wrqm	w_await	wareq-s	d/s	dkB/s	drqm/s	%drqm	d_await	dareq-s	f/s	f_await	aqu-sz	%util
41769.3	668300	0.000	0.000	0.171	16.00	36713.4	1047819	0.000	0.000	0.093	28.58	0.000	0.000	0.000	0.000	0.000	0.000	0.000	0.000	10.47	88.89		ma120101_rel_withdbg.cz12b_c32r128
36391.7	582272	0.000	0.000	0.179	16.00	44858.1	1295315	0.000	0.000	1.782	28.94	0.000	0.000	0.000	0.000	0.000	0.000	0.000	0.000	87.26	94.53		my8406_rel_o2nofp.cz12a_c32r128
13223.4	109302	0.000	0.000	0.091	8.250	16041.6	263374	0.000	0.000	0.058	21.33	0.000	0.000	0.000	0.000	0.000	0.000	0.000	0.000	1.913	73.41		pg180_o2nofp.cx10b_c32r128
qp500.L4
qp500.L4: point queries with 500 insert/s per client. Graphs for performance per 1-second interval are here.
Average throughput:
Query response time histogram: each cell has the percentage of responses that take <= the time in the header and max is the max response time in seconds. For max values in the top 25% of the range have a red background and in the bottom 25% of the range have a green background. The red background is not used when the min value is within 80% of the max value.
| dbms | 256us | 1ms | 4ms | 16ms | 64ms | 256ms | 1s | 4s | 16s | gt | max |
|---|---|---|---|---|---|---|---|---|---|---|---|
| ma120101_rel_withdbg.cz12b_c32r128 | nonzero | 7.663 | 76.791 | 10.667 | 4.805 | 0.074 | 0.222 | ||||
| my8406_rel_o2nofp.cz12a_c32r128 | nonzero | 11.397 | 85.383 | 3.206 | 0.015 | 0.059 | |||||
| pg180_o2nofp.cx10b_c32r128 | 0.111 | 92.172 | 1.957 | 5.660 | 0.064 | 0.022 | 0.011 | 0.004 | 10.570 |
Insert response time histogram: each cell has the percentage of responses that take <= the time in the header and max is the max response time in seconds. For max values in the top 25% of the range have a red background and in the bottom 25% of the range have a green background. The red background is not used when the min value is within 80% of the max value.
| dbms | 256us | 1ms | 4ms | 16ms | 64ms | 256ms | 1s | 4s | 16s | gt | max |
|---|---|---|---|---|---|---|---|---|---|---|---|
| ma120101_rel_withdbg.cz12b_c32r128 | 0.060 | 17.739 | 56.748 | 25.453 | 0.738 | ||||||
| my8406_rel_o2nofp.cz12a_c32r128 | 16.872 | 83.018 | 0.109 | 0.138 | |||||||
| pg180_o2nofp.cx10b_c32r128 | 29.429 | 67.215 | 2.783 | 0.294 | 0.200 | 0.079 | 10.506 |
Delete response time histogram: each cell has the percentage of responses that take <= the time in the header and max is the max response time in seconds. For max values in the top 25% of the range have a red background and in the bottom 25% of the range have a green background. The red background is not used when the min value is within 80% of the max value.
| dbms | 256us | 1ms | 4ms | 16ms | 64ms | 256ms | 1s | 4s | 16s | gt | max |
|---|---|---|---|---|---|---|---|---|---|---|---|
| ma120101_rel_withdbg.cz12b_c32r128 | 0.077 | 19.108 | 58.269 | 22.546 | 0.611 | ||||||
| my8406_rel_o2nofp.cz12a_c32r128 | 33.172 | 65.968 | 0.859 | nonzero | 0.071 | ||||||
| pg180_o2nofp.cx10b_c32r128 | 34.108 | 65.541 | 0.192 | 0.111 | 0.041 | 0.007 | 9.835 |
Performance metrics for the DBMS listed above. Some are normalized by throughput, others are not. Legend for results is here.
ips	qps	rps	rmbps	wps	wmbps	rpq	rkbpq	wpi	wkbpi	csps	cpups	cspq	cpupq	dbgb1	dbgb2	rss	maxop	p50	p99	tag
5912	5152	75608	1181.4	33018.4	913.4	14.677	234.828	5.585	158.198	1188421	18.6	230.694	1733	730.4	832.7	100.4	0.222	112	48	ma120101_rel_withdbg.cz12b_c32r128
9936	10514	122588	1915.4	50244.4	1403.0	11.660	186.560	5.057	144.584	478916	24.2	45.552	1105	818.5	1137.8	106.0	0.059	528	400	my8406_rel_o2nofp.cz12a_c32r128
9464	4132	78023	612.2	20213.7	281.8	18.883	151.720	2.136	30.496	182152	39.7	44.084	4612	789.2	885.3	39.2	10.570	224	0	pg180_o2nofp.cx10b_c32r128
Average values from iostat.
r/s	rkB/s	rrqm/s	%rrqm	r_await	rareq-s	w/s	wkB/s	wrqm/s	%wrqm	w_await	wareq-s	d/s	dkB/s	drqm/s	%drqm	d_await	dareq-s	f/s	f_await	aqu-sz	%util
75607.5	1209715	0.000	0.000	0.160	16.00	33018.4	935314	0.000	0.000	0.096	28.33	0.000	0.000	0.000	0.000	0.000	0.000	0.000	0.000	16.93	100.00		ma120101_rel_withdbg.cz12b_c32r128
122588	1961415	0.000	0.000	0.194	16.00	50244.4	1436662	0.000	0.000	2.177	28.60	0.000	0.000	0.000	0.000	0.000	0.000	0.000	0.000	133.2	100.00		my8406_rel_o2nofp.cz12a_c32r128
78022.9	626892	0.000	0.000	0.103	8.035	20213.7	288606	0.000	0.000	395.9	16.43	0.000	0.000	0.000	0.000	0.000	0.000	0.000	0.000	9038.6	74.31		pg180_o2nofp.cx10b_c32r128
qr1000.L5
qr1000.L5: range queries with 1000 insert/s per client. Graphs for performance per 1-second interval are here.
Average throughput:
Query response time histogram: each cell has the percentage of responses that take <= the time in the header and max is the max response time in seconds. For max values in the top 25% of the range have a red background and in the bottom 25% of the range have a green background. The red background is not used when the min value is within 80% of the max value.
| dbms | 256us | 1ms | 4ms | 16ms | 64ms | 256ms | 1s | 4s | 16s | gt | max |
|---|---|---|---|---|---|---|---|---|---|---|---|
| ma120101_rel_withdbg.cz12b_c32r128 | 91.698 | 6.773 | 1.291 | 0.191 | 0.046 | nonzero | nonzero | 0.260 | |||
| my8406_rel_o2nofp.cz12a_c32r128 | 93.839 | 5.293 | 0.851 | 0.016 | nonzero | nonzero | 0.074 | ||||
| pg180_o2nofp.cx10b_c32r128 | 98.907 | 0.923 | 0.049 | 0.073 | 0.045 | 0.002 | nonzero | nonzero | nonzero | 4.279 |
Insert response time histogram: each cell has the percentage of responses that take <= the time in the header and max is the max response time in seconds. For max values in the top 25% of the range have a red background and in the bottom 25% of the range have a green background. The red background is not used when the min value is within 80% of the max value.
| dbms | 256us | 1ms | 4ms | 16ms | 64ms | 256ms | 1s | 4s | 16s | gt | max |
|---|---|---|---|---|---|---|---|---|---|---|---|
| ma120101_rel_withdbg.cz12b_c32r128 | 0.913 | 24.016 | 53.496 | 21.574 | 0.487 | ||||||
| my8406_rel_o2nofp.cz12a_c32r128 | 0.001 | 34.229 | 61.048 | 4.723 | 0.166 | ||||||
| pg180_o2nofp.cx10b_c32r128 | 20.860 | 43.188 | 35.444 | 0.349 | 0.153 | 0.007 | 7.788 |
Delete response time histogram: each cell has the percentage of responses that take <= the time in the header and max is the max response time in seconds. For max values in the top 25% of the range have a red background and in the bottom 25% of the range have a green background. The red background is not used when the min value is within 80% of the max value.
| dbms | 256us | 1ms | 4ms | 16ms | 64ms | 256ms | 1s | 4s | 16s | gt | max |
|---|---|---|---|---|---|---|---|---|---|---|---|
| ma120101_rel_withdbg.cz12b_c32r128 | 3.844 | 31.029 | 43.835 | 21.292 | 0.483 | ||||||
| my8406_rel_o2nofp.cz12a_c32r128 | 23.330 | 53.888 | 20.744 | 2.038 | 0.149 | ||||||
| pg180_o2nofp.cx10b_c32r128 | 0.007 | nonzero | 0.001 | 80.533 | 19.287 | 0.091 | 0.081 | nonzero | 4.903 |
Performance metrics for the DBMS listed above. Some are normalized by throughput, others are not. Legend for results is here.
ips	qps	rps	rmbps	wps	wmbps	rpq	rkbpq	wpi	wkbpi	csps	cpups	cspq	cpupq	dbgb1	dbgb2	rss	maxop	p50	p99	tag
7663	97256	43802	684.4	42536.1	1180.7	0.450	7.206	5.551	157.785	1420689	46.6	14.608	230	730.5	832.8	100.4	0.260	5019	2302	ma120101_rel_withdbg.cz12b_c32r128
19350	122238	37646	588.2	48923.1	1389.2	0.308	4.928	2.528	73.517	913068	59.5	7.470	234	818.5	1146.8	106.0	0.074	6235	4555	my8406_rel_o2nofp.cz12a_c32r128
15772	149143	20957	169.2	24511.4	524.9	0.141	1.162	1.554	34.078	418741	72.8	2.808	234	800.0	896.1	81.7	4.279	7735	607	pg180_o2nofp.cx10b_c32r128
Average values from iostat.
r/s	rkB/s	rrqm/s	%rrqm	r_await	rareq-s	w/s	wkB/s	wrqm/s	%wrqm	w_await	wareq-s	d/s	dkB/s	drqm/s	%drqm	d_await	dareq-s	f/s	f_await	aqu-sz	%util
43801.5	700816	0.000	0.000	0.158	16.00	42536.1	1209071	0.000	0.000	0.080	28.43	0.000	0.000	0.000	0.000	0.000	0.000	0.000	0.000	10.31	100.00		ma120101_rel_withdbg.cz12b_c32r128
37645.8	602341	0.000	0.000	0.191	16.00	48923.1	1422521	0.000	0.000	1.865	29.08	0.000	0.000	0.000	0.000	0.000	0.000	0.000	0.000	98.61	100.00		my8406_rel_o2nofp.cz12a_c32r128
20956.7	173234	0.000	0.000	0.096	8.314	24511.4	537475	0.000	0.000	176.6	24.36	0.000	0.000	0.000	0.000	0.000	0.000	0.000	0.000	4480.8	90.38		pg180_o2nofp.cx10b_c32r128
qp1000.L6
qp1000.L6: point queries with 1000 insert/s per client. Graphs for performance per 1-second interval are here.
Average throughput:
Query response time histogram: each cell has the percentage of responses that take <= the time in the header and max is the max response time in seconds. For max values in the top 25% of the range have a red background and in the bottom 25% of the range have a green background. The red background is not used when the min value is within 80% of the max value.
| dbms | 256us | 1ms | 4ms | 16ms | 64ms | 256ms | 1s | 4s | 16s | gt | max |
|---|---|---|---|---|---|---|---|---|---|---|---|
| ma120101_rel_withdbg.cz12b_c32r128 | nonzero | 8.293 | 84.194 | 6.009 | 1.486 | 0.017 | 0.205 | ||||
| my8406_rel_o2nofp.cz12a_c32r128 | nonzero | 7.704 | 89.150 | 3.141 | 0.005 | nonzero | 0.115 | ||||
| pg180_o2nofp.cx10b_c32r128 | 0.005 | 65.538 | 23.170 | 10.601 | 0.608 | 0.065 | 0.012 | 0.001 | 10.495 |
Insert response time histogram: each cell has the percentage of responses that take <= the time in the header and max is the max response time in seconds. For max values in the top 25% of the range have a red background and in the bottom 25% of the range have a green background. The red background is not used when the min value is within 80% of the max value.
| dbms | 256us | 1ms | 4ms | 16ms | 64ms | 256ms | 1s | 4s | 16s | gt | max |
|---|---|---|---|---|---|---|---|---|---|---|---|
| ma120101_rel_withdbg.cz12b_c32r128 | 0.031 | 27.891 | 38.011 | 34.067 | 0.620 | ||||||
| my8406_rel_o2nofp.cz12a_c32r128 | 2.039 | 97.961 | nonzero | 0.297 | |||||||
| pg180_o2nofp.cx10b_c32r128 | 5.191 | 50.380 | 43.514 | 0.779 | 0.125 | 0.011 | 10.572 |
Delete response time histogram: each cell has the percentage of responses that take <= the time in the header and max is the max response time in seconds. For max values in the top 25% of the range have a red background and in the bottom 25% of the range have a green background. The red background is not used when the min value is within 80% of the max value.
| dbms | 256us | 1ms | 4ms | 16ms | 64ms | 256ms | 1s | 4s | 16s | gt | max |
|---|---|---|---|---|---|---|---|---|---|---|---|
| ma120101_rel_withdbg.cz12b_c32r128 | 0.038 | 29.618 | 37.262 | 33.082 | 0.704 | ||||||
| my8406_rel_o2nofp.cz12a_c32r128 | 10.824 | 89.176 | 0.188 | ||||||||
| pg180_o2nofp.cx10b_c32r128 | 0.272 | 9.556 | 27.622 | 55.121 | 7.143 | 0.234 | 0.050 | nonzero | 10.500 |
Performance metrics for the DBMS listed above. Some are normalized by throughput, others are not. Legend for results is here.
ips	qps	rps	rmbps	wps	wmbps	rpq	rkbpq	wpi	wkbpi	csps	cpups	cspq	cpupq	dbgb1	dbgb2	rss	maxop	p50	p99	tag
6205	7599	103402	1615.7	40437.2	1121.2	13.607	217.709	6.517	185.031	1043469	19.4	137.311	1225	730.5	832.8	100.4	0.205	448	64	ma120101_rel_withdbg.cz12b_c32r128
10939	10199	123312	1926.7	51346.3	1439.8	12.090	193.447	4.694	134.777	531182	27.5	52.081	1294	818.5	1155.6	106.0	0.115	512	384	my8406_rel_o2nofp.cz12a_c32r128
14466	2301	63325	582.1	30518.1	533.3	27.516	258.997	2.110	37.747	146360	62.6	63.596	13056	805.2	901.3	61.4	10.495	128	0	pg180_o2nofp.cx10b_c32r128
Average values from iostat.
r/s	rkB/s	rrqm/s	%rrqm	r_await	rareq-s	w/s	wkB/s	wrqm/s	%wrqm	w_await	wareq-s	d/s	dkB/s	drqm/s	%drqm	d_await	dareq-s	f/s	f_await	aqu-sz	%util
103402	1654433	0.000	0.000	0.191	16.00	40437.2	1148152	0.000	0.000	0.118	28.39	0.000	0.000	0.000	0.000	0.000	0.000	0.000	0.000	24.78	100.00		ma120101_rel_withdbg.cz12b_c32r128
123312	1972988	0.000	0.000	0.199	16.00	51346.3	1474311	0.000	0.000	2.338	28.72	0.000	0.000	0.000	0.000	0.000	0.000	0.000	0.000	144.6	100.00		my8406_rel_o2nofp.cz12a_c32r128
63325.1	596055	0.000	0.000	0.131	9.502	30518.1	546073	0.000	0.000	290.8	19.60	0.000	0.000	0.000	0.000	0.000	0.000	0.000	0.000	9739.3	87.91		pg180_o2nofp.cx10b_c32r128
l.i0
l.i0: load without secondary indexes
Performance metrics for all DBMS, not just the ones listed above. Some are normalized by throughput, others are not. Legend for results is here.
ips	qps	rps	rmbps	wps	wmbps	rpq	rkbpq	wpi	wkbpi	csps	cpups	cspq	cpupq	dbgb1	dbgb2	rss	maxop	p50	p99	tag
1004268	0	5	0.1	6179.4	287.3	0.000	0.000	0.006	0.293	178307	59.0	0.178	28	263.2	365.1	101.2	0.713	50645	41355	ma120101_rel_withdbg.cz12b_c32r128
1428571	0	5	0.1	9661.7	528.6	0.000	0.000	0.007	0.379	323499	54.0	0.226	18	262.3	548.6	108.8	0.270	74220	60634	my8406_rel_o2nofp.cz12a_c32r128
2117522	0	1751	14.1	8835.5	844.3	0.001	0.007	0.004	0.408	355213	59.1	0.168	13	382.7	478.8	95.5	1.424	114177	49846	pg180_o2nofp.cx10b_c32r128
l.x
l.x: create secondary indexes
Performance metrics for all DBMS, not just the ones listed above. Some are normalized by throughput, others are not. Legend for results is here.
ips	qps	rps	rmbps	wps	wmbps	rpq	rkbpq	wpi	wkbpi	csps	cpups	cspq	cpupq	dbgb1	dbgb2	rss	maxop	p50	p99	tag
1537279	0	16749	1373.8	20104.5	1549.2	0.011	0.915	0.013	1.032	108785	24.7	0.071	8	557.5	659.4	100.7	0.004	NA	NA	ma120101_rel_withdbg.cz12b_c32r128
848716	0	16867	1022.5	38465.0	1178.5	0.020	1.234	0.045	1.422	342574	56.9	0.404	32	603.6	889.9	106.7	0.008	NA	NA	my8406_rel_o2nofp.cz12a_c32r128
3454232	0	11305	1100.4	8923.4	990.4	0.003	0.326	0.003	0.294	89741	24.2	0.026	3	768.4	863.7	31.8	0.149	NA	NA	pg180_o2nofp.cx10b_c32r128
l.i1
l.i1: continue load after secondary indexes created with 50 inserts per transaction
Performance metrics for all DBMS, not just the ones listed above. Some are normalized by throughput, others are not. Legend for results is here.
ips	qps	rps	rmbps	wps	wmbps	rpq	rkbpq	wpi	wkbpi	csps	cpups	cspq	cpupq	dbgb1	dbgb2	rss	maxop	p50	p99	tag
8305	0	50159	783.7	49755.5	1339.8	6.040	96.634	5.991	165.198	1012811	16.5	121.956	954	730.2	832.5	100.5	0.790	450	150	ma120101_rel_withdbg.cz12b_c32r128
16556	0	37539	586.6	52297.5	1516.5	2.267	36.278	3.159	93.796	333931	20.7	20.170	600	818.5	1128.5	107.5	0.520	699	300	my8406_rel_o2nofp.cz12a_c32r128
22637	0	28697	229.5	33466.2	742.0	1.268	10.383	1.478	33.566	80347	32.0	3.549	679	781.5	918.4	81.8	4.078	1099	0	pg180_o2nofp.cx10b_c32r128
l.i2
l.i2: continue load after secondary indexes created with 5 inserts per transaction
Performance metrics for all DBMS, not just the ones listed above. Some are normalized by throughput, others are not. Legend for results is here.
ips	qps	rps	rmbps	wps	wmbps	rpq	rkbpq	wpi	wkbpi	csps	cpups	cspq	cpupq	dbgb1	dbgb2	rss	maxop	p50	p99	tag
8602	0	58307	911.0	51129.7	1428.7	6.778	108.451	5.944	170.072	696756	16.1	80.998	898	730.2	832.5	100.3	0.218	579	95	ma120101_rel_withdbg.cz12b_c32r128
6307	0	42612	665.8	54515.3	1544.4	6.756	108.100	8.643	250.745	362906	18.7	57.539	1423	818.5	1129.4	106.0	0.103	155	90	my8406_rel_o2nofp.cz12a_c32r128
2572	0	3376	32.7	5223.0	82.4	1.313	13.026	2.031	32.806	19506	27.3	7.584	5095	784.8	880.9	86.5	4.508	135	55	pg180_o2nofp.cx10b_c32r128
qr100.L1
qr100.L1: range queries with 100 insert/s per client
Performance metrics for all DBMS, not just the ones listed above. Some are normalized by throughput, others are not. Legend for results is here.
ips	qps	rps	rmbps	wps	wmbps	rpq	rkbpq	wpi	wkbpi	csps	cpups	cspq	cpupq	dbgb1	dbgb2	rss	maxop	p50	p99	tag
1987	199066	8797	137.5	7099.8	198.1	0.044	0.707	3.574	102.107	1215692	44.4	6.107	107	730.2	832.5	100.4	0.084	10085	9366	ma120101_rel_withdbg.cz12b_c32r128
1987	206207	8240	128.7	10136.1	286.9	0.040	0.639	5.100	147.827	1223329	45.1	5.933	105	818.5	1130.1	106.0	0.027	10373	9737	my8406_rel_o2nofp.cz12a_c32r128
1987	366335	2623	21.1	2296.1	45.0	0.007	0.059	1.155	23.172	1398663	43.7	3.818	57	785.0	881.1	95.4	1.121	18322	17485	pg180_o2nofp.cx10b_c32r128
qp100.L2
qp100.L2: point queries with 100 insert/s per client
Performance metrics for all DBMS, not just the ones listed above. Some are normalized by throughput, others are not. Legend for results is here.
ips	qps	rps	rmbps	wps	wmbps	rpq	rkbpq	wpi	wkbpi	csps	cpups	cspq	cpupq	dbgb1	dbgb2	rss	maxop	p50	p99	tag
1987	19507	140662	2198.0	11446.2	316.4	7.211	115.379	5.761	163.106	574056	15.6	29.428	384	730.2	832.5	100.4	0.134	991	543	ma120101_rel_withdbg.cz12b_c32r128
1988	18931	136713	2136.2	16013.6	445.2	7.222	115.550	8.056	229.344	427047	16.2	22.558	411	818.5	1130.8	106.0	0.034	959	606	my8406_rel_o2nofp.cz12a_c32r128
1987	7212	101152	793.4	5581.6	68.5	14.025	112.649	2.809	35.294	225451	23.3	31.259	1551	785.2	881.2	86.8	5.566	384	0	pg180_o2nofp.cx10b_c32r128
qr500.L3
qr500.L3: range queries with 500 insert/s per client
Performance metrics for all DBMS, not just the ones listed above. Some are normalized by throughput, others are not. Legend for results is here.
ips	qps	rps	rmbps	wps	wmbps	rpq	rkbpq	wpi	wkbpi	csps	cpups	cspq	cpupq	dbgb1	dbgb2	rss	maxop	p50	p99	tag
9936	142687	41769	652.6	36713.4	1023.3	0.293	4.684	3.695	105.451	1435983	49.1	10.064	165	730.2	832.5	100.4	0.221	7592	3581	ma120101_rel_withdbg.cz12b_c32r128
9936	181940	36392	568.6	44858.1	1265.0	0.200	3.200	4.514	130.359	1204319	55.0	6.619	145	818.5	1134.3	106.0	0.046	9193	8023	my8406_rel_o2nofp.cz12a_c32r128
9912	304725	13223	106.7	16041.6	257.2	0.043	0.359	1.618	26.572	1131403	52.3	3.713	82	786.3	882.4	85.6	2.170	15407	13248	pg180_o2nofp.cx10b_c32r128
qp500.L4
qp500.L4: point queries with 500 insert/s per client
Performance metrics for all DBMS, not just the ones listed above. Some are normalized by throughput, others are not. Legend for results is here.
ips	qps	rps	rmbps	wps	wmbps	rpq	rkbpq	wpi	wkbpi	csps	cpups	cspq	cpupq	dbgb1	dbgb2	rss	maxop	p50	p99	tag
5912	5152	75608	1181.4	33018.4	913.4	14.677	234.828	5.585	158.198	1188421	18.6	230.694	1733	730.4	832.7	100.4	0.222	112	48	ma120101_rel_withdbg.cz12b_c32r128
9936	10514	122588	1915.4	50244.4	1403.0	11.660	186.560	5.057	144.584	478916	24.2	45.552	1105	818.5	1137.8	106.0	0.059	528	400	my8406_rel_o2nofp.cz12a_c32r128
9464	4132	78023	612.2	20213.7	281.8	18.883	151.720	2.136	30.496	182152	39.7	44.084	4612	789.2	885.3	39.2	10.570	224	0	pg180_o2nofp.cx10b_c32r128
qr1000.L5
qr1000.L5: range queries with 1000 insert/s per client
Performance metrics for all DBMS, not just the ones listed above. Some are normalized by throughput, others are not. Legend for results is here.
ips	qps	rps	rmbps	wps	wmbps	rpq	rkbpq	wpi	wkbpi	csps	cpups	cspq	cpupq	dbgb1	dbgb2	rss	maxop	p50	p99	tag
7663	97256	43802	684.4	42536.1	1180.7	0.450	7.206	5.551	157.785	1420689	46.6	14.608	230	730.5	832.8	100.4	0.260	5019	2302	ma120101_rel_withdbg.cz12b_c32r128
19350	122238	37646	588.2	48923.1	1389.2	0.308	4.928	2.528	73.517	913068	59.5	7.470	234	818.5	1146.8	106.0	0.074	6235	4555	my8406_rel_o2nofp.cz12a_c32r128
15772	149143	20957	169.2	24511.4	524.9	0.141	1.162	1.554	34.078	418741	72.8	2.808	234	800.0	896.1	81.7	4.279	7735	607	pg180_o2nofp.cx10b_c32r128
qp1000.L6
qp1000.L6: point queries with 1000 insert/s per client
Performance metrics for all DBMS, not just the ones listed above. Some are normalized by throughput, others are not. Legend for results is here.
ips	qps	rps	rmbps	wps	wmbps	rpq	rkbpq	wpi	wkbpi	csps	cpups	cspq	cpupq	dbgb1	dbgb2	rss	maxop	p50	p99	tag
6205	7599	103402	1615.7	40437.2	1121.2	13.607	217.709	6.517	185.031	1043469	19.4	137.311	1225	730.5	832.8	100.4	0.205	448	64	ma120101_rel_withdbg.cz12b_c32r128
10939	10199	123312	1926.7	51346.3	1439.8	12.090	193.447	4.694	134.777	531182	27.5	52.081	1294	818.5	1155.6	106.0	0.115	512	384	my8406_rel_o2nofp.cz12a_c32r128
14466	2301	63325	582.1	30518.1	533.3	27.516	258.997	2.110	37.747	146360	62.6	63.596	13056	805.2	901.3	61.4	10.495	128	0	pg180_o2nofp.cx10b_c32r128
l.i0
- l.i0: load without secondary indexes
- Legend for results is here.
- Each entry lists the percentage of responses that fit in that bucket (slower than max time for previous bucket, faster than min time for next bucket).
Insert response time histogram
256us	1ms	4ms	16ms	64ms	256ms	1s	4s	16s	gt	max	tag
0.000	0.786	98.601	0.356	0.168	0.088	nonzero	0.000	0.000	0.000	0.713	ma120101_rel_withdbg.cz12b_c32r128
0.000	0.115	99.738	0.086	0.023	0.039	nonzero	0.000	0.000	0.000	0.270	my8406_rel_o2nofp.cz12a_c32r128
0.000	92.755	6.924	0.241	0.070	0.007	0.003	nonzero	0.000	0.000	1.424	pg180_o2nofp.cx10b_c32r128
l.x
- l.x: create secondary indexes
- Legend for results is here.
- Each entry lists the percentage of responses that fit in that bucket (slower than max time for previous bucket, faster than min time for next bucket).
TODO - determine whether there is data for create index response time
l.i1
- l.i1: continue load after secondary indexes created with 50 inserts per transaction
- Legend for results is here.
- Each entry lists the percentage of responses that fit in that bucket (slower than max time for previous bucket, faster than min time for next bucket).
Insert response time histogram
256us	1ms	4ms	16ms	64ms	256ms	1s	4s	16s	gt	max	tag
0.000	0.000	0.000	0.335	28.373	52.121	19.170	0.000	0.000	0.000	0.790	ma120101_rel_withdbg.cz12b_c32r128
0.000	0.000	0.146	15.703	41.572	42.101	0.477	0.000	0.000	0.000	0.520	my8406_rel_o2nofp.cz12a_c32r128
0.000	0.000	0.000	18.998	62.949	17.860	0.073	0.120	nonzero	0.000	4.078	pg180_o2nofp.cx10b_c32r128
Delete response time histogram
256us	1ms	4ms	16ms	64ms	256ms	1s	4s	16s	gt	max	tag
0.000	0.000	0.000	2.529	48.789	29.895	18.787	0.000	0.000	0.000	0.736	ma120101_rel_withdbg.cz12b_c32r128
0.000	0.000	18.418	19.191	34.993	27.395	0.003	0.000	0.000	0.000	0.293	my8406_rel_o2nofp.cz12a_c32r128
0.000	2.489	8.647	20.642	62.623	5.508	0.028	0.063	0.000	0.000	3.157	pg180_o2nofp.cx10b_c32r128
l.i2
- l.i2: continue load after secondary indexes created with 5 inserts per transaction
- Legend for results is here.
- Each entry lists the percentage of responses that fit in that bucket (slower than max time for previous bucket, faster than min time for next bucket).
Insert response time histogram
256us	1ms	4ms	16ms	64ms	256ms	1s	4s	16s	gt	max	tag
nonzero	0.787	57.216	13.444	28.448	0.105	0.000	0.000	0.000	0.000	0.218	ma120101_rel_withdbg.cz12b_c32r128
0.000	0.000	0.139	74.397	25.410	0.055	0.000	0.000	0.000	0.000	0.103	my8406_rel_o2nofp.cz12a_c32r128
0.088	37.304	62.059	0.137	0.309	0.025	0.051	0.026	nonzero	0.000	4.508	pg180_o2nofp.cx10b_c32r128
Delete response time histogram
256us	1ms	4ms	16ms	64ms	256ms	1s	4s	16s	gt	max	tag
nonzero	1.760	62.332	7.638	28.195	0.075	0.000	0.000	0.000	0.000	0.217	ma120101_rel_withdbg.cz12b_c32r128
0.000	0.000	1.298	74.233	24.448	0.020	0.000	0.000	0.000	0.000	0.117	my8406_rel_o2nofp.cz12a_c32r128
0.201	3.386	0.853	0.186	95.368	0.003	0.002	nonzero	0.000	0.000	2.062	pg180_o2nofp.cx10b_c32r128
qr100.L1
- qr100.L1: range queries with 100 insert/s per client
- Legend for results is here.
- Each entry lists the percentage of responses that fit in that bucket (slower than max time for previous bucket, faster than min time for next bucket).
Query response time histogram
256us	1ms	4ms	16ms	64ms	256ms	1s	4s	16s	gt	max	tag
99.607	0.369	0.024	0.001	nonzero	nonzero	0.000	0.000	0.000	0.000	0.084	ma120101_rel_withdbg.cz12b_c32r128
99.911	0.085	0.004	nonzero	nonzero	0.000	0.000	0.000	0.000	0.000	0.027	my8406_rel_o2nofp.cz12a_c32r128
99.996	0.004	0.001	nonzero	nonzero	nonzero	nonzero	nonzero	0.000	0.000	1.121	pg180_o2nofp.cx10b_c32r128
Insert response time histogram
256us	1ms	4ms	16ms	64ms	256ms	1s	4s	16s	gt	max	tag
0.000	0.000	0.000	45.364	54.476	0.160	0.000	0.000	0.000	0.000	0.128	ma120101_rel_withdbg.cz12b_c32r128
0.000	0.000	0.000	83.550	16.450	0.000	0.000	0.000	0.000	0.000	0.055	my8406_rel_o2nofp.cz12a_c32r128
0.000	0.000	0.000	98.308	1.601	0.037	0.053	0.001	0.000	0.000	1.162	pg180_o2nofp.cx10b_c32r128
Delete response time histogram
256us	1ms	4ms	16ms	64ms	256ms	1s	4s	16s	gt	max	tag
0.000	0.000	0.000	68.112	31.790	0.097	0.000	0.000	0.000	0.000	0.123	ma120101_rel_withdbg.cz12b_c32r128
0.000	0.000	89.622	10.307	0.072	0.000	0.000	0.000	0.000	0.000	0.028	my8406_rel_o2nofp.cz12a_c32r128
0.000	23.008	74.472	2.516	0.001	0.001	0.002	0.000	0.000	0.000	0.514	pg180_o2nofp.cx10b_c32r128
qp100.L2
- qp100.L2: point queries with 100 insert/s per client
- Legend for results is here.
- Each entry lists the percentage of responses that fit in that bucket (slower than max time for previous bucket, faster than min time for next bucket).
Query response time histogram
256us	1ms	4ms	16ms	64ms	256ms	1s	4s	16s	gt	max	tag
0.017	65.494	34.417	0.067	0.004	nonzero	0.000	0.000	0.000	0.000	0.134	ma120101_rel_withdbg.cz12b_c32r128
0.003	59.984	39.752	0.261	nonzero	0.000	0.000	0.000	0.000	0.000	0.034	my8406_rel_o2nofp.cz12a_c32r128
nonzero	2.288	94.373	0.227	3.003	0.073	0.030	0.006	0.001	0.000	5.566	pg180_o2nofp.cx10b_c32r128
Insert response time histogram
256us	1ms	4ms	16ms	64ms	256ms	1s	4s	16s	gt	max	tag
0.000	0.000	0.000	0.110	99.060	0.817	0.013	0.000	0.000	0.000	0.356	ma120101_rel_withdbg.cz12b_c32r128
0.000	0.000	0.000	47.613	52.362	0.026	0.000	0.000	0.000	0.000	0.098	my8406_rel_o2nofp.cz12a_c32r128
0.000	0.000	0.000	68.346	29.679	0.902	0.489	0.520	0.064	0.000	5.349	pg180_o2nofp.cx10b_c32r128
Delete response time histogram
256us	1ms	4ms	16ms	64ms	256ms	1s	4s	16s	gt	max	tag
0.000	0.000	0.000	0.149	99.152	0.696	0.003	0.000	0.000	0.000	0.309	ma120101_rel_withdbg.cz12b_c32r128
0.000	0.000	91.709	8.263	0.028	0.000	0.000	0.000	0.000	0.000	0.034	my8406_rel_o2nofp.cz12a_c32r128
0.000	0.000	49.385	45.971	4.584	0.009	0.030	0.020	0.001	0.000	5.240	pg180_o2nofp.cx10b_c32r128
qr500.L3
- qr500.L3: range queries with 500 insert/s per client
- Legend for results is here.
- Each entry lists the percentage of responses that fit in that bucket (slower than max time for previous bucket, faster than min time for next bucket).
Query response time histogram
256us	1ms	4ms	16ms	64ms	256ms	1s	4s	16s	gt	max	tag
96.533	3.130	0.255	0.064	0.017	nonzero	0.000	0.000	0.000	0.000	0.221	ma120101_rel_withdbg.cz12b_c32r128
99.420	0.548	0.030	0.002	nonzero	0.000	0.000	0.000	0.000	0.000	0.046	my8406_rel_o2nofp.cz12a_c32r128
99.973	0.021	0.004	0.001	0.001	nonzero	nonzero	nonzero	0.000	0.000	2.170	pg180_o2nofp.cx10b_c32r128
Insert response time histogram
256us	1ms	4ms	16ms	64ms	256ms	1s	4s	16s	gt	max	tag
0.000	0.000	0.000	13.401	70.476	16.049	0.074	0.000	0.000	0.000	0.500	ma120101_rel_withdbg.cz12b_c32r128
0.000	0.000	0.000	34.033	65.777	0.189	0.000	0.000	0.000	0.000	0.116	my8406_rel_o2nofp.cz12a_c32r128
0.000	0.000	0.000	83.580	15.677	0.457	0.228	0.058	0.000	0.000	3.544	pg180_o2nofp.cx10b_c32r128
Delete response time histogram
256us	1ms	4ms	16ms	64ms	256ms	1s	4s	16s	gt	max	tag
0.000	0.000	0.000	30.503	55.440	14.029	0.028	0.000	0.000	0.000	0.399	ma120101_rel_withdbg.cz12b_c32r128
0.000	0.000	49.395	48.629	1.974	0.002	0.000	0.000	0.000	0.000	0.073	my8406_rel_o2nofp.cz12a_c32r128
0.000	0.000	3.517	87.230	9.234	0.011	0.004	0.003	0.000	0.000	3.348	pg180_o2nofp.cx10b_c32r128
qp500.L4
- qp500.L4: point queries with 500 insert/s per client
- Legend for results is here.
- Each entry lists the percentage of responses that fit in that bucket (slower than max time for previous bucket, faster than min time for next bucket).
Query response time histogram
256us	1ms	4ms	16ms	64ms	256ms	1s	4s	16s	gt	max	tag
nonzero	7.663	76.791	10.667	4.805	0.074	0.000	0.000	0.000	0.000	0.222	ma120101_rel_withdbg.cz12b_c32r128
nonzero	11.397	85.383	3.206	0.015	0.000	0.000	0.000	0.000	0.000	0.059	my8406_rel_o2nofp.cz12a_c32r128
0.000	0.111	92.172	1.957	5.660	0.064	0.022	0.011	0.004	0.000	10.570	pg180_o2nofp.cx10b_c32r128
Insert response time histogram
256us	1ms	4ms	16ms	64ms	256ms	1s	4s	16s	gt	max	tag
0.000	0.000	0.000	0.060	17.739	56.748	25.453	0.000	0.000	0.000	0.738	ma120101_rel_withdbg.cz12b_c32r128
0.000	0.000	0.000	16.872	83.018	0.109	0.000	0.000	0.000	0.000	0.138	my8406_rel_o2nofp.cz12a_c32r128
0.000	0.000	0.000	29.429	67.215	2.783	0.294	0.200	0.079	0.000	10.506	pg180_o2nofp.cx10b_c32r128
Delete response time histogram
256us	1ms	4ms	16ms	64ms	256ms	1s	4s	16s	gt	max	tag
0.000	0.000	0.000	0.077	19.108	58.269	22.546	0.000	0.000	0.000	0.611	ma120101_rel_withdbg.cz12b_c32r128
0.000	0.000	33.172	65.968	0.859	nonzero	0.000	0.000	0.000	0.000	0.071	my8406_rel_o2nofp.cz12a_c32r128
0.000	0.000	0.000	34.108	65.541	0.192	0.111	0.041	0.007	0.000	9.835	pg180_o2nofp.cx10b_c32r128
qr1000.L5
- qr1000.L5: range queries with 1000 insert/s per client
- Legend for results is here.
- Each entry lists the percentage of responses that fit in that bucket (slower than max time for previous bucket, faster than min time for next bucket).
Query response time histogram
256us	1ms	4ms	16ms	64ms	256ms	1s	4s	16s	gt	max	tag
91.698	6.773	1.291	0.191	0.046	nonzero	nonzero	0.000	0.000	0.000	0.260	ma120101_rel_withdbg.cz12b_c32r128
93.839	5.293	0.851	0.016	nonzero	nonzero	0.000	0.000	0.000	0.000	0.074	my8406_rel_o2nofp.cz12a_c32r128
98.907	0.923	0.049	0.073	0.045	0.002	nonzero	nonzero	nonzero	0.000	4.279	pg180_o2nofp.cx10b_c32r128
Insert response time histogram
256us	1ms	4ms	16ms	64ms	256ms	1s	4s	16s	gt	max	tag
0.000	0.000	0.000	0.913	24.016	53.496	21.574	0.000	0.000	0.000	0.487	ma120101_rel_withdbg.cz12b_c32r128
0.000	0.000	0.001	34.229	61.048	4.723	0.000	0.000	0.000	0.000	0.166	my8406_rel_o2nofp.cz12a_c32r128
0.000	0.000	0.000	20.860	43.188	35.444	0.349	0.153	0.007	0.000	7.788	pg180_o2nofp.cx10b_c32r128
Delete response time histogram
256us	1ms	4ms	16ms	64ms	256ms	1s	4s	16s	gt	max	tag
0.000	0.000	0.000	3.844	31.029	43.835	21.292	0.000	0.000	0.000	0.483	ma120101_rel_withdbg.cz12b_c32r128
0.000	0.000	23.330	53.888	20.744	2.038	0.000	0.000	0.000	0.000	0.149	my8406_rel_o2nofp.cz12a_c32r128
0.000	0.007	nonzero	0.001	80.533	19.287	0.091	0.081	nonzero	0.000	4.903	pg180_o2nofp.cx10b_c32r128
qp1000.L6
- qp1000.L6: point queries with 1000 insert/s per client
- Legend for results is here.
- Each entry lists the percentage of responses that fit in that bucket (slower than max time for previous bucket, faster than min time for next bucket).
Query response time histogram
256us	1ms	4ms	16ms	64ms	256ms	1s	4s	16s	gt	max	tag
nonzero	8.293	84.194	6.009	1.486	0.017	0.000	0.000	0.000	0.000	0.205	ma120101_rel_withdbg.cz12b_c32r128
nonzero	7.704	89.150	3.141	0.005	nonzero	0.000	0.000	0.000	0.000	0.115	my8406_rel_o2nofp.cz12a_c32r128
0.000	0.005	65.538	23.170	10.601	0.608	0.065	0.012	0.001	0.000	10.495	pg180_o2nofp.cx10b_c32r128
Insert response time histogram
256us	1ms	4ms	16ms	64ms	256ms	1s	4s	16s	gt	max	tag
0.000	0.000	0.000	0.031	27.891	38.011	34.067	0.000	0.000	0.000	0.620	ma120101_rel_withdbg.cz12b_c32r128
0.000	0.000	0.000	0.000	2.039	97.961	nonzero	0.000	0.000	0.000	0.297	my8406_rel_o2nofp.cz12a_c32r128
0.000	0.000	0.000	5.191	50.380	43.514	0.779	0.125	0.011	0.000	10.572	pg180_o2nofp.cx10b_c32r128
Delete response time histogram
256us	1ms	4ms	16ms	64ms	256ms	1s	4s	16s	gt	max	tag
0.000	0.000	0.000	0.038	29.618	37.262	33.082	0.000	0.000	0.000	0.704	ma120101_rel_withdbg.cz12b_c32r128
0.000	0.000	0.000	0.000	10.824	89.176	0.000	0.000	0.000	0.000	0.188	my8406_rel_o2nofp.cz12a_c32r128
0.000	0.272	9.556	27.622	55.121	7.143	0.234	0.050	nonzero	0.000	10.500	pg180_o2nofp.cx10b_c32r128