Introduction
This is a report for the insert benchmark with 800M docs and 1 client(s). It is generated by scripts (bash, awk, sed) and Tufte might not be impressed. An overview of the insert benchmark is here and a short update is here. Below, by DBMS, I mean DBMS+version.config. An example is my8020.c10b40 where my means MySQL, 8020 is version 8.0.20 and c10b40 is the name for the configuration file.
The test server has 8 AMD cores, 32G RAM and an NVMe device for the database. The benchmark was run with 1 client and there were 1 or 3 connections per client (1 for queries or inserts without rate limits, 1+1 for rate limited inserts+deletes). It uses 1 table with a table per client. It loads 800M rows per table without secondary indexes, creates 3 secondary indexes per table, then inserts 16m+4m rows per table with a delete per insert to avoid growing the table. It then does 6 read+write tests for 7200s each that do queries as fast as possible with 100,100,500,500,1000,1000 inserts/s and the same for deletes/s per client concurrent with the queries. The database is larger than memory and the working set it not cached for most benchmark steps. Clients and the DBMS share one server.
The tested DBMS are:
- pg176_o2nofp.cx10a_c8r32 - Postgres 17.6 with the x10a_c8r32 config
- pg18rc1_o2nofp.cx10b_c8r32 - Postgres 18 rc1 with the x10b_c8r32 config that uses io_method=sync
- pg18rc1_o2nofp.cx10c_c8r32 - Postgres 18 rc1 with the x10c_c8r32 config that uses io_method=worker
- pg18rc1_o2nofp.cx10d_c8r32 - Postgres 18 rc1 with the x10c_c8r32 config that uses io_method=io_uring
Contents
- Summary
- l.i0: load without secondary indexes
- l.x: create secondary indexes
- l.i1: continue load after secondary indexes created with 50 inserts per transaction
- l.i2: continue load after secondary indexes created with 5 inserts per transaction
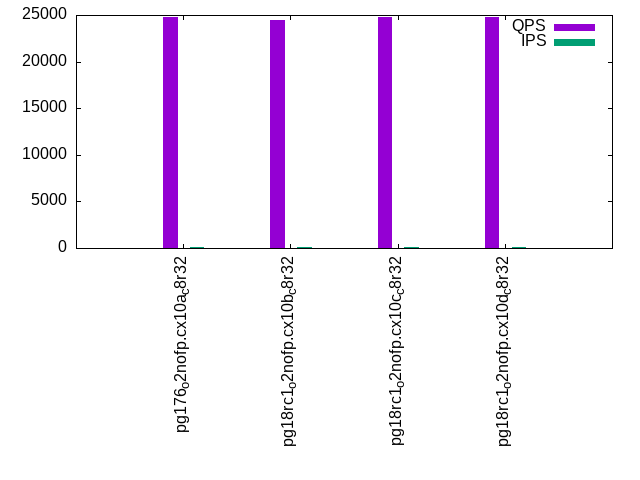
- qr100.L1: range queries with 100 insert/s per client
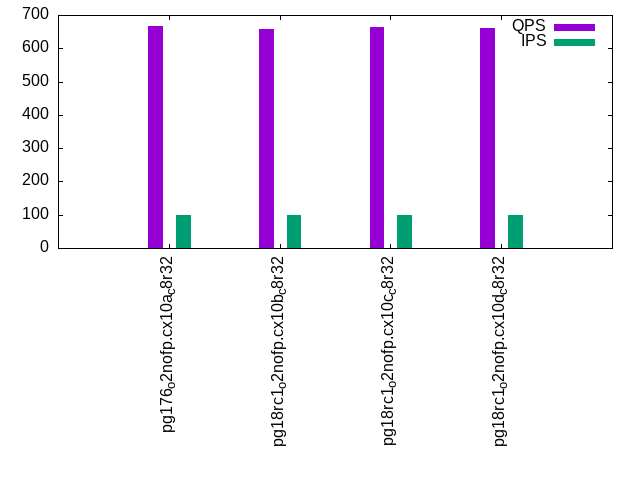
- qp100.L2: point queries with 100 insert/s per client
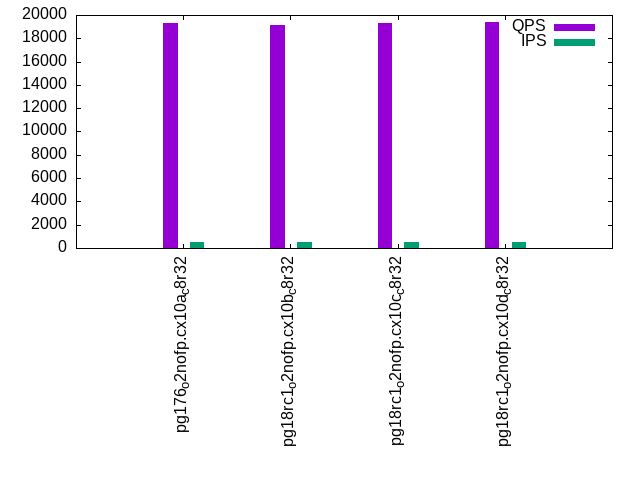
- qr500.L3: range queries with 500 insert/s per client
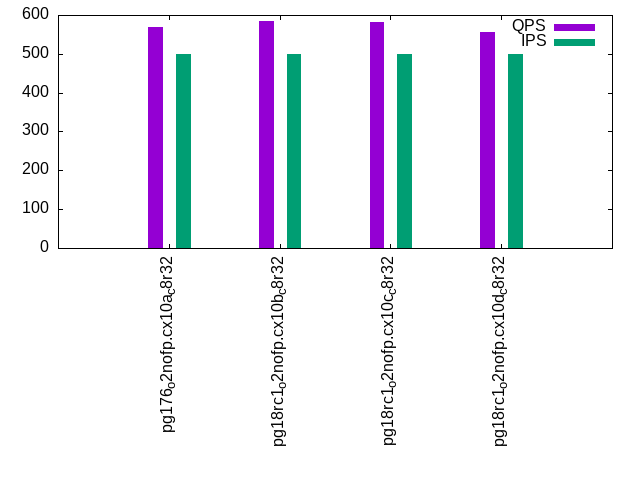
- qp500.L4: point queries with 500 insert/s per client
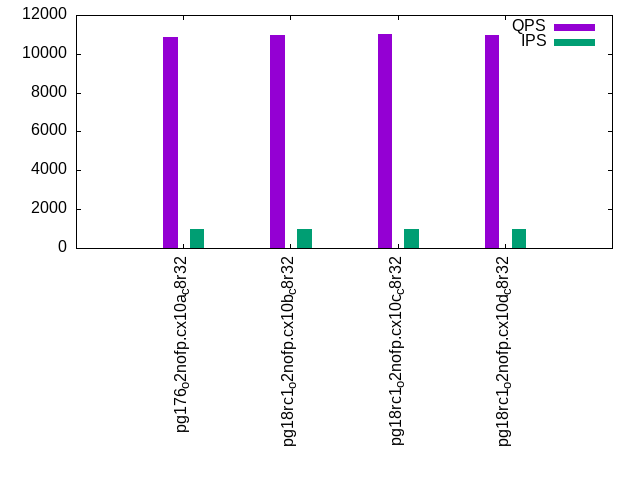
- qr1000.L5: range queries with 1000 insert/s per client
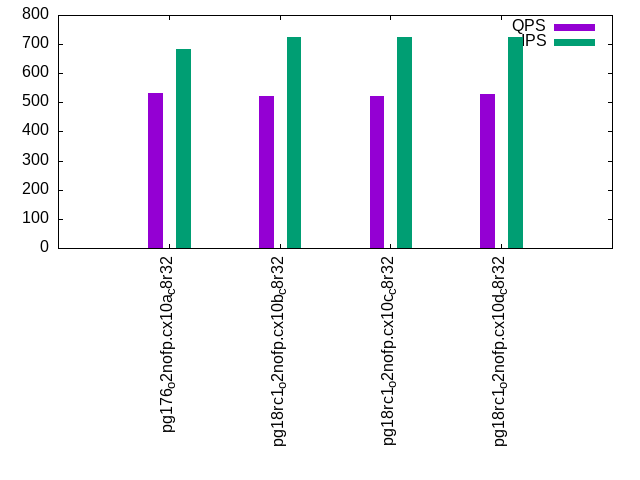
- qp1000.L6: point queries with 1000 insert/s per client
Summary
The numbers are inserts/s for l.i0, l.i1 and l.i2, indexed docs (or rows) /s for l.x and queries/s for qr100, qp100 thru qr1000, qp1000" The values are the average rate over the entire test for inserts (IPS) and queries (QPS). The range of values for IPS and QPS is split into 3 parts: bottom 25%, middle 50%, top 25%. Values in the bottom 25% have a red background, values in the top 25% have a green background and values in the middle have no color. A gray background is used for values that can be ignored because the DBMS did not sustain the target insert rate. Red backgrounds are not used when the minimum value is within 80% of the max value.
| dbms | l.i0 | l.x | l.i1 | l.i2 | qr100 | qp100 | qr500 | qp500 | qr1000 | qp1000 |
|---|---|---|---|---|---|---|---|---|---|---|
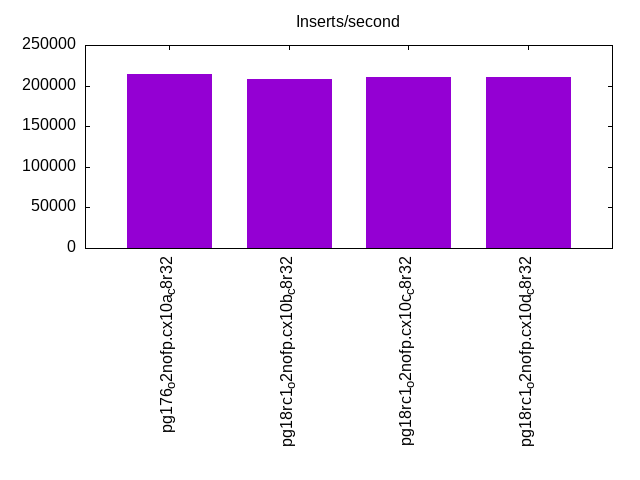
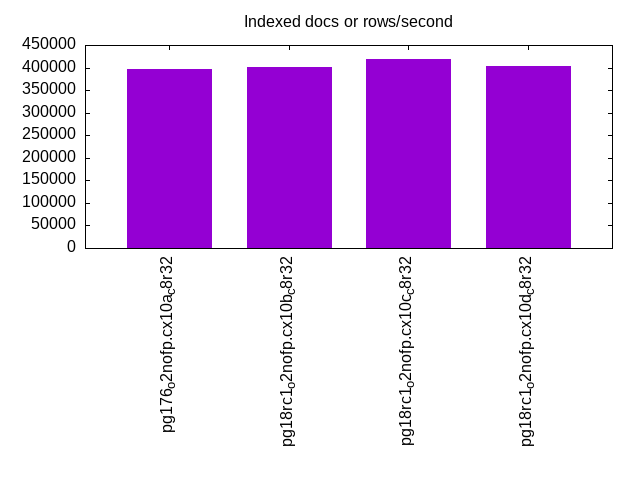
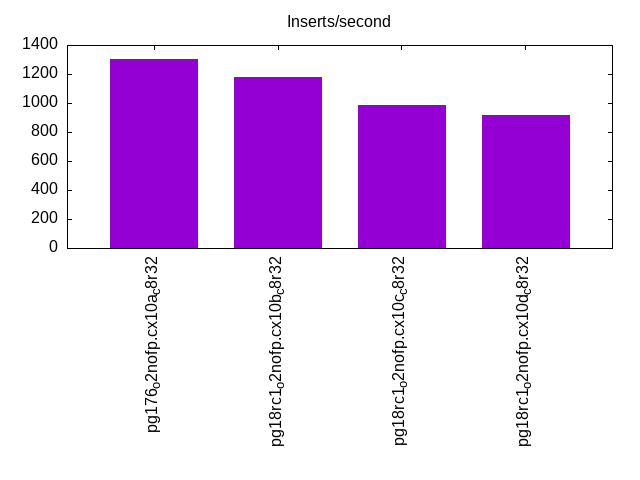
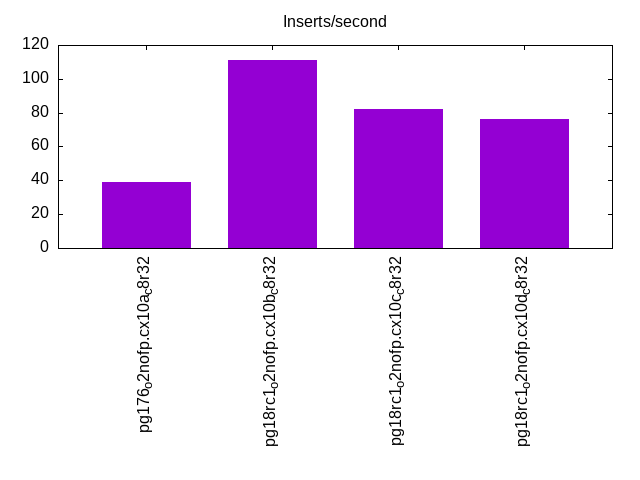
| pg176_o2nofp.cx10a_c8r32 | 214420 | 397417 | 1301 | 39 | 24810 | 666 | 19280 | 569 | 10884 | 533 |
| pg18rc1_o2nofp.cx10b_c8r32 | 207846 | 401405 | 1177 | 111 | 24495 | 657 | 19129 | 584 | 10979 | 522 |
| pg18rc1_o2nofp.cx10c_c8r32 | 210139 | 419948 | 987 | 82 | 24736 | 664 | 19328 | 582 | 11026 | 522 |
| pg18rc1_o2nofp.cx10d_c8r32 | 210250 | 404449 | 917 | 76 | 24761 | 662 | 19393 | 557 | 10960 | 528 |
This table has relative throughput, throughput for the DBMS relative to the DBMS in the first line, using the absolute throughput from the previous table. Values less than 0.95 have a yellow background. Values greater than 1.05 have a blue background.
| dbms | l.i0 | l.x | l.i1 | l.i2 | qr100 | qp100 | qr500 | qp500 | qr1000 | qp1000 |
|---|---|---|---|---|---|---|---|---|---|---|
| pg176_o2nofp.cx10a_c8r32 | 1.00 | 1.00 | 1.00 | 1.00 | 1.00 | 1.00 | 1.00 | 1.00 | 1.00 | 1.00 |
| pg18rc1_o2nofp.cx10b_c8r32 | 0.97 | 1.01 | 0.90 | 2.85 | 0.99 | 0.99 | 0.99 | 1.03 | 1.01 | 0.98 |
| pg18rc1_o2nofp.cx10c_c8r32 | 0.98 | 1.06 | 0.76 | 2.10 | 1.00 | 1.00 | 1.00 | 1.02 | 1.01 | 0.98 |
| pg18rc1_o2nofp.cx10d_c8r32 | 0.98 | 1.02 | 0.70 | 1.95 | 1.00 | 0.99 | 1.01 | 0.98 | 1.01 | 0.99 |
This lists the average rate of inserts/s for the tests that do inserts concurrent with queries. For such tests the query rate is listed in the table above. The read+write tests are setup so that the insert rate should match the target rate every second. Cells that are not at least 95% of the target have a red background to indicate a failure to satisfy the target.
| dbms | qr100.L1 | qp100.L2 | qr500.L3 | qp500.L4 | qr1000.L5 | qp1000.L6 |
|---|---|---|---|---|---|---|
| pg176_o2nofp.cx10a_c8r32 | 100 | 100 | 500 | 500 | 972 | 684 |
| pg18rc1_o2nofp.cx10b_c8r32 | 100 | 100 | 500 | 500 | 986 | 724 |
| pg18rc1_o2nofp.cx10c_c8r32 | 100 | 100 | 500 | 500 | 988 | 723 |
| pg18rc1_o2nofp.cx10d_c8r32 | 100 | 100 | 500 | 500 | 987 | 723 |
| target | 100 | 100 | 500 | 500 | 1000 | 1000 |
l.i0
l.i0: load without secondary indexes. Graphs for performance per 1-second interval are here.
Average throughput:
Insert response time histogram: each cell has the percentage of responses that take <= the time in the header and max is the max response time in seconds. For the max column values in the top 25% of the range have a red background and in the bottom 25% of the range have a green background. The red background is not used when the min value is within 80% of the max value.
| dbms | 256us | 1ms | 4ms | 16ms | 64ms | 256ms | 1s | 4s | 16s | gt | max |
|---|---|---|---|---|---|---|---|---|---|---|---|
| pg176_o2nofp.cx10a_c8r32 | 99.983 | 0.014 | 0.002 | 0.001 | 0.040 | ||||||
| pg18rc1_o2nofp.cx10b_c8r32 | 99.983 | 0.014 | 0.003 | nonzero | 0.040 | ||||||
| pg18rc1_o2nofp.cx10c_c8r32 | 99.982 | 0.015 | 0.003 | nonzero | 0.042 | ||||||
| pg18rc1_o2nofp.cx10d_c8r32 | 99.984 | 0.013 | 0.003 | nonzero | 0.044 |
Performance metrics for the DBMS listed above. Some are normalized by throughput, others are not. Legend for results is here.
ips	qps	rps	rmbps	wps	wmbps	rpq	rkbpq	wpi	wkbpi	csps	cpups	cspq	cpupq	dbgb1	dbgb2	rss	maxop	p50	p99	tag
214420	0	37	0.3	798.4	88.3	0.000	0.001	0.004	0.422	21352	20.6	0.100	8	76.5	116.6	1.2	0.040	215749	207866	pg176_o2nofp.cx10a_c8r32
207846	0	35	0.3	778.9	85.5	0.000	0.001	0.004	0.421	20698	20.3	0.100	8	76.5	116.6	1.0	0.040	209168	201266	pg18rc1_o2nofp.cx10b_c8r32
210139	0	36	0.3	786.7	86.3	0.000	0.001	0.004	0.421	21008	20.5	0.100	8	76.5	116.6	18.9	0.042	211365	203763	pg18rc1_o2nofp.cx10c_c8r32
210250	0	36	0.3	785.2	86.4	0.000	0.001	0.004	0.421	21058	20.4	0.100	8	76.5	116.6	18.9	0.044	211576	203268	pg18rc1_o2nofp.cx10d_c8r32
l.x
l.x: create secondary indexes.
Average throughput:
Performance metrics for the DBMS listed above. Some are normalized by throughput, others are not. Legend for results is here.
ips	qps	rps	rmbps	wps	wmbps	rpq	rkbpq	wpi	wkbpi	csps	cpups	cspq	cpupq	dbgb1	dbgb2	rss	maxop	p50	p99	tag
397417	0	1336	146.0	1220.9	148.5	0.003	0.376	0.003	0.383	1164	12.5	0.003	3	153.6	193.7	23.4	0.002	NA	NA	pg176_o2nofp.cx10a_c8r32
401405	0	1285	144.3	1224.4	149.9	0.003	0.368	0.003	0.382	1082	12.5	0.003	2	153.6	193.7	23.4	0.003	NA	NA	pg18rc1_o2nofp.cx10b_c8r32
419948	0	1210	144.3	1280.0	156.6	0.003	0.352	0.003	0.382	2031	13.2	0.005	3	153.6	193.7	23.4	0.003	NA	NA	pg18rc1_o2nofp.cx10c_c8r32
404449	0	1211	141.4	1236.1	151.1	0.003	0.358	0.003	0.383	1715	13.0	0.004	3	153.6	193.7	23.4	0.003	NA	NA	pg18rc1_o2nofp.cx10d_c8r32
l.i1
l.i1: continue load after secondary indexes created with 50 inserts per transaction. Graphs for performance per 1-second interval are here.
Average throughput:
Insert response time histogram: each cell has the percentage of responses that take <= the time in the header and max is the max response time in seconds. For the max column values in the top 25% of the range have a red background and in the bottom 25% of the range have a green background. The red background is not used when the min value is within 80% of the max value.
| dbms | 256us | 1ms | 4ms | 16ms | 64ms | 256ms | 1s | 4s | 16s | gt | max |
|---|---|---|---|---|---|---|---|---|---|---|---|
| pg176_o2nofp.cx10a_c8r32 | 98.716 | 1.113 | 0.170 | 0.001 | 0.381 | ||||||
| pg18rc1_o2nofp.cx10b_c8r32 | nonzero | 98.771 | 1.076 | 0.152 | 0.193 | ||||||
| pg18rc1_o2nofp.cx10c_c8r32 | 98.922 | 0.917 | 0.161 | 0.182 | |||||||
| pg18rc1_o2nofp.cx10d_c8r32 | 97.037 | 2.504 | 0.458 | 0.001 | 0.332 |
Delete response time histogram: each cell has the percentage of responses that take <= the time in the header and max is the max response time in seconds. For the max column values in the top 25% of the range have a red background and in the bottom 25% of the range have a green background. The red background is not used when the min value is within 80% of the max value.
| dbms | 256us | 1ms | 4ms | 16ms | 64ms | 256ms | 1s | 4s | 16s | gt | max |
|---|---|---|---|---|---|---|---|---|---|---|---|
| pg176_o2nofp.cx10a_c8r32 | 0.188 | 4.271 | 10.465 | 77.810 | 7.266 | 0.126 | |||||
| pg18rc1_o2nofp.cx10b_c8r32 | 0.206 | 4.336 | 11.250 | 67.585 | 16.623 | 0.090 | |||||
| pg18rc1_o2nofp.cx10c_c8r32 | 0.264 | 4.240 | 11.071 | 47.420 | 37.005 | 0.114 | |||||
| pg18rc1_o2nofp.cx10d_c8r32 | 0.294 | 4.315 | 11.053 | 44.321 | 40.017 | 0.118 |
Performance metrics for the DBMS listed above. Some are normalized by throughput, others are not. Legend for results is here.
ips	qps	rps	rmbps	wps	wmbps	rpq	rkbpq	wpi	wkbpi	csps	cpups	cspq	cpupq	dbgb1	dbgb2	rss	maxop	p50	p99	tag
1301	0	1530	12.3	2008.0	31.1	1.176	9.682	1.544	24.460	3632	13.6	2.793	837	156.2	196.3	22.6	0.381	1150	400	pg176_o2nofp.cx10a_c8r32
1177	0	1382	10.9	1794.7	27.6	1.173	9.486	1.524	23.977	3296	13.5	2.799	917	156.2	196.3	23.4	0.193	950	600	pg18rc1_o2nofp.cx10b_c8r32
987	0	1158	9.1	1517.8	23.6	1.173	9.486	1.538	24.511	2791	13.5	2.829	1095	156.2	194.5	23.3	0.182	650	450	pg18rc1_o2nofp.cx10c_c8r32
917	0	1076	8.5	1412.5	22.0	1.173	9.486	1.540	24.603	2603	13.2	2.839	1152	156.2	193.0	21.7	0.332	650	450	pg18rc1_o2nofp.cx10d_c8r32
l.i2
l.i2: continue load after secondary indexes created with 5 inserts per transaction. Graphs for performance per 1-second interval are here.
Average throughput:
Insert response time histogram: each cell has the percentage of responses that take <= the time in the header and max is the max response time in seconds. For the max column values in the top 25% of the range have a red background and in the bottom 25% of the range have a green background. The red background is not used when the min value is within 80% of the max value.
| dbms | 256us | 1ms | 4ms | 16ms | 64ms | 256ms | 1s | 4s | 16s | gt | max |
|---|---|---|---|---|---|---|---|---|---|---|---|
| pg176_o2nofp.cx10a_c8r32 | 2.488 | 97.272 | 0.238 | 0.002 | nonzero | 0.088 | |||||
| pg18rc1_o2nofp.cx10b_c8r32 | 0.008 | 19.993 | 76.153 | 3.188 | 0.653 | 0.002 | 0.003 | nonzero | 2.075 | ||
| pg18rc1_o2nofp.cx10c_c8r32 | 6.974 | 92.887 | 0.139 | 0.001 | 0.018 | ||||||
| pg18rc1_o2nofp.cx10d_c8r32 | 6.377 | 93.599 | 0.024 | nonzero | 0.022 |
Delete response time histogram: each cell has the percentage of responses that take <= the time in the header and max is the max response time in seconds. For the max column values in the top 25% of the range have a red background and in the bottom 25% of the range have a green background. The red background is not used when the min value is within 80% of the max value.
| dbms | 256us | 1ms | 4ms | 16ms | 64ms | 256ms | 1s | 4s | 16s | gt | max |
|---|---|---|---|---|---|---|---|---|---|---|---|
| pg176_o2nofp.cx10a_c8r32 | 100.000 | nonzero | 0.256 | ||||||||
| pg18rc1_o2nofp.cx10b_c8r32 | 0.534 | 8.482 | 15.430 | 0.032 | 75.101 | 0.420 | 0.002 | nonzero | 2.075 | ||
| pg18rc1_o2nofp.cx10c_c8r32 | 75.748 | 24.252 | 0.204 | ||||||||
| pg18rc1_o2nofp.cx10d_c8r32 | 66.990 | 33.010 | nonzero | 0.257 |
Performance metrics for the DBMS listed above. Some are normalized by throughput, others are not. Legend for results is here.
ips	qps	rps	rmbps	wps	wmbps	rpq	rkbpq	wpi	wkbpi	csps	cpups	cspq	cpupq	dbgb1	dbgb2	rss	maxop	p50	p99	tag
39	0	43	0.3	97.2	1.3	1.095	8.886	2.493	33.906	354	12.4	9.082	25436	156.9	176.9	23.4	0.088	40	35	pg176_o2nofp.cx10a_c8r32
111	0	178	3.2	335.0	6.6	1.597	29.900	3.013	60.836	815	12.5	7.326	8993	156.8	196.9	23.4	2.075	85	75	pg18rc1_o2nofp.cx10b_c8r32
82	0	90	0.7	185.6	2.7	1.092	8.839	2.250	33.044	603	12.4	7.313	12024	156.9	176.9	23.4	0.018	80	75	pg18rc1_o2nofp.cx10c_c8r32
76	0	82	0.7	171.9	2.4	1.091	8.829	2.274	33.172	563	12.4	7.453	13122	156.9	176.9	23.4	0.022	80	45	pg18rc1_o2nofp.cx10d_c8r32
qr100.L1
qr100.L1: range queries with 100 insert/s per client. Graphs for performance per 1-second interval are here.
Average throughput:
Query response time histogram: each cell has the percentage of responses that take <= the time in the header and max is the max response time in seconds. For max values in the top 25% of the range have a red background and in the bottom 25% of the range have a green background. The red background is not used when the min value is within 80% of the max value.
| dbms | 256us | 1ms | 4ms | 16ms | 64ms | 256ms | 1s | 4s | 16s | gt | max |
|---|---|---|---|---|---|---|---|---|---|---|---|
| pg176_o2nofp.cx10a_c8r32 | 99.991 | 0.009 | nonzero | nonzero | 0.024 | ||||||
| pg18rc1_o2nofp.cx10b_c8r32 | 99.991 | 0.009 | nonzero | nonzero | 0.046 | ||||||
| pg18rc1_o2nofp.cx10c_c8r32 | 99.991 | 0.009 | nonzero | nonzero | nonzero | 0.053 | |||||
| pg18rc1_o2nofp.cx10d_c8r32 | 99.991 | 0.009 | nonzero | nonzero | nonzero | 0.025 |
Insert response time histogram: each cell has the percentage of responses that take <= the time in the header and max is the max response time in seconds. For max values in the top 25% of the range have a red background and in the bottom 25% of the range have a green background. The red background is not used when the min value is within 80% of the max value.
| dbms | 256us | 1ms | 4ms | 16ms | 64ms | 256ms | 1s | 4s | 16s | gt | max |
|---|---|---|---|---|---|---|---|---|---|---|---|
| pg176_o2nofp.cx10a_c8r32 | 99.875 | 0.125 | 0.039 | ||||||||
| pg18rc1_o2nofp.cx10b_c8r32 | 99.868 | 0.125 | 0.007 | 0.071 | |||||||
| pg18rc1_o2nofp.cx10c_c8r32 | 99.896 | 0.097 | 0.007 | 0.068 | |||||||
| pg18rc1_o2nofp.cx10d_c8r32 | 99.903 | 0.097 | 0.057 |
Delete response time histogram: each cell has the percentage of responses that take <= the time in the header and max is the max response time in seconds. For max values in the top 25% of the range have a red background and in the bottom 25% of the range have a green background. The red background is not used when the min value is within 80% of the max value.
| dbms | 256us | 1ms | 4ms | 16ms | 64ms | 256ms | 1s | 4s | 16s | gt | max |
|---|---|---|---|---|---|---|---|---|---|---|---|
| pg176_o2nofp.cx10a_c8r32 | 0.007 | 15.792 | 69.632 | 14.569 | 0.006 | ||||||
| pg18rc1_o2nofp.cx10b_c8r32 | 15.757 | 70.479 | 13.764 | 0.006 | |||||||
| pg18rc1_o2nofp.cx10c_c8r32 | 15.701 | 69.757 | 14.542 | 0.007 | |||||||
| pg18rc1_o2nofp.cx10d_c8r32 | 16.090 | 71.271 | 12.639 | 0.006 |
Performance metrics for the DBMS listed above. Some are normalized by throughput, others are not. Legend for results is here.
ips	qps	rps	rmbps	wps	wmbps	rpq	rkbpq	wpi	wkbpi	csps	cpups	cspq	cpupq	dbgb1	dbgb2	rss	maxop	p50	p99	tag
100	24810	115	0.9	155.3	2.6	0.005	0.038	1.554	26.952	95089	8.6	3.833	28	156.9	189.7	23.4	0.024	24843	23788	pg176_o2nofp.cx10a_c8r32
100	24495	110	0.9	156.8	2.6	0.005	0.038	1.570	26.986	93878	8.6	3.833	28	156.8	190.3	23.4	0.046	24476	23708	pg18rc1_o2nofp.cx10b_c8r32
100	24736	111	0.9	155.6	2.6	0.004	0.037	1.558	26.998	94799	8.8	3.832	28	157.0	189.8	23.4	0.053	24720	23700	pg18rc1_o2nofp.cx10c_c8r32
100	24761	110	0.9	156.3	2.6	0.004	0.036	1.564	27.033	94894	8.6	3.832	28	157.0	190.1	23.4	0.025	24794	23868	pg18rc1_o2nofp.cx10d_c8r32
qp100.L2
qp100.L2: point queries with 100 insert/s per client. Graphs for performance per 1-second interval are here.
Average throughput:
Query response time histogram: each cell has the percentage of responses that take <= the time in the header and max is the max response time in seconds. For max values in the top 25% of the range have a red background and in the bottom 25% of the range have a green background. The red background is not used when the min value is within 80% of the max value.
| dbms | 256us | 1ms | 4ms | 16ms | 64ms | 256ms | 1s | 4s | 16s | gt | max |
|---|---|---|---|---|---|---|---|---|---|---|---|
| pg176_o2nofp.cx10a_c8r32 | nonzero | 3.587 | 96.390 | 0.023 | nonzero | 0.040 | |||||
| pg18rc1_o2nofp.cx10b_c8r32 | nonzero | 3.081 | 96.894 | 0.024 | nonzero | 0.034 | |||||
| pg18rc1_o2nofp.cx10c_c8r32 | 3.499 | 96.475 | 0.026 | nonzero | 0.049 | ||||||
| pg18rc1_o2nofp.cx10d_c8r32 | 3.424 | 96.544 | 0.030 | 0.002 | 0.043 |
Insert response time histogram: each cell has the percentage of responses that take <= the time in the header and max is the max response time in seconds. For max values in the top 25% of the range have a red background and in the bottom 25% of the range have a green background. The red background is not used when the min value is within 80% of the max value.
| dbms | 256us | 1ms | 4ms | 16ms | 64ms | 256ms | 1s | 4s | 16s | gt | max |
|---|---|---|---|---|---|---|---|---|---|---|---|
| pg176_o2nofp.cx10a_c8r32 | 99.889 | 0.111 | 0.048 | ||||||||
| pg18rc1_o2nofp.cx10b_c8r32 | 99.861 | 0.139 | 0.042 | ||||||||
| pg18rc1_o2nofp.cx10c_c8r32 | 99.840 | 0.160 | 0.034 | ||||||||
| pg18rc1_o2nofp.cx10d_c8r32 | 99.840 | 0.132 | 0.028 | 0.077 |
Delete response time histogram: each cell has the percentage of responses that take <= the time in the header and max is the max response time in seconds. For max values in the top 25% of the range have a red background and in the bottom 25% of the range have a green background. The red background is not used when the min value is within 80% of the max value.
| dbms | 256us | 1ms | 4ms | 16ms | 64ms | 256ms | 1s | 4s | 16s | gt | max |
|---|---|---|---|---|---|---|---|---|---|---|---|
| pg176_o2nofp.cx10a_c8r32 | 10.667 | 89.326 | 0.007 | 0.021 | |||||||
| pg18rc1_o2nofp.cx10b_c8r32 | 11.021 | 88.972 | 0.007 | 0.021 | |||||||
| pg18rc1_o2nofp.cx10c_c8r32 | 11.062 | 88.931 | 0.007 | 0.022 | |||||||
| pg18rc1_o2nofp.cx10d_c8r32 | 10.903 | 89.090 | 0.007 | 0.021 |
Performance metrics for the DBMS listed above. Some are normalized by throughput, others are not. Legend for results is here.
ips	qps	rps	rmbps	wps	wmbps	rpq	rkbpq	wpi	wkbpi	csps	cpups	cspq	cpupq	dbgb1	dbgb2	rss	maxop	p50	p99	tag
100	666	8278	64.8	272.1	3.5	12.433	99.599	2.723	35.667	18533	2.8	27.836	336	157.0	179.6	23.4	0.040	672	464	pg176_o2nofp.cx10a_c8r32
100	657	8181	64.0	270.1	3.5	12.446	99.703	2.704	35.461	18320	3.1	27.871	377	156.8	180.0	23.3	0.034	656	448	pg18rc1_o2nofp.cx10b_c8r32
100	664	8249	64.5	272.0	3.5	12.414	99.402	2.723	35.661	18474	3.1	27.801	373	157.0	179.7	23.4	0.049	672	464	pg18rc1_o2nofp.cx10c_c8r32
100	662	8215	64.7	271.1	3.5	12.409	100.154	2.714	35.594	18386	3.0	27.774	363	157.0	179.9	23.4	0.043	672	464	pg18rc1_o2nofp.cx10d_c8r32
qr500.L3
qr500.L3: range queries with 500 insert/s per client. Graphs for performance per 1-second interval are here.
Average throughput:
Query response time histogram: each cell has the percentage of responses that take <= the time in the header and max is the max response time in seconds. For max values in the top 25% of the range have a red background and in the bottom 25% of the range have a green background. The red background is not used when the min value is within 80% of the max value.
| dbms | 256us | 1ms | 4ms | 16ms | 64ms | 256ms | 1s | 4s | 16s | gt | max |
|---|---|---|---|---|---|---|---|---|---|---|---|
| pg176_o2nofp.cx10a_c8r32 | 99.971 | 0.029 | nonzero | nonzero | nonzero | nonzero | 0.074 | ||||
| pg18rc1_o2nofp.cx10b_c8r32 | 99.970 | 0.029 | nonzero | nonzero | nonzero | nonzero | 0.089 | ||||
| pg18rc1_o2nofp.cx10c_c8r32 | 99.976 | 0.023 | nonzero | nonzero | nonzero | nonzero | 0.083 | ||||
| pg18rc1_o2nofp.cx10d_c8r32 | 99.971 | 0.028 | nonzero | nonzero | nonzero | nonzero | 0.092 |
Insert response time histogram: each cell has the percentage of responses that take <= the time in the header and max is the max response time in seconds. For max values in the top 25% of the range have a red background and in the bottom 25% of the range have a green background. The red background is not used when the min value is within 80% of the max value.
| dbms | 256us | 1ms | 4ms | 16ms | 64ms | 256ms | 1s | 4s | 16s | gt | max |
|---|---|---|---|---|---|---|---|---|---|---|---|
| pg176_o2nofp.cx10a_c8r32 | 0.004 | 97.797 | 1.896 | 0.303 | 0.241 | ||||||
| pg18rc1_o2nofp.cx10b_c8r32 | 0.007 | 99.753 | 0.240 | 0.036 | |||||||
| pg18rc1_o2nofp.cx10c_c8r32 | 0.029 | 99.765 | 0.206 | 0.027 | |||||||
| pg18rc1_o2nofp.cx10d_c8r32 | 0.033 | 99.715 | 0.229 | 0.022 | 0.096 |
Delete response time histogram: each cell has the percentage of responses that take <= the time in the header and max is the max response time in seconds. For max values in the top 25% of the range have a red background and in the bottom 25% of the range have a green background. The red background is not used when the min value is within 80% of the max value.
| dbms | 256us | 1ms | 4ms | 16ms | 64ms | 256ms | 1s | 4s | 16s | gt | max |
|---|---|---|---|---|---|---|---|---|---|---|---|
| pg176_o2nofp.cx10a_c8r32 | 24.649 | 75.351 | 0.048 | ||||||||
| pg18rc1_o2nofp.cx10b_c8r32 | 28.836 | 71.164 | 0.040 | ||||||||
| pg18rc1_o2nofp.cx10c_c8r32 | 28.207 | 71.793 | 0.042 | ||||||||
| pg18rc1_o2nofp.cx10d_c8r32 | 28.354 | 71.646 | 0.040 |
Performance metrics for the DBMS listed above. Some are normalized by throughput, others are not. Legend for results is here.
ips	qps	rps	rmbps	wps	wmbps	rpq	rkbpq	wpi	wkbpi	csps	cpups	cspq	cpupq	dbgb1	dbgb2	rss	maxop	p50	p99	tag
500	19280	654	5.3	655.7	12.0	0.034	0.279	1.312	24.592	75390	12.9	3.910	54	157.3	179.1	23.4	0.074	19209	16318	pg176_o2nofp.cx10a_c8r32
500	19129	646	5.2	671.9	12.1	0.034	0.279	1.345	24.838	74561	12.6	3.898	53	156.8	178.6	23.3	0.089	19085	16302	pg18rc1_o2nofp.cx10b_c8r32
500	19328	652	5.2	659.5	12.0	0.034	0.278	1.320	24.640	75330	12.5	3.897	52	157.3	179.1	23.4	0.083	19214	16509	pg18rc1_o2nofp.cx10c_c8r32
500	19393	653	5.3	667.5	12.1	0.034	0.282	1.336	24.861	75578	12.5	3.897	52	157.3	179.1	23.4	0.092	19355	16366	pg18rc1_o2nofp.cx10d_c8r32
qp500.L4
qp500.L4: point queries with 500 insert/s per client. Graphs for performance per 1-second interval are here.
Average throughput:
Query response time histogram: each cell has the percentage of responses that take <= the time in the header and max is the max response time in seconds. For max values in the top 25% of the range have a red background and in the bottom 25% of the range have a green background. The red background is not used when the min value is within 80% of the max value.
| dbms | 256us | 1ms | 4ms | 16ms | 64ms | 256ms | 1s | 4s | 16s | gt | max |
|---|---|---|---|---|---|---|---|---|---|---|---|
| pg176_o2nofp.cx10a_c8r32 | 1.303 | 97.798 | 0.850 | 0.048 | nonzero | nonzero | 0.266 | ||||
| pg18rc1_o2nofp.cx10b_c8r32 | 1.284 | 98.382 | 0.326 | 0.008 | 0.036 | ||||||
| pg18rc1_o2nofp.cx10c_c8r32 | 1.252 | 98.474 | 0.269 | 0.005 | nonzero | 0.068 | |||||
| pg18rc1_o2nofp.cx10d_c8r32 | nonzero | 1.334 | 97.240 | 1.329 | 0.096 | nonzero | 0.076 |
Insert response time histogram: each cell has the percentage of responses that take <= the time in the header and max is the max response time in seconds. For max values in the top 25% of the range have a red background and in the bottom 25% of the range have a green background. The red background is not used when the min value is within 80% of the max value.
| dbms | 256us | 1ms | 4ms | 16ms | 64ms | 256ms | 1s | 4s | 16s | gt | max |
|---|---|---|---|---|---|---|---|---|---|---|---|
| pg176_o2nofp.cx10a_c8r32 | 92.869 | 5.956 | 1.171 | 0.004 | 0.280 | ||||||
| pg18rc1_o2nofp.cx10b_c8r32 | 98.507 | 1.337 | 0.156 | 0.180 | |||||||
| pg18rc1_o2nofp.cx10c_c8r32 | 97.562 | 2.292 | 0.146 | 0.170 | |||||||
| pg18rc1_o2nofp.cx10d_c8r32 | 90.254 | 6.933 | 2.812 | 0.179 |
Delete response time histogram: each cell has the percentage of responses that take <= the time in the header and max is the max response time in seconds. For max values in the top 25% of the range have a red background and in the bottom 25% of the range have a green background. The red background is not used when the min value is within 80% of the max value.
| dbms | 256us | 1ms | 4ms | 16ms | 64ms | 256ms | 1s | 4s | 16s | gt | max |
|---|---|---|---|---|---|---|---|---|---|---|---|
| pg176_o2nofp.cx10a_c8r32 | 99.867 | 0.133 | 0.097 | ||||||||
| pg18rc1_o2nofp.cx10b_c8r32 | 99.996 | 0.004 | 0.098 | ||||||||
| pg18rc1_o2nofp.cx10c_c8r32 | 99.999 | 0.001 | 0.100 | ||||||||
| pg18rc1_o2nofp.cx10d_c8r32 | 99.999 | 0.001 | 0.098 |
Performance metrics for the DBMS listed above. Some are normalized by throughput, others are not. Legend for results is here.
ips	qps	rps	rmbps	wps	wmbps	rpq	rkbpq	wpi	wkbpi	csps	cpups	cspq	cpupq	dbgb1	dbgb2	rss	maxop	p50	p99	tag
500	569	8226	64.4	1247.5	16.1	14.453	115.822	2.496	33.037	18234	9.2	32.035	1293	157.7	180.2	19.8	0.266	592	112	pg176_o2nofp.cx10a_c8r32
500	584	8368	65.5	1228.1	15.9	14.335	114.982	2.457	32.655	18539	9.2	31.762	1261	156.8	179.3	23.3	0.036	592	400	pg18rc1_o2nofp.cx10b_c8r32
500	582	8338	65.3	1244.6	16.1	14.314	114.877	2.490	33.003	18626	8.8	31.976	1209	157.7	180.2	23.4	0.068	592	320	pg18rc1_o2nofp.cx10c_c8r32
500	557	8010	62.9	1231.2	16.0	14.372	115.596	2.463	32.776	17746	8.3	31.842	1191	157.7	180.1	23.4	0.076	592	96	pg18rc1_o2nofp.cx10d_c8r32
qr1000.L5
qr1000.L5: range queries with 1000 insert/s per client. Graphs for performance per 1-second interval are here.
Average throughput:
Query response time histogram: each cell has the percentage of responses that take <= the time in the header and max is the max response time in seconds. For max values in the top 25% of the range have a red background and in the bottom 25% of the range have a green background. The red background is not used when the min value is within 80% of the max value.
| dbms | 256us | 1ms | 4ms | 16ms | 64ms | 256ms | 1s | 4s | 16s | gt | max |
|---|---|---|---|---|---|---|---|---|---|---|---|
| pg176_o2nofp.cx10a_c8r32 | 99.711 | 0.287 | 0.002 | 0.001 | nonzero | nonzero | nonzero | 0.515 | |||
| pg18rc1_o2nofp.cx10b_c8r32 | 99.736 | 0.262 | 0.002 | 0.001 | nonzero | nonzero | nonzero | 0.389 | |||
| pg18rc1_o2nofp.cx10c_c8r32 | 99.769 | 0.228 | 0.002 | 0.001 | nonzero | nonzero | nonzero | 0.374 | |||
| pg18rc1_o2nofp.cx10d_c8r32 | 99.719 | 0.278 | 0.002 | 0.001 | nonzero | nonzero | nonzero | 0.497 |
Insert response time histogram: each cell has the percentage of responses that take <= the time in the header and max is the max response time in seconds. For max values in the top 25% of the range have a red background and in the bottom 25% of the range have a green background. The red background is not used when the min value is within 80% of the max value.
| dbms | 256us | 1ms | 4ms | 16ms | 64ms | 256ms | 1s | 4s | 16s | gt | max |
|---|---|---|---|---|---|---|---|---|---|---|---|
| pg176_o2nofp.cx10a_c8r32 | 98.941 | 1.047 | 0.012 | 0.101 | |||||||
| pg18rc1_o2nofp.cx10b_c8r32 | 0.007 | 98.883 | 0.919 | 0.191 | 0.187 | ||||||
| pg18rc1_o2nofp.cx10c_c8r32 | 0.013 | 98.974 | 0.831 | 0.181 | 0.158 | ||||||
| pg18rc1_o2nofp.cx10d_c8r32 | 98.935 | 1.056 | 0.010 | 0.094 |
Delete response time histogram: each cell has the percentage of responses that take <= the time in the header and max is the max response time in seconds. For max values in the top 25% of the range have a red background and in the bottom 25% of the range have a green background. The red background is not used when the min value is within 80% of the max value.
| dbms | 256us | 1ms | 4ms | 16ms | 64ms | 256ms | 1s | 4s | 16s | gt | max |
|---|---|---|---|---|---|---|---|---|---|---|---|
| pg176_o2nofp.cx10a_c8r32 | 99.997 | 0.003 | 0.121 | ||||||||
| pg18rc1_o2nofp.cx10b_c8r32 | 99.999 | 0.001 | 0.152 | ||||||||
| pg18rc1_o2nofp.cx10c_c8r32 | 99.999 | 0.001 | 0.129 | ||||||||
| pg18rc1_o2nofp.cx10d_c8r32 | 99.999 | 0.001 | 0.122 |
Performance metrics for the DBMS listed above. Some are normalized by throughput, others are not. Legend for results is here.
ips	qps	rps	rmbps	wps	wmbps	rpq	rkbpq	wpi	wkbpi	csps	cpups	cspq	cpupq	dbgb1	dbgb2	rss	maxop	p50	p99	tag
972	10884	1170	9.4	1442.8	25.2	0.107	0.882	1.485	26.607	44345	23.0	4.074	169	158.3	197.0	23.0	0.515	10764	8990	pg176_o2nofp.cx10a_c8r32
986	10979	1186	9.5	1462.4	25.3	0.108	0.889	1.483	26.284	44742	22.7	4.075	165	157.2	195.9	23.3	0.389	10910	9038	pg18rc1_o2nofp.cx10b_c8r32
988	11026	1196	9.6	1466.4	25.6	0.108	0.890	1.484	26.513	44939	22.6	4.076	164	158.3	197.0	23.2	0.374	10927	9102	pg18rc1_o2nofp.cx10c_c8r32
987	10960	1198	9.7	1467.3	25.5	0.109	0.903	1.486	26.461	44701	22.6	4.079	165	158.3	197.0	23.4	0.497	10878	9006	pg18rc1_o2nofp.cx10d_c8r32
qp1000.L6
qp1000.L6: point queries with 1000 insert/s per client. Graphs for performance per 1-second interval are here.
Average throughput:
Query response time histogram: each cell has the percentage of responses that take <= the time in the header and max is the max response time in seconds. For max values in the top 25% of the range have a red background and in the bottom 25% of the range have a green background. The red background is not used when the min value is within 80% of the max value.
| dbms | 256us | 1ms | 4ms | 16ms | 64ms | 256ms | 1s | 4s | 16s | gt | max |
|---|---|---|---|---|---|---|---|---|---|---|---|
| pg176_o2nofp.cx10a_c8r32 | 0.665 | 98.102 | 1.228 | 0.005 | nonzero | 0.079 | |||||
| pg18rc1_o2nofp.cx10b_c8r32 | 0.552 | 98.105 | 1.290 | 0.054 | nonzero | 0.072 | |||||
| pg18rc1_o2nofp.cx10c_c8r32 | 0.546 | 98.035 | 1.362 | 0.057 | 0.054 | ||||||
| pg18rc1_o2nofp.cx10d_c8r32 | 0.607 | 98.032 | 1.357 | 0.004 | 0.046 |
Insert response time histogram: each cell has the percentage of responses that take <= the time in the header and max is the max response time in seconds. For max values in the top 25% of the range have a red background and in the bottom 25% of the range have a green background. The red background is not used when the min value is within 80% of the max value.
| dbms | 256us | 1ms | 4ms | 16ms | 64ms | 256ms | 1s | 4s | 16s | gt | max |
|---|---|---|---|---|---|---|---|---|---|---|---|
| pg176_o2nofp.cx10a_c8r32 | 94.128 | 5.664 | 0.208 | 0.177 | |||||||
| pg18rc1_o2nofp.cx10b_c8r32 | 94.600 | 4.577 | 0.819 | 0.003 | 0.351 | ||||||
| pg18rc1_o2nofp.cx10c_c8r32 | 93.392 | 5.620 | 0.988 | 0.182 | |||||||
| pg18rc1_o2nofp.cx10d_c8r32 | 92.869 | 6.962 | 0.169 | 0.171 |
Delete response time histogram: each cell has the percentage of responses that take <= the time in the header and max is the max response time in seconds. For max values in the top 25% of the range have a red background and in the bottom 25% of the range have a green background. The red background is not used when the min value is within 80% of the max value.
| dbms | 256us | 1ms | 4ms | 16ms | 64ms | 256ms | 1s | 4s | 16s | gt | max |
|---|---|---|---|---|---|---|---|---|---|---|---|
| pg176_o2nofp.cx10a_c8r32 | 17.117 | 82.883 | 0.205 | ||||||||
| pg18rc1_o2nofp.cx10b_c8r32 | 27.810 | 72.190 | 0.207 | ||||||||
| pg18rc1_o2nofp.cx10c_c8r32 | 31.995 | 68.005 | 0.214 | ||||||||
| pg18rc1_o2nofp.cx10d_c8r32 | 31.677 | 68.323 | 0.202 |
Performance metrics for the DBMS listed above. Some are normalized by throughput, others are not. Legend for results is here.
ips	qps	rps	rmbps	wps	wmbps	rpq	rkbpq	wpi	wkbpi	csps	cpups	cspq	cpupq	dbgb1	dbgb2	rss	maxop	p50	p99	tag
684	533	8251	64.6	1643.0	21.4	15.475	124.022	2.402	31.990	18258	15.7	34.242	2356	159.2	197.8	23.0	0.079	544	352	pg176_o2nofp.cx10a_c8r32
724	522	8175	64.0	1726.4	22.3	15.667	125.597	2.386	31.615	18095	15.9	34.678	2438	158.1	196.7	23.3	0.072	528	112	pg18rc1_o2nofp.cx10b_c8r32
723	522	8201	64.2	1721.6	22.4	15.726	126.048	2.382	31.684	18151	15.9	34.806	2439	159.2	197.8	23.2	0.054	528	112	pg18rc1_o2nofp.cx10c_c8r32
723	528	8207	64.4	1724.0	22.3	15.541	124.943	2.385	31.657	18171	16.1	34.408	2439	159.2	197.8	23.4	0.046	528	352	pg18rc1_o2nofp.cx10d_c8r32
l.i0
l.i0: load without secondary indexes
Performance metrics for all DBMS, not just the ones listed above. Some are normalized by throughput, others are not. Legend for results is here.
ips	qps	rps	rmbps	wps	wmbps	rpq	rkbpq	wpi	wkbpi	csps	cpups	cspq	cpupq	dbgb1	dbgb2	rss	maxop	p50	p99	tag
214420	0	37	0.3	798.4	88.3	0.000	0.001	0.004	0.422	21352	20.6	0.100	8	76.5	116.6	1.2	0.040	215749	207866	pg176_o2nofp.cx10a_c8r32
207846	0	35	0.3	778.9	85.5	0.000	0.001	0.004	0.421	20698	20.3	0.100	8	76.5	116.6	1.0	0.040	209168	201266	pg18rc1_o2nofp.cx10b_c8r32
210139	0	36	0.3	786.7	86.3	0.000	0.001	0.004	0.421	21008	20.5	0.100	8	76.5	116.6	18.9	0.042	211365	203763	pg18rc1_o2nofp.cx10c_c8r32
210250	0	36	0.3	785.2	86.4	0.000	0.001	0.004	0.421	21058	20.4	0.100	8	76.5	116.6	18.9	0.044	211576	203268	pg18rc1_o2nofp.cx10d_c8r32
l.x
l.x: create secondary indexes
Performance metrics for all DBMS, not just the ones listed above. Some are normalized by throughput, others are not. Legend for results is here.
ips	qps	rps	rmbps	wps	wmbps	rpq	rkbpq	wpi	wkbpi	csps	cpups	cspq	cpupq	dbgb1	dbgb2	rss	maxop	p50	p99	tag
397417	0	1336	146.0	1220.9	148.5	0.003	0.376	0.003	0.383	1164	12.5	0.003	3	153.6	193.7	23.4	0.002	NA	NA	pg176_o2nofp.cx10a_c8r32
401405	0	1285	144.3	1224.4	149.9	0.003	0.368	0.003	0.382	1082	12.5	0.003	2	153.6	193.7	23.4	0.003	NA	NA	pg18rc1_o2nofp.cx10b_c8r32
419948	0	1210	144.3	1280.0	156.6	0.003	0.352	0.003	0.382	2031	13.2	0.005	3	153.6	193.7	23.4	0.003	NA	NA	pg18rc1_o2nofp.cx10c_c8r32
404449	0	1211	141.4	1236.1	151.1	0.003	0.358	0.003	0.383	1715	13.0	0.004	3	153.6	193.7	23.4	0.003	NA	NA	pg18rc1_o2nofp.cx10d_c8r32
l.i1
l.i1: continue load after secondary indexes created with 50 inserts per transaction
Performance metrics for all DBMS, not just the ones listed above. Some are normalized by throughput, others are not. Legend for results is here.
ips	qps	rps	rmbps	wps	wmbps	rpq	rkbpq	wpi	wkbpi	csps	cpups	cspq	cpupq	dbgb1	dbgb2	rss	maxop	p50	p99	tag
1301	0	1530	12.3	2008.0	31.1	1.176	9.682	1.544	24.460	3632	13.6	2.793	837	156.2	196.3	22.6	0.381	1150	400	pg176_o2nofp.cx10a_c8r32
1177	0	1382	10.9	1794.7	27.6	1.173	9.486	1.524	23.977	3296	13.5	2.799	917	156.2	196.3	23.4	0.193	950	600	pg18rc1_o2nofp.cx10b_c8r32
987	0	1158	9.1	1517.8	23.6	1.173	9.486	1.538	24.511	2791	13.5	2.829	1095	156.2	194.5	23.3	0.182	650	450	pg18rc1_o2nofp.cx10c_c8r32
917	0	1076	8.5	1412.5	22.0	1.173	9.486	1.540	24.603	2603	13.2	2.839	1152	156.2	193.0	21.7	0.332	650	450	pg18rc1_o2nofp.cx10d_c8r32
l.i2
l.i2: continue load after secondary indexes created with 5 inserts per transaction
Performance metrics for all DBMS, not just the ones listed above. Some are normalized by throughput, others are not. Legend for results is here.
ips	qps	rps	rmbps	wps	wmbps	rpq	rkbpq	wpi	wkbpi	csps	cpups	cspq	cpupq	dbgb1	dbgb2	rss	maxop	p50	p99	tag
39	0	43	0.3	97.2	1.3	1.095	8.886	2.493	33.906	354	12.4	9.082	25436	156.9	176.9	23.4	0.088	40	35	pg176_o2nofp.cx10a_c8r32
111	0	178	3.2	335.0	6.6	1.597	29.900	3.013	60.836	815	12.5	7.326	8993	156.8	196.9	23.4	2.075	85	75	pg18rc1_o2nofp.cx10b_c8r32
82	0	90	0.7	185.6	2.7	1.092	8.839	2.250	33.044	603	12.4	7.313	12024	156.9	176.9	23.4	0.018	80	75	pg18rc1_o2nofp.cx10c_c8r32
76	0	82	0.7	171.9	2.4	1.091	8.829	2.274	33.172	563	12.4	7.453	13122	156.9	176.9	23.4	0.022	80	45	pg18rc1_o2nofp.cx10d_c8r32
qr100.L1
qr100.L1: range queries with 100 insert/s per client
Performance metrics for all DBMS, not just the ones listed above. Some are normalized by throughput, others are not. Legend for results is here.
ips	qps	rps	rmbps	wps	wmbps	rpq	rkbpq	wpi	wkbpi	csps	cpups	cspq	cpupq	dbgb1	dbgb2	rss	maxop	p50	p99	tag
100	24810	115	0.9	155.3	2.6	0.005	0.038	1.554	26.952	95089	8.6	3.833	28	156.9	189.7	23.4	0.024	24843	23788	pg176_o2nofp.cx10a_c8r32
100	24495	110	0.9	156.8	2.6	0.005	0.038	1.570	26.986	93878	8.6	3.833	28	156.8	190.3	23.4	0.046	24476	23708	pg18rc1_o2nofp.cx10b_c8r32
100	24736	111	0.9	155.6	2.6	0.004	0.037	1.558	26.998	94799	8.8	3.832	28	157.0	189.8	23.4	0.053	24720	23700	pg18rc1_o2nofp.cx10c_c8r32
100	24761	110	0.9	156.3	2.6	0.004	0.036	1.564	27.033	94894	8.6	3.832	28	157.0	190.1	23.4	0.025	24794	23868	pg18rc1_o2nofp.cx10d_c8r32
qp100.L2
qp100.L2: point queries with 100 insert/s per client
Performance metrics for all DBMS, not just the ones listed above. Some are normalized by throughput, others are not. Legend for results is here.
ips	qps	rps	rmbps	wps	wmbps	rpq	rkbpq	wpi	wkbpi	csps	cpups	cspq	cpupq	dbgb1	dbgb2	rss	maxop	p50	p99	tag
100	666	8278	64.8	272.1	3.5	12.433	99.599	2.723	35.667	18533	2.8	27.836	336	157.0	179.6	23.4	0.040	672	464	pg176_o2nofp.cx10a_c8r32
100	657	8181	64.0	270.1	3.5	12.446	99.703	2.704	35.461	18320	3.1	27.871	377	156.8	180.0	23.3	0.034	656	448	pg18rc1_o2nofp.cx10b_c8r32
100	664	8249	64.5	272.0	3.5	12.414	99.402	2.723	35.661	18474	3.1	27.801	373	157.0	179.7	23.4	0.049	672	464	pg18rc1_o2nofp.cx10c_c8r32
100	662	8215	64.7	271.1	3.5	12.409	100.154	2.714	35.594	18386	3.0	27.774	363	157.0	179.9	23.4	0.043	672	464	pg18rc1_o2nofp.cx10d_c8r32
qr500.L3
qr500.L3: range queries with 500 insert/s per client
Performance metrics for all DBMS, not just the ones listed above. Some are normalized by throughput, others are not. Legend for results is here.
ips	qps	rps	rmbps	wps	wmbps	rpq	rkbpq	wpi	wkbpi	csps	cpups	cspq	cpupq	dbgb1	dbgb2	rss	maxop	p50	p99	tag
500	19280	654	5.3	655.7	12.0	0.034	0.279	1.312	24.592	75390	12.9	3.910	54	157.3	179.1	23.4	0.074	19209	16318	pg176_o2nofp.cx10a_c8r32
500	19129	646	5.2	671.9	12.1	0.034	0.279	1.345	24.838	74561	12.6	3.898	53	156.8	178.6	23.3	0.089	19085	16302	pg18rc1_o2nofp.cx10b_c8r32
500	19328	652	5.2	659.5	12.0	0.034	0.278	1.320	24.640	75330	12.5	3.897	52	157.3	179.1	23.4	0.083	19214	16509	pg18rc1_o2nofp.cx10c_c8r32
500	19393	653	5.3	667.5	12.1	0.034	0.282	1.336	24.861	75578	12.5	3.897	52	157.3	179.1	23.4	0.092	19355	16366	pg18rc1_o2nofp.cx10d_c8r32
qp500.L4
qp500.L4: point queries with 500 insert/s per client
Performance metrics for all DBMS, not just the ones listed above. Some are normalized by throughput, others are not. Legend for results is here.
ips	qps	rps	rmbps	wps	wmbps	rpq	rkbpq	wpi	wkbpi	csps	cpups	cspq	cpupq	dbgb1	dbgb2	rss	maxop	p50	p99	tag
500	569	8226	64.4	1247.5	16.1	14.453	115.822	2.496	33.037	18234	9.2	32.035	1293	157.7	180.2	19.8	0.266	592	112	pg176_o2nofp.cx10a_c8r32
500	584	8368	65.5	1228.1	15.9	14.335	114.982	2.457	32.655	18539	9.2	31.762	1261	156.8	179.3	23.3	0.036	592	400	pg18rc1_o2nofp.cx10b_c8r32
500	582	8338	65.3	1244.6	16.1	14.314	114.877	2.490	33.003	18626	8.8	31.976	1209	157.7	180.2	23.4	0.068	592	320	pg18rc1_o2nofp.cx10c_c8r32
500	557	8010	62.9	1231.2	16.0	14.372	115.596	2.463	32.776	17746	8.3	31.842	1191	157.7	180.1	23.4	0.076	592	96	pg18rc1_o2nofp.cx10d_c8r32
qr1000.L5
qr1000.L5: range queries with 1000 insert/s per client
Performance metrics for all DBMS, not just the ones listed above. Some are normalized by throughput, others are not. Legend for results is here.
ips	qps	rps	rmbps	wps	wmbps	rpq	rkbpq	wpi	wkbpi	csps	cpups	cspq	cpupq	dbgb1	dbgb2	rss	maxop	p50	p99	tag
972	10884	1170	9.4	1442.8	25.2	0.107	0.882	1.485	26.607	44345	23.0	4.074	169	158.3	197.0	23.0	0.515	10764	8990	pg176_o2nofp.cx10a_c8r32
986	10979	1186	9.5	1462.4	25.3	0.108	0.889	1.483	26.284	44742	22.7	4.075	165	157.2	195.9	23.3	0.389	10910	9038	pg18rc1_o2nofp.cx10b_c8r32
988	11026	1196	9.6	1466.4	25.6	0.108	0.890	1.484	26.513	44939	22.6	4.076	164	158.3	197.0	23.2	0.374	10927	9102	pg18rc1_o2nofp.cx10c_c8r32
987	10960	1198	9.7	1467.3	25.5	0.109	0.903	1.486	26.461	44701	22.6	4.079	165	158.3	197.0	23.4	0.497	10878	9006	pg18rc1_o2nofp.cx10d_c8r32
qp1000.L6
qp1000.L6: point queries with 1000 insert/s per client
Performance metrics for all DBMS, not just the ones listed above. Some are normalized by throughput, others are not. Legend for results is here.
ips	qps	rps	rmbps	wps	wmbps	rpq	rkbpq	wpi	wkbpi	csps	cpups	cspq	cpupq	dbgb1	dbgb2	rss	maxop	p50	p99	tag
684	533	8251	64.6	1643.0	21.4	15.475	124.022	2.402	31.990	18258	15.7	34.242	2356	159.2	197.8	23.0	0.079	544	352	pg176_o2nofp.cx10a_c8r32
724	522	8175	64.0	1726.4	22.3	15.667	125.597	2.386	31.615	18095	15.9	34.678	2438	158.1	196.7	23.3	0.072	528	112	pg18rc1_o2nofp.cx10b_c8r32
723	522	8201	64.2	1721.6	22.4	15.726	126.048	2.382	31.684	18151	15.9	34.806	2439	159.2	197.8	23.2	0.054	528	112	pg18rc1_o2nofp.cx10c_c8r32
723	528	8207	64.4	1724.0	22.3	15.541	124.943	2.385	31.657	18171	16.1	34.408	2439	159.2	197.8	23.4	0.046	528	352	pg18rc1_o2nofp.cx10d_c8r32
l.i0
- l.i0: load without secondary indexes
- Legend for results is here.
- Each entry lists the percentage of responses that fit in that bucket (slower than max time for previous bucket, faster than min time for next bucket).
Insert response time histogram
256us	1ms	4ms	16ms	64ms	256ms	1s	4s	16s	gt	max	tag
0.000	99.983	0.014	0.002	0.001	0.000	0.000	0.000	0.000	0.000	0.040	pg176_o2nofp.cx10a_c8r32
0.000	99.983	0.014	0.003	nonzero	0.000	0.000	0.000	0.000	0.000	0.040	pg18rc1_o2nofp.cx10b_c8r32
0.000	99.982	0.015	0.003	nonzero	0.000	0.000	0.000	0.000	0.000	0.042	pg18rc1_o2nofp.cx10c_c8r32
0.000	99.984	0.013	0.003	nonzero	0.000	0.000	0.000	0.000	0.000	0.044	pg18rc1_o2nofp.cx10d_c8r32
l.x
- l.x: create secondary indexes
- Legend for results is here.
- Each entry lists the percentage of responses that fit in that bucket (slower than max time for previous bucket, faster than min time for next bucket).
TODO - determine whether there is data for create index response time
l.i1
- l.i1: continue load after secondary indexes created with 50 inserts per transaction
- Legend for results is here.
- Each entry lists the percentage of responses that fit in that bucket (slower than max time for previous bucket, faster than min time for next bucket).
Insert response time histogram
256us	1ms	4ms	16ms	64ms	256ms	1s	4s	16s	gt	max	tag
0.000	0.000	0.000	98.716	1.113	0.170	0.001	0.000	0.000	0.000	0.381	pg176_o2nofp.cx10a_c8r32
0.000	0.000	nonzero	98.771	1.076	0.152	0.000	0.000	0.000	0.000	0.193	pg18rc1_o2nofp.cx10b_c8r32
0.000	0.000	0.000	98.922	0.917	0.161	0.000	0.000	0.000	0.000	0.182	pg18rc1_o2nofp.cx10c_c8r32
0.000	0.000	0.000	97.037	2.504	0.458	0.001	0.000	0.000	0.000	0.332	pg18rc1_o2nofp.cx10d_c8r32
Delete response time histogram
256us	1ms	4ms	16ms	64ms	256ms	1s	4s	16s	gt	max	tag
0.000	0.188	4.271	10.465	77.810	7.266	0.000	0.000	0.000	0.000	0.126	pg176_o2nofp.cx10a_c8r32
0.000	0.206	4.336	11.250	67.585	16.623	0.000	0.000	0.000	0.000	0.090	pg18rc1_o2nofp.cx10b_c8r32
0.000	0.264	4.240	11.071	47.420	37.005	0.000	0.000	0.000	0.000	0.114	pg18rc1_o2nofp.cx10c_c8r32
0.000	0.294	4.315	11.053	44.321	40.017	0.000	0.000	0.000	0.000	0.118	pg18rc1_o2nofp.cx10d_c8r32
l.i2
- l.i2: continue load after secondary indexes created with 5 inserts per transaction
- Legend for results is here.
- Each entry lists the percentage of responses that fit in that bucket (slower than max time for previous bucket, faster than min time for next bucket).
Insert response time histogram
256us	1ms	4ms	16ms	64ms	256ms	1s	4s	16s	gt	max	tag
0.000	2.488	97.272	0.238	0.002	nonzero	0.000	0.000	0.000	0.000	0.088	pg176_o2nofp.cx10a_c8r32
0.008	19.993	76.153	3.188	0.653	0.002	0.003	nonzero	0.000	0.000	2.075	pg18rc1_o2nofp.cx10b_c8r32
0.000	6.974	92.887	0.139	0.001	0.000	0.000	0.000	0.000	0.000	0.018	pg18rc1_o2nofp.cx10c_c8r32
0.000	6.377	93.599	0.024	nonzero	0.000	0.000	0.000	0.000	0.000	0.022	pg18rc1_o2nofp.cx10d_c8r32
Delete response time histogram
256us	1ms	4ms	16ms	64ms	256ms	1s	4s	16s	gt	max	tag
0.000	0.000	0.000	0.000	0.000	100.000	nonzero	0.000	0.000	0.000	0.256	pg176_o2nofp.cx10a_c8r32
0.534	8.482	15.430	0.032	75.101	0.420	0.002	nonzero	0.000	0.000	2.075	pg18rc1_o2nofp.cx10b_c8r32
0.000	0.000	0.000	0.000	75.748	24.252	0.000	0.000	0.000	0.000	0.204	pg18rc1_o2nofp.cx10c_c8r32
0.000	0.000	0.000	0.000	66.990	33.010	nonzero	0.000	0.000	0.000	0.257	pg18rc1_o2nofp.cx10d_c8r32
qr100.L1
- qr100.L1: range queries with 100 insert/s per client
- Legend for results is here.
- Each entry lists the percentage of responses that fit in that bucket (slower than max time for previous bucket, faster than min time for next bucket).
Query response time histogram
256us	1ms	4ms	16ms	64ms	256ms	1s	4s	16s	gt	max	tag
99.991	0.009	nonzero	0.000	nonzero	0.000	0.000	0.000	0.000	0.000	0.024	pg176_o2nofp.cx10a_c8r32
99.991	0.009	nonzero	0.000	nonzero	0.000	0.000	0.000	0.000	0.000	0.046	pg18rc1_o2nofp.cx10b_c8r32
99.991	0.009	nonzero	nonzero	nonzero	0.000	0.000	0.000	0.000	0.000	0.053	pg18rc1_o2nofp.cx10c_c8r32
99.991	0.009	nonzero	nonzero	nonzero	0.000	0.000	0.000	0.000	0.000	0.025	pg18rc1_o2nofp.cx10d_c8r32
Insert response time histogram
256us	1ms	4ms	16ms	64ms	256ms	1s	4s	16s	gt	max	tag
0.000	0.000	0.000	99.875	0.125	0.000	0.000	0.000	0.000	0.000	0.039	pg176_o2nofp.cx10a_c8r32
0.000	0.000	0.000	99.868	0.125	0.007	0.000	0.000	0.000	0.000	0.071	pg18rc1_o2nofp.cx10b_c8r32
0.000	0.000	0.000	99.896	0.097	0.007	0.000	0.000	0.000	0.000	0.068	pg18rc1_o2nofp.cx10c_c8r32
0.000	0.000	0.000	99.903	0.097	0.000	0.000	0.000	0.000	0.000	0.057	pg18rc1_o2nofp.cx10d_c8r32
Delete response time histogram
256us	1ms	4ms	16ms	64ms	256ms	1s	4s	16s	gt	max	tag
0.007	15.792	69.632	14.569	0.000	0.000	0.000	0.000	0.000	0.000	0.006	pg176_o2nofp.cx10a_c8r32
0.000	15.757	70.479	13.764	0.000	0.000	0.000	0.000	0.000	0.000	0.006	pg18rc1_o2nofp.cx10b_c8r32
0.000	15.701	69.757	14.542	0.000	0.000	0.000	0.000	0.000	0.000	0.007	pg18rc1_o2nofp.cx10c_c8r32
0.000	16.090	71.271	12.639	0.000	0.000	0.000	0.000	0.000	0.000	0.006	pg18rc1_o2nofp.cx10d_c8r32
qp100.L2
- qp100.L2: point queries with 100 insert/s per client
- Legend for results is here.
- Each entry lists the percentage of responses that fit in that bucket (slower than max time for previous bucket, faster than min time for next bucket).
Query response time histogram
256us	1ms	4ms	16ms	64ms	256ms	1s	4s	16s	gt	max	tag
nonzero	3.587	96.390	0.023	nonzero	0.000	0.000	0.000	0.000	0.000	0.040	pg176_o2nofp.cx10a_c8r32
nonzero	3.081	96.894	0.024	nonzero	0.000	0.000	0.000	0.000	0.000	0.034	pg18rc1_o2nofp.cx10b_c8r32
0.000	3.499	96.475	0.026	nonzero	0.000	0.000	0.000	0.000	0.000	0.049	pg18rc1_o2nofp.cx10c_c8r32
0.000	3.424	96.544	0.030	0.002	0.000	0.000	0.000	0.000	0.000	0.043	pg18rc1_o2nofp.cx10d_c8r32
Insert response time histogram
256us	1ms	4ms	16ms	64ms	256ms	1s	4s	16s	gt	max	tag
0.000	0.000	0.000	99.889	0.111	0.000	0.000	0.000	0.000	0.000	0.048	pg176_o2nofp.cx10a_c8r32
0.000	0.000	0.000	99.861	0.139	0.000	0.000	0.000	0.000	0.000	0.042	pg18rc1_o2nofp.cx10b_c8r32
0.000	0.000	0.000	99.840	0.160	0.000	0.000	0.000	0.000	0.000	0.034	pg18rc1_o2nofp.cx10c_c8r32
0.000	0.000	0.000	99.840	0.132	0.028	0.000	0.000	0.000	0.000	0.077	pg18rc1_o2nofp.cx10d_c8r32
Delete response time histogram
256us	1ms	4ms	16ms	64ms	256ms	1s	4s	16s	gt	max	tag
0.000	0.000	10.667	89.326	0.007	0.000	0.000	0.000	0.000	0.000	0.021	pg176_o2nofp.cx10a_c8r32
0.000	0.000	11.021	88.972	0.007	0.000	0.000	0.000	0.000	0.000	0.021	pg18rc1_o2nofp.cx10b_c8r32
0.000	0.000	11.062	88.931	0.007	0.000	0.000	0.000	0.000	0.000	0.022	pg18rc1_o2nofp.cx10c_c8r32
0.000	0.000	10.903	89.090	0.007	0.000	0.000	0.000	0.000	0.000	0.021	pg18rc1_o2nofp.cx10d_c8r32
qr500.L3
- qr500.L3: range queries with 500 insert/s per client
- Legend for results is here.
- Each entry lists the percentage of responses that fit in that bucket (slower than max time for previous bucket, faster than min time for next bucket).
Query response time histogram
256us	1ms	4ms	16ms	64ms	256ms	1s	4s	16s	gt	max	tag
99.971	0.029	nonzero	nonzero	nonzero	nonzero	0.000	0.000	0.000	0.000	0.074	pg176_o2nofp.cx10a_c8r32
99.970	0.029	nonzero	nonzero	nonzero	nonzero	0.000	0.000	0.000	0.000	0.089	pg18rc1_o2nofp.cx10b_c8r32
99.976	0.023	nonzero	nonzero	nonzero	nonzero	0.000	0.000	0.000	0.000	0.083	pg18rc1_o2nofp.cx10c_c8r32
99.971	0.028	nonzero	nonzero	nonzero	nonzero	0.000	0.000	0.000	0.000	0.092	pg18rc1_o2nofp.cx10d_c8r32
Insert response time histogram
256us	1ms	4ms	16ms	64ms	256ms	1s	4s	16s	gt	max	tag
0.000	0.000	0.004	97.797	1.896	0.303	0.000	0.000	0.000	0.000	0.241	pg176_o2nofp.cx10a_c8r32
0.000	0.000	0.007	99.753	0.240	0.000	0.000	0.000	0.000	0.000	0.036	pg18rc1_o2nofp.cx10b_c8r32
0.000	0.000	0.029	99.765	0.206	0.000	0.000	0.000	0.000	0.000	0.027	pg18rc1_o2nofp.cx10c_c8r32
0.000	0.000	0.033	99.715	0.229	0.022	0.000	0.000	0.000	0.000	0.096	pg18rc1_o2nofp.cx10d_c8r32
Delete response time histogram
256us	1ms	4ms	16ms	64ms	256ms	1s	4s	16s	gt	max	tag
0.000	0.000	0.000	24.649	75.351	0.000	0.000	0.000	0.000	0.000	0.048	pg176_o2nofp.cx10a_c8r32
0.000	0.000	0.000	28.836	71.164	0.000	0.000	0.000	0.000	0.000	0.040	pg18rc1_o2nofp.cx10b_c8r32
0.000	0.000	0.000	28.207	71.793	0.000	0.000	0.000	0.000	0.000	0.042	pg18rc1_o2nofp.cx10c_c8r32
0.000	0.000	0.000	28.354	71.646	0.000	0.000	0.000	0.000	0.000	0.040	pg18rc1_o2nofp.cx10d_c8r32
qp500.L4
- qp500.L4: point queries with 500 insert/s per client
- Legend for results is here.
- Each entry lists the percentage of responses that fit in that bucket (slower than max time for previous bucket, faster than min time for next bucket).
Query response time histogram
256us	1ms	4ms	16ms	64ms	256ms	1s	4s	16s	gt	max	tag
0.000	1.303	97.798	0.850	0.048	nonzero	nonzero	0.000	0.000	0.000	0.266	pg176_o2nofp.cx10a_c8r32
0.000	1.284	98.382	0.326	0.008	0.000	0.000	0.000	0.000	0.000	0.036	pg18rc1_o2nofp.cx10b_c8r32
0.000	1.252	98.474	0.269	0.005	nonzero	0.000	0.000	0.000	0.000	0.068	pg18rc1_o2nofp.cx10c_c8r32
nonzero	1.334	97.240	1.329	0.096	nonzero	0.000	0.000	0.000	0.000	0.076	pg18rc1_o2nofp.cx10d_c8r32
Insert response time histogram
256us	1ms	4ms	16ms	64ms	256ms	1s	4s	16s	gt	max	tag
0.000	0.000	0.000	92.869	5.956	1.171	0.004	0.000	0.000	0.000	0.280	pg176_o2nofp.cx10a_c8r32
0.000	0.000	0.000	98.507	1.337	0.156	0.000	0.000	0.000	0.000	0.180	pg18rc1_o2nofp.cx10b_c8r32
0.000	0.000	0.000	97.562	2.292	0.146	0.000	0.000	0.000	0.000	0.170	pg18rc1_o2nofp.cx10c_c8r32
0.000	0.000	0.000	90.254	6.933	2.812	0.000	0.000	0.000	0.000	0.179	pg18rc1_o2nofp.cx10d_c8r32
Delete response time histogram
256us	1ms	4ms	16ms	64ms	256ms	1s	4s	16s	gt	max	tag
0.000	0.000	0.000	0.000	99.867	0.133	0.000	0.000	0.000	0.000	0.097	pg176_o2nofp.cx10a_c8r32
0.000	0.000	0.000	0.000	99.996	0.004	0.000	0.000	0.000	0.000	0.098	pg18rc1_o2nofp.cx10b_c8r32
0.000	0.000	0.000	0.000	99.999	0.001	0.000	0.000	0.000	0.000	0.100	pg18rc1_o2nofp.cx10c_c8r32
0.000	0.000	0.000	0.000	99.999	0.001	0.000	0.000	0.000	0.000	0.098	pg18rc1_o2nofp.cx10d_c8r32
qr1000.L5
- qr1000.L5: range queries with 1000 insert/s per client
- Legend for results is here.
- Each entry lists the percentage of responses that fit in that bucket (slower than max time for previous bucket, faster than min time for next bucket).
Query response time histogram
256us	1ms	4ms	16ms	64ms	256ms	1s	4s	16s	gt	max	tag
99.711	0.287	0.002	0.001	nonzero	nonzero	nonzero	0.000	0.000	0.000	0.515	pg176_o2nofp.cx10a_c8r32
99.736	0.262	0.002	0.001	nonzero	nonzero	nonzero	0.000	0.000	0.000	0.389	pg18rc1_o2nofp.cx10b_c8r32
99.769	0.228	0.002	0.001	nonzero	nonzero	nonzero	0.000	0.000	0.000	0.374	pg18rc1_o2nofp.cx10c_c8r32
99.719	0.278	0.002	0.001	nonzero	nonzero	nonzero	0.000	0.000	0.000	0.497	pg18rc1_o2nofp.cx10d_c8r32
Insert response time histogram
256us	1ms	4ms	16ms	64ms	256ms	1s	4s	16s	gt	max	tag
0.000	0.000	0.000	98.941	1.047	0.012	0.000	0.000	0.000	0.000	0.101	pg176_o2nofp.cx10a_c8r32
0.000	0.000	0.007	98.883	0.919	0.191	0.000	0.000	0.000	0.000	0.187	pg18rc1_o2nofp.cx10b_c8r32
0.000	0.000	0.013	98.974	0.831	0.181	0.000	0.000	0.000	0.000	0.158	pg18rc1_o2nofp.cx10c_c8r32
0.000	0.000	0.000	98.935	1.056	0.010	0.000	0.000	0.000	0.000	0.094	pg18rc1_o2nofp.cx10d_c8r32
Delete response time histogram
256us	1ms	4ms	16ms	64ms	256ms	1s	4s	16s	gt	max	tag
0.000	0.000	0.000	0.000	99.997	0.003	0.000	0.000	0.000	0.000	0.121	pg176_o2nofp.cx10a_c8r32
0.000	0.000	0.000	0.000	99.999	0.001	0.000	0.000	0.000	0.000	0.152	pg18rc1_o2nofp.cx10b_c8r32
0.000	0.000	0.000	0.000	99.999	0.001	0.000	0.000	0.000	0.000	0.129	pg18rc1_o2nofp.cx10c_c8r32
0.000	0.000	0.000	0.000	99.999	0.001	0.000	0.000	0.000	0.000	0.122	pg18rc1_o2nofp.cx10d_c8r32
qp1000.L6
- qp1000.L6: point queries with 1000 insert/s per client
- Legend for results is here.
- Each entry lists the percentage of responses that fit in that bucket (slower than max time for previous bucket, faster than min time for next bucket).
Query response time histogram
256us	1ms	4ms	16ms	64ms	256ms	1s	4s	16s	gt	max	tag
0.000	0.665	98.102	1.228	0.005	nonzero	0.000	0.000	0.000	0.000	0.079	pg176_o2nofp.cx10a_c8r32
0.000	0.552	98.105	1.290	0.054	nonzero	0.000	0.000	0.000	0.000	0.072	pg18rc1_o2nofp.cx10b_c8r32
0.000	0.546	98.035	1.362	0.057	0.000	0.000	0.000	0.000	0.000	0.054	pg18rc1_o2nofp.cx10c_c8r32
0.000	0.607	98.032	1.357	0.004	0.000	0.000	0.000	0.000	0.000	0.046	pg18rc1_o2nofp.cx10d_c8r32
Insert response time histogram
256us	1ms	4ms	16ms	64ms	256ms	1s	4s	16s	gt	max	tag
0.000	0.000	0.000	94.128	5.664	0.208	0.000	0.000	0.000	0.000	0.177	pg176_o2nofp.cx10a_c8r32
0.000	0.000	0.000	94.600	4.577	0.819	0.003	0.000	0.000	0.000	0.351	pg18rc1_o2nofp.cx10b_c8r32
0.000	0.000	0.000	93.392	5.620	0.988	0.000	0.000	0.000	0.000	0.182	pg18rc1_o2nofp.cx10c_c8r32
0.000	0.000	0.000	92.869	6.962	0.169	0.000	0.000	0.000	0.000	0.171	pg18rc1_o2nofp.cx10d_c8r32
Delete response time histogram
256us	1ms	4ms	16ms	64ms	256ms	1s	4s	16s	gt	max	tag
0.000	0.000	0.000	0.000	17.117	82.883	0.000	0.000	0.000	0.000	0.205	pg176_o2nofp.cx10a_c8r32
0.000	0.000	0.000	0.000	27.810	72.190	0.000	0.000	0.000	0.000	0.207	pg18rc1_o2nofp.cx10b_c8r32
0.000	0.000	0.000	0.000	31.995	68.005	0.000	0.000	0.000	0.000	0.214	pg18rc1_o2nofp.cx10c_c8r32
0.000	0.000	0.000	0.000	31.677	68.323	0.000	0.000	0.000	0.000	0.202	pg18rc1_o2nofp.cx10d_c8r32