Introduction
This is a report for the insert benchmark with 30M docs and 1 client(s). It is generated by scripts (bash, awk, sed) and Tufte might not be impressed. An overview of the insert benchmark is here and a short update is here. Below, by DBMS, I mean DBMS+version.config. An example is my8020.c10b40 where my means MySQL, 8020 is version 8.0.20 and c10b40 is the name for the configuration file.
The test server has 8 AMD cores, 32G RAM and an NVMe device for the database. The benchmark was run with 1 client and there were 1 or 3 connections per client (1 for queries or inserts without rate limits, 1+1 for rate limited inserts+deletes). It uses 1 table with a table per client. It loads 30M rows per table without secondary indexes, creates 3 secondary indexes per table, then inserts 40m+10m rows per table with a delete per insert to avoid growing the table. It then does 6 read+write tests for 3600s each that do queries as fast as possible with 100,100,500,500,1000,1000 inserts/s and the same for deletes/s per client concurrent with the queries. The database is cached by Postgres. Clients and the DBMS share one server.
The tested DBMS are:
- pg176_o2nofp.cx10a_c8r32 - Postgres 17.6 with the x10b_c8r32 config
- pg18rc1_o2nofp.cx10b_c8r32 - Postgres 18 rc1 with the x10b_c8r32 config that uses io_method=sync
- pg18rc1_o2nofp.cx10c_c8r32 - Postgres 18 rc1 with the x10c_c8r32 config that uses io_method=worker
- pg18rc1_o2nofp.cx10d_c8r32 - Postgres 18 rc1 with the x10c_c8r32 config that uses io_method=io_uring
Contents
- Summary
- l.i0: load without secondary indexes
- l.x: create secondary indexes
- l.i1: continue load after secondary indexes created with 50 inserts per transaction
- l.i2: continue load after secondary indexes created with 5 inserts per transaction
- qr100.L1: range queries with 100 insert/s per client
- qp100.L2: point queries with 100 insert/s per client
- qr500.L3: range queries with 500 insert/s per client
- qp500.L4: point queries with 500 insert/s per client
- qr1000.L5: range queries with 1000 insert/s per client
- qp1000.L6: point queries with 1000 insert/s per client
Summary
The numbers are inserts/s for l.i0, l.i1 and l.i2, indexed docs (or rows) /s for l.x and queries/s for qr100, qp100 thru qr1000, qp1000" The values are the average rate over the entire test for inserts (IPS) and queries (QPS). The range of values for IPS and QPS is split into 3 parts: bottom 25%, middle 50%, top 25%. Values in the bottom 25% have a red background, values in the top 25% have a green background and values in the middle have no color. A gray background is used for values that can be ignored because the DBMS did not sustain the target insert rate. Red backgrounds are not used when the minimum value is within 80% of the max value.
| dbms | l.i0 | l.x | l.i1 | l.i2 | qr100 | qp100 | qr500 | qp500 | qr1000 | qp1000 |
|---|---|---|---|---|---|---|---|---|---|---|
| pg176_o2nofp.cx10a_c8r32 | 211268 | 500002 | 21834 | 2796 | 26623 | 13151 | 24084 | 13160 | 24119 | 13036 |
| pg18rc1_o2nofp.cx10b_c8r32 | 205479 | 508476 | 22409 | 2837 | 26696 | 13103 | 24109 | 13165 | 24169 | 13024 |
| pg18rc1_o2nofp.cx10c_c8r32 | 202703 | 500002 | 22359 | 2946 | 26561 | 13095 | 23833 | 13060 | 23710 | 13022 |
| pg18rc1_o2nofp.cx10d_c8r32 | 205479 | 500002 | 22099 | 2810 | 26256 | 13098 | 23936 | 13062 | 23921 | 12945 |
This table has relative throughput, throughput for the DBMS relative to the DBMS in the first line, using the absolute throughput from the previous table. Values less than 0.95 have a yellow background. Values greater than 1.05 have a blue background.
| dbms | l.i0 | l.x | l.i1 | l.i2 | qr100 | qp100 | qr500 | qp500 | qr1000 | qp1000 |
|---|---|---|---|---|---|---|---|---|---|---|
| pg176_o2nofp.cx10a_c8r32 | 1.00 | 1.00 | 1.00 | 1.00 | 1.00 | 1.00 | 1.00 | 1.00 | 1.00 | 1.00 |
| pg18rc1_o2nofp.cx10b_c8r32 | 0.97 | 1.02 | 1.03 | 1.01 | 1.00 | 1.00 | 1.00 | 1.00 | 1.00 | 1.00 |
| pg18rc1_o2nofp.cx10c_c8r32 | 0.96 | 1.00 | 1.02 | 1.05 | 1.00 | 1.00 | 0.99 | 0.99 | 0.98 | 1.00 |
| pg18rc1_o2nofp.cx10d_c8r32 | 0.97 | 1.00 | 1.01 | 1.01 | 0.99 | 1.00 | 0.99 | 0.99 | 0.99 | 0.99 |
This lists the average rate of inserts/s for the tests that do inserts concurrent with queries. For such tests the query rate is listed in the table above. The read+write tests are setup so that the insert rate should match the target rate every second. Cells that are not at least 95% of the target have a red background to indicate a failure to satisfy the target.
| dbms | qr100.L1 | qp100.L2 | qr500.L3 | qp500.L4 | qr1000.L5 | qp1000.L6 |
|---|---|---|---|---|---|---|
| pg176_o2nofp.cx10a_c8r32 | 100 | 100 | 499 | 499 | 999 | 999 |
| pg18rc1_o2nofp.cx10b_c8r32 | 100 | 100 | 500 | 500 | 999 | 999 |
| pg18rc1_o2nofp.cx10c_c8r32 | 100 | 100 | 500 | 500 | 999 | 999 |
| pg18rc1_o2nofp.cx10d_c8r32 | 100 | 100 | 500 | 499 | 999 | 999 |
| target | 100 | 100 | 500 | 500 | 1000 | 1000 |
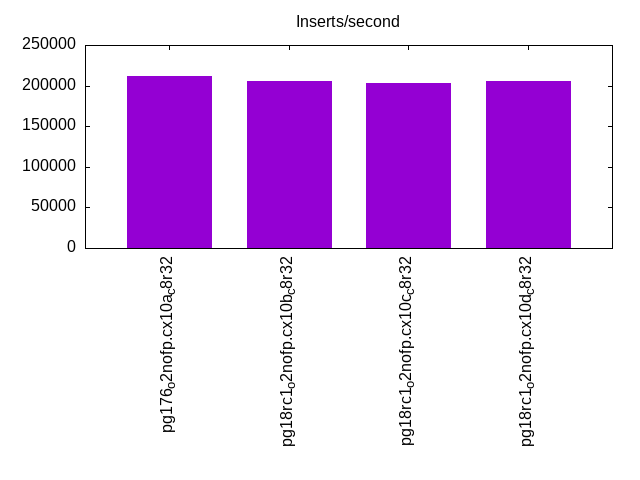
l.i0
l.i0: load without secondary indexes. Graphs for performance per 1-second interval are here.
Average throughput:
Insert response time histogram: each cell has the percentage of responses that take <= the time in the header and max is the max response time in seconds. For the max column values in the top 25% of the range have a red background and in the bottom 25% of the range have a green background. The red background is not used when the min value is within 80% of the max value.
| dbms | 256us | 1ms | 4ms | 16ms | 64ms | 256ms | 1s | 4s | 16s | gt | max |
|---|---|---|---|---|---|---|---|---|---|---|---|
| pg176_o2nofp.cx10a_c8r32 | 99.993 | 0.006 | 0.001 | 0.012 | |||||||
| pg18rc1_o2nofp.cx10b_c8r32 | 99.991 | 0.009 | 0.003 | ||||||||
| pg18rc1_o2nofp.cx10c_c8r32 | 99.994 | 0.004 | 0.002 | 0.009 | |||||||
| pg18rc1_o2nofp.cx10d_c8r32 | 99.985 | 0.013 | 0.002 | 0.013 |
Performance metrics for the DBMS listed above. Some are normalized by throughput, others are not. Legend for results is here.
ips	qps	rps	rmbps	wps	wmbps	rpq	rkbpq	wpi	wkbpi	csps	cpups	cspq	cpupq	dbgb1	dbgb2	rss	maxop	p50	p99	tag
211268	0	0	0.0	784.8	89.3	0.000	0.000	0.004	0.433	22551	19.9	0.107	8	2.9	7.8	2.4	0.012	211764	204182	pg176_o2nofp.cx10a_c8r32
205479	0	0	0.0	761.8	86.6	0.000	0.000	0.004	0.431	22049	19.6	0.107	8	2.9	7.8	0.6	0.003	206164	199573	pg18rc1_o2nofp.cx10b_c8r32
202703	0	0	0.0	757.1	86.0	0.000	0.000	0.004	0.435	21833	19.6	0.108	8	2.9	7.8	2.4	0.009	204777	197748	pg18rc1_o2nofp.cx10c_c8r32
205479	0	0	0.0	763.3	86.7	0.000	0.000	0.004	0.432	22004	19.8	0.107	8	2.9	7.8	1.8	0.013	206678	198577	pg18rc1_o2nofp.cx10d_c8r32
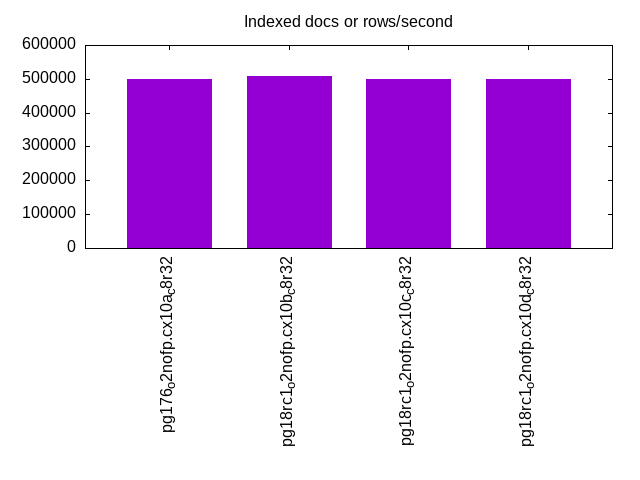
l.x
l.x: create secondary indexes.
Average throughput:
Performance metrics for the DBMS listed above. Some are normalized by throughput, others are not. Legend for results is here.
ips	qps	rps	rmbps	wps	wmbps	rpq	rkbpq	wpi	wkbpi	csps	cpups	cspq	cpupq	dbgb1	dbgb2	rss	maxop	p50	p99	tag
500002	0	1	0.0	1123.5	138.2	0.000	0.000	0.002	0.283	3452	11.8	0.007	2	5.8	13.3	3.0	0.001	NA	NA	pg176_o2nofp.cx10a_c8r32
508476	0	0	0.0	915.3	112.5	0.000	0.000	0.002	0.227	2822	12.0	0.006	2	5.8	13.3	3.0	0.002	NA	NA	pg18rc1_o2nofp.cx10b_c8r32
500002	0	0	0.0	895.0	110.1	0.000	0.000	0.002	0.225	2664	12.1	0.005	2	5.8	13.3	3.0	0.002	NA	NA	pg18rc1_o2nofp.cx10c_c8r32
500002	0	1	0.0	921.2	113.3	0.000	0.000	0.002	0.232	2720	12.1	0.005	2	5.8	13.3	3.0	0.001	NA	NA	pg18rc1_o2nofp.cx10d_c8r32
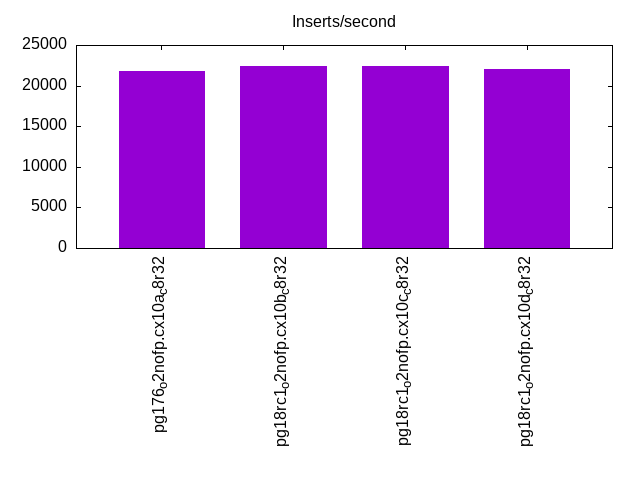
l.i1
l.i1: continue load after secondary indexes created with 50 inserts per transaction. Graphs for performance per 1-second interval are here.
Average throughput:
Insert response time histogram: each cell has the percentage of responses that take <= the time in the header and max is the max response time in seconds. For the max column values in the top 25% of the range have a red background and in the bottom 25% of the range have a green background. The red background is not used when the min value is within 80% of the max value.
| dbms | 256us | 1ms | 4ms | 16ms | 64ms | 256ms | 1s | 4s | 16s | gt | max |
|---|---|---|---|---|---|---|---|---|---|---|---|
| pg176_o2nofp.cx10a_c8r32 | 48.585 | 51.413 | 0.001 | nonzero | 0.035 | ||||||
| pg18rc1_o2nofp.cx10b_c8r32 | 49.830 | 50.169 | nonzero | 0.001 | 0.038 | ||||||
| pg18rc1_o2nofp.cx10c_c8r32 | 49.244 | 50.742 | 0.008 | 0.005 | 0.001 | 0.072 | |||||
| pg18rc1_o2nofp.cx10d_c8r32 | 49.356 | 50.643 | nonzero | 0.001 | 0.045 |
Delete response time histogram: each cell has the percentage of responses that take <= the time in the header and max is the max response time in seconds. For the max column values in the top 25% of the range have a red background and in the bottom 25% of the range have a green background. The red background is not used when the min value is within 80% of the max value.
| dbms | 256us | 1ms | 4ms | 16ms | 64ms | 256ms | 1s | 4s | 16s | gt | max |
|---|---|---|---|---|---|---|---|---|---|---|---|
| pg176_o2nofp.cx10a_c8r32 | 0.001 | 24.944 | 72.647 | 2.405 | 0.002 | 0.042 | |||||
| pg18rc1_o2nofp.cx10b_c8r32 | 0.001 | 26.319 | 71.909 | 1.769 | 0.001 | 0.045 | |||||
| pg18rc1_o2nofp.cx10c_c8r32 | nonzero | 26.803 | 71.772 | 1.417 | 0.006 | 0.001 | 0.077 | ||||
| pg18rc1_o2nofp.cx10d_c8r32 | 0.001 | 25.836 | 72.089 | 2.074 | 0.001 | 0.045 |
Performance metrics for the DBMS listed above. Some are normalized by throughput, others are not. Legend for results is here.
ips	qps	rps	rmbps	wps	wmbps	rpq	rkbpq	wpi	wkbpi	csps	cpups	cspq	cpupq	dbgb1	dbgb2	rss	maxop	p50	p99	tag
21834	0	0	0.0	261.6	29.6	0.000	0.000	0.012	1.388	9081	20.3	0.416	74	7.8	38.3	2.0	0.035	16647	12048	pg176_o2nofp.cx10a_c8r32
22409	0	0	0.0	282.1	31.1	0.000	0.000	0.013	1.420	9319	20.4	0.416	73	7.8	38.3	5.8	0.038	17147	12148	pg18rc1_o2nofp.cx10b_c8r32
22359	0	0	0.0	281.0	31.0	0.000	0.000	0.013	1.419	9408	20.4	0.421	73	7.8	38.3	7.7	0.072	17048	11998	pg18rc1_o2nofp.cx10c_c8r32
22099	0	0	0.0	277.7	30.6	0.000	0.000	0.013	1.416	9212	20.2	0.417	73	7.8	38.3	6.6	0.045	16847	12098	pg18rc1_o2nofp.cx10d_c8r32
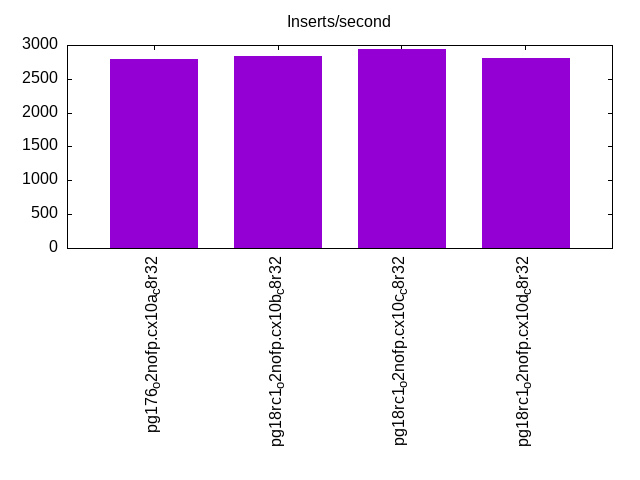
l.i2
l.i2: continue load after secondary indexes created with 5 inserts per transaction. Graphs for performance per 1-second interval are here.
Average throughput:
Insert response time histogram: each cell has the percentage of responses that take <= the time in the header and max is the max response time in seconds. For the max column values in the top 25% of the range have a red background and in the bottom 25% of the range have a green background. The red background is not used when the min value is within 80% of the max value.
| dbms | 256us | 1ms | 4ms | 16ms | 64ms | 256ms | 1s | 4s | 16s | gt | max |
|---|---|---|---|---|---|---|---|---|---|---|---|
| pg176_o2nofp.cx10a_c8r32 | 51.893 | 48.107 | nonzero | 0.001 | |||||||
| pg18rc1_o2nofp.cx10b_c8r32 | 53.072 | 46.927 | 0.001 | 0.002 | |||||||
| pg18rc1_o2nofp.cx10c_c8r32 | 53.190 | 46.810 | nonzero | nonzero | 0.020 | ||||||
| pg18rc1_o2nofp.cx10d_c8r32 | 49.276 | 50.724 | nonzero | 0.002 |
Delete response time histogram: each cell has the percentage of responses that take <= the time in the header and max is the max response time in seconds. For the max column values in the top 25% of the range have a red background and in the bottom 25% of the range have a green background. The red background is not used when the min value is within 80% of the max value.
| dbms | 256us | 1ms | 4ms | 16ms | 64ms | 256ms | 1s | 4s | 16s | gt | max |
|---|---|---|---|---|---|---|---|---|---|---|---|
| pg176_o2nofp.cx10a_c8r32 | 4.441 | 22.425 | 73.101 | 0.033 | 0.013 | ||||||
| pg18rc1_o2nofp.cx10b_c8r32 | 4.377 | 22.253 | 73.326 | 0.043 | 0.013 | ||||||
| pg18rc1_o2nofp.cx10c_c8r32 | 4.036 | 25.328 | 70.613 | 0.022 | nonzero | 0.020 | |||||
| pg18rc1_o2nofp.cx10d_c8r32 | 4.307 | 27.052 | 68.599 | 0.042 | 0.013 |
Performance metrics for the DBMS listed above. Some are normalized by throughput, others are not. Legend for results is here.
ips	qps	rps	rmbps	wps	wmbps	rpq	rkbpq	wpi	wkbpi	csps	cpups	cspq	cpupq	dbgb1	dbgb2	rss	maxop	p50	p99	tag
2796	0	0	0.0	60.2	6.0	0.000	0.000	0.022	2.188	10502	15.3	3.757	438	7.9	40.2	0.4	0.001	2045	1415	pg176_o2nofp.cx10a_c8r32
2837	0	0	0.0	60.8	6.0	0.000	0.000	0.021	2.176	10670	15.3	3.761	431	7.9	40.2	0.3	0.002	2105	1365	pg18rc1_o2nofp.cx10b_c8r32
2946	0	0	0.0	62.9	6.3	0.000	0.000	0.021	2.182	11141	15.4	3.783	418	7.9	40.5	6.7	0.020	2215	1480	pg18rc1_o2nofp.cx10c_c8r32
2810	0	0	0.0	60.4	6.0	0.000	0.000	0.022	2.192	10637	15.4	3.785	438	7.9	40.3	7.9	0.002	2045	1450	pg18rc1_o2nofp.cx10d_c8r32
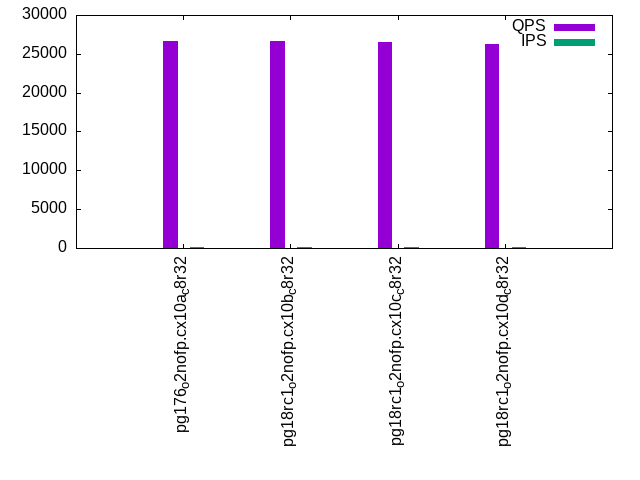
qr100.L1
qr100.L1: range queries with 100 insert/s per client. Graphs for performance per 1-second interval are here.
Average throughput:
Query response time histogram: each cell has the percentage of responses that take <= the time in the header and max is the max response time in seconds. For max values in the top 25% of the range have a red background and in the bottom 25% of the range have a green background. The red background is not used when the min value is within 80% of the max value.
| dbms | 256us | 1ms | 4ms | 16ms | 64ms | 256ms | 1s | 4s | 16s | gt | max |
|---|---|---|---|---|---|---|---|---|---|---|---|
| pg176_o2nofp.cx10a_c8r32 | 99.994 | 0.006 | nonzero | 0.001 | |||||||
| pg18rc1_o2nofp.cx10b_c8r32 | 99.993 | 0.007 | nonzero | 0.001 | |||||||
| pg18rc1_o2nofp.cx10c_c8r32 | 99.993 | 0.007 | nonzero | 0.001 | |||||||
| pg18rc1_o2nofp.cx10d_c8r32 | 99.993 | 0.007 | 0.001 |
Insert response time histogram: each cell has the percentage of responses that take <= the time in the header and max is the max response time in seconds. For max values in the top 25% of the range have a red background and in the bottom 25% of the range have a green background. The red background is not used when the min value is within 80% of the max value.
| dbms | 256us | 1ms | 4ms | 16ms | 64ms | 256ms | 1s | 4s | 16s | gt | max |
|---|---|---|---|---|---|---|---|---|---|---|---|
| pg176_o2nofp.cx10a_c8r32 | 21.194 | 78.778 | 0.028 | 0.004 | |||||||
| pg18rc1_o2nofp.cx10b_c8r32 | 26.111 | 73.861 | 0.028 | 0.005 | |||||||
| pg18rc1_o2nofp.cx10c_c8r32 | 27.333 | 72.639 | 0.028 | 0.005 | |||||||
| pg18rc1_o2nofp.cx10d_c8r32 | 28.528 | 71.444 | 0.028 | 0.005 |
Delete response time histogram: each cell has the percentage of responses that take <= the time in the header and max is the max response time in seconds. For max values in the top 25% of the range have a red background and in the bottom 25% of the range have a green background. The red background is not used when the min value is within 80% of the max value.
| dbms | 256us | 1ms | 4ms | 16ms | 64ms | 256ms | 1s | 4s | 16s | gt | max |
|---|---|---|---|---|---|---|---|---|---|---|---|
| pg176_o2nofp.cx10a_c8r32 | 0.028 | 65.806 | 34.167 | 0.002 | |||||||
| pg18rc1_o2nofp.cx10b_c8r32 | 64.806 | 35.194 | 0.002 | ||||||||
| pg18rc1_o2nofp.cx10c_c8r32 | 62.861 | 37.139 | 0.002 | ||||||||
| pg18rc1_o2nofp.cx10d_c8r32 | 62.833 | 37.167 | 0.002 |
Performance metrics for the DBMS listed above. Some are normalized by throughput, others are not. Legend for results is here.
ips	qps	rps	rmbps	wps	wmbps	rpq	rkbpq	wpi	wkbpi	csps	cpups	cspq	cpupq	dbgb1	dbgb2	rss	maxop	p50	p99	tag
100	26623	0	0.0	12.2	0.8	0.000	0.000	0.122	7.731	101633	8.2	3.817	25	7.9	40.2	0.1	0.001	26635	26221	pg176_o2nofp.cx10a_c8r32
100	26696	0	0.0	12.2	0.8	0.000	0.000	0.122	7.754	101849	8.1	3.815	24	7.9	40.2	0.1	0.001	26712	26266	pg18rc1_o2nofp.cx10b_c8r32
100	26561	0	0.0	12.0	0.8	0.000	0.000	0.120	7.721	101338	8.3	3.815	25	7.9	40.5	0.1	0.001	26556	26169	pg18rc1_o2nofp.cx10c_c8r32
100	26256	0	0.0	12.3	0.8	0.000	0.000	0.123	7.727	100179	8.6	3.815	26	7.9	40.3	0.1	0.001	26267	25836	pg18rc1_o2nofp.cx10d_c8r32
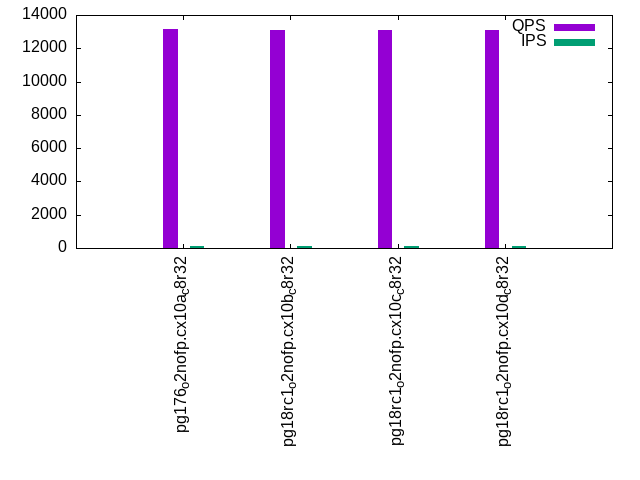
qp100.L2
qp100.L2: point queries with 100 insert/s per client. Graphs for performance per 1-second interval are here.
Average throughput:
Query response time histogram: each cell has the percentage of responses that take <= the time in the header and max is the max response time in seconds. For max values in the top 25% of the range have a red background and in the bottom 25% of the range have a green background. The red background is not used when the min value is within 80% of the max value.
| dbms | 256us | 1ms | 4ms | 16ms | 64ms | 256ms | 1s | 4s | 16s | gt | max |
|---|---|---|---|---|---|---|---|---|---|---|---|
| pg176_o2nofp.cx10a_c8r32 | 99.986 | 0.014 | 0.001 | ||||||||
| pg18rc1_o2nofp.cx10b_c8r32 | 99.984 | 0.016 | 0.001 | ||||||||
| pg18rc1_o2nofp.cx10c_c8r32 | 99.985 | 0.015 | nonzero | 0.001 | |||||||
| pg18rc1_o2nofp.cx10d_c8r32 | 99.983 | 0.017 | 0.001 |
Insert response time histogram: each cell has the percentage of responses that take <= the time in the header and max is the max response time in seconds. For max values in the top 25% of the range have a red background and in the bottom 25% of the range have a green background. The red background is not used when the min value is within 80% of the max value.
| dbms | 256us | 1ms | 4ms | 16ms | 64ms | 256ms | 1s | 4s | 16s | gt | max |
|---|---|---|---|---|---|---|---|---|---|---|---|
| pg176_o2nofp.cx10a_c8r32 | 1.833 | 98.139 | 0.028 | 0.004 | |||||||
| pg18rc1_o2nofp.cx10b_c8r32 | 4.611 | 95.361 | 0.028 | 0.005 | |||||||
| pg18rc1_o2nofp.cx10c_c8r32 | 2.083 | 97.889 | 0.028 | 0.005 | |||||||
| pg18rc1_o2nofp.cx10d_c8r32 | 4.222 | 95.750 | 0.028 | 0.004 |
Delete response time histogram: each cell has the percentage of responses that take <= the time in the header and max is the max response time in seconds. For max values in the top 25% of the range have a red background and in the bottom 25% of the range have a green background. The red background is not used when the min value is within 80% of the max value.
| dbms | 256us | 1ms | 4ms | 16ms | 64ms | 256ms | 1s | 4s | 16s | gt | max |
|---|---|---|---|---|---|---|---|---|---|---|---|
| pg176_o2nofp.cx10a_c8r32 | 22.722 | 77.278 | 0.004 | ||||||||
| pg18rc1_o2nofp.cx10b_c8r32 | 17.750 | 82.250 | 0.003 | ||||||||
| pg18rc1_o2nofp.cx10c_c8r32 | 12.667 | 87.333 | 0.003 | ||||||||
| pg18rc1_o2nofp.cx10d_c8r32 | 30.222 | 69.750 | 0.028 | 0.004 |
Performance metrics for the DBMS listed above. Some are normalized by throughput, others are not. Legend for results is here.
ips	qps	rps	rmbps	wps	wmbps	rpq	rkbpq	wpi	wkbpi	csps	cpups	cspq	cpupq	dbgb1	dbgb2	rss	maxop	p50	p99	tag
100	13151	0	0.0	58.8	1.6	0.000	0.000	0.589	16.775	50783	10.1	3.862	61	7.9	40.2	0.1	0.001	13166	13054	pg176_o2nofp.cx10a_c8r32
100	13103	0	0.0	58.8	1.6	0.000	0.000	0.589	16.810	50569	9.9	3.859	60	7.9	40.2	0.1	0.001	13102	13002	pg18rc1_o2nofp.cx10b_c8r32
100	13095	0	0.0	58.6	1.6	0.000	0.000	0.587	16.784	50537	10.1	3.859	62	7.9	40.2	0.1	0.001	13102	13002	pg18rc1_o2nofp.cx10c_c8r32
100	13098	0	0.0	58.8	1.6	0.000	0.000	0.589	16.792	50566	9.9	3.861	60	7.9	40.2	0.1	0.001	13102	13002	pg18rc1_o2nofp.cx10d_c8r32
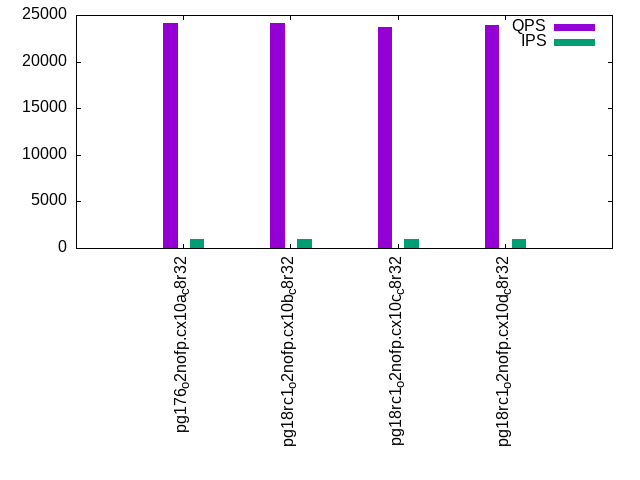
qr500.L3
qr500.L3: range queries with 500 insert/s per client. Graphs for performance per 1-second interval are here.
Average throughput:

Query response time histogram: each cell has the percentage of responses that take <= the time in the header and max is the max response time in seconds. For max values in the top 25% of the range have a red background and in the bottom 25% of the range have a green background. The red background is not used when the min value is within 80% of the max value.
| dbms | 256us | 1ms | 4ms | 16ms | 64ms | 256ms | 1s | 4s | 16s | gt | max |
|---|---|---|---|---|---|---|---|---|---|---|---|
| pg176_o2nofp.cx10a_c8r32 | 99.991 | 0.009 | nonzero | 0.002 | |||||||
| pg18rc1_o2nofp.cx10b_c8r32 | 99.990 | 0.010 | nonzero | 0.002 | |||||||
| pg18rc1_o2nofp.cx10c_c8r32 | 99.990 | 0.010 | nonzero | 0.002 | |||||||
| pg18rc1_o2nofp.cx10d_c8r32 | 99.990 | 0.010 | nonzero | nonzero | 0.004 |
Insert response time histogram: each cell has the percentage of responses that take <= the time in the header and max is the max response time in seconds. For max values in the top 25% of the range have a red background and in the bottom 25% of the range have a green background. The red background is not used when the min value is within 80% of the max value.
| dbms | 256us | 1ms | 4ms | 16ms | 64ms | 256ms | 1s | 4s | 16s | gt | max |
|---|---|---|---|---|---|---|---|---|---|---|---|
| pg176_o2nofp.cx10a_c8r32 | 71.972 | 28.022 | 0.006 | 0.005 | |||||||
| pg18rc1_o2nofp.cx10b_c8r32 | 74.700 | 25.294 | 0.006 | 0.004 | |||||||
| pg18rc1_o2nofp.cx10c_c8r32 | 70.022 | 29.972 | 0.006 | 0.005 | |||||||
| pg18rc1_o2nofp.cx10d_c8r32 | 74.067 | 25.928 | 0.006 | 0.005 |
Delete response time histogram: each cell has the percentage of responses that take <= the time in the header and max is the max response time in seconds. For max values in the top 25% of the range have a red background and in the bottom 25% of the range have a green background. The red background is not used when the min value is within 80% of the max value.
| dbms | 256us | 1ms | 4ms | 16ms | 64ms | 256ms | 1s | 4s | 16s | gt | max |
|---|---|---|---|---|---|---|---|---|---|---|---|
| pg176_o2nofp.cx10a_c8r32 | 4.133 | 92.728 | 3.139 | 0.005 | |||||||
| pg18rc1_o2nofp.cx10b_c8r32 | 2.122 | 96.133 | 1.744 | 0.005 | |||||||
| pg18rc1_o2nofp.cx10c_c8r32 | 1.761 | 96.383 | 1.856 | 0.005 | |||||||
| pg18rc1_o2nofp.cx10d_c8r32 | 2.950 | 95.167 | 1.883 | 0.005 |
Performance metrics for the DBMS listed above. Some are normalized by throughput, others are not. Legend for results is here.
ips	qps	rps	rmbps	wps	wmbps	rpq	rkbpq	wpi	wkbpi	csps	cpups	cspq	cpupq	dbgb1	dbgb2	rss	maxop	p50	p99	tag
499	24084	0	0.0	66.7	2.3	0.000	0.000	0.134	4.628	92079	9.2	3.823	31	7.9	39.0	0.3	0.002	24061	22604	pg176_o2nofp.cx10a_c8r32
500	24109	0	0.0	66.7	2.3	0.000	0.000	0.134	4.633	92125	9.2	3.821	31	7.9	39.0	0.3	0.002	24076	22652	pg18rc1_o2nofp.cx10b_c8r32
500	23833	0	0.0	67.1	2.3	0.000	0.000	0.134	4.672	91076	9.4	3.821	32	8.0	39.1	0.4	0.002	23816	22429	pg18rc1_o2nofp.cx10c_c8r32
500	23936	0	0.0	66.8	2.2	0.000	0.000	0.134	4.608	91465	9.2	3.821	31	7.9	39.0	0.3	0.004	23963	22508	pg18rc1_o2nofp.cx10d_c8r32
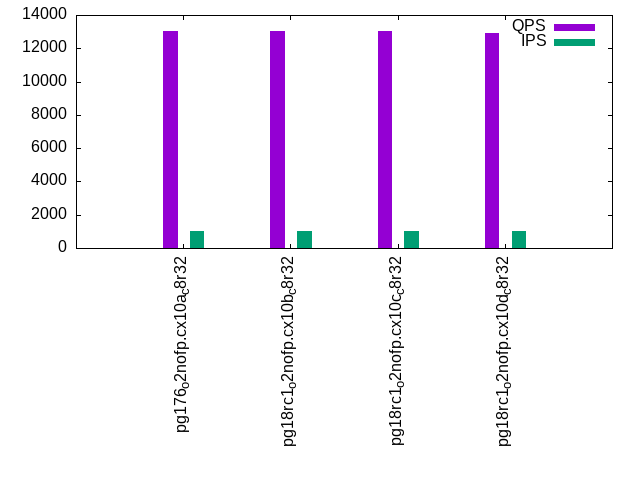
qp500.L4
qp500.L4: point queries with 500 insert/s per client. Graphs for performance per 1-second interval are here.
Average throughput:

Query response time histogram: each cell has the percentage of responses that take <= the time in the header and max is the max response time in seconds. For max values in the top 25% of the range have a red background and in the bottom 25% of the range have a green background. The red background is not used when the min value is within 80% of the max value.
| dbms | 256us | 1ms | 4ms | 16ms | 64ms | 256ms | 1s | 4s | 16s | gt | max |
|---|---|---|---|---|---|---|---|---|---|---|---|
| pg176_o2nofp.cx10a_c8r32 | 99.979 | 0.021 | nonzero | 0.002 | |||||||
| pg18rc1_o2nofp.cx10b_c8r32 | 99.976 | 0.024 | nonzero | 0.001 | |||||||
| pg18rc1_o2nofp.cx10c_c8r32 | 99.977 | 0.023 | nonzero | 0.002 | |||||||
| pg18rc1_o2nofp.cx10d_c8r32 | 99.974 | 0.026 | nonzero | nonzero | 0.035 |
Insert response time histogram: each cell has the percentage of responses that take <= the time in the header and max is the max response time in seconds. For max values in the top 25% of the range have a red background and in the bottom 25% of the range have a green background. The red background is not used when the min value is within 80% of the max value.
| dbms | 256us | 1ms | 4ms | 16ms | 64ms | 256ms | 1s | 4s | 16s | gt | max |
|---|---|---|---|---|---|---|---|---|---|---|---|
| pg176_o2nofp.cx10a_c8r32 | 69.733 | 30.233 | 0.033 | 0.015 | |||||||
| pg18rc1_o2nofp.cx10b_c8r32 | 73.739 | 26.239 | 0.022 | 0.013 | |||||||
| pg18rc1_o2nofp.cx10c_c8r32 | 72.544 | 27.422 | 0.028 | 0.006 | 0.020 | ||||||
| pg18rc1_o2nofp.cx10d_c8r32 | 73.939 | 26.039 | 0.011 | 0.011 | 0.017 |
Delete response time histogram: each cell has the percentage of responses that take <= the time in the header and max is the max response time in seconds. For max values in the top 25% of the range have a red background and in the bottom 25% of the range have a green background. The red background is not used when the min value is within 80% of the max value.
| dbms | 256us | 1ms | 4ms | 16ms | 64ms | 256ms | 1s | 4s | 16s | gt | max |
|---|---|---|---|---|---|---|---|---|---|---|---|
| pg176_o2nofp.cx10a_c8r32 | 0.072 | 29.583 | 60.911 | 9.433 | 0.014 | ||||||
| pg18rc1_o2nofp.cx10b_c8r32 | 0.122 | 27.767 | 69.756 | 2.356 | 0.012 | ||||||
| pg18rc1_o2nofp.cx10c_c8r32 | 0.144 | 28.128 | 68.406 | 3.317 | 0.006 | 0.018 | |||||
| pg18rc1_o2nofp.cx10d_c8r32 | 0.139 | 24.883 | 71.878 | 3.094 | 0.006 | 0.017 |
Performance metrics for the DBMS listed above. Some are normalized by throughput, others are not. Legend for results is here.
ips	qps	rps	rmbps	wps	wmbps	rpq	rkbpq	wpi	wkbpi	csps	cpups	cspq	cpupq	dbgb1	dbgb2	rss	maxop	p50	p99	tag
499	13160	0	0.0	41.9	3.0	0.000	0.000	0.084	6.082	50925	10.5	3.870	64	8.0	36.9	0.3	0.002	13181	13006	pg176_o2nofp.cx10a_c8r32
500	13165	0	0.0	41.7	2.9	0.000	0.000	0.083	6.030	50914	10.5	3.867	64	7.9	36.9	0.2	0.001	13180	13022	pg18rc1_o2nofp.cx10b_c8r32
500	13060	0	0.0	41.7	2.9	0.000	0.000	0.083	6.035	50508	10.5	3.868	64	8.0	37.0	0.2	0.002	13070	12926	pg18rc1_o2nofp.cx10c_c8r32
499	13062	0	0.0	41.8	3.0	0.000	0.000	0.084	6.057	50548	10.5	3.870	64	7.9	36.9	0.2	0.035	13081	12941	pg18rc1_o2nofp.cx10d_c8r32
qr1000.L5
qr1000.L5: range queries with 1000 insert/s per client. Graphs for performance per 1-second interval are here.
Average throughput:
Query response time histogram: each cell has the percentage of responses that take <= the time in the header and max is the max response time in seconds. For max values in the top 25% of the range have a red background and in the bottom 25% of the range have a green background. The red background is not used when the min value is within 80% of the max value.
| dbms | 256us | 1ms | 4ms | 16ms | 64ms | 256ms | 1s | 4s | 16s | gt | max |
|---|---|---|---|---|---|---|---|---|---|---|---|
| pg176_o2nofp.cx10a_c8r32 | 99.989 | 0.011 | nonzero | 0.004 | |||||||
| pg18rc1_o2nofp.cx10b_c8r32 | 99.988 | 0.012 | nonzero | nonzero | 0.004 | ||||||
| pg18rc1_o2nofp.cx10c_c8r32 | 99.988 | 0.012 | nonzero | nonzero | 0.004 | ||||||
| pg18rc1_o2nofp.cx10d_c8r32 | 99.987 | 0.013 | nonzero | nonzero | 0.005 |
Insert response time histogram: each cell has the percentage of responses that take <= the time in the header and max is the max response time in seconds. For max values in the top 25% of the range have a red background and in the bottom 25% of the range have a green background. The red background is not used when the min value is within 80% of the max value.
| dbms | 256us | 1ms | 4ms | 16ms | 64ms | 256ms | 1s | 4s | 16s | gt | max |
|---|---|---|---|---|---|---|---|---|---|---|---|
| pg176_o2nofp.cx10a_c8r32 | 73.331 | 26.667 | 0.003 | 0.004 | |||||||
| pg18rc1_o2nofp.cx10b_c8r32 | 72.708 | 27.283 | 0.006 | 0.003 | 0.018 | ||||||
| pg18rc1_o2nofp.cx10c_c8r32 | 73.169 | 26.828 | 0.003 | 0.005 | |||||||
| pg18rc1_o2nofp.cx10d_c8r32 | 72.811 | 27.186 | 0.003 | 0.004 |
Delete response time histogram: each cell has the percentage of responses that take <= the time in the header and max is the max response time in seconds. For max values in the top 25% of the range have a red background and in the bottom 25% of the range have a green background. The red background is not used when the min value is within 80% of the max value.
| dbms | 256us | 1ms | 4ms | 16ms | 64ms | 256ms | 1s | 4s | 16s | gt | max |
|---|---|---|---|---|---|---|---|---|---|---|---|
| pg176_o2nofp.cx10a_c8r32 | 0.050 | 18.272 | 77.292 | 4.386 | 0.006 | ||||||
| pg18rc1_o2nofp.cx10b_c8r32 | 0.092 | 13.061 | 85.622 | 1.222 | 0.003 | 0.017 | |||||
| pg18rc1_o2nofp.cx10c_c8r32 | 0.036 | 11.753 | 86.981 | 1.231 | 0.007 | ||||||
| pg18rc1_o2nofp.cx10d_c8r32 | 0.072 | 13.561 | 85.025 | 1.342 | 0.008 |
Performance metrics for the DBMS listed above. Some are normalized by throughput, others are not. Legend for results is here.
ips	qps	rps	rmbps	wps	wmbps	rpq	rkbpq	wpi	wkbpi	csps	cpups	cspq	cpupq	dbgb1	dbgb2	rss	maxop	p50	p99	tag
999	24119	0	0.0	50.6	3.4	0.000	0.000	0.051	3.500	92393	9.5	3.831	32	8.0	34.6	0.3	0.004	24022	21756	pg176_o2nofp.cx10a_c8r32
999	24169	0	0.0	51.7	3.5	0.000	0.000	0.052	3.540	92531	9.7	3.829	32	8.0	34.7	0.3	0.004	23852	22301	pg18rc1_o2nofp.cx10b_c8r32
999	23710	0	0.0	51.5	3.4	0.000	0.000	0.052	3.512	90842	9.7	3.831	33	8.0	34.6	0.3	0.004	23450	21789	pg18rc1_o2nofp.cx10c_c8r32
999	23921	0	0.0	51.7	3.5	0.000	0.000	0.052	3.539	91639	9.8	3.831	33	8.0	34.7	0.3	0.005	23675	21981	pg18rc1_o2nofp.cx10d_c8r32
qp1000.L6
qp1000.L6: point queries with 1000 insert/s per client. Graphs for performance per 1-second interval are here.
Average throughput:
Query response time histogram: each cell has the percentage of responses that take <= the time in the header and max is the max response time in seconds. For max values in the top 25% of the range have a red background and in the bottom 25% of the range have a green background. The red background is not used when the min value is within 80% of the max value.
| dbms | 256us | 1ms | 4ms | 16ms | 64ms | 256ms | 1s | 4s | 16s | gt | max |
|---|---|---|---|---|---|---|---|---|---|---|---|
| pg176_o2nofp.cx10a_c8r32 | 99.975 | 0.025 | nonzero | 0.001 | |||||||
| pg18rc1_o2nofp.cx10b_c8r32 | 99.973 | 0.027 | nonzero | 0.002 | |||||||
| pg18rc1_o2nofp.cx10c_c8r32 | 99.973 | 0.026 | nonzero | 0.001 | |||||||
| pg18rc1_o2nofp.cx10d_c8r32 | 99.971 | 0.029 | nonzero | 0.002 |
Insert response time histogram: each cell has the percentage of responses that take <= the time in the header and max is the max response time in seconds. For max values in the top 25% of the range have a red background and in the bottom 25% of the range have a green background. The red background is not used when the min value is within 80% of the max value.
| dbms | 256us | 1ms | 4ms | 16ms | 64ms | 256ms | 1s | 4s | 16s | gt | max |
|---|---|---|---|---|---|---|---|---|---|---|---|
| pg176_o2nofp.cx10a_c8r32 | 67.389 | 32.606 | 0.006 | 0.015 | |||||||
| pg18rc1_o2nofp.cx10b_c8r32 | 75.586 | 24.397 | 0.011 | 0.006 | 0.017 | ||||||
| pg18rc1_o2nofp.cx10c_c8r32 | 73.717 | 26.272 | 0.006 | 0.006 | 0.018 | ||||||
| pg18rc1_o2nofp.cx10d_c8r32 | 74.739 | 25.250 | 0.008 | 0.003 | 0.019 |
Delete response time histogram: each cell has the percentage of responses that take <= the time in the header and max is the max response time in seconds. For max values in the top 25% of the range have a red background and in the bottom 25% of the range have a green background. The red background is not used when the min value is within 80% of the max value.
| dbms | 256us | 1ms | 4ms | 16ms | 64ms | 256ms | 1s | 4s | 16s | gt | max |
|---|---|---|---|---|---|---|---|---|---|---|---|
| pg176_o2nofp.cx10a_c8r32 | 0.019 | 14.503 | 79.469 | 6.008 | 0.013 | ||||||
| pg18rc1_o2nofp.cx10b_c8r32 | 0.061 | 26.050 | 72.247 | 1.639 | 0.003 | 0.017 | |||||
| pg18rc1_o2nofp.cx10c_c8r32 | 0.075 | 24.056 | 73.997 | 1.867 | 0.006 | 0.017 | |||||
| pg18rc1_o2nofp.cx10d_c8r32 | 0.128 | 24.069 | 73.781 | 2.019 | 0.003 | 0.017 |
Performance metrics for the DBMS listed above. Some are normalized by throughput, others are not. Legend for results is here.
ips	qps	rps	rmbps	wps	wmbps	rpq	rkbpq	wpi	wkbpi	csps	cpups	cspq	cpupq	dbgb1	dbgb2	rss	maxop	p50	p99	tag
999	13036	0	0.0	41.6	3.5	0.000	0.000	0.042	3.612	50627	10.9	3.884	67	8.1	31.9	0.3	0.001	13054	12878	pg176_o2nofp.cx10a_c8r32
999	13024	0	0.0	41.5	3.6	0.000	0.000	0.042	3.640	50556	10.7	3.882	66	8.0	31.9	0.2	0.002	13038	12842	pg18rc1_o2nofp.cx10b_c8r32
999	13022	0	0.0	41.4	3.5	0.000	0.000	0.041	3.625	50575	10.8	3.884	66	8.0	31.8	0.2	0.001	13038	12861	pg18rc1_o2nofp.cx10c_c8r32
999	12945	0	0.0	41.4	3.5	0.000	0.000	0.041	3.630	50282	10.7	3.884	66	8.0	31.9	0.2	0.002	12959	12782	pg18rc1_o2nofp.cx10d_c8r32
l.i0
l.i0: load without secondary indexes
Performance metrics for all DBMS, not just the ones listed above. Some are normalized by throughput, others are not. Legend for results is here.
ips	qps	rps	rmbps	wps	wmbps	rpq	rkbpq	wpi	wkbpi	csps	cpups	cspq	cpupq	dbgb1	dbgb2	rss	maxop	p50	p99	tag
211268	0	0	0.0	784.8	89.3	0.000	0.000	0.004	0.433	22551	19.9	0.107	8	2.9	7.8	2.4	0.012	211764	204182	pg176_o2nofp.cx10a_c8r32
205479	0	0	0.0	761.8	86.6	0.000	0.000	0.004	0.431	22049	19.6	0.107	8	2.9	7.8	0.6	0.003	206164	199573	pg18rc1_o2nofp.cx10b_c8r32
202703	0	0	0.0	757.1	86.0	0.000	0.000	0.004	0.435	21833	19.6	0.108	8	2.9	7.8	2.4	0.009	204777	197748	pg18rc1_o2nofp.cx10c_c8r32
205479	0	0	0.0	763.3	86.7	0.000	0.000	0.004	0.432	22004	19.8	0.107	8	2.9	7.8	1.8	0.013	206678	198577	pg18rc1_o2nofp.cx10d_c8r32
l.x
l.x: create secondary indexes
Performance metrics for all DBMS, not just the ones listed above. Some are normalized by throughput, others are not. Legend for results is here.
ips	qps	rps	rmbps	wps	wmbps	rpq	rkbpq	wpi	wkbpi	csps	cpups	cspq	cpupq	dbgb1	dbgb2	rss	maxop	p50	p99	tag
500002	0	1	0.0	1123.5	138.2	0.000	0.000	0.002	0.283	3452	11.8	0.007	2	5.8	13.3	3.0	0.001	NA	NA	pg176_o2nofp.cx10a_c8r32
508476	0	0	0.0	915.3	112.5	0.000	0.000	0.002	0.227	2822	12.0	0.006	2	5.8	13.3	3.0	0.002	NA	NA	pg18rc1_o2nofp.cx10b_c8r32
500002	0	0	0.0	895.0	110.1	0.000	0.000	0.002	0.225	2664	12.1	0.005	2	5.8	13.3	3.0	0.002	NA	NA	pg18rc1_o2nofp.cx10c_c8r32
500002	0	1	0.0	921.2	113.3	0.000	0.000	0.002	0.232	2720	12.1	0.005	2	5.8	13.3	3.0	0.001	NA	NA	pg18rc1_o2nofp.cx10d_c8r32
l.i1
l.i1: continue load after secondary indexes created with 50 inserts per transaction
Performance metrics for all DBMS, not just the ones listed above. Some are normalized by throughput, others are not. Legend for results is here.
ips	qps	rps	rmbps	wps	wmbps	rpq	rkbpq	wpi	wkbpi	csps	cpups	cspq	cpupq	dbgb1	dbgb2	rss	maxop	p50	p99	tag
21834	0	0	0.0	261.6	29.6	0.000	0.000	0.012	1.388	9081	20.3	0.416	74	7.8	38.3	2.0	0.035	16647	12048	pg176_o2nofp.cx10a_c8r32
22409	0	0	0.0	282.1	31.1	0.000	0.000	0.013	1.420	9319	20.4	0.416	73	7.8	38.3	5.8	0.038	17147	12148	pg18rc1_o2nofp.cx10b_c8r32
22359	0	0	0.0	281.0	31.0	0.000	0.000	0.013	1.419	9408	20.4	0.421	73	7.8	38.3	7.7	0.072	17048	11998	pg18rc1_o2nofp.cx10c_c8r32
22099	0	0	0.0	277.7	30.6	0.000	0.000	0.013	1.416	9212	20.2	0.417	73	7.8	38.3	6.6	0.045	16847	12098	pg18rc1_o2nofp.cx10d_c8r32
l.i2
l.i2: continue load after secondary indexes created with 5 inserts per transaction
Performance metrics for all DBMS, not just the ones listed above. Some are normalized by throughput, others are not. Legend for results is here.
ips	qps	rps	rmbps	wps	wmbps	rpq	rkbpq	wpi	wkbpi	csps	cpups	cspq	cpupq	dbgb1	dbgb2	rss	maxop	p50	p99	tag
2796	0	0	0.0	60.2	6.0	0.000	0.000	0.022	2.188	10502	15.3	3.757	438	7.9	40.2	0.4	0.001	2045	1415	pg176_o2nofp.cx10a_c8r32
2837	0	0	0.0	60.8	6.0	0.000	0.000	0.021	2.176	10670	15.3	3.761	431	7.9	40.2	0.3	0.002	2105	1365	pg18rc1_o2nofp.cx10b_c8r32
2946	0	0	0.0	62.9	6.3	0.000	0.000	0.021	2.182	11141	15.4	3.783	418	7.9	40.5	6.7	0.020	2215	1480	pg18rc1_o2nofp.cx10c_c8r32
2810	0	0	0.0	60.4	6.0	0.000	0.000	0.022	2.192	10637	15.4	3.785	438	7.9	40.3	7.9	0.002	2045	1450	pg18rc1_o2nofp.cx10d_c8r32
qr100.L1
qr100.L1: range queries with 100 insert/s per client
Performance metrics for all DBMS, not just the ones listed above. Some are normalized by throughput, others are not. Legend for results is here.
ips	qps	rps	rmbps	wps	wmbps	rpq	rkbpq	wpi	wkbpi	csps	cpups	cspq	cpupq	dbgb1	dbgb2	rss	maxop	p50	p99	tag
100	26623	0	0.0	12.2	0.8	0.000	0.000	0.122	7.731	101633	8.2	3.817	25	7.9	40.2	0.1	0.001	26635	26221	pg176_o2nofp.cx10a_c8r32
100	26696	0	0.0	12.2	0.8	0.000	0.000	0.122	7.754	101849	8.1	3.815	24	7.9	40.2	0.1	0.001	26712	26266	pg18rc1_o2nofp.cx10b_c8r32
100	26561	0	0.0	12.0	0.8	0.000	0.000	0.120	7.721	101338	8.3	3.815	25	7.9	40.5	0.1	0.001	26556	26169	pg18rc1_o2nofp.cx10c_c8r32
100	26256	0	0.0	12.3	0.8	0.000	0.000	0.123	7.727	100179	8.6	3.815	26	7.9	40.3	0.1	0.001	26267	25836	pg18rc1_o2nofp.cx10d_c8r32
qp100.L2
qp100.L2: point queries with 100 insert/s per client
Performance metrics for all DBMS, not just the ones listed above. Some are normalized by throughput, others are not. Legend for results is here.
ips	qps	rps	rmbps	wps	wmbps	rpq	rkbpq	wpi	wkbpi	csps	cpups	cspq	cpupq	dbgb1	dbgb2	rss	maxop	p50	p99	tag
100	13151	0	0.0	58.8	1.6	0.000	0.000	0.589	16.775	50783	10.1	3.862	61	7.9	40.2	0.1	0.001	13166	13054	pg176_o2nofp.cx10a_c8r32
100	13103	0	0.0	58.8	1.6	0.000	0.000	0.589	16.810	50569	9.9	3.859	60	7.9	40.2	0.1	0.001	13102	13002	pg18rc1_o2nofp.cx10b_c8r32
100	13095	0	0.0	58.6	1.6	0.000	0.000	0.587	16.784	50537	10.1	3.859	62	7.9	40.2	0.1	0.001	13102	13002	pg18rc1_o2nofp.cx10c_c8r32
100	13098	0	0.0	58.8	1.6	0.000	0.000	0.589	16.792	50566	9.9	3.861	60	7.9	40.2	0.1	0.001	13102	13002	pg18rc1_o2nofp.cx10d_c8r32
qr500.L3
qr500.L3: range queries with 500 insert/s per client
Performance metrics for all DBMS, not just the ones listed above. Some are normalized by throughput, others are not. Legend for results is here.
ips	qps	rps	rmbps	wps	wmbps	rpq	rkbpq	wpi	wkbpi	csps	cpups	cspq	cpupq	dbgb1	dbgb2	rss	maxop	p50	p99	tag
499	24084	0	0.0	66.7	2.3	0.000	0.000	0.134	4.628	92079	9.2	3.823	31	7.9	39.0	0.3	0.002	24061	22604	pg176_o2nofp.cx10a_c8r32
500	24109	0	0.0	66.7	2.3	0.000	0.000	0.134	4.633	92125	9.2	3.821	31	7.9	39.0	0.3	0.002	24076	22652	pg18rc1_o2nofp.cx10b_c8r32
500	23833	0	0.0	67.1	2.3	0.000	0.000	0.134	4.672	91076	9.4	3.821	32	8.0	39.1	0.4	0.002	23816	22429	pg18rc1_o2nofp.cx10c_c8r32
500	23936	0	0.0	66.8	2.2	0.000	0.000	0.134	4.608	91465	9.2	3.821	31	7.9	39.0	0.3	0.004	23963	22508	pg18rc1_o2nofp.cx10d_c8r32
qp500.L4
qp500.L4: point queries with 500 insert/s per client
Performance metrics for all DBMS, not just the ones listed above. Some are normalized by throughput, others are not. Legend for results is here.
ips	qps	rps	rmbps	wps	wmbps	rpq	rkbpq	wpi	wkbpi	csps	cpups	cspq	cpupq	dbgb1	dbgb2	rss	maxop	p50	p99	tag
499	13160	0	0.0	41.9	3.0	0.000	0.000	0.084	6.082	50925	10.5	3.870	64	8.0	36.9	0.3	0.002	13181	13006	pg176_o2nofp.cx10a_c8r32
500	13165	0	0.0	41.7	2.9	0.000	0.000	0.083	6.030	50914	10.5	3.867	64	7.9	36.9	0.2	0.001	13180	13022	pg18rc1_o2nofp.cx10b_c8r32
500	13060	0	0.0	41.7	2.9	0.000	0.000	0.083	6.035	50508	10.5	3.868	64	8.0	37.0	0.2	0.002	13070	12926	pg18rc1_o2nofp.cx10c_c8r32
499	13062	0	0.0	41.8	3.0	0.000	0.000	0.084	6.057	50548	10.5	3.870	64	7.9	36.9	0.2	0.035	13081	12941	pg18rc1_o2nofp.cx10d_c8r32
qr1000.L5
qr1000.L5: range queries with 1000 insert/s per client
Performance metrics for all DBMS, not just the ones listed above. Some are normalized by throughput, others are not. Legend for results is here.
ips	qps	rps	rmbps	wps	wmbps	rpq	rkbpq	wpi	wkbpi	csps	cpups	cspq	cpupq	dbgb1	dbgb2	rss	maxop	p50	p99	tag
999	24119	0	0.0	50.6	3.4	0.000	0.000	0.051	3.500	92393	9.5	3.831	32	8.0	34.6	0.3	0.004	24022	21756	pg176_o2nofp.cx10a_c8r32
999	24169	0	0.0	51.7	3.5	0.000	0.000	0.052	3.540	92531	9.7	3.829	32	8.0	34.7	0.3	0.004	23852	22301	pg18rc1_o2nofp.cx10b_c8r32
999	23710	0	0.0	51.5	3.4	0.000	0.000	0.052	3.512	90842	9.7	3.831	33	8.0	34.6	0.3	0.004	23450	21789	pg18rc1_o2nofp.cx10c_c8r32
999	23921	0	0.0	51.7	3.5	0.000	0.000	0.052	3.539	91639	9.8	3.831	33	8.0	34.7	0.3	0.005	23675	21981	pg18rc1_o2nofp.cx10d_c8r32
qp1000.L6
qp1000.L6: point queries with 1000 insert/s per client
Performance metrics for all DBMS, not just the ones listed above. Some are normalized by throughput, others are not. Legend for results is here.
ips	qps	rps	rmbps	wps	wmbps	rpq	rkbpq	wpi	wkbpi	csps	cpups	cspq	cpupq	dbgb1	dbgb2	rss	maxop	p50	p99	tag
999	13036	0	0.0	41.6	3.5	0.000	0.000	0.042	3.612	50627	10.9	3.884	67	8.1	31.9	0.3	0.001	13054	12878	pg176_o2nofp.cx10a_c8r32
999	13024	0	0.0	41.5	3.6	0.000	0.000	0.042	3.640	50556	10.7	3.882	66	8.0	31.9	0.2	0.002	13038	12842	pg18rc1_o2nofp.cx10b_c8r32
999	13022	0	0.0	41.4	3.5	0.000	0.000	0.041	3.625	50575	10.8	3.884	66	8.0	31.8	0.2	0.001	13038	12861	pg18rc1_o2nofp.cx10c_c8r32
999	12945	0	0.0	41.4	3.5	0.000	0.000	0.041	3.630	50282	10.7	3.884	66	8.0	31.9	0.2	0.002	12959	12782	pg18rc1_o2nofp.cx10d_c8r32
l.i0
- l.i0: load without secondary indexes
- Legend for results is here.
- Each entry lists the percentage of responses that fit in that bucket (slower than max time for previous bucket, faster than min time for next bucket).
Insert response time histogram
256us	1ms	4ms	16ms	64ms	256ms	1s	4s	16s	gt	max	tag
0.000	99.993	0.006	0.001	0.000	0.000	0.000	0.000	0.000	0.000	0.012	pg176_o2nofp.cx10a_c8r32
0.000	99.991	0.009	0.000	0.000	0.000	0.000	0.000	0.000	0.000	0.003	pg18rc1_o2nofp.cx10b_c8r32
0.000	99.994	0.004	0.002	0.000	0.000	0.000	0.000	0.000	0.000	0.009	pg18rc1_o2nofp.cx10c_c8r32
0.000	99.985	0.013	0.002	0.000	0.000	0.000	0.000	0.000	0.000	0.013	pg18rc1_o2nofp.cx10d_c8r32
l.x
- l.x: create secondary indexes
- Legend for results is here.
- Each entry lists the percentage of responses that fit in that bucket (slower than max time for previous bucket, faster than min time for next bucket).
TODO - determine whether there is data for create index response time
l.i1
- l.i1: continue load after secondary indexes created with 50 inserts per transaction
- Legend for results is here.
- Each entry lists the percentage of responses that fit in that bucket (slower than max time for previous bucket, faster than min time for next bucket).
Insert response time histogram
256us	1ms	4ms	16ms	64ms	256ms	1s	4s	16s	gt	max	tag
0.000	48.585	51.413	0.001	nonzero	0.000	0.000	0.000	0.000	0.000	0.035	pg176_o2nofp.cx10a_c8r32
0.000	49.830	50.169	nonzero	0.001	0.000	0.000	0.000	0.000	0.000	0.038	pg18rc1_o2nofp.cx10b_c8r32
0.000	49.244	50.742	0.008	0.005	0.001	0.000	0.000	0.000	0.000	0.072	pg18rc1_o2nofp.cx10c_c8r32
0.000	49.356	50.643	nonzero	0.001	0.000	0.000	0.000	0.000	0.000	0.045	pg18rc1_o2nofp.cx10d_c8r32
Delete response time histogram
256us	1ms	4ms	16ms	64ms	256ms	1s	4s	16s	gt	max	tag
0.001	24.944	72.647	2.405	0.002	0.000	0.000	0.000	0.000	0.000	0.042	pg176_o2nofp.cx10a_c8r32
0.001	26.319	71.909	1.769	0.001	0.000	0.000	0.000	0.000	0.000	0.045	pg18rc1_o2nofp.cx10b_c8r32
nonzero	26.803	71.772	1.417	0.006	0.001	0.000	0.000	0.000	0.000	0.077	pg18rc1_o2nofp.cx10c_c8r32
0.001	25.836	72.089	2.074	0.001	0.000	0.000	0.000	0.000	0.000	0.045	pg18rc1_o2nofp.cx10d_c8r32
l.i2
- l.i2: continue load after secondary indexes created with 5 inserts per transaction
- Legend for results is here.
- Each entry lists the percentage of responses that fit in that bucket (slower than max time for previous bucket, faster than min time for next bucket).
Insert response time histogram
256us	1ms	4ms	16ms	64ms	256ms	1s	4s	16s	gt	max	tag
51.893	48.107	nonzero	0.000	0.000	0.000	0.000	0.000	0.000	0.000	0.001	pg176_o2nofp.cx10a_c8r32
53.072	46.927	0.001	0.000	0.000	0.000	0.000	0.000	0.000	0.000	0.002	pg18rc1_o2nofp.cx10b_c8r32
53.190	46.810	nonzero	0.000	nonzero	0.000	0.000	0.000	0.000	0.000	0.020	pg18rc1_o2nofp.cx10c_c8r32
49.276	50.724	nonzero	0.000	0.000	0.000	0.000	0.000	0.000	0.000	0.002	pg18rc1_o2nofp.cx10d_c8r32
Delete response time histogram
256us	1ms	4ms	16ms	64ms	256ms	1s	4s	16s	gt	max	tag
4.441	22.425	73.101	0.033	0.000	0.000	0.000	0.000	0.000	0.000	0.013	pg176_o2nofp.cx10a_c8r32
4.377	22.253	73.326	0.043	0.000	0.000	0.000	0.000	0.000	0.000	0.013	pg18rc1_o2nofp.cx10b_c8r32
4.036	25.328	70.613	0.022	nonzero	0.000	0.000	0.000	0.000	0.000	0.020	pg18rc1_o2nofp.cx10c_c8r32
4.307	27.052	68.599	0.042	0.000	0.000	0.000	0.000	0.000	0.000	0.013	pg18rc1_o2nofp.cx10d_c8r32
qr100.L1
- qr100.L1: range queries with 100 insert/s per client
- Legend for results is here.
- Each entry lists the percentage of responses that fit in that bucket (slower than max time for previous bucket, faster than min time for next bucket).
Query response time histogram
256us	1ms	4ms	16ms	64ms	256ms	1s	4s	16s	gt	max	tag
99.994	0.006	nonzero	0.000	0.000	0.000	0.000	0.000	0.000	0.000	0.001	pg176_o2nofp.cx10a_c8r32
99.993	0.007	nonzero	0.000	0.000	0.000	0.000	0.000	0.000	0.000	0.001	pg18rc1_o2nofp.cx10b_c8r32
99.993	0.007	nonzero	0.000	0.000	0.000	0.000	0.000	0.000	0.000	0.001	pg18rc1_o2nofp.cx10c_c8r32
99.993	0.007	0.000	0.000	0.000	0.000	0.000	0.000	0.000	0.000	0.001	pg18rc1_o2nofp.cx10d_c8r32
Insert response time histogram
256us	1ms	4ms	16ms	64ms	256ms	1s	4s	16s	gt	max	tag
0.000	21.194	78.778	0.028	0.000	0.000	0.000	0.000	0.000	0.000	0.004	pg176_o2nofp.cx10a_c8r32
0.000	26.111	73.861	0.028	0.000	0.000	0.000	0.000	0.000	0.000	0.005	pg18rc1_o2nofp.cx10b_c8r32
0.000	27.333	72.639	0.028	0.000	0.000	0.000	0.000	0.000	0.000	0.005	pg18rc1_o2nofp.cx10c_c8r32
0.000	28.528	71.444	0.028	0.000	0.000	0.000	0.000	0.000	0.000	0.005	pg18rc1_o2nofp.cx10d_c8r32
Delete response time histogram
256us	1ms	4ms	16ms	64ms	256ms	1s	4s	16s	gt	max	tag
0.028	65.806	34.167	0.000	0.000	0.000	0.000	0.000	0.000	0.000	0.002	pg176_o2nofp.cx10a_c8r32
0.000	64.806	35.194	0.000	0.000	0.000	0.000	0.000	0.000	0.000	0.002	pg18rc1_o2nofp.cx10b_c8r32
0.000	62.861	37.139	0.000	0.000	0.000	0.000	0.000	0.000	0.000	0.002	pg18rc1_o2nofp.cx10c_c8r32
0.000	62.833	37.167	0.000	0.000	0.000	0.000	0.000	0.000	0.000	0.002	pg18rc1_o2nofp.cx10d_c8r32
qp100.L2
- qp100.L2: point queries with 100 insert/s per client
- Legend for results is here.
- Each entry lists the percentage of responses that fit in that bucket (slower than max time for previous bucket, faster than min time for next bucket).
Query response time histogram
256us	1ms	4ms	16ms	64ms	256ms	1s	4s	16s	gt	max	tag
99.986	0.014	0.000	0.000	0.000	0.000	0.000	0.000	0.000	0.000	0.001	pg176_o2nofp.cx10a_c8r32
99.984	0.016	0.000	0.000	0.000	0.000	0.000	0.000	0.000	0.000	0.001	pg18rc1_o2nofp.cx10b_c8r32
99.985	0.015	nonzero	0.000	0.000	0.000	0.000	0.000	0.000	0.000	0.001	pg18rc1_o2nofp.cx10c_c8r32
99.983	0.017	0.000	0.000	0.000	0.000	0.000	0.000	0.000	0.000	0.001	pg18rc1_o2nofp.cx10d_c8r32
Insert response time histogram
256us	1ms	4ms	16ms	64ms	256ms	1s	4s	16s	gt	max	tag
0.000	1.833	98.139	0.028	0.000	0.000	0.000	0.000	0.000	0.000	0.004	pg176_o2nofp.cx10a_c8r32
0.000	4.611	95.361	0.028	0.000	0.000	0.000	0.000	0.000	0.000	0.005	pg18rc1_o2nofp.cx10b_c8r32
0.000	2.083	97.889	0.028	0.000	0.000	0.000	0.000	0.000	0.000	0.005	pg18rc1_o2nofp.cx10c_c8r32
0.000	4.222	95.750	0.028	0.000	0.000	0.000	0.000	0.000	0.000	0.004	pg18rc1_o2nofp.cx10d_c8r32
Delete response time histogram
256us	1ms	4ms	16ms	64ms	256ms	1s	4s	16s	gt	max	tag
0.000	22.722	77.278	0.000	0.000	0.000	0.000	0.000	0.000	0.000	0.004	pg176_o2nofp.cx10a_c8r32
0.000	17.750	82.250	0.000	0.000	0.000	0.000	0.000	0.000	0.000	0.003	pg18rc1_o2nofp.cx10b_c8r32
0.000	12.667	87.333	0.000	0.000	0.000	0.000	0.000	0.000	0.000	0.003	pg18rc1_o2nofp.cx10c_c8r32
0.000	30.222	69.750	0.028	0.000	0.000	0.000	0.000	0.000	0.000	0.004	pg18rc1_o2nofp.cx10d_c8r32
qr500.L3
- qr500.L3: range queries with 500 insert/s per client
- Legend for results is here.
- Each entry lists the percentage of responses that fit in that bucket (slower than max time for previous bucket, faster than min time for next bucket).
Query response time histogram
256us	1ms	4ms	16ms	64ms	256ms	1s	4s	16s	gt	max	tag
99.991	0.009	nonzero	0.000	0.000	0.000	0.000	0.000	0.000	0.000	0.002	pg176_o2nofp.cx10a_c8r32
99.990	0.010	nonzero	0.000	0.000	0.000	0.000	0.000	0.000	0.000	0.002	pg18rc1_o2nofp.cx10b_c8r32
99.990	0.010	nonzero	0.000	0.000	0.000	0.000	0.000	0.000	0.000	0.002	pg18rc1_o2nofp.cx10c_c8r32
99.990	0.010	nonzero	nonzero	0.000	0.000	0.000	0.000	0.000	0.000	0.004	pg18rc1_o2nofp.cx10d_c8r32
Insert response time histogram
256us	1ms	4ms	16ms	64ms	256ms	1s	4s	16s	gt	max	tag
0.000	71.972	28.022	0.006	0.000	0.000	0.000	0.000	0.000	0.000	0.005	pg176_o2nofp.cx10a_c8r32
0.000	74.700	25.294	0.006	0.000	0.000	0.000	0.000	0.000	0.000	0.004	pg18rc1_o2nofp.cx10b_c8r32
0.000	70.022	29.972	0.006	0.000	0.000	0.000	0.000	0.000	0.000	0.005	pg18rc1_o2nofp.cx10c_c8r32
0.000	74.067	25.928	0.006	0.000	0.000	0.000	0.000	0.000	0.000	0.005	pg18rc1_o2nofp.cx10d_c8r32
Delete response time histogram
256us	1ms	4ms	16ms	64ms	256ms	1s	4s	16s	gt	max	tag
0.000	4.133	92.728	3.139	0.000	0.000	0.000	0.000	0.000	0.000	0.005	pg176_o2nofp.cx10a_c8r32
0.000	2.122	96.133	1.744	0.000	0.000	0.000	0.000	0.000	0.000	0.005	pg18rc1_o2nofp.cx10b_c8r32
0.000	1.761	96.383	1.856	0.000	0.000	0.000	0.000	0.000	0.000	0.005	pg18rc1_o2nofp.cx10c_c8r32
0.000	2.950	95.167	1.883	0.000	0.000	0.000	0.000	0.000	0.000	0.005	pg18rc1_o2nofp.cx10d_c8r32
qp500.L4
- qp500.L4: point queries with 500 insert/s per client
- Legend for results is here.
- Each entry lists the percentage of responses that fit in that bucket (slower than max time for previous bucket, faster than min time for next bucket).
Query response time histogram
256us	1ms	4ms	16ms	64ms	256ms	1s	4s	16s	gt	max	tag
99.979	0.021	nonzero	0.000	0.000	0.000	0.000	0.000	0.000	0.000	0.002	pg176_o2nofp.cx10a_c8r32
99.976	0.024	nonzero	0.000	0.000	0.000	0.000	0.000	0.000	0.000	0.001	pg18rc1_o2nofp.cx10b_c8r32
99.977	0.023	nonzero	0.000	0.000	0.000	0.000	0.000	0.000	0.000	0.002	pg18rc1_o2nofp.cx10c_c8r32
99.974	0.026	nonzero	0.000	nonzero	0.000	0.000	0.000	0.000	0.000	0.035	pg18rc1_o2nofp.cx10d_c8r32
Insert response time histogram
256us	1ms	4ms	16ms	64ms	256ms	1s	4s	16s	gt	max	tag
0.000	69.733	30.233	0.033	0.000	0.000	0.000	0.000	0.000	0.000	0.015	pg176_o2nofp.cx10a_c8r32
0.000	73.739	26.239	0.022	0.000	0.000	0.000	0.000	0.000	0.000	0.013	pg18rc1_o2nofp.cx10b_c8r32
0.000	72.544	27.422	0.028	0.006	0.000	0.000	0.000	0.000	0.000	0.020	pg18rc1_o2nofp.cx10c_c8r32
0.000	73.939	26.039	0.011	0.011	0.000	0.000	0.000	0.000	0.000	0.017	pg18rc1_o2nofp.cx10d_c8r32
Delete response time histogram
256us	1ms	4ms	16ms	64ms	256ms	1s	4s	16s	gt	max	tag
0.072	29.583	60.911	9.433	0.000	0.000	0.000	0.000	0.000	0.000	0.014	pg176_o2nofp.cx10a_c8r32
0.122	27.767	69.756	2.356	0.000	0.000	0.000	0.000	0.000	0.000	0.012	pg18rc1_o2nofp.cx10b_c8r32
0.144	28.128	68.406	3.317	0.006	0.000	0.000	0.000	0.000	0.000	0.018	pg18rc1_o2nofp.cx10c_c8r32
0.139	24.883	71.878	3.094	0.006	0.000	0.000	0.000	0.000	0.000	0.017	pg18rc1_o2nofp.cx10d_c8r32
qr1000.L5
- qr1000.L5: range queries with 1000 insert/s per client
- Legend for results is here.
- Each entry lists the percentage of responses that fit in that bucket (slower than max time for previous bucket, faster than min time for next bucket).
Query response time histogram
256us	1ms	4ms	16ms	64ms	256ms	1s	4s	16s	gt	max	tag
99.989	0.011	nonzero	0.000	0.000	0.000	0.000	0.000	0.000	0.000	0.004	pg176_o2nofp.cx10a_c8r32
99.988	0.012	nonzero	nonzero	0.000	0.000	0.000	0.000	0.000	0.000	0.004	pg18rc1_o2nofp.cx10b_c8r32
99.988	0.012	nonzero	nonzero	0.000	0.000	0.000	0.000	0.000	0.000	0.004	pg18rc1_o2nofp.cx10c_c8r32
99.987	0.013	nonzero	nonzero	0.000	0.000	0.000	0.000	0.000	0.000	0.005	pg18rc1_o2nofp.cx10d_c8r32
Insert response time histogram
256us	1ms	4ms	16ms	64ms	256ms	1s	4s	16s	gt	max	tag
0.000	73.331	26.667	0.003	0.000	0.000	0.000	0.000	0.000	0.000	0.004	pg176_o2nofp.cx10a_c8r32
0.000	72.708	27.283	0.006	0.003	0.000	0.000	0.000	0.000	0.000	0.018	pg18rc1_o2nofp.cx10b_c8r32
0.000	73.169	26.828	0.003	0.000	0.000	0.000	0.000	0.000	0.000	0.005	pg18rc1_o2nofp.cx10c_c8r32
0.000	72.811	27.186	0.003	0.000	0.000	0.000	0.000	0.000	0.000	0.004	pg18rc1_o2nofp.cx10d_c8r32
Delete response time histogram
256us	1ms	4ms	16ms	64ms	256ms	1s	4s	16s	gt	max	tag
0.050	18.272	77.292	4.386	0.000	0.000	0.000	0.000	0.000	0.000	0.006	pg176_o2nofp.cx10a_c8r32
0.092	13.061	85.622	1.222	0.003	0.000	0.000	0.000	0.000	0.000	0.017	pg18rc1_o2nofp.cx10b_c8r32
0.036	11.753	86.981	1.231	0.000	0.000	0.000	0.000	0.000	0.000	0.007	pg18rc1_o2nofp.cx10c_c8r32
0.072	13.561	85.025	1.342	0.000	0.000	0.000	0.000	0.000	0.000	0.008	pg18rc1_o2nofp.cx10d_c8r32
qp1000.L6
- qp1000.L6: point queries with 1000 insert/s per client
- Legend for results is here.
- Each entry lists the percentage of responses that fit in that bucket (slower than max time for previous bucket, faster than min time for next bucket).
Query response time histogram
256us	1ms	4ms	16ms	64ms	256ms	1s	4s	16s	gt	max	tag
99.975	0.025	nonzero	0.000	0.000	0.000	0.000	0.000	0.000	0.000	0.001	pg176_o2nofp.cx10a_c8r32
99.973	0.027	nonzero	0.000	0.000	0.000	0.000	0.000	0.000	0.000	0.002	pg18rc1_o2nofp.cx10b_c8r32
99.973	0.026	nonzero	0.000	0.000	0.000	0.000	0.000	0.000	0.000	0.001	pg18rc1_o2nofp.cx10c_c8r32
99.971	0.029	nonzero	0.000	0.000	0.000	0.000	0.000	0.000	0.000	0.002	pg18rc1_o2nofp.cx10d_c8r32
Insert response time histogram
256us	1ms	4ms	16ms	64ms	256ms	1s	4s	16s	gt	max	tag
0.000	67.389	32.606	0.006	0.000	0.000	0.000	0.000	0.000	0.000	0.015	pg176_o2nofp.cx10a_c8r32
0.000	75.586	24.397	0.011	0.006	0.000	0.000	0.000	0.000	0.000	0.017	pg18rc1_o2nofp.cx10b_c8r32
0.000	73.717	26.272	0.006	0.006	0.000	0.000	0.000	0.000	0.000	0.018	pg18rc1_o2nofp.cx10c_c8r32
0.000	74.739	25.250	0.008	0.003	0.000	0.000	0.000	0.000	0.000	0.019	pg18rc1_o2nofp.cx10d_c8r32
Delete response time histogram
256us	1ms	4ms	16ms	64ms	256ms	1s	4s	16s	gt	max	tag
0.019	14.503	79.469	6.008	0.000	0.000	0.000	0.000	0.000	0.000	0.013	pg176_o2nofp.cx10a_c8r32
0.061	26.050	72.247	1.639	0.003	0.000	0.000	0.000	0.000	0.000	0.017	pg18rc1_o2nofp.cx10b_c8r32
0.075	24.056	73.997	1.867	0.006	0.000	0.000	0.000	0.000	0.000	0.017	pg18rc1_o2nofp.cx10c_c8r32
0.128	24.069	73.781	2.019	0.003	0.000	0.000	0.000	0.000	0.000	0.017	pg18rc1_o2nofp.cx10d_c8r32