Introduction
This is a report for the insert benchmark with 800M docs and 1 client(s). It is generated by scripts (bash, awk, sed) and Tufte might not be impressed. An overview of the insert benchmark is here and a short update is here. Below, by DBMS, I mean DBMS+version.config. An example is my8020.c10b40 where my means MySQL, 8020 is version 8.0.20 and c10b40 is the name for the configuration file.
The test server has 8 AMD cores, 32G RAM and an NVMe device for the database. The benchmark was run with 1 client and there were 1 or 3 connections per client (1 for queries or inserts without rate limits, 1+1 for rate limited inserts+deletes). It uses 1 table with a table per client. It loads 800M rows per table without secondary indexes, creates 3 secondary indexes per table, then inserts 4m+1m rows per table with a delete per insert to avoid growing the table. It then does 6 read+write tests for 3600s each that do queries as fast as possible with 100,100,500,500,1000,1000 inserts/s and the same for deletes/s per client concurrent with the queries. The database is larger than memory and the working set it not cached for most benchmark steps. Clients and the DBMS share one server.
The tested DBMS are:
- pg176_o2nofp.cx10a_c8r32 - Postgres 17.6 with the x10a_c8r32 config
- pg18rc1_o2nofp.cx10b_c8r32 - Postgres 18 rc1 with the x10b_c8r32 config that uses io_method=sync
- pg18rc1_o2nofp.cx10c_c8r32 - Postgres 18 rc1 with the x10c_c8r32 config that uses io_method=worker
- pg18rc1_o2nofp.cx10d_c8r32 - Postgres 18 rc1 with the x10c_c8r32 config that uses io_method=io_uring
Contents
- Summary
- l.i0: load without secondary indexes
- l.x: create secondary indexes
- l.i1: continue load after secondary indexes created with 50 inserts per transaction
- l.i2: continue load after secondary indexes created with 5 inserts per transaction
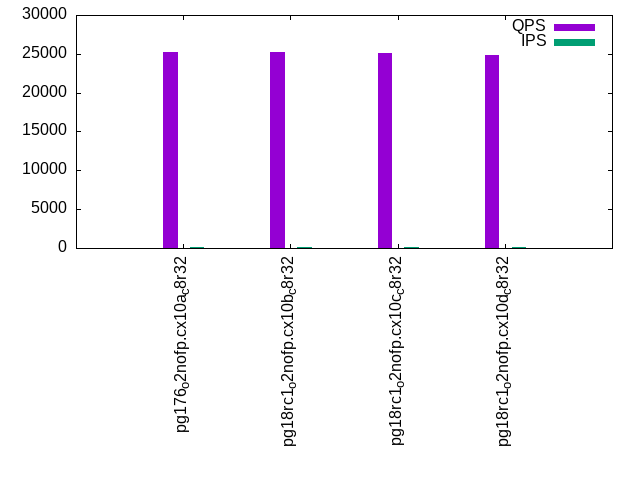
- qr100.L1: range queries with 100 insert/s per client
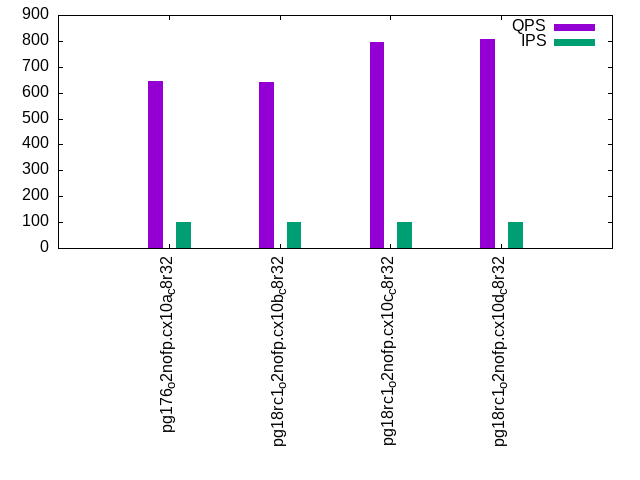
- qp100.L2: point queries with 100 insert/s per client
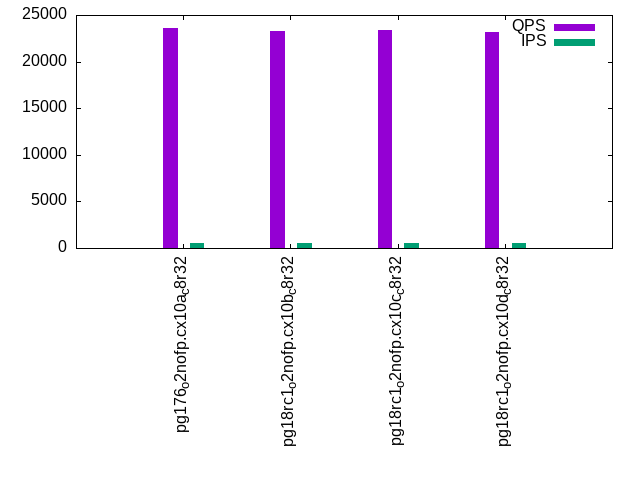
- qr500.L3: range queries with 500 insert/s per client
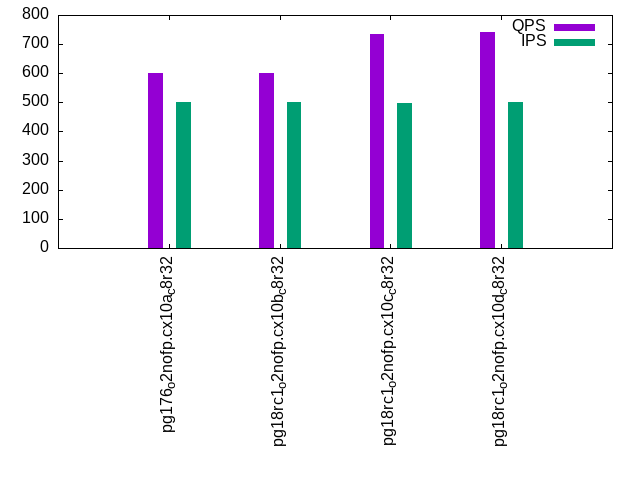
- qp500.L4: point queries with 500 insert/s per client
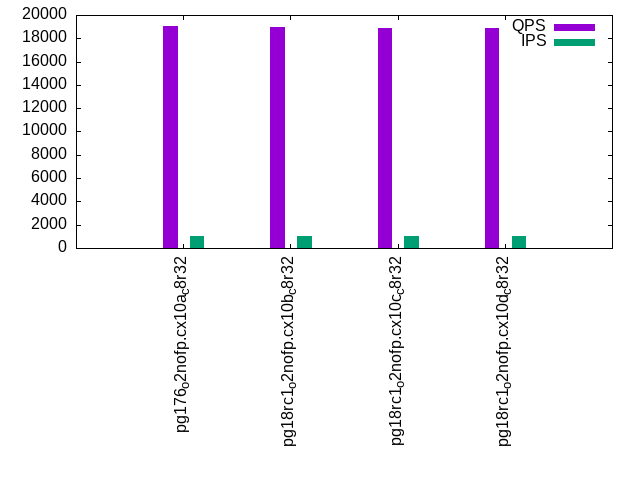
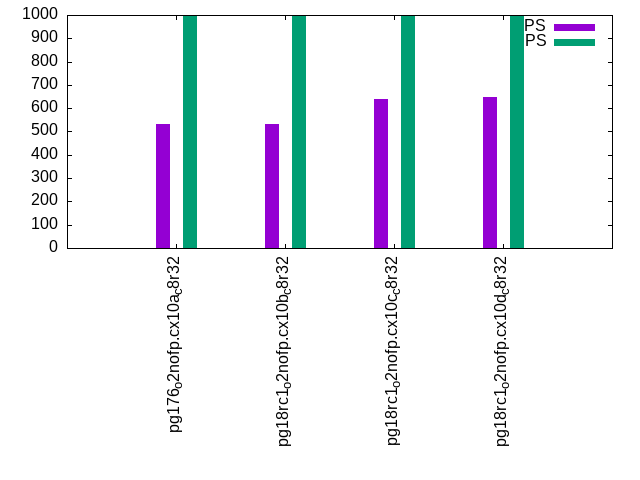
- qr1000.L5: range queries with 1000 insert/s per client
- qp1000.L6: point queries with 1000 insert/s per client
Summary
The numbers are inserts/s for l.i0, l.i1 and l.i2, indexed docs (or rows) /s for l.x and queries/s for qr100, qp100 thru qr1000, qp1000" The values are the average rate over the entire test for inserts (IPS) and queries (QPS). The range of values for IPS and QPS is split into 3 parts: bottom 25%, middle 50%, top 25%. Values in the bottom 25% have a red background, values in the top 25% have a green background and values in the middle have no color. A gray background is used for values that can be ignored because the DBMS did not sustain the target insert rate. Red backgrounds are not used when the minimum value is within 80% of the max value.
| dbms | l.i0 | l.x | l.i1 | l.i2 | qr100 | qp100 | qr500 | qp500 | qr1000 | qp1000 |
|---|---|---|---|---|---|---|---|---|---|---|
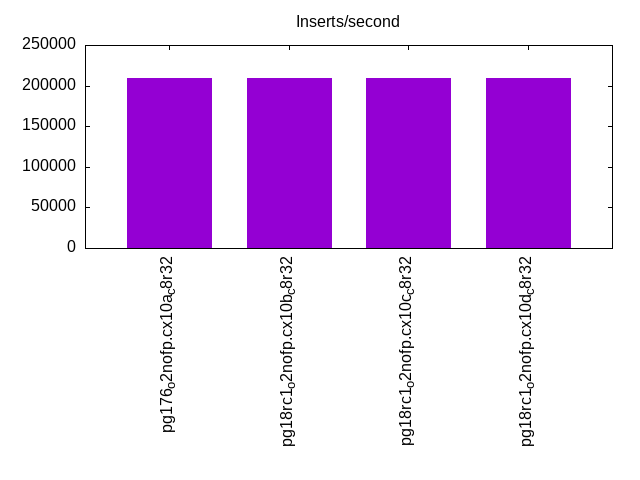
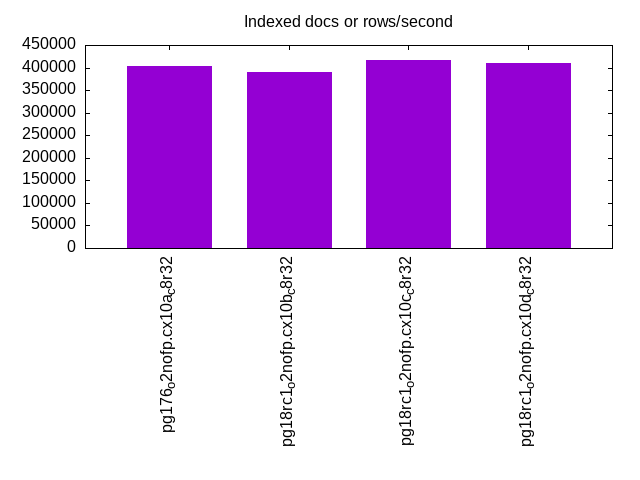
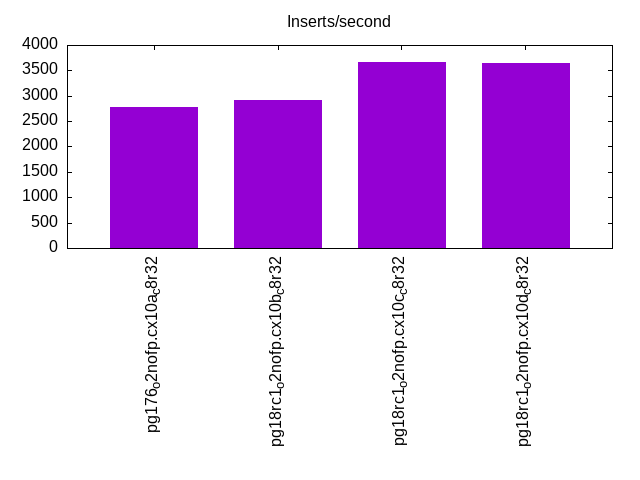
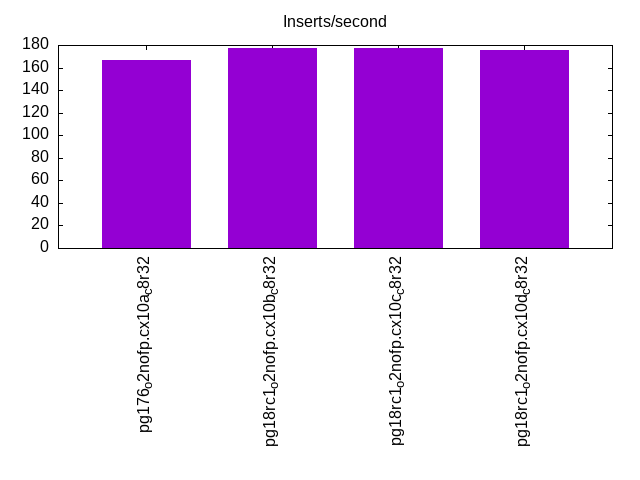
| pg176_o2nofp.cx10a_c8r32 | 209369 | 402820 | 2784 | 167 | 25242 | 644 | 23609 | 601 | 19081 | 531 |
| pg18rc1_o2nofp.cx10b_c8r32 | 209424 | 390434 | 2920 | 177 | 25177 | 643 | 23248 | 602 | 18981 | 531 |
| pg18rc1_o2nofp.cx10c_c8r32 | 209314 | 415800 | 3660 | 177 | 25050 | 794 | 23339 | 735 | 18871 | 640 |
| pg18rc1_o2nofp.cx10d_c8r32 | 209644 | 410467 | 3653 | 176 | 24871 | 808 | 23142 | 740 | 18847 | 646 |
This table has relative throughput, throughput for the DBMS relative to the DBMS in the first line, using the absolute throughput from the previous table. Values less than 0.95 have a yellow background. Values greater than 1.05 have a blue background.
| dbms | l.i0 | l.x | l.i1 | l.i2 | qr100 | qp100 | qr500 | qp500 | qr1000 | qp1000 |
|---|---|---|---|---|---|---|---|---|---|---|
| pg176_o2nofp.cx10a_c8r32 | 1.00 | 1.00 | 1.00 | 1.00 | 1.00 | 1.00 | 1.00 | 1.00 | 1.00 | 1.00 |
| pg18rc1_o2nofp.cx10b_c8r32 | 1.00 | 0.97 | 1.05 | 1.06 | 1.00 | 1.00 | 0.98 | 1.00 | 0.99 | 1.00 |
| pg18rc1_o2nofp.cx10c_c8r32 | 1.00 | 1.03 | 1.31 | 1.06 | 0.99 | 1.23 | 0.99 | 1.22 | 0.99 | 1.21 |
| pg18rc1_o2nofp.cx10d_c8r32 | 1.00 | 1.02 | 1.31 | 1.05 | 0.99 | 1.25 | 0.98 | 1.23 | 0.99 | 1.22 |
This lists the average rate of inserts/s for the tests that do inserts concurrent with queries. For such tests the query rate is listed in the table above. The read+write tests are setup so that the insert rate should match the target rate every second. Cells that are not at least 95% of the target have a red background to indicate a failure to satisfy the target.
| dbms | qr100.L1 | qp100.L2 | qr500.L3 | qp500.L4 | qr1000.L5 | qp1000.L6 |
|---|---|---|---|---|---|---|
| pg176_o2nofp.cx10a_c8r32 | 100 | 100 | 499 | 500 | 999 | 999 |
| pg18rc1_o2nofp.cx10b_c8r32 | 100 | 100 | 500 | 500 | 999 | 999 |
| pg18rc1_o2nofp.cx10c_c8r32 | 100 | 100 | 499 | 499 | 999 | 998 |
| pg18rc1_o2nofp.cx10d_c8r32 | 100 | 100 | 500 | 500 | 999 | 998 |
| target | 100 | 100 | 500 | 500 | 1000 | 1000 |
l.i0
l.i0: load without secondary indexes. Graphs for performance per 1-second interval are here.
Average throughput:
Insert response time histogram: each cell has the percentage of responses that take <= the time in the header and max is the max response time in seconds. For the max column values in the top 25% of the range have a red background and in the bottom 25% of the range have a green background. The red background is not used when the min value is within 80% of the max value.
| dbms | 256us | 1ms | 4ms | 16ms | 64ms | 256ms | 1s | 4s | 16s | gt | max |
|---|---|---|---|---|---|---|---|---|---|---|---|
| pg176_o2nofp.cx10a_c8r32 | 99.970 | 0.026 | 0.004 | nonzero | 0.040 | ||||||
| pg18rc1_o2nofp.cx10b_c8r32 | 99.983 | 0.013 | 0.003 | nonzero | 0.046 | ||||||
| pg18rc1_o2nofp.cx10c_c8r32 | 99.983 | 0.014 | 0.003 | nonzero | 0.048 | ||||||
| pg18rc1_o2nofp.cx10d_c8r32 | 99.984 | 0.013 | 0.003 | nonzero | 0.036 |
Performance metrics for the DBMS listed above. Some are normalized by throughput, others are not. Legend for results is here.
ips	qps	rps	rmbps	wps	wmbps	rpq	rkbpq	wpi	wkbpi	csps	cpups	cspq	cpupq	dbgb1	dbgb2	rss	maxop	p50	p99	tag
209369	0	37	0.3	783.9	86.5	0.000	0.001	0.004	0.423	21090	20.5	0.101	8	76.5	116.6	19.5	0.040	212372	190167	pg176_o2nofp.cx10a_c8r32
209424	0	35	0.3	783.8	86.1	0.000	0.001	0.004	0.421	20830	20.3	0.099	8	76.5	116.6	18.9	0.046	210665	203165	pg18rc1_o2nofp.cx10b_c8r32
209314	0	35	0.3	782.7	86.0	0.000	0.001	0.004	0.421	20940	20.4	0.100	8	76.5	116.6	0.5	0.048	210572	203168	pg18rc1_o2nofp.cx10c_c8r32
209644	0	36	0.3	783.9	86.2	0.000	0.001	0.004	0.421	21004	20.5	0.100	8	76.5	116.6	18.9	0.036	210963	203176	pg18rc1_o2nofp.cx10d_c8r32
l.x
l.x: create secondary indexes.
Average throughput:
Performance metrics for the DBMS listed above. Some are normalized by throughput, others are not. Legend for results is here.
ips	qps	rps	rmbps	wps	wmbps	rpq	rkbpq	wpi	wkbpi	csps	cpups	cspq	cpupq	dbgb1	dbgb2	rss	maxop	p50	p99	tag
402820	0	1097	136.0	1235.3	150.4	0.003	0.346	0.003	0.382	889	12.5	0.002	2	153.6	193.7	23.4	0.002	NA	NA	pg176_o2nofp.cx10a_c8r32
390434	0	1271	141.4	1188.6	145.5	0.003	0.371	0.003	0.382	1105	12.2	0.003	2	153.6	193.7	23.4	0.003	NA	NA	pg18rc1_o2nofp.cx10b_c8r32
415800	0	1296	147.7	1273.2	155.2	0.003	0.364	0.003	0.382	2151	13.1	0.005	3	153.6	193.7	23.4	0.003	NA	NA	pg18rc1_o2nofp.cx10c_c8r32
410467	0	1306	147.2	1261.1	152.9	0.003	0.367	0.003	0.381	1783	13.2	0.004	3	153.6	193.7	23.4	0.002	NA	NA	pg18rc1_o2nofp.cx10d_c8r32
l.i1
l.i1: continue load after secondary indexes created with 50 inserts per transaction. Graphs for performance per 1-second interval are here.
Average throughput:
Insert response time histogram: each cell has the percentage of responses that take <= the time in the header and max is the max response time in seconds. For the max column values in the top 25% of the range have a red background and in the bottom 25% of the range have a green background. The red background is not used when the min value is within 80% of the max value.
| dbms | 256us | 1ms | 4ms | 16ms | 64ms | 256ms | 1s | 4s | 16s | gt | max |
|---|---|---|---|---|---|---|---|---|---|---|---|
| pg176_o2nofp.cx10a_c8r32 | 88.950 | 9.428 | 1.620 | 0.003 | 0.306 | ||||||
| pg18rc1_o2nofp.cx10b_c8r32 | 90.565 | 7.329 | 2.103 | 0.004 | 0.307 | ||||||
| pg18rc1_o2nofp.cx10c_c8r32 | 98.170 | 1.706 | 0.124 | 0.112 | |||||||
| pg18rc1_o2nofp.cx10d_c8r32 | 98.112 | 1.773 | 0.115 | 0.127 |
Delete response time histogram: each cell has the percentage of responses that take <= the time in the header and max is the max response time in seconds. For the max column values in the top 25% of the range have a red background and in the bottom 25% of the range have a green background. The red background is not used when the min value is within 80% of the max value.
| dbms | 256us | 1ms | 4ms | 16ms | 64ms | 256ms | 1s | 4s | 16s | gt | max |
|---|---|---|---|---|---|---|---|---|---|---|---|
| pg176_o2nofp.cx10a_c8r32 | 1.333 | 17.445 | 41.185 | 40.038 | 0.029 | ||||||
| pg18rc1_o2nofp.cx10b_c8r32 | 1.609 | 17.434 | 43.366 | 37.591 | 0.030 | ||||||
| pg18rc1_o2nofp.cx10c_c8r32 | 0.715 | 17.534 | 44.927 | 36.824 | 0.031 | ||||||
| pg18rc1_o2nofp.cx10d_c8r32 | 0.532 | 18.982 | 42.712 | 37.773 | 0.032 |
Performance metrics for the DBMS listed above. Some are normalized by throughput, others are not. Legend for results is here.
ips	qps	rps	rmbps	wps	wmbps	rpq	rkbpq	wpi	wkbpi	csps	cpups	cspq	cpupq	dbgb1	dbgb2	rss	maxop	p50	p99	tag
2784	0	3991	31.5	3293.7	56.4	1.434	11.573	1.183	20.739	8998	12.0	3.232	345	154.3	194.3	22.8	0.306	2400	650	pg176_o2nofp.cx10a_c8r32
2920	0	4193	33.0	3480.1	59.6	1.436	11.587	1.192	20.911	9422	12.2	3.227	334	154.3	194.3	22.8	0.307	2500	650	pg18rc1_o2nofp.cx10b_c8r32
3660	0	5264	41.5	4357.5	74.8	1.438	11.606	1.191	20.929	11805	15.2	3.226	332	154.3	194.3	22.9	0.112	2850	1450	pg18rc1_o2nofp.cx10c_c8r32
3653	0	5261	41.4	4358.8	74.8	1.440	11.619	1.193	20.975	11802	15.2	3.231	333	154.3	194.3	23.0	0.127	2899	1800	pg18rc1_o2nofp.cx10d_c8r32
l.i2
l.i2: continue load after secondary indexes created with 5 inserts per transaction. Graphs for performance per 1-second interval are here.
Average throughput:
Insert response time histogram: each cell has the percentage of responses that take <= the time in the header and max is the max response time in seconds. For the max column values in the top 25% of the range have a red background and in the bottom 25% of the range have a green background. The red background is not used when the min value is within 80% of the max value.
| dbms | 256us | 1ms | 4ms | 16ms | 64ms | 256ms | 1s | 4s | 16s | gt | max |
|---|---|---|---|---|---|---|---|---|---|---|---|
| pg176_o2nofp.cx10a_c8r32 | 10.630 | 89.259 | 0.110 | 0.001 | 0.019 | ||||||
| pg18rc1_o2nofp.cx10b_c8r32 | 10.586 | 89.394 | 0.019 | 0.001 | 0.018 | ||||||
| pg18rc1_o2nofp.cx10c_c8r32 | 19.010 | 80.763 | 0.226 | 0.002 | 0.040 | ||||||
| pg18rc1_o2nofp.cx10d_c8r32 | 19.224 | 80.553 | 0.222 | 0.002 | 0.025 |
Delete response time histogram: each cell has the percentage of responses that take <= the time in the header and max is the max response time in seconds. For the max column values in the top 25% of the range have a red background and in the bottom 25% of the range have a green background. The red background is not used when the min value is within 80% of the max value.
| dbms | 256us | 1ms | 4ms | 16ms | 64ms | 256ms | 1s | 4s | 16s | gt | max |
|---|---|---|---|---|---|---|---|---|---|---|---|
| pg176_o2nofp.cx10a_c8r32 | 99.999 | 0.001 | 0.085 | ||||||||
| pg18rc1_o2nofp.cx10b_c8r32 | 99.999 | 0.001 | 0.081 | ||||||||
| pg18rc1_o2nofp.cx10c_c8r32 | 99.999 | 0.001 | 0.081 | ||||||||
| pg18rc1_o2nofp.cx10d_c8r32 | 99.999 | 0.001 | 0.081 |
Performance metrics for the DBMS listed above. Some are normalized by throughput, others are not. Legend for results is here.
ips	qps	rps	rmbps	wps	wmbps	rpq	rkbpq	wpi	wkbpi	csps	cpups	cspq	cpupq	dbgb1	dbgb2	rss	maxop	p50	p99	tag
167	0	178	1.4	495.6	6.8	1.070	8.674	2.975	41.725	1074	12.7	6.449	6098	154.4	194.5	23.3	0.019	165	145	pg176_o2nofp.cx10a_c8r32
177	0	190	1.5	511.8	7.1	1.071	8.677	2.888	40.927	1139	12.8	6.430	5779	154.4	194.5	23.4	0.018	175	155	pg18rc1_o2nofp.cx10b_c8r32
177	0	190	1.5	512.5	7.1	1.073	8.690	2.891	40.905	1139	12.8	6.424	5776	154.4	194.5	22.9	0.040	175	155	pg18rc1_o2nofp.cx10c_c8r32
176	0	188	1.5	506.7	7.0	1.069	8.663	2.880	40.949	1130	12.8	6.426	5821	154.4	194.5	23.0	0.025	175	155	pg18rc1_o2nofp.cx10d_c8r32
qr100.L1
qr100.L1: range queries with 100 insert/s per client. Graphs for performance per 1-second interval are here.
Average throughput:
Query response time histogram: each cell has the percentage of responses that take <= the time in the header and max is the max response time in seconds. For max values in the top 25% of the range have a red background and in the bottom 25% of the range have a green background. The red background is not used when the min value is within 80% of the max value.
| dbms | 256us | 1ms | 4ms | 16ms | 64ms | 256ms | 1s | 4s | 16s | gt | max |
|---|---|---|---|---|---|---|---|---|---|---|---|
| pg176_o2nofp.cx10a_c8r32 | 99.991 | 0.009 | nonzero | nonzero | 0.043 | ||||||
| pg18rc1_o2nofp.cx10b_c8r32 | 99.991 | 0.009 | nonzero | nonzero | 0.024 | ||||||
| pg18rc1_o2nofp.cx10c_c8r32 | 99.990 | 0.010 | nonzero | nonzero | 0.052 | ||||||
| pg18rc1_o2nofp.cx10d_c8r32 | 99.991 | 0.009 | nonzero | nonzero | nonzero | 0.042 |
Insert response time histogram: each cell has the percentage of responses that take <= the time in the header and max is the max response time in seconds. For max values in the top 25% of the range have a red background and in the bottom 25% of the range have a green background. The red background is not used when the min value is within 80% of the max value.
| dbms | 256us | 1ms | 4ms | 16ms | 64ms | 256ms | 1s | 4s | 16s | gt | max |
|---|---|---|---|---|---|---|---|---|---|---|---|
| pg176_o2nofp.cx10a_c8r32 | 0.028 | 99.833 | 0.139 | 0.058 | |||||||
| pg18rc1_o2nofp.cx10b_c8r32 | 0.028 | 99.917 | 0.056 | 0.058 | |||||||
| pg18rc1_o2nofp.cx10c_c8r32 | 99.889 | 0.083 | 0.028 | 0.065 | |||||||
| pg18rc1_o2nofp.cx10d_c8r32 | 99.861 | 0.139 | 0.057 |
Delete response time histogram: each cell has the percentage of responses that take <= the time in the header and max is the max response time in seconds. For max values in the top 25% of the range have a red background and in the bottom 25% of the range have a green background. The red background is not used when the min value is within 80% of the max value.
| dbms | 256us | 1ms | 4ms | 16ms | 64ms | 256ms | 1s | 4s | 16s | gt | max |
|---|---|---|---|---|---|---|---|---|---|---|---|
| pg176_o2nofp.cx10a_c8r32 | 0.028 | 59.750 | 40.222 | 0.002 | |||||||
| pg18rc1_o2nofp.cx10b_c8r32 | 57.889 | 42.111 | 0.003 | ||||||||
| pg18rc1_o2nofp.cx10c_c8r32 | 60.528 | 39.472 | 0.003 | ||||||||
| pg18rc1_o2nofp.cx10d_c8r32 | 59.556 | 40.444 | 0.002 |
Performance metrics for the DBMS listed above. Some are normalized by throughput, others are not. Legend for results is here.
ips	qps	rps	rmbps	wps	wmbps	rpq	rkbpq	wpi	wkbpi	csps	cpups	cspq	cpupq	dbgb1	dbgb2	rss	maxop	p50	p99	tag
100	25242	113	0.9	64.1	1.9	0.004	0.037	0.641	19.205	96540	8.5	3.825	27	154.4	191.7	23.3	0.043	25275	25018	pg176_o2nofp.cx10a_c8r32
100	25177	111	0.9	66.5	1.9	0.004	0.036	0.666	19.429	96293	8.7	3.825	28	154.4	191.7	23.4	0.024	25289	24716	pg18rc1_o2nofp.cx10b_c8r32
100	25050	111	0.9	67.9	1.9	0.004	0.037	0.680	19.540	95861	8.6	3.827	27	154.4	191.7	23.4	0.052	25067	24771	pg18rc1_o2nofp.cx10c_c8r32
100	24871	111	0.9	68.5	1.9	0.004	0.037	0.686	19.578	95123	8.6	3.825	28	154.4	191.7	23.4	0.042	24795	24348	pg18rc1_o2nofp.cx10d_c8r32
qp100.L2
qp100.L2: point queries with 100 insert/s per client. Graphs for performance per 1-second interval are here.
Average throughput:
Query response time histogram: each cell has the percentage of responses that take <= the time in the header and max is the max response time in seconds. For max values in the top 25% of the range have a red background and in the bottom 25% of the range have a green background. The red background is not used when the min value is within 80% of the max value.
| dbms | 256us | 1ms | 4ms | 16ms | 64ms | 256ms | 1s | 4s | 16s | gt | max |
|---|---|---|---|---|---|---|---|---|---|---|---|
| pg176_o2nofp.cx10a_c8r32 | 3.095 | 96.879 | 0.026 | 0.010 | |||||||
| pg18rc1_o2nofp.cx10b_c8r32 | 3.017 | 96.954 | 0.029 | nonzero | 0.044 | ||||||
| pg18rc1_o2nofp.cx10c_c8r32 | 17.998 | 81.902 | 0.096 | 0.004 | 0.031 | ||||||
| pg18rc1_o2nofp.cx10d_c8r32 | 18.832 | 81.073 | 0.093 | 0.003 | 0.031 |
Insert response time histogram: each cell has the percentage of responses that take <= the time in the header and max is the max response time in seconds. For max values in the top 25% of the range have a red background and in the bottom 25% of the range have a green background. The red background is not used when the min value is within 80% of the max value.
| dbms | 256us | 1ms | 4ms | 16ms | 64ms | 256ms | 1s | 4s | 16s | gt | max |
|---|---|---|---|---|---|---|---|---|---|---|---|
| pg176_o2nofp.cx10a_c8r32 | 99.972 | 0.028 | 0.017 | ||||||||
| pg18rc1_o2nofp.cx10b_c8r32 | 100.000 | 0.015 | |||||||||
| pg18rc1_o2nofp.cx10c_c8r32 | 92.750 | 7.167 | 0.083 | 0.177 | |||||||
| pg18rc1_o2nofp.cx10d_c8r32 | 99.194 | 0.639 | 0.167 | 0.086 |
Delete response time histogram: each cell has the percentage of responses that take <= the time in the header and max is the max response time in seconds. For max values in the top 25% of the range have a red background and in the bottom 25% of the range have a green background. The red background is not used when the min value is within 80% of the max value.
| dbms | 256us | 1ms | 4ms | 16ms | 64ms | 256ms | 1s | 4s | 16s | gt | max |
|---|---|---|---|---|---|---|---|---|---|---|---|
| pg176_o2nofp.cx10a_c8r32 | 4.194 | 95.778 | 0.028 | 0.007 | |||||||
| pg18rc1_o2nofp.cx10b_c8r32 | 4.194 | 95.778 | 0.028 | 0.007 | |||||||
| pg18rc1_o2nofp.cx10c_c8r32 | 4.111 | 95.861 | 0.028 | 0.007 | |||||||
| pg18rc1_o2nofp.cx10d_c8r32 | 5.111 | 94.861 | 0.028 | 0.007 |
Performance metrics for the DBMS listed above. Some are normalized by throughput, others are not. Legend for results is here.
ips	qps	rps	rmbps	wps	wmbps	rpq	rkbpq	wpi	wkbpi	csps	cpups	cspq	cpupq	dbgb1	dbgb2	rss	maxop	p50	p99	tag
100	644	8317	65.0	349.9	4.1	12.918	103.454	3.499	41.870	18484	2.2	28.710	273	154.5	191.7	23.3	0.010	656	448	pg176_o2nofp.cx10a_c8r32
100	643	8274	64.7	347.9	4.1	12.876	103.100	3.479	41.723	18396	2.4	28.627	299	154.5	191.7	23.4	0.044	656	432	pg18rc1_o2nofp.cx10b_c8r32
100	794	10082	78.8	350.7	4.1	12.696	101.652	3.511	41.936	22425	3.6	28.239	363	154.5	191.7	23.4	0.031	816	544	pg18rc1_o2nofp.cx10c_c8r32
100	808	10242	80.1	351.0	4.1	12.673	101.462	3.510	41.912	22781	3.7	28.188	366	154.5	191.7	23.4	0.031	832	544	pg18rc1_o2nofp.cx10d_c8r32
qr500.L3
qr500.L3: range queries with 500 insert/s per client. Graphs for performance per 1-second interval are here.
Average throughput:
Query response time histogram: each cell has the percentage of responses that take <= the time in the header and max is the max response time in seconds. For max values in the top 25% of the range have a red background and in the bottom 25% of the range have a green background. The red background is not used when the min value is within 80% of the max value.
| dbms | 256us | 1ms | 4ms | 16ms | 64ms | 256ms | 1s | 4s | 16s | gt | max |
|---|---|---|---|---|---|---|---|---|---|---|---|
| pg176_o2nofp.cx10a_c8r32 | 99.985 | 0.015 | nonzero | nonzero | nonzero | 0.026 | |||||
| pg18rc1_o2nofp.cx10b_c8r32 | 99.984 | 0.016 | nonzero | nonzero | nonzero | 0.026 | |||||
| pg18rc1_o2nofp.cx10c_c8r32 | 99.983 | 0.017 | 0.001 | nonzero | nonzero | 0.035 | |||||
| pg18rc1_o2nofp.cx10d_c8r32 | 99.984 | 0.015 | 0.001 | nonzero | nonzero | 0.028 |
Insert response time histogram: each cell has the percentage of responses that take <= the time in the header and max is the max response time in seconds. For max values in the top 25% of the range have a red background and in the bottom 25% of the range have a green background. The red background is not used when the min value is within 80% of the max value.
| dbms | 256us | 1ms | 4ms | 16ms | 64ms | 256ms | 1s | 4s | 16s | gt | max |
|---|---|---|---|---|---|---|---|---|---|---|---|
| pg176_o2nofp.cx10a_c8r32 | 99.856 | 0.144 | 0.043 | ||||||||
| pg18rc1_o2nofp.cx10b_c8r32 | 99.794 | 0.206 | 0.036 | ||||||||
| pg18rc1_o2nofp.cx10c_c8r32 | 99.628 | 0.294 | 0.078 | 0.146 | |||||||
| pg18rc1_o2nofp.cx10d_c8r32 | 99.478 | 0.456 | 0.067 | 0.155 |
Delete response time histogram: each cell has the percentage of responses that take <= the time in the header and max is the max response time in seconds. For max values in the top 25% of the range have a red background and in the bottom 25% of the range have a green background. The red background is not used when the min value is within 80% of the max value.
| dbms | 256us | 1ms | 4ms | 16ms | 64ms | 256ms | 1s | 4s | 16s | gt | max |
|---|---|---|---|---|---|---|---|---|---|---|---|
| pg176_o2nofp.cx10a_c8r32 | 52.417 | 47.583 | 0.012 | ||||||||
| pg18rc1_o2nofp.cx10b_c8r32 | 52.567 | 47.433 | 0.012 | ||||||||
| pg18rc1_o2nofp.cx10c_c8r32 | 52.933 | 47.067 | 0.012 | ||||||||
| pg18rc1_o2nofp.cx10d_c8r32 | 53.450 | 46.550 | 0.012 |
Performance metrics for the DBMS listed above. Some are normalized by throughput, others are not. Legend for results is here.
ips	qps	rps	rmbps	wps	wmbps	rpq	rkbpq	wpi	wkbpi	csps	cpups	cspq	cpupq	dbgb1	dbgb2	rss	maxop	p50	p99	tag
499	23609	872	6.9	341.8	9.3	0.037	0.300	0.684	19.033	91954	9.7	3.895	33	154.5	190.2	23.3	0.026	23675	22428	pg176_o2nofp.cx10a_c8r32
500	23248	871	6.9	348.9	9.4	0.037	0.305	0.698	19.169	90529	9.7	3.894	33	154.5	190.2	23.4	0.026	23308	22156	pg18rc1_o2nofp.cx10b_c8r32
499	23339	873	6.9	346.9	9.3	0.037	0.304	0.695	19.161	90937	9.6	3.896	33	154.5	190.2	23.4	0.035	23404	22126	pg18rc1_o2nofp.cx10c_c8r32
500	23142	873	6.9	348.2	9.4	0.038	0.307	0.697	19.174	90130	9.8	3.895	34	154.5	190.2	23.4	0.028	23242	22108	pg18rc1_o2nofp.cx10d_c8r32
qp500.L4
qp500.L4: point queries with 500 insert/s per client. Graphs for performance per 1-second interval are here.
Average throughput:
Query response time histogram: each cell has the percentage of responses that take <= the time in the header and max is the max response time in seconds. For max values in the top 25% of the range have a red background and in the bottom 25% of the range have a green background. The red background is not used when the min value is within 80% of the max value.
| dbms | 256us | 1ms | 4ms | 16ms | 64ms | 256ms | 1s | 4s | 16s | gt | max |
|---|---|---|---|---|---|---|---|---|---|---|---|
| pg176_o2nofp.cx10a_c8r32 | 1.417 | 98.451 | 0.133 | nonzero | 0.040 | ||||||
| pg18rc1_o2nofp.cx10b_c8r32 | 1.442 | 98.424 | 0.134 | nonzero | 0.033 | ||||||
| pg18rc1_o2nofp.cx10c_c8r32 | 10.559 | 88.853 | 0.574 | 0.014 | 0.036 | ||||||
| pg18rc1_o2nofp.cx10d_c8r32 | 11.229 | 88.162 | 0.595 | 0.014 | 0.037 |
Insert response time histogram: each cell has the percentage of responses that take <= the time in the header and max is the max response time in seconds. For max values in the top 25% of the range have a red background and in the bottom 25% of the range have a green background. The red background is not used when the min value is within 80% of the max value.
| dbms | 256us | 1ms | 4ms | 16ms | 64ms | 256ms | 1s | 4s | 16s | gt | max |
|---|---|---|---|---|---|---|---|---|---|---|---|
| pg176_o2nofp.cx10a_c8r32 | 99.250 | 0.750 | 0.058 | ||||||||
| pg18rc1_o2nofp.cx10b_c8r32 | 99.361 | 0.639 | 0.050 | ||||||||
| pg18rc1_o2nofp.cx10c_c8r32 | 95.661 | 4.239 | 0.100 | 0.174 | |||||||
| pg18rc1_o2nofp.cx10d_c8r32 | 95.539 | 4.328 | 0.133 | 0.187 |
Delete response time histogram: each cell has the percentage of responses that take <= the time in the header and max is the max response time in seconds. For max values in the top 25% of the range have a red background and in the bottom 25% of the range have a green background. The red background is not used when the min value is within 80% of the max value.
| dbms | 256us | 1ms | 4ms | 16ms | 64ms | 256ms | 1s | 4s | 16s | gt | max |
|---|---|---|---|---|---|---|---|---|---|---|---|
| pg176_o2nofp.cx10a_c8r32 | 99.100 | 0.900 | 0.035 | ||||||||
| pg18rc1_o2nofp.cx10b_c8r32 | 99.950 | 0.050 | 0.035 | ||||||||
| pg18rc1_o2nofp.cx10c_c8r32 | 99.950 | 0.050 | 0.035 | ||||||||
| pg18rc1_o2nofp.cx10d_c8r32 | 99.928 | 0.072 | 0.034 |
Performance metrics for the DBMS listed above. Some are normalized by throughput, others are not. Legend for results is here.
ips	qps	rps	rmbps	wps	wmbps	rpq	rkbpq	wpi	wkbpi	csps	cpups	cspq	cpupq	dbgb1	dbgb2	rss	maxop	p50	p99	tag
500	601	8728	68.3	1565.1	18.4	14.528	116.411	3.132	37.611	19250	4.8	32.041	639	154.6	188.5	23.3	0.040	608	448	pg176_o2nofp.cx10a_c8r32
500	602	8706	68.1	1559.1	18.3	14.474	115.998	3.118	37.494	19206	4.8	31.931	638	154.6	188.5	23.4	0.033	608	448	pg18rc1_o2nofp.cx10b_c8r32
499	735	10324	80.8	1579.6	18.5	14.050	112.567	3.163	37.869	22803	4.9	31.033	533	154.6	188.4	23.4	0.036	752	464	pg18rc1_o2nofp.cx10c_c8r32
500	740	10385	81.3	1578.6	18.5	14.025	112.377	3.159	37.829	22940	4.9	30.980	529	154.6	188.4	23.4	0.037	768	480	pg18rc1_o2nofp.cx10d_c8r32
qr1000.L5
qr1000.L5: range queries with 1000 insert/s per client. Graphs for performance per 1-second interval are here.
Average throughput:
Query response time histogram: each cell has the percentage of responses that take <= the time in the header and max is the max response time in seconds. For max values in the top 25% of the range have a red background and in the bottom 25% of the range have a green background. The red background is not used when the min value is within 80% of the max value.
| dbms | 256us | 1ms | 4ms | 16ms | 64ms | 256ms | 1s | 4s | 16s | gt | max |
|---|---|---|---|---|---|---|---|---|---|---|---|
| pg176_o2nofp.cx10a_c8r32 | 99.957 | 0.041 | 0.002 | nonzero | nonzero | nonzero | 0.065 | ||||
| pg18rc1_o2nofp.cx10b_c8r32 | 99.951 | 0.047 | 0.002 | nonzero | nonzero | nonzero | 0.078 | ||||
| pg18rc1_o2nofp.cx10c_c8r32 | 99.953 | 0.045 | 0.002 | nonzero | nonzero | nonzero | 0.096 | ||||
| pg18rc1_o2nofp.cx10d_c8r32 | 99.959 | 0.039 | 0.002 | nonzero | nonzero | nonzero | 0.118 |
Insert response time histogram: each cell has the percentage of responses that take <= the time in the header and max is the max response time in seconds. For max values in the top 25% of the range have a red background and in the bottom 25% of the range have a green background. The red background is not used when the min value is within 80% of the max value.
| dbms | 256us | 1ms | 4ms | 16ms | 64ms | 256ms | 1s | 4s | 16s | gt | max |
|---|---|---|---|---|---|---|---|---|---|---|---|
| pg176_o2nofp.cx10a_c8r32 | 99.581 | 0.419 | 0.030 | ||||||||
| pg18rc1_o2nofp.cx10b_c8r32 | 99.644 | 0.356 | 0.029 | ||||||||
| pg18rc1_o2nofp.cx10c_c8r32 | 98.861 | 1.011 | 0.128 | 0.148 | |||||||
| pg18rc1_o2nofp.cx10d_c8r32 | 98.911 | 0.958 | 0.131 | 0.155 |
Delete response time histogram: each cell has the percentage of responses that take <= the time in the header and max is the max response time in seconds. For max values in the top 25% of the range have a red background and in the bottom 25% of the range have a green background. The red background is not used when the min value is within 80% of the max value.
| dbms | 256us | 1ms | 4ms | 16ms | 64ms | 256ms | 1s | 4s | 16s | gt | max |
|---|---|---|---|---|---|---|---|---|---|---|---|
| pg176_o2nofp.cx10a_c8r32 | 11.703 | 88.297 | 0.053 | ||||||||
| pg18rc1_o2nofp.cx10b_c8r32 | 18.056 | 81.944 | 0.051 | ||||||||
| pg18rc1_o2nofp.cx10c_c8r32 | 19.078 | 80.922 | 0.052 | ||||||||
| pg18rc1_o2nofp.cx10d_c8r32 | 18.897 | 81.103 | 0.052 |
Performance metrics for the DBMS listed above. Some are normalized by throughput, others are not. Legend for results is here.
ips	qps	rps	rmbps	wps	wmbps	rpq	rkbpq	wpi	wkbpi	csps	cpups	cspq	cpupq	dbgb1	dbgb2	rss	maxop	p50	p99	tag
999	19081	1493	11.9	940.7	19.1	0.078	0.640	0.942	19.615	76102	16.0	3.988	67	154.8	187.7	23.3	0.065	19118	17497	pg176_o2nofp.cx10a_c8r32
999	18981	1494	11.9	943.0	19.2	0.079	0.644	0.944	19.649	75679	15.9	3.987	67	154.8	187.7	23.4	0.078	19017	17373	pg18rc1_o2nofp.cx10b_c8r32
999	18871	1498	12.0	931.2	19.1	0.079	0.649	0.932	19.570	75301	15.9	3.990	67	154.8	187.6	23.4	0.096	18893	17128	pg18rc1_o2nofp.cx10c_c8r32
999	18847	1499	12.0	930.8	19.1	0.080	0.651	0.931	19.556	75183	15.9	3.989	67	154.8	187.6	23.4	0.118	18861	17277	pg18rc1_o2nofp.cx10d_c8r32
qp1000.L6
qp1000.L6: point queries with 1000 insert/s per client. Graphs for performance per 1-second interval are here.
Average throughput:
Query response time histogram: each cell has the percentage of responses that take <= the time in the header and max is the max response time in seconds. For max values in the top 25% of the range have a red background and in the bottom 25% of the range have a green background. The red background is not used when the min value is within 80% of the max value.
| dbms | 256us | 1ms | 4ms | 16ms | 64ms | 256ms | 1s | 4s | 16s | gt | max |
|---|---|---|---|---|---|---|---|---|---|---|---|
| pg176_o2nofp.cx10a_c8r32 | 0.457 | 99.244 | 0.299 | nonzero | 0.032 | ||||||
| pg18rc1_o2nofp.cx10b_c8r32 | 0.455 | 99.248 | 0.296 | nonzero | 0.029 | ||||||
| pg18rc1_o2nofp.cx10c_c8r32 | 4.301 | 94.385 | 1.285 | 0.030 | 0.041 | ||||||
| pg18rc1_o2nofp.cx10d_c8r32 | 4.585 | 94.083 | 1.301 | 0.031 | 0.040 |
Insert response time histogram: each cell has the percentage of responses that take <= the time in the header and max is the max response time in seconds. For max values in the top 25% of the range have a red background and in the bottom 25% of the range have a green background. The red background is not used when the min value is within 80% of the max value.
| dbms | 256us | 1ms | 4ms | 16ms | 64ms | 256ms | 1s | 4s | 16s | gt | max |
|---|---|---|---|---|---|---|---|---|---|---|---|
| pg176_o2nofp.cx10a_c8r32 | 98.867 | 1.133 | 0.036 | ||||||||
| pg18rc1_o2nofp.cx10b_c8r32 | 99.008 | 0.992 | 0.042 | ||||||||
| pg18rc1_o2nofp.cx10c_c8r32 | 93.458 | 6.294 | 0.247 | 0.189 | |||||||
| pg18rc1_o2nofp.cx10d_c8r32 | 93.444 | 6.278 | 0.278 | 0.182 |
Delete response time histogram: each cell has the percentage of responses that take <= the time in the header and max is the max response time in seconds. For max values in the top 25% of the range have a red background and in the bottom 25% of the range have a green background. The red background is not used when the min value is within 80% of the max value.
| dbms | 256us | 1ms | 4ms | 16ms | 64ms | 256ms | 1s | 4s | 16s | gt | max |
|---|---|---|---|---|---|---|---|---|---|---|---|
| pg176_o2nofp.cx10a_c8r32 | 99.997 | 0.003 | 0.083 | ||||||||
| pg18rc1_o2nofp.cx10b_c8r32 | 99.997 | 0.003 | 0.082 | ||||||||
| pg18rc1_o2nofp.cx10c_c8r32 | 99.997 | 0.003 | 0.083 | ||||||||
| pg18rc1_o2nofp.cx10d_c8r32 | 99.997 | 0.003 | 0.083 |
Performance metrics for the DBMS listed above. Some are normalized by throughput, others are not. Legend for results is here.
ips	qps	rps	rmbps	wps	wmbps	rpq	rkbpq	wpi	wkbpi	csps	cpups	cspq	cpupq	dbgb1	dbgb2	rss	maxop	p50	p99	tag
999	531	9071	71.0	2734.1	33.9	17.079	136.931	2.737	34.765	19877	12.5	37.426	1883	155.0	190.9	23.3	0.032	544	384	pg176_o2nofp.cx10a_c8r32
999	531	9042	70.8	2736.1	33.8	17.018	136.454	2.738	34.644	19822	12.2	37.308	1837	155.0	190.7	23.4	0.029	544	384	pg18rc1_o2nofp.cx10b_c8r32
998	640	10398	81.4	2779.4	34.1	16.259	130.329	2.784	34.968	22821	12.8	35.686	1601	155.0	190.5	23.4	0.041	672	256	pg18rc1_o2nofp.cx10c_c8r32
998	646	10467	81.9	2781.9	34.1	16.210	129.944	2.787	34.959	22984	12.8	35.596	1586	155.0	190.4	23.4	0.040	672	288	pg18rc1_o2nofp.cx10d_c8r32
l.i0
l.i0: load without secondary indexes
Performance metrics for all DBMS, not just the ones listed above. Some are normalized by throughput, others are not. Legend for results is here.
ips	qps	rps	rmbps	wps	wmbps	rpq	rkbpq	wpi	wkbpi	csps	cpups	cspq	cpupq	dbgb1	dbgb2	rss	maxop	p50	p99	tag
209369	0	37	0.3	783.9	86.5	0.000	0.001	0.004	0.423	21090	20.5	0.101	8	76.5	116.6	19.5	0.040	212372	190167	pg176_o2nofp.cx10a_c8r32
209424	0	35	0.3	783.8	86.1	0.000	0.001	0.004	0.421	20830	20.3	0.099	8	76.5	116.6	18.9	0.046	210665	203165	pg18rc1_o2nofp.cx10b_c8r32
209314	0	35	0.3	782.7	86.0	0.000	0.001	0.004	0.421	20940	20.4	0.100	8	76.5	116.6	0.5	0.048	210572	203168	pg18rc1_o2nofp.cx10c_c8r32
209644	0	36	0.3	783.9	86.2	0.000	0.001	0.004	0.421	21004	20.5	0.100	8	76.5	116.6	18.9	0.036	210963	203176	pg18rc1_o2nofp.cx10d_c8r32
l.x
l.x: create secondary indexes
Performance metrics for all DBMS, not just the ones listed above. Some are normalized by throughput, others are not. Legend for results is here.
ips	qps	rps	rmbps	wps	wmbps	rpq	rkbpq	wpi	wkbpi	csps	cpups	cspq	cpupq	dbgb1	dbgb2	rss	maxop	p50	p99	tag
402820	0	1097	136.0	1235.3	150.4	0.003	0.346	0.003	0.382	889	12.5	0.002	2	153.6	193.7	23.4	0.002	NA	NA	pg176_o2nofp.cx10a_c8r32
390434	0	1271	141.4	1188.6	145.5	0.003	0.371	0.003	0.382	1105	12.2	0.003	2	153.6	193.7	23.4	0.003	NA	NA	pg18rc1_o2nofp.cx10b_c8r32
415800	0	1296	147.7	1273.2	155.2	0.003	0.364	0.003	0.382	2151	13.1	0.005	3	153.6	193.7	23.4	0.003	NA	NA	pg18rc1_o2nofp.cx10c_c8r32
410467	0	1306	147.2	1261.1	152.9	0.003	0.367	0.003	0.381	1783	13.2	0.004	3	153.6	193.7	23.4	0.002	NA	NA	pg18rc1_o2nofp.cx10d_c8r32
l.i1
l.i1: continue load after secondary indexes created with 50 inserts per transaction
Performance metrics for all DBMS, not just the ones listed above. Some are normalized by throughput, others are not. Legend for results is here.
ips	qps	rps	rmbps	wps	wmbps	rpq	rkbpq	wpi	wkbpi	csps	cpups	cspq	cpupq	dbgb1	dbgb2	rss	maxop	p50	p99	tag
2784	0	3991	31.5	3293.7	56.4	1.434	11.573	1.183	20.739	8998	12.0	3.232	345	154.3	194.3	22.8	0.306	2400	650	pg176_o2nofp.cx10a_c8r32
2920	0	4193	33.0	3480.1	59.6	1.436	11.587	1.192	20.911	9422	12.2	3.227	334	154.3	194.3	22.8	0.307	2500	650	pg18rc1_o2nofp.cx10b_c8r32
3660	0	5264	41.5	4357.5	74.8	1.438	11.606	1.191	20.929	11805	15.2	3.226	332	154.3	194.3	22.9	0.112	2850	1450	pg18rc1_o2nofp.cx10c_c8r32
3653	0	5261	41.4	4358.8	74.8	1.440	11.619	1.193	20.975	11802	15.2	3.231	333	154.3	194.3	23.0	0.127	2899	1800	pg18rc1_o2nofp.cx10d_c8r32
l.i2
l.i2: continue load after secondary indexes created with 5 inserts per transaction
Performance metrics for all DBMS, not just the ones listed above. Some are normalized by throughput, others are not. Legend for results is here.
ips	qps	rps	rmbps	wps	wmbps	rpq	rkbpq	wpi	wkbpi	csps	cpups	cspq	cpupq	dbgb1	dbgb2	rss	maxop	p50	p99	tag
167	0	178	1.4	495.6	6.8	1.070	8.674	2.975	41.725	1074	12.7	6.449	6098	154.4	194.5	23.3	0.019	165	145	pg176_o2nofp.cx10a_c8r32
177	0	190	1.5	511.8	7.1	1.071	8.677	2.888	40.927	1139	12.8	6.430	5779	154.4	194.5	23.4	0.018	175	155	pg18rc1_o2nofp.cx10b_c8r32
177	0	190	1.5	512.5	7.1	1.073	8.690	2.891	40.905	1139	12.8	6.424	5776	154.4	194.5	22.9	0.040	175	155	pg18rc1_o2nofp.cx10c_c8r32
176	0	188	1.5	506.7	7.0	1.069	8.663	2.880	40.949	1130	12.8	6.426	5821	154.4	194.5	23.0	0.025	175	155	pg18rc1_o2nofp.cx10d_c8r32
qr100.L1
qr100.L1: range queries with 100 insert/s per client
Performance metrics for all DBMS, not just the ones listed above. Some are normalized by throughput, others are not. Legend for results is here.
ips	qps	rps	rmbps	wps	wmbps	rpq	rkbpq	wpi	wkbpi	csps	cpups	cspq	cpupq	dbgb1	dbgb2	rss	maxop	p50	p99	tag
100	25242	113	0.9	64.1	1.9	0.004	0.037	0.641	19.205	96540	8.5	3.825	27	154.4	191.7	23.3	0.043	25275	25018	pg176_o2nofp.cx10a_c8r32
100	25177	111	0.9	66.5	1.9	0.004	0.036	0.666	19.429	96293	8.7	3.825	28	154.4	191.7	23.4	0.024	25289	24716	pg18rc1_o2nofp.cx10b_c8r32
100	25050	111	0.9	67.9	1.9	0.004	0.037	0.680	19.540	95861	8.6	3.827	27	154.4	191.7	23.4	0.052	25067	24771	pg18rc1_o2nofp.cx10c_c8r32
100	24871	111	0.9	68.5	1.9	0.004	0.037	0.686	19.578	95123	8.6	3.825	28	154.4	191.7	23.4	0.042	24795	24348	pg18rc1_o2nofp.cx10d_c8r32
qp100.L2
qp100.L2: point queries with 100 insert/s per client
Performance metrics for all DBMS, not just the ones listed above. Some are normalized by throughput, others are not. Legend for results is here.
ips	qps	rps	rmbps	wps	wmbps	rpq	rkbpq	wpi	wkbpi	csps	cpups	cspq	cpupq	dbgb1	dbgb2	rss	maxop	p50	p99	tag
100	644	8317	65.0	349.9	4.1	12.918	103.454	3.499	41.870	18484	2.2	28.710	273	154.5	191.7	23.3	0.010	656	448	pg176_o2nofp.cx10a_c8r32
100	643	8274	64.7	347.9	4.1	12.876	103.100	3.479	41.723	18396	2.4	28.627	299	154.5	191.7	23.4	0.044	656	432	pg18rc1_o2nofp.cx10b_c8r32
100	794	10082	78.8	350.7	4.1	12.696	101.652	3.511	41.936	22425	3.6	28.239	363	154.5	191.7	23.4	0.031	816	544	pg18rc1_o2nofp.cx10c_c8r32
100	808	10242	80.1	351.0	4.1	12.673	101.462	3.510	41.912	22781	3.7	28.188	366	154.5	191.7	23.4	0.031	832	544	pg18rc1_o2nofp.cx10d_c8r32
qr500.L3
qr500.L3: range queries with 500 insert/s per client
Performance metrics for all DBMS, not just the ones listed above. Some are normalized by throughput, others are not. Legend for results is here.
ips	qps	rps	rmbps	wps	wmbps	rpq	rkbpq	wpi	wkbpi	csps	cpups	cspq	cpupq	dbgb1	dbgb2	rss	maxop	p50	p99	tag
499	23609	872	6.9	341.8	9.3	0.037	0.300	0.684	19.033	91954	9.7	3.895	33	154.5	190.2	23.3	0.026	23675	22428	pg176_o2nofp.cx10a_c8r32
500	23248	871	6.9	348.9	9.4	0.037	0.305	0.698	19.169	90529	9.7	3.894	33	154.5	190.2	23.4	0.026	23308	22156	pg18rc1_o2nofp.cx10b_c8r32
499	23339	873	6.9	346.9	9.3	0.037	0.304	0.695	19.161	90937	9.6	3.896	33	154.5	190.2	23.4	0.035	23404	22126	pg18rc1_o2nofp.cx10c_c8r32
500	23142	873	6.9	348.2	9.4	0.038	0.307	0.697	19.174	90130	9.8	3.895	34	154.5	190.2	23.4	0.028	23242	22108	pg18rc1_o2nofp.cx10d_c8r32
qp500.L4
qp500.L4: point queries with 500 insert/s per client
Performance metrics for all DBMS, not just the ones listed above. Some are normalized by throughput, others are not. Legend for results is here.
ips	qps	rps	rmbps	wps	wmbps	rpq	rkbpq	wpi	wkbpi	csps	cpups	cspq	cpupq	dbgb1	dbgb2	rss	maxop	p50	p99	tag
500	601	8728	68.3	1565.1	18.4	14.528	116.411	3.132	37.611	19250	4.8	32.041	639	154.6	188.5	23.3	0.040	608	448	pg176_o2nofp.cx10a_c8r32
500	602	8706	68.1	1559.1	18.3	14.474	115.998	3.118	37.494	19206	4.8	31.931	638	154.6	188.5	23.4	0.033	608	448	pg18rc1_o2nofp.cx10b_c8r32
499	735	10324	80.8	1579.6	18.5	14.050	112.567	3.163	37.869	22803	4.9	31.033	533	154.6	188.4	23.4	0.036	752	464	pg18rc1_o2nofp.cx10c_c8r32
500	740	10385	81.3	1578.6	18.5	14.025	112.377	3.159	37.829	22940	4.9	30.980	529	154.6	188.4	23.4	0.037	768	480	pg18rc1_o2nofp.cx10d_c8r32
qr1000.L5
qr1000.L5: range queries with 1000 insert/s per client
Performance metrics for all DBMS, not just the ones listed above. Some are normalized by throughput, others are not. Legend for results is here.
ips	qps	rps	rmbps	wps	wmbps	rpq	rkbpq	wpi	wkbpi	csps	cpups	cspq	cpupq	dbgb1	dbgb2	rss	maxop	p50	p99	tag
999	19081	1493	11.9	940.7	19.1	0.078	0.640	0.942	19.615	76102	16.0	3.988	67	154.8	187.7	23.3	0.065	19118	17497	pg176_o2nofp.cx10a_c8r32
999	18981	1494	11.9	943.0	19.2	0.079	0.644	0.944	19.649	75679	15.9	3.987	67	154.8	187.7	23.4	0.078	19017	17373	pg18rc1_o2nofp.cx10b_c8r32
999	18871	1498	12.0	931.2	19.1	0.079	0.649	0.932	19.570	75301	15.9	3.990	67	154.8	187.6	23.4	0.096	18893	17128	pg18rc1_o2nofp.cx10c_c8r32
999	18847	1499	12.0	930.8	19.1	0.080	0.651	0.931	19.556	75183	15.9	3.989	67	154.8	187.6	23.4	0.118	18861	17277	pg18rc1_o2nofp.cx10d_c8r32
qp1000.L6
qp1000.L6: point queries with 1000 insert/s per client
Performance metrics for all DBMS, not just the ones listed above. Some are normalized by throughput, others are not. Legend for results is here.
ips	qps	rps	rmbps	wps	wmbps	rpq	rkbpq	wpi	wkbpi	csps	cpups	cspq	cpupq	dbgb1	dbgb2	rss	maxop	p50	p99	tag
999	531	9071	71.0	2734.1	33.9	17.079	136.931	2.737	34.765	19877	12.5	37.426	1883	155.0	190.9	23.3	0.032	544	384	pg176_o2nofp.cx10a_c8r32
999	531	9042	70.8	2736.1	33.8	17.018	136.454	2.738	34.644	19822	12.2	37.308	1837	155.0	190.7	23.4	0.029	544	384	pg18rc1_o2nofp.cx10b_c8r32
998	640	10398	81.4	2779.4	34.1	16.259	130.329	2.784	34.968	22821	12.8	35.686	1601	155.0	190.5	23.4	0.041	672	256	pg18rc1_o2nofp.cx10c_c8r32
998	646	10467	81.9	2781.9	34.1	16.210	129.944	2.787	34.959	22984	12.8	35.596	1586	155.0	190.4	23.4	0.040	672	288	pg18rc1_o2nofp.cx10d_c8r32
l.i0
- l.i0: load without secondary indexes
- Legend for results is here.
- Each entry lists the percentage of responses that fit in that bucket (slower than max time for previous bucket, faster than min time for next bucket).
Insert response time histogram
256us	1ms	4ms	16ms	64ms	256ms	1s	4s	16s	gt	max	tag
0.000	99.970	0.026	0.004	nonzero	0.000	0.000	0.000	0.000	0.000	0.040	pg176_o2nofp.cx10a_c8r32
0.000	99.983	0.013	0.003	nonzero	0.000	0.000	0.000	0.000	0.000	0.046	pg18rc1_o2nofp.cx10b_c8r32
0.000	99.983	0.014	0.003	nonzero	0.000	0.000	0.000	0.000	0.000	0.048	pg18rc1_o2nofp.cx10c_c8r32
0.000	99.984	0.013	0.003	nonzero	0.000	0.000	0.000	0.000	0.000	0.036	pg18rc1_o2nofp.cx10d_c8r32
l.x
- l.x: create secondary indexes
- Legend for results is here.
- Each entry lists the percentage of responses that fit in that bucket (slower than max time for previous bucket, faster than min time for next bucket).
TODO - determine whether there is data for create index response time
l.i1
- l.i1: continue load after secondary indexes created with 50 inserts per transaction
- Legend for results is here.
- Each entry lists the percentage of responses that fit in that bucket (slower than max time for previous bucket, faster than min time for next bucket).
Insert response time histogram
256us	1ms	4ms	16ms	64ms	256ms	1s	4s	16s	gt	max	tag
0.000	0.000	0.000	88.950	9.428	1.620	0.003	0.000	0.000	0.000	0.306	pg176_o2nofp.cx10a_c8r32
0.000	0.000	0.000	90.565	7.329	2.103	0.004	0.000	0.000	0.000	0.307	pg18rc1_o2nofp.cx10b_c8r32
0.000	0.000	0.000	98.170	1.706	0.124	0.000	0.000	0.000	0.000	0.112	pg18rc1_o2nofp.cx10c_c8r32
0.000	0.000	0.000	98.112	1.773	0.115	0.000	0.000	0.000	0.000	0.127	pg18rc1_o2nofp.cx10d_c8r32
Delete response time histogram
256us	1ms	4ms	16ms	64ms	256ms	1s	4s	16s	gt	max	tag
0.000	1.333	17.445	41.185	40.038	0.000	0.000	0.000	0.000	0.000	0.029	pg176_o2nofp.cx10a_c8r32
0.000	1.609	17.434	43.366	37.591	0.000	0.000	0.000	0.000	0.000	0.030	pg18rc1_o2nofp.cx10b_c8r32
0.000	0.715	17.534	44.927	36.824	0.000	0.000	0.000	0.000	0.000	0.031	pg18rc1_o2nofp.cx10c_c8r32
0.000	0.532	18.982	42.712	37.773	0.000	0.000	0.000	0.000	0.000	0.032	pg18rc1_o2nofp.cx10d_c8r32
l.i2
- l.i2: continue load after secondary indexes created with 5 inserts per transaction
- Legend for results is here.
- Each entry lists the percentage of responses that fit in that bucket (slower than max time for previous bucket, faster than min time for next bucket).
Insert response time histogram
256us	1ms	4ms	16ms	64ms	256ms	1s	4s	16s	gt	max	tag
0.000	10.630	89.259	0.110	0.001	0.000	0.000	0.000	0.000	0.000	0.019	pg176_o2nofp.cx10a_c8r32
0.000	10.586	89.394	0.019	0.001	0.000	0.000	0.000	0.000	0.000	0.018	pg18rc1_o2nofp.cx10b_c8r32
0.000	19.010	80.763	0.226	0.002	0.000	0.000	0.000	0.000	0.000	0.040	pg18rc1_o2nofp.cx10c_c8r32
0.000	19.224	80.553	0.222	0.002	0.000	0.000	0.000	0.000	0.000	0.025	pg18rc1_o2nofp.cx10d_c8r32
Delete response time histogram
256us	1ms	4ms	16ms	64ms	256ms	1s	4s	16s	gt	max	tag
0.000	0.000	0.000	0.000	99.999	0.001	0.000	0.000	0.000	0.000	0.085	pg176_o2nofp.cx10a_c8r32
0.000	0.000	0.000	0.000	99.999	0.001	0.000	0.000	0.000	0.000	0.081	pg18rc1_o2nofp.cx10b_c8r32
0.000	0.000	0.000	0.000	99.999	0.001	0.000	0.000	0.000	0.000	0.081	pg18rc1_o2nofp.cx10c_c8r32
0.000	0.000	0.000	0.000	99.999	0.001	0.000	0.000	0.000	0.000	0.081	pg18rc1_o2nofp.cx10d_c8r32
qr100.L1
- qr100.L1: range queries with 100 insert/s per client
- Legend for results is here.
- Each entry lists the percentage of responses that fit in that bucket (slower than max time for previous bucket, faster than min time for next bucket).
Query response time histogram
256us	1ms	4ms	16ms	64ms	256ms	1s	4s	16s	gt	max	tag
99.991	0.009	nonzero	0.000	nonzero	0.000	0.000	0.000	0.000	0.000	0.043	pg176_o2nofp.cx10a_c8r32
99.991	0.009	nonzero	0.000	nonzero	0.000	0.000	0.000	0.000	0.000	0.024	pg18rc1_o2nofp.cx10b_c8r32
99.990	0.010	nonzero	0.000	nonzero	0.000	0.000	0.000	0.000	0.000	0.052	pg18rc1_o2nofp.cx10c_c8r32
99.991	0.009	nonzero	nonzero	nonzero	0.000	0.000	0.000	0.000	0.000	0.042	pg18rc1_o2nofp.cx10d_c8r32
Insert response time histogram
256us	1ms	4ms	16ms	64ms	256ms	1s	4s	16s	gt	max	tag
0.000	0.000	0.028	99.833	0.139	0.000	0.000	0.000	0.000	0.000	0.058	pg176_o2nofp.cx10a_c8r32
0.000	0.000	0.028	99.917	0.056	0.000	0.000	0.000	0.000	0.000	0.058	pg18rc1_o2nofp.cx10b_c8r32
0.000	0.000	0.000	99.889	0.083	0.028	0.000	0.000	0.000	0.000	0.065	pg18rc1_o2nofp.cx10c_c8r32
0.000	0.000	0.000	99.861	0.139	0.000	0.000	0.000	0.000	0.000	0.057	pg18rc1_o2nofp.cx10d_c8r32
Delete response time histogram
256us	1ms	4ms	16ms	64ms	256ms	1s	4s	16s	gt	max	tag
0.028	59.750	40.222	0.000	0.000	0.000	0.000	0.000	0.000	0.000	0.002	pg176_o2nofp.cx10a_c8r32
0.000	57.889	42.111	0.000	0.000	0.000	0.000	0.000	0.000	0.000	0.003	pg18rc1_o2nofp.cx10b_c8r32
0.000	60.528	39.472	0.000	0.000	0.000	0.000	0.000	0.000	0.000	0.003	pg18rc1_o2nofp.cx10c_c8r32
0.000	59.556	40.444	0.000	0.000	0.000	0.000	0.000	0.000	0.000	0.002	pg18rc1_o2nofp.cx10d_c8r32
qp100.L2
- qp100.L2: point queries with 100 insert/s per client
- Legend for results is here.
- Each entry lists the percentage of responses that fit in that bucket (slower than max time for previous bucket, faster than min time for next bucket).
Query response time histogram
256us	1ms	4ms	16ms	64ms	256ms	1s	4s	16s	gt	max	tag
0.000	3.095	96.879	0.026	0.000	0.000	0.000	0.000	0.000	0.000	0.010	pg176_o2nofp.cx10a_c8r32
0.000	3.017	96.954	0.029	nonzero	0.000	0.000	0.000	0.000	0.000	0.044	pg18rc1_o2nofp.cx10b_c8r32
0.000	17.998	81.902	0.096	0.004	0.000	0.000	0.000	0.000	0.000	0.031	pg18rc1_o2nofp.cx10c_c8r32
0.000	18.832	81.073	0.093	0.003	0.000	0.000	0.000	0.000	0.000	0.031	pg18rc1_o2nofp.cx10d_c8r32
Insert response time histogram
256us	1ms	4ms	16ms	64ms	256ms	1s	4s	16s	gt	max	tag
0.000	0.000	0.000	99.972	0.028	0.000	0.000	0.000	0.000	0.000	0.017	pg176_o2nofp.cx10a_c8r32
0.000	0.000	0.000	100.000	0.000	0.000	0.000	0.000	0.000	0.000	0.015	pg18rc1_o2nofp.cx10b_c8r32
0.000	0.000	0.000	92.750	7.167	0.083	0.000	0.000	0.000	0.000	0.177	pg18rc1_o2nofp.cx10c_c8r32
0.000	0.000	0.000	99.194	0.639	0.167	0.000	0.000	0.000	0.000	0.086	pg18rc1_o2nofp.cx10d_c8r32
Delete response time histogram
256us	1ms	4ms	16ms	64ms	256ms	1s	4s	16s	gt	max	tag
0.000	4.194	95.778	0.028	0.000	0.000	0.000	0.000	0.000	0.000	0.007	pg176_o2nofp.cx10a_c8r32
0.000	4.194	95.778	0.028	0.000	0.000	0.000	0.000	0.000	0.000	0.007	pg18rc1_o2nofp.cx10b_c8r32
0.000	4.111	95.861	0.028	0.000	0.000	0.000	0.000	0.000	0.000	0.007	pg18rc1_o2nofp.cx10c_c8r32
0.000	5.111	94.861	0.028	0.000	0.000	0.000	0.000	0.000	0.000	0.007	pg18rc1_o2nofp.cx10d_c8r32
qr500.L3
- qr500.L3: range queries with 500 insert/s per client
- Legend for results is here.
- Each entry lists the percentage of responses that fit in that bucket (slower than max time for previous bucket, faster than min time for next bucket).
Query response time histogram
256us	1ms	4ms	16ms	64ms	256ms	1s	4s	16s	gt	max	tag
99.985	0.015	nonzero	nonzero	nonzero	0.000	0.000	0.000	0.000	0.000	0.026	pg176_o2nofp.cx10a_c8r32
99.984	0.016	nonzero	nonzero	nonzero	0.000	0.000	0.000	0.000	0.000	0.026	pg18rc1_o2nofp.cx10b_c8r32
99.983	0.017	0.001	nonzero	nonzero	0.000	0.000	0.000	0.000	0.000	0.035	pg18rc1_o2nofp.cx10c_c8r32
99.984	0.015	0.001	nonzero	nonzero	0.000	0.000	0.000	0.000	0.000	0.028	pg18rc1_o2nofp.cx10d_c8r32
Insert response time histogram
256us	1ms	4ms	16ms	64ms	256ms	1s	4s	16s	gt	max	tag
0.000	0.000	0.000	99.856	0.144	0.000	0.000	0.000	0.000	0.000	0.043	pg176_o2nofp.cx10a_c8r32
0.000	0.000	0.000	99.794	0.206	0.000	0.000	0.000	0.000	0.000	0.036	pg18rc1_o2nofp.cx10b_c8r32
0.000	0.000	0.000	99.628	0.294	0.078	0.000	0.000	0.000	0.000	0.146	pg18rc1_o2nofp.cx10c_c8r32
0.000	0.000	0.000	99.478	0.456	0.067	0.000	0.000	0.000	0.000	0.155	pg18rc1_o2nofp.cx10d_c8r32
Delete response time histogram
256us	1ms	4ms	16ms	64ms	256ms	1s	4s	16s	gt	max	tag
0.000	0.000	52.417	47.583	0.000	0.000	0.000	0.000	0.000	0.000	0.012	pg176_o2nofp.cx10a_c8r32
0.000	0.000	52.567	47.433	0.000	0.000	0.000	0.000	0.000	0.000	0.012	pg18rc1_o2nofp.cx10b_c8r32
0.000	0.000	52.933	47.067	0.000	0.000	0.000	0.000	0.000	0.000	0.012	pg18rc1_o2nofp.cx10c_c8r32
0.000	0.000	53.450	46.550	0.000	0.000	0.000	0.000	0.000	0.000	0.012	pg18rc1_o2nofp.cx10d_c8r32
qp500.L4
- qp500.L4: point queries with 500 insert/s per client
- Legend for results is here.
- Each entry lists the percentage of responses that fit in that bucket (slower than max time for previous bucket, faster than min time for next bucket).
Query response time histogram
256us	1ms	4ms	16ms	64ms	256ms	1s	4s	16s	gt	max	tag
0.000	1.417	98.451	0.133	nonzero	0.000	0.000	0.000	0.000	0.000	0.040	pg176_o2nofp.cx10a_c8r32
0.000	1.442	98.424	0.134	nonzero	0.000	0.000	0.000	0.000	0.000	0.033	pg18rc1_o2nofp.cx10b_c8r32
0.000	10.559	88.853	0.574	0.014	0.000	0.000	0.000	0.000	0.000	0.036	pg18rc1_o2nofp.cx10c_c8r32
0.000	11.229	88.162	0.595	0.014	0.000	0.000	0.000	0.000	0.000	0.037	pg18rc1_o2nofp.cx10d_c8r32
Insert response time histogram
256us	1ms	4ms	16ms	64ms	256ms	1s	4s	16s	gt	max	tag
0.000	0.000	0.000	99.250	0.750	0.000	0.000	0.000	0.000	0.000	0.058	pg176_o2nofp.cx10a_c8r32
0.000	0.000	0.000	99.361	0.639	0.000	0.000	0.000	0.000	0.000	0.050	pg18rc1_o2nofp.cx10b_c8r32
0.000	0.000	0.000	95.661	4.239	0.100	0.000	0.000	0.000	0.000	0.174	pg18rc1_o2nofp.cx10c_c8r32
0.000	0.000	0.000	95.539	4.328	0.133	0.000	0.000	0.000	0.000	0.187	pg18rc1_o2nofp.cx10d_c8r32
Delete response time histogram
256us	1ms	4ms	16ms	64ms	256ms	1s	4s	16s	gt	max	tag
0.000	0.000	0.000	99.100	0.900	0.000	0.000	0.000	0.000	0.000	0.035	pg176_o2nofp.cx10a_c8r32
0.000	0.000	0.000	99.950	0.050	0.000	0.000	0.000	0.000	0.000	0.035	pg18rc1_o2nofp.cx10b_c8r32
0.000	0.000	0.000	99.950	0.050	0.000	0.000	0.000	0.000	0.000	0.035	pg18rc1_o2nofp.cx10c_c8r32
0.000	0.000	0.000	99.928	0.072	0.000	0.000	0.000	0.000	0.000	0.034	pg18rc1_o2nofp.cx10d_c8r32
qr1000.L5
- qr1000.L5: range queries with 1000 insert/s per client
- Legend for results is here.
- Each entry lists the percentage of responses that fit in that bucket (slower than max time for previous bucket, faster than min time for next bucket).
Query response time histogram
256us	1ms	4ms	16ms	64ms	256ms	1s	4s	16s	gt	max	tag
99.957	0.041	0.002	nonzero	nonzero	nonzero	0.000	0.000	0.000	0.000	0.065	pg176_o2nofp.cx10a_c8r32
99.951	0.047	0.002	nonzero	nonzero	nonzero	0.000	0.000	0.000	0.000	0.078	pg18rc1_o2nofp.cx10b_c8r32
99.953	0.045	0.002	nonzero	nonzero	nonzero	0.000	0.000	0.000	0.000	0.096	pg18rc1_o2nofp.cx10c_c8r32
99.959	0.039	0.002	nonzero	nonzero	nonzero	0.000	0.000	0.000	0.000	0.118	pg18rc1_o2nofp.cx10d_c8r32
Insert response time histogram
256us	1ms	4ms	16ms	64ms	256ms	1s	4s	16s	gt	max	tag
0.000	0.000	0.000	99.581	0.419	0.000	0.000	0.000	0.000	0.000	0.030	pg176_o2nofp.cx10a_c8r32
0.000	0.000	0.000	99.644	0.356	0.000	0.000	0.000	0.000	0.000	0.029	pg18rc1_o2nofp.cx10b_c8r32
0.000	0.000	0.000	98.861	1.011	0.128	0.000	0.000	0.000	0.000	0.148	pg18rc1_o2nofp.cx10c_c8r32
0.000	0.000	0.000	98.911	0.958	0.131	0.000	0.000	0.000	0.000	0.155	pg18rc1_o2nofp.cx10d_c8r32
Delete response time histogram
256us	1ms	4ms	16ms	64ms	256ms	1s	4s	16s	gt	max	tag
0.000	0.000	0.000	11.703	88.297	0.000	0.000	0.000	0.000	0.000	0.053	pg176_o2nofp.cx10a_c8r32
0.000	0.000	0.000	18.056	81.944	0.000	0.000	0.000	0.000	0.000	0.051	pg18rc1_o2nofp.cx10b_c8r32
0.000	0.000	0.000	19.078	80.922	0.000	0.000	0.000	0.000	0.000	0.052	pg18rc1_o2nofp.cx10c_c8r32
0.000	0.000	0.000	18.897	81.103	0.000	0.000	0.000	0.000	0.000	0.052	pg18rc1_o2nofp.cx10d_c8r32
qp1000.L6
- qp1000.L6: point queries with 1000 insert/s per client
- Legend for results is here.
- Each entry lists the percentage of responses that fit in that bucket (slower than max time for previous bucket, faster than min time for next bucket).
Query response time histogram
256us	1ms	4ms	16ms	64ms	256ms	1s	4s	16s	gt	max	tag
0.000	0.457	99.244	0.299	nonzero	0.000	0.000	0.000	0.000	0.000	0.032	pg176_o2nofp.cx10a_c8r32
0.000	0.455	99.248	0.296	nonzero	0.000	0.000	0.000	0.000	0.000	0.029	pg18rc1_o2nofp.cx10b_c8r32
0.000	4.301	94.385	1.285	0.030	0.000	0.000	0.000	0.000	0.000	0.041	pg18rc1_o2nofp.cx10c_c8r32
0.000	4.585	94.083	1.301	0.031	0.000	0.000	0.000	0.000	0.000	0.040	pg18rc1_o2nofp.cx10d_c8r32
Insert response time histogram
256us	1ms	4ms	16ms	64ms	256ms	1s	4s	16s	gt	max	tag
0.000	0.000	0.000	98.867	1.133	0.000	0.000	0.000	0.000	0.000	0.036	pg176_o2nofp.cx10a_c8r32
0.000	0.000	0.000	99.008	0.992	0.000	0.000	0.000	0.000	0.000	0.042	pg18rc1_o2nofp.cx10b_c8r32
0.000	0.000	0.000	93.458	6.294	0.247	0.000	0.000	0.000	0.000	0.189	pg18rc1_o2nofp.cx10c_c8r32
0.000	0.000	0.000	93.444	6.278	0.278	0.000	0.000	0.000	0.000	0.182	pg18rc1_o2nofp.cx10d_c8r32
Delete response time histogram
256us	1ms	4ms	16ms	64ms	256ms	1s	4s	16s	gt	max	tag
0.000	0.000	0.000	0.000	99.997	0.003	0.000	0.000	0.000	0.000	0.083	pg176_o2nofp.cx10a_c8r32
0.000	0.000	0.000	0.000	99.997	0.003	0.000	0.000	0.000	0.000	0.082	pg18rc1_o2nofp.cx10b_c8r32
0.000	0.000	0.000	0.000	99.997	0.003	0.000	0.000	0.000	0.000	0.083	pg18rc1_o2nofp.cx10c_c8r32
0.000	0.000	0.000	0.000	99.997	0.003	0.000	0.000	0.000	0.000	0.083	pg18rc1_o2nofp.cx10d_c8r32