Introduction
This is a report for the insert benchmark with 800M docs and 1 client(s). It is generated by scripts (bash, awk, sed) and Tufte might not be impressed. An overview of the insert benchmark is here and a short update is here. Below, by DBMS, I mean DBMS+version.config. An example is my8020.c10b40 where my means MySQL, 8020 is version 8.0.20 and c10b40 is the name for the configuration file.
The test server has 8 AMD cores, 32G RAM and an NVMe device for the database. The benchmark was run with 1 client and there were 1 or 3 connections per client (1 for queries or inserts without rate limits, 1+1 for rate limited inserts+deletes). It uses 1 table with a table per client. It loads 800M rows per table without secondary indexes, creates 3 secondary indexes per table, then inserts 4m+1m rows per table with a delete per insert to avoid growing the table. It then does 6 read+write tests for 3600s each that do queries as fast as possible with 100,100,500,500,1000,1000 inserts/s and the same for deletes/s per client concurrent with the queries. The database is larger than memory and the working set it not cached for most benchmark steps. Clients and the DBMS share one server.
The tested DBMS are:
- pg176_o2nofp.cx10a_c8r32 - Postgres 17.6 with the x10b_c8r32 config
- pg18rc1_o2nofp.cx10b_c8r32 - Postgres 18 rc1 with the x10b_c8r32 config that uses io_method=sync
- pg18rc1_o2nofp.cx10c_c8r32 - Postgres 18 rc1 with the x10c_c8r32 config that uses io_method=worker
- pg18rc1_o2nofp.cx10d_c8r32 - Postgres 18 rc1 with the x10c_c8r32 config that uses io_method=io_uring
Contents
- Summary
- l.i0: load without secondary indexes
- l.x: create secondary indexes
- l.i1: continue load after secondary indexes created with 50 inserts per transaction
- l.i2: continue load after secondary indexes created with 5 inserts per transaction
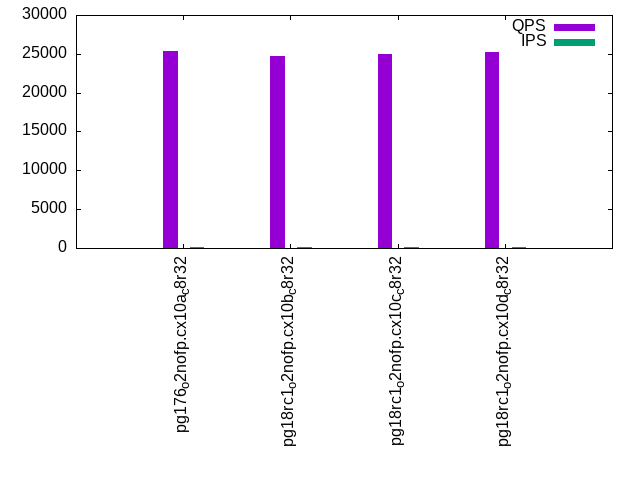
- qr100.L1: range queries with 100 insert/s per client
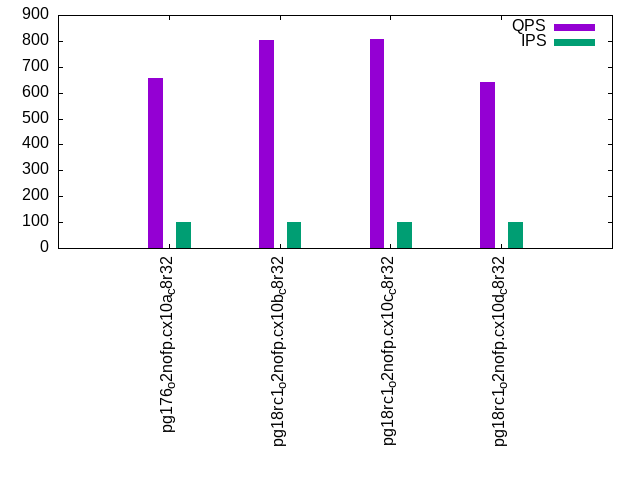
- qp100.L2: point queries with 100 insert/s per client
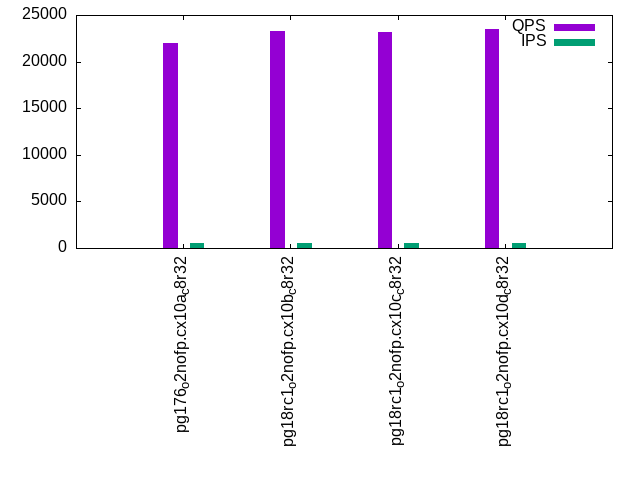
- qr500.L3: range queries with 500 insert/s per client
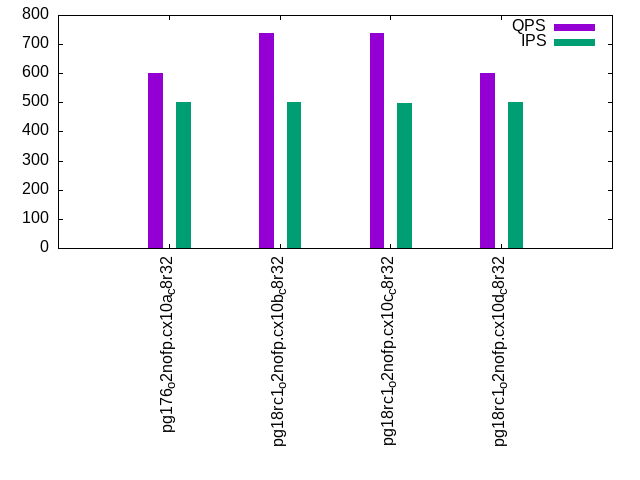
- qp500.L4: point queries with 500 insert/s per client
- qr1000.L5: range queries with 1000 insert/s per client
- qp1000.L6: point queries with 1000 insert/s per client
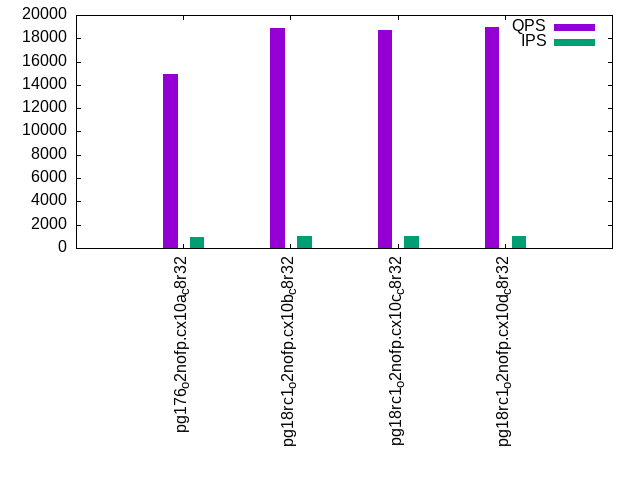
Summary
The numbers are inserts/s for l.i0, l.i1 and l.i2, indexed docs (or rows) /s for l.x and queries/s for qr100, qp100 thru qr1000, qp1000" The values are the average rate over the entire test for inserts (IPS) and queries (QPS). The range of values for IPS and QPS is split into 3 parts: bottom 25%, middle 50%, top 25%. Values in the bottom 25% have a red background, values in the top 25% have a green background and values in the middle have no color. A gray background is used for values that can be ignored because the DBMS did not sustain the target insert rate. Red backgrounds are not used when the minimum value is within 80% of the max value.
| dbms | l.i0 | l.x | l.i1 | l.i2 | qr100 | qp100 | qr500 | qp500 | qr1000 | qp1000 |
|---|---|---|---|---|---|---|---|---|---|---|
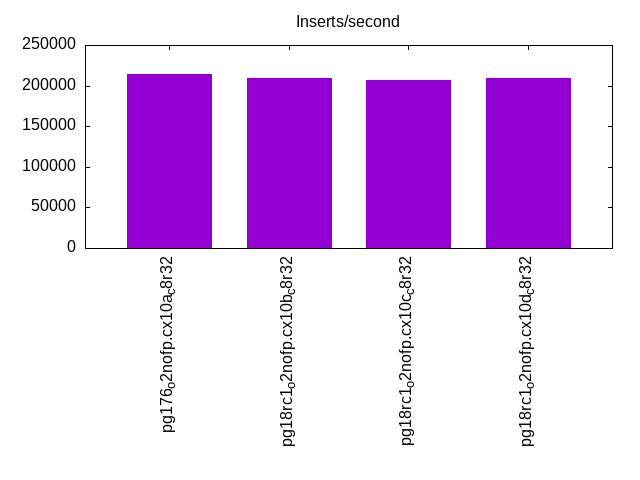
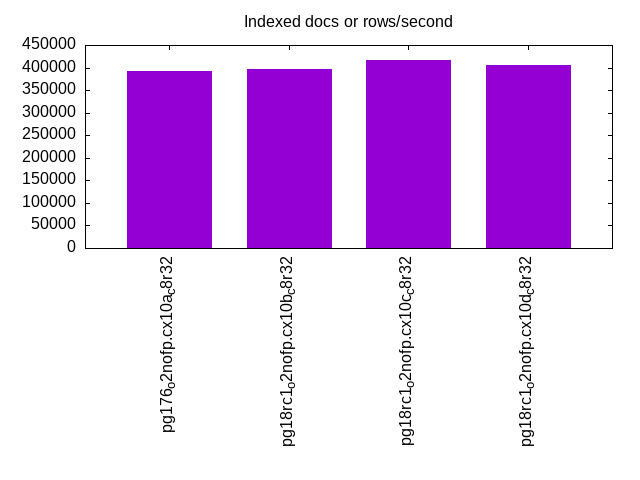
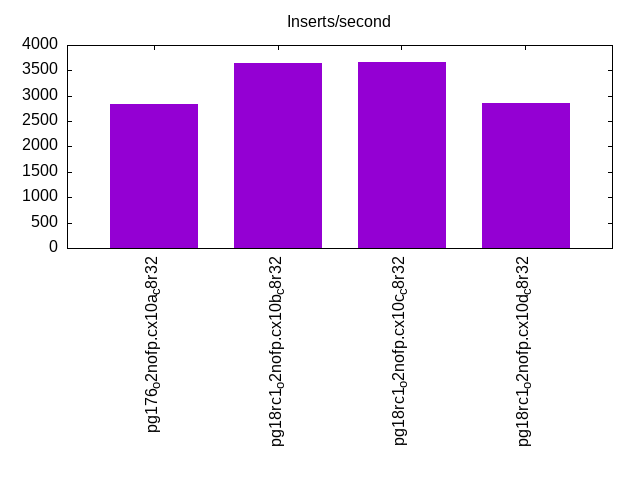
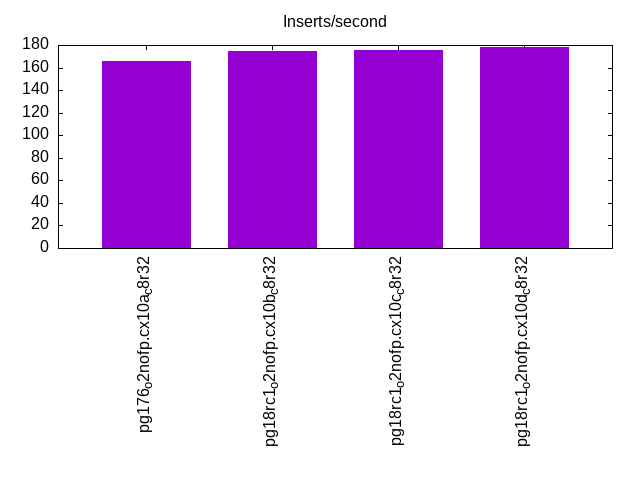
| pg176_o2nofp.cx10a_c8r32 | 214535 | 392734 | 2847 | 166 | 25416 | 658 | 22024 | 600 | 14912 | 523 |
| pg18rc1_o2nofp.cx10b_c8r32 | 209589 | 395844 | 3650 | 175 | 24754 | 805 | 23329 | 739 | 18866 | 644 |
| pg18rc1_o2nofp.cx10c_c8r32 | 206718 | 416017 | 3656 | 176 | 24916 | 806 | 23211 | 738 | 18743 | 646 |
| pg18rc1_o2nofp.cx10d_c8r32 | 208986 | 405680 | 2851 | 178 | 25251 | 642 | 23517 | 602 | 18997 | 532 |
This table has relative throughput, throughput for the DBMS relative to the DBMS in the first line, using the absolute throughput from the previous table. Values less than 0.95 have a yellow background. Values greater than 1.05 have a blue background.
| dbms | l.i0 | l.x | l.i1 | l.i2 | qr100 | qp100 | qr500 | qp500 | qr1000 | qp1000 |
|---|---|---|---|---|---|---|---|---|---|---|
| pg176_o2nofp.cx10a_c8r32 | 1.00 | 1.00 | 1.00 | 1.00 | 1.00 | 1.00 | 1.00 | 1.00 | 1.00 | 1.00 |
| pg18rc1_o2nofp.cx10b_c8r32 | 0.98 | 1.01 | 1.28 | 1.05 | 0.97 | 1.22 | 1.06 | 1.23 | 1.27 | 1.23 |
| pg18rc1_o2nofp.cx10c_c8r32 | 0.96 | 1.06 | 1.28 | 1.06 | 0.98 | 1.22 | 1.05 | 1.23 | 1.26 | 1.24 |
| pg18rc1_o2nofp.cx10d_c8r32 | 0.97 | 1.03 | 1.00 | 1.07 | 0.99 | 0.98 | 1.07 | 1.00 | 1.27 | 1.02 |
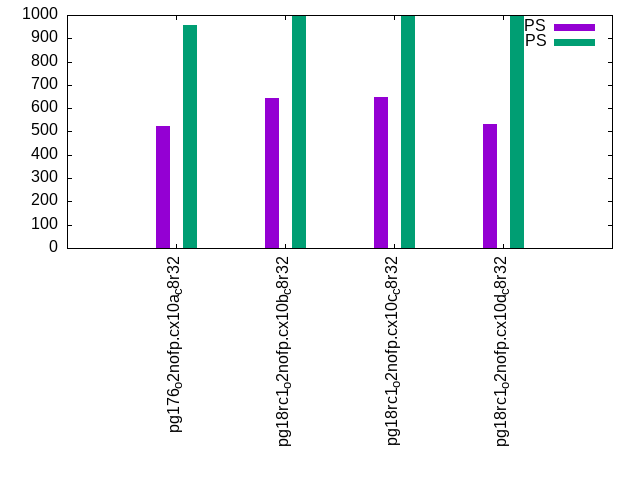
This lists the average rate of inserts/s for the tests that do inserts concurrent with queries. For such tests the query rate is listed in the table above. The read+write tests are setup so that the insert rate should match the target rate every second. Cells that are not at least 95% of the target have a red background to indicate a failure to satisfy the target.
| dbms | qr100.L1 | qp100.L2 | qr500.L3 | qp500.L4 | qr1000.L5 | qp1000.L6 |
|---|---|---|---|---|---|---|
| pg176_o2nofp.cx10a_c8r32 | 100 | 100 | 500 | 500 | 975 | 957 |
| pg18rc1_o2nofp.cx10b_c8r32 | 100 | 100 | 500 | 500 | 999 | 999 |
| pg18rc1_o2nofp.cx10c_c8r32 | 100 | 100 | 499 | 499 | 999 | 998 |
| pg18rc1_o2nofp.cx10d_c8r32 | 100 | 100 | 500 | 500 | 999 | 999 |
| target | 100 | 100 | 500 | 500 | 1000 | 1000 |
l.i0
l.i0: load without secondary indexes. Graphs for performance per 1-second interval are here.
Average throughput:
Insert response time histogram: each cell has the percentage of responses that take <= the time in the header and max is the max response time in seconds. For the max column values in the top 25% of the range have a red background and in the bottom 25% of the range have a green background. The red background is not used when the min value is within 80% of the max value.
| dbms | 256us | 1ms | 4ms | 16ms | 64ms | 256ms | 1s | 4s | 16s | gt | max |
|---|---|---|---|---|---|---|---|---|---|---|---|
| pg176_o2nofp.cx10a_c8r32 | 99.982 | 0.015 | 0.002 | 0.001 | 0.040 | ||||||
| pg18rc1_o2nofp.cx10b_c8r32 | 99.983 | 0.014 | 0.003 | nonzero | 0.042 | ||||||
| pg18rc1_o2nofp.cx10c_c8r32 | 99.982 | 0.015 | 0.003 | nonzero | 0.047 | ||||||
| pg18rc1_o2nofp.cx10d_c8r32 | 99.982 | 0.014 | 0.003 | nonzero | 0.043 |
Performance metrics for the DBMS listed above. Some are normalized by throughput, others are not. Legend for results is here.
ips	qps	rps	rmbps	wps	wmbps	rpq	rkbpq	wpi	wkbpi	csps	cpups	cspq	cpupq	dbgb1	dbgb2	rss	maxop	p50	p99	tag
214535	0	37	0.3	798.8	88.3	0.000	0.001	0.004	0.422	21359	20.7	0.100	8	76.5	116.6	19.8	0.040	215876	207765	pg176_o2nofp.cx10a_c8r32
209589	0	36	0.3	783.9	86.1	0.000	0.001	0.004	0.421	20856	20.4	0.100	8	76.5	116.6	18.9	0.042	210764	203071	pg18rc1_o2nofp.cx10b_c8r32
206718	0	34	0.3	774.0	85.1	0.000	0.001	0.004	0.422	20698	20.3	0.100	8	76.5	116.6	0.2	0.047	207969	200278	pg18rc1_o2nofp.cx10c_c8r32
208986	0	35	0.3	782.0	85.9	0.000	0.001	0.004	0.421	20930	20.5	0.100	8	76.5	116.6	1.2	0.043	210273	202065	pg18rc1_o2nofp.cx10d_c8r32
l.x
l.x: create secondary indexes.
Average throughput:
Performance metrics for the DBMS listed above. Some are normalized by throughput, others are not. Legend for results is here.
ips	qps	rps	rmbps	wps	wmbps	rpq	rkbpq	wpi	wkbpi	csps	cpups	cspq	cpupq	dbgb1	dbgb2	rss	maxop	p50	p99	tag
392734	0	1140	135.1	1221.5	146.9	0.003	0.352	0.003	0.383	1077	12.4	0.003	3	153.6	193.7	22.7	0.002	NA	NA	pg176_o2nofp.cx10a_c8r32
395844	0	1068	131.8	1242.1	147.8	0.003	0.341	0.003	0.382	1122	12.5	0.003	3	153.6	193.7	14.8	0.002	NA	NA	pg18rc1_o2nofp.cx10b_c8r32
416017	0	1350	150.3	1269.9	155.5	0.003	0.370	0.003	0.383	2171	13.1	0.005	3	153.6	193.7	23.4	0.003	NA	NA	pg18rc1_o2nofp.cx10c_c8r32
405680	0	1283	145.1	1242.9	151.6	0.003	0.366	0.003	0.383	1779	13.1	0.004	3	153.6	193.7	23.4	0.003	NA	NA	pg18rc1_o2nofp.cx10d_c8r32
l.i1
l.i1: continue load after secondary indexes created with 50 inserts per transaction. Graphs for performance per 1-second interval are here.
Average throughput:
Insert response time histogram: each cell has the percentage of responses that take <= the time in the header and max is the max response time in seconds. For the max column values in the top 25% of the range have a red background and in the bottom 25% of the range have a green background. The red background is not used when the min value is within 80% of the max value.
| dbms | 256us | 1ms | 4ms | 16ms | 64ms | 256ms | 1s | 4s | 16s | gt | max |
|---|---|---|---|---|---|---|---|---|---|---|---|
| pg176_o2nofp.cx10a_c8r32 | 90.094 | 8.321 | 1.584 | 0.001 | 0.509 | ||||||
| pg18rc1_o2nofp.cx10b_c8r32 | 98.340 | 1.541 | 0.119 | 0.135 | |||||||
| pg18rc1_o2nofp.cx10c_c8r32 | 98.034 | 1.846 | 0.120 | 0.121 | |||||||
| pg18rc1_o2nofp.cx10d_c8r32 | 85.936 | 12.840 | 1.221 | 0.003 | 0.391 |
Delete response time histogram: each cell has the percentage of responses that take <= the time in the header and max is the max response time in seconds. For the max column values in the top 25% of the range have a red background and in the bottom 25% of the range have a green background. The red background is not used when the min value is within 80% of the max value.
| dbms | 256us | 1ms | 4ms | 16ms | 64ms | 256ms | 1s | 4s | 16s | gt | max |
|---|---|---|---|---|---|---|---|---|---|---|---|
| pg176_o2nofp.cx10a_c8r32 | 1.439 | 16.934 | 41.771 | 39.856 | 0.031 | ||||||
| pg18rc1_o2nofp.cx10b_c8r32 | 0.860 | 17.534 | 43.816 | 37.790 | 0.032 | ||||||
| pg18rc1_o2nofp.cx10c_c8r32 | 0.923 | 17.381 | 44.824 | 36.873 | 0.030 | ||||||
| pg18rc1_o2nofp.cx10d_c8r32 | 1.109 | 17.680 | 44.745 | 36.466 | 0.031 |
Performance metrics for the DBMS listed above. Some are normalized by throughput, others are not. Legend for results is here.
ips	qps	rps	rmbps	wps	wmbps	rpq	rkbpq	wpi	wkbpi	csps	cpups	cspq	cpupq	dbgb1	dbgb2	rss	maxop	p50	p99	tag
2847	0	4080	32.1	3384.8	57.9	1.433	11.535	1.189	20.837	9191	12.3	3.229	346	154.3	194.3	22.6	0.509	2450	650	pg176_o2nofp.cx10a_c8r32
3650	0	5234	41.2	4341.6	74.6	1.434	11.561	1.190	20.917	11767	15.2	3.224	333	154.3	194.3	22.5	0.135	2849	1949	pg18rc1_o2nofp.cx10b_c8r32
3656	0	5286	41.6	4326.8	74.1	1.446	11.663	1.183	20.749	11871	15.1	3.247	330	154.3	194.3	22.9	0.121	2849	1600	pg18rc1_o2nofp.cx10c_c8r32
2851	0	4097	32.3	3402.0	58.3	1.437	11.595	1.193	20.930	9218	11.9	3.233	334	154.3	194.3	22.9	0.391	2450	750	pg18rc1_o2nofp.cx10d_c8r32
l.i2
l.i2: continue load after secondary indexes created with 5 inserts per transaction. Graphs for performance per 1-second interval are here.
Average throughput:
Insert response time histogram: each cell has the percentage of responses that take <= the time in the header and max is the max response time in seconds. For the max column values in the top 25% of the range have a red background and in the bottom 25% of the range have a green background. The red background is not used when the min value is within 80% of the max value.
| dbms | 256us | 1ms | 4ms | 16ms | 64ms | 256ms | 1s | 4s | 16s | gt | max |
|---|---|---|---|---|---|---|---|---|---|---|---|
| pg176_o2nofp.cx10a_c8r32 | 11.162 | 88.807 | 0.031 | 0.001 | 0.018 | ||||||
| pg18rc1_o2nofp.cx10b_c8r32 | 17.865 | 81.865 | 0.268 | 0.002 | 0.018 | ||||||
| pg18rc1_o2nofp.cx10c_c8r32 | 18.712 | 81.061 | 0.226 | 0.002 | 0.031 | ||||||
| pg18rc1_o2nofp.cx10d_c8r32 | 11.795 | 88.182 | 0.022 | 0.001 | 0.022 |
Delete response time histogram: each cell has the percentage of responses that take <= the time in the header and max is the max response time in seconds. For the max column values in the top 25% of the range have a red background and in the bottom 25% of the range have a green background. The red background is not used when the min value is within 80% of the max value.
| dbms | 256us | 1ms | 4ms | 16ms | 64ms | 256ms | 1s | 4s | 16s | gt | max |
|---|---|---|---|---|---|---|---|---|---|---|---|
| pg176_o2nofp.cx10a_c8r32 | 99.999 | 0.001 | 0.080 | ||||||||
| pg18rc1_o2nofp.cx10b_c8r32 | 99.999 | 0.001 | 0.083 | ||||||||
| pg18rc1_o2nofp.cx10c_c8r32 | 99.999 | 0.001 | 0.082 | ||||||||
| pg18rc1_o2nofp.cx10d_c8r32 | 99.999 | 0.001 | 0.081 |
Performance metrics for the DBMS listed above. Some are normalized by throughput, others are not. Legend for results is here.
ips	qps	rps	rmbps	wps	wmbps	rpq	rkbpq	wpi	wkbpi	csps	cpups	cspq	cpupq	dbgb1	dbgb2	rss	maxop	p50	p99	tag
166	0	178	1.4	495.2	6.8	1.067	8.574	2.974	41.781	1077	12.7	6.466	6102	154.4	194.5	22.7	0.018	165	145	pg176_o2nofp.cx10a_c8r32
175	0	186	1.5	503.8	7.0	1.066	8.564	2.879	40.999	1120	12.8	6.400	5851	154.4	194.5	23.3	0.018	175	155	pg18rc1_o2nofp.cx10b_c8r32
176	0	188	1.5	508.5	7.1	1.071	8.677	2.897	41.138	1127	12.7	6.423	5789	154.4	194.5	22.9	0.031	175	155	pg18rc1_o2nofp.cx10c_c8r32
178	0	190	1.5	513.4	7.1	1.071	8.676	2.891	40.880	1135	12.8	6.390	5766	154.4	194.5	23.4	0.022	175	155	pg18rc1_o2nofp.cx10d_c8r32
qr100.L1
qr100.L1: range queries with 100 insert/s per client. Graphs for performance per 1-second interval are here.
Average throughput:
Query response time histogram: each cell has the percentage of responses that take <= the time in the header and max is the max response time in seconds. For max values in the top 25% of the range have a red background and in the bottom 25% of the range have a green background. The red background is not used when the min value is within 80% of the max value.
| dbms | 256us | 1ms | 4ms | 16ms | 64ms | 256ms | 1s | 4s | 16s | gt | max |
|---|---|---|---|---|---|---|---|---|---|---|---|
| pg176_o2nofp.cx10a_c8r32 | 99.992 | 0.008 | nonzero | nonzero | nonzero | 0.025 | |||||
| pg18rc1_o2nofp.cx10b_c8r32 | 99.991 | 0.009 | nonzero | nonzero | 0.026 | ||||||
| pg18rc1_o2nofp.cx10c_c8r32 | 99.991 | 0.009 | nonzero | nonzero | 0.041 | ||||||
| pg18rc1_o2nofp.cx10d_c8r32 | 99.989 | 0.011 | nonzero | nonzero | 0.044 |
Insert response time histogram: each cell has the percentage of responses that take <= the time in the header and max is the max response time in seconds. For max values in the top 25% of the range have a red background and in the bottom 25% of the range have a green background. The red background is not used when the min value is within 80% of the max value.
| dbms | 256us | 1ms | 4ms | 16ms | 64ms | 256ms | 1s | 4s | 16s | gt | max |
|---|---|---|---|---|---|---|---|---|---|---|---|
| pg176_o2nofp.cx10a_c8r32 | 99.875 | 0.125 | 0.057 | ||||||||
| pg18rc1_o2nofp.cx10b_c8r32 | 99.917 | 0.056 | 0.028 | 0.074 | |||||||
| pg18rc1_o2nofp.cx10c_c8r32 | 0.028 | 99.917 | 0.056 | 0.055 | |||||||
| pg18rc1_o2nofp.cx10d_c8r32 | 0.056 | 99.889 | 0.056 | 0.056 |
Delete response time histogram: each cell has the percentage of responses that take <= the time in the header and max is the max response time in seconds. For max values in the top 25% of the range have a red background and in the bottom 25% of the range have a green background. The red background is not used when the min value is within 80% of the max value.
| dbms | 256us | 1ms | 4ms | 16ms | 64ms | 256ms | 1s | 4s | 16s | gt | max |
|---|---|---|---|---|---|---|---|---|---|---|---|
| pg176_o2nofp.cx10a_c8r32 | 30.986 | 69.014 | 0.003 | ||||||||
| pg18rc1_o2nofp.cx10b_c8r32 | 58.361 | 41.639 | 0.003 | ||||||||
| pg18rc1_o2nofp.cx10c_c8r32 | 59.556 | 40.444 | 0.002 | ||||||||
| pg18rc1_o2nofp.cx10d_c8r32 | 58.389 | 41.611 | 0.002 |
Performance metrics for the DBMS listed above. Some are normalized by throughput, others are not. Legend for results is here.
ips	qps	rps	rmbps	wps	wmbps	rpq	rkbpq	wpi	wkbpi	csps	cpups	cspq	cpupq	dbgb1	dbgb2	rss	maxop	p50	p99	tag
100	25416	111	0.9	114.8	2.3	0.004	0.035	1.149	23.491	97342	8.5	3.830	27	154.5	193.8	23.3	0.025	25308	24695	pg176_o2nofp.cx10a_c8r32
100	24754	111	0.9	67.4	1.9	0.004	0.036	0.675	19.515	94728	8.6	3.827	28	154.4	191.7	23.3	0.026	24684	24379	pg18rc1_o2nofp.cx10b_c8r32
100	24916	111	0.9	67.9	1.9	0.004	0.036	0.680	19.568	95350	8.6	3.827	28	154.5	192.7	23.4	0.041	24989	24492	pg18rc1_o2nofp.cx10c_c8r32
100	25251	111	0.9	69.0	1.9	0.004	0.036	0.690	19.623	96571	8.4	3.824	27	154.4	191.7	23.4	0.044	25371	24668	pg18rc1_o2nofp.cx10d_c8r32
qp100.L2
qp100.L2: point queries with 100 insert/s per client. Graphs for performance per 1-second interval are here.
Average throughput:
Query response time histogram: each cell has the percentage of responses that take <= the time in the header and max is the max response time in seconds. For max values in the top 25% of the range have a red background and in the bottom 25% of the range have a green background. The red background is not used when the min value is within 80% of the max value.
| dbms | 256us | 1ms | 4ms | 16ms | 64ms | 256ms | 1s | 4s | 16s | gt | max |
|---|---|---|---|---|---|---|---|---|---|---|---|
| pg176_o2nofp.cx10a_c8r32 | 3.414 | 96.560 | 0.026 | nonzero | 0.043 | ||||||
| pg18rc1_o2nofp.cx10b_c8r32 | 19.606 | 80.289 | 0.101 | 0.004 | 0.035 | ||||||
| pg18rc1_o2nofp.cx10c_c8r32 | 19.667 | 80.249 | 0.083 | 0.002 | 0.027 | ||||||
| pg18rc1_o2nofp.cx10d_c8r32 | 3.044 | 96.930 | 0.025 | nonzero | 0.029 |
Insert response time histogram: each cell has the percentage of responses that take <= the time in the header and max is the max response time in seconds. For max values in the top 25% of the range have a red background and in the bottom 25% of the range have a green background. The red background is not used when the min value is within 80% of the max value.
| dbms | 256us | 1ms | 4ms | 16ms | 64ms | 256ms | 1s | 4s | 16s | gt | max |
|---|---|---|---|---|---|---|---|---|---|---|---|
| pg176_o2nofp.cx10a_c8r32 | 99.875 | 0.125 | 0.036 | ||||||||
| pg18rc1_o2nofp.cx10b_c8r32 | 93.194 | 6.667 | 0.139 | 0.196 | |||||||
| pg18rc1_o2nofp.cx10c_c8r32 | 92.528 | 7.417 | 0.056 | 0.187 | |||||||
| pg18rc1_o2nofp.cx10d_c8r32 | 99.917 | 0.083 | 0.028 |
Delete response time histogram: each cell has the percentage of responses that take <= the time in the header and max is the max response time in seconds. For max values in the top 25% of the range have a red background and in the bottom 25% of the range have a green background. The red background is not used when the min value is within 80% of the max value.
| dbms | 256us | 1ms | 4ms | 16ms | 64ms | 256ms | 1s | 4s | 16s | gt | max |
|---|---|---|---|---|---|---|---|---|---|---|---|
| pg176_o2nofp.cx10a_c8r32 | 75.236 | 24.764 | 0.012 | ||||||||
| pg18rc1_o2nofp.cx10b_c8r32 | 5.500 | 94.444 | 0.056 | 0.007 | |||||||
| pg18rc1_o2nofp.cx10c_c8r32 | 4.417 | 95.556 | 0.028 | 0.007 | |||||||
| pg18rc1_o2nofp.cx10d_c8r32 | 4.194 | 95.778 | 0.028 | 0.007 |
Performance metrics for the DBMS listed above. Some are normalized by throughput, others are not. Legend for results is here.
ips	qps	rps	rmbps	wps	wmbps	rpq	rkbpq	wpi	wkbpi	csps	cpups	cspq	cpupq	dbgb1	dbgb2	rss	maxop	p50	p99	tag
100	658	8263	64.6	307.0	3.8	12.567	100.593	3.070	38.420	18462	2.3	28.079	280	154.5	188.8	23.3	0.043	672	448	pg176_o2nofp.cx10a_c8r32
100	805	10214	79.8	351.6	4.1	12.683	101.520	3.516	41.985	22717	3.6	28.209	358	154.5	191.7	23.3	0.035	832	544	pg18rc1_o2nofp.cx10b_c8r32
100	806	10229	80.0	348.9	4.1	12.685	101.555	3.493	41.825	22756	3.6	28.219	357	154.5	192.7	23.4	0.027	832	544	pg18rc1_o2nofp.cx10c_c8r32
100	642	8270	64.7	345.6	4.1	12.877	103.231	3.456	41.524	18390	2.6	28.636	324	154.5	191.7	23.4	0.029	656	432	pg18rc1_o2nofp.cx10d_c8r32
qr500.L3
qr500.L3: range queries with 500 insert/s per client. Graphs for performance per 1-second interval are here.
Average throughput:
Query response time histogram: each cell has the percentage of responses that take <= the time in the header and max is the max response time in seconds. For max values in the top 25% of the range have a red background and in the bottom 25% of the range have a green background. The red background is not used when the min value is within 80% of the max value.
| dbms | 256us | 1ms | 4ms | 16ms | 64ms | 256ms | 1s | 4s | 16s | gt | max |
|---|---|---|---|---|---|---|---|---|---|---|---|
| pg176_o2nofp.cx10a_c8r32 | 99.983 | 0.017 | nonzero | nonzero | 0.006 | ||||||
| pg18rc1_o2nofp.cx10b_c8r32 | 99.984 | 0.016 | nonzero | nonzero | 0.007 | ||||||
| pg18rc1_o2nofp.cx10c_c8r32 | 99.984 | 0.015 | 0.001 | nonzero | nonzero | nonzero | 0.312 | ||||
| pg18rc1_o2nofp.cx10d_c8r32 | 99.982 | 0.018 | nonzero | nonzero | nonzero | 0.022 |
Insert response time histogram: each cell has the percentage of responses that take <= the time in the header and max is the max response time in seconds. For max values in the top 25% of the range have a red background and in the bottom 25% of the range have a green background. The red background is not used when the min value is within 80% of the max value.
| dbms | 256us | 1ms | 4ms | 16ms | 64ms | 256ms | 1s | 4s | 16s | gt | max |
|---|---|---|---|---|---|---|---|---|---|---|---|
| pg176_o2nofp.cx10a_c8r32 | 99.808 | 0.192 | 0.027 | ||||||||
| pg18rc1_o2nofp.cx10b_c8r32 | 99.728 | 0.189 | 0.083 | 0.131 | |||||||
| pg18rc1_o2nofp.cx10c_c8r32 | 99.700 | 0.261 | 0.039 | 0.191 | |||||||
| pg18rc1_o2nofp.cx10d_c8r32 | 99.872 | 0.128 | 0.049 |
Delete response time histogram: each cell has the percentage of responses that take <= the time in the header and max is the max response time in seconds. For max values in the top 25% of the range have a red background and in the bottom 25% of the range have a green background. The red background is not used when the min value is within 80% of the max value.
| dbms | 256us | 1ms | 4ms | 16ms | 64ms | 256ms | 1s | 4s | 16s | gt | max |
|---|---|---|---|---|---|---|---|---|---|---|---|
| pg176_o2nofp.cx10a_c8r32 | 7.803 | 81.294 | 10.903 | 0.021 | |||||||
| pg18rc1_o2nofp.cx10b_c8r32 | 52.628 | 47.372 | 0.013 | ||||||||
| pg18rc1_o2nofp.cx10c_c8r32 | 54.100 | 45.900 | 0.012 | ||||||||
| pg18rc1_o2nofp.cx10d_c8r32 | 52.744 | 47.256 | 0.012 |
Performance metrics for the DBMS listed above. Some are normalized by throughput, others are not. Legend for results is here.
ips	qps	rps	rmbps	wps	wmbps	rpq	rkbpq	wpi	wkbpi	csps	cpups	cspq	cpupq	dbgb1	dbgb2	rss	maxop	p50	p99	tag
500	22024	756	6.0	499.3	10.6	0.034	0.278	0.999	21.741	85771	10.8	3.894	39	154.7	183.8	23.3	0.006	21927	20205	pg176_o2nofp.cx10a_c8r32
500	23329	869	6.9	344.3	9.3	0.037	0.301	0.689	19.106	90833	9.7	3.894	33	154.5	190.2	23.3	0.007	23419	22275	pg18rc1_o2nofp.cx10b_c8r32
499	23211	872	6.9	347.3	9.3	0.038	0.305	0.695	19.170	90443	9.9	3.897	34	154.5	190.4	23.4	0.312	23303	22157	pg18rc1_o2nofp.cx10c_c8r32
500	23517	870	6.9	356.2	9.4	0.037	0.301	0.713	19.303	91553	9.6	3.893	33	154.5	190.2	23.4	0.022	23549	22390	pg18rc1_o2nofp.cx10d_c8r32
qp500.L4
qp500.L4: point queries with 500 insert/s per client. Graphs for performance per 1-second interval are here.
Average throughput:
Query response time histogram: each cell has the percentage of responses that take <= the time in the header and max is the max response time in seconds. For max values in the top 25% of the range have a red background and in the bottom 25% of the range have a green background. The red background is not used when the min value is within 80% of the max value.
| dbms | 256us | 1ms | 4ms | 16ms | 64ms | 256ms | 1s | 4s | 16s | gt | max |
|---|---|---|---|---|---|---|---|---|---|---|---|
| pg176_o2nofp.cx10a_c8r32 | 1.464 | 98.406 | 0.128 | 0.003 | 0.045 | ||||||
| pg18rc1_o2nofp.cx10b_c8r32 | 10.863 | 88.556 | 0.568 | 0.013 | 0.038 | ||||||
| pg18rc1_o2nofp.cx10c_c8r32 | 10.861 | 88.544 | 0.575 | 0.018 | 0.001 | 0.112 | |||||
| pg18rc1_o2nofp.cx10d_c8r32 | nonzero | 1.434 | 98.438 | 0.128 | 0.012 |
Insert response time histogram: each cell has the percentage of responses that take <= the time in the header and max is the max response time in seconds. For max values in the top 25% of the range have a red background and in the bottom 25% of the range have a green background. The red background is not used when the min value is within 80% of the max value.
| dbms | 256us | 1ms | 4ms | 16ms | 64ms | 256ms | 1s | 4s | 16s | gt | max |
|---|---|---|---|---|---|---|---|---|---|---|---|
| pg176_o2nofp.cx10a_c8r32 | 99.217 | 0.761 | 0.022 | 0.175 | |||||||
| pg18rc1_o2nofp.cx10b_c8r32 | 95.278 | 4.622 | 0.100 | 0.192 | |||||||
| pg18rc1_o2nofp.cx10c_c8r32 | 95.728 | 4.100 | 0.156 | 0.017 | 0.566 | ||||||
| pg18rc1_o2nofp.cx10d_c8r32 | 99.222 | 0.778 | 0.033 |
Delete response time histogram: each cell has the percentage of responses that take <= the time in the header and max is the max response time in seconds. For max values in the top 25% of the range have a red background and in the bottom 25% of the range have a green background. The red background is not used when the min value is within 80% of the max value.
| dbms | 256us | 1ms | 4ms | 16ms | 64ms | 256ms | 1s | 4s | 16s | gt | max |
|---|---|---|---|---|---|---|---|---|---|---|---|
| pg176_o2nofp.cx10a_c8r32 | 0.072 | 99.928 | 0.057 | ||||||||
| pg18rc1_o2nofp.cx10b_c8r32 | 99.944 | 0.056 | 0.036 | ||||||||
| pg18rc1_o2nofp.cx10c_c8r32 | 99.939 | 0.061 | 0.035 | ||||||||
| pg18rc1_o2nofp.cx10d_c8r32 | 99.950 | 0.050 | 0.034 |
Performance metrics for the DBMS listed above. Some are normalized by throughput, others are not. Legend for results is here.
ips	qps	rps	rmbps	wps	wmbps	rpq	rkbpq	wpi	wkbpi	csps	cpups	cspq	cpupq	dbgb1	dbgb2	rss	maxop	p50	p99	tag
500	600	8634	67.5	1383.5	17.0	14.379	115.075	2.767	34.796	19096	6.2	31.800	826	154.8	182.9	23.3	0.045	608	400	pg176_o2nofp.cx10a_c8r32
500	739	10387	81.2	1580.9	18.5	14.052	112.508	3.164	37.870	22939	4.9	31.032	530	154.6	188.5	23.3	0.038	768	480	pg18rc1_o2nofp.cx10b_c8r32
499	738	10355	81.0	1580.6	18.5	14.041	112.504	3.165	37.897	22878	4.9	31.021	532	154.6	188.6	23.4	0.112	768	480	pg18rc1_o2nofp.cx10c_c8r32
500	602	8696	68.1	1553.4	18.3	14.443	115.843	3.107	37.404	19184	4.8	31.862	638	154.6	188.4	23.4	0.012	624	448	pg18rc1_o2nofp.cx10d_c8r32
qr1000.L5
qr1000.L5: range queries with 1000 insert/s per client. Graphs for performance per 1-second interval are here.
Average throughput:
Query response time histogram: each cell has the percentage of responses that take <= the time in the header and max is the max response time in seconds. For max values in the top 25% of the range have a red background and in the bottom 25% of the range have a green background. The red background is not used when the min value is within 80% of the max value.
| dbms | 256us | 1ms | 4ms | 16ms | 64ms | 256ms | 1s | 4s | 16s | gt | max |
|---|---|---|---|---|---|---|---|---|---|---|---|
| pg176_o2nofp.cx10a_c8r32 | 99.927 | 0.072 | 0.001 | nonzero | nonzero | 0.023 | |||||
| pg18rc1_o2nofp.cx10b_c8r32 | 99.959 | 0.038 | 0.002 | nonzero | nonzero | 0.017 | |||||
| pg18rc1_o2nofp.cx10c_c8r32 | 99.953 | 0.045 | 0.002 | nonzero | nonzero | nonzero | 0.110 | ||||
| pg18rc1_o2nofp.cx10d_c8r32 | 99.950 | 0.049 | 0.002 | nonzero | nonzero | nonzero | 0.070 |
Insert response time histogram: each cell has the percentage of responses that take <= the time in the header and max is the max response time in seconds. For max values in the top 25% of the range have a red background and in the bottom 25% of the range have a green background. The red background is not used when the min value is within 80% of the max value.
| dbms | 256us | 1ms | 4ms | 16ms | 64ms | 256ms | 1s | 4s | 16s | gt | max |
|---|---|---|---|---|---|---|---|---|---|---|---|
| pg176_o2nofp.cx10a_c8r32 | 0.050 | 99.763 | 0.188 | 0.030 | |||||||
| pg18rc1_o2nofp.cx10b_c8r32 | 98.919 | 0.942 | 0.139 | 0.230 | |||||||
| pg18rc1_o2nofp.cx10c_c8r32 | 98.803 | 1.075 | 0.122 | 0.161 | |||||||
| pg18rc1_o2nofp.cx10d_c8r32 | 99.667 | 0.333 | 0.031 |
Delete response time histogram: each cell has the percentage of responses that take <= the time in the header and max is the max response time in seconds. For max values in the top 25% of the range have a red background and in the bottom 25% of the range have a green background. The red background is not used when the min value is within 80% of the max value.
| dbms | 256us | 1ms | 4ms | 16ms | 64ms | 256ms | 1s | 4s | 16s | gt | max |
|---|---|---|---|---|---|---|---|---|---|---|---|
| pg176_o2nofp.cx10a_c8r32 | 99.999 | 0.001 | 0.089 | ||||||||
| pg18rc1_o2nofp.cx10b_c8r32 | 17.756 | 82.244 | 0.055 | ||||||||
| pg18rc1_o2nofp.cx10c_c8r32 | 17.481 | 82.519 | 0.051 | ||||||||
| pg18rc1_o2nofp.cx10d_c8r32 | 17.358 | 82.642 | 0.053 |
Performance metrics for the DBMS listed above. Some are normalized by throughput, others are not. Legend for results is here.
ips	qps	rps	rmbps	wps	wmbps	rpq	rkbpq	wpi	wkbpi	csps	cpups	cspq	cpupq	dbgb1	dbgb2	rss	maxop	p50	p99	tag
975	14912	1260	9.9	1284.7	23.7	0.085	0.683	1.317	24.845	59848	21.9	4.013	117	155.4	191.5	23.3	0.023	14888	13070	pg176_o2nofp.cx10a_c8r32
999	18866	1491	11.8	931.4	19.1	0.079	0.641	0.933	19.561	75230	15.9	3.988	67	154.8	187.7	23.3	0.017	18887	17261	pg18rc1_o2nofp.cx10b_c8r32
999	18743	1499	12.0	930.2	19.1	0.080	0.654	0.931	19.558	74812	15.8	3.992	67	154.8	187.8	23.4	0.110	18775	17176	pg18rc1_o2nofp.cx10c_c8r32
999	18997	1494	11.9	937.9	19.1	0.079	0.643	0.938	19.621	75739	15.7	3.987	66	154.8	187.6	23.4	0.070	19005	17270	pg18rc1_o2nofp.cx10d_c8r32
qp1000.L6
qp1000.L6: point queries with 1000 insert/s per client. Graphs for performance per 1-second interval are here.
Average throughput:
Query response time histogram: each cell has the percentage of responses that take <= the time in the header and max is the max response time in seconds. For max values in the top 25% of the range have a red background and in the bottom 25% of the range have a green background. The red background is not used when the min value is within 80% of the max value.
| dbms | 256us | 1ms | 4ms | 16ms | 64ms | 256ms | 1s | 4s | 16s | gt | max |
|---|---|---|---|---|---|---|---|---|---|---|---|
| pg176_o2nofp.cx10a_c8r32 | 0.466 | 98.363 | 1.145 | 0.025 | 0.050 | ||||||
| pg18rc1_o2nofp.cx10b_c8r32 | 4.343 | 94.359 | 1.268 | 0.030 | 0.038 | ||||||
| pg18rc1_o2nofp.cx10c_c8r32 | 4.584 | 94.100 | 1.286 | 0.030 | 0.037 | ||||||
| pg18rc1_o2nofp.cx10d_c8r32 | 0.464 | 99.235 | 0.301 | nonzero | 0.029 |
Insert response time histogram: each cell has the percentage of responses that take <= the time in the header and max is the max response time in seconds. For max values in the top 25% of the range have a red background and in the bottom 25% of the range have a green background. The red background is not used when the min value is within 80% of the max value.
| dbms | 256us | 1ms | 4ms | 16ms | 64ms | 256ms | 1s | 4s | 16s | gt | max |
|---|---|---|---|---|---|---|---|---|---|---|---|
| pg176_o2nofp.cx10a_c8r32 | 97.062 | 2.810 | 0.128 | 0.182 | |||||||
| pg18rc1_o2nofp.cx10b_c8r32 | 93.431 | 6.308 | 0.261 | 0.181 | |||||||
| pg18rc1_o2nofp.cx10c_c8r32 | 93.094 | 6.650 | 0.256 | 0.176 | |||||||
| pg18rc1_o2nofp.cx10d_c8r32 | 98.969 | 1.031 | 0.040 |
Delete response time histogram: each cell has the percentage of responses that take <= the time in the header and max is the max response time in seconds. For max values in the top 25% of the range have a red background and in the bottom 25% of the range have a green background. The red background is not used when the min value is within 80% of the max value.
| dbms | 256us | 1ms | 4ms | 16ms | 64ms | 256ms | 1s | 4s | 16s | gt | max |
|---|---|---|---|---|---|---|---|---|---|---|---|
| pg176_o2nofp.cx10a_c8r32 | 98.862 | 1.137 | 0.141 | ||||||||
| pg18rc1_o2nofp.cx10b_c8r32 | 99.997 | 0.003 | 0.085 | ||||||||
| pg18rc1_o2nofp.cx10c_c8r32 | 99.997 | 0.003 | 0.082 | ||||||||
| pg18rc1_o2nofp.cx10d_c8r32 | 99.997 | 0.003 | 0.082 |
Performance metrics for the DBMS listed above. Some are normalized by throughput, others are not. Legend for results is here.
ips	qps	rps	rmbps	wps	wmbps	rpq	rkbpq	wpi	wkbpi	csps	cpups	cspq	cpupq	dbgb1	dbgb2	rss	maxop	p50	p99	tag
957	523	8794	68.8	2295.7	29.0	16.819	134.776	2.400	31.095	19339	13.7	36.985	2096	155.9	193.2	23.3	0.050	528	368	pg176_o2nofp.cx10a_c8r32
999	644	10471	81.8	2775.4	34.1	16.272	130.236	2.779	34.936	22980	12.8	35.711	1591	155.0	190.6	23.3	0.038	672	320	pg18rc1_o2nofp.cx10b_c8r32
998	646	10476	82.0	2776.2	34.0	16.222	130.058	2.781	34.900	22998	12.9	35.612	1598	155.0	190.6	23.4	0.037	672	320	pg18rc1_o2nofp.cx10c_c8r32
999	532	9036	70.8	2744.1	33.7	16.984	136.216	2.746	34.559	19809	12.1	37.235	1820	155.0	190.3	23.4	0.029	544	384	pg18rc1_o2nofp.cx10d_c8r32
l.i0
l.i0: load without secondary indexes
Performance metrics for all DBMS, not just the ones listed above. Some are normalized by throughput, others are not. Legend for results is here.
ips	qps	rps	rmbps	wps	wmbps	rpq	rkbpq	wpi	wkbpi	csps	cpups	cspq	cpupq	dbgb1	dbgb2	rss	maxop	p50	p99	tag
214535	0	37	0.3	798.8	88.3	0.000	0.001	0.004	0.422	21359	20.7	0.100	8	76.5	116.6	19.8	0.040	215876	207765	pg176_o2nofp.cx10a_c8r32
209589	0	36	0.3	783.9	86.1	0.000	0.001	0.004	0.421	20856	20.4	0.100	8	76.5	116.6	18.9	0.042	210764	203071	pg18rc1_o2nofp.cx10b_c8r32
206718	0	34	0.3	774.0	85.1	0.000	0.001	0.004	0.422	20698	20.3	0.100	8	76.5	116.6	0.2	0.047	207969	200278	pg18rc1_o2nofp.cx10c_c8r32
208986	0	35	0.3	782.0	85.9	0.000	0.001	0.004	0.421	20930	20.5	0.100	8	76.5	116.6	1.2	0.043	210273	202065	pg18rc1_o2nofp.cx10d_c8r32
l.x
l.x: create secondary indexes
Performance metrics for all DBMS, not just the ones listed above. Some are normalized by throughput, others are not. Legend for results is here.
ips	qps	rps	rmbps	wps	wmbps	rpq	rkbpq	wpi	wkbpi	csps	cpups	cspq	cpupq	dbgb1	dbgb2	rss	maxop	p50	p99	tag
392734	0	1140	135.1	1221.5	146.9	0.003	0.352	0.003	0.383	1077	12.4	0.003	3	153.6	193.7	22.7	0.002	NA	NA	pg176_o2nofp.cx10a_c8r32
395844	0	1068	131.8	1242.1	147.8	0.003	0.341	0.003	0.382	1122	12.5	0.003	3	153.6	193.7	14.8	0.002	NA	NA	pg18rc1_o2nofp.cx10b_c8r32
416017	0	1350	150.3	1269.9	155.5	0.003	0.370	0.003	0.383	2171	13.1	0.005	3	153.6	193.7	23.4	0.003	NA	NA	pg18rc1_o2nofp.cx10c_c8r32
405680	0	1283	145.1	1242.9	151.6	0.003	0.366	0.003	0.383	1779	13.1	0.004	3	153.6	193.7	23.4	0.003	NA	NA	pg18rc1_o2nofp.cx10d_c8r32
l.i1
l.i1: continue load after secondary indexes created with 50 inserts per transaction
Performance metrics for all DBMS, not just the ones listed above. Some are normalized by throughput, others are not. Legend for results is here.
ips	qps	rps	rmbps	wps	wmbps	rpq	rkbpq	wpi	wkbpi	csps	cpups	cspq	cpupq	dbgb1	dbgb2	rss	maxop	p50	p99	tag
2847	0	4080	32.1	3384.8	57.9	1.433	11.535	1.189	20.837	9191	12.3	3.229	346	154.3	194.3	22.6	0.509	2450	650	pg176_o2nofp.cx10a_c8r32
3650	0	5234	41.2	4341.6	74.6	1.434	11.561	1.190	20.917	11767	15.2	3.224	333	154.3	194.3	22.5	0.135	2849	1949	pg18rc1_o2nofp.cx10b_c8r32
3656	0	5286	41.6	4326.8	74.1	1.446	11.663	1.183	20.749	11871	15.1	3.247	330	154.3	194.3	22.9	0.121	2849	1600	pg18rc1_o2nofp.cx10c_c8r32
2851	0	4097	32.3	3402.0	58.3	1.437	11.595	1.193	20.930	9218	11.9	3.233	334	154.3	194.3	22.9	0.391	2450	750	pg18rc1_o2nofp.cx10d_c8r32
l.i2
l.i2: continue load after secondary indexes created with 5 inserts per transaction
Performance metrics for all DBMS, not just the ones listed above. Some are normalized by throughput, others are not. Legend for results is here.
ips	qps	rps	rmbps	wps	wmbps	rpq	rkbpq	wpi	wkbpi	csps	cpups	cspq	cpupq	dbgb1	dbgb2	rss	maxop	p50	p99	tag
166	0	178	1.4	495.2	6.8	1.067	8.574	2.974	41.781	1077	12.7	6.466	6102	154.4	194.5	22.7	0.018	165	145	pg176_o2nofp.cx10a_c8r32
175	0	186	1.5	503.8	7.0	1.066	8.564	2.879	40.999	1120	12.8	6.400	5851	154.4	194.5	23.3	0.018	175	155	pg18rc1_o2nofp.cx10b_c8r32
176	0	188	1.5	508.5	7.1	1.071	8.677	2.897	41.138	1127	12.7	6.423	5789	154.4	194.5	22.9	0.031	175	155	pg18rc1_o2nofp.cx10c_c8r32
178	0	190	1.5	513.4	7.1	1.071	8.676	2.891	40.880	1135	12.8	6.390	5766	154.4	194.5	23.4	0.022	175	155	pg18rc1_o2nofp.cx10d_c8r32
qr100.L1
qr100.L1: range queries with 100 insert/s per client
Performance metrics for all DBMS, not just the ones listed above. Some are normalized by throughput, others are not. Legend for results is here.
ips	qps	rps	rmbps	wps	wmbps	rpq	rkbpq	wpi	wkbpi	csps	cpups	cspq	cpupq	dbgb1	dbgb2	rss	maxop	p50	p99	tag
100	25416	111	0.9	114.8	2.3	0.004	0.035	1.149	23.491	97342	8.5	3.830	27	154.5	193.8	23.3	0.025	25308	24695	pg176_o2nofp.cx10a_c8r32
100	24754	111	0.9	67.4	1.9	0.004	0.036	0.675	19.515	94728	8.6	3.827	28	154.4	191.7	23.3	0.026	24684	24379	pg18rc1_o2nofp.cx10b_c8r32
100	24916	111	0.9	67.9	1.9	0.004	0.036	0.680	19.568	95350	8.6	3.827	28	154.5	192.7	23.4	0.041	24989	24492	pg18rc1_o2nofp.cx10c_c8r32
100	25251	111	0.9	69.0	1.9	0.004	0.036	0.690	19.623	96571	8.4	3.824	27	154.4	191.7	23.4	0.044	25371	24668	pg18rc1_o2nofp.cx10d_c8r32
qp100.L2
qp100.L2: point queries with 100 insert/s per client
Performance metrics for all DBMS, not just the ones listed above. Some are normalized by throughput, others are not. Legend for results is here.
ips	qps	rps	rmbps	wps	wmbps	rpq	rkbpq	wpi	wkbpi	csps	cpups	cspq	cpupq	dbgb1	dbgb2	rss	maxop	p50	p99	tag
100	658	8263	64.6	307.0	3.8	12.567	100.593	3.070	38.420	18462	2.3	28.079	280	154.5	188.8	23.3	0.043	672	448	pg176_o2nofp.cx10a_c8r32
100	805	10214	79.8	351.6	4.1	12.683	101.520	3.516	41.985	22717	3.6	28.209	358	154.5	191.7	23.3	0.035	832	544	pg18rc1_o2nofp.cx10b_c8r32
100	806	10229	80.0	348.9	4.1	12.685	101.555	3.493	41.825	22756	3.6	28.219	357	154.5	192.7	23.4	0.027	832	544	pg18rc1_o2nofp.cx10c_c8r32
100	642	8270	64.7	345.6	4.1	12.877	103.231	3.456	41.524	18390	2.6	28.636	324	154.5	191.7	23.4	0.029	656	432	pg18rc1_o2nofp.cx10d_c8r32
qr500.L3
qr500.L3: range queries with 500 insert/s per client
Performance metrics for all DBMS, not just the ones listed above. Some are normalized by throughput, others are not. Legend for results is here.
ips	qps	rps	rmbps	wps	wmbps	rpq	rkbpq	wpi	wkbpi	csps	cpups	cspq	cpupq	dbgb1	dbgb2	rss	maxop	p50	p99	tag
500	22024	756	6.0	499.3	10.6	0.034	0.278	0.999	21.741	85771	10.8	3.894	39	154.7	183.8	23.3	0.006	21927	20205	pg176_o2nofp.cx10a_c8r32
500	23329	869	6.9	344.3	9.3	0.037	0.301	0.689	19.106	90833	9.7	3.894	33	154.5	190.2	23.3	0.007	23419	22275	pg18rc1_o2nofp.cx10b_c8r32
499	23211	872	6.9	347.3	9.3	0.038	0.305	0.695	19.170	90443	9.9	3.897	34	154.5	190.4	23.4	0.312	23303	22157	pg18rc1_o2nofp.cx10c_c8r32
500	23517	870	6.9	356.2	9.4	0.037	0.301	0.713	19.303	91553	9.6	3.893	33	154.5	190.2	23.4	0.022	23549	22390	pg18rc1_o2nofp.cx10d_c8r32
qp500.L4
qp500.L4: point queries with 500 insert/s per client
Performance metrics for all DBMS, not just the ones listed above. Some are normalized by throughput, others are not. Legend for results is here.
ips	qps	rps	rmbps	wps	wmbps	rpq	rkbpq	wpi	wkbpi	csps	cpups	cspq	cpupq	dbgb1	dbgb2	rss	maxop	p50	p99	tag
500	600	8634	67.5	1383.5	17.0	14.379	115.075	2.767	34.796	19096	6.2	31.800	826	154.8	182.9	23.3	0.045	608	400	pg176_o2nofp.cx10a_c8r32
500	739	10387	81.2	1580.9	18.5	14.052	112.508	3.164	37.870	22939	4.9	31.032	530	154.6	188.5	23.3	0.038	768	480	pg18rc1_o2nofp.cx10b_c8r32
499	738	10355	81.0	1580.6	18.5	14.041	112.504	3.165	37.897	22878	4.9	31.021	532	154.6	188.6	23.4	0.112	768	480	pg18rc1_o2nofp.cx10c_c8r32
500	602	8696	68.1	1553.4	18.3	14.443	115.843	3.107	37.404	19184	4.8	31.862	638	154.6	188.4	23.4	0.012	624	448	pg18rc1_o2nofp.cx10d_c8r32
qr1000.L5
qr1000.L5: range queries with 1000 insert/s per client
Performance metrics for all DBMS, not just the ones listed above. Some are normalized by throughput, others are not. Legend for results is here.
ips	qps	rps	rmbps	wps	wmbps	rpq	rkbpq	wpi	wkbpi	csps	cpups	cspq	cpupq	dbgb1	dbgb2	rss	maxop	p50	p99	tag
975	14912	1260	9.9	1284.7	23.7	0.085	0.683	1.317	24.845	59848	21.9	4.013	117	155.4	191.5	23.3	0.023	14888	13070	pg176_o2nofp.cx10a_c8r32
999	18866	1491	11.8	931.4	19.1	0.079	0.641	0.933	19.561	75230	15.9	3.988	67	154.8	187.7	23.3	0.017	18887	17261	pg18rc1_o2nofp.cx10b_c8r32
999	18743	1499	12.0	930.2	19.1	0.080	0.654	0.931	19.558	74812	15.8	3.992	67	154.8	187.8	23.4	0.110	18775	17176	pg18rc1_o2nofp.cx10c_c8r32
999	18997	1494	11.9	937.9	19.1	0.079	0.643	0.938	19.621	75739	15.7	3.987	66	154.8	187.6	23.4	0.070	19005	17270	pg18rc1_o2nofp.cx10d_c8r32
qp1000.L6
qp1000.L6: point queries with 1000 insert/s per client
Performance metrics for all DBMS, not just the ones listed above. Some are normalized by throughput, others are not. Legend for results is here.
ips	qps	rps	rmbps	wps	wmbps	rpq	rkbpq	wpi	wkbpi	csps	cpups	cspq	cpupq	dbgb1	dbgb2	rss	maxop	p50	p99	tag
957	523	8794	68.8	2295.7	29.0	16.819	134.776	2.400	31.095	19339	13.7	36.985	2096	155.9	193.2	23.3	0.050	528	368	pg176_o2nofp.cx10a_c8r32
999	644	10471	81.8	2775.4	34.1	16.272	130.236	2.779	34.936	22980	12.8	35.711	1591	155.0	190.6	23.3	0.038	672	320	pg18rc1_o2nofp.cx10b_c8r32
998	646	10476	82.0	2776.2	34.0	16.222	130.058	2.781	34.900	22998	12.9	35.612	1598	155.0	190.6	23.4	0.037	672	320	pg18rc1_o2nofp.cx10c_c8r32
999	532	9036	70.8	2744.1	33.7	16.984	136.216	2.746	34.559	19809	12.1	37.235	1820	155.0	190.3	23.4	0.029	544	384	pg18rc1_o2nofp.cx10d_c8r32
l.i0
- l.i0: load without secondary indexes
- Legend for results is here.
- Each entry lists the percentage of responses that fit in that bucket (slower than max time for previous bucket, faster than min time for next bucket).
Insert response time histogram
256us	1ms	4ms	16ms	64ms	256ms	1s	4s	16s	gt	max	tag
0.000	99.982	0.015	0.002	0.001	0.000	0.000	0.000	0.000	0.000	0.040	pg176_o2nofp.cx10a_c8r32
0.000	99.983	0.014	0.003	nonzero	0.000	0.000	0.000	0.000	0.000	0.042	pg18rc1_o2nofp.cx10b_c8r32
0.000	99.982	0.015	0.003	nonzero	0.000	0.000	0.000	0.000	0.000	0.047	pg18rc1_o2nofp.cx10c_c8r32
0.000	99.982	0.014	0.003	nonzero	0.000	0.000	0.000	0.000	0.000	0.043	pg18rc1_o2nofp.cx10d_c8r32
l.x
- l.x: create secondary indexes
- Legend for results is here.
- Each entry lists the percentage of responses that fit in that bucket (slower than max time for previous bucket, faster than min time for next bucket).
TODO - determine whether there is data for create index response time
l.i1
- l.i1: continue load after secondary indexes created with 50 inserts per transaction
- Legend for results is here.
- Each entry lists the percentage of responses that fit in that bucket (slower than max time for previous bucket, faster than min time for next bucket).
Insert response time histogram
256us	1ms	4ms	16ms	64ms	256ms	1s	4s	16s	gt	max	tag
0.000	0.000	0.000	90.094	8.321	1.584	0.001	0.000	0.000	0.000	0.509	pg176_o2nofp.cx10a_c8r32
0.000	0.000	0.000	98.340	1.541	0.119	0.000	0.000	0.000	0.000	0.135	pg18rc1_o2nofp.cx10b_c8r32
0.000	0.000	0.000	98.034	1.846	0.120	0.000	0.000	0.000	0.000	0.121	pg18rc1_o2nofp.cx10c_c8r32
0.000	0.000	0.000	85.936	12.840	1.221	0.003	0.000	0.000	0.000	0.391	pg18rc1_o2nofp.cx10d_c8r32
Delete response time histogram
256us	1ms	4ms	16ms	64ms	256ms	1s	4s	16s	gt	max	tag
0.000	1.439	16.934	41.771	39.856	0.000	0.000	0.000	0.000	0.000	0.031	pg176_o2nofp.cx10a_c8r32
0.000	0.860	17.534	43.816	37.790	0.000	0.000	0.000	0.000	0.000	0.032	pg18rc1_o2nofp.cx10b_c8r32
0.000	0.923	17.381	44.824	36.873	0.000	0.000	0.000	0.000	0.000	0.030	pg18rc1_o2nofp.cx10c_c8r32
0.000	1.109	17.680	44.745	36.466	0.000	0.000	0.000	0.000	0.000	0.031	pg18rc1_o2nofp.cx10d_c8r32
l.i2
- l.i2: continue load after secondary indexes created with 5 inserts per transaction
- Legend for results is here.
- Each entry lists the percentage of responses that fit in that bucket (slower than max time for previous bucket, faster than min time for next bucket).
Insert response time histogram
256us	1ms	4ms	16ms	64ms	256ms	1s	4s	16s	gt	max	tag
0.000	11.162	88.807	0.031	0.001	0.000	0.000	0.000	0.000	0.000	0.018	pg176_o2nofp.cx10a_c8r32
0.000	17.865	81.865	0.268	0.002	0.000	0.000	0.000	0.000	0.000	0.018	pg18rc1_o2nofp.cx10b_c8r32
0.000	18.712	81.061	0.226	0.002	0.000	0.000	0.000	0.000	0.000	0.031	pg18rc1_o2nofp.cx10c_c8r32
0.000	11.795	88.182	0.022	0.001	0.000	0.000	0.000	0.000	0.000	0.022	pg18rc1_o2nofp.cx10d_c8r32
Delete response time histogram
256us	1ms	4ms	16ms	64ms	256ms	1s	4s	16s	gt	max	tag
0.000	0.000	0.000	0.000	99.999	0.001	0.000	0.000	0.000	0.000	0.080	pg176_o2nofp.cx10a_c8r32
0.000	0.000	0.000	0.000	99.999	0.001	0.000	0.000	0.000	0.000	0.083	pg18rc1_o2nofp.cx10b_c8r32
0.000	0.000	0.000	0.000	99.999	0.001	0.000	0.000	0.000	0.000	0.082	pg18rc1_o2nofp.cx10c_c8r32
0.000	0.000	0.000	0.000	99.999	0.001	0.000	0.000	0.000	0.000	0.081	pg18rc1_o2nofp.cx10d_c8r32
qr100.L1
- qr100.L1: range queries with 100 insert/s per client
- Legend for results is here.
- Each entry lists the percentage of responses that fit in that bucket (slower than max time for previous bucket, faster than min time for next bucket).
Query response time histogram
256us	1ms	4ms	16ms	64ms	256ms	1s	4s	16s	gt	max	tag
99.992	0.008	nonzero	nonzero	nonzero	0.000	0.000	0.000	0.000	0.000	0.025	pg176_o2nofp.cx10a_c8r32
99.991	0.009	nonzero	0.000	nonzero	0.000	0.000	0.000	0.000	0.000	0.026	pg18rc1_o2nofp.cx10b_c8r32
99.991	0.009	nonzero	0.000	nonzero	0.000	0.000	0.000	0.000	0.000	0.041	pg18rc1_o2nofp.cx10c_c8r32
99.989	0.011	nonzero	0.000	nonzero	0.000	0.000	0.000	0.000	0.000	0.044	pg18rc1_o2nofp.cx10d_c8r32
Insert response time histogram
256us	1ms	4ms	16ms	64ms	256ms	1s	4s	16s	gt	max	tag
0.000	0.000	0.000	99.875	0.125	0.000	0.000	0.000	0.000	0.000	0.057	pg176_o2nofp.cx10a_c8r32
0.000	0.000	0.000	99.917	0.056	0.028	0.000	0.000	0.000	0.000	0.074	pg18rc1_o2nofp.cx10b_c8r32
0.000	0.000	0.028	99.917	0.056	0.000	0.000	0.000	0.000	0.000	0.055	pg18rc1_o2nofp.cx10c_c8r32
0.000	0.000	0.056	99.889	0.056	0.000	0.000	0.000	0.000	0.000	0.056	pg18rc1_o2nofp.cx10d_c8r32
Delete response time histogram
256us	1ms	4ms	16ms	64ms	256ms	1s	4s	16s	gt	max	tag
0.000	30.986	69.014	0.000	0.000	0.000	0.000	0.000	0.000	0.000	0.003	pg176_o2nofp.cx10a_c8r32
0.000	58.361	41.639	0.000	0.000	0.000	0.000	0.000	0.000	0.000	0.003	pg18rc1_o2nofp.cx10b_c8r32
0.000	59.556	40.444	0.000	0.000	0.000	0.000	0.000	0.000	0.000	0.002	pg18rc1_o2nofp.cx10c_c8r32
0.000	58.389	41.611	0.000	0.000	0.000	0.000	0.000	0.000	0.000	0.002	pg18rc1_o2nofp.cx10d_c8r32
qp100.L2
- qp100.L2: point queries with 100 insert/s per client
- Legend for results is here.
- Each entry lists the percentage of responses that fit in that bucket (slower than max time for previous bucket, faster than min time for next bucket).
Query response time histogram
256us	1ms	4ms	16ms	64ms	256ms	1s	4s	16s	gt	max	tag
0.000	3.414	96.560	0.026	nonzero	0.000	0.000	0.000	0.000	0.000	0.043	pg176_o2nofp.cx10a_c8r32
0.000	19.606	80.289	0.101	0.004	0.000	0.000	0.000	0.000	0.000	0.035	pg18rc1_o2nofp.cx10b_c8r32
0.000	19.667	80.249	0.083	0.002	0.000	0.000	0.000	0.000	0.000	0.027	pg18rc1_o2nofp.cx10c_c8r32
0.000	3.044	96.930	0.025	nonzero	0.000	0.000	0.000	0.000	0.000	0.029	pg18rc1_o2nofp.cx10d_c8r32
Insert response time histogram
256us	1ms	4ms	16ms	64ms	256ms	1s	4s	16s	gt	max	tag
0.000	0.000	0.000	99.875	0.125	0.000	0.000	0.000	0.000	0.000	0.036	pg176_o2nofp.cx10a_c8r32
0.000	0.000	0.000	93.194	6.667	0.139	0.000	0.000	0.000	0.000	0.196	pg18rc1_o2nofp.cx10b_c8r32
0.000	0.000	0.000	92.528	7.417	0.056	0.000	0.000	0.000	0.000	0.187	pg18rc1_o2nofp.cx10c_c8r32
0.000	0.000	0.000	99.917	0.083	0.000	0.000	0.000	0.000	0.000	0.028	pg18rc1_o2nofp.cx10d_c8r32
Delete response time histogram
256us	1ms	4ms	16ms	64ms	256ms	1s	4s	16s	gt	max	tag
0.000	0.000	75.236	24.764	0.000	0.000	0.000	0.000	0.000	0.000	0.012	pg176_o2nofp.cx10a_c8r32
0.000	5.500	94.444	0.056	0.000	0.000	0.000	0.000	0.000	0.000	0.007	pg18rc1_o2nofp.cx10b_c8r32
0.000	4.417	95.556	0.028	0.000	0.000	0.000	0.000	0.000	0.000	0.007	pg18rc1_o2nofp.cx10c_c8r32
0.000	4.194	95.778	0.028	0.000	0.000	0.000	0.000	0.000	0.000	0.007	pg18rc1_o2nofp.cx10d_c8r32
qr500.L3
- qr500.L3: range queries with 500 insert/s per client
- Legend for results is here.
- Each entry lists the percentage of responses that fit in that bucket (slower than max time for previous bucket, faster than min time for next bucket).
Query response time histogram
256us	1ms	4ms	16ms	64ms	256ms	1s	4s	16s	gt	max	tag
99.983	0.017	nonzero	nonzero	0.000	0.000	0.000	0.000	0.000	0.000	0.006	pg176_o2nofp.cx10a_c8r32
99.984	0.016	nonzero	nonzero	0.000	0.000	0.000	0.000	0.000	0.000	0.007	pg18rc1_o2nofp.cx10b_c8r32
99.984	0.015	0.001	nonzero	nonzero	0.000	nonzero	0.000	0.000	0.000	0.312	pg18rc1_o2nofp.cx10c_c8r32
99.982	0.018	nonzero	nonzero	nonzero	0.000	0.000	0.000	0.000	0.000	0.022	pg18rc1_o2nofp.cx10d_c8r32
Insert response time histogram
256us	1ms	4ms	16ms	64ms	256ms	1s	4s	16s	gt	max	tag
0.000	0.000	0.000	99.808	0.192	0.000	0.000	0.000	0.000	0.000	0.027	pg176_o2nofp.cx10a_c8r32
0.000	0.000	0.000	99.728	0.189	0.083	0.000	0.000	0.000	0.000	0.131	pg18rc1_o2nofp.cx10b_c8r32
0.000	0.000	0.000	99.700	0.261	0.039	0.000	0.000	0.000	0.000	0.191	pg18rc1_o2nofp.cx10c_c8r32
0.000	0.000	0.000	99.872	0.128	0.000	0.000	0.000	0.000	0.000	0.049	pg18rc1_o2nofp.cx10d_c8r32
Delete response time histogram
256us	1ms	4ms	16ms	64ms	256ms	1s	4s	16s	gt	max	tag
0.000	0.000	7.803	81.294	10.903	0.000	0.000	0.000	0.000	0.000	0.021	pg176_o2nofp.cx10a_c8r32
0.000	0.000	52.628	47.372	0.000	0.000	0.000	0.000	0.000	0.000	0.013	pg18rc1_o2nofp.cx10b_c8r32
0.000	0.000	54.100	45.900	0.000	0.000	0.000	0.000	0.000	0.000	0.012	pg18rc1_o2nofp.cx10c_c8r32
0.000	0.000	52.744	47.256	0.000	0.000	0.000	0.000	0.000	0.000	0.012	pg18rc1_o2nofp.cx10d_c8r32
qp500.L4
- qp500.L4: point queries with 500 insert/s per client
- Legend for results is here.
- Each entry lists the percentage of responses that fit in that bucket (slower than max time for previous bucket, faster than min time for next bucket).
Query response time histogram
256us	1ms	4ms	16ms	64ms	256ms	1s	4s	16s	gt	max	tag
0.000	1.464	98.406	0.128	0.003	0.000	0.000	0.000	0.000	0.000	0.045	pg176_o2nofp.cx10a_c8r32
0.000	10.863	88.556	0.568	0.013	0.000	0.000	0.000	0.000	0.000	0.038	pg18rc1_o2nofp.cx10b_c8r32
0.000	10.861	88.544	0.575	0.018	0.001	0.000	0.000	0.000	0.000	0.112	pg18rc1_o2nofp.cx10c_c8r32
nonzero	1.434	98.438	0.128	0.000	0.000	0.000	0.000	0.000	0.000	0.012	pg18rc1_o2nofp.cx10d_c8r32
Insert response time histogram
256us	1ms	4ms	16ms	64ms	256ms	1s	4s	16s	gt	max	tag
0.000	0.000	0.000	99.217	0.761	0.022	0.000	0.000	0.000	0.000	0.175	pg176_o2nofp.cx10a_c8r32
0.000	0.000	0.000	95.278	4.622	0.100	0.000	0.000	0.000	0.000	0.192	pg18rc1_o2nofp.cx10b_c8r32
0.000	0.000	0.000	95.728	4.100	0.156	0.017	0.000	0.000	0.000	0.566	pg18rc1_o2nofp.cx10c_c8r32
0.000	0.000	0.000	99.222	0.778	0.000	0.000	0.000	0.000	0.000	0.033	pg18rc1_o2nofp.cx10d_c8r32
Delete response time histogram
256us	1ms	4ms	16ms	64ms	256ms	1s	4s	16s	gt	max	tag
0.000	0.000	0.000	0.072	99.928	0.000	0.000	0.000	0.000	0.000	0.057	pg176_o2nofp.cx10a_c8r32
0.000	0.000	0.000	99.944	0.056	0.000	0.000	0.000	0.000	0.000	0.036	pg18rc1_o2nofp.cx10b_c8r32
0.000	0.000	0.000	99.939	0.061	0.000	0.000	0.000	0.000	0.000	0.035	pg18rc1_o2nofp.cx10c_c8r32
0.000	0.000	0.000	99.950	0.050	0.000	0.000	0.000	0.000	0.000	0.034	pg18rc1_o2nofp.cx10d_c8r32
qr1000.L5
- qr1000.L5: range queries with 1000 insert/s per client
- Legend for results is here.
- Each entry lists the percentage of responses that fit in that bucket (slower than max time for previous bucket, faster than min time for next bucket).
Query response time histogram
256us	1ms	4ms	16ms	64ms	256ms	1s	4s	16s	gt	max	tag
99.927	0.072	0.001	nonzero	nonzero	0.000	0.000	0.000	0.000	0.000	0.023	pg176_o2nofp.cx10a_c8r32
99.959	0.038	0.002	nonzero	nonzero	0.000	0.000	0.000	0.000	0.000	0.017	pg18rc1_o2nofp.cx10b_c8r32
99.953	0.045	0.002	nonzero	nonzero	nonzero	0.000	0.000	0.000	0.000	0.110	pg18rc1_o2nofp.cx10c_c8r32
99.950	0.049	0.002	nonzero	nonzero	nonzero	0.000	0.000	0.000	0.000	0.070	pg18rc1_o2nofp.cx10d_c8r32
Insert response time histogram
256us	1ms	4ms	16ms	64ms	256ms	1s	4s	16s	gt	max	tag
0.000	0.000	0.050	99.763	0.188	0.000	0.000	0.000	0.000	0.000	0.030	pg176_o2nofp.cx10a_c8r32
0.000	0.000	0.000	98.919	0.942	0.139	0.000	0.000	0.000	0.000	0.230	pg18rc1_o2nofp.cx10b_c8r32
0.000	0.000	0.000	98.803	1.075	0.122	0.000	0.000	0.000	0.000	0.161	pg18rc1_o2nofp.cx10c_c8r32
0.000	0.000	0.000	99.667	0.333	0.000	0.000	0.000	0.000	0.000	0.031	pg18rc1_o2nofp.cx10d_c8r32
Delete response time histogram
256us	1ms	4ms	16ms	64ms	256ms	1s	4s	16s	gt	max	tag
0.000	0.000	0.000	0.000	99.999	0.001	0.000	0.000	0.000	0.000	0.089	pg176_o2nofp.cx10a_c8r32
0.000	0.000	0.000	17.756	82.244	0.000	0.000	0.000	0.000	0.000	0.055	pg18rc1_o2nofp.cx10b_c8r32
0.000	0.000	0.000	17.481	82.519	0.000	0.000	0.000	0.000	0.000	0.051	pg18rc1_o2nofp.cx10c_c8r32
0.000	0.000	0.000	17.358	82.642	0.000	0.000	0.000	0.000	0.000	0.053	pg18rc1_o2nofp.cx10d_c8r32
qp1000.L6
- qp1000.L6: point queries with 1000 insert/s per client
- Legend for results is here.
- Each entry lists the percentage of responses that fit in that bucket (slower than max time for previous bucket, faster than min time for next bucket).
Query response time histogram
256us	1ms	4ms	16ms	64ms	256ms	1s	4s	16s	gt	max	tag
0.000	0.466	98.363	1.145	0.025	0.000	0.000	0.000	0.000	0.000	0.050	pg176_o2nofp.cx10a_c8r32
0.000	4.343	94.359	1.268	0.030	0.000	0.000	0.000	0.000	0.000	0.038	pg18rc1_o2nofp.cx10b_c8r32
0.000	4.584	94.100	1.286	0.030	0.000	0.000	0.000	0.000	0.000	0.037	pg18rc1_o2nofp.cx10c_c8r32
0.000	0.464	99.235	0.301	nonzero	0.000	0.000	0.000	0.000	0.000	0.029	pg18rc1_o2nofp.cx10d_c8r32
Insert response time histogram
256us	1ms	4ms	16ms	64ms	256ms	1s	4s	16s	gt	max	tag
0.000	0.000	0.000	97.062	2.810	0.128	0.000	0.000	0.000	0.000	0.182	pg176_o2nofp.cx10a_c8r32
0.000	0.000	0.000	93.431	6.308	0.261	0.000	0.000	0.000	0.000	0.181	pg18rc1_o2nofp.cx10b_c8r32
0.000	0.000	0.000	93.094	6.650	0.256	0.000	0.000	0.000	0.000	0.176	pg18rc1_o2nofp.cx10c_c8r32
0.000	0.000	0.000	98.969	1.031	0.000	0.000	0.000	0.000	0.000	0.040	pg18rc1_o2nofp.cx10d_c8r32
Delete response time histogram
256us	1ms	4ms	16ms	64ms	256ms	1s	4s	16s	gt	max	tag
0.000	0.000	0.000	0.000	98.862	1.137	0.000	0.000	0.000	0.000	0.141	pg176_o2nofp.cx10a_c8r32
0.000	0.000	0.000	0.000	99.997	0.003	0.000	0.000	0.000	0.000	0.085	pg18rc1_o2nofp.cx10b_c8r32
0.000	0.000	0.000	0.000	99.997	0.003	0.000	0.000	0.000	0.000	0.082	pg18rc1_o2nofp.cx10c_c8r32
0.000	0.000	0.000	0.000	99.997	0.003	0.000	0.000	0.000	0.000	0.082	pg18rc1_o2nofp.cx10d_c8r32