Introduction
This is a report for the insert benchmark with 30M docs and 1 client(s). It is generated by scripts (bash, awk, sed) and Tufte might not be impressed. An overview of the insert benchmark is here and a short update is here. Below, by DBMS, I mean DBMS+version.config. An example is my8020.c10b40 where my means MySQL, 8020 is version 8.0.20 and c10b40 is the name for the configuration file.
The test server has 8 AMD cores, 32G RAM and an NVMe SSD. It is described here as the PN53. The benchmark was run with 1 client and there were 1 or 3 connections per client (1 for queries or inserts without rate limits, 1+1 for rate limited inserts+deletes). It uses 1 table. It loads 30M rows per table without secondary indexes, creates 3 secondary indexes per table, then inserts 40m+10m rows per table with a delete per insert to avoid growing the table. It then does 6 read+write tests for 1800s each that do queries as fast as possible with 100,100,500,500,1000,1000 inserts/s and the same for deletes/s per client concurrent with the queries. The database is cached by InnoDB. Clients and the DBMS share one server. The per-database configs are in the per-database subdirectories here.
The tested DBMS are:
- my5651_rel_o2nofp.cz12a_c8r32 - MySQL 5.6.51 with the cz12a_c8r32 config
- my5744_rel_o2nofp.cz12a_c8r32 - MySQL 5.7.44 with the cz12a_c8r32 config
- my8043_rel_o2nofp.cz12a_c8r32 - MySQL 8.0.43 with the cz12a_c8r32 config
- my8406_rel_o2nofp.cz12a_c8r32 - MySQL 8.4.6 with the cz12a_c8r32 config
- my9400_rel_o2nofp.cz12a_c8r32 - MySQL 9.4.0 with the cz12a_c8r32 config
Contents
- Summary
- l.i0: load without secondary indexes
- l.x: create secondary indexes
- l.i1: continue load after secondary indexes created with 50 inserts per transaction
- l.i2: continue load after secondary indexes created with 5 inserts per transaction
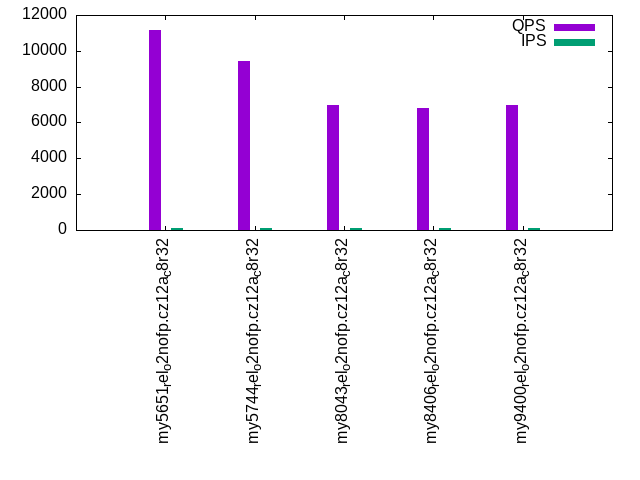
- qr100.L1: range queries with 100 insert/s per client
- qp100.L2: point queries with 100 insert/s per client
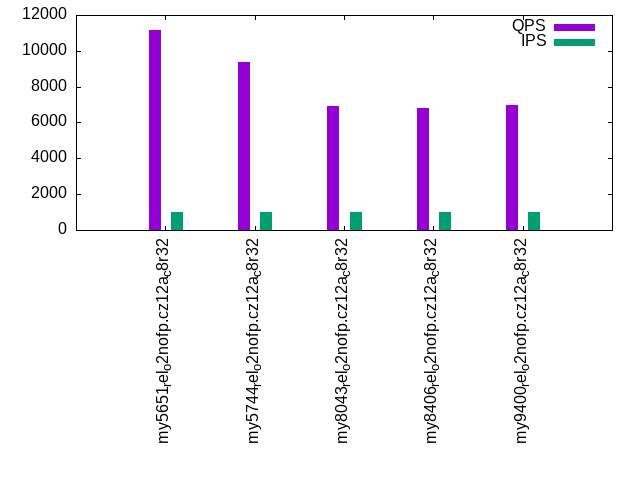
- qr500.L3: range queries with 500 insert/s per client
- qp500.L4: point queries with 500 insert/s per client
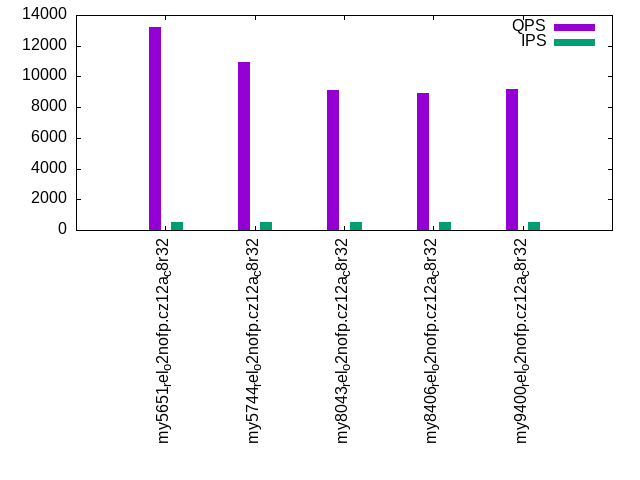
- qr1000.L5: range queries with 1000 insert/s per client
- qp1000.L6: point queries with 1000 insert/s per client
Summary
The numbers are inserts/s for l.i0, l.i1 and l.i2, indexed docs (or rows) /s for l.x and queries/s for qr100, qp100 thru qr1000, qp1000" The values are the average rate over the entire test for inserts (IPS) and queries (QPS). The range of values for IPS and QPS is split into 3 parts: bottom 25%, middle 50%, top 25%. Values in the bottom 25% have a red background, values in the top 25% have a green background and values in the middle have no color. A gray background is used for values that can be ignored because the DBMS did not sustain the target insert rate. Red backgrounds are not used when the minimum value is within 80% of the max value.
| dbms | l.i0 | l.x | l.i1 | l.i2 | qr100 | qp100 | qr500 | qp500 | qr1000 | qp1000 |
|---|---|---|---|---|---|---|---|---|---|---|
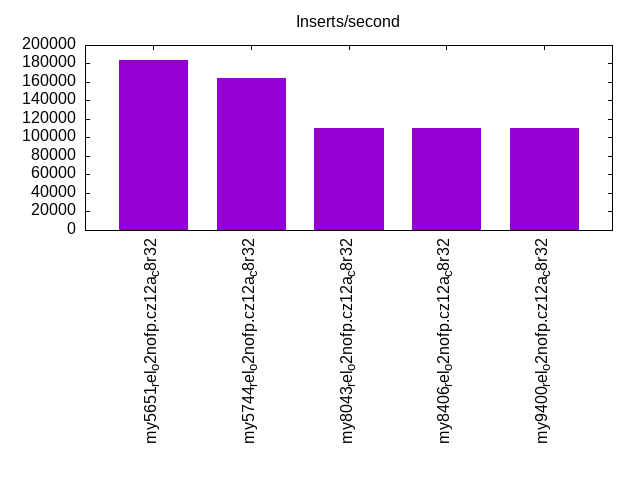
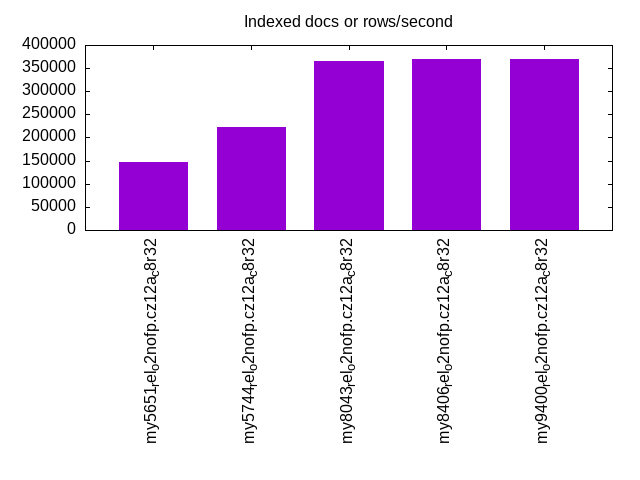
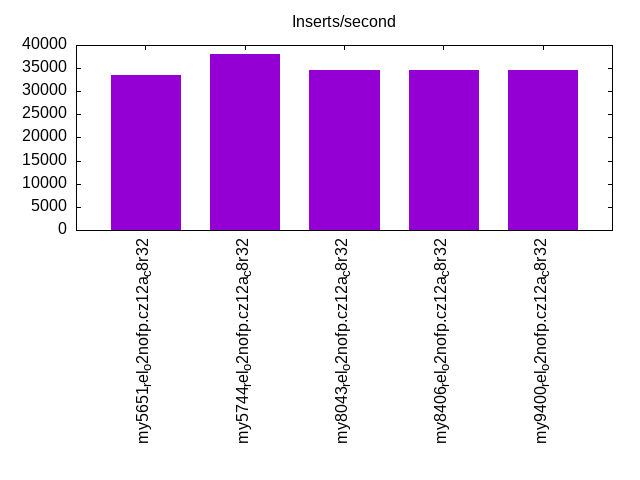
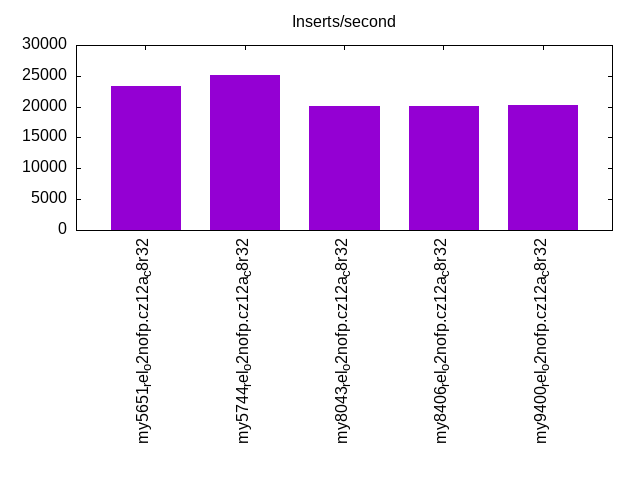
| my5651_rel_o2nofp.cz12a_c8r32 | 184049 | 146342 | 33501 | 23364 | 13180 | 11184 | 13204 | 11112 | 13091 | 11167 |
| my5744_rel_o2nofp.cz12a_c8r32 | 163934 | 222223 | 38095 | 25189 | 10986 | 9415 | 10926 | 9387 | 10958 | 9351 |
| my8043_rel_o2nofp.cz12a_c8r32 | 110701 | 365855 | 34692 | 20121 | 9144 | 6952 | 9124 | 6980 | 9122 | 6942 |
| my8406_rel_o2nofp.cz12a_c8r32 | 110701 | 370372 | 34512 | 20040 | 8906 | 6806 | 8908 | 6789 | 8873 | 6824 |
| my9400_rel_o2nofp.cz12a_c8r32 | 109890 | 370372 | 34632 | 20325 | 9185 | 6992 | 9178 | 6973 | 9131 | 6975 |
This table has relative throughput, throughput for the DBMS relative to the DBMS in the first line, using the absolute throughput from the previous table. Values less than 0.95 have a yellow background. Values greater than 1.05 have a blue background.
| dbms | l.i0 | l.x | l.i1 | l.i2 | qr100 | qp100 | qr500 | qp500 | qr1000 | qp1000 |
|---|---|---|---|---|---|---|---|---|---|---|
| my5651_rel_o2nofp.cz12a_c8r32 | 1.00 | 1.00 | 1.00 | 1.00 | 1.00 | 1.00 | 1.00 | 1.00 | 1.00 | 1.00 |
| my5744_rel_o2nofp.cz12a_c8r32 | 0.89 | 1.52 | 1.14 | 1.08 | 0.83 | 0.84 | 0.83 | 0.84 | 0.84 | 0.84 |
| my8043_rel_o2nofp.cz12a_c8r32 | 0.60 | 2.50 | 1.04 | 0.86 | 0.69 | 0.62 | 0.69 | 0.63 | 0.70 | 0.62 |
| my8406_rel_o2nofp.cz12a_c8r32 | 0.60 | 2.53 | 1.03 | 0.86 | 0.68 | 0.61 | 0.67 | 0.61 | 0.68 | 0.61 |
| my9400_rel_o2nofp.cz12a_c8r32 | 0.60 | 2.53 | 1.03 | 0.87 | 0.70 | 0.63 | 0.70 | 0.63 | 0.70 | 0.62 |
This lists the average rate of inserts/s for the tests that do inserts concurrent with queries. For such tests the query rate is listed in the table above. The read+write tests are setup so that the insert rate should match the target rate every second. Cells that are not at least 95% of the target have a red background to indicate a failure to satisfy the target.
| dbms | qr100.L1 | qp100.L2 | qr500.L3 | qp500.L4 | qr1000.L5 | qp1000.L6 |
|---|---|---|---|---|---|---|
| my5651_rel_o2nofp.cz12a_c8r32 | 100 | 100 | 500 | 500 | 1000 | 1000 |
| my5744_rel_o2nofp.cz12a_c8r32 | 100 | 100 | 500 | 500 | 1000 | 1000 |
| my8043_rel_o2nofp.cz12a_c8r32 | 100 | 100 | 500 | 500 | 1000 | 1000 |
| my8406_rel_o2nofp.cz12a_c8r32 | 100 | 100 | 500 | 500 | 1000 | 999 |
| my9400_rel_o2nofp.cz12a_c8r32 | 100 | 100 | 500 | 500 | 1000 | 999 |
| target | 100 | 100 | 500 | 500 | 1000 | 1000 |
l.i0
l.i0: load without secondary indexes. Graphs for performance per 1-second interval are here.
Average throughput:
Insert response time histogram: each cell has the percentage of responses that take <= the time in the header and max is the max response time in seconds. For the max column values in the top 25% of the range have a red background and in the bottom 25% of the range have a green background. The red background is not used when the min value is within 80% of the max value.
| dbms | 256us | 1ms | 4ms | 16ms | 64ms | 256ms | 1s | 4s | 16s | gt | max |
|---|---|---|---|---|---|---|---|---|---|---|---|
| my5651_rel_o2nofp.cz12a_c8r32 | 99.725 | 0.219 | 0.034 | 0.021 | 0.002 | 0.175 | |||||
| my5744_rel_o2nofp.cz12a_c8r32 | 99.702 | 0.109 | 0.061 | 0.127 | 0.001 | 0.165 | |||||
| my8043_rel_o2nofp.cz12a_c8r32 | 99.473 | 0.335 | 0.058 | 0.132 | 0.002 | 0.078 | |||||
| my8406_rel_o2nofp.cz12a_c8r32 | 99.470 | 0.337 | 0.060 | 0.131 | 0.002 | 0.093 | |||||
| my9400_rel_o2nofp.cz12a_c8r32 | 99.452 | 0.355 | 0.060 | 0.131 | 0.002 | 0.078 |
Performance metrics for the DBMS listed above. Some are normalized by throughput, others are not. Legend for results is here.
ips	qps	rps	rmbps	wps	wmbps	rpq	rkbpq	wpi	wkbpi	csps	cpups	cspq	cpupq	dbgb1	dbgb2	rss	maxop	p50	p99	tag
184049	0	1617	6.3	495.6	45.9	0.009	0.035	0.003	0.255	24185	20.3	0.131	9	2.0	32.5	3.5	0.175	185670	153878	my5651_rel_o2nofp.cz12a_c8r32
163934	0	0	0.0	503.2	42.4	0.000	0.000	0.003	0.265	19031	20.0	0.116	10	2.0	32.5	4.0	0.165	165267	137281	my5744_rel_o2nofp.cz12a_c8r32
110701	0	0	0.0	411.0	31.6	0.000	0.000	0.004	0.293	13713	17.1	0.124	12	2.0	32.6	4.3	0.078	111588	102981	my8043_rel_o2nofp.cz12a_c8r32
110701	0	0	0.0	406.0	31.4	0.000	0.000	0.004	0.291	13677	17.1	0.124	12	2.0	34.0	4.2	0.093	111079	101788	my8406_rel_o2nofp.cz12a_c8r32
109890	0	0	0.0	406.3	31.4	0.000	0.000	0.004	0.293	13688	17.2	0.125	13	2.0	34.0	4.3	0.078	110880	102081	my9400_rel_o2nofp.cz12a_c8r32
l.x
l.x: create secondary indexes.
Average throughput:
Performance metrics for the DBMS listed above. Some are normalized by throughput, others are not. Legend for results is here.
ips	qps	rps	rmbps	wps	wmbps	rpq	rkbpq	wpi	wkbpi	csps	cpups	cspq	cpupq	dbgb1	dbgb2	rss	maxop	p50	p99	tag
146342	0	27	0.1	2290.6	159.2	0.000	0.001	0.016	1.114	1579	10.4	0.011	6	4.2	34.7	5.2	0.001	NA	NA	my5651_rel_o2nofp.cz12a_c8r32
222223	0	0	0.0	3992.0	227.2	0.000	0.000	0.018	1.047	12129	11.9	0.055	4	4.6	35.1	5.5	0.001	NA	NA	my5744_rel_o2nofp.cz12a_c8r32
365855	0	1	0.0	11127.0	466.0	0.000	0.000	0.030	1.304	24775	40.1	0.068	9	4.5	35.1	5.0	0.002	NA	NA	my8043_rel_o2nofp.cz12a_c8r32
370372	0	1	0.0	11793.1	478.0	0.000	0.000	0.032	1.321	26220	39.7	0.071	9	4.5	36.5	5.1	0.002	NA	NA	my8406_rel_o2nofp.cz12a_c8r32
370372	0	1	0.0	11722.1	476.8	0.000	0.000	0.032	1.318	25827	39.7	0.070	9	4.5	36.5	5.1	0.001	NA	NA	my9400_rel_o2nofp.cz12a_c8r32
l.i1
l.i1: continue load after secondary indexes created with 50 inserts per transaction. Graphs for performance per 1-second interval are here.
Average throughput:
Insert response time histogram: each cell has the percentage of responses that take <= the time in the header and max is the max response time in seconds. For the max column values in the top 25% of the range have a red background and in the bottom 25% of the range have a green background. The red background is not used when the min value is within 80% of the max value.
| dbms | 256us | 1ms | 4ms | 16ms | 64ms | 256ms | 1s | 4s | 16s | gt | max |
|---|---|---|---|---|---|---|---|---|---|---|---|
| my5651_rel_o2nofp.cz12a_c8r32 | 11.502 | 86.599 | 1.727 | 0.170 | 0.002 | 0.081 | |||||
| my5744_rel_o2nofp.cz12a_c8r32 | 13.398 | 86.007 | 0.553 | 0.040 | 0.001 | 0.121 | |||||
| my8043_rel_o2nofp.cz12a_c8r32 | 99.365 | 0.551 | 0.082 | 0.001 | nonzero | 0.324 | |||||
| my8406_rel_o2nofp.cz12a_c8r32 | 99.369 | 0.549 | 0.082 | 0.001 | nonzero | 0.349 | |||||
| my9400_rel_o2nofp.cz12a_c8r32 | 99.347 | 0.568 | 0.083 | 0.001 | nonzero | 0.340 |
Delete response time histogram: each cell has the percentage of responses that take <= the time in the header and max is the max response time in seconds. For the max column values in the top 25% of the range have a red background and in the bottom 25% of the range have a green background. The red background is not used when the min value is within 80% of the max value.
| dbms | 256us | 1ms | 4ms | 16ms | 64ms | 256ms | 1s | 4s | 16s | gt | max |
|---|---|---|---|---|---|---|---|---|---|---|---|
| my5651_rel_o2nofp.cz12a_c8r32 | 78.046 | 20.853 | 0.968 | 0.132 | 0.001 | 0.075 | |||||
| my5744_rel_o2nofp.cz12a_c8r32 | 67.449 | 32.380 | 0.157 | 0.012 | 0.001 | 0.121 | |||||
| my8043_rel_o2nofp.cz12a_c8r32 | 82.946 | 16.871 | 0.165 | 0.018 | 0.001 | nonzero | 0.342 | ||||
| my8406_rel_o2nofp.cz12a_c8r32 | 81.792 | 18.040 | 0.150 | 0.017 | nonzero | nonzero | 0.307 | ||||
| my9400_rel_o2nofp.cz12a_c8r32 | 85.148 | 14.665 | 0.168 | 0.019 | 0.001 | 0.113 |
Performance metrics for the DBMS listed above. Some are normalized by throughput, others are not. Legend for results is here.
ips	qps	rps	rmbps	wps	wmbps	rpq	rkbpq	wpi	wkbpi	csps	cpups	cspq	cpupq	dbgb1	dbgb2	rss	maxop	p50	p99	tag
33501	0	854	3.3	2497.8	108.9	0.026	0.102	0.075	3.328	34445	40.1	1.028	96	6.2	36.7	7.8	0.081	35545	9249	my5651_rel_o2nofp.cz12a_c8r32
38095	0	0	0.0	2892.9	125.6	0.000	0.000	0.076	3.377	24210	47.1	0.636	99	6.2	36.8	8.2	0.121	39695	10448	my5744_rel_o2nofp.cz12a_c8r32
34692	0	126	2.0	2790.0	115.9	0.004	0.058	0.080	3.420	43716	36.2	1.260	83	6.8	37.8	9.4	0.324	35896	5599	my8043_rel_o2nofp.cz12a_c8r32
34512	0	126	2.0	2673.7	112.8	0.004	0.058	0.077	3.348	43268	35.9	1.254	83	6.8	43.1	9.4	0.349	35846	5649	my8406_rel_o2nofp.cz12a_c8r32
34632	0	126	2.0	2750.7	114.9	0.004	0.058	0.079	3.396	43468	35.8	1.255	83	6.8	43.1	9.4	0.340	35846	5649	my9400_rel_o2nofp.cz12a_c8r32
l.i2
l.i2: continue load after secondary indexes created with 5 inserts per transaction. Graphs for performance per 1-second interval are here.
Average throughput:
Insert response time histogram: each cell has the percentage of responses that take <= the time in the header and max is the max response time in seconds. For the max column values in the top 25% of the range have a red background and in the bottom 25% of the range have a green background. The red background is not used when the min value is within 80% of the max value.
| dbms | 256us | 1ms | 4ms | 16ms | 64ms | 256ms | 1s | 4s | 16s | gt | max |
|---|---|---|---|---|---|---|---|---|---|---|---|
| my5651_rel_o2nofp.cz12a_c8r32 | 88.938 | 10.938 | 0.017 | 0.097 | 0.009 | nonzero | 0.074 | ||||
| my5744_rel_o2nofp.cz12a_c8r32 | 93.362 | 6.581 | 0.045 | 0.011 | nonzero | nonzero | 0.114 | ||||
| my8043_rel_o2nofp.cz12a_c8r32 | 81.662 | 18.307 | 0.023 | 0.007 | 0.001 | nonzero | 0.101 | ||||
| my8406_rel_o2nofp.cz12a_c8r32 | 81.475 | 18.495 | 0.023 | 0.006 | 0.001 | nonzero | 0.101 | ||||
| my9400_rel_o2nofp.cz12a_c8r32 | 81.883 | 18.087 | 0.022 | 0.008 | 0.001 | nonzero | 0.117 |
Delete response time histogram: each cell has the percentage of responses that take <= the time in the header and max is the max response time in seconds. For the max column values in the top 25% of the range have a red background and in the bottom 25% of the range have a green background. The red background is not used when the min value is within 80% of the max value.
| dbms | 256us | 1ms | 4ms | 16ms | 64ms | 256ms | 1s | 4s | 16s | gt | max |
|---|---|---|---|---|---|---|---|---|---|---|---|
| my5651_rel_o2nofp.cz12a_c8r32 | 97.298 | 2.578 | 0.017 | 0.098 | 0.008 | nonzero | 0.074 | ||||
| my5744_rel_o2nofp.cz12a_c8r32 | 94.273 | 5.701 | 0.018 | 0.009 | nonzero | nonzero | 0.114 | ||||
| my8043_rel_o2nofp.cz12a_c8r32 | 95.401 | 4.573 | 0.018 | 0.006 | 0.001 | nonzero | 0.102 | ||||
| my8406_rel_o2nofp.cz12a_c8r32 | 94.857 | 5.119 | 0.017 | 0.006 | 0.001 | nonzero | 0.101 | ||||
| my9400_rel_o2nofp.cz12a_c8r32 | 95.693 | 4.282 | 0.018 | 0.007 | nonzero | nonzero | 0.119 |
Performance metrics for the DBMS listed above. Some are normalized by throughput, others are not. Legend for results is here.
ips	qps	rps	rmbps	wps	wmbps	rpq	rkbpq	wpi	wkbpi	csps	cpups	cspq	cpupq	dbgb1	dbgb2	rss	maxop	p50	p99	tag
23364	0	4148	16.2	1680.6	69.3	0.178	0.710	0.072	3.036	202942	43.7	8.686	150	6.2	36.7	7.8	0.074	23428	22108	my5651_rel_o2nofp.cz12a_c8r32
25189	0	0	0.0	1889.8	78.0	0.000	0.000	0.075	3.169	113442	41.9	4.504	133	6.2	36.8	8.3	0.114	25327	22698	my5744_rel_o2nofp.cz12a_c8r32
20121	0	0	0.0	1664.6	67.2	0.000	0.000	0.083	3.418	105937	34.5	5.265	137	6.8	37.8	9.4	0.101	20222	18813	my8043_rel_o2nofp.cz12a_c8r32
20040	0	0	0.0	1603.2	65.4	0.000	0.000	0.080	3.343	105007	34.5	5.240	138	6.8	45.0	9.4	0.101	20108	18882	my8406_rel_o2nofp.cz12a_c8r32
20325	0	0	0.0	1681.3	67.9	0.000	0.000	0.083	3.420	106731	34.7	5.251	137	6.8	45.0	9.4	0.117	20388	18623	my9400_rel_o2nofp.cz12a_c8r32
qr100.L1
qr100.L1: range queries with 100 insert/s per client. Graphs for performance per 1-second interval are here.
Average throughput:

Query response time histogram: each cell has the percentage of responses that take <= the time in the header and max is the max response time in seconds. For max values in the top 25% of the range have a red background and in the bottom 25% of the range have a green background. The red background is not used when the min value is within 80% of the max value.
| dbms | 256us | 1ms | 4ms | 16ms | 64ms | 256ms | 1s | 4s | 16s | gt | max |
|---|---|---|---|---|---|---|---|---|---|---|---|
| my5651_rel_o2nofp.cz12a_c8r32 | 99.963 | 0.031 | 0.002 | 0.005 | nonzero | 0.024 | |||||
| my5744_rel_o2nofp.cz12a_c8r32 | 99.986 | 0.013 | nonzero | nonzero | 0.010 | ||||||
| my8043_rel_o2nofp.cz12a_c8r32 | 99.968 | 0.032 | nonzero | nonzero | 0.004 | ||||||
| my8406_rel_o2nofp.cz12a_c8r32 | 99.968 | 0.032 | nonzero | 0.001 | |||||||
| my9400_rel_o2nofp.cz12a_c8r32 | 99.966 | 0.034 | nonzero | nonzero | 0.008 |
Insert response time histogram: each cell has the percentage of responses that take <= the time in the header and max is the max response time in seconds. For max values in the top 25% of the range have a red background and in the bottom 25% of the range have a green background. The red background is not used when the min value is within 80% of the max value.
| dbms | 256us | 1ms | 4ms | 16ms | 64ms | 256ms | 1s | 4s | 16s | gt | max |
|---|---|---|---|---|---|---|---|---|---|---|---|
| my5651_rel_o2nofp.cz12a_c8r32 | 0.333 | 49.583 | 44.611 | 5.444 | 0.028 | 0.070 | |||||
| my5744_rel_o2nofp.cz12a_c8r32 | 4.306 | 95.611 | 0.083 | 0.010 | |||||||
| my8043_rel_o2nofp.cz12a_c8r32 | 91.111 | 8.889 | 0.011 | ||||||||
| my8406_rel_o2nofp.cz12a_c8r32 | 91.972 | 8.000 | 0.028 | 0.050 | |||||||
| my9400_rel_o2nofp.cz12a_c8r32 | 80.250 | 19.500 | 0.250 | 0.058 |
Delete response time histogram: each cell has the percentage of responses that take <= the time in the header and max is the max response time in seconds. For max values in the top 25% of the range have a red background and in the bottom 25% of the range have a green background. The red background is not used when the min value is within 80% of the max value.
| dbms | 256us | 1ms | 4ms | 16ms | 64ms | 256ms | 1s | 4s | 16s | gt | max |
|---|---|---|---|---|---|---|---|---|---|---|---|
| my5651_rel_o2nofp.cz12a_c8r32 | 3.194 | 45.972 | 47.861 | 2.972 | 0.064 | ||||||
| my5744_rel_o2nofp.cz12a_c8r32 | 56.194 | 43.750 | 0.056 | 0.010 | |||||||
| my8043_rel_o2nofp.cz12a_c8r32 | 32.111 | 59.222 | 8.667 | 0.011 | |||||||
| my8406_rel_o2nofp.cz12a_c8r32 | 33.944 | 58.139 | 7.889 | 0.028 | 0.056 | ||||||
| my9400_rel_o2nofp.cz12a_c8r32 | 33.500 | 46.722 | 19.694 | 0.083 | 0.050 |
Performance metrics for the DBMS listed above. Some are normalized by throughput, others are not. Legend for results is here.
ips	qps	rps	rmbps	wps	wmbps	rpq	rkbpq	wpi	wkbpi	csps	cpups	cspq	cpupq	dbgb1	dbgb2	rss	maxop	p50	p99	tag
100	13180	4	0.0	736.4	20.3	0.000	0.001	7.371	207.710	75694	12.4	5.743	75	6.2	36.7	7.9	0.024	13198	12814	my5651_rel_o2nofp.cz12a_c8r32
100	10986	0	0.0	184.0	5.0	0.000	0.000	1.840	51.606	63071	13.2	5.741	96	6.2	36.8	8.3	0.010	10990	10846	my5744_rel_o2nofp.cz12a_c8r32
100	9144	0	0.0	173.1	4.8	0.000	0.000	1.732	49.011	52870	12.4	5.782	108	6.8	37.8	9.5	0.004	9151	9070	my8043_rel_o2nofp.cz12a_c8r32
100	8906	0	0.0	155.1	4.3	0.000	0.000	1.553	43.987	51512	13.2	5.784	119	6.8	45.0	9.4	0.001	8911	8798	my8406_rel_o2nofp.cz12a_c8r32
100	9185	0	0.0	195.2	5.4	0.000	0.000	1.952	55.221	53124	12.4	5.784	108	6.8	45.0	9.5	0.008	9183	9071	my9400_rel_o2nofp.cz12a_c8r32
qp100.L2
qp100.L2: point queries with 100 insert/s per client. Graphs for performance per 1-second interval are here.
Average throughput:
Query response time histogram: each cell has the percentage of responses that take <= the time in the header and max is the max response time in seconds. For max values in the top 25% of the range have a red background and in the bottom 25% of the range have a green background. The red background is not used when the min value is within 80% of the max value.
| dbms | 256us | 1ms | 4ms | 16ms | 64ms | 256ms | 1s | 4s | 16s | gt | max |
|---|---|---|---|---|---|---|---|---|---|---|---|
| my5651_rel_o2nofp.cz12a_c8r32 | 99.961 | 0.034 | 0.002 | 0.004 | nonzero | 0.020 | |||||
| my5744_rel_o2nofp.cz12a_c8r32 | 99.983 | 0.017 | nonzero | 0.002 | |||||||
| my8043_rel_o2nofp.cz12a_c8r32 | 99.915 | 0.085 | nonzero | 0.001 | |||||||
| my8406_rel_o2nofp.cz12a_c8r32 | 99.904 | 0.096 | nonzero | 0.001 | |||||||
| my9400_rel_o2nofp.cz12a_c8r32 | 99.906 | 0.094 | nonzero | 0.001 |
Insert response time histogram: each cell has the percentage of responses that take <= the time in the header and max is the max response time in seconds. For max values in the top 25% of the range have a red background and in the bottom 25% of the range have a green background. The red background is not used when the min value is within 80% of the max value.
| dbms | 256us | 1ms | 4ms | 16ms | 64ms | 256ms | 1s | 4s | 16s | gt | max |
|---|---|---|---|---|---|---|---|---|---|---|---|
| my5651_rel_o2nofp.cz12a_c8r32 | 0.056 | 51.917 | 44.361 | 3.667 | 0.061 | ||||||
| my5744_rel_o2nofp.cz12a_c8r32 | 100.000 | 0.002 | |||||||||
| my8043_rel_o2nofp.cz12a_c8r32 | 90.500 | 9.500 | 0.011 | ||||||||
| my8406_rel_o2nofp.cz12a_c8r32 | 91.333 | 8.667 | 0.011 | ||||||||
| my9400_rel_o2nofp.cz12a_c8r32 | 91.444 | 8.528 | 0.028 | 0.022 |
Delete response time histogram: each cell has the percentage of responses that take <= the time in the header and max is the max response time in seconds. For max values in the top 25% of the range have a red background and in the bottom 25% of the range have a green background. The red background is not used when the min value is within 80% of the max value.
| dbms | 256us | 1ms | 4ms | 16ms | 64ms | 256ms | 1s | 4s | 16s | gt | max |
|---|---|---|---|---|---|---|---|---|---|---|---|
| my5651_rel_o2nofp.cz12a_c8r32 | 0.889 | 50.472 | 47.111 | 1.528 | 0.053 | ||||||
| my5744_rel_o2nofp.cz12a_c8r32 | 44.472 | 55.528 | 0.002 | ||||||||
| my8043_rel_o2nofp.cz12a_c8r32 | 4.528 | 86.000 | 9.472 | 0.011 | |||||||
| my8406_rel_o2nofp.cz12a_c8r32 | 4.972 | 86.417 | 8.611 | 0.011 | |||||||
| my9400_rel_o2nofp.cz12a_c8r32 | 6.361 | 85.167 | 8.444 | 0.028 | 0.021 |
Performance metrics for the DBMS listed above. Some are normalized by throughput, others are not. Legend for results is here.
ips	qps	rps	rmbps	wps	wmbps	rpq	rkbpq	wpi	wkbpi	csps	cpups	cspq	cpupq	dbgb1	dbgb2	rss	maxop	p50	p99	tag
100	11184	4	0.0	728.9	20.1	0.000	0.001	7.289	205.506	64880	12.7	5.801	91	6.2	36.7	7.9	0.020	11183	10942	my5651_rel_o2nofp.cz12a_c8r32
100	9415	0	0.0	34.5	0.9	0.000	0.000	0.345	9.043	54615	12.5	5.801	106	6.2	36.8	8.3	0.002	9422	9311	my5744_rel_o2nofp.cz12a_c8r32
100	6952	0	0.0	48.3	1.3	0.000	0.000	0.483	13.714	40652	12.5	5.848	144	6.8	37.8	9.5	0.001	6943	6910	my8043_rel_o2nofp.cz12a_c8r32
100	6806	0	0.0	33.5	0.9	0.000	0.000	0.335	9.534	39804	12.9	5.848	152	6.8	45.0	9.4	0.001	6815	6735	my8406_rel_o2nofp.cz12a_c8r32
100	6992	0	0.0	39.2	1.1	0.000	0.000	0.392	10.818	40865	12.4	5.845	142	6.8	45.1	9.5	0.001	6991	6927	my9400_rel_o2nofp.cz12a_c8r32
qr500.L3
qr500.L3: range queries with 500 insert/s per client. Graphs for performance per 1-second interval are here.
Average throughput:
Query response time histogram: each cell has the percentage of responses that take <= the time in the header and max is the max response time in seconds. For max values in the top 25% of the range have a red background and in the bottom 25% of the range have a green background. The red background is not used when the min value is within 80% of the max value.
| dbms | 256us | 1ms | 4ms | 16ms | 64ms | 256ms | 1s | 4s | 16s | gt | max |
|---|---|---|---|---|---|---|---|---|---|---|---|
| my5651_rel_o2nofp.cz12a_c8r32 | 99.968 | 0.028 | 0.001 | 0.002 | nonzero | 0.023 | |||||
| my5744_rel_o2nofp.cz12a_c8r32 | 99.983 | 0.017 | nonzero | 0.003 | |||||||
| my8043_rel_o2nofp.cz12a_c8r32 | 99.962 | 0.038 | nonzero | 0.003 | |||||||
| my8406_rel_o2nofp.cz12a_c8r32 | 99.959 | 0.041 | nonzero | 0.002 | |||||||
| my9400_rel_o2nofp.cz12a_c8r32 | 99.965 | 0.035 | nonzero | 0.002 |
Insert response time histogram: each cell has the percentage of responses that take <= the time in the header and max is the max response time in seconds. For max values in the top 25% of the range have a red background and in the bottom 25% of the range have a green background. The red background is not used when the min value is within 80% of the max value.
| dbms | 256us | 1ms | 4ms | 16ms | 64ms | 256ms | 1s | 4s | 16s | gt | max |
|---|---|---|---|---|---|---|---|---|---|---|---|
| my5651_rel_o2nofp.cz12a_c8r32 | 13.272 | 76.528 | 9.922 | 0.278 | 0.059 | ||||||
| my5744_rel_o2nofp.cz12a_c8r32 | 16.789 | 83.211 | 0.002 | ||||||||
| my8043_rel_o2nofp.cz12a_c8r32 | 98.122 | 1.872 | 0.006 | 0.020 | |||||||
| my8406_rel_o2nofp.cz12a_c8r32 | 98.133 | 1.861 | 0.006 | 0.021 | |||||||
| my9400_rel_o2nofp.cz12a_c8r32 | 99.994 | 0.006 | 0.011 |
Delete response time histogram: each cell has the percentage of responses that take <= the time in the header and max is the max response time in seconds. For max values in the top 25% of the range have a red background and in the bottom 25% of the range have a green background. The red background is not used when the min value is within 80% of the max value.
| dbms | 256us | 1ms | 4ms | 16ms | 64ms | 256ms | 1s | 4s | 16s | gt | max |
|---|---|---|---|---|---|---|---|---|---|---|---|
| my5651_rel_o2nofp.cz12a_c8r32 | 22.856 | 66.939 | 9.978 | 0.228 | 0.046 | ||||||
| my5744_rel_o2nofp.cz12a_c8r32 | 88.972 | 11.028 | 0.002 | ||||||||
| my8043_rel_o2nofp.cz12a_c8r32 | 74.122 | 24.000 | 1.872 | 0.006 | 0.020 | ||||||
| my8406_rel_o2nofp.cz12a_c8r32 | 74.561 | 23.578 | 1.861 | 0.011 | |||||||
| my9400_rel_o2nofp.cz12a_c8r32 | 84.661 | 15.333 | 0.006 | 0.011 |
Performance metrics for the DBMS listed above. Some are normalized by throughput, others are not. Legend for results is here.
ips	qps	rps	rmbps	wps	wmbps	rpq	rkbpq	wpi	wkbpi	csps	cpups	cspq	cpupq	dbgb1	dbgb2	rss	maxop	p50	p99	tag
500	13204	16	0.1	401.6	11.5	0.001	0.005	0.804	23.562	76089	13.2	5.762	80	6.2	36.7	7.9	0.023	13230	12895	my5651_rel_o2nofp.cz12a_c8r32
500	10926	0	0.0	83.6	2.6	0.000	0.000	0.167	5.296	62889	13.3	5.756	97	6.2	36.8	8.3	0.003	10927	10798	my5744_rel_o2nofp.cz12a_c8r32
500	9124	0	0.0	69.2	2.2	0.000	0.000	0.138	4.565	52995	12.7	5.808	111	6.8	37.8	9.5	0.003	9119	9039	my8043_rel_o2nofp.cz12a_c8r32
500	8908	0	0.0	67.9	2.2	0.000	0.000	0.136	4.501	51760	13.2	5.810	119	6.8	45.1	9.4	0.002	8910	8814	my8406_rel_o2nofp.cz12a_c8r32
500	9178	0	0.0	74.2	2.4	0.000	0.000	0.149	4.914	53336	12.7	5.811	111	6.8	45.1	9.5	0.002	9183	9086	my9400_rel_o2nofp.cz12a_c8r32
qp500.L4
qp500.L4: point queries with 500 insert/s per client. Graphs for performance per 1-second interval are here.
Average throughput:

Query response time histogram: each cell has the percentage of responses that take <= the time in the header and max is the max response time in seconds. For max values in the top 25% of the range have a red background and in the bottom 25% of the range have a green background. The red background is not used when the min value is within 80% of the max value.
| dbms | 256us | 1ms | 4ms | 16ms | 64ms | 256ms | 1s | 4s | 16s | gt | max |
|---|---|---|---|---|---|---|---|---|---|---|---|
| my5651_rel_o2nofp.cz12a_c8r32 | 99.954 | 0.043 | 0.001 | 0.002 | 0.010 | ||||||
| my5744_rel_o2nofp.cz12a_c8r32 | 99.978 | 0.022 | nonzero | 0.002 | |||||||
| my8043_rel_o2nofp.cz12a_c8r32 | 99.889 | 0.111 | nonzero | 0.002 | |||||||
| my8406_rel_o2nofp.cz12a_c8r32 | 99.871 | 0.128 | nonzero | 0.002 | |||||||
| my9400_rel_o2nofp.cz12a_c8r32 | 99.890 | 0.110 | nonzero | 0.002 |
Insert response time histogram: each cell has the percentage of responses that take <= the time in the header and max is the max response time in seconds. For max values in the top 25% of the range have a red background and in the bottom 25% of the range have a green background. The red background is not used when the min value is within 80% of the max value.
| dbms | 256us | 1ms | 4ms | 16ms | 64ms | 256ms | 1s | 4s | 16s | gt | max |
|---|---|---|---|---|---|---|---|---|---|---|---|
| my5651_rel_o2nofp.cz12a_c8r32 | 13.578 | 77.222 | 9.128 | 0.072 | 0.017 | ||||||
| my5744_rel_o2nofp.cz12a_c8r32 | 11.572 | 88.417 | 0.011 | 0.010 | |||||||
| my8043_rel_o2nofp.cz12a_c8r32 | 98.067 | 1.933 | 0.011 | ||||||||
| my8406_rel_o2nofp.cz12a_c8r32 | 98.128 | 1.872 | 0.011 | ||||||||
| my9400_rel_o2nofp.cz12a_c8r32 | 98.111 | 1.883 | 0.006 | 0.020 |
Delete response time histogram: each cell has the percentage of responses that take <= the time in the header and max is the max response time in seconds. For max values in the top 25% of the range have a red background and in the bottom 25% of the range have a green background. The red background is not used when the min value is within 80% of the max value.
| dbms | 256us | 1ms | 4ms | 16ms | 64ms | 256ms | 1s | 4s | 16s | gt | max |
|---|---|---|---|---|---|---|---|---|---|---|---|
| my5651_rel_o2nofp.cz12a_c8r32 | 22.189 | 68.578 | 9.211 | 0.022 | 0.017 | ||||||
| my5744_rel_o2nofp.cz12a_c8r32 | 87.617 | 12.378 | 0.006 | 0.010 | |||||||
| my8043_rel_o2nofp.cz12a_c8r32 | 49.067 | 49.006 | 1.928 | 0.011 | |||||||
| my8406_rel_o2nofp.cz12a_c8r32 | 51.717 | 46.411 | 1.872 | 0.011 | |||||||
| my9400_rel_o2nofp.cz12a_c8r32 | 53.517 | 44.600 | 1.878 | 0.006 | 0.020 |
Performance metrics for the DBMS listed above. Some are normalized by throughput, others are not. Legend for results is here.
ips	qps	rps	rmbps	wps	wmbps	rpq	rkbpq	wpi	wkbpi	csps	cpups	cspq	cpupq	dbgb1	dbgb2	rss	maxop	p50	p99	tag
500	11112	16	0.1	7.1	0.6	0.001	0.006	0.014	1.176	64712	12.5	5.824	90	6.2	36.7	7.9	0.010	11118	10958	my5651_rel_o2nofp.cz12a_c8r32
500	9387	0	0.0	30.2	1.1	0.000	0.000	0.060	2.286	54557	12.6	5.812	107	6.2	36.8	8.3	0.002	9375	9279	my5744_rel_o2nofp.cz12a_c8r32
500	6980	0	0.0	39.3	1.4	0.000	0.000	0.079	2.948	41152	12.5	5.896	143	6.8	37.8	9.5	0.002	6975	6927	my8043_rel_o2nofp.cz12a_c8r32
500	6789	0	0.0	36.1	1.3	0.000	0.000	0.072	2.747	40054	13.0	5.900	153	6.8	45.2	9.4	0.002	6783	6719	my8406_rel_o2nofp.cz12a_c8r32
500	6973	0	0.0	33.9	1.3	0.000	0.000	0.068	2.646	41112	12.6	5.896	145	6.8	45.2	9.5	0.002	6975	6911	my9400_rel_o2nofp.cz12a_c8r32
qr1000.L5
qr1000.L5: range queries with 1000 insert/s per client. Graphs for performance per 1-second interval are here.
Average throughput:

Query response time histogram: each cell has the percentage of responses that take <= the time in the header and max is the max response time in seconds. For max values in the top 25% of the range have a red background and in the bottom 25% of the range have a green background. The red background is not used when the min value is within 80% of the max value.
| dbms | 256us | 1ms | 4ms | 16ms | 64ms | 256ms | 1s | 4s | 16s | gt | max |
|---|---|---|---|---|---|---|---|---|---|---|---|
| my5651_rel_o2nofp.cz12a_c8r32 | 99.960 | 0.035 | 0.002 | 0.003 | nonzero | 0.019 | |||||
| my5744_rel_o2nofp.cz12a_c8r32 | 99.979 | 0.021 | nonzero | nonzero | 0.007 | ||||||
| my8043_rel_o2nofp.cz12a_c8r32 | 99.957 | 0.043 | nonzero | 0.002 | |||||||
| my8406_rel_o2nofp.cz12a_c8r32 | 99.954 | 0.046 | nonzero | 0.002 | |||||||
| my9400_rel_o2nofp.cz12a_c8r32 | 99.957 | 0.043 | nonzero | 0.002 |
Insert response time histogram: each cell has the percentage of responses that take <= the time in the header and max is the max response time in seconds. For max values in the top 25% of the range have a red background and in the bottom 25% of the range have a green background. The red background is not used when the min value is within 80% of the max value.
| dbms | 256us | 1ms | 4ms | 16ms | 64ms | 256ms | 1s | 4s | 16s | gt | max |
|---|---|---|---|---|---|---|---|---|---|---|---|
| my5651_rel_o2nofp.cz12a_c8r32 | 16.350 | 76.606 | 6.775 | 0.269 | 0.047 | ||||||
| my5744_rel_o2nofp.cz12a_c8r32 | 31.669 | 68.331 | 0.003 | ||||||||
| my8043_rel_o2nofp.cz12a_c8r32 | 99.081 | 0.917 | 0.003 | 0.020 | |||||||
| my8406_rel_o2nofp.cz12a_c8r32 | 99.986 | 0.011 | 0.003 | 0.041 | |||||||
| my9400_rel_o2nofp.cz12a_c8r32 | 99.139 | 0.856 | 0.006 | 0.045 |
Delete response time histogram: each cell has the percentage of responses that take <= the time in the header and max is the max response time in seconds. For max values in the top 25% of the range have a red background and in the bottom 25% of the range have a green background. The red background is not used when the min value is within 80% of the max value.
| dbms | 256us | 1ms | 4ms | 16ms | 64ms | 256ms | 1s | 4s | 16s | gt | max |
|---|---|---|---|---|---|---|---|---|---|---|---|
| my5651_rel_o2nofp.cz12a_c8r32 | 29.597 | 63.597 | 6.600 | 0.206 | 0.042 | ||||||
| my5744_rel_o2nofp.cz12a_c8r32 | 93.406 | 6.594 | 0.002 | ||||||||
| my8043_rel_o2nofp.cz12a_c8r32 | 84.672 | 14.411 | 0.914 | 0.003 | 0.020 | ||||||
| my8406_rel_o2nofp.cz12a_c8r32 | 74.100 | 25.894 | 0.003 | 0.003 | 0.034 | ||||||
| my9400_rel_o2nofp.cz12a_c8r32 | 85.283 | 13.858 | 0.856 | 0.003 | 0.051 |
Performance metrics for the DBMS listed above. Some are normalized by throughput, others are not. Legend for results is here.
ips	qps	rps	rmbps	wps	wmbps	rpq	rkbpq	wpi	wkbpi	csps	cpups	cspq	cpupq	dbgb1	dbgb2	rss	maxop	p50	p99	tag
1000	13091	32	0.1	622.0	18.0	0.002	0.010	0.622	18.466	75852	13.5	5.794	83	6.2	36.7	7.9	0.019	13102	12526	my5651_rel_o2nofp.cz12a_c8r32
1000	10958	0	0.0	97.1	3.4	0.000	0.000	0.097	3.494	63244	14.2	5.772	104	6.2	36.8	8.3	0.007	10958	10846	my5744_rel_o2nofp.cz12a_c8r32
1000	9122	0	0.0	96.2	3.5	0.000	0.000	0.096	3.541	53472	13.4	5.862	118	6.8	37.8	9.5	0.002	9119	9039	my8043_rel_o2nofp.cz12a_c8r32
1000	8873	0	0.0	99.5	3.6	0.000	0.000	0.100	3.649	52083	13.9	5.870	125	6.8	45.4	9.4	0.002	8863	8783	my8406_rel_o2nofp.cz12a_c8r32
1000	9131	0	0.0	99.8	3.6	0.000	0.000	0.100	3.643	53524	13.4	5.862	117	6.8	45.4	9.5	0.002	9134	9038	my9400_rel_o2nofp.cz12a_c8r32
qp1000.L6
qp1000.L6: point queries with 1000 insert/s per client. Graphs for performance per 1-second interval are here.
Average throughput:
Query response time histogram: each cell has the percentage of responses that take <= the time in the header and max is the max response time in seconds. For max values in the top 25% of the range have a red background and in the bottom 25% of the range have a green background. The red background is not used when the min value is within 80% of the max value.
| dbms | 256us | 1ms | 4ms | 16ms | 64ms | 256ms | 1s | 4s | 16s | gt | max |
|---|---|---|---|---|---|---|---|---|---|---|---|
| my5651_rel_o2nofp.cz12a_c8r32 | 99.940 | 0.057 | 0.001 | 0.002 | 0.010 | ||||||
| my5744_rel_o2nofp.cz12a_c8r32 | 99.972 | 0.028 | nonzero | 0.002 | |||||||
| my8043_rel_o2nofp.cz12a_c8r32 | 99.878 | 0.122 | nonzero | 0.002 | |||||||
| my8406_rel_o2nofp.cz12a_c8r32 | 99.857 | 0.143 | nonzero | 0.002 | |||||||
| my9400_rel_o2nofp.cz12a_c8r32 | 99.871 | 0.129 | nonzero | 0.002 |
Insert response time histogram: each cell has the percentage of responses that take <= the time in the header and max is the max response time in seconds. For max values in the top 25% of the range have a red background and in the bottom 25% of the range have a green background. The red background is not used when the min value is within 80% of the max value.
| dbms | 256us | 1ms | 4ms | 16ms | 64ms | 256ms | 1s | 4s | 16s | gt | max |
|---|---|---|---|---|---|---|---|---|---|---|---|
| my5651_rel_o2nofp.cz12a_c8r32 | 18.350 | 76.914 | 4.708 | 0.028 | 0.018 | ||||||
| my5744_rel_o2nofp.cz12a_c8r32 | 25.844 | 74.147 | 0.008 | 0.011 | |||||||
| my8043_rel_o2nofp.cz12a_c8r32 | 99.044 | 0.953 | 0.003 | 0.021 | |||||||
| my8406_rel_o2nofp.cz12a_c8r32 | 99.992 | 0.006 | 0.003 | 0.043 | |||||||
| my9400_rel_o2nofp.cz12a_c8r32 | 99.092 | 0.903 | 0.006 | 0.048 |
Delete response time histogram: each cell has the percentage of responses that take <= the time in the header and max is the max response time in seconds. For max values in the top 25% of the range have a red background and in the bottom 25% of the range have a green background. The red background is not used when the min value is within 80% of the max value.
| dbms | 256us | 1ms | 4ms | 16ms | 64ms | 256ms | 1s | 4s | 16s | gt | max |
|---|---|---|---|---|---|---|---|---|---|---|---|
| my5651_rel_o2nofp.cz12a_c8r32 | 33.242 | 62.036 | 4.706 | 0.017 | 0.017 | ||||||
| my5744_rel_o2nofp.cz12a_c8r32 | 92.519 | 7.475 | 0.006 | 0.010 | |||||||
| my8043_rel_o2nofp.cz12a_c8r32 | 70.839 | 28.206 | 0.953 | 0.003 | 0.020 | ||||||
| my8406_rel_o2nofp.cz12a_c8r32 | 69.614 | 30.381 | 0.003 | 0.003 | 0.049 | ||||||
| my9400_rel_o2nofp.cz12a_c8r32 | 72.183 | 26.958 | 0.853 | 0.006 | 0.055 |
Performance metrics for the DBMS listed above. Some are normalized by throughput, others are not. Legend for results is here.
ips	qps	rps	rmbps	wps	wmbps	rpq	rkbpq	wpi	wkbpi	csps	cpups	cspq	cpupq	dbgb1	dbgb2	rss	maxop	p50	p99	tag
1000	11167	31	0.1	17.8	1.3	0.003	0.011	0.018	1.326	65396	13.6	5.856	97	6.2	36.7	7.8	0.010	11166	11022	my5651_rel_o2nofp.cz12a_c8r32
1000	9351	0	0.0	70.5	2.7	0.000	0.000	0.070	2.738	54575	13.4	5.836	115	6.2	36.8	8.3	0.002	9343	9247	my5744_rel_o2nofp.cz12a_c8r32
1000	6942	0	0.0	89.8	3.3	0.000	0.000	0.090	3.367	41426	13.2	5.967	152	6.8	37.8	9.5	0.002	6943	6895	my8043_rel_o2nofp.cz12a_c8r32
999	6824	0	0.0	88.8	3.3	0.000	0.000	0.089	3.342	40785	13.5	5.977	158	6.8	45.6	9.4	0.002	6831	6751	my8406_rel_o2nofp.cz12a_c8r32
999	6975	0	0.0	93.6	3.4	0.000	0.000	0.094	3.484	41647	13.4	5.971	154	6.8	45.6	9.5	0.002	6975	6927	my9400_rel_o2nofp.cz12a_c8r32
l.i0
l.i0: load without secondary indexes
Performance metrics for all DBMS, not just the ones listed above. Some are normalized by throughput, others are not. Legend for results is here.
ips	qps	rps	rmbps	wps	wmbps	rpq	rkbpq	wpi	wkbpi	csps	cpups	cspq	cpupq	dbgb1	dbgb2	rss	maxop	p50	p99	tag
184049	0	1617	6.3	495.6	45.9	0.009	0.035	0.003	0.255	24185	20.3	0.131	9	2.0	32.5	3.5	0.175	185670	153878	my5651_rel_o2nofp.cz12a_c8r32
163934	0	0	0.0	503.2	42.4	0.000	0.000	0.003	0.265	19031	20.0	0.116	10	2.0	32.5	4.0	0.165	165267	137281	my5744_rel_o2nofp.cz12a_c8r32
110701	0	0	0.0	411.0	31.6	0.000	0.000	0.004	0.293	13713	17.1	0.124	12	2.0	32.6	4.3	0.078	111588	102981	my8043_rel_o2nofp.cz12a_c8r32
110701	0	0	0.0	406.0	31.4	0.000	0.000	0.004	0.291	13677	17.1	0.124	12	2.0	34.0	4.2	0.093	111079	101788	my8406_rel_o2nofp.cz12a_c8r32
109890	0	0	0.0	406.3	31.4	0.000	0.000	0.004	0.293	13688	17.2	0.125	13	2.0	34.0	4.3	0.078	110880	102081	my9400_rel_o2nofp.cz12a_c8r32
l.x
l.x: create secondary indexes
Performance metrics for all DBMS, not just the ones listed above. Some are normalized by throughput, others are not. Legend for results is here.
ips	qps	rps	rmbps	wps	wmbps	rpq	rkbpq	wpi	wkbpi	csps	cpups	cspq	cpupq	dbgb1	dbgb2	rss	maxop	p50	p99	tag
146342	0	27	0.1	2290.6	159.2	0.000	0.001	0.016	1.114	1579	10.4	0.011	6	4.2	34.7	5.2	0.001	NA	NA	my5651_rel_o2nofp.cz12a_c8r32
222223	0	0	0.0	3992.0	227.2	0.000	0.000	0.018	1.047	12129	11.9	0.055	4	4.6	35.1	5.5	0.001	NA	NA	my5744_rel_o2nofp.cz12a_c8r32
365855	0	1	0.0	11127.0	466.0	0.000	0.000	0.030	1.304	24775	40.1	0.068	9	4.5	35.1	5.0	0.002	NA	NA	my8043_rel_o2nofp.cz12a_c8r32
370372	0	1	0.0	11793.1	478.0	0.000	0.000	0.032	1.321	26220	39.7	0.071	9	4.5	36.5	5.1	0.002	NA	NA	my8406_rel_o2nofp.cz12a_c8r32
370372	0	1	0.0	11722.1	476.8	0.000	0.000	0.032	1.318	25827	39.7	0.070	9	4.5	36.5	5.1	0.001	NA	NA	my9400_rel_o2nofp.cz12a_c8r32
l.i1
l.i1: continue load after secondary indexes created with 50 inserts per transaction
Performance metrics for all DBMS, not just the ones listed above. Some are normalized by throughput, others are not. Legend for results is here.
ips	qps	rps	rmbps	wps	wmbps	rpq	rkbpq	wpi	wkbpi	csps	cpups	cspq	cpupq	dbgb1	dbgb2	rss	maxop	p50	p99	tag
33501	0	854	3.3	2497.8	108.9	0.026	0.102	0.075	3.328	34445	40.1	1.028	96	6.2	36.7	7.8	0.081	35545	9249	my5651_rel_o2nofp.cz12a_c8r32
38095	0	0	0.0	2892.9	125.6	0.000	0.000	0.076	3.377	24210	47.1	0.636	99	6.2	36.8	8.2	0.121	39695	10448	my5744_rel_o2nofp.cz12a_c8r32
34692	0	126	2.0	2790.0	115.9	0.004	0.058	0.080	3.420	43716	36.2	1.260	83	6.8	37.8	9.4	0.324	35896	5599	my8043_rel_o2nofp.cz12a_c8r32
34512	0	126	2.0	2673.7	112.8	0.004	0.058	0.077	3.348	43268	35.9	1.254	83	6.8	43.1	9.4	0.349	35846	5649	my8406_rel_o2nofp.cz12a_c8r32
34632	0	126	2.0	2750.7	114.9	0.004	0.058	0.079	3.396	43468	35.8	1.255	83	6.8	43.1	9.4	0.340	35846	5649	my9400_rel_o2nofp.cz12a_c8r32
l.i2
l.i2: continue load after secondary indexes created with 5 inserts per transaction
Performance metrics for all DBMS, not just the ones listed above. Some are normalized by throughput, others are not. Legend for results is here.
ips	qps	rps	rmbps	wps	wmbps	rpq	rkbpq	wpi	wkbpi	csps	cpups	cspq	cpupq	dbgb1	dbgb2	rss	maxop	p50	p99	tag
23364	0	4148	16.2	1680.6	69.3	0.178	0.710	0.072	3.036	202942	43.7	8.686	150	6.2	36.7	7.8	0.074	23428	22108	my5651_rel_o2nofp.cz12a_c8r32
25189	0	0	0.0	1889.8	78.0	0.000	0.000	0.075	3.169	113442	41.9	4.504	133	6.2	36.8	8.3	0.114	25327	22698	my5744_rel_o2nofp.cz12a_c8r32
20121	0	0	0.0	1664.6	67.2	0.000	0.000	0.083	3.418	105937	34.5	5.265	137	6.8	37.8	9.4	0.101	20222	18813	my8043_rel_o2nofp.cz12a_c8r32
20040	0	0	0.0	1603.2	65.4	0.000	0.000	0.080	3.343	105007	34.5	5.240	138	6.8	45.0	9.4	0.101	20108	18882	my8406_rel_o2nofp.cz12a_c8r32
20325	0	0	0.0	1681.3	67.9	0.000	0.000	0.083	3.420	106731	34.7	5.251	137	6.8	45.0	9.4	0.117	20388	18623	my9400_rel_o2nofp.cz12a_c8r32
qr100.L1
qr100.L1: range queries with 100 insert/s per client
Performance metrics for all DBMS, not just the ones listed above. Some are normalized by throughput, others are not. Legend for results is here.
ips	qps	rps	rmbps	wps	wmbps	rpq	rkbpq	wpi	wkbpi	csps	cpups	cspq	cpupq	dbgb1	dbgb2	rss	maxop	p50	p99	tag
100	13180	4	0.0	736.4	20.3	0.000	0.001	7.371	207.710	75694	12.4	5.743	75	6.2	36.7	7.9	0.024	13198	12814	my5651_rel_o2nofp.cz12a_c8r32
100	10986	0	0.0	184.0	5.0	0.000	0.000	1.840	51.606	63071	13.2	5.741	96	6.2	36.8	8.3	0.010	10990	10846	my5744_rel_o2nofp.cz12a_c8r32
100	9144	0	0.0	173.1	4.8	0.000	0.000	1.732	49.011	52870	12.4	5.782	108	6.8	37.8	9.5	0.004	9151	9070	my8043_rel_o2nofp.cz12a_c8r32
100	8906	0	0.0	155.1	4.3	0.000	0.000	1.553	43.987	51512	13.2	5.784	119	6.8	45.0	9.4	0.001	8911	8798	my8406_rel_o2nofp.cz12a_c8r32
100	9185	0	0.0	195.2	5.4	0.000	0.000	1.952	55.221	53124	12.4	5.784	108	6.8	45.0	9.5	0.008	9183	9071	my9400_rel_o2nofp.cz12a_c8r32
qp100.L2
qp100.L2: point queries with 100 insert/s per client
Performance metrics for all DBMS, not just the ones listed above. Some are normalized by throughput, others are not. Legend for results is here.
ips	qps	rps	rmbps	wps	wmbps	rpq	rkbpq	wpi	wkbpi	csps	cpups	cspq	cpupq	dbgb1	dbgb2	rss	maxop	p50	p99	tag
100	11184	4	0.0	728.9	20.1	0.000	0.001	7.289	205.506	64880	12.7	5.801	91	6.2	36.7	7.9	0.020	11183	10942	my5651_rel_o2nofp.cz12a_c8r32
100	9415	0	0.0	34.5	0.9	0.000	0.000	0.345	9.043	54615	12.5	5.801	106	6.2	36.8	8.3	0.002	9422	9311	my5744_rel_o2nofp.cz12a_c8r32
100	6952	0	0.0	48.3	1.3	0.000	0.000	0.483	13.714	40652	12.5	5.848	144	6.8	37.8	9.5	0.001	6943	6910	my8043_rel_o2nofp.cz12a_c8r32
100	6806	0	0.0	33.5	0.9	0.000	0.000	0.335	9.534	39804	12.9	5.848	152	6.8	45.0	9.4	0.001	6815	6735	my8406_rel_o2nofp.cz12a_c8r32
100	6992	0	0.0	39.2	1.1	0.000	0.000	0.392	10.818	40865	12.4	5.845	142	6.8	45.1	9.5	0.001	6991	6927	my9400_rel_o2nofp.cz12a_c8r32
qr500.L3
qr500.L3: range queries with 500 insert/s per client
Performance metrics for all DBMS, not just the ones listed above. Some are normalized by throughput, others are not. Legend for results is here.
ips	qps	rps	rmbps	wps	wmbps	rpq	rkbpq	wpi	wkbpi	csps	cpups	cspq	cpupq	dbgb1	dbgb2	rss	maxop	p50	p99	tag
500	13204	16	0.1	401.6	11.5	0.001	0.005	0.804	23.562	76089	13.2	5.762	80	6.2	36.7	7.9	0.023	13230	12895	my5651_rel_o2nofp.cz12a_c8r32
500	10926	0	0.0	83.6	2.6	0.000	0.000	0.167	5.296	62889	13.3	5.756	97	6.2	36.8	8.3	0.003	10927	10798	my5744_rel_o2nofp.cz12a_c8r32
500	9124	0	0.0	69.2	2.2	0.000	0.000	0.138	4.565	52995	12.7	5.808	111	6.8	37.8	9.5	0.003	9119	9039	my8043_rel_o2nofp.cz12a_c8r32
500	8908	0	0.0	67.9	2.2	0.000	0.000	0.136	4.501	51760	13.2	5.810	119	6.8	45.1	9.4	0.002	8910	8814	my8406_rel_o2nofp.cz12a_c8r32
500	9178	0	0.0	74.2	2.4	0.000	0.000	0.149	4.914	53336	12.7	5.811	111	6.8	45.1	9.5	0.002	9183	9086	my9400_rel_o2nofp.cz12a_c8r32
qp500.L4
qp500.L4: point queries with 500 insert/s per client
Performance metrics for all DBMS, not just the ones listed above. Some are normalized by throughput, others are not. Legend for results is here.
ips	qps	rps	rmbps	wps	wmbps	rpq	rkbpq	wpi	wkbpi	csps	cpups	cspq	cpupq	dbgb1	dbgb2	rss	maxop	p50	p99	tag
500	11112	16	0.1	7.1	0.6	0.001	0.006	0.014	1.176	64712	12.5	5.824	90	6.2	36.7	7.9	0.010	11118	10958	my5651_rel_o2nofp.cz12a_c8r32
500	9387	0	0.0	30.2	1.1	0.000	0.000	0.060	2.286	54557	12.6	5.812	107	6.2	36.8	8.3	0.002	9375	9279	my5744_rel_o2nofp.cz12a_c8r32
500	6980	0	0.0	39.3	1.4	0.000	0.000	0.079	2.948	41152	12.5	5.896	143	6.8	37.8	9.5	0.002	6975	6927	my8043_rel_o2nofp.cz12a_c8r32
500	6789	0	0.0	36.1	1.3	0.000	0.000	0.072	2.747	40054	13.0	5.900	153	6.8	45.2	9.4	0.002	6783	6719	my8406_rel_o2nofp.cz12a_c8r32
500	6973	0	0.0	33.9	1.3	0.000	0.000	0.068	2.646	41112	12.6	5.896	145	6.8	45.2	9.5	0.002	6975	6911	my9400_rel_o2nofp.cz12a_c8r32
qr1000.L5
qr1000.L5: range queries with 1000 insert/s per client
Performance metrics for all DBMS, not just the ones listed above. Some are normalized by throughput, others are not. Legend for results is here.
ips	qps	rps	rmbps	wps	wmbps	rpq	rkbpq	wpi	wkbpi	csps	cpups	cspq	cpupq	dbgb1	dbgb2	rss	maxop	p50	p99	tag
1000	13091	32	0.1	622.0	18.0	0.002	0.010	0.622	18.466	75852	13.5	5.794	83	6.2	36.7	7.9	0.019	13102	12526	my5651_rel_o2nofp.cz12a_c8r32
1000	10958	0	0.0	97.1	3.4	0.000	0.000	0.097	3.494	63244	14.2	5.772	104	6.2	36.8	8.3	0.007	10958	10846	my5744_rel_o2nofp.cz12a_c8r32
1000	9122	0	0.0	96.2	3.5	0.000	0.000	0.096	3.541	53472	13.4	5.862	118	6.8	37.8	9.5	0.002	9119	9039	my8043_rel_o2nofp.cz12a_c8r32
1000	8873	0	0.0	99.5	3.6	0.000	0.000	0.100	3.649	52083	13.9	5.870	125	6.8	45.4	9.4	0.002	8863	8783	my8406_rel_o2nofp.cz12a_c8r32
1000	9131	0	0.0	99.8	3.6	0.000	0.000	0.100	3.643	53524	13.4	5.862	117	6.8	45.4	9.5	0.002	9134	9038	my9400_rel_o2nofp.cz12a_c8r32
qp1000.L6
qp1000.L6: point queries with 1000 insert/s per client
Performance metrics for all DBMS, not just the ones listed above. Some are normalized by throughput, others are not. Legend for results is here.
ips	qps	rps	rmbps	wps	wmbps	rpq	rkbpq	wpi	wkbpi	csps	cpups	cspq	cpupq	dbgb1	dbgb2	rss	maxop	p50	p99	tag
1000	11167	31	0.1	17.8	1.3	0.003	0.011	0.018	1.326	65396	13.6	5.856	97	6.2	36.7	7.8	0.010	11166	11022	my5651_rel_o2nofp.cz12a_c8r32
1000	9351	0	0.0	70.5	2.7	0.000	0.000	0.070	2.738	54575	13.4	5.836	115	6.2	36.8	8.3	0.002	9343	9247	my5744_rel_o2nofp.cz12a_c8r32
1000	6942	0	0.0	89.8	3.3	0.000	0.000	0.090	3.367	41426	13.2	5.967	152	6.8	37.8	9.5	0.002	6943	6895	my8043_rel_o2nofp.cz12a_c8r32
999	6824	0	0.0	88.8	3.3	0.000	0.000	0.089	3.342	40785	13.5	5.977	158	6.8	45.6	9.4	0.002	6831	6751	my8406_rel_o2nofp.cz12a_c8r32
999	6975	0	0.0	93.6	3.4	0.000	0.000	0.094	3.484	41647	13.4	5.971	154	6.8	45.6	9.5	0.002	6975	6927	my9400_rel_o2nofp.cz12a_c8r32
l.i0
- l.i0: load without secondary indexes
- Legend for results is here.
- Each entry lists the percentage of responses that fit in that bucket (slower than max time for previous bucket, faster than min time for next bucket).
Insert response time histogram
256us	1ms	4ms	16ms	64ms	256ms	1s	4s	16s	gt	max	tag
0.000	99.725	0.219	0.034	0.021	0.002	0.000	0.000	0.000	0.000	0.175	my5651_rel_o2nofp.cz12a_c8r32
0.000	99.702	0.109	0.061	0.127	0.001	0.000	0.000	0.000	0.000	0.165	my5744_rel_o2nofp.cz12a_c8r32
0.000	99.473	0.335	0.058	0.132	0.002	0.000	0.000	0.000	0.000	0.078	my8043_rel_o2nofp.cz12a_c8r32
0.000	99.470	0.337	0.060	0.131	0.002	0.000	0.000	0.000	0.000	0.093	my8406_rel_o2nofp.cz12a_c8r32
0.000	99.452	0.355	0.060	0.131	0.002	0.000	0.000	0.000	0.000	0.078	my9400_rel_o2nofp.cz12a_c8r32
l.x
- l.x: create secondary indexes
- Legend for results is here.
- Each entry lists the percentage of responses that fit in that bucket (slower than max time for previous bucket, faster than min time for next bucket).
TODO - determine whether there is data for create index response time
l.i1
- l.i1: continue load after secondary indexes created with 50 inserts per transaction
- Legend for results is here.
- Each entry lists the percentage of responses that fit in that bucket (slower than max time for previous bucket, faster than min time for next bucket).
Insert response time histogram
256us	1ms	4ms	16ms	64ms	256ms	1s	4s	16s	gt	max	tag
0.000	11.502	86.599	1.727	0.170	0.002	0.000	0.000	0.000	0.000	0.081	my5651_rel_o2nofp.cz12a_c8r32
0.000	13.398	86.007	0.553	0.040	0.001	0.000	0.000	0.000	0.000	0.121	my5744_rel_o2nofp.cz12a_c8r32
0.000	0.000	99.365	0.551	0.082	0.001	nonzero	0.000	0.000	0.000	0.324	my8043_rel_o2nofp.cz12a_c8r32
0.000	0.000	99.369	0.549	0.082	0.001	nonzero	0.000	0.000	0.000	0.349	my8406_rel_o2nofp.cz12a_c8r32
0.000	0.000	99.347	0.568	0.083	0.001	nonzero	0.000	0.000	0.000	0.340	my9400_rel_o2nofp.cz12a_c8r32
Delete response time histogram
256us	1ms	4ms	16ms	64ms	256ms	1s	4s	16s	gt	max	tag
0.000	78.046	20.853	0.968	0.132	0.001	0.000	0.000	0.000	0.000	0.075	my5651_rel_o2nofp.cz12a_c8r32
0.000	67.449	32.380	0.157	0.012	0.001	0.000	0.000	0.000	0.000	0.121	my5744_rel_o2nofp.cz12a_c8r32
0.000	82.946	16.871	0.165	0.018	0.001	nonzero	0.000	0.000	0.000	0.342	my8043_rel_o2nofp.cz12a_c8r32
0.000	81.792	18.040	0.150	0.017	nonzero	nonzero	0.000	0.000	0.000	0.307	my8406_rel_o2nofp.cz12a_c8r32
0.000	85.148	14.665	0.168	0.019	0.001	0.000	0.000	0.000	0.000	0.113	my9400_rel_o2nofp.cz12a_c8r32
l.i2
- l.i2: continue load after secondary indexes created with 5 inserts per transaction
- Legend for results is here.
- Each entry lists the percentage of responses that fit in that bucket (slower than max time for previous bucket, faster than min time for next bucket).
Insert response time histogram
256us	1ms	4ms	16ms	64ms	256ms	1s	4s	16s	gt	max	tag
88.938	10.938	0.017	0.097	0.009	nonzero	0.000	0.000	0.000	0.000	0.074	my5651_rel_o2nofp.cz12a_c8r32
93.362	6.581	0.045	0.011	nonzero	nonzero	0.000	0.000	0.000	0.000	0.114	my5744_rel_o2nofp.cz12a_c8r32
81.662	18.307	0.023	0.007	0.001	nonzero	0.000	0.000	0.000	0.000	0.101	my8043_rel_o2nofp.cz12a_c8r32
81.475	18.495	0.023	0.006	0.001	nonzero	0.000	0.000	0.000	0.000	0.101	my8406_rel_o2nofp.cz12a_c8r32
81.883	18.087	0.022	0.008	0.001	nonzero	0.000	0.000	0.000	0.000	0.117	my9400_rel_o2nofp.cz12a_c8r32
Delete response time histogram
256us	1ms	4ms	16ms	64ms	256ms	1s	4s	16s	gt	max	tag
97.298	2.578	0.017	0.098	0.008	nonzero	0.000	0.000	0.000	0.000	0.074	my5651_rel_o2nofp.cz12a_c8r32
94.273	5.701	0.018	0.009	nonzero	nonzero	0.000	0.000	0.000	0.000	0.114	my5744_rel_o2nofp.cz12a_c8r32
95.401	4.573	0.018	0.006	0.001	nonzero	0.000	0.000	0.000	0.000	0.102	my8043_rel_o2nofp.cz12a_c8r32
94.857	5.119	0.017	0.006	0.001	nonzero	0.000	0.000	0.000	0.000	0.101	my8406_rel_o2nofp.cz12a_c8r32
95.693	4.282	0.018	0.007	nonzero	nonzero	0.000	0.000	0.000	0.000	0.119	my9400_rel_o2nofp.cz12a_c8r32
qr100.L1
- qr100.L1: range queries with 100 insert/s per client
- Legend for results is here.
- Each entry lists the percentage of responses that fit in that bucket (slower than max time for previous bucket, faster than min time for next bucket).
Query response time histogram
256us	1ms	4ms	16ms	64ms	256ms	1s	4s	16s	gt	max	tag
99.963	0.031	0.002	0.005	nonzero	0.000	0.000	0.000	0.000	0.000	0.024	my5651_rel_o2nofp.cz12a_c8r32
99.986	0.013	nonzero	nonzero	0.000	0.000	0.000	0.000	0.000	0.000	0.010	my5744_rel_o2nofp.cz12a_c8r32
99.968	0.032	nonzero	nonzero	0.000	0.000	0.000	0.000	0.000	0.000	0.004	my8043_rel_o2nofp.cz12a_c8r32
99.968	0.032	nonzero	0.000	0.000	0.000	0.000	0.000	0.000	0.000	0.001	my8406_rel_o2nofp.cz12a_c8r32
99.966	0.034	nonzero	nonzero	0.000	0.000	0.000	0.000	0.000	0.000	0.008	my9400_rel_o2nofp.cz12a_c8r32
Insert response time histogram
256us	1ms	4ms	16ms	64ms	256ms	1s	4s	16s	gt	max	tag
0.000	0.333	49.583	44.611	5.444	0.028	0.000	0.000	0.000	0.000	0.070	my5651_rel_o2nofp.cz12a_c8r32
0.000	4.306	95.611	0.083	0.000	0.000	0.000	0.000	0.000	0.000	0.010	my5744_rel_o2nofp.cz12a_c8r32
0.000	0.000	91.111	8.889	0.000	0.000	0.000	0.000	0.000	0.000	0.011	my8043_rel_o2nofp.cz12a_c8r32
0.000	0.000	91.972	8.000	0.028	0.000	0.000	0.000	0.000	0.000	0.050	my8406_rel_o2nofp.cz12a_c8r32
0.000	0.000	80.250	19.500	0.250	0.000	0.000	0.000	0.000	0.000	0.058	my9400_rel_o2nofp.cz12a_c8r32
Delete response time histogram
256us	1ms	4ms	16ms	64ms	256ms	1s	4s	16s	gt	max	tag
0.000	3.194	45.972	47.861	2.972	0.000	0.000	0.000	0.000	0.000	0.064	my5651_rel_o2nofp.cz12a_c8r32
0.000	56.194	43.750	0.056	0.000	0.000	0.000	0.000	0.000	0.000	0.010	my5744_rel_o2nofp.cz12a_c8r32
0.000	32.111	59.222	8.667	0.000	0.000	0.000	0.000	0.000	0.000	0.011	my8043_rel_o2nofp.cz12a_c8r32
0.000	33.944	58.139	7.889	0.028	0.000	0.000	0.000	0.000	0.000	0.056	my8406_rel_o2nofp.cz12a_c8r32
0.000	33.500	46.722	19.694	0.083	0.000	0.000	0.000	0.000	0.000	0.050	my9400_rel_o2nofp.cz12a_c8r32
qp100.L2
- qp100.L2: point queries with 100 insert/s per client
- Legend for results is here.
- Each entry lists the percentage of responses that fit in that bucket (slower than max time for previous bucket, faster than min time for next bucket).
Query response time histogram
256us	1ms	4ms	16ms	64ms	256ms	1s	4s	16s	gt	max	tag
99.961	0.034	0.002	0.004	nonzero	0.000	0.000	0.000	0.000	0.000	0.020	my5651_rel_o2nofp.cz12a_c8r32
99.983	0.017	nonzero	0.000	0.000	0.000	0.000	0.000	0.000	0.000	0.002	my5744_rel_o2nofp.cz12a_c8r32
99.915	0.085	nonzero	0.000	0.000	0.000	0.000	0.000	0.000	0.000	0.001	my8043_rel_o2nofp.cz12a_c8r32
99.904	0.096	nonzero	0.000	0.000	0.000	0.000	0.000	0.000	0.000	0.001	my8406_rel_o2nofp.cz12a_c8r32
99.906	0.094	nonzero	0.000	0.000	0.000	0.000	0.000	0.000	0.000	0.001	my9400_rel_o2nofp.cz12a_c8r32
Insert response time histogram
256us	1ms	4ms	16ms	64ms	256ms	1s	4s	16s	gt	max	tag
0.000	0.056	51.917	44.361	3.667	0.000	0.000	0.000	0.000	0.000	0.061	my5651_rel_o2nofp.cz12a_c8r32
0.000	0.000	100.000	0.000	0.000	0.000	0.000	0.000	0.000	0.000	0.002	my5744_rel_o2nofp.cz12a_c8r32
0.000	0.000	90.500	9.500	0.000	0.000	0.000	0.000	0.000	0.000	0.011	my8043_rel_o2nofp.cz12a_c8r32
0.000	0.000	91.333	8.667	0.000	0.000	0.000	0.000	0.000	0.000	0.011	my8406_rel_o2nofp.cz12a_c8r32
0.000	0.000	91.444	8.528	0.028	0.000	0.000	0.000	0.000	0.000	0.022	my9400_rel_o2nofp.cz12a_c8r32
Delete response time histogram
256us	1ms	4ms	16ms	64ms	256ms	1s	4s	16s	gt	max	tag
0.000	0.889	50.472	47.111	1.528	0.000	0.000	0.000	0.000	0.000	0.053	my5651_rel_o2nofp.cz12a_c8r32
0.000	44.472	55.528	0.000	0.000	0.000	0.000	0.000	0.000	0.000	0.002	my5744_rel_o2nofp.cz12a_c8r32
0.000	4.528	86.000	9.472	0.000	0.000	0.000	0.000	0.000	0.000	0.011	my8043_rel_o2nofp.cz12a_c8r32
0.000	4.972	86.417	8.611	0.000	0.000	0.000	0.000	0.000	0.000	0.011	my8406_rel_o2nofp.cz12a_c8r32
0.000	6.361	85.167	8.444	0.028	0.000	0.000	0.000	0.000	0.000	0.021	my9400_rel_o2nofp.cz12a_c8r32
qr500.L3
- qr500.L3: range queries with 500 insert/s per client
- Legend for results is here.
- Each entry lists the percentage of responses that fit in that bucket (slower than max time for previous bucket, faster than min time for next bucket).
Query response time histogram
256us	1ms	4ms	16ms	64ms	256ms	1s	4s	16s	gt	max	tag
99.968	0.028	0.001	0.002	nonzero	0.000	0.000	0.000	0.000	0.000	0.023	my5651_rel_o2nofp.cz12a_c8r32
99.983	0.017	nonzero	0.000	0.000	0.000	0.000	0.000	0.000	0.000	0.003	my5744_rel_o2nofp.cz12a_c8r32
99.962	0.038	nonzero	0.000	0.000	0.000	0.000	0.000	0.000	0.000	0.003	my8043_rel_o2nofp.cz12a_c8r32
99.959	0.041	nonzero	0.000	0.000	0.000	0.000	0.000	0.000	0.000	0.002	my8406_rel_o2nofp.cz12a_c8r32
99.965	0.035	nonzero	0.000	0.000	0.000	0.000	0.000	0.000	0.000	0.002	my9400_rel_o2nofp.cz12a_c8r32
Insert response time histogram
256us	1ms	4ms	16ms	64ms	256ms	1s	4s	16s	gt	max	tag
0.000	13.272	76.528	9.922	0.278	0.000	0.000	0.000	0.000	0.000	0.059	my5651_rel_o2nofp.cz12a_c8r32
0.000	16.789	83.211	0.000	0.000	0.000	0.000	0.000	0.000	0.000	0.002	my5744_rel_o2nofp.cz12a_c8r32
0.000	0.000	98.122	1.872	0.006	0.000	0.000	0.000	0.000	0.000	0.020	my8043_rel_o2nofp.cz12a_c8r32
0.000	0.000	98.133	1.861	0.006	0.000	0.000	0.000	0.000	0.000	0.021	my8406_rel_o2nofp.cz12a_c8r32
0.000	0.000	99.994	0.006	0.000	0.000	0.000	0.000	0.000	0.000	0.011	my9400_rel_o2nofp.cz12a_c8r32
Delete response time histogram
256us	1ms	4ms	16ms	64ms	256ms	1s	4s	16s	gt	max	tag
0.000	22.856	66.939	9.978	0.228	0.000	0.000	0.000	0.000	0.000	0.046	my5651_rel_o2nofp.cz12a_c8r32
0.000	88.972	11.028	0.000	0.000	0.000	0.000	0.000	0.000	0.000	0.002	my5744_rel_o2nofp.cz12a_c8r32
0.000	74.122	24.000	1.872	0.006	0.000	0.000	0.000	0.000	0.000	0.020	my8043_rel_o2nofp.cz12a_c8r32
0.000	74.561	23.578	1.861	0.000	0.000	0.000	0.000	0.000	0.000	0.011	my8406_rel_o2nofp.cz12a_c8r32
0.000	84.661	15.333	0.006	0.000	0.000	0.000	0.000	0.000	0.000	0.011	my9400_rel_o2nofp.cz12a_c8r32
qp500.L4
- qp500.L4: point queries with 500 insert/s per client
- Legend for results is here.
- Each entry lists the percentage of responses that fit in that bucket (slower than max time for previous bucket, faster than min time for next bucket).
Query response time histogram
256us	1ms	4ms	16ms	64ms	256ms	1s	4s	16s	gt	max	tag
99.954	0.043	0.001	0.002	0.000	0.000	0.000	0.000	0.000	0.000	0.010	my5651_rel_o2nofp.cz12a_c8r32
99.978	0.022	nonzero	0.000	0.000	0.000	0.000	0.000	0.000	0.000	0.002	my5744_rel_o2nofp.cz12a_c8r32
99.889	0.111	nonzero	0.000	0.000	0.000	0.000	0.000	0.000	0.000	0.002	my8043_rel_o2nofp.cz12a_c8r32
99.871	0.128	nonzero	0.000	0.000	0.000	0.000	0.000	0.000	0.000	0.002	my8406_rel_o2nofp.cz12a_c8r32
99.890	0.110	nonzero	0.000	0.000	0.000	0.000	0.000	0.000	0.000	0.002	my9400_rel_o2nofp.cz12a_c8r32
Insert response time histogram
256us	1ms	4ms	16ms	64ms	256ms	1s	4s	16s	gt	max	tag
0.000	13.578	77.222	9.128	0.072	0.000	0.000	0.000	0.000	0.000	0.017	my5651_rel_o2nofp.cz12a_c8r32
0.000	11.572	88.417	0.011	0.000	0.000	0.000	0.000	0.000	0.000	0.010	my5744_rel_o2nofp.cz12a_c8r32
0.000	0.000	98.067	1.933	0.000	0.000	0.000	0.000	0.000	0.000	0.011	my8043_rel_o2nofp.cz12a_c8r32
0.000	0.000	98.128	1.872	0.000	0.000	0.000	0.000	0.000	0.000	0.011	my8406_rel_o2nofp.cz12a_c8r32
0.000	0.000	98.111	1.883	0.006	0.000	0.000	0.000	0.000	0.000	0.020	my9400_rel_o2nofp.cz12a_c8r32
Delete response time histogram
256us	1ms	4ms	16ms	64ms	256ms	1s	4s	16s	gt	max	tag
0.000	22.189	68.578	9.211	0.022	0.000	0.000	0.000	0.000	0.000	0.017	my5651_rel_o2nofp.cz12a_c8r32
0.000	87.617	12.378	0.006	0.000	0.000	0.000	0.000	0.000	0.000	0.010	my5744_rel_o2nofp.cz12a_c8r32
0.000	49.067	49.006	1.928	0.000	0.000	0.000	0.000	0.000	0.000	0.011	my8043_rel_o2nofp.cz12a_c8r32
0.000	51.717	46.411	1.872	0.000	0.000	0.000	0.000	0.000	0.000	0.011	my8406_rel_o2nofp.cz12a_c8r32
0.000	53.517	44.600	1.878	0.006	0.000	0.000	0.000	0.000	0.000	0.020	my9400_rel_o2nofp.cz12a_c8r32
qr1000.L5
- qr1000.L5: range queries with 1000 insert/s per client
- Legend for results is here.
- Each entry lists the percentage of responses that fit in that bucket (slower than max time for previous bucket, faster than min time for next bucket).
Query response time histogram
256us	1ms	4ms	16ms	64ms	256ms	1s	4s	16s	gt	max	tag
99.960	0.035	0.002	0.003	nonzero	0.000	0.000	0.000	0.000	0.000	0.019	my5651_rel_o2nofp.cz12a_c8r32
99.979	0.021	nonzero	nonzero	0.000	0.000	0.000	0.000	0.000	0.000	0.007	my5744_rel_o2nofp.cz12a_c8r32
99.957	0.043	nonzero	0.000	0.000	0.000	0.000	0.000	0.000	0.000	0.002	my8043_rel_o2nofp.cz12a_c8r32
99.954	0.046	nonzero	0.000	0.000	0.000	0.000	0.000	0.000	0.000	0.002	my8406_rel_o2nofp.cz12a_c8r32
99.957	0.043	nonzero	0.000	0.000	0.000	0.000	0.000	0.000	0.000	0.002	my9400_rel_o2nofp.cz12a_c8r32
Insert response time histogram
256us	1ms	4ms	16ms	64ms	256ms	1s	4s	16s	gt	max	tag
0.000	16.350	76.606	6.775	0.269	0.000	0.000	0.000	0.000	0.000	0.047	my5651_rel_o2nofp.cz12a_c8r32
0.000	31.669	68.331	0.000	0.000	0.000	0.000	0.000	0.000	0.000	0.003	my5744_rel_o2nofp.cz12a_c8r32
0.000	0.000	99.081	0.917	0.003	0.000	0.000	0.000	0.000	0.000	0.020	my8043_rel_o2nofp.cz12a_c8r32
0.000	0.000	99.986	0.011	0.003	0.000	0.000	0.000	0.000	0.000	0.041	my8406_rel_o2nofp.cz12a_c8r32
0.000	0.000	99.139	0.856	0.006	0.000	0.000	0.000	0.000	0.000	0.045	my9400_rel_o2nofp.cz12a_c8r32
Delete response time histogram
256us	1ms	4ms	16ms	64ms	256ms	1s	4s	16s	gt	max	tag
0.000	29.597	63.597	6.600	0.206	0.000	0.000	0.000	0.000	0.000	0.042	my5651_rel_o2nofp.cz12a_c8r32
0.000	93.406	6.594	0.000	0.000	0.000	0.000	0.000	0.000	0.000	0.002	my5744_rel_o2nofp.cz12a_c8r32
0.000	84.672	14.411	0.914	0.003	0.000	0.000	0.000	0.000	0.000	0.020	my8043_rel_o2nofp.cz12a_c8r32
0.000	74.100	25.894	0.003	0.003	0.000	0.000	0.000	0.000	0.000	0.034	my8406_rel_o2nofp.cz12a_c8r32
0.000	85.283	13.858	0.856	0.003	0.000	0.000	0.000	0.000	0.000	0.051	my9400_rel_o2nofp.cz12a_c8r32
qp1000.L6
- qp1000.L6: point queries with 1000 insert/s per client
- Legend for results is here.
- Each entry lists the percentage of responses that fit in that bucket (slower than max time for previous bucket, faster than min time for next bucket).
Query response time histogram
256us	1ms	4ms	16ms	64ms	256ms	1s	4s	16s	gt	max	tag
99.940	0.057	0.001	0.002	0.000	0.000	0.000	0.000	0.000	0.000	0.010	my5651_rel_o2nofp.cz12a_c8r32
99.972	0.028	nonzero	0.000	0.000	0.000	0.000	0.000	0.000	0.000	0.002	my5744_rel_o2nofp.cz12a_c8r32
99.878	0.122	nonzero	0.000	0.000	0.000	0.000	0.000	0.000	0.000	0.002	my8043_rel_o2nofp.cz12a_c8r32
99.857	0.143	nonzero	0.000	0.000	0.000	0.000	0.000	0.000	0.000	0.002	my8406_rel_o2nofp.cz12a_c8r32
99.871	0.129	nonzero	0.000	0.000	0.000	0.000	0.000	0.000	0.000	0.002	my9400_rel_o2nofp.cz12a_c8r32
Insert response time histogram
256us	1ms	4ms	16ms	64ms	256ms	1s	4s	16s	gt	max	tag
0.000	18.350	76.914	4.708	0.028	0.000	0.000	0.000	0.000	0.000	0.018	my5651_rel_o2nofp.cz12a_c8r32
0.000	25.844	74.147	0.008	0.000	0.000	0.000	0.000	0.000	0.000	0.011	my5744_rel_o2nofp.cz12a_c8r32
0.000	0.000	99.044	0.953	0.003	0.000	0.000	0.000	0.000	0.000	0.021	my8043_rel_o2nofp.cz12a_c8r32
0.000	0.000	99.992	0.006	0.003	0.000	0.000	0.000	0.000	0.000	0.043	my8406_rel_o2nofp.cz12a_c8r32
0.000	0.000	99.092	0.903	0.006	0.000	0.000	0.000	0.000	0.000	0.048	my9400_rel_o2nofp.cz12a_c8r32
Delete response time histogram
256us	1ms	4ms	16ms	64ms	256ms	1s	4s	16s	gt	max	tag
0.000	33.242	62.036	4.706	0.017	0.000	0.000	0.000	0.000	0.000	0.017	my5651_rel_o2nofp.cz12a_c8r32
0.000	92.519	7.475	0.006	0.000	0.000	0.000	0.000	0.000	0.000	0.010	my5744_rel_o2nofp.cz12a_c8r32
0.000	70.839	28.206	0.953	0.003	0.000	0.000	0.000	0.000	0.000	0.020	my8043_rel_o2nofp.cz12a_c8r32
0.000	69.614	30.381	0.003	0.003	0.000	0.000	0.000	0.000	0.000	0.049	my8406_rel_o2nofp.cz12a_c8r32
0.000	72.183	26.958	0.853	0.006	0.000	0.000	0.000	0.000	0.000	0.055	my9400_rel_o2nofp.cz12a_c8r32