Introduction
This is a report for the insert benchmark with 50M docs and 1 client(s). It is generated by scripts (bash, awk, sed) and Tufte might not be impressed. An overview of the insert benchmark is here and a short update is here. Below, by DBMS, I mean DBMS+version.config. An example is my8020.c10b40 where my means MySQL, 8020 is version 8.0.20 and c10b40 is the name for the configuration file.
The test server has 48 AMD cores, 128G RAM and RAID 10 with 2 NVMe devices. It is described here. The benchmark was run with 1 client and there were 1 or 3 connections per client (1 for queries or inserts without rate limits, 1+1 for rate limited inserts+deletes). It uses 1 table with a table per client. It loads 50M rows per table without secondary indexes, creates 3 secondary indexes per table, then inserts 160m+40m rows per table with a delete per insert to avoid growing the table. It then does 6 read+write tests for 1800s each that do queries as fast as possible with 100,100,500,500,1000,1000 inserts/s and the same for deletes/s per client concurrent with the queries. The database is cached by Postgres. Clients and the DBMS share one server. The per-database configs are in the per-database subdirectories here.
The tested DBMS are:
- pg174_o2nofp.cx10a_c32r128 - Postgres 17.4 with the cx10a_c32r128 config
- pg175_o2nofp.cx10a_c32r128 - Postgres 17.5 with the cx10a_c32r128 config
- pg18beta1_o2nofp.cx10b_c32r128 - Postgres 18 beta1 with the cx10b_c32r128 config that uses io_method='sync'
- pg18beta1_o2nofp.cx10cw4_c32r128 - Postgres 18 beta1 with the cx10cw4_c32r128 config that uses io_method='worker' and io_workers=4
- pg18beta1_o2nofp.cx10d_c32r128 - Postgres 18 beta1 with the cx10d_c32r128 config that uses io_method='io_uring'
- pg18beta2_o2nofp.cx10b_c32r128 - Postgres 18 beta1 with the cx10b_c32r128 config that uses io_method='sync'
- pg18beta2_o2nofp.cx10cw4_c32r128 - Postgres 18 beta2 with the cx10cw4_c32r128 config that uses io_method='worker' and io_workers=4
- pg18beta2_o2nofp.cx10d_c32r128 - Postgres 18 beta1 with the cx10d_c32r128 config that uses io_method='io_uring'
Contents
- Summary
- l.i0: load without secondary indexes
- l.x: create secondary indexes
- l.i1: continue load after secondary indexes created with 50 inserts per transaction
- l.i2: continue load after secondary indexes created with 5 inserts per transaction
- qr100.L1: range queries with 100 insert/s per client
- qp100.L2: point queries with 100 insert/s per client
- qr500.L3: range queries with 500 insert/s per client
- qp500.L4: point queries with 500 insert/s per client
- qr1000.L5: range queries with 1000 insert/s per client
- qp1000.L6: point queries with 1000 insert/s per client
Summary
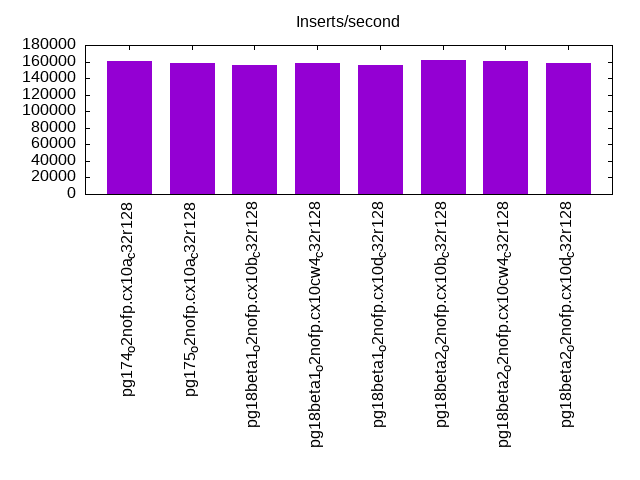
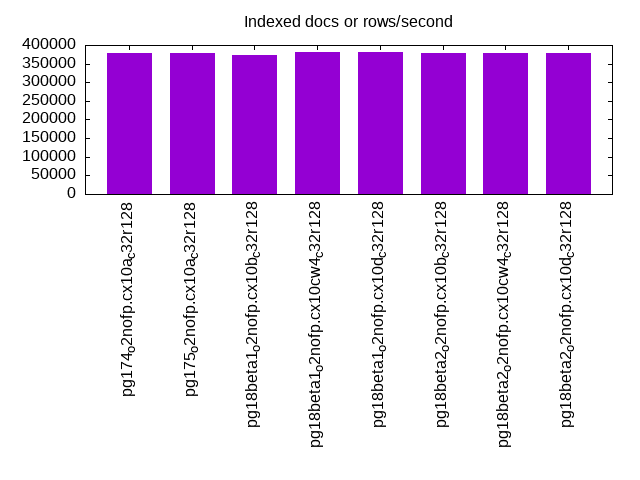
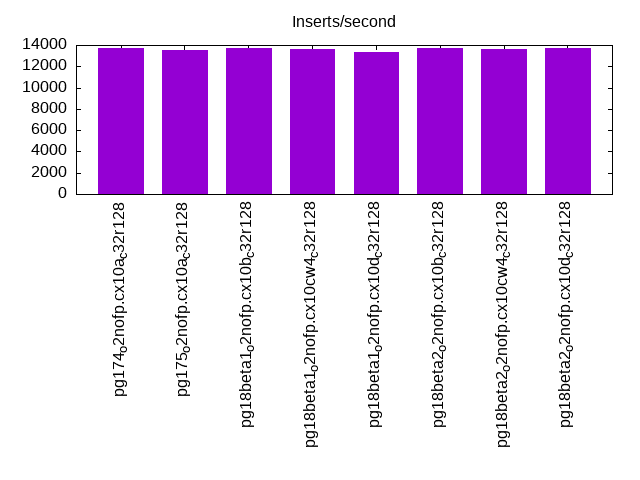
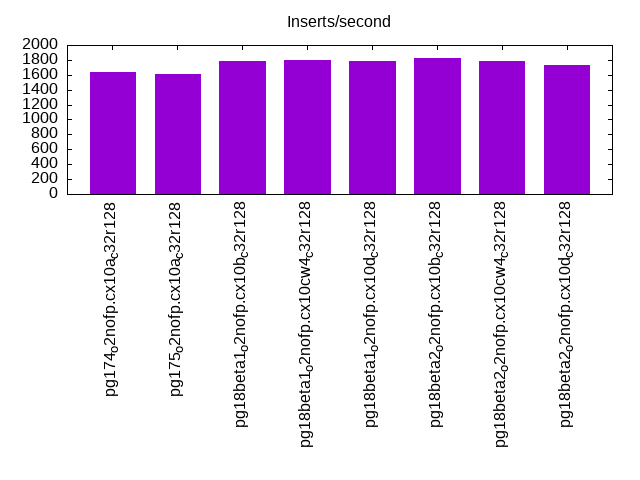
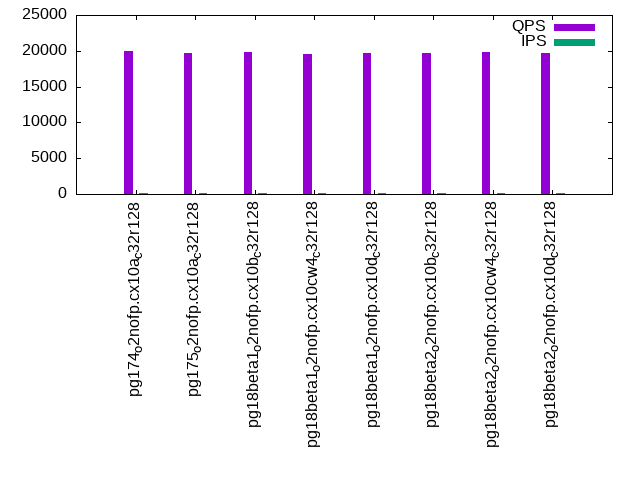
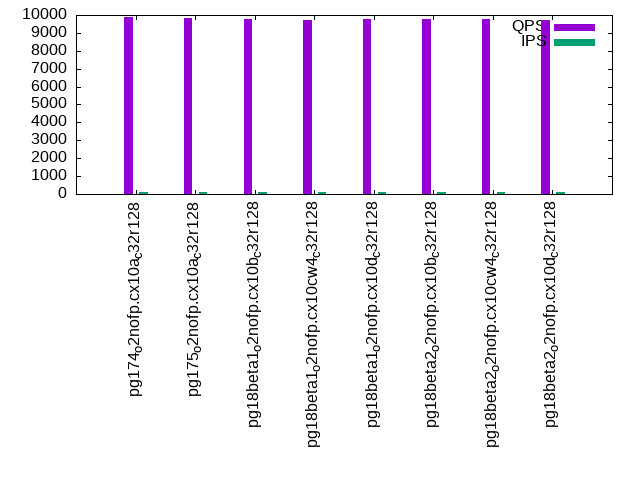
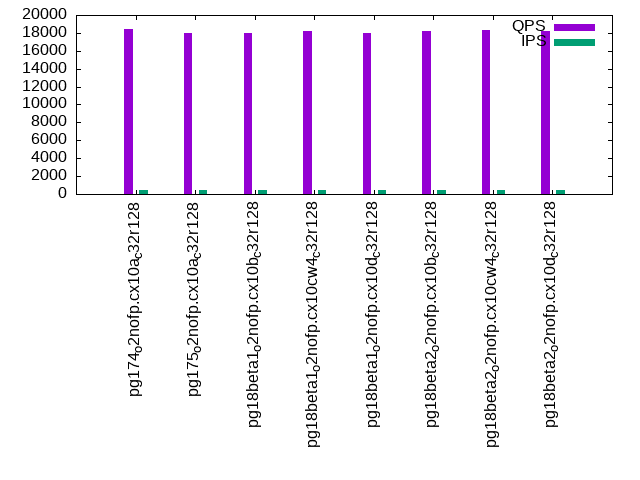
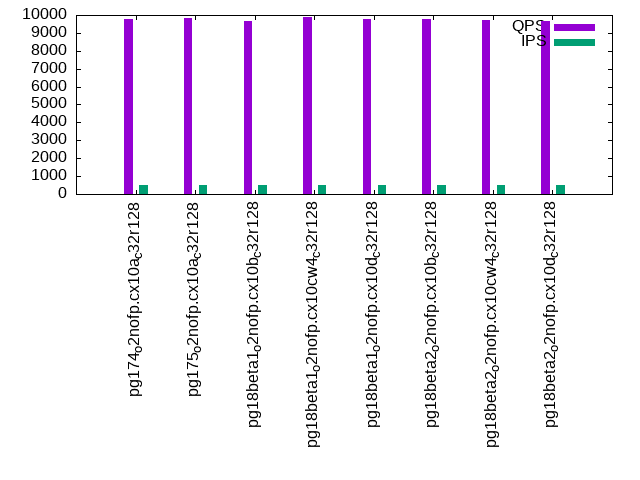
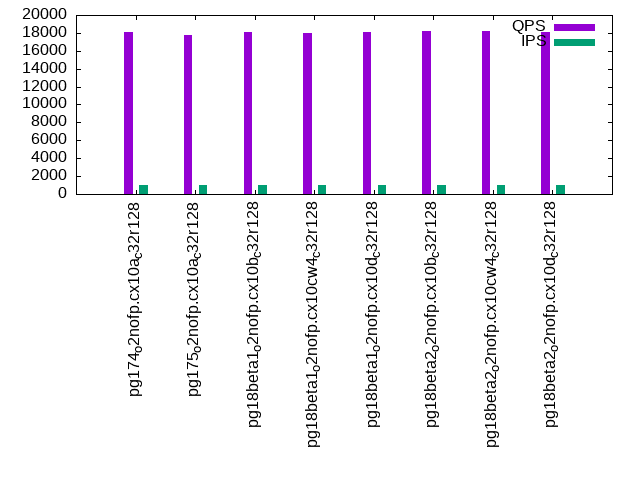
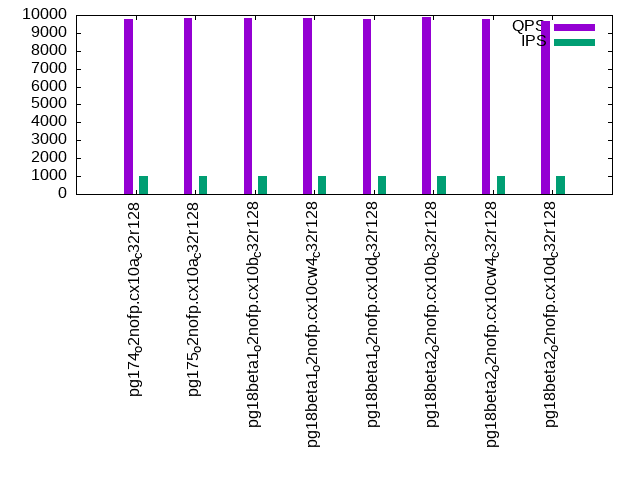
The numbers are inserts/s for l.i0, l.i1 and l.i2, indexed docs (or rows) /s for l.x and queries/s for qr100, qp100 thru qr1000, qp1000" The values are the average rate over the entire test for inserts (IPS) and queries (QPS). The range of values for IPS and QPS is split into 3 parts: bottom 25%, middle 50%, top 25%. Values in the bottom 25% have a red background, values in the top 25% have a green background and values in the middle have no color. A gray background is used for values that can be ignored because the DBMS did not sustain the target insert rate. Red backgrounds are not used when the minimum value is within 80% of the max value.
| dbms | l.i0 | l.x | l.i1 | l.i2 | qr100 | qp100 | qr500 | qp500 | qr1000 | qp1000 |
|---|---|---|---|---|---|---|---|---|---|---|
| pg174_o2nofp.cx10a_c32r128 | 160256 | 378789 | 13704 | 1636 | 20020 | 9862 | 18464 | 9800 | 18108 | 9762 |
| pg175_o2nofp.cx10a_c32r128 | 158228 | 378789 | 13560 | 1611 | 19666 | 9856 | 17955 | 9849 | 17744 | 9846 |
| pg18beta1_o2nofp.cx10b_c32r128 | 156250 | 373135 | 13735 | 1791 | 19772 | 9782 | 18009 | 9668 | 18064 | 9854 |
| pg18beta1_o2nofp.cx10cw4_c32r128 | 158730 | 381680 | 13619 | 1798 | 19557 | 9739 | 18168 | 9872 | 18033 | 9842 |
| pg18beta1_o2nofp.cx10d_c32r128 | 155763 | 381680 | 13336 | 1781 | 19655 | 9764 | 17943 | 9796 | 18048 | 9785 |
| pg18beta2_o2nofp.cx10b_c32r128 | 161290 | 378789 | 13752 | 1831 | 19699 | 9792 | 18204 | 9771 | 18258 | 9870 |
| pg18beta2_o2nofp.cx10cw4_c32r128 | 160772 | 378789 | 13587 | 1784 | 19852 | 9804 | 18269 | 9725 | 18163 | 9762 |
| pg18beta2_o2nofp.cx10d_c32r128 | 158730 | 378789 | 13736 | 1731 | 19751 | 9733 | 18257 | 9682 | 18132 | 9669 |
This table has relative throughput, throughput for the DBMS relative to the DBMS in the first line, using the absolute throughput from the previous table. Values less than 0.95 have a yellow background. Values greater than 1.05 have a blue background.
| dbms | l.i0 | l.x | l.i1 | l.i2 | qr100 | qp100 | qr500 | qp500 | qr1000 | qp1000 |
|---|---|---|---|---|---|---|---|---|---|---|
| pg174_o2nofp.cx10a_c32r128 | 1.00 | 1.00 | 1.00 | 1.00 | 1.00 | 1.00 | 1.00 | 1.00 | 1.00 | 1.00 |
| pg175_o2nofp.cx10a_c32r128 | 0.99 | 1.00 | 0.99 | 0.98 | 0.98 | 1.00 | 0.97 | 1.00 | 0.98 | 1.01 |
| pg18beta1_o2nofp.cx10b_c32r128 | 0.98 | 0.99 | 1.00 | 1.09 | 0.99 | 0.99 | 0.98 | 0.99 | 1.00 | 1.01 |
| pg18beta1_o2nofp.cx10cw4_c32r128 | 0.99 | 1.01 | 0.99 | 1.10 | 0.98 | 0.99 | 0.98 | 1.01 | 1.00 | 1.01 |
| pg18beta1_o2nofp.cx10d_c32r128 | 0.97 | 1.01 | 0.97 | 1.09 | 0.98 | 0.99 | 0.97 | 1.00 | 1.00 | 1.00 |
| pg18beta2_o2nofp.cx10b_c32r128 | 1.01 | 1.00 | 1.00 | 1.12 | 0.98 | 0.99 | 0.99 | 1.00 | 1.01 | 1.01 |
| pg18beta2_o2nofp.cx10cw4_c32r128 | 1.00 | 1.00 | 0.99 | 1.09 | 0.99 | 0.99 | 0.99 | 0.99 | 1.00 | 1.00 |
| pg18beta2_o2nofp.cx10d_c32r128 | 0.99 | 1.00 | 1.00 | 1.06 | 0.99 | 0.99 | 0.99 | 0.99 | 1.00 | 0.99 |
This lists the average rate of inserts/s for the tests that do inserts concurrent with queries. For such tests the query rate is listed in the table above. The read+write tests are setup so that the insert rate should match the target rate every second. Cells that are not at least 95% of the target have a red background to indicate a failure to satisfy the target.
| dbms | qr100.L1 | qp100.L2 | qr500.L3 | qp500.L4 | qr1000.L5 | qp1000.L6 |
|---|---|---|---|---|---|---|
| pg174_o2nofp.cx10a_c32r128 | 100 | 100 | 499 | 499 | 998 | 999 |
| pg175_o2nofp.cx10a_c32r128 | 100 | 100 | 499 | 499 | 999 | 999 |
| pg18beta1_o2nofp.cx10b_c32r128 | 100 | 100 | 499 | 499 | 999 | 999 |
| pg18beta1_o2nofp.cx10cw4_c32r128 | 100 | 100 | 499 | 499 | 999 | 999 |
| pg18beta1_o2nofp.cx10d_c32r128 | 100 | 100 | 499 | 499 | 998 | 999 |
| pg18beta2_o2nofp.cx10b_c32r128 | 100 | 100 | 499 | 499 | 999 | 999 |
| pg18beta2_o2nofp.cx10cw4_c32r128 | 100 | 100 | 499 | 499 | 998 | 998 |
| pg18beta2_o2nofp.cx10d_c32r128 | 100 | 100 | 499 | 499 | 998 | 999 |
| target | 100 | 100 | 500 | 500 | 1000 | 1000 |
l.i0
l.i0: load without secondary indexes. Graphs for performance per 1-second interval are here.
Average throughput:
Insert response time histogram: each cell has the percentage of responses that take <= the time in the header and max is the max response time in seconds. For the max column values in the top 25% of the range have a red background and in the bottom 25% of the range have a green background. The red background is not used when the min value is within 80% of the max value.
| dbms | 256us | 1ms | 4ms | 16ms | 64ms | 256ms | 1s | 4s | 16s | gt | max |
|---|---|---|---|---|---|---|---|---|---|---|---|
| pg174_o2nofp.cx10a_c32r128 | 99.999 | nonzero | 0.001 | nonzero | 0.017 | ||||||
| pg175_o2nofp.cx10a_c32r128 | 99.999 | 0.001 | nonzero | nonzero | 0.019 | ||||||
| pg18beta1_o2nofp.cx10b_c32r128 | 99.998 | 0.001 | 0.001 | 0.008 | |||||||
| pg18beta1_o2nofp.cx10cw4_c32r128 | 99.998 | 0.001 | nonzero | nonzero | 0.022 | ||||||
| pg18beta1_o2nofp.cx10d_c32r128 | 99.998 | 0.001 | nonzero | 0.015 | |||||||
| pg18beta2_o2nofp.cx10b_c32r128 | 99.999 | 0.001 | 0.001 | 0.008 | |||||||
| pg18beta2_o2nofp.cx10cw4_c32r128 | 99.999 | nonzero | 0.001 | nonzero | 0.016 | ||||||
| pg18beta2_o2nofp.cx10d_c32r128 | 99.999 | 0.001 | 0.001 | 0.014 |
Performance metrics for the DBMS listed above. Some are normalized by throughput, others are not. Legend for results is here.
ips	qps	rps	rmbps	wps	wmbps	rpq	rkbpq	wpi	wkbpi	csps	cpups	cspq	cpupq	dbgb1	dbgb2	rss	maxop	p50	p99	tag
160256	0	0	0.0	619.8	68.0	0.000	0.000	0.004	0.434	17353	3.5	0.108	10	4.8	13.0	0.5	0.017	161115	158422	pg174_o2nofp.cx10a_c32r128
158228	0	0	0.0	622.8	68.4	0.000	0.000	0.004	0.443	16911	3.9	0.107	12	4.8	13.0	0.5	0.019	159909	156878	pg175_o2nofp.cx10a_c32r128
156250	0	0	0.0	595.9	66.3	0.000	0.000	0.004	0.434	16624	3.2	0.106	10	4.8	13.0	4.7	0.008	156322	155027	pg18beta1_o2nofp.cx10b_c32r128
158730	0	0	0.0	606.2	67.6	0.000	0.000	0.004	0.436	17148	3.3	0.108	10	4.8	13.0	0.5	0.022	159515	156318	pg18beta1_o2nofp.cx10cw4_c32r128
155763	0	0	0.0	605.0	67.3	0.000	0.000	0.004	0.442	16547	3.1	0.106	10	4.8	13.0	0.5	0.015	156122	154919	pg18beta1_o2nofp.cx10d_c32r128
161290	0	0	0.0	614.1	68.5	0.000	0.000	0.004	0.435	17352	3.5	0.108	10	4.8	13.0	4.8	0.008	161512	160615	pg18beta2_o2nofp.cx10b_c32r128
160772	0	0	0.0	617.4	68.4	0.000	0.000	0.004	0.436	17320	3.4	0.108	10	4.8	13.0	0.5	0.016	161510	160412	pg18beta2_o2nofp.cx10cw4_c32r128
158730	0	0	0.0	607.8	67.6	0.000	0.000	0.004	0.436	17080	3.4	0.108	10	4.8	13.0	0.5	0.014	158920	157616	pg18beta2_o2nofp.cx10d_c32r128
l.x
l.x: create secondary indexes.
Average throughput:
Performance metrics for the DBMS listed above. Some are normalized by throughput, others are not. Legend for results is here.
ips	qps	rps	rmbps	wps	wmbps	rpq	rkbpq	wpi	wkbpi	csps	cpups	cspq	cpupq	dbgb1	dbgb2	rss	maxop	p50	p99	tag
378789	0	0	0.0	957.9	113.9	0.000	0.000	0.003	0.308	1884	2.5	0.005	3	9.6	22.2	5.1	0.002	NA	NA	pg174_o2nofp.cx10a_c32r128
378789	0	0	0.0	947.2	112.4	0.000	0.000	0.003	0.304	1875	2.5	0.005	3	9.6	22.1	5.1	0.002	NA	NA	pg175_o2nofp.cx10a_c32r128
373135	0	0	0.0	914.4	109.9	0.000	0.000	0.002	0.302	1714	2.4	0.005	3	9.6	22.2	5.1	0.002	NA	NA	pg18beta1_o2nofp.cx10b_c32r128
381680	0	6	0.0	1057.5	115.5	0.000	0.000	0.003	0.310	2287	2.6	0.006	3	9.6	22.2	5.1	0.002	NA	NA	pg18beta1_o2nofp.cx10cw4_c32r128
381680	0	0	0.0	953.6	114.3	0.000	0.000	0.002	0.307	1914	2.3	0.005	3	9.6	22.1	5.1	0.002	NA	NA	pg18beta1_o2nofp.cx10d_c32r128
378789	0	0	0.0	963.0	115.5	0.000	0.000	0.003	0.312	1854	2.4	0.005	3	9.6	22.2	5.1	0.002	NA	NA	pg18beta2_o2nofp.cx10b_c32r128
378789	0	0	0.0	970.1	115.8	0.000	0.000	0.003	0.313	1906	2.4	0.005	3	9.6	22.2	5.1	0.002	NA	NA	pg18beta2_o2nofp.cx10cw4_c32r128
378789	0	0	0.0	949.0	113.6	0.000	0.000	0.003	0.307	1873	2.4	0.005	3	9.6	22.2	5.1	0.002	NA	NA	pg18beta2_o2nofp.cx10d_c32r128
l.i1
l.i1: continue load after secondary indexes created with 50 inserts per transaction. Graphs for performance per 1-second interval are here.
Average throughput:
Insert response time histogram: each cell has the percentage of responses that take <= the time in the header and max is the max response time in seconds. For the max column values in the top 25% of the range have a red background and in the bottom 25% of the range have a green background. The red background is not used when the min value is within 80% of the max value.
| dbms | 256us | 1ms | 4ms | 16ms | 64ms | 256ms | 1s | 4s | 16s | gt | max |
|---|---|---|---|---|---|---|---|---|---|---|---|
| pg174_o2nofp.cx10a_c32r128 | 34.470 | 65.529 | 0.001 | nonzero | 0.083 | ||||||
| pg175_o2nofp.cx10a_c32r128 | 34.471 | 65.528 | 0.001 | nonzero | 0.023 | ||||||
| pg18beta1_o2nofp.cx10b_c32r128 | 29.032 | 70.968 | 0.001 | nonzero | nonzero | 0.082 | |||||
| pg18beta1_o2nofp.cx10cw4_c32r128 | 32.016 | 67.983 | 0.001 | nonzero | 0.085 | ||||||
| pg18beta1_o2nofp.cx10d_c32r128 | 33.942 | 66.057 | 0.001 | nonzero | 0.093 | ||||||
| pg18beta2_o2nofp.cx10b_c32r128 | 36.586 | 63.413 | 0.001 | 0.015 | |||||||
| pg18beta2_o2nofp.cx10cw4_c32r128 | 36.697 | 63.302 | 0.001 | nonzero | 0.089 | ||||||
| pg18beta2_o2nofp.cx10d_c32r128 | 36.017 | 63.982 | 0.001 | 0.015 |
Delete response time histogram: each cell has the percentage of responses that take <= the time in the header and max is the max response time in seconds. For the max column values in the top 25% of the range have a red background and in the bottom 25% of the range have a green background. The red background is not used when the min value is within 80% of the max value.
| dbms | 256us | 1ms | 4ms | 16ms | 64ms | 256ms | 1s | 4s | 16s | gt | max |
|---|---|---|---|---|---|---|---|---|---|---|---|
| pg174_o2nofp.cx10a_c32r128 | 11.980 | 39.286 | 48.734 | nonzero | nonzero | 0.084 | |||||
| pg175_o2nofp.cx10a_c32r128 | 12.036 | 39.610 | 48.354 | nonzero | 0.024 | ||||||
| pg18beta1_o2nofp.cx10b_c32r128 | 11.511 | 40.447 | 48.042 | nonzero | nonzero | 0.084 | |||||
| pg18beta1_o2nofp.cx10cw4_c32r128 | 11.659 | 40.027 | 48.314 | nonzero | nonzero | 0.086 | |||||
| pg18beta1_o2nofp.cx10d_c32r128 | 11.284 | 44.811 | 43.905 | nonzero | nonzero | 0.094 | |||||
| pg18beta2_o2nofp.cx10b_c32r128 | 11.949 | 38.323 | 49.728 | nonzero | 0.021 | ||||||
| pg18beta2_o2nofp.cx10cw4_c32r128 | 11.883 | 44.497 | 43.620 | nonzero | 0.091 | ||||||
| pg18beta2_o2nofp.cx10d_c32r128 | 11.979 | 38.383 | 49.638 | nonzero | 0.021 |
Performance metrics for the DBMS listed above. Some are normalized by throughput, others are not. Legend for results is here.
ips	qps	rps	rmbps	wps	wmbps	rpq	rkbpq	wpi	wkbpi	csps	cpups	cspq	cpupq	dbgb1	dbgb2	rss	maxop	p50	p99	tag
13704	0	0	0.0	182.7	17.3	0.000	0.000	0.013	1.290	6249	3.0	0.456	105	13.6	51.1	1.1	0.083	10138	6093	pg174_o2nofp.cx10a_c32r128
13560	0	0	0.0	182.6	17.1	0.000	0.000	0.013	1.292	6209	3.0	0.458	106	13.6	50.8	12.3	0.023	9989	5544	pg175_o2nofp.cx10a_c32r128
13735	0	0	0.0	177.4	17.3	0.000	0.000	0.013	1.292	6234	3.0	0.454	105	13.6	51.6	13.2	0.082	10788	7342	pg18beta1_o2nofp.cx10b_c32r128
13619	0	1	0.0	177.3	17.2	0.000	0.001	0.013	1.294	6207	3.0	0.456	106	13.6	51.0	1.7	0.085	10388	6043	pg18beta1_o2nofp.cx10cw4_c32r128
13336	0	0	0.0	174.5	16.8	0.000	0.000	0.013	1.288	6065	2.9	0.455	104	13.6	50.0	13.7	0.093	10240	4095	pg18beta1_o2nofp.cx10d_c32r128
13752	0	0	0.0	175.0	17.3	0.000	0.000	0.013	1.291	6229	3.0	0.453	105	13.6	51.9	1.5	0.015	9889	6842	pg18beta2_o2nofp.cx10b_c32r128
13587	0	0	0.0	173.9	17.0	0.000	0.000	0.013	1.283	6171	2.9	0.454	102	13.6	50.3	1.4	0.089	10288	4295	pg18beta2_o2nofp.cx10cw4_c32r128
13736	0	0	0.0	176.5	17.4	0.000	0.000	0.013	1.296	6240	3.0	0.454	105	13.6	51.9	1.7	0.015	9939	6093	pg18beta2_o2nofp.cx10d_c32r128
l.i2
l.i2: continue load after secondary indexes created with 5 inserts per transaction. Graphs for performance per 1-second interval are here.
Average throughput:
Insert response time histogram: each cell has the percentage of responses that take <= the time in the header and max is the max response time in seconds. For the max column values in the top 25% of the range have a red background and in the bottom 25% of the range have a green background. The red background is not used when the min value is within 80% of the max value.
| dbms | 256us | 1ms | 4ms | 16ms | 64ms | 256ms | 1s | 4s | 16s | gt | max |
|---|---|---|---|---|---|---|---|---|---|---|---|
| pg174_o2nofp.cx10a_c32r128 | 32.101 | 67.899 | nonzero | nonzero | 0.081 | ||||||
| pg175_o2nofp.cx10a_c32r128 | 30.741 | 69.259 | nonzero | nonzero | 0.087 | ||||||
| pg18beta1_o2nofp.cx10b_c32r128 | 40.482 | 59.518 | nonzero | nonzero | 0.088 | ||||||
| pg18beta1_o2nofp.cx10cw4_c32r128 | 42.450 | 57.550 | nonzero | 0.002 | |||||||
| pg18beta1_o2nofp.cx10d_c32r128 | 39.608 | 60.391 | nonzero | nonzero | 0.099 | ||||||
| pg18beta2_o2nofp.cx10b_c32r128 | 44.402 | 55.598 | nonzero | nonzero | 0.096 | ||||||
| pg18beta2_o2nofp.cx10cw4_c32r128 | 42.550 | 57.450 | nonzero | nonzero | 0.101 | ||||||
| pg18beta2_o2nofp.cx10d_c32r128 | 40.420 | 59.580 | nonzero | nonzero | 0.100 |
Delete response time histogram: each cell has the percentage of responses that take <= the time in the header and max is the max response time in seconds. For the max column values in the top 25% of the range have a red background and in the bottom 25% of the range have a green background. The red background is not used when the min value is within 80% of the max value.
| dbms | 256us | 1ms | 4ms | 16ms | 64ms | 256ms | 1s | 4s | 16s | gt | max |
|---|---|---|---|---|---|---|---|---|---|---|---|
| pg174_o2nofp.cx10a_c32r128 | 0.972 | 9.473 | 61.597 | 27.958 | nonzero | nonzero | 0.081 | ||||
| pg175_o2nofp.cx10a_c32r128 | 0.882 | 10.625 | 59.694 | 28.799 | nonzero | nonzero | 0.088 | ||||
| pg18beta1_o2nofp.cx10b_c32r128 | 0.788 | 17.876 | 58.204 | 23.131 | nonzero | nonzero | 0.089 | ||||
| pg18beta1_o2nofp.cx10cw4_c32r128 | 0.762 | 18.182 | 58.252 | 22.803 | nonzero | 0.029 | |||||
| pg18beta1_o2nofp.cx10d_c32r128 | 0.725 | 17.746 | 59.467 | 22.062 | nonzero | 0.100 | |||||
| pg18beta2_o2nofp.cx10b_c32r128 | 0.826 | 18.386 | 58.807 | 21.982 | nonzero | nonzero | 0.096 | ||||
| pg18beta2_o2nofp.cx10cw4_c32r128 | 0.806 | 17.837 | 58.926 | 22.431 | nonzero | nonzero | 0.102 | ||||
| pg18beta2_o2nofp.cx10d_c32r128 | 0.797 | 17.722 | 54.007 | 27.474 | nonzero | nonzero | 0.101 |
Performance metrics for the DBMS listed above. Some are normalized by throughput, others are not. Legend for results is here.
ips	qps	rps	rmbps	wps	wmbps	rpq	rkbpq	wpi	wkbpi	csps	cpups	cspq	cpupq	dbgb1	dbgb2	rss	maxop	p50	p99	tag
1636	0	0	0.0	93.1	6.1	0.000	0.000	0.057	3.818	7189	1.9	4.395	558	13.7	51.2	11.4	0.081	1294	809	pg174_o2nofp.cx10a_c32r128
1611	0	0	0.0	90.7	6.1	0.000	0.000	0.056	3.849	7090	1.9	4.400	566	13.7	50.9	2.1	0.087	1283	789	pg175_o2nofp.cx10a_c32r128
1791	0	0	0.0	86.1	6.1	0.000	0.000	0.048	3.508	7745	2.0	4.325	536	13.6	51.6	11.5	0.088	1328	584	pg18beta1_o2nofp.cx10b_c32r128
1798	0	0	0.0	87.3	6.2	0.000	0.000	0.049	3.543	7801	2.0	4.337	534	13.7	51.1	11.3	0.002	1333	579	pg18beta1_o2nofp.cx10cw4_c32r128
1781	0	0	0.0	83.6	6.2	0.000	0.000	0.047	3.583	7719	2.0	4.334	539	13.7	50.1	13.6	0.099	1348	574	pg18beta1_o2nofp.cx10d_c32r128
1831	0	0	0.0	86.0	6.2	0.000	0.000	0.047	3.467	7949	2.0	4.341	524	13.6	52.0	13.8	0.096	1343	579	pg18beta2_o2nofp.cx10b_c32r128
1784	0	0	0.0	86.2	6.2	0.000	0.000	0.048	3.555	7744	2.0	4.342	538	13.6	50.4	13.5	0.101	1334	554	pg18beta2_o2nofp.cx10cw4_c32r128
1731	0	0	0.0	86.9	6.1	0.000	0.000	0.050	3.596	7518	2.0	4.343	555	13.6	52.0	6.2	0.100	1249	599	pg18beta2_o2nofp.cx10d_c32r128
qr100.L1
qr100.L1: range queries with 100 insert/s per client. Graphs for performance per 1-second interval are here.
Average throughput:
Query response time histogram: each cell has the percentage of responses that take <= the time in the header and max is the max response time in seconds. For max values in the top 25% of the range have a red background and in the bottom 25% of the range have a green background. The red background is not used when the min value is within 80% of the max value.
| dbms | 256us | 1ms | 4ms | 16ms | 64ms | 256ms | 1s | 4s | 16s | gt | max |
|---|---|---|---|---|---|---|---|---|---|---|---|
| pg174_o2nofp.cx10a_c32r128 | 100.000 | nonzero | nonzero | 0.001 | |||||||
| pg175_o2nofp.cx10a_c32r128 | 100.000 | nonzero | nonzero | 0.001 | |||||||
| pg18beta1_o2nofp.cx10b_c32r128 | 100.000 | nonzero | nonzero | 0.002 | |||||||
| pg18beta1_o2nofp.cx10cw4_c32r128 | 100.000 | nonzero | nonzero | nonzero | 0.004 | ||||||
| pg18beta1_o2nofp.cx10d_c32r128 | 100.000 | nonzero | nonzero | 0.001 | |||||||
| pg18beta2_o2nofp.cx10b_c32r128 | 100.000 | nonzero | nonzero | 0.001 | |||||||
| pg18beta2_o2nofp.cx10cw4_c32r128 | 100.000 | nonzero | nonzero | 0.001 | |||||||
| pg18beta2_o2nofp.cx10d_c32r128 | 100.000 | nonzero | nonzero | 0.001 |
Insert response time histogram: each cell has the percentage of responses that take <= the time in the header and max is the max response time in seconds. For max values in the top 25% of the range have a red background and in the bottom 25% of the range have a green background. The red background is not used when the min value is within 80% of the max value.
| dbms | 256us | 1ms | 4ms | 16ms | 64ms | 256ms | 1s | 4s | 16s | gt | max |
|---|---|---|---|---|---|---|---|---|---|---|---|
| pg174_o2nofp.cx10a_c32r128 | 99.861 | 0.139 | 0.008 | ||||||||
| pg175_o2nofp.cx10a_c32r128 | 99.861 | 0.139 | 0.008 | ||||||||
| pg18beta1_o2nofp.cx10b_c32r128 | 99.861 | 0.139 | 0.008 | ||||||||
| pg18beta1_o2nofp.cx10cw4_c32r128 | 99.861 | 0.139 | 0.008 | ||||||||
| pg18beta1_o2nofp.cx10d_c32r128 | 99.861 | 0.139 | 0.008 | ||||||||
| pg18beta2_o2nofp.cx10b_c32r128 | 99.833 | 0.167 | 0.008 | ||||||||
| pg18beta2_o2nofp.cx10cw4_c32r128 | 99.861 | 0.139 | 0.008 | ||||||||
| pg18beta2_o2nofp.cx10d_c32r128 | 99.861 | 0.139 | 0.009 |
Delete response time histogram: each cell has the percentage of responses that take <= the time in the header and max is the max response time in seconds. For max values in the top 25% of the range have a red background and in the bottom 25% of the range have a green background. The red background is not used when the min value is within 80% of the max value.
| dbms | 256us | 1ms | 4ms | 16ms | 64ms | 256ms | 1s | 4s | 16s | gt | max |
|---|---|---|---|---|---|---|---|---|---|---|---|
| pg174_o2nofp.cx10a_c32r128 | 58.556 | 41.444 | 0.002 | ||||||||
| pg175_o2nofp.cx10a_c32r128 | 54.861 | 45.139 | 0.002 | ||||||||
| pg18beta1_o2nofp.cx10b_c32r128 | 54.583 | 45.417 | 0.003 | ||||||||
| pg18beta1_o2nofp.cx10cw4_c32r128 | 51.889 | 48.111 | 0.003 | ||||||||
| pg18beta1_o2nofp.cx10d_c32r128 | 54.917 | 45.083 | 0.003 | ||||||||
| pg18beta2_o2nofp.cx10b_c32r128 | 56.361 | 43.639 | 0.003 | ||||||||
| pg18beta2_o2nofp.cx10cw4_c32r128 | 56.944 | 43.056 | 0.003 | ||||||||
| pg18beta2_o2nofp.cx10d_c32r128 | 56.611 | 43.389 | 0.003 |
Performance metrics for the DBMS listed above. Some are normalized by throughput, others are not. Legend for results is here.
ips	qps	rps	rmbps	wps	wmbps	rpq	rkbpq	wpi	wkbpi	csps	cpups	cspq	cpupq	dbgb1	dbgb2	rss	maxop	p50	p99	tag
100	20020	0	0.0	24.1	0.9	0.000	0.000	0.241	8.986	76594	1.9	3.826	46	13.7	51.2	0.2	0.001	20040	19754	pg174_o2nofp.cx10a_c32r128
100	19666	0	0.0	15.9	0.8	0.000	0.000	0.159	8.670	75195	1.9	3.824	46	13.7	50.9	0.2	0.001	19657	19417	pg175_o2nofp.cx10a_c32r128
100	19772	0	0.0	14.2	0.8	0.000	0.000	0.142	8.612	75639	1.9	3.826	46	13.6	51.6	0.2	0.002	19769	19498	pg18beta1_o2nofp.cx10b_c32r128
100	19557	0	0.0	19.5	0.9	0.000	0.000	0.195	8.835	74797	1.9	3.825	47	13.7	51.1	0.2	0.004	19546	19242	pg18beta1_o2nofp.cx10cw4_c32r128
100	19655	0	0.0	15.3	0.8	0.000	0.000	0.154	8.676	75156	1.9	3.824	46	13.7	50.1	0.2	0.001	19642	19370	pg18beta1_o2nofp.cx10d_c32r128
100	19699	0	0.0	19.3	0.9	0.000	0.000	0.194	8.873	75339	1.9	3.825	46	13.6	52.0	0.2	0.001	19674	19434	pg18beta2_o2nofp.cx10b_c32r128
100	19852	0	0.0	17.6	0.9	0.000	0.000	0.176	8.758	75917	1.9	3.824	46	13.6	50.4	0.2	0.001	19848	19594	pg18beta2_o2nofp.cx10cw4_c32r128
100	19751	0	0.0	14.9	0.8	0.000	0.000	0.150	8.666	75518	1.9	3.824	46	13.6	52.0	0.2	0.001	19754	19465	pg18beta2_o2nofp.cx10d_c32r128
qp100.L2
qp100.L2: point queries with 100 insert/s per client. Graphs for performance per 1-second interval are here.
Average throughput:
Query response time histogram: each cell has the percentage of responses that take <= the time in the header and max is the max response time in seconds. For max values in the top 25% of the range have a red background and in the bottom 25% of the range have a green background. The red background is not used when the min value is within 80% of the max value.
| dbms | 256us | 1ms | 4ms | 16ms | 64ms | 256ms | 1s | 4s | 16s | gt | max |
|---|---|---|---|---|---|---|---|---|---|---|---|
| pg174_o2nofp.cx10a_c32r128 | 99.999 | 0.001 | 0.001 | ||||||||
| pg175_o2nofp.cx10a_c32r128 | 99.999 | 0.001 | 0.001 | ||||||||
| pg18beta1_o2nofp.cx10b_c32r128 | 99.999 | 0.001 | 0.001 | ||||||||
| pg18beta1_o2nofp.cx10cw4_c32r128 | 99.999 | 0.001 | 0.001 | ||||||||
| pg18beta1_o2nofp.cx10d_c32r128 | 99.999 | 0.001 | 0.001 | ||||||||
| pg18beta2_o2nofp.cx10b_c32r128 | 99.999 | 0.001 | nonzero | 0.004 | |||||||
| pg18beta2_o2nofp.cx10cw4_c32r128 | 99.999 | 0.001 | 0.001 | ||||||||
| pg18beta2_o2nofp.cx10d_c32r128 | 99.999 | 0.001 | 0.001 |
Insert response time histogram: each cell has the percentage of responses that take <= the time in the header and max is the max response time in seconds. For max values in the top 25% of the range have a red background and in the bottom 25% of the range have a green background. The red background is not used when the min value is within 80% of the max value.
| dbms | 256us | 1ms | 4ms | 16ms | 64ms | 256ms | 1s | 4s | 16s | gt | max |
|---|---|---|---|---|---|---|---|---|---|---|---|
| pg174_o2nofp.cx10a_c32r128 | 99.889 | 0.111 | 0.008 | ||||||||
| pg175_o2nofp.cx10a_c32r128 | 99.889 | 0.111 | 0.008 | ||||||||
| pg18beta1_o2nofp.cx10b_c32r128 | 99.889 | 0.111 | 0.008 | ||||||||
| pg18beta1_o2nofp.cx10cw4_c32r128 | 99.889 | 0.111 | 0.008 | ||||||||
| pg18beta1_o2nofp.cx10d_c32r128 | 99.889 | 0.111 | 0.008 | ||||||||
| pg18beta2_o2nofp.cx10b_c32r128 | 99.861 | 0.139 | 0.009 | ||||||||
| pg18beta2_o2nofp.cx10cw4_c32r128 | 99.889 | 0.111 | 0.008 | ||||||||
| pg18beta2_o2nofp.cx10d_c32r128 | 99.889 | 0.111 | 0.008 |
Delete response time histogram: each cell has the percentage of responses that take <= the time in the header and max is the max response time in seconds. For max values in the top 25% of the range have a red background and in the bottom 25% of the range have a green background. The red background is not used when the min value is within 80% of the max value.
| dbms | 256us | 1ms | 4ms | 16ms | 64ms | 256ms | 1s | 4s | 16s | gt | max |
|---|---|---|---|---|---|---|---|---|---|---|---|
| pg174_o2nofp.cx10a_c32r128 | 99.972 | 0.028 | 0.006 | ||||||||
| pg175_o2nofp.cx10a_c32r128 | 99.972 | 0.028 | 0.007 | ||||||||
| pg18beta1_o2nofp.cx10b_c32r128 | 99.972 | 0.028 | 0.007 | ||||||||
| pg18beta1_o2nofp.cx10cw4_c32r128 | 99.972 | 0.028 | 0.007 | ||||||||
| pg18beta1_o2nofp.cx10d_c32r128 | 99.972 | 0.028 | 0.007 | ||||||||
| pg18beta2_o2nofp.cx10b_c32r128 | 99.972 | 0.028 | 0.007 | ||||||||
| pg18beta2_o2nofp.cx10cw4_c32r128 | 99.972 | 0.028 | 0.007 | ||||||||
| pg18beta2_o2nofp.cx10d_c32r128 | 99.972 | 0.028 | 0.007 |
Performance metrics for the DBMS listed above. Some are normalized by throughput, others are not. Legend for results is here.
ips	qps	rps	rmbps	wps	wmbps	rpq	rkbpq	wpi	wkbpi	csps	cpups	cspq	cpupq	dbgb1	dbgb2	rss	maxop	p50	p99	tag
100	9862	0	0.0	113.1	2.0	0.000	0.000	1.133	20.185	38258	2.5	3.879	122	13.7	51.2	0.2	0.001	9876	9765	pg174_o2nofp.cx10a_c32r128
100	9856	0	0.0	106.1	1.9	0.000	0.000	1.063	19.884	38188	2.3	3.875	112	13.7	50.9	0.2	0.001	9860	9797	pg175_o2nofp.cx10a_c32r128
100	9782	0	0.0	105.9	1.9	0.000	0.000	1.062	19.913	37901	2.4	3.875	118	13.6	51.6	0.2	0.001	9797	9669	pg18beta1_o2nofp.cx10b_c32r128
100	9739	0	0.0	104.3	1.9	0.000	0.000	1.045	19.838	37732	2.2	3.874	108	13.7	51.1	0.2	0.001	9749	9669	pg18beta1_o2nofp.cx10cw4_c32r128
100	9764	0	0.0	107.2	1.9	0.000	0.000	1.074	19.941	37843	2.3	3.876	113	13.7	50.1	0.2	0.001	9765	9685	pg18beta1_o2nofp.cx10d_c32r128
100	9792	0	0.0	103.4	1.9	0.000	0.000	1.036	19.816	37932	2.4	3.874	118	13.6	52.0	0.2	0.004	9797	9717	pg18beta2_o2nofp.cx10b_c32r128
100	9804	0	0.0	106.7	1.9	0.000	0.000	1.069	19.914	37993	2.5	3.875	122	13.6	50.4	0.2	0.001	9797	9732	pg18beta2_o2nofp.cx10cw4_c32r128
100	9733	0	0.0	106.3	1.9	0.000	0.000	1.065	19.933	37730	2.3	3.876	113	13.6	52.0	0.2	0.001	9749	9621	pg18beta2_o2nofp.cx10d_c32r128
qr500.L3
qr500.L3: range queries with 500 insert/s per client. Graphs for performance per 1-second interval are here.
Average throughput:
Query response time histogram: each cell has the percentage of responses that take <= the time in the header and max is the max response time in seconds. For max values in the top 25% of the range have a red background and in the bottom 25% of the range have a green background. The red background is not used when the min value is within 80% of the max value.
| dbms | 256us | 1ms | 4ms | 16ms | 64ms | 256ms | 1s | 4s | 16s | gt | max |
|---|---|---|---|---|---|---|---|---|---|---|---|
| pg174_o2nofp.cx10a_c32r128 | 100.000 | nonzero | nonzero | 0.003 | |||||||
| pg175_o2nofp.cx10a_c32r128 | 100.000 | nonzero | nonzero | 0.003 | |||||||
| pg18beta1_o2nofp.cx10b_c32r128 | 99.999 | 0.001 | nonzero | nonzero | 0.004 | ||||||
| pg18beta1_o2nofp.cx10cw4_c32r128 | 100.000 | nonzero | nonzero | 0.003 | |||||||
| pg18beta1_o2nofp.cx10d_c32r128 | 100.000 | nonzero | nonzero | 0.004 | |||||||
| pg18beta2_o2nofp.cx10b_c32r128 | 100.000 | nonzero | nonzero | nonzero | 0.004 | ||||||
| pg18beta2_o2nofp.cx10cw4_c32r128 | 100.000 | nonzero | nonzero | 0.003 | |||||||
| pg18beta2_o2nofp.cx10d_c32r128 | 100.000 | nonzero | nonzero | 0.004 |
Insert response time histogram: each cell has the percentage of responses that take <= the time in the header and max is the max response time in seconds. For max values in the top 25% of the range have a red background and in the bottom 25% of the range have a green background. The red background is not used when the min value is within 80% of the max value.
| dbms | 256us | 1ms | 4ms | 16ms | 64ms | 256ms | 1s | 4s | 16s | gt | max |
|---|---|---|---|---|---|---|---|---|---|---|---|
| pg174_o2nofp.cx10a_c32r128 | 7.956 | 92.028 | 0.017 | 0.008 | |||||||
| pg175_o2nofp.cx10a_c32r128 | 8.317 | 91.661 | 0.022 | 0.008 | |||||||
| pg18beta1_o2nofp.cx10b_c32r128 | 7.567 | 92.411 | 0.022 | 0.008 | |||||||
| pg18beta1_o2nofp.cx10cw4_c32r128 | 9.389 | 90.589 | 0.022 | 0.008 | |||||||
| pg18beta1_o2nofp.cx10d_c32r128 | 8.094 | 91.883 | 0.022 | 0.008 | |||||||
| pg18beta2_o2nofp.cx10b_c32r128 | 14.500 | 85.483 | 0.017 | 0.008 | |||||||
| pg18beta2_o2nofp.cx10cw4_c32r128 | 11.839 | 88.139 | 0.022 | 0.008 | |||||||
| pg18beta2_o2nofp.cx10d_c32r128 | 6.556 | 93.422 | 0.022 | 0.008 |
Delete response time histogram: each cell has the percentage of responses that take <= the time in the header and max is the max response time in seconds. For max values in the top 25% of the range have a red background and in the bottom 25% of the range have a green background. The red background is not used when the min value is within 80% of the max value.
| dbms | 256us | 1ms | 4ms | 16ms | 64ms | 256ms | 1s | 4s | 16s | gt | max |
|---|---|---|---|---|---|---|---|---|---|---|---|
| pg174_o2nofp.cx10a_c32r128 | 94.539 | 5.461 | 0.010 | ||||||||
| pg175_o2nofp.cx10a_c32r128 | 94.911 | 5.089 | 0.011 | ||||||||
| pg18beta1_o2nofp.cx10b_c32r128 | 94.706 | 5.294 | 0.011 | ||||||||
| pg18beta1_o2nofp.cx10cw4_c32r128 | 94.278 | 5.722 | 0.011 | ||||||||
| pg18beta1_o2nofp.cx10d_c32r128 | 94.467 | 5.533 | 0.011 | ||||||||
| pg18beta2_o2nofp.cx10b_c32r128 | 95.378 | 4.622 | 0.011 | ||||||||
| pg18beta2_o2nofp.cx10cw4_c32r128 | 95.439 | 4.561 | 0.011 | ||||||||
| pg18beta2_o2nofp.cx10d_c32r128 | 95.550 | 4.450 | 0.011 |
Performance metrics for the DBMS listed above. Some are normalized by throughput, others are not. Legend for results is here.
ips	qps	rps	rmbps	wps	wmbps	rpq	rkbpq	wpi	wkbpi	csps	cpups	cspq	cpupq	dbgb1	dbgb2	rss	maxop	p50	p99	tag
499	18464	0	0.0	117.5	3.1	0.000	0.000	0.235	6.348	70773	2.1	3.833	55	13.7	51.2	0.5	0.003	18443	17632	pg174_o2nofp.cx10a_c32r128
499	17955	0	0.0	112.6	3.1	0.000	0.000	0.226	6.344	68844	2.1	3.834	56	13.7	50.9	0.5	0.003	17963	17116	pg175_o2nofp.cx10a_c32r128
499	18009	0	0.0	109.4	3.1	0.000	0.000	0.219	6.281	69001	2.1	3.831	56	13.6	51.6	0.5	0.004	17995	17052	pg18beta1_o2nofp.cx10b_c32r128
499	18168	0	0.0	110.8	3.1	0.000	0.000	0.222	6.297	69614	2.2	3.832	58	13.7	51.1	0.5	0.003	18123	17244	pg18beta1_o2nofp.cx10cw4_c32r128
499	17943	0	0.0	111.5	3.1	0.000	0.000	0.223	6.305	68757	2.2	3.832	59	13.7	50.1	0.5	0.004	17931	17036	pg18beta1_o2nofp.cx10d_c32r128
499	18204	0	0.0	108.4	3.1	0.000	0.000	0.217	6.309	69745	2.1	3.831	55	13.6	52.0	0.5	0.004	18219	17292	pg18beta2_o2nofp.cx10b_c32r128
499	18269	0	0.0	109.9	3.1	0.000	0.000	0.220	6.298	69995	2.1	3.831	55	13.6	50.4	0.5	0.003	18267	17404	pg18beta2_o2nofp.cx10cw4_c32r128
499	18257	0	0.0	109.0	3.1	0.000	0.000	0.218	6.295	69949	2.1	3.831	55	13.6	52.0	0.5	0.004	18283	17419	pg18beta2_o2nofp.cx10d_c32r128
qp500.L4
qp500.L4: point queries with 500 insert/s per client. Graphs for performance per 1-second interval are here.
Average throughput:
Query response time histogram: each cell has the percentage of responses that take <= the time in the header and max is the max response time in seconds. For max values in the top 25% of the range have a red background and in the bottom 25% of the range have a green background. The red background is not used when the min value is within 80% of the max value.
| dbms | 256us | 1ms | 4ms | 16ms | 64ms | 256ms | 1s | 4s | 16s | gt | max |
|---|---|---|---|---|---|---|---|---|---|---|---|
| pg174_o2nofp.cx10a_c32r128 | 100.000 | nonzero | 0.001 | ||||||||
| pg175_o2nofp.cx10a_c32r128 | 99.999 | 0.001 | nonzero | 0.001 | |||||||
| pg18beta1_o2nofp.cx10b_c32r128 | 99.999 | 0.001 | 0.001 | ||||||||
| pg18beta1_o2nofp.cx10cw4_c32r128 | 99.999 | 0.001 | 0.001 | ||||||||
| pg18beta1_o2nofp.cx10d_c32r128 | 99.999 | 0.001 | 0.001 | ||||||||
| pg18beta2_o2nofp.cx10b_c32r128 | 99.999 | 0.001 | 0.001 | ||||||||
| pg18beta2_o2nofp.cx10cw4_c32r128 | 99.999 | 0.001 | nonzero | 0.001 | |||||||
| pg18beta2_o2nofp.cx10d_c32r128 | 99.999 | 0.001 | nonzero | nonzero | 0.005 |
Insert response time histogram: each cell has the percentage of responses that take <= the time in the header and max is the max response time in seconds. For max values in the top 25% of the range have a red background and in the bottom 25% of the range have a green background. The red background is not used when the min value is within 80% of the max value.
| dbms | 256us | 1ms | 4ms | 16ms | 64ms | 256ms | 1s | 4s | 16s | gt | max |
|---|---|---|---|---|---|---|---|---|---|---|---|
| pg174_o2nofp.cx10a_c32r128 | 12.006 | 87.972 | 0.022 | 0.008 | |||||||
| pg175_o2nofp.cx10a_c32r128 | 7.761 | 92.222 | 0.017 | 0.008 | |||||||
| pg18beta1_o2nofp.cx10b_c32r128 | 18.172 | 81.778 | 0.050 | 0.014 | |||||||
| pg18beta1_o2nofp.cx10cw4_c32r128 | 17.972 | 81.967 | 0.056 | 0.006 | 0.023 | ||||||
| pg18beta1_o2nofp.cx10d_c32r128 | 15.639 | 84.317 | 0.044 | 0.014 | |||||||
| pg18beta2_o2nofp.cx10b_c32r128 | 23.278 | 76.672 | 0.039 | 0.011 | 0.023 | ||||||
| pg18beta2_o2nofp.cx10cw4_c32r128 | 24.578 | 75.378 | 0.044 | 0.015 | |||||||
| pg18beta2_o2nofp.cx10d_c32r128 | 15.750 | 84.200 | 0.044 | 0.006 | 0.016 |
Delete response time histogram: each cell has the percentage of responses that take <= the time in the header and max is the max response time in seconds. For max values in the top 25% of the range have a red background and in the bottom 25% of the range have a green background. The red background is not used when the min value is within 80% of the max value.
| dbms | 256us | 1ms | 4ms | 16ms | 64ms | 256ms | 1s | 4s | 16s | gt | max |
|---|---|---|---|---|---|---|---|---|---|---|---|
| pg174_o2nofp.cx10a_c32r128 | 46.294 | 53.700 | 0.006 | 0.022 | |||||||
| pg175_o2nofp.cx10a_c32r128 | 46.083 | 53.911 | 0.006 | 0.024 | |||||||
| pg18beta1_o2nofp.cx10b_c32r128 | 31.678 | 63.089 | 5.228 | 0.006 | 0.023 | ||||||
| pg18beta1_o2nofp.cx10cw4_c32r128 | 31.028 | 65.294 | 3.672 | 0.006 | 0.023 | ||||||
| pg18beta1_o2nofp.cx10d_c32r128 | 30.517 | 65.500 | 3.978 | 0.006 | 0.024 | ||||||
| pg18beta2_o2nofp.cx10b_c32r128 | 33.039 | 63.311 | 3.644 | 0.006 | 0.024 | ||||||
| pg18beta2_o2nofp.cx10cw4_c32r128 | 33.033 | 62.922 | 4.039 | 0.006 | 0.023 | ||||||
| pg18beta2_o2nofp.cx10d_c32r128 | 31.572 | 61.083 | 7.339 | 0.006 | 0.024 |
Performance metrics for the DBMS listed above. Some are normalized by throughput, others are not. Legend for results is here.
ips	qps	rps	rmbps	wps	wmbps	rpq	rkbpq	wpi	wkbpi	csps	cpups	cspq	cpupq	dbgb1	dbgb2	rss	maxop	p50	p99	tag
499	9800	0	0.0	106.4	4.5	0.000	0.000	0.213	9.164	38128	2.8	3.891	137	13.7	51.3	0.6	0.001	9812	9733	pg174_o2nofp.cx10a_c32r128
499	9849	0	0.0	101.8	4.5	0.000	0.000	0.204	9.180	38292	2.3	3.888	112	13.8	51.0	0.5	0.001	9860	9733	pg175_o2nofp.cx10a_c32r128
499	9668	0	0.0	96.5	4.6	0.000	0.000	0.193	9.339	37570	2.2	3.886	109	13.6	51.6	0.4	0.001	9669	9605	pg18beta1_o2nofp.cx10b_c32r128
499	9872	0	0.0	100.9	4.6	0.000	0.000	0.202	9.374	38398	2.4	3.890	117	13.7	51.1	14.0	0.001	9877	9813	pg18beta1_o2nofp.cx10cw4_c32r128
499	9796	0	0.0	97.8	4.6	0.000	0.000	0.196	9.363	38089	2.5	3.888	122	13.7	50.1	0.4	0.001	9797	9717	pg18beta1_o2nofp.cx10d_c32r128
499	9771	0	0.0	97.8	4.6	0.000	0.000	0.196	9.345	37992	2.4	3.888	118	13.6	52.0	0.4	0.001	9765	9685	pg18beta2_o2nofp.cx10b_c32r128
499	9725	0	0.0	98.4	4.6	0.000	0.000	0.197	9.345	37794	2.3	3.886	114	13.6	50.4	0.4	0.001	9733	9621	pg18beta2_o2nofp.cx10cw4_c32r128
499	9682	0	0.0	99.0	4.6	0.000	0.000	0.198	9.386	37657	2.3	3.890	114	13.6	52.0	0.4	0.005	9685	9621	pg18beta2_o2nofp.cx10d_c32r128
qr1000.L5
qr1000.L5: range queries with 1000 insert/s per client. Graphs for performance per 1-second interval are here.
Average throughput:
Query response time histogram: each cell has the percentage of responses that take <= the time in the header and max is the max response time in seconds. For max values in the top 25% of the range have a red background and in the bottom 25% of the range have a green background. The red background is not used when the min value is within 80% of the max value.
| dbms | 256us | 1ms | 4ms | 16ms | 64ms | 256ms | 1s | 4s | 16s | gt | max |
|---|---|---|---|---|---|---|---|---|---|---|---|
| pg174_o2nofp.cx10a_c32r128 | 99.998 | 0.001 | nonzero | nonzero | 0.011 | ||||||
| pg175_o2nofp.cx10a_c32r128 | 99.998 | 0.001 | nonzero | nonzero | 0.013 | ||||||
| pg18beta1_o2nofp.cx10b_c32r128 | 99.998 | 0.002 | nonzero | nonzero | 0.008 | ||||||
| pg18beta1_o2nofp.cx10cw4_c32r128 | 99.998 | 0.002 | nonzero | nonzero | 0.008 | ||||||
| pg18beta1_o2nofp.cx10d_c32r128 | 99.998 | 0.002 | nonzero | nonzero | 0.007 | ||||||
| pg18beta2_o2nofp.cx10b_c32r128 | 99.998 | 0.002 | nonzero | nonzero | 0.008 | ||||||
| pg18beta2_o2nofp.cx10cw4_c32r128 | 99.998 | 0.002 | nonzero | nonzero | 0.008 | ||||||
| pg18beta2_o2nofp.cx10d_c32r128 | 99.998 | 0.002 | nonzero | nonzero | 0.006 |
Insert response time histogram: each cell has the percentage of responses that take <= the time in the header and max is the max response time in seconds. For max values in the top 25% of the range have a red background and in the bottom 25% of the range have a green background. The red background is not used when the min value is within 80% of the max value.
| dbms | 256us | 1ms | 4ms | 16ms | 64ms | 256ms | 1s | 4s | 16s | gt | max |
|---|---|---|---|---|---|---|---|---|---|---|---|
| pg174_o2nofp.cx10a_c32r128 | 41.878 | 58.106 | 0.017 | 0.014 | |||||||
| pg175_o2nofp.cx10a_c32r128 | 40.172 | 59.814 | 0.014 | 0.013 | |||||||
| pg18beta1_o2nofp.cx10b_c32r128 | 29.133 | 70.858 | 0.008 | 0.008 | |||||||
| pg18beta1_o2nofp.cx10cw4_c32r128 | 33.531 | 66.461 | 0.008 | 0.008 | |||||||
| pg18beta1_o2nofp.cx10d_c32r128 | 31.206 | 68.786 | 0.008 | 0.008 | |||||||
| pg18beta2_o2nofp.cx10b_c32r128 | 34.086 | 65.903 | 0.011 | 0.008 | |||||||
| pg18beta2_o2nofp.cx10cw4_c32r128 | 32.219 | 67.772 | 0.008 | 0.008 | |||||||
| pg18beta2_o2nofp.cx10d_c32r128 | 27.083 | 72.908 | 0.008 | 0.008 |
Delete response time histogram: each cell has the percentage of responses that take <= the time in the header and max is the max response time in seconds. For max values in the top 25% of the range have a red background and in the bottom 25% of the range have a green background. The red background is not used when the min value is within 80% of the max value.
| dbms | 256us | 1ms | 4ms | 16ms | 64ms | 256ms | 1s | 4s | 16s | gt | max |
|---|---|---|---|---|---|---|---|---|---|---|---|
| pg174_o2nofp.cx10a_c32r128 | 8.669 | 70.464 | 20.864 | 0.003 | 0.032 | ||||||
| pg175_o2nofp.cx10a_c32r128 | 8.631 | 70.108 | 21.258 | 0.003 | 0.033 | ||||||
| pg18beta1_o2nofp.cx10b_c32r128 | 16.489 | 59.056 | 24.456 | 0.013 | |||||||
| pg18beta1_o2nofp.cx10cw4_c32r128 | 17.056 | 60.047 | 22.897 | 0.014 | |||||||
| pg18beta1_o2nofp.cx10d_c32r128 | 16.722 | 56.575 | 26.703 | 0.013 | |||||||
| pg18beta2_o2nofp.cx10b_c32r128 | 16.994 | 59.417 | 23.589 | 0.014 | |||||||
| pg18beta2_o2nofp.cx10cw4_c32r128 | 16.992 | 53.583 | 29.425 | 0.014 | |||||||
| pg18beta2_o2nofp.cx10d_c32r128 | 17.461 | 63.292 | 19.247 | 0.011 |
Performance metrics for the DBMS listed above. Some are normalized by throughput, others are not. Legend for results is here.
ips	qps	rps	rmbps	wps	wmbps	rpq	rkbpq	wpi	wkbpi	csps	cpups	cspq	cpupq	dbgb1	dbgb2	rss	maxop	p50	p99	tag
998	18108	0	0.0	123.4	5.0	0.000	0.000	0.124	5.102	69665	2.6	3.847	69	13.8	51.3	0.5	0.011	18298	15390	pg174_o2nofp.cx10a_c32r128
999	17744	0	0.0	116.3	4.9	0.000	0.000	0.116	5.072	68202	2.6	3.844	70	13.8	51.0	0.5	0.013	18011	15055	pg175_o2nofp.cx10a_c32r128
999	18064	0	0.0	96.2	5.1	0.000	0.000	0.096	5.190	69404	2.5	3.842	66	13.7	51.7	11.5	0.008	18171	16365	pg18beta1_o2nofp.cx10b_c32r128
999	18033	0	0.0	101.2	5.0	0.000	0.000	0.101	5.163	69288	2.6	3.842	69	13.7	51.1	0.5	0.008	18170	16301	pg18beta1_o2nofp.cx10cw4_c32r128
998	18048	0	0.0	100.2	5.1	0.000	0.000	0.100	5.187	69393	2.6	3.845	69	13.7	50.1	8.4	0.007	18235	16253	pg18beta1_o2nofp.cx10d_c32r128
999	18258	0	0.0	108.7	5.1	0.000	0.000	0.109	5.225	70208	2.6	3.845	68	13.7	52.0	0.5	0.008	18347	16685	pg18beta2_o2nofp.cx10b_c32r128
998	18163	0	0.0	100.5	5.0	0.000	0.000	0.101	5.168	69833	2.5	3.845	66	13.7	50.4	0.5	0.008	18283	16605	pg18beta2_o2nofp.cx10cw4_c32r128
998	18132	0	0.0	90.1	5.2	0.000	0.000	0.090	5.288	69707	2.6	3.844	69	13.7	52.0	8.2	0.006	18075	16541	pg18beta2_o2nofp.cx10d_c32r128
qp1000.L6
qp1000.L6: point queries with 1000 insert/s per client. Graphs for performance per 1-second interval are here.
Average throughput:
Query response time histogram: each cell has the percentage of responses that take <= the time in the header and max is the max response time in seconds. For max values in the top 25% of the range have a red background and in the bottom 25% of the range have a green background. The red background is not used when the min value is within 80% of the max value.
| dbms | 256us | 1ms | 4ms | 16ms | 64ms | 256ms | 1s | 4s | 16s | gt | max |
|---|---|---|---|---|---|---|---|---|---|---|---|
| pg174_o2nofp.cx10a_c32r128 | 99.999 | 0.001 | nonzero | nonzero | nonzero | 0.102 | |||||
| pg175_o2nofp.cx10a_c32r128 | 99.999 | 0.001 | nonzero | 0.001 | |||||||
| pg18beta1_o2nofp.cx10b_c32r128 | 99.999 | 0.001 | nonzero | nonzero | 0.004 | ||||||
| pg18beta1_o2nofp.cx10cw4_c32r128 | 99.999 | 0.001 | nonzero | nonzero | 0.117 | ||||||
| pg18beta1_o2nofp.cx10d_c32r128 | 99.999 | 0.001 | nonzero | 0.001 | |||||||
| pg18beta2_o2nofp.cx10b_c32r128 | 99.999 | 0.001 | 0.001 | ||||||||
| pg18beta2_o2nofp.cx10cw4_c32r128 | 99.999 | 0.001 | 0.001 | ||||||||
| pg18beta2_o2nofp.cx10d_c32r128 | 99.999 | 0.001 | 0.001 |
Insert response time histogram: each cell has the percentage of responses that take <= the time in the header and max is the max response time in seconds. For max values in the top 25% of the range have a red background and in the bottom 25% of the range have a green background. The red background is not used when the min value is within 80% of the max value.
| dbms | 256us | 1ms | 4ms | 16ms | 64ms | 256ms | 1s | 4s | 16s | gt | max |
|---|---|---|---|---|---|---|---|---|---|---|---|
| pg174_o2nofp.cx10a_c32r128 | 28.492 | 71.497 | 0.011 | 0.014 | |||||||
| pg175_o2nofp.cx10a_c32r128 | 24.025 | 75.964 | 0.011 | 0.012 | |||||||
| pg18beta1_o2nofp.cx10b_c32r128 | 33.383 | 66.606 | 0.011 | 0.013 | |||||||
| pg18beta1_o2nofp.cx10cw4_c32r128 | 40.969 | 59.019 | 0.011 | 0.013 | |||||||
| pg18beta1_o2nofp.cx10d_c32r128 | 39.417 | 60.572 | 0.011 | 0.013 | |||||||
| pg18beta2_o2nofp.cx10b_c32r128 | 42.078 | 57.914 | 0.008 | 0.009 | |||||||
| pg18beta2_o2nofp.cx10cw4_c32r128 | 42.461 | 57.531 | 0.008 | 0.008 | |||||||
| pg18beta2_o2nofp.cx10d_c32r128 | 33.158 | 66.833 | 0.008 | 0.008 |
Delete response time histogram: each cell has the percentage of responses that take <= the time in the header and max is the max response time in seconds. For max values in the top 25% of the range have a red background and in the bottom 25% of the range have a green background. The red background is not used when the min value is within 80% of the max value.
| dbms | 256us | 1ms | 4ms | 16ms | 64ms | 256ms | 1s | 4s | 16s | gt | max |
|---|---|---|---|---|---|---|---|---|---|---|---|
| pg174_o2nofp.cx10a_c32r128 | 8.594 | 48.539 | 42.864 | 0.003 | 0.025 | ||||||
| pg175_o2nofp.cx10a_c32r128 | 8.519 | 49.233 | 42.244 | 0.003 | 0.027 | ||||||
| pg18beta1_o2nofp.cx10b_c32r128 | 8.192 | 80.725 | 11.083 | 0.016 | |||||||
| pg18beta1_o2nofp.cx10cw4_c32r128 | 8.036 | 89.175 | 2.786 | 0.003 | 0.018 | ||||||
| pg18beta1_o2nofp.cx10d_c32r128 | 8.003 | 89.397 | 2.597 | 0.003 | 0.016 | ||||||
| pg18beta2_o2nofp.cx10b_c32r128 | 8.381 | 89.042 | 2.575 | 0.003 | 0.017 | ||||||
| pg18beta2_o2nofp.cx10cw4_c32r128 | 8.489 | 88.786 | 2.722 | 0.003 | 0.017 | ||||||
| pg18beta2_o2nofp.cx10d_c32r128 | 16.511 | 56.511 | 26.978 | 0.012 |
Performance metrics for the DBMS listed above. Some are normalized by throughput, others are not. Legend for results is here.
ips	qps	rps	rmbps	wps	wmbps	rpq	rkbpq	wpi	wkbpi	csps	cpups	cspq	cpupq	dbgb1	dbgb2	rss	maxop	p50	p99	tag
999	9762	0	0.0	101.1	5.5	0.000	0.000	0.101	5.675	38196	2.5	3.913	123	13.8	51.4	13.9	0.102	9765	9685	pg174_o2nofp.cx10a_c32r128
999	9846	0	0.0	90.5	5.5	0.000	0.000	0.091	5.611	38464	2.3	3.907	112	13.8	51.0	0.6	0.001	9844	9781	pg175_o2nofp.cx10a_c32r128
999	9854	0	0.0	82.5	5.3	0.000	0.000	0.083	5.431	38492	2.4	3.906	117	13.7	51.7	0.5	0.004	9861	9765	pg18beta1_o2nofp.cx10b_c32r128
999	9842	0	0.0	84.0	5.3	0.000	0.000	0.084	5.394	38447	2.4	3.907	117	13.6	51.1	0.4	0.117	9860	9749	pg18beta1_o2nofp.cx10cw4_c32r128
999	9785	0	0.0	82.3	5.3	0.000	0.000	0.082	5.391	38224	2.5	3.906	123	13.7	50.1	0.5	0.001	9781	9701	pg18beta1_o2nofp.cx10d_c32r128
999	9870	0	0.0	91.3	5.3	0.000	0.000	0.091	5.441	38616	2.6	3.913	126	13.7	52.0	0.4	0.001	9877	9813	pg18beta2_o2nofp.cx10b_c32r128
998	9762	0	0.0	84.9	5.3	0.000	0.000	0.085	5.403	38167	2.4	3.910	118	13.7	50.4	0.4	0.001	9780	9685	pg18beta2_o2nofp.cx10cw4_c32r128
999	9669	0	0.0	73.1	5.3	0.000	0.000	0.073	5.467	37784	2.4	3.908	119	13.7	52.0	0.6	0.001	9669	9573	pg18beta2_o2nofp.cx10d_c32r128
l.i0
l.i0: load without secondary indexes
Performance metrics for all DBMS, not just the ones listed above. Some are normalized by throughput, others are not. Legend for results is here.
ips	qps	rps	rmbps	wps	wmbps	rpq	rkbpq	wpi	wkbpi	csps	cpups	cspq	cpupq	dbgb1	dbgb2	rss	maxop	p50	p99	tag
160256	0	0	0.0	619.8	68.0	0.000	0.000	0.004	0.434	17353	3.5	0.108	10	4.8	13.0	0.5	0.017	161115	158422	pg174_o2nofp.cx10a_c32r128
158228	0	0	0.0	622.8	68.4	0.000	0.000	0.004	0.443	16911	3.9	0.107	12	4.8	13.0	0.5	0.019	159909	156878	pg175_o2nofp.cx10a_c32r128
156250	0	0	0.0	595.9	66.3	0.000	0.000	0.004	0.434	16624	3.2	0.106	10	4.8	13.0	4.7	0.008	156322	155027	pg18beta1_o2nofp.cx10b_c32r128
158730	0	0	0.0	606.2	67.6	0.000	0.000	0.004	0.436	17148	3.3	0.108	10	4.8	13.0	0.5	0.022	159515	156318	pg18beta1_o2nofp.cx10cw4_c32r128
155763	0	0	0.0	605.0	67.3	0.000	0.000	0.004	0.442	16547	3.1	0.106	10	4.8	13.0	0.5	0.015	156122	154919	pg18beta1_o2nofp.cx10d_c32r128
161290	0	0	0.0	614.1	68.5	0.000	0.000	0.004	0.435	17352	3.5	0.108	10	4.8	13.0	4.8	0.008	161512	160615	pg18beta2_o2nofp.cx10b_c32r128
160772	0	0	0.0	617.4	68.4	0.000	0.000	0.004	0.436	17320	3.4	0.108	10	4.8	13.0	0.5	0.016	161510	160412	pg18beta2_o2nofp.cx10cw4_c32r128
158730	0	0	0.0	607.8	67.6	0.000	0.000	0.004	0.436	17080	3.4	0.108	10	4.8	13.0	0.5	0.014	158920	157616	pg18beta2_o2nofp.cx10d_c32r128
l.x
l.x: create secondary indexes
Performance metrics for all DBMS, not just the ones listed above. Some are normalized by throughput, others are not. Legend for results is here.
ips	qps	rps	rmbps	wps	wmbps	rpq	rkbpq	wpi	wkbpi	csps	cpups	cspq	cpupq	dbgb1	dbgb2	rss	maxop	p50	p99	tag
378789	0	0	0.0	957.9	113.9	0.000	0.000	0.003	0.308	1884	2.5	0.005	3	9.6	22.2	5.1	0.002	NA	NA	pg174_o2nofp.cx10a_c32r128
378789	0	0	0.0	947.2	112.4	0.000	0.000	0.003	0.304	1875	2.5	0.005	3	9.6	22.1	5.1	0.002	NA	NA	pg175_o2nofp.cx10a_c32r128
373135	0	0	0.0	914.4	109.9	0.000	0.000	0.002	0.302	1714	2.4	0.005	3	9.6	22.2	5.1	0.002	NA	NA	pg18beta1_o2nofp.cx10b_c32r128
381680	0	6	0.0	1057.5	115.5	0.000	0.000	0.003	0.310	2287	2.6	0.006	3	9.6	22.2	5.1	0.002	NA	NA	pg18beta1_o2nofp.cx10cw4_c32r128
381680	0	0	0.0	953.6	114.3	0.000	0.000	0.002	0.307	1914	2.3	0.005	3	9.6	22.1	5.1	0.002	NA	NA	pg18beta1_o2nofp.cx10d_c32r128
378789	0	0	0.0	963.0	115.5	0.000	0.000	0.003	0.312	1854	2.4	0.005	3	9.6	22.2	5.1	0.002	NA	NA	pg18beta2_o2nofp.cx10b_c32r128
378789	0	0	0.0	970.1	115.8	0.000	0.000	0.003	0.313	1906	2.4	0.005	3	9.6	22.2	5.1	0.002	NA	NA	pg18beta2_o2nofp.cx10cw4_c32r128
378789	0	0	0.0	949.0	113.6	0.000	0.000	0.003	0.307	1873	2.4	0.005	3	9.6	22.2	5.1	0.002	NA	NA	pg18beta2_o2nofp.cx10d_c32r128
l.i1
l.i1: continue load after secondary indexes created with 50 inserts per transaction
Performance metrics for all DBMS, not just the ones listed above. Some are normalized by throughput, others are not. Legend for results is here.
ips	qps	rps	rmbps	wps	wmbps	rpq	rkbpq	wpi	wkbpi	csps	cpups	cspq	cpupq	dbgb1	dbgb2	rss	maxop	p50	p99	tag
13704	0	0	0.0	182.7	17.3	0.000	0.000	0.013	1.290	6249	3.0	0.456	105	13.6	51.1	1.1	0.083	10138	6093	pg174_o2nofp.cx10a_c32r128
13560	0	0	0.0	182.6	17.1	0.000	0.000	0.013	1.292	6209	3.0	0.458	106	13.6	50.8	12.3	0.023	9989	5544	pg175_o2nofp.cx10a_c32r128
13735	0	0	0.0	177.4	17.3	0.000	0.000	0.013	1.292	6234	3.0	0.454	105	13.6	51.6	13.2	0.082	10788	7342	pg18beta1_o2nofp.cx10b_c32r128
13619	0	1	0.0	177.3	17.2	0.000	0.001	0.013	1.294	6207	3.0	0.456	106	13.6	51.0	1.7	0.085	10388	6043	pg18beta1_o2nofp.cx10cw4_c32r128
13336	0	0	0.0	174.5	16.8	0.000	0.000	0.013	1.288	6065	2.9	0.455	104	13.6	50.0	13.7	0.093	10240	4095	pg18beta1_o2nofp.cx10d_c32r128
13752	0	0	0.0	175.0	17.3	0.000	0.000	0.013	1.291	6229	3.0	0.453	105	13.6	51.9	1.5	0.015	9889	6842	pg18beta2_o2nofp.cx10b_c32r128
13587	0	0	0.0	173.9	17.0	0.000	0.000	0.013	1.283	6171	2.9	0.454	102	13.6	50.3	1.4	0.089	10288	4295	pg18beta2_o2nofp.cx10cw4_c32r128
13736	0	0	0.0	176.5	17.4	0.000	0.000	0.013	1.296	6240	3.0	0.454	105	13.6	51.9	1.7	0.015	9939	6093	pg18beta2_o2nofp.cx10d_c32r128
l.i2
l.i2: continue load after secondary indexes created with 5 inserts per transaction
Performance metrics for all DBMS, not just the ones listed above. Some are normalized by throughput, others are not. Legend for results is here.
ips	qps	rps	rmbps	wps	wmbps	rpq	rkbpq	wpi	wkbpi	csps	cpups	cspq	cpupq	dbgb1	dbgb2	rss	maxop	p50	p99	tag
1636	0	0	0.0	93.1	6.1	0.000	0.000	0.057	3.818	7189	1.9	4.395	558	13.7	51.2	11.4	0.081	1294	809	pg174_o2nofp.cx10a_c32r128
1611	0	0	0.0	90.7	6.1	0.000	0.000	0.056	3.849	7090	1.9	4.400	566	13.7	50.9	2.1	0.087	1283	789	pg175_o2nofp.cx10a_c32r128
1791	0	0	0.0	86.1	6.1	0.000	0.000	0.048	3.508	7745	2.0	4.325	536	13.6	51.6	11.5	0.088	1328	584	pg18beta1_o2nofp.cx10b_c32r128
1798	0	0	0.0	87.3	6.2	0.000	0.000	0.049	3.543	7801	2.0	4.337	534	13.7	51.1	11.3	0.002	1333	579	pg18beta1_o2nofp.cx10cw4_c32r128
1781	0	0	0.0	83.6	6.2	0.000	0.000	0.047	3.583	7719	2.0	4.334	539	13.7	50.1	13.6	0.099	1348	574	pg18beta1_o2nofp.cx10d_c32r128
1831	0	0	0.0	86.0	6.2	0.000	0.000	0.047	3.467	7949	2.0	4.341	524	13.6	52.0	13.8	0.096	1343	579	pg18beta2_o2nofp.cx10b_c32r128
1784	0	0	0.0	86.2	6.2	0.000	0.000	0.048	3.555	7744	2.0	4.342	538	13.6	50.4	13.5	0.101	1334	554	pg18beta2_o2nofp.cx10cw4_c32r128
1731	0	0	0.0	86.9	6.1	0.000	0.000	0.050	3.596	7518	2.0	4.343	555	13.6	52.0	6.2	0.100	1249	599	pg18beta2_o2nofp.cx10d_c32r128
qr100.L1
qr100.L1: range queries with 100 insert/s per client
Performance metrics for all DBMS, not just the ones listed above. Some are normalized by throughput, others are not. Legend for results is here.
ips	qps	rps	rmbps	wps	wmbps	rpq	rkbpq	wpi	wkbpi	csps	cpups	cspq	cpupq	dbgb1	dbgb2	rss	maxop	p50	p99	tag
100	20020	0	0.0	24.1	0.9	0.000	0.000	0.241	8.986	76594	1.9	3.826	46	13.7	51.2	0.2	0.001	20040	19754	pg174_o2nofp.cx10a_c32r128
100	19666	0	0.0	15.9	0.8	0.000	0.000	0.159	8.670	75195	1.9	3.824	46	13.7	50.9	0.2	0.001	19657	19417	pg175_o2nofp.cx10a_c32r128
100	19772	0	0.0	14.2	0.8	0.000	0.000	0.142	8.612	75639	1.9	3.826	46	13.6	51.6	0.2	0.002	19769	19498	pg18beta1_o2nofp.cx10b_c32r128
100	19557	0	0.0	19.5	0.9	0.000	0.000	0.195	8.835	74797	1.9	3.825	47	13.7	51.1	0.2	0.004	19546	19242	pg18beta1_o2nofp.cx10cw4_c32r128
100	19655	0	0.0	15.3	0.8	0.000	0.000	0.154	8.676	75156	1.9	3.824	46	13.7	50.1	0.2	0.001	19642	19370	pg18beta1_o2nofp.cx10d_c32r128
100	19699	0	0.0	19.3	0.9	0.000	0.000	0.194	8.873	75339	1.9	3.825	46	13.6	52.0	0.2	0.001	19674	19434	pg18beta2_o2nofp.cx10b_c32r128
100	19852	0	0.0	17.6	0.9	0.000	0.000	0.176	8.758	75917	1.9	3.824	46	13.6	50.4	0.2	0.001	19848	19594	pg18beta2_o2nofp.cx10cw4_c32r128
100	19751	0	0.0	14.9	0.8	0.000	0.000	0.150	8.666	75518	1.9	3.824	46	13.6	52.0	0.2	0.001	19754	19465	pg18beta2_o2nofp.cx10d_c32r128
qp100.L2
qp100.L2: point queries with 100 insert/s per client
Performance metrics for all DBMS, not just the ones listed above. Some are normalized by throughput, others are not. Legend for results is here.
ips	qps	rps	rmbps	wps	wmbps	rpq	rkbpq	wpi	wkbpi	csps	cpups	cspq	cpupq	dbgb1	dbgb2	rss	maxop	p50	p99	tag
100	9862	0	0.0	113.1	2.0	0.000	0.000	1.133	20.185	38258	2.5	3.879	122	13.7	51.2	0.2	0.001	9876	9765	pg174_o2nofp.cx10a_c32r128
100	9856	0	0.0	106.1	1.9	0.000	0.000	1.063	19.884	38188	2.3	3.875	112	13.7	50.9	0.2	0.001	9860	9797	pg175_o2nofp.cx10a_c32r128
100	9782	0	0.0	105.9	1.9	0.000	0.000	1.062	19.913	37901	2.4	3.875	118	13.6	51.6	0.2	0.001	9797	9669	pg18beta1_o2nofp.cx10b_c32r128
100	9739	0	0.0	104.3	1.9	0.000	0.000	1.045	19.838	37732	2.2	3.874	108	13.7	51.1	0.2	0.001	9749	9669	pg18beta1_o2nofp.cx10cw4_c32r128
100	9764	0	0.0	107.2	1.9	0.000	0.000	1.074	19.941	37843	2.3	3.876	113	13.7	50.1	0.2	0.001	9765	9685	pg18beta1_o2nofp.cx10d_c32r128
100	9792	0	0.0	103.4	1.9	0.000	0.000	1.036	19.816	37932	2.4	3.874	118	13.6	52.0	0.2	0.004	9797	9717	pg18beta2_o2nofp.cx10b_c32r128
100	9804	0	0.0	106.7	1.9	0.000	0.000	1.069	19.914	37993	2.5	3.875	122	13.6	50.4	0.2	0.001	9797	9732	pg18beta2_o2nofp.cx10cw4_c32r128
100	9733	0	0.0	106.3	1.9	0.000	0.000	1.065	19.933	37730	2.3	3.876	113	13.6	52.0	0.2	0.001	9749	9621	pg18beta2_o2nofp.cx10d_c32r128
qr500.L3
qr500.L3: range queries with 500 insert/s per client
Performance metrics for all DBMS, not just the ones listed above. Some are normalized by throughput, others are not. Legend for results is here.
ips	qps	rps	rmbps	wps	wmbps	rpq	rkbpq	wpi	wkbpi	csps	cpups	cspq	cpupq	dbgb1	dbgb2	rss	maxop	p50	p99	tag
499	18464	0	0.0	117.5	3.1	0.000	0.000	0.235	6.348	70773	2.1	3.833	55	13.7	51.2	0.5	0.003	18443	17632	pg174_o2nofp.cx10a_c32r128
499	17955	0	0.0	112.6	3.1	0.000	0.000	0.226	6.344	68844	2.1	3.834	56	13.7	50.9	0.5	0.003	17963	17116	pg175_o2nofp.cx10a_c32r128
499	18009	0	0.0	109.4	3.1	0.000	0.000	0.219	6.281	69001	2.1	3.831	56	13.6	51.6	0.5	0.004	17995	17052	pg18beta1_o2nofp.cx10b_c32r128
499	18168	0	0.0	110.8	3.1	0.000	0.000	0.222	6.297	69614	2.2	3.832	58	13.7	51.1	0.5	0.003	18123	17244	pg18beta1_o2nofp.cx10cw4_c32r128
499	17943	0	0.0	111.5	3.1	0.000	0.000	0.223	6.305	68757	2.2	3.832	59	13.7	50.1	0.5	0.004	17931	17036	pg18beta1_o2nofp.cx10d_c32r128
499	18204	0	0.0	108.4	3.1	0.000	0.000	0.217	6.309	69745	2.1	3.831	55	13.6	52.0	0.5	0.004	18219	17292	pg18beta2_o2nofp.cx10b_c32r128
499	18269	0	0.0	109.9	3.1	0.000	0.000	0.220	6.298	69995	2.1	3.831	55	13.6	50.4	0.5	0.003	18267	17404	pg18beta2_o2nofp.cx10cw4_c32r128
499	18257	0	0.0	109.0	3.1	0.000	0.000	0.218	6.295	69949	2.1	3.831	55	13.6	52.0	0.5	0.004	18283	17419	pg18beta2_o2nofp.cx10d_c32r128
qp500.L4
qp500.L4: point queries with 500 insert/s per client
Performance metrics for all DBMS, not just the ones listed above. Some are normalized by throughput, others are not. Legend for results is here.
ips	qps	rps	rmbps	wps	wmbps	rpq	rkbpq	wpi	wkbpi	csps	cpups	cspq	cpupq	dbgb1	dbgb2	rss	maxop	p50	p99	tag
499	9800	0	0.0	106.4	4.5	0.000	0.000	0.213	9.164	38128	2.8	3.891	137	13.7	51.3	0.6	0.001	9812	9733	pg174_o2nofp.cx10a_c32r128
499	9849	0	0.0	101.8	4.5	0.000	0.000	0.204	9.180	38292	2.3	3.888	112	13.8	51.0	0.5	0.001	9860	9733	pg175_o2nofp.cx10a_c32r128
499	9668	0	0.0	96.5	4.6	0.000	0.000	0.193	9.339	37570	2.2	3.886	109	13.6	51.6	0.4	0.001	9669	9605	pg18beta1_o2nofp.cx10b_c32r128
499	9872	0	0.0	100.9	4.6	0.000	0.000	0.202	9.374	38398	2.4	3.890	117	13.7	51.1	14.0	0.001	9877	9813	pg18beta1_o2nofp.cx10cw4_c32r128
499	9796	0	0.0	97.8	4.6	0.000	0.000	0.196	9.363	38089	2.5	3.888	122	13.7	50.1	0.4	0.001	9797	9717	pg18beta1_o2nofp.cx10d_c32r128
499	9771	0	0.0	97.8	4.6	0.000	0.000	0.196	9.345	37992	2.4	3.888	118	13.6	52.0	0.4	0.001	9765	9685	pg18beta2_o2nofp.cx10b_c32r128
499	9725	0	0.0	98.4	4.6	0.000	0.000	0.197	9.345	37794	2.3	3.886	114	13.6	50.4	0.4	0.001	9733	9621	pg18beta2_o2nofp.cx10cw4_c32r128
499	9682	0	0.0	99.0	4.6	0.000	0.000	0.198	9.386	37657	2.3	3.890	114	13.6	52.0	0.4	0.005	9685	9621	pg18beta2_o2nofp.cx10d_c32r128
qr1000.L5
qr1000.L5: range queries with 1000 insert/s per client
Performance metrics for all DBMS, not just the ones listed above. Some are normalized by throughput, others are not. Legend for results is here.
ips	qps	rps	rmbps	wps	wmbps	rpq	rkbpq	wpi	wkbpi	csps	cpups	cspq	cpupq	dbgb1	dbgb2	rss	maxop	p50	p99	tag
998	18108	0	0.0	123.4	5.0	0.000	0.000	0.124	5.102	69665	2.6	3.847	69	13.8	51.3	0.5	0.011	18298	15390	pg174_o2nofp.cx10a_c32r128
999	17744	0	0.0	116.3	4.9	0.000	0.000	0.116	5.072	68202	2.6	3.844	70	13.8	51.0	0.5	0.013	18011	15055	pg175_o2nofp.cx10a_c32r128
999	18064	0	0.0	96.2	5.1	0.000	0.000	0.096	5.190	69404	2.5	3.842	66	13.7	51.7	11.5	0.008	18171	16365	pg18beta1_o2nofp.cx10b_c32r128
999	18033	0	0.0	101.2	5.0	0.000	0.000	0.101	5.163	69288	2.6	3.842	69	13.7	51.1	0.5	0.008	18170	16301	pg18beta1_o2nofp.cx10cw4_c32r128
998	18048	0	0.0	100.2	5.1	0.000	0.000	0.100	5.187	69393	2.6	3.845	69	13.7	50.1	8.4	0.007	18235	16253	pg18beta1_o2nofp.cx10d_c32r128
999	18258	0	0.0	108.7	5.1	0.000	0.000	0.109	5.225	70208	2.6	3.845	68	13.7	52.0	0.5	0.008	18347	16685	pg18beta2_o2nofp.cx10b_c32r128
998	18163	0	0.0	100.5	5.0	0.000	0.000	0.101	5.168	69833	2.5	3.845	66	13.7	50.4	0.5	0.008	18283	16605	pg18beta2_o2nofp.cx10cw4_c32r128
998	18132	0	0.0	90.1	5.2	0.000	0.000	0.090	5.288	69707	2.6	3.844	69	13.7	52.0	8.2	0.006	18075	16541	pg18beta2_o2nofp.cx10d_c32r128
qp1000.L6
qp1000.L6: point queries with 1000 insert/s per client
Performance metrics for all DBMS, not just the ones listed above. Some are normalized by throughput, others are not. Legend for results is here.
ips	qps	rps	rmbps	wps	wmbps	rpq	rkbpq	wpi	wkbpi	csps	cpups	cspq	cpupq	dbgb1	dbgb2	rss	maxop	p50	p99	tag
999	9762	0	0.0	101.1	5.5	0.000	0.000	0.101	5.675	38196	2.5	3.913	123	13.8	51.4	13.9	0.102	9765	9685	pg174_o2nofp.cx10a_c32r128
999	9846	0	0.0	90.5	5.5	0.000	0.000	0.091	5.611	38464	2.3	3.907	112	13.8	51.0	0.6	0.001	9844	9781	pg175_o2nofp.cx10a_c32r128
999	9854	0	0.0	82.5	5.3	0.000	0.000	0.083	5.431	38492	2.4	3.906	117	13.7	51.7	0.5	0.004	9861	9765	pg18beta1_o2nofp.cx10b_c32r128
999	9842	0	0.0	84.0	5.3	0.000	0.000	0.084	5.394	38447	2.4	3.907	117	13.6	51.1	0.4	0.117	9860	9749	pg18beta1_o2nofp.cx10cw4_c32r128
999	9785	0	0.0	82.3	5.3	0.000	0.000	0.082	5.391	38224	2.5	3.906	123	13.7	50.1	0.5	0.001	9781	9701	pg18beta1_o2nofp.cx10d_c32r128
999	9870	0	0.0	91.3	5.3	0.000	0.000	0.091	5.441	38616	2.6	3.913	126	13.7	52.0	0.4	0.001	9877	9813	pg18beta2_o2nofp.cx10b_c32r128
998	9762	0	0.0	84.9	5.3	0.000	0.000	0.085	5.403	38167	2.4	3.910	118	13.7	50.4	0.4	0.001	9780	9685	pg18beta2_o2nofp.cx10cw4_c32r128
999	9669	0	0.0	73.1	5.3	0.000	0.000	0.073	5.467	37784	2.4	3.908	119	13.7	52.0	0.6	0.001	9669	9573	pg18beta2_o2nofp.cx10d_c32r128
l.i0
- l.i0: load without secondary indexes
- Legend for results is here.
- Each entry lists the percentage of responses that fit in that bucket (slower than max time for previous bucket, faster than min time for next bucket).
Insert response time histogram
256us	1ms	4ms	16ms	64ms	256ms	1s	4s	16s	gt	max	tag
0.000	99.999	nonzero	0.001	nonzero	0.000	0.000	0.000	0.000	0.000	0.017	pg174_o2nofp.cx10a_c32r128
0.000	99.999	0.001	nonzero	nonzero	0.000	0.000	0.000	0.000	0.000	0.019	pg175_o2nofp.cx10a_c32r128
0.000	99.998	0.001	0.001	0.000	0.000	0.000	0.000	0.000	0.000	0.008	pg18beta1_o2nofp.cx10b_c32r128
0.000	99.998	0.001	nonzero	nonzero	0.000	0.000	0.000	0.000	0.000	0.022	pg18beta1_o2nofp.cx10cw4_c32r128
0.000	99.998	0.001	nonzero	0.000	0.000	0.000	0.000	0.000	0.000	0.015	pg18beta1_o2nofp.cx10d_c32r128
0.000	99.999	0.001	0.001	0.000	0.000	0.000	0.000	0.000	0.000	0.008	pg18beta2_o2nofp.cx10b_c32r128
0.000	99.999	nonzero	0.001	nonzero	0.000	0.000	0.000	0.000	0.000	0.016	pg18beta2_o2nofp.cx10cw4_c32r128
0.000	99.999	0.001	0.001	0.000	0.000	0.000	0.000	0.000	0.000	0.014	pg18beta2_o2nofp.cx10d_c32r128
l.x
- l.x: create secondary indexes
- Legend for results is here.
- Each entry lists the percentage of responses that fit in that bucket (slower than max time for previous bucket, faster than min time for next bucket).
TODO - determine whether there is data for create index response time
l.i1
- l.i1: continue load after secondary indexes created with 50 inserts per transaction
- Legend for results is here.
- Each entry lists the percentage of responses that fit in that bucket (slower than max time for previous bucket, faster than min time for next bucket).
Insert response time histogram
256us	1ms	4ms	16ms	64ms	256ms	1s	4s	16s	gt	max	tag
0.000	34.470	65.529	0.001	0.000	nonzero	0.000	0.000	0.000	0.000	0.083	pg174_o2nofp.cx10a_c32r128
0.000	34.471	65.528	0.001	nonzero	0.000	0.000	0.000	0.000	0.000	0.023	pg175_o2nofp.cx10a_c32r128
0.000	29.032	70.968	0.001	nonzero	nonzero	0.000	0.000	0.000	0.000	0.082	pg18beta1_o2nofp.cx10b_c32r128
0.000	32.016	67.983	0.001	0.000	nonzero	0.000	0.000	0.000	0.000	0.085	pg18beta1_o2nofp.cx10cw4_c32r128
0.000	33.942	66.057	0.001	0.000	nonzero	0.000	0.000	0.000	0.000	0.093	pg18beta1_o2nofp.cx10d_c32r128
0.000	36.586	63.413	0.001	0.000	0.000	0.000	0.000	0.000	0.000	0.015	pg18beta2_o2nofp.cx10b_c32r128
0.000	36.697	63.302	0.001	0.000	nonzero	0.000	0.000	0.000	0.000	0.089	pg18beta2_o2nofp.cx10cw4_c32r128
0.000	36.017	63.982	0.001	0.000	0.000	0.000	0.000	0.000	0.000	0.015	pg18beta2_o2nofp.cx10d_c32r128
Delete response time histogram
256us	1ms	4ms	16ms	64ms	256ms	1s	4s	16s	gt	max	tag
0.000	11.980	39.286	48.734	nonzero	nonzero	0.000	0.000	0.000	0.000	0.084	pg174_o2nofp.cx10a_c32r128
0.000	12.036	39.610	48.354	nonzero	0.000	0.000	0.000	0.000	0.000	0.024	pg175_o2nofp.cx10a_c32r128
0.000	11.511	40.447	48.042	nonzero	nonzero	0.000	0.000	0.000	0.000	0.084	pg18beta1_o2nofp.cx10b_c32r128
0.000	11.659	40.027	48.314	nonzero	nonzero	0.000	0.000	0.000	0.000	0.086	pg18beta1_o2nofp.cx10cw4_c32r128
0.000	11.284	44.811	43.905	nonzero	nonzero	0.000	0.000	0.000	0.000	0.094	pg18beta1_o2nofp.cx10d_c32r128
0.000	11.949	38.323	49.728	nonzero	0.000	0.000	0.000	0.000	0.000	0.021	pg18beta2_o2nofp.cx10b_c32r128
0.000	11.883	44.497	43.620	0.000	nonzero	0.000	0.000	0.000	0.000	0.091	pg18beta2_o2nofp.cx10cw4_c32r128
0.000	11.979	38.383	49.638	nonzero	0.000	0.000	0.000	0.000	0.000	0.021	pg18beta2_o2nofp.cx10d_c32r128
l.i2
- l.i2: continue load after secondary indexes created with 5 inserts per transaction
- Legend for results is here.
- Each entry lists the percentage of responses that fit in that bucket (slower than max time for previous bucket, faster than min time for next bucket).
Insert response time histogram
256us	1ms	4ms	16ms	64ms	256ms	1s	4s	16s	gt	max	tag
32.101	67.899	nonzero	0.000	0.000	nonzero	0.000	0.000	0.000	0.000	0.081	pg174_o2nofp.cx10a_c32r128
30.741	69.259	nonzero	0.000	0.000	nonzero	0.000	0.000	0.000	0.000	0.087	pg175_o2nofp.cx10a_c32r128
40.482	59.518	nonzero	0.000	0.000	nonzero	0.000	0.000	0.000	0.000	0.088	pg18beta1_o2nofp.cx10b_c32r128
42.450	57.550	nonzero	0.000	0.000	0.000	0.000	0.000	0.000	0.000	0.002	pg18beta1_o2nofp.cx10cw4_c32r128
39.608	60.391	nonzero	0.000	0.000	nonzero	0.000	0.000	0.000	0.000	0.099	pg18beta1_o2nofp.cx10d_c32r128
44.402	55.598	nonzero	0.000	0.000	nonzero	0.000	0.000	0.000	0.000	0.096	pg18beta2_o2nofp.cx10b_c32r128
42.550	57.450	nonzero	0.000	0.000	nonzero	0.000	0.000	0.000	0.000	0.101	pg18beta2_o2nofp.cx10cw4_c32r128
40.420	59.580	nonzero	0.000	0.000	nonzero	0.000	0.000	0.000	0.000	0.100	pg18beta2_o2nofp.cx10d_c32r128
Delete response time histogram
256us	1ms	4ms	16ms	64ms	256ms	1s	4s	16s	gt	max	tag
0.972	9.473	61.597	27.958	nonzero	nonzero	0.000	0.000	0.000	0.000	0.081	pg174_o2nofp.cx10a_c32r128
0.882	10.625	59.694	28.799	nonzero	nonzero	0.000	0.000	0.000	0.000	0.088	pg175_o2nofp.cx10a_c32r128
0.788	17.876	58.204	23.131	nonzero	nonzero	0.000	0.000	0.000	0.000	0.089	pg18beta1_o2nofp.cx10b_c32r128
0.762	18.182	58.252	22.803	nonzero	0.000	0.000	0.000	0.000	0.000	0.029	pg18beta1_o2nofp.cx10cw4_c32r128
0.725	17.746	59.467	22.062	0.000	nonzero	0.000	0.000	0.000	0.000	0.100	pg18beta1_o2nofp.cx10d_c32r128
0.826	18.386	58.807	21.982	nonzero	nonzero	0.000	0.000	0.000	0.000	0.096	pg18beta2_o2nofp.cx10b_c32r128
0.806	17.837	58.926	22.431	nonzero	nonzero	0.000	0.000	0.000	0.000	0.102	pg18beta2_o2nofp.cx10cw4_c32r128
0.797	17.722	54.007	27.474	nonzero	nonzero	0.000	0.000	0.000	0.000	0.101	pg18beta2_o2nofp.cx10d_c32r128
qr100.L1
- qr100.L1: range queries with 100 insert/s per client
- Legend for results is here.
- Each entry lists the percentage of responses that fit in that bucket (slower than max time for previous bucket, faster than min time for next bucket).
Query response time histogram
256us	1ms	4ms	16ms	64ms	256ms	1s	4s	16s	gt	max	tag
100.000	nonzero	nonzero	0.000	0.000	0.000	0.000	0.000	0.000	0.000	0.001	pg174_o2nofp.cx10a_c32r128
100.000	nonzero	nonzero	0.000	0.000	0.000	0.000	0.000	0.000	0.000	0.001	pg175_o2nofp.cx10a_c32r128
100.000	nonzero	nonzero	0.000	0.000	0.000	0.000	0.000	0.000	0.000	0.002	pg18beta1_o2nofp.cx10b_c32r128
100.000	nonzero	nonzero	nonzero	0.000	0.000	0.000	0.000	0.000	0.000	0.004	pg18beta1_o2nofp.cx10cw4_c32r128
100.000	nonzero	nonzero	0.000	0.000	0.000	0.000	0.000	0.000	0.000	0.001	pg18beta1_o2nofp.cx10d_c32r128
100.000	nonzero	nonzero	0.000	0.000	0.000	0.000	0.000	0.000	0.000	0.001	pg18beta2_o2nofp.cx10b_c32r128
100.000	nonzero	nonzero	0.000	0.000	0.000	0.000	0.000	0.000	0.000	0.001	pg18beta2_o2nofp.cx10cw4_c32r128
100.000	nonzero	nonzero	0.000	0.000	0.000	0.000	0.000	0.000	0.000	0.001	pg18beta2_o2nofp.cx10d_c32r128
Insert response time histogram
256us	1ms	4ms	16ms	64ms	256ms	1s	4s	16s	gt	max	tag
0.000	0.000	99.861	0.139	0.000	0.000	0.000	0.000	0.000	0.000	0.008	pg174_o2nofp.cx10a_c32r128
0.000	0.000	99.861	0.139	0.000	0.000	0.000	0.000	0.000	0.000	0.008	pg175_o2nofp.cx10a_c32r128
0.000	0.000	99.861	0.139	0.000	0.000	0.000	0.000	0.000	0.000	0.008	pg18beta1_o2nofp.cx10b_c32r128
0.000	0.000	99.861	0.139	0.000	0.000	0.000	0.000	0.000	0.000	0.008	pg18beta1_o2nofp.cx10cw4_c32r128
0.000	0.000	99.861	0.139	0.000	0.000	0.000	0.000	0.000	0.000	0.008	pg18beta1_o2nofp.cx10d_c32r128
0.000	0.000	99.833	0.167	0.000	0.000	0.000	0.000	0.000	0.000	0.008	pg18beta2_o2nofp.cx10b_c32r128
0.000	0.000	99.861	0.139	0.000	0.000	0.000	0.000	0.000	0.000	0.008	pg18beta2_o2nofp.cx10cw4_c32r128
0.000	0.000	99.861	0.139	0.000	0.000	0.000	0.000	0.000	0.000	0.009	pg18beta2_o2nofp.cx10d_c32r128
Delete response time histogram
256us	1ms	4ms	16ms	64ms	256ms	1s	4s	16s	gt	max	tag
0.000	58.556	41.444	0.000	0.000	0.000	0.000	0.000	0.000	0.000	0.002	pg174_o2nofp.cx10a_c32r128
0.000	54.861	45.139	0.000	0.000	0.000	0.000	0.000	0.000	0.000	0.002	pg175_o2nofp.cx10a_c32r128
0.000	54.583	45.417	0.000	0.000	0.000	0.000	0.000	0.000	0.000	0.003	pg18beta1_o2nofp.cx10b_c32r128
0.000	51.889	48.111	0.000	0.000	0.000	0.000	0.000	0.000	0.000	0.003	pg18beta1_o2nofp.cx10cw4_c32r128
0.000	54.917	45.083	0.000	0.000	0.000	0.000	0.000	0.000	0.000	0.003	pg18beta1_o2nofp.cx10d_c32r128
0.000	56.361	43.639	0.000	0.000	0.000	0.000	0.000	0.000	0.000	0.003	pg18beta2_o2nofp.cx10b_c32r128
0.000	56.944	43.056	0.000	0.000	0.000	0.000	0.000	0.000	0.000	0.003	pg18beta2_o2nofp.cx10cw4_c32r128
0.000	56.611	43.389	0.000	0.000	0.000	0.000	0.000	0.000	0.000	0.003	pg18beta2_o2nofp.cx10d_c32r128
qp100.L2
- qp100.L2: point queries with 100 insert/s per client
- Legend for results is here.
- Each entry lists the percentage of responses that fit in that bucket (slower than max time for previous bucket, faster than min time for next bucket).
Query response time histogram
256us	1ms	4ms	16ms	64ms	256ms	1s	4s	16s	gt	max	tag
99.999	0.001	0.000	0.000	0.000	0.000	0.000	0.000	0.000	0.000	0.001	pg174_o2nofp.cx10a_c32r128
99.999	0.001	0.000	0.000	0.000	0.000	0.000	0.000	0.000	0.000	0.001	pg175_o2nofp.cx10a_c32r128
99.999	0.001	0.000	0.000	0.000	0.000	0.000	0.000	0.000	0.000	0.001	pg18beta1_o2nofp.cx10b_c32r128
99.999	0.001	0.000	0.000	0.000	0.000	0.000	0.000	0.000	0.000	0.001	pg18beta1_o2nofp.cx10cw4_c32r128
99.999	0.001	0.000	0.000	0.000	0.000	0.000	0.000	0.000	0.000	0.001	pg18beta1_o2nofp.cx10d_c32r128
99.999	0.001	0.000	nonzero	0.000	0.000	0.000	0.000	0.000	0.000	0.004	pg18beta2_o2nofp.cx10b_c32r128
99.999	0.001	0.000	0.000	0.000	0.000	0.000	0.000	0.000	0.000	0.001	pg18beta2_o2nofp.cx10cw4_c32r128
99.999	0.001	0.000	0.000	0.000	0.000	0.000	0.000	0.000	0.000	0.001	pg18beta2_o2nofp.cx10d_c32r128
Insert response time histogram
256us	1ms	4ms	16ms	64ms	256ms	1s	4s	16s	gt	max	tag
0.000	0.000	99.889	0.111	0.000	0.000	0.000	0.000	0.000	0.000	0.008	pg174_o2nofp.cx10a_c32r128
0.000	0.000	99.889	0.111	0.000	0.000	0.000	0.000	0.000	0.000	0.008	pg175_o2nofp.cx10a_c32r128
0.000	0.000	99.889	0.111	0.000	0.000	0.000	0.000	0.000	0.000	0.008	pg18beta1_o2nofp.cx10b_c32r128
0.000	0.000	99.889	0.111	0.000	0.000	0.000	0.000	0.000	0.000	0.008	pg18beta1_o2nofp.cx10cw4_c32r128
0.000	0.000	99.889	0.111	0.000	0.000	0.000	0.000	0.000	0.000	0.008	pg18beta1_o2nofp.cx10d_c32r128
0.000	0.000	99.861	0.139	0.000	0.000	0.000	0.000	0.000	0.000	0.009	pg18beta2_o2nofp.cx10b_c32r128
0.000	0.000	99.889	0.111	0.000	0.000	0.000	0.000	0.000	0.000	0.008	pg18beta2_o2nofp.cx10cw4_c32r128
0.000	0.000	99.889	0.111	0.000	0.000	0.000	0.000	0.000	0.000	0.008	pg18beta2_o2nofp.cx10d_c32r128
Delete response time histogram
256us	1ms	4ms	16ms	64ms	256ms	1s	4s	16s	gt	max	tag
0.000	0.000	99.972	0.028	0.000	0.000	0.000	0.000	0.000	0.000	0.006	pg174_o2nofp.cx10a_c32r128
0.000	0.000	99.972	0.028	0.000	0.000	0.000	0.000	0.000	0.000	0.007	pg175_o2nofp.cx10a_c32r128
0.000	0.000	99.972	0.028	0.000	0.000	0.000	0.000	0.000	0.000	0.007	pg18beta1_o2nofp.cx10b_c32r128
0.000	0.000	99.972	0.028	0.000	0.000	0.000	0.000	0.000	0.000	0.007	pg18beta1_o2nofp.cx10cw4_c32r128
0.000	0.000	99.972	0.028	0.000	0.000	0.000	0.000	0.000	0.000	0.007	pg18beta1_o2nofp.cx10d_c32r128
0.000	0.000	99.972	0.028	0.000	0.000	0.000	0.000	0.000	0.000	0.007	pg18beta2_o2nofp.cx10b_c32r128
0.000	0.000	99.972	0.028	0.000	0.000	0.000	0.000	0.000	0.000	0.007	pg18beta2_o2nofp.cx10cw4_c32r128
0.000	0.000	99.972	0.028	0.000	0.000	0.000	0.000	0.000	0.000	0.007	pg18beta2_o2nofp.cx10d_c32r128
qr500.L3
- qr500.L3: range queries with 500 insert/s per client
- Legend for results is here.
- Each entry lists the percentage of responses that fit in that bucket (slower than max time for previous bucket, faster than min time for next bucket).
Query response time histogram
256us	1ms	4ms	16ms	64ms	256ms	1s	4s	16s	gt	max	tag
100.000	nonzero	nonzero	0.000	0.000	0.000	0.000	0.000	0.000	0.000	0.003	pg174_o2nofp.cx10a_c32r128
100.000	nonzero	nonzero	0.000	0.000	0.000	0.000	0.000	0.000	0.000	0.003	pg175_o2nofp.cx10a_c32r128
99.999	0.001	nonzero	nonzero	0.000	0.000	0.000	0.000	0.000	0.000	0.004	pg18beta1_o2nofp.cx10b_c32r128
100.000	nonzero	nonzero	0.000	0.000	0.000	0.000	0.000	0.000	0.000	0.003	pg18beta1_o2nofp.cx10cw4_c32r128
100.000	nonzero	nonzero	0.000	0.000	0.000	0.000	0.000	0.000	0.000	0.004	pg18beta1_o2nofp.cx10d_c32r128
100.000	nonzero	nonzero	nonzero	0.000	0.000	0.000	0.000	0.000	0.000	0.004	pg18beta2_o2nofp.cx10b_c32r128
100.000	nonzero	nonzero	0.000	0.000	0.000	0.000	0.000	0.000	0.000	0.003	pg18beta2_o2nofp.cx10cw4_c32r128
100.000	nonzero	nonzero	0.000	0.000	0.000	0.000	0.000	0.000	0.000	0.004	pg18beta2_o2nofp.cx10d_c32r128
Insert response time histogram
256us	1ms	4ms	16ms	64ms	256ms	1s	4s	16s	gt	max	tag
0.000	7.956	92.028	0.017	0.000	0.000	0.000	0.000	0.000	0.000	0.008	pg174_o2nofp.cx10a_c32r128
0.000	8.317	91.661	0.022	0.000	0.000	0.000	0.000	0.000	0.000	0.008	pg175_o2nofp.cx10a_c32r128
0.000	7.567	92.411	0.022	0.000	0.000	0.000	0.000	0.000	0.000	0.008	pg18beta1_o2nofp.cx10b_c32r128
0.000	9.389	90.589	0.022	0.000	0.000	0.000	0.000	0.000	0.000	0.008	pg18beta1_o2nofp.cx10cw4_c32r128
0.000	8.094	91.883	0.022	0.000	0.000	0.000	0.000	0.000	0.000	0.008	pg18beta1_o2nofp.cx10d_c32r128
0.000	14.500	85.483	0.017	0.000	0.000	0.000	0.000	0.000	0.000	0.008	pg18beta2_o2nofp.cx10b_c32r128
0.000	11.839	88.139	0.022	0.000	0.000	0.000	0.000	0.000	0.000	0.008	pg18beta2_o2nofp.cx10cw4_c32r128
0.000	6.556	93.422	0.022	0.000	0.000	0.000	0.000	0.000	0.000	0.008	pg18beta2_o2nofp.cx10d_c32r128
Delete response time histogram
256us	1ms	4ms	16ms	64ms	256ms	1s	4s	16s	gt	max	tag
0.000	0.000	94.539	5.461	0.000	0.000	0.000	0.000	0.000	0.000	0.010	pg174_o2nofp.cx10a_c32r128
0.000	0.000	94.911	5.089	0.000	0.000	0.000	0.000	0.000	0.000	0.011	pg175_o2nofp.cx10a_c32r128
0.000	0.000	94.706	5.294	0.000	0.000	0.000	0.000	0.000	0.000	0.011	pg18beta1_o2nofp.cx10b_c32r128
0.000	0.000	94.278	5.722	0.000	0.000	0.000	0.000	0.000	0.000	0.011	pg18beta1_o2nofp.cx10cw4_c32r128
0.000	0.000	94.467	5.533	0.000	0.000	0.000	0.000	0.000	0.000	0.011	pg18beta1_o2nofp.cx10d_c32r128
0.000	0.000	95.378	4.622	0.000	0.000	0.000	0.000	0.000	0.000	0.011	pg18beta2_o2nofp.cx10b_c32r128
0.000	0.000	95.439	4.561	0.000	0.000	0.000	0.000	0.000	0.000	0.011	pg18beta2_o2nofp.cx10cw4_c32r128
0.000	0.000	95.550	4.450	0.000	0.000	0.000	0.000	0.000	0.000	0.011	pg18beta2_o2nofp.cx10d_c32r128
qp500.L4
- qp500.L4: point queries with 500 insert/s per client
- Legend for results is here.
- Each entry lists the percentage of responses that fit in that bucket (slower than max time for previous bucket, faster than min time for next bucket).
Query response time histogram
256us	1ms	4ms	16ms	64ms	256ms	1s	4s	16s	gt	max	tag
100.000	nonzero	0.000	0.000	0.000	0.000	0.000	0.000	0.000	0.000	0.001	pg174_o2nofp.cx10a_c32r128
99.999	0.001	nonzero	0.000	0.000	0.000	0.000	0.000	0.000	0.000	0.001	pg175_o2nofp.cx10a_c32r128
99.999	0.001	0.000	0.000	0.000	0.000	0.000	0.000	0.000	0.000	0.001	pg18beta1_o2nofp.cx10b_c32r128
99.999	0.001	0.000	0.000	0.000	0.000	0.000	0.000	0.000	0.000	0.001	pg18beta1_o2nofp.cx10cw4_c32r128
99.999	0.001	0.000	0.000	0.000	0.000	0.000	0.000	0.000	0.000	0.001	pg18beta1_o2nofp.cx10d_c32r128
99.999	0.001	0.000	0.000	0.000	0.000	0.000	0.000	0.000	0.000	0.001	pg18beta2_o2nofp.cx10b_c32r128
99.999	0.001	nonzero	0.000	0.000	0.000	0.000	0.000	0.000	0.000	0.001	pg18beta2_o2nofp.cx10cw4_c32r128
99.999	0.001	nonzero	nonzero	0.000	0.000	0.000	0.000	0.000	0.000	0.005	pg18beta2_o2nofp.cx10d_c32r128
Insert response time histogram
256us	1ms	4ms	16ms	64ms	256ms	1s	4s	16s	gt	max	tag
0.000	12.006	87.972	0.022	0.000	0.000	0.000	0.000	0.000	0.000	0.008	pg174_o2nofp.cx10a_c32r128
0.000	7.761	92.222	0.017	0.000	0.000	0.000	0.000	0.000	0.000	0.008	pg175_o2nofp.cx10a_c32r128
0.000	18.172	81.778	0.050	0.000	0.000	0.000	0.000	0.000	0.000	0.014	pg18beta1_o2nofp.cx10b_c32r128
0.000	17.972	81.967	0.056	0.006	0.000	0.000	0.000	0.000	0.000	0.023	pg18beta1_o2nofp.cx10cw4_c32r128
0.000	15.639	84.317	0.044	0.000	0.000	0.000	0.000	0.000	0.000	0.014	pg18beta1_o2nofp.cx10d_c32r128
0.000	23.278	76.672	0.039	0.011	0.000	0.000	0.000	0.000	0.000	0.023	pg18beta2_o2nofp.cx10b_c32r128
0.000	24.578	75.378	0.044	0.000	0.000	0.000	0.000	0.000	0.000	0.015	pg18beta2_o2nofp.cx10cw4_c32r128
0.000	15.750	84.200	0.044	0.006	0.000	0.000	0.000	0.000	0.000	0.016	pg18beta2_o2nofp.cx10d_c32r128
Delete response time histogram
256us	1ms	4ms	16ms	64ms	256ms	1s	4s	16s	gt	max	tag
0.000	0.000	46.294	53.700	0.006	0.000	0.000	0.000	0.000	0.000	0.022	pg174_o2nofp.cx10a_c32r128
0.000	0.000	46.083	53.911	0.006	0.000	0.000	0.000	0.000	0.000	0.024	pg175_o2nofp.cx10a_c32r128
0.000	31.678	63.089	5.228	0.006	0.000	0.000	0.000	0.000	0.000	0.023	pg18beta1_o2nofp.cx10b_c32r128
0.000	31.028	65.294	3.672	0.006	0.000	0.000	0.000	0.000	0.000	0.023	pg18beta1_o2nofp.cx10cw4_c32r128
0.000	30.517	65.500	3.978	0.006	0.000	0.000	0.000	0.000	0.000	0.024	pg18beta1_o2nofp.cx10d_c32r128
0.000	33.039	63.311	3.644	0.006	0.000	0.000	0.000	0.000	0.000	0.024	pg18beta2_o2nofp.cx10b_c32r128
0.000	33.033	62.922	4.039	0.006	0.000	0.000	0.000	0.000	0.000	0.023	pg18beta2_o2nofp.cx10cw4_c32r128
0.000	31.572	61.083	7.339	0.006	0.000	0.000	0.000	0.000	0.000	0.024	pg18beta2_o2nofp.cx10d_c32r128
qr1000.L5
- qr1000.L5: range queries with 1000 insert/s per client
- Legend for results is here.
- Each entry lists the percentage of responses that fit in that bucket (slower than max time for previous bucket, faster than min time for next bucket).
Query response time histogram
256us	1ms	4ms	16ms	64ms	256ms	1s	4s	16s	gt	max	tag
99.998	0.001	nonzero	nonzero	0.000	0.000	0.000	0.000	0.000	0.000	0.011	pg174_o2nofp.cx10a_c32r128
99.998	0.001	nonzero	nonzero	0.000	0.000	0.000	0.000	0.000	0.000	0.013	pg175_o2nofp.cx10a_c32r128
99.998	0.002	nonzero	nonzero	0.000	0.000	0.000	0.000	0.000	0.000	0.008	pg18beta1_o2nofp.cx10b_c32r128
99.998	0.002	nonzero	nonzero	0.000	0.000	0.000	0.000	0.000	0.000	0.008	pg18beta1_o2nofp.cx10cw4_c32r128
99.998	0.002	nonzero	nonzero	0.000	0.000	0.000	0.000	0.000	0.000	0.007	pg18beta1_o2nofp.cx10d_c32r128
99.998	0.002	nonzero	nonzero	0.000	0.000	0.000	0.000	0.000	0.000	0.008	pg18beta2_o2nofp.cx10b_c32r128
99.998	0.002	nonzero	nonzero	0.000	0.000	0.000	0.000	0.000	0.000	0.008	pg18beta2_o2nofp.cx10cw4_c32r128
99.998	0.002	nonzero	nonzero	0.000	0.000	0.000	0.000	0.000	0.000	0.006	pg18beta2_o2nofp.cx10d_c32r128
Insert response time histogram
256us	1ms	4ms	16ms	64ms	256ms	1s	4s	16s	gt	max	tag
0.000	41.878	58.106	0.017	0.000	0.000	0.000	0.000	0.000	0.000	0.014	pg174_o2nofp.cx10a_c32r128
0.000	40.172	59.814	0.014	0.000	0.000	0.000	0.000	0.000	0.000	0.013	pg175_o2nofp.cx10a_c32r128
0.000	29.133	70.858	0.008	0.000	0.000	0.000	0.000	0.000	0.000	0.008	pg18beta1_o2nofp.cx10b_c32r128
0.000	33.531	66.461	0.008	0.000	0.000	0.000	0.000	0.000	0.000	0.008	pg18beta1_o2nofp.cx10cw4_c32r128
0.000	31.206	68.786	0.008	0.000	0.000	0.000	0.000	0.000	0.000	0.008	pg18beta1_o2nofp.cx10d_c32r128
0.000	34.086	65.903	0.011	0.000	0.000	0.000	0.000	0.000	0.000	0.008	pg18beta2_o2nofp.cx10b_c32r128
0.000	32.219	67.772	0.008	0.000	0.000	0.000	0.000	0.000	0.000	0.008	pg18beta2_o2nofp.cx10cw4_c32r128
0.000	27.083	72.908	0.008	0.000	0.000	0.000	0.000	0.000	0.000	0.008	pg18beta2_o2nofp.cx10d_c32r128
Delete response time histogram
256us	1ms	4ms	16ms	64ms	256ms	1s	4s	16s	gt	max	tag
0.000	8.669	70.464	20.864	0.003	0.000	0.000	0.000	0.000	0.000	0.032	pg174_o2nofp.cx10a_c32r128
0.000	8.631	70.108	21.258	0.003	0.000	0.000	0.000	0.000	0.000	0.033	pg175_o2nofp.cx10a_c32r128
0.000	16.489	59.056	24.456	0.000	0.000	0.000	0.000	0.000	0.000	0.013	pg18beta1_o2nofp.cx10b_c32r128
0.000	17.056	60.047	22.897	0.000	0.000	0.000	0.000	0.000	0.000	0.014	pg18beta1_o2nofp.cx10cw4_c32r128
0.000	16.722	56.575	26.703	0.000	0.000	0.000	0.000	0.000	0.000	0.013	pg18beta1_o2nofp.cx10d_c32r128
0.000	16.994	59.417	23.589	0.000	0.000	0.000	0.000	0.000	0.000	0.014	pg18beta2_o2nofp.cx10b_c32r128
0.000	16.992	53.583	29.425	0.000	0.000	0.000	0.000	0.000	0.000	0.014	pg18beta2_o2nofp.cx10cw4_c32r128
0.000	17.461	63.292	19.247	0.000	0.000	0.000	0.000	0.000	0.000	0.011	pg18beta2_o2nofp.cx10d_c32r128
qp1000.L6
- qp1000.L6: point queries with 1000 insert/s per client
- Legend for results is here.
- Each entry lists the percentage of responses that fit in that bucket (slower than max time for previous bucket, faster than min time for next bucket).
Query response time histogram
256us	1ms	4ms	16ms	64ms	256ms	1s	4s	16s	gt	max	tag
99.999	0.001	nonzero	nonzero	0.000	nonzero	0.000	0.000	0.000	0.000	0.102	pg174_o2nofp.cx10a_c32r128
99.999	0.001	nonzero	0.000	0.000	0.000	0.000	0.000	0.000	0.000	0.001	pg175_o2nofp.cx10a_c32r128
99.999	0.001	nonzero	nonzero	0.000	0.000	0.000	0.000	0.000	0.000	0.004	pg18beta1_o2nofp.cx10b_c32r128
99.999	0.001	0.000	nonzero	0.000	nonzero	0.000	0.000	0.000	0.000	0.117	pg18beta1_o2nofp.cx10cw4_c32r128
99.999	0.001	nonzero	0.000	0.000	0.000	0.000	0.000	0.000	0.000	0.001	pg18beta1_o2nofp.cx10d_c32r128
99.999	0.001	0.000	0.000	0.000	0.000	0.000	0.000	0.000	0.000	0.001	pg18beta2_o2nofp.cx10b_c32r128
99.999	0.001	0.000	0.000	0.000	0.000	0.000	0.000	0.000	0.000	0.001	pg18beta2_o2nofp.cx10cw4_c32r128
99.999	0.001	0.000	0.000	0.000	0.000	0.000	0.000	0.000	0.000	0.001	pg18beta2_o2nofp.cx10d_c32r128
Insert response time histogram
256us	1ms	4ms	16ms	64ms	256ms	1s	4s	16s	gt	max	tag
0.000	28.492	71.497	0.011	0.000	0.000	0.000	0.000	0.000	0.000	0.014	pg174_o2nofp.cx10a_c32r128
0.000	24.025	75.964	0.011	0.000	0.000	0.000	0.000	0.000	0.000	0.012	pg175_o2nofp.cx10a_c32r128
0.000	33.383	66.606	0.011	0.000	0.000	0.000	0.000	0.000	0.000	0.013	pg18beta1_o2nofp.cx10b_c32r128
0.000	40.969	59.019	0.011	0.000	0.000	0.000	0.000	0.000	0.000	0.013	pg18beta1_o2nofp.cx10cw4_c32r128
0.000	39.417	60.572	0.011	0.000	0.000	0.000	0.000	0.000	0.000	0.013	pg18beta1_o2nofp.cx10d_c32r128
0.000	42.078	57.914	0.008	0.000	0.000	0.000	0.000	0.000	0.000	0.009	pg18beta2_o2nofp.cx10b_c32r128
0.000	42.461	57.531	0.008	0.000	0.000	0.000	0.000	0.000	0.000	0.008	pg18beta2_o2nofp.cx10cw4_c32r128
0.000	33.158	66.833	0.008	0.000	0.000	0.000	0.000	0.000	0.000	0.008	pg18beta2_o2nofp.cx10d_c32r128
Delete response time histogram
256us	1ms	4ms	16ms	64ms	256ms	1s	4s	16s	gt	max	tag
0.000	8.594	48.539	42.864	0.003	0.000	0.000	0.000	0.000	0.000	0.025	pg174_o2nofp.cx10a_c32r128
0.000	8.519	49.233	42.244	0.003	0.000	0.000	0.000	0.000	0.000	0.027	pg175_o2nofp.cx10a_c32r128
0.000	8.192	80.725	11.083	0.000	0.000	0.000	0.000	0.000	0.000	0.016	pg18beta1_o2nofp.cx10b_c32r128
0.000	8.036	89.175	2.786	0.003	0.000	0.000	0.000	0.000	0.000	0.018	pg18beta1_o2nofp.cx10cw4_c32r128
0.000	8.003	89.397	2.597	0.003	0.000	0.000	0.000	0.000	0.000	0.016	pg18beta1_o2nofp.cx10d_c32r128
0.000	8.381	89.042	2.575	0.003	0.000	0.000	0.000	0.000	0.000	0.017	pg18beta2_o2nofp.cx10b_c32r128
0.000	8.489	88.786	2.722	0.003	0.000	0.000	0.000	0.000	0.000	0.017	pg18beta2_o2nofp.cx10cw4_c32r128
0.000	16.511	56.511	26.978	0.000	0.000	0.000	0.000	0.000	0.000	0.012	pg18beta2_o2nofp.cx10d_c32r128