Introduction
This is a report for the insert benchmark with 200M docs and 20 client(s). It is generated by scripts (bash, awk, sed) and Tufte might not be impressed. An overview of the insert benchmark is here and a short update is here. Below, by DBMS, I mean DBMS+version.config. An example is my8020.c10b40 where my means MySQL, 8020 is version 8.0.20 and c10b40 is the name for the configuration file.
The test server has 48 AMD cores, 128G RAM and RAID 10 with 2 NVMe devices. It is described here. The benchmark was run with 20 clients and there were 1 or 3 connections per client (1 for queries or inserts without rate limits, 1+1 for rate limited inserts+deletes). It uses 20 tables with a table per client. It loads 10M rows per table without secondary indexes, creates 3 secondary indexes per table, then inserts 16m+4m rows per table with a delete per insert to avoid growing the table. It then does 6 read+write tests for 1800s each that do queries as fast as possible with 100,100,500,500,1000,1000 inserts/s and the same for deletes/s per client concurrent with the queries. The database is cached by Postgres. Clients and the DBMS share one server. The per-database configs are in the per-database subdirectories here.
The tested DBMS are:
- pg174_o2nofp.cx10a_c32r128 - Postgres 17.4 with the cx10a_c32r128 config
- pg175_o2nofp.cx10a_c32r128 - Postgres 17.5 with the cx10a_c32r128 config
- pg18beta1_o2nofp.cx10b_c32r128 - Postgres 18 beta1 with the cx10b_c32r128 config that uses io_method='sync'
- pg18beta1_o2nofp.cx10cw4_c32r128 - Postgres 18 beta1 with the cx10cw4_c32r128 config that uses io_method='worker' and io_workers=4
- pg18beta1_o2nofp.cx10d_c32r128 - Postgres 18 beta1 with the cx10d_c32r128 config that uses io_method='io_uring'
- pg18beta2_o2nofp.cx10b_c32r128 - Postgres 18 beta1 with the cx10b_c32r128 config that uses io_method='sync'
- pg18beta2_o2nofp.cx10cw4_c32r128 - Postgres 18 beta2 with the cx10cw4_c32r128 config that uses io_method='worker' and io_workers=4
- pg18beta2_o2nofp.cx10d_c32r128 - Postgres 18 beta1 with the cx10d_c32r128 config that uses io_method='io_uring'
Contents
- Summary
- l.i0: load without secondary indexes
- l.x: create secondary indexes
- l.i1: continue load after secondary indexes created with 50 inserts per transaction
- l.i2: continue load after secondary indexes created with 5 inserts per transaction
- qr100.L1: range queries with 100 insert/s per client
- qp100.L2: point queries with 100 insert/s per client
- qr500.L3: range queries with 500 insert/s per client
- qp500.L4: point queries with 500 insert/s per client
- qr1000.L5: range queries with 1000 insert/s per client
- qp1000.L6: point queries with 1000 insert/s per client
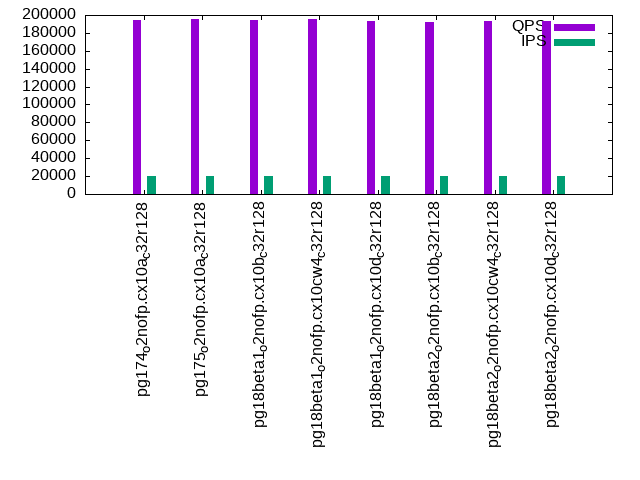
Summary
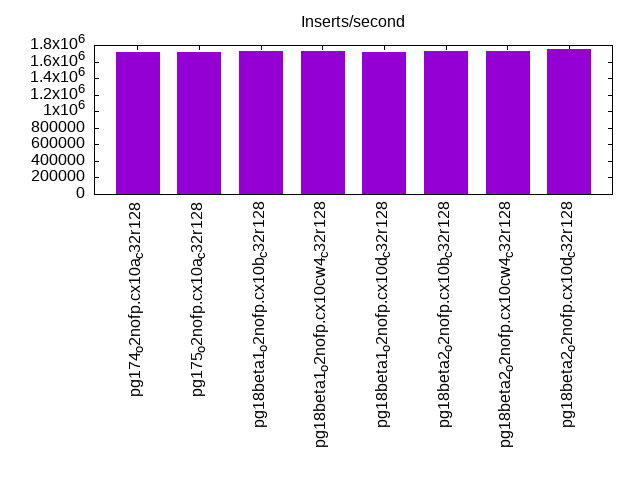
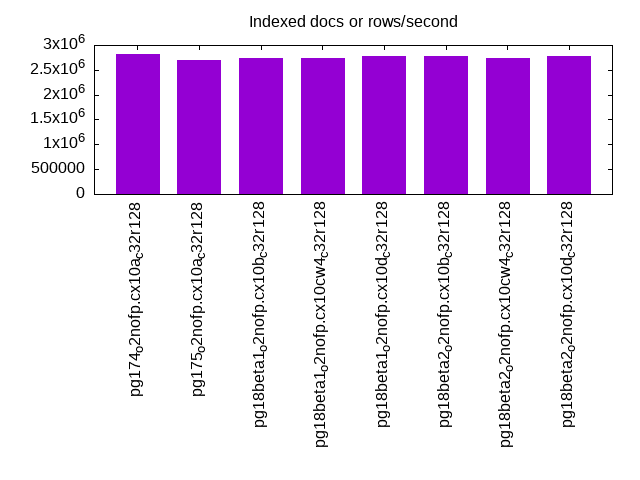
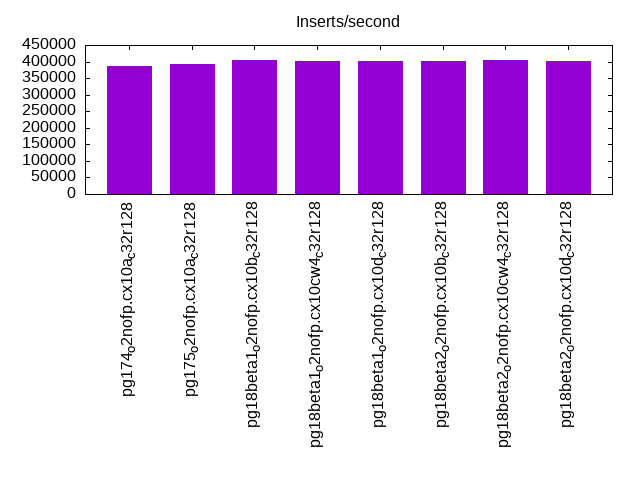
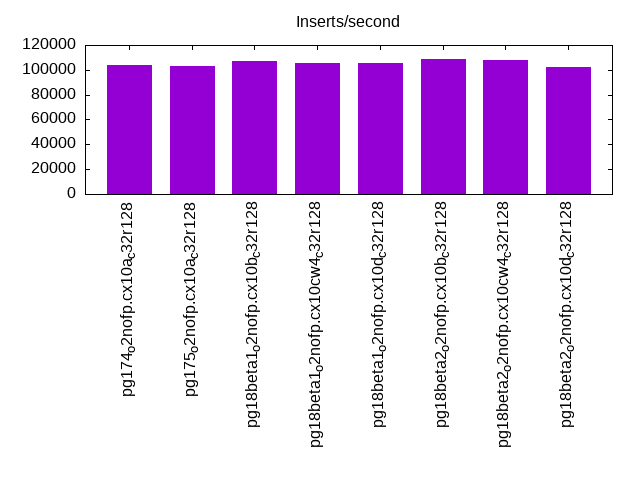
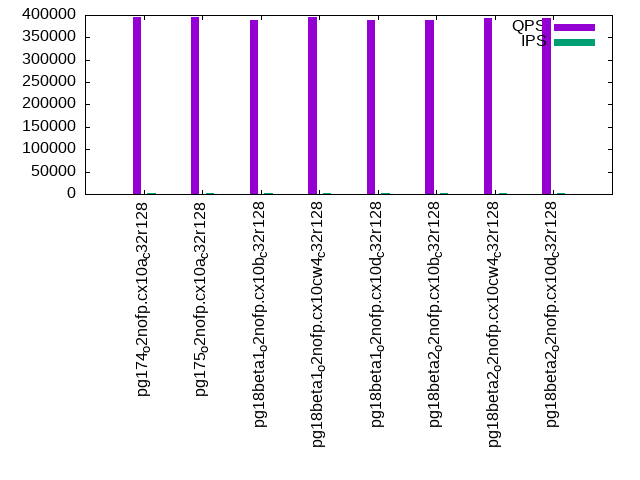
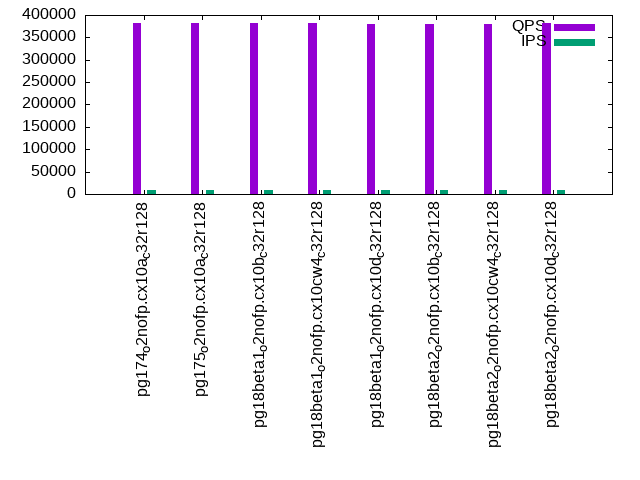
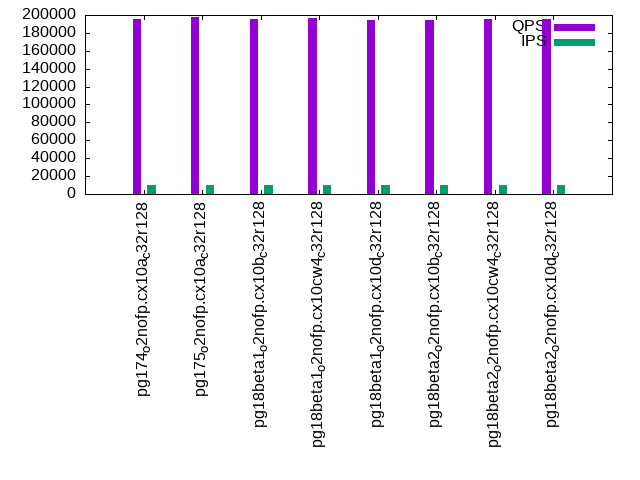
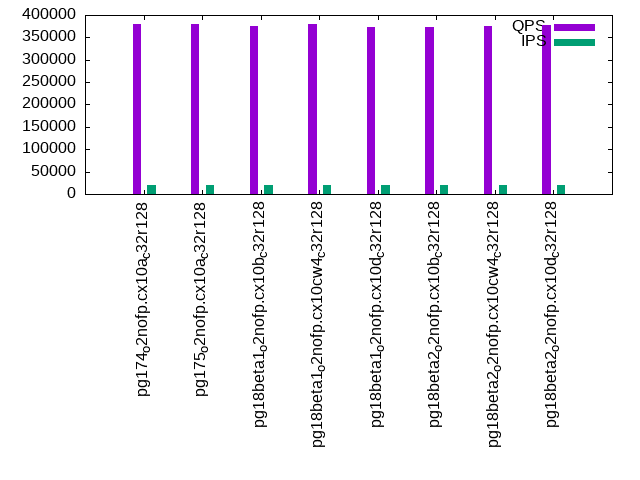
The numbers are inserts/s for l.i0, l.i1 and l.i2, indexed docs (or rows) /s for l.x and queries/s for qr100, qp100 thru qr1000, qp1000" The values are the average rate over the entire test for inserts (IPS) and queries (QPS). The range of values for IPS and QPS is split into 3 parts: bottom 25%, middle 50%, top 25%. Values in the bottom 25% have a red background, values in the top 25% have a green background and values in the middle have no color. A gray background is used for values that can be ignored because the DBMS did not sustain the target insert rate. Red backgrounds are not used when the minimum value is within 80% of the max value.
| dbms | l.i0 | l.x | l.i1 | l.i2 | qr100 | qp100 | qr500 | qp500 | qr1000 | qp1000 |
|---|---|---|---|---|---|---|---|---|---|---|
| pg174_o2nofp.cx10a_c32r128 | 1709402 | 2816903 | 386007 | 104167 | 395158 | 197320 | 382722 | 195661 | 379160 | 194506 |
| pg175_o2nofp.cx10a_c32r128 | 1709402 | 2702704 | 394089 | 102960 | 395337 | 198067 | 382515 | 197586 | 378895 | 196025 |
| pg18beta1_o2nofp.cx10b_c32r128 | 1724138 | 2739727 | 403531 | 107095 | 389626 | 196234 | 381016 | 195721 | 375844 | 193883 |
| pg18beta1_o2nofp.cx10cw4_c32r128 | 1724138 | 2739727 | 402516 | 105263 | 394628 | 197758 | 382306 | 196855 | 380142 | 195350 |
| pg18beta1_o2nofp.cx10d_c32r128 | 1709402 | 2777779 | 402010 | 105402 | 387844 | 195817 | 380116 | 194291 | 372142 | 193014 |
| pg18beta2_o2nofp.cx10b_c32r128 | 1724138 | 2777779 | 402516 | 108844 | 388556 | 195689 | 378877 | 194856 | 374028 | 192619 |
| pg18beta2_o2nofp.cx10cw4_c32r128 | 1724138 | 2739727 | 404551 | 107527 | 393904 | 195961 | 380643 | 195419 | 375702 | 193496 |
| pg18beta2_o2nofp.cx10d_c32r128 | 1754386 | 2777779 | 400501 | 102302 | 392702 | 196612 | 382885 | 195338 | 377862 | 193708 |
This table has relative throughput, throughput for the DBMS relative to the DBMS in the first line, using the absolute throughput from the previous table. Values less than 0.95 have a yellow background. Values greater than 1.05 have a blue background.
| dbms | l.i0 | l.x | l.i1 | l.i2 | qr100 | qp100 | qr500 | qp500 | qr1000 | qp1000 |
|---|---|---|---|---|---|---|---|---|---|---|
| pg174_o2nofp.cx10a_c32r128 | 1.00 | 1.00 | 1.00 | 1.00 | 1.00 | 1.00 | 1.00 | 1.00 | 1.00 | 1.00 |
| pg175_o2nofp.cx10a_c32r128 | 1.00 | 0.96 | 1.02 | 0.99 | 1.00 | 1.00 | 1.00 | 1.01 | 1.00 | 1.01 |
| pg18beta1_o2nofp.cx10b_c32r128 | 1.01 | 0.97 | 1.05 | 1.03 | 0.99 | 0.99 | 1.00 | 1.00 | 0.99 | 1.00 |
| pg18beta1_o2nofp.cx10cw4_c32r128 | 1.01 | 0.97 | 1.04 | 1.01 | 1.00 | 1.00 | 1.00 | 1.01 | 1.00 | 1.00 |
| pg18beta1_o2nofp.cx10d_c32r128 | 1.00 | 0.99 | 1.04 | 1.01 | 0.98 | 0.99 | 0.99 | 0.99 | 0.98 | 0.99 |
| pg18beta2_o2nofp.cx10b_c32r128 | 1.01 | 0.99 | 1.04 | 1.04 | 0.98 | 0.99 | 0.99 | 1.00 | 0.99 | 0.99 |
| pg18beta2_o2nofp.cx10cw4_c32r128 | 1.01 | 0.97 | 1.05 | 1.03 | 1.00 | 0.99 | 0.99 | 1.00 | 0.99 | 0.99 |
| pg18beta2_o2nofp.cx10d_c32r128 | 1.03 | 0.99 | 1.04 | 0.98 | 0.99 | 1.00 | 1.00 | 1.00 | 1.00 | 1.00 |
This lists the average rate of inserts/s for the tests that do inserts concurrent with queries. For such tests the query rate is listed in the table above. The read+write tests are setup so that the insert rate should match the target rate every second. Cells that are not at least 95% of the target have a red background to indicate a failure to satisfy the target.
| dbms | qr100.L1 | qp100.L2 | qr500.L3 | qp500.L4 | qr1000.L5 | qp1000.L6 |
|---|---|---|---|---|---|---|
| pg174_o2nofp.cx10a_c32r128 | 1977 | 1977 | 9885 | 9885 | 19758 | 19758 |
| pg175_o2nofp.cx10a_c32r128 | 1977 | 1977 | 9874 | 9885 | 19758 | 19758 |
| pg18beta1_o2nofp.cx10b_c32r128 | 1976 | 1977 | 9879 | 9879 | 19758 | 19758 |
| pg18beta1_o2nofp.cx10cw4_c32r128 | 1977 | 1977 | 9885 | 9885 | 19758 | 19758 |
| pg18beta1_o2nofp.cx10d_c32r128 | 1977 | 1978 | 9885 | 9879 | 19758 | 19758 |
| pg18beta2_o2nofp.cx10b_c32r128 | 1977 | 1977 | 9885 | 9885 | 19758 | 19758 |
| pg18beta2_o2nofp.cx10cw4_c32r128 | 1977 | 1977 | 9885 | 9885 | 19758 | 19758 |
| pg18beta2_o2nofp.cx10d_c32r128 | 1977 | 1977 | 9885 | 9885 | 19758 | 19758 |
| target | 2000 | 2000 | 10000 | 10000 | 20000 | 20000 |
l.i0
l.i0: load without secondary indexes. Graphs for performance per 1-second interval are here.
Average throughput:
Insert response time histogram: each cell has the percentage of responses that take <= the time in the header and max is the max response time in seconds. For the max column values in the top 25% of the range have a red background and in the bottom 25% of the range have a green background. The red background is not used when the min value is within 80% of the max value.
| dbms | 256us | 1ms | 4ms | 16ms | 64ms | 256ms | 1s | 4s | 16s | gt | max |
|---|---|---|---|---|---|---|---|---|---|---|---|
| pg174_o2nofp.cx10a_c32r128 | 94.027 | 5.940 | 0.015 | 0.002 | 0.010 | 0.006 | 0.639 | ||||
| pg175_o2nofp.cx10a_c32r128 | 94.811 | 5.148 | 0.019 | 0.003 | 0.012 | 0.006 | 0.634 | ||||
| pg18beta1_o2nofp.cx10b_c32r128 | 95.284 | 4.661 | 0.025 | 0.013 | 0.012 | 0.005 | 0.451 | ||||
| pg18beta1_o2nofp.cx10cw4_c32r128 | 95.602 | 4.350 | 0.020 | 0.011 | 0.010 | 0.008 | 0.544 | ||||
| pg18beta1_o2nofp.cx10d_c32r128 | 95.422 | 4.534 | 0.021 | 0.007 | 0.009 | 0.007 | 0.550 | ||||
| pg18beta2_o2nofp.cx10b_c32r128 | 95.921 | 4.027 | 0.024 | 0.012 | 0.009 | 0.007 | 0.597 | ||||
| pg18beta2_o2nofp.cx10cw4_c32r128 | 95.562 | 4.383 | 0.023 | 0.013 | 0.014 | 0.005 | 0.485 | ||||
| pg18beta2_o2nofp.cx10d_c32r128 | 95.773 | 4.169 | 0.028 | 0.013 | 0.014 | 0.004 | 0.379 |
Performance metrics for the DBMS listed above. Some are normalized by throughput, others are not. Legend for results is here.
ips	qps	rps	rmbps	wps	wmbps	rpq	rkbpq	wpi	wkbpi	csps	cpups	cspq	cpupq	dbgb1	dbgb2	rss	maxop	p50	p99	tag
1709402	0	1	0.0	6861.5	722.7	0.000	0.000	0.004	0.433	287250	45.3	0.168	13	19.1	51.7	1.4	0.639	112979	41556	pg174_o2nofp.cx10a_c32r128
1709402	0	4	0.0	6917.3	730.3	0.000	0.000	0.004	0.437	276641	47.2	0.162	13	19.1	51.7	1.4	0.634	113944	40887	pg175_o2nofp.cx10a_c32r128
1724138	0	77	2.2	6848.9	724.0	0.000	0.001	0.004	0.430	264641	47.5	0.153	13	19.1	51.7	1.4	0.451	114777	55141	pg18beta1_o2nofp.cx10b_c32r128
1724138	0	4	0.0	6889.5	730.9	0.000	0.000	0.004	0.434	267553	46.9	0.155	13	19.1	51.7	1.4	0.544	115962	45751	pg18beta1_o2nofp.cx10cw4_c32r128
1709402	0	4	0.0	6797.1	719.9	0.000	0.000	0.004	0.431	268945	46.9	0.157	13	19.1	51.7	7.9	0.550	115276	45851	pg18beta1_o2nofp.cx10d_c32r128
1724138	0	4	0.0	6839.3	724.7	0.000	0.000	0.004	0.430	263266	46.7	0.153	13	19.1	51.7	0.5	0.597	116425	43167	pg18beta2_o2nofp.cx10b_c32r128
1724138	0	3	0.0	6844.8	724.4	0.000	0.000	0.004	0.430	265107	46.9	0.154	13	19.1	51.7	0.4	0.485	116775	47748	pg18beta2_o2nofp.cx10cw4_c32r128
1754386	0	4	0.0	6881.9	729.4	0.000	0.000	0.004	0.426	266590	46.6	0.152	13	19.1	51.7	11.6	0.379	116175	45351	pg18beta2_o2nofp.cx10d_c32r128
l.x
l.x: create secondary indexes.
Average throughput:
Performance metrics for the DBMS listed above. Some are normalized by throughput, others are not. Legend for results is here.
ips	qps	rps	rmbps	wps	wmbps	rpq	rkbpq	wpi	wkbpi	csps	cpups	cspq	cpupq	dbgb1	dbgb2	rss	maxop	p50	p99	tag
2816903	0	0	0.0	7278.5	845.3	0.000	0.000	0.003	0.307	41312	15.9	0.015	3	38.4	88.5	7.2	0.043	NA	NA	pg174_o2nofp.cx10a_c32r128
2702704	0	4	0.0	6783.6	787.8	0.000	0.000	0.003	0.298	41634	16.6	0.015	3	38.4	88.5	6.4	0.036	NA	NA	pg175_o2nofp.cx10a_c32r128
2739727	0	5	0.0	7214.5	835.9	0.000	0.000	0.003	0.312	35705	17.4	0.013	3	38.4	88.5	6.4	0.036	NA	NA	pg18beta1_o2nofp.cx10b_c32r128
2739727	0	5	0.0	7036.3	817.1	0.000	0.000	0.003	0.305	36225	17.4	0.013	3	38.4	88.5	6.4	0.043	NA	NA	pg18beta1_o2nofp.cx10cw4_c32r128
2777779	0	5	0.0	7269.5	844.4	0.000	0.000	0.003	0.311	35652	17.4	0.013	3	38.4	88.5	6.4	0.036	NA	NA	pg18beta1_o2nofp.cx10d_c32r128
2777779	0	5	0.0	7221.6	838.3	0.000	0.000	0.003	0.309	35312	17.6	0.013	3	38.4	88.5	7.2	0.027	NA	NA	pg18beta2_o2nofp.cx10b_c32r128
2739727	0	5	0.0	7201.3	835.8	0.000	0.000	0.003	0.312	36362	17.5	0.013	3	38.4	88.5	6.4	0.044	NA	NA	pg18beta2_o2nofp.cx10cw4_c32r128
2777779	0	5	0.0	7382.7	857.2	0.000	0.000	0.003	0.316	36698	17.5	0.013	3	38.4	88.5	7.1	0.034	NA	NA	pg18beta2_o2nofp.cx10d_c32r128
l.i1
l.i1: continue load after secondary indexes created with 50 inserts per transaction. Graphs for performance per 1-second interval are here.
Average throughput:
Insert response time histogram: each cell has the percentage of responses that take <= the time in the header and max is the max response time in seconds. For the max column values in the top 25% of the range have a red background and in the bottom 25% of the range have a green background. The red background is not used when the min value is within 80% of the max value.
| dbms | 256us | 1ms | 4ms | 16ms | 64ms | 256ms | 1s | 4s | 16s | gt | max |
|---|---|---|---|---|---|---|---|---|---|---|---|
| pg174_o2nofp.cx10a_c32r128 | 2.012 | 89.825 | 7.624 | 0.532 | 0.006 | 0.001 | 0.998 | ||||
| pg175_o2nofp.cx10a_c32r128 | 2.045 | 90.037 | 7.370 | 0.543 | 0.004 | 0.001 | 0.703 | ||||
| pg18beta1_o2nofp.cx10b_c32r128 | 1.966 | 90.856 | 6.537 | 0.636 | 0.005 | nonzero | 0.598 | ||||
| pg18beta1_o2nofp.cx10cw4_c32r128 | 1.781 | 90.640 | 6.970 | 0.605 | 0.003 | 0.001 | 0.490 | ||||
| pg18beta1_o2nofp.cx10d_c32r128 | 1.593 | 90.759 | 7.010 | 0.632 | 0.005 | 0.001 | 0.474 | ||||
| pg18beta2_o2nofp.cx10b_c32r128 | 2.091 | 90.756 | 6.528 | 0.620 | 0.004 | 0.001 | 0.700 | ||||
| pg18beta2_o2nofp.cx10cw4_c32r128 | 1.820 | 90.748 | 6.811 | 0.615 | 0.005 | 0.001 | 0.452 | ||||
| pg18beta2_o2nofp.cx10d_c32r128 | 1.950 | 90.572 | 6.846 | 0.626 | 0.005 | 0.001 | 0.738 |
Delete response time histogram: each cell has the percentage of responses that take <= the time in the header and max is the max response time in seconds. For the max column values in the top 25% of the range have a red background and in the bottom 25% of the range have a green background. The red background is not used when the min value is within 80% of the max value.
| dbms | 256us | 1ms | 4ms | 16ms | 64ms | 256ms | 1s | 4s | 16s | gt | max |
|---|---|---|---|---|---|---|---|---|---|---|---|
| pg174_o2nofp.cx10a_c32r128 | 20.618 | 76.103 | 3.026 | 0.249 | 0.004 | nonzero | nonzero | 1.074 | |||
| pg175_o2nofp.cx10a_c32r128 | 20.908 | 75.901 | 2.935 | 0.252 | 0.003 | 0.001 | 0.702 | ||||
| pg18beta1_o2nofp.cx10b_c32r128 | 20.957 | 76.010 | 2.691 | 0.338 | 0.004 | nonzero | 0.598 | ||||
| pg18beta1_o2nofp.cx10cw4_c32r128 | 20.820 | 76.204 | 2.657 | 0.316 | 0.002 | nonzero | 0.494 | ||||
| pg18beta1_o2nofp.cx10d_c32r128 | 21.072 | 75.904 | 2.681 | 0.340 | 0.003 | 0.001 | 0.464 | ||||
| pg18beta2_o2nofp.cx10b_c32r128 | 20.652 | 76.423 | 2.594 | 0.328 | 0.003 | nonzero | 0.685 | ||||
| pg18beta2_o2nofp.cx10cw4_c32r128 | 22.199 | 75.114 | 2.374 | 0.308 | 0.004 | nonzero | 0.450 | ||||
| pg18beta2_o2nofp.cx10d_c32r128 | 21.555 | 75.611 | 2.507 | 0.324 | 0.003 | nonzero | 0.737 |
Performance metrics for the DBMS listed above. Some are normalized by throughput, others are not. Legend for results is here.
ips	qps	rps	rmbps	wps	wmbps	rpq	rkbpq	wpi	wkbpi	csps	cpups	cspq	cpupq	dbgb1	dbgb2	rss	maxop	p50	p99	tag
386007	0	686	3.1	6263.2	599.6	0.002	0.008	0.016	1.591	248886	52.2	0.645	65	55.9	152.0	23.9	0.998	22675	3146	pg174_o2nofp.cx10a_c32r128
394089	0	724	3.2	6446.9	612.1	0.002	0.008	0.016	1.590	251099	53.5	0.637	65	55.9	152.0	10.7	0.703	22930	3346	pg175_o2nofp.cx10a_c32r128
403531	0	90	0.4	6647.7	631.5	0.000	0.001	0.016	1.602	247938	54.5	0.614	65	56.2	152.2	32.1	0.598	23257	3596	pg18beta1_o2nofp.cx10b_c32r128
402516	0	87	0.5	6555.0	624.7	0.000	0.001	0.016	1.589	261059	54.2	0.649	65	55.8	151.9	21.5	0.490	22885	3546	pg18beta1_o2nofp.cx10cw4_c32r128
402010	0	111	0.5	6598.0	629.0	0.000	0.001	0.016	1.602	258977	54.3	0.644	65	55.9	152.0	27.6	0.474	22894	3596	pg18beta1_o2nofp.cx10d_c32r128
402516	0	93	0.4	6592.5	627.9	0.000	0.001	0.016	1.597	248074	54.4	0.616	65	56.6	152.7	34.4	0.700	23275	3348	pg18beta2_o2nofp.cx10b_c32r128
404551	0	90	0.5	6604.7	627.1	0.000	0.001	0.016	1.587	263144	53.8	0.650	64	55.9	151.9	37.8	0.452	23020	3496	pg18beta2_o2nofp.cx10cw4_c32r128
400501	0	95	0.5	6551.3	623.6	0.000	0.001	0.016	1.594	254150	53.6	0.635	64	55.9	152.0	35.4	0.738	23075	3498	pg18beta2_o2nofp.cx10d_c32r128
l.i2
l.i2: continue load after secondary indexes created with 5 inserts per transaction. Graphs for performance per 1-second interval are here.
Average throughput:
Insert response time histogram: each cell has the percentage of responses that take <= the time in the header and max is the max response time in seconds. For the max column values in the top 25% of the range have a red background and in the bottom 25% of the range have a green background. The red background is not used when the min value is within 80% of the max value.
| dbms | 256us | 1ms | 4ms | 16ms | 64ms | 256ms | 1s | 4s | 16s | gt | max |
|---|---|---|---|---|---|---|---|---|---|---|---|
| pg174_o2nofp.cx10a_c32r128 | 92.669 | 7.123 | 0.199 | 0.009 | nonzero | nonzero | 0.071 | ||||
| pg175_o2nofp.cx10a_c32r128 | 92.783 | 7.022 | 0.181 | 0.014 | nonzero | 0.064 | |||||
| pg18beta1_o2nofp.cx10b_c32r128 | 92.168 | 7.621 | 0.186 | 0.024 | nonzero | 0.063 | |||||
| pg18beta1_o2nofp.cx10cw4_c32r128 | 92.477 | 7.328 | 0.176 | 0.019 | 0.001 | nonzero | 0.068 | ||||
| pg18beta1_o2nofp.cx10d_c32r128 | 92.673 | 7.138 | 0.174 | 0.015 | nonzero | 0.063 | |||||
| pg18beta2_o2nofp.cx10b_c32r128 | 92.142 | 7.663 | 0.186 | 0.009 | nonzero | 0.019 | |||||
| pg18beta2_o2nofp.cx10cw4_c32r128 | 92.561 | 7.243 | 0.188 | 0.009 | nonzero | nonzero | 0.070 | ||||
| pg18beta2_o2nofp.cx10d_c32r128 | 92.413 | 7.397 | 0.175 | 0.015 | nonzero | 0.061 |
Delete response time histogram: each cell has the percentage of responses that take <= the time in the header and max is the max response time in seconds. For the max column values in the top 25% of the range have a red background and in the bottom 25% of the range have a green background. The red background is not used when the min value is within 80% of the max value.
| dbms | 256us | 1ms | 4ms | 16ms | 64ms | 256ms | 1s | 4s | 16s | gt | max |
|---|---|---|---|---|---|---|---|---|---|---|---|
| pg174_o2nofp.cx10a_c32r128 | 3.208 | 59.110 | 37.638 | 0.044 | nonzero | nonzero | 0.072 | ||||
| pg175_o2nofp.cx10a_c32r128 | 3.302 | 56.252 | 40.389 | 0.057 | nonzero | nonzero | 0.064 | ||||
| pg18beta1_o2nofp.cx10b_c32r128 | 2.584 | 62.020 | 35.320 | 0.075 | 0.001 | 0.064 | |||||
| pg18beta1_o2nofp.cx10cw4_c32r128 | 2.701 | 61.289 | 35.942 | 0.067 | 0.001 | nonzero | 0.068 | ||||
| pg18beta1_o2nofp.cx10d_c32r128 | 2.725 | 60.149 | 37.066 | 0.058 | 0.001 | 0.063 | |||||
| pg18beta2_o2nofp.cx10b_c32r128 | 2.594 | 65.027 | 32.330 | 0.049 | nonzero | 0.026 | |||||
| pg18beta2_o2nofp.cx10cw4_c32r128 | 2.645 | 63.564 | 33.741 | 0.049 | nonzero | nonzero | 0.070 | ||||
| pg18beta2_o2nofp.cx10d_c32r128 | 2.683 | 62.363 | 34.893 | 0.060 | 0.001 | 0.061 |
Performance metrics for the DBMS listed above. Some are normalized by throughput, others are not. Legend for results is here.
ips	qps	rps	rmbps	wps	wmbps	rpq	rkbpq	wpi	wkbpi	csps	cpups	cspq	cpupq	dbgb1	dbgb2	rss	maxop	p50	p99	tag
104167	0	1	0.0	1555.6	148.7	0.000	0.000	0.015	1.462	390251	53.0	3.746	244	56.1	152.2	1.2	0.071	4036	2447	pg174_o2nofp.cx10a_c32r128
102960	0	0	0.0	1569.2	149.7	0.000	0.000	0.015	1.489	386972	53.1	3.758	248	56.2	152.2	12.6	0.064	4287	3061	pg175_o2nofp.cx10a_c32r128
107095	0	1	0.0	1600.1	153.6	0.000	0.000	0.015	1.469	398333	54.6	3.719	245	56.4	152.5	5.6	0.063	5079	2233	pg18beta1_o2nofp.cx10b_c32r128
105263	0	0	0.0	1583.0	152.0	0.000	0.000	0.015	1.478	391081	53.8	3.715	245	56.0	152.1	38.5	0.068	4945	2248	pg18beta1_o2nofp.cx10cw4_c32r128
105402	0	1	0.0	1551.7	148.6	0.000	0.000	0.015	1.443	391615	53.8	3.715	245	56.1	152.2	4.1	0.063	4825	2347	pg18beta1_o2nofp.cx10d_c32r128
108844	0	0	0.0	1648.8	157.6	0.000	0.000	0.015	1.483	400096	54.6	3.676	241	56.8	152.9	6.2	0.019	5147	2298	pg18beta2_o2nofp.cx10b_c32r128
107527	0	1	0.0	1632.5	156.2	0.000	0.000	0.015	1.487	396654	54.4	3.689	243	56.1	152.2	2.3	0.070	5016	2303	pg18beta2_o2nofp.cx10cw4_c32r128
102302	0	0	0.0	1551.7	148.2	0.000	0.000	0.015	1.484	381713	52.1	3.731	244	56.1	152.2	22.3	0.061	4686	2303	pg18beta2_o2nofp.cx10d_c32r128
qr100.L1
qr100.L1: range queries with 100 insert/s per client. Graphs for performance per 1-second interval are here.
Average throughput:
Query response time histogram: each cell has the percentage of responses that take <= the time in the header and max is the max response time in seconds. For max values in the top 25% of the range have a red background and in the bottom 25% of the range have a green background. The red background is not used when the min value is within 80% of the max value.
| dbms | 256us | 1ms | 4ms | 16ms | 64ms | 256ms | 1s | 4s | 16s | gt | max |
|---|---|---|---|---|---|---|---|---|---|---|---|
| pg174_o2nofp.cx10a_c32r128 | 99.998 | 0.001 | 0.001 | nonzero | 0.008 | ||||||
| pg175_o2nofp.cx10a_c32r128 | 99.998 | 0.001 | 0.001 | nonzero | nonzero | 0.016 | |||||
| pg18beta1_o2nofp.cx10b_c32r128 | 99.998 | 0.001 | 0.001 | nonzero | 0.005 | ||||||
| pg18beta1_o2nofp.cx10cw4_c32r128 | 99.998 | 0.001 | 0.001 | nonzero | 0.008 | ||||||
| pg18beta1_o2nofp.cx10d_c32r128 | 99.998 | 0.001 | 0.001 | nonzero | 0.008 | ||||||
| pg18beta2_o2nofp.cx10b_c32r128 | 99.998 | 0.001 | 0.001 | nonzero | nonzero | 0.028 | |||||
| pg18beta2_o2nofp.cx10cw4_c32r128 | 99.998 | 0.001 | 0.001 | nonzero | 0.009 | ||||||
| pg18beta2_o2nofp.cx10d_c32r128 | 99.998 | 0.001 | 0.001 | nonzero | 0.009 |
Insert response time histogram: each cell has the percentage of responses that take <= the time in the header and max is the max response time in seconds. For max values in the top 25% of the range have a red background and in the bottom 25% of the range have a green background. The red background is not used when the min value is within 80% of the max value.
| dbms | 256us | 1ms | 4ms | 16ms | 64ms | 256ms | 1s | 4s | 16s | gt | max |
|---|---|---|---|---|---|---|---|---|---|---|---|
| pg174_o2nofp.cx10a_c32r128 | 0.010 | 99.725 | 0.265 | 0.009 | |||||||
| pg175_o2nofp.cx10a_c32r128 | 0.001 | 99.701 | 0.297 | 0.012 | |||||||
| pg18beta1_o2nofp.cx10b_c32r128 | 0.013 | 99.706 | 0.282 | 0.014 | |||||||
| pg18beta1_o2nofp.cx10cw4_c32r128 | 0.019 | 99.753 | 0.228 | 0.010 | |||||||
| pg18beta1_o2nofp.cx10d_c32r128 | 0.003 | 99.747 | 0.250 | 0.011 | |||||||
| pg18beta2_o2nofp.cx10b_c32r128 | 0.008 | 99.708 | 0.279 | 0.004 | 0.028 | ||||||
| pg18beta2_o2nofp.cx10cw4_c32r128 | 0.021 | 99.721 | 0.258 | 0.010 | |||||||
| pg18beta2_o2nofp.cx10d_c32r128 | 99.694 | 0.306 | 0.015 |
Delete response time histogram: each cell has the percentage of responses that take <= the time in the header and max is the max response time in seconds. For max values in the top 25% of the range have a red background and in the bottom 25% of the range have a green background. The red background is not used when the min value is within 80% of the max value.
| dbms | 256us | 1ms | 4ms | 16ms | 64ms | 256ms | 1s | 4s | 16s | gt | max |
|---|---|---|---|---|---|---|---|---|---|---|---|
| pg174_o2nofp.cx10a_c32r128 | 67.778 | 32.193 | 0.029 | 0.009 | |||||||
| pg175_o2nofp.cx10a_c32r128 | 67.924 | 32.062 | 0.011 | 0.003 | 0.021 | ||||||
| pg18beta1_o2nofp.cx10b_c32r128 | 67.972 | 32.015 | 0.013 | 0.013 | |||||||
| pg18beta1_o2nofp.cx10cw4_c32r128 | 68.243 | 31.751 | 0.006 | 0.005 | |||||||
| pg18beta1_o2nofp.cx10d_c32r128 | 67.464 | 32.519 | 0.017 | 0.011 | |||||||
| pg18beta2_o2nofp.cx10b_c32r128 | 68.872 | 31.110 | 0.017 | 0.001 | 0.026 | ||||||
| pg18beta2_o2nofp.cx10cw4_c32r128 | 69.632 | 30.347 | 0.021 | 0.007 | |||||||
| pg18beta2_o2nofp.cx10d_c32r128 | 69.935 | 30.047 | 0.018 | 0.015 |
Performance metrics for the DBMS listed above. Some are normalized by throughput, others are not. Legend for results is here.
ips	qps	rps	rmbps	wps	wmbps	rpq	rkbpq	wpi	wkbpi	csps	cpups	cspq	cpupq	dbgb1	dbgb2	rss	maxop	p50	p99	tag
1977	395158	0	0.0	123.0	10.5	0.000	0.000	0.062	5.420	1505072	42.8	3.809	52	56.1	152.1	0.5	0.008	20090	19435	pg174_o2nofp.cx10a_c32r128
1977	395337	0	0.0	126.3	10.5	0.000	0.000	0.064	5.416	1505834	42.7	3.809	52	56.2	152.2	0.4	0.016	20058	19323	pg175_o2nofp.cx10a_c32r128
1976	389626	0	0.0	120.9	10.5	0.000	0.000	0.061	5.417	1485078	42.7	3.812	53	56.4	152.4	0.5	0.005	19483	18834	pg18beta1_o2nofp.cx10b_c32r128
1977	394628	0	0.0	121.1	10.4	0.000	0.000	0.061	5.411	1503340	42.9	3.810	52	56.0	152.1	0.5	0.008	19786	19131	pg18beta1_o2nofp.cx10cw4_c32r128
1977	387844	0	0.0	120.3	10.5	0.000	0.000	0.061	5.415	1477471	42.7	3.809	53	56.1	152.2	0.4	0.008	19691	18987	pg18beta1_o2nofp.cx10d_c32r128
1977	388556	0	0.0	121.4	10.4	0.000	0.000	0.061	5.401	1480207	42.8	3.810	53	56.8	152.9	0.5	0.028	19834	19136	pg18beta2_o2nofp.cx10b_c32r128
1977	393904	0	0.0	121.2	10.4	0.000	0.000	0.061	5.409	1500500	42.9	3.809	52	56.1	152.1	0.5	0.009	20098	19409	pg18beta2_o2nofp.cx10cw4_c32r128
1977	392702	0	0.0	126.2	10.5	0.000	0.000	0.064	5.423	1495907	42.8	3.809	52	56.1	152.2	0.5	0.009	19819	19051	pg18beta2_o2nofp.cx10d_c32r128
qp100.L2
qp100.L2: point queries with 100 insert/s per client. Graphs for performance per 1-second interval are here.
Average throughput:

Query response time histogram: each cell has the percentage of responses that take <= the time in the header and max is the max response time in seconds. For max values in the top 25% of the range have a red background and in the bottom 25% of the range have a green background. The red background is not used when the min value is within 80% of the max value.
| dbms | 256us | 1ms | 4ms | 16ms | 64ms | 256ms | 1s | 4s | 16s | gt | max |
|---|---|---|---|---|---|---|---|---|---|---|---|
| pg174_o2nofp.cx10a_c32r128 | 99.995 | 0.004 | 0.001 | nonzero | 0.010 | ||||||
| pg175_o2nofp.cx10a_c32r128 | 99.995 | 0.004 | 0.001 | nonzero | 0.010 | ||||||
| pg18beta1_o2nofp.cx10b_c32r128 | 99.995 | 0.004 | 0.001 | nonzero | 0.006 | ||||||
| pg18beta1_o2nofp.cx10cw4_c32r128 | 99.995 | 0.004 | 0.001 | nonzero | 0.008 | ||||||
| pg18beta1_o2nofp.cx10d_c32r128 | 99.995 | 0.004 | 0.001 | nonzero | 0.006 | ||||||
| pg18beta2_o2nofp.cx10b_c32r128 | 99.994 | 0.004 | 0.001 | nonzero | 0.008 | ||||||
| pg18beta2_o2nofp.cx10cw4_c32r128 | 99.995 | 0.004 | 0.001 | nonzero | 0.012 | ||||||
| pg18beta2_o2nofp.cx10d_c32r128 | 99.994 | 0.004 | 0.001 | nonzero | 0.009 |
Insert response time histogram: each cell has the percentage of responses that take <= the time in the header and max is the max response time in seconds. For max values in the top 25% of the range have a red background and in the bottom 25% of the range have a green background. The red background is not used when the min value is within 80% of the max value.
| dbms | 256us | 1ms | 4ms | 16ms | 64ms | 256ms | 1s | 4s | 16s | gt | max |
|---|---|---|---|---|---|---|---|---|---|---|---|
| pg174_o2nofp.cx10a_c32r128 | 99.694 | 0.306 | 0.012 | ||||||||
| pg175_o2nofp.cx10a_c32r128 | 99.736 | 0.264 | 0.014 | ||||||||
| pg18beta1_o2nofp.cx10b_c32r128 | 99.743 | 0.251 | 0.006 | 0.024 | |||||||
| pg18beta1_o2nofp.cx10cw4_c32r128 | 99.750 | 0.246 | 0.004 | 0.020 | |||||||
| pg18beta1_o2nofp.cx10d_c32r128 | 99.758 | 0.236 | 0.006 | 0.021 | |||||||
| pg18beta2_o2nofp.cx10b_c32r128 | 99.731 | 0.269 | 0.014 | ||||||||
| pg18beta2_o2nofp.cx10cw4_c32r128 | 99.700 | 0.293 | 0.007 | 0.025 | |||||||
| pg18beta2_o2nofp.cx10d_c32r128 | 99.614 | 0.385 | 0.001 | 0.024 |
Delete response time histogram: each cell has the percentage of responses that take <= the time in the header and max is the max response time in seconds. For max values in the top 25% of the range have a red background and in the bottom 25% of the range have a green background. The red background is not used when the min value is within 80% of the max value.
| dbms | 256us | 1ms | 4ms | 16ms | 64ms | 256ms | 1s | 4s | 16s | gt | max |
|---|---|---|---|---|---|---|---|---|---|---|---|
| pg174_o2nofp.cx10a_c32r128 | 19.518 | 80.404 | 0.078 | 0.009 | |||||||
| pg175_o2nofp.cx10a_c32r128 | 19.089 | 80.849 | 0.062 | 0.009 | |||||||
| pg18beta1_o2nofp.cx10b_c32r128 | 19.206 | 80.722 | 0.072 | 0.010 | |||||||
| pg18beta1_o2nofp.cx10cw4_c32r128 | 19.774 | 80.165 | 0.060 | 0.001 | 0.019 | ||||||
| pg18beta1_o2nofp.cx10d_c32r128 | 19.250 | 80.692 | 0.057 | 0.001 | 0.020 | ||||||
| pg18beta2_o2nofp.cx10b_c32r128 | 16.367 | 83.574 | 0.060 | 0.010 | |||||||
| pg18beta2_o2nofp.cx10cw4_c32r128 | 18.606 | 81.333 | 0.061 | 0.011 | |||||||
| pg18beta2_o2nofp.cx10d_c32r128 | 20.453 | 79.454 | 0.093 | 0.012 |
Performance metrics for the DBMS listed above. Some are normalized by throughput, others are not. Legend for results is here.
ips	qps	rps	rmbps	wps	wmbps	rpq	rkbpq	wpi	wkbpi	csps	cpups	cspq	cpupq	dbgb1	dbgb2	rss	maxop	p50	p99	tag
1977	197320	0	0.0	339.8	17.8	0.000	0.000	0.172	9.223	760092	41.5	3.852	101	56.1	149.0	0.5	0.010	10005	9749	pg174_o2nofp.cx10a_c32r128
1977	198067	0	0.0	343.0	17.8	0.000	0.000	0.174	9.235	763054	41.1	3.852	100	56.2	149.0	0.5	0.010	10021	9781	pg175_o2nofp.cx10a_c32r128
1977	196234	0	0.0	337.8	17.8	0.000	0.000	0.171	9.223	756087	41.4	3.853	101	56.4	149.3	0.1	0.006	9893	9702	pg18beta1_o2nofp.cx10b_c32r128
1977	197758	0	0.0	338.8	17.8	0.000	0.000	0.171	9.216	761899	41.3	3.853	100	56.1	148.8	0.5	0.008	10101	9893	pg18beta1_o2nofp.cx10cw4_c32r128
1978	195817	0	0.0	337.9	17.8	0.000	0.000	0.171	9.214	754018	41.3	3.851	101	56.1	149.0	0.4	0.006	9925	9717	pg18beta1_o2nofp.cx10d_c32r128
1977	195689	1	0.0	340.4	17.9	0.000	0.000	0.172	9.249	753950	41.4	3.853	102	56.8	149.7	0.5	0.008	9724	9526	pg18beta2_o2nofp.cx10b_c32r128
1977	195961	0	0.0	337.8	17.8	0.000	0.000	0.171	9.218	754949	41.5	3.853	102	56.1	148.9	0.5	0.012	10037	9845	pg18beta2_o2nofp.cx10cw4_c32r128
1977	196612	0	0.0	338.1	17.8	0.000	0.000	0.171	9.224	757515	41.3	3.853	101	56.1	149.1	0.5	0.009	10021	9813	pg18beta2_o2nofp.cx10d_c32r128
qr500.L3
qr500.L3: range queries with 500 insert/s per client. Graphs for performance per 1-second interval are here.
Average throughput:
Query response time histogram: each cell has the percentage of responses that take <= the time in the header and max is the max response time in seconds. For max values in the top 25% of the range have a red background and in the bottom 25% of the range have a green background. The red background is not used when the min value is within 80% of the max value.
| dbms | 256us | 1ms | 4ms | 16ms | 64ms | 256ms | 1s | 4s | 16s | gt | max |
|---|---|---|---|---|---|---|---|---|---|---|---|
| pg174_o2nofp.cx10a_c32r128 | 99.994 | 0.003 | 0.003 | nonzero | nonzero | nonzero | 0.065 | ||||
| pg175_o2nofp.cx10a_c32r128 | 99.994 | 0.003 | 0.003 | nonzero | nonzero | nonzero | 0.065 | ||||
| pg18beta1_o2nofp.cx10b_c32r128 | 99.994 | 0.003 | 0.003 | nonzero | nonzero | 0.062 | |||||
| pg18beta1_o2nofp.cx10cw4_c32r128 | 99.994 | 0.003 | 0.003 | nonzero | nonzero | 0.063 | |||||
| pg18beta1_o2nofp.cx10d_c32r128 | 99.994 | 0.003 | 0.003 | nonzero | nonzero | nonzero | 0.069 | ||||
| pg18beta2_o2nofp.cx10b_c32r128 | 99.994 | 0.003 | 0.003 | nonzero | nonzero | nonzero | 0.080 | ||||
| pg18beta2_o2nofp.cx10cw4_c32r128 | 99.994 | 0.003 | 0.003 | nonzero | nonzero | nonzero | 0.076 | ||||
| pg18beta2_o2nofp.cx10d_c32r128 | 99.994 | 0.003 | 0.003 | nonzero | nonzero | nonzero | 0.074 |
Insert response time histogram: each cell has the percentage of responses that take <= the time in the header and max is the max response time in seconds. For max values in the top 25% of the range have a red background and in the bottom 25% of the range have a green background. The red background is not used when the min value is within 80% of the max value.
| dbms | 256us | 1ms | 4ms | 16ms | 64ms | 256ms | 1s | 4s | 16s | gt | max |
|---|---|---|---|---|---|---|---|---|---|---|---|
| pg174_o2nofp.cx10a_c32r128 | 10.428 | 88.583 | 0.961 | 0.028 | 0.032 | ||||||
| pg175_o2nofp.cx10a_c32r128 | 5.807 | 93.497 | 0.682 | 0.014 | 0.023 | ||||||
| pg18beta1_o2nofp.cx10b_c32r128 | 11.692 | 87.193 | 1.076 | 0.039 | 0.037 | ||||||
| pg18beta1_o2nofp.cx10cw4_c32r128 | 11.482 | 87.661 | 0.828 | 0.029 | 0.053 | ||||||
| pg18beta1_o2nofp.cx10d_c32r128 | 9.155 | 89.767 | 1.026 | 0.052 | 0.035 | ||||||
| pg18beta2_o2nofp.cx10b_c32r128 | 6.109 | 93.154 | 0.703 | 0.034 | 0.042 | ||||||
| pg18beta2_o2nofp.cx10cw4_c32r128 | 10.371 | 88.733 | 0.864 | 0.033 | 0.030 | ||||||
| pg18beta2_o2nofp.cx10d_c32r128 | 12.166 | 86.667 | 1.105 | 0.062 | 0.033 |
Delete response time histogram: each cell has the percentage of responses that take <= the time in the header and max is the max response time in seconds. For max values in the top 25% of the range have a red background and in the bottom 25% of the range have a green background. The red background is not used when the min value is within 80% of the max value.
| dbms | 256us | 1ms | 4ms | 16ms | 64ms | 256ms | 1s | 4s | 16s | gt | max |
|---|---|---|---|---|---|---|---|---|---|---|---|
| pg174_o2nofp.cx10a_c32r128 | 54.087 | 45.333 | 0.569 | 0.011 | 0.026 | ||||||
| pg175_o2nofp.cx10a_c32r128 | 52.480 | 47.056 | 0.458 | 0.006 | 0.021 | ||||||
| pg18beta1_o2nofp.cx10b_c32r128 | 51.549 | 47.774 | 0.657 | 0.021 | 0.031 | ||||||
| pg18beta1_o2nofp.cx10cw4_c32r128 | 52.778 | 46.708 | 0.496 | 0.018 | 0.052 | ||||||
| pg18beta1_o2nofp.cx10d_c32r128 | 52.249 | 47.137 | 0.593 | 0.021 | 0.027 | ||||||
| pg18beta2_o2nofp.cx10b_c32r128 | 49.759 | 49.778 | 0.444 | 0.019 | 0.038 | ||||||
| pg18beta2_o2nofp.cx10cw4_c32r128 | 52.822 | 46.653 | 0.516 | 0.010 | 0.020 | ||||||
| pg18beta2_o2nofp.cx10d_c32r128 | 54.280 | 45.080 | 0.613 | 0.027 | 0.025 |
Performance metrics for the DBMS listed above. Some are normalized by throughput, others are not. Legend for results is here.
ips	qps	rps	rmbps	wps	wmbps	rpq	rkbpq	wpi	wkbpi	csps	cpups	cspq	cpupq	dbgb1	dbgb2	rss	maxop	p50	p99	tag
9885	382722	0	0.0	512.5	27.4	0.000	0.000	0.052	2.838	1453421	43.5	3.798	55	56.2	142.4	48.5	0.065	19307	18131	pg174_o2nofp.cx10a_c32r128
9874	382515	0	0.0	515.3	27.4	0.000	0.000	0.052	2.843	1453940	43.6	3.801	55	56.3	142.4	35.0	0.065	19403	18044	pg175_o2nofp.cx10a_c32r128
9879	381016	0	0.0	513.3	27.9	0.000	0.000	0.052	2.889	1447699	43.5	3.800	55	56.4	142.6	15.1	0.062	19291	18172	pg18beta1_o2nofp.cx10b_c32r128
9885	382306	0	0.0	510.2	27.5	0.000	0.000	0.052	2.853	1451856	43.6	3.798	55	56.1	142.2	4.4	0.063	19252	18156	pg18beta1_o2nofp.cx10cw4_c32r128
9885	380116	0	0.0	510.7	27.7	0.000	0.000	0.052	2.875	1443351	43.5	3.797	55	56.2	142.4	6.4	0.069	19115	17996	pg18beta1_o2nofp.cx10d_c32r128
9885	378877	0	0.0	516.7	27.7	0.000	0.000	0.052	2.873	1438698	43.5	3.797	55	56.8	142.9	8.0	0.080	19051	17996	pg18beta2_o2nofp.cx10b_c32r128
9885	380643	0	0.0	508.9	27.7	0.000	0.000	0.051	2.864	1445181	43.6	3.797	55	56.1	142.2	7.0	0.076	18818	17709	pg18beta2_o2nofp.cx10cw4_c32r128
9885	382885	1	0.0	514.3	27.8	0.000	0.000	0.052	2.885	1454294	43.6	3.798	55	56.2	142.4	4.4	0.074	19429	18307	pg18beta2_o2nofp.cx10d_c32r128
qp500.L4
qp500.L4: point queries with 500 insert/s per client. Graphs for performance per 1-second interval are here.
Average throughput:
Query response time histogram: each cell has the percentage of responses that take <= the time in the header and max is the max response time in seconds. For max values in the top 25% of the range have a red background and in the bottom 25% of the range have a green background. The red background is not used when the min value is within 80% of the max value.
| dbms | 256us | 1ms | 4ms | 16ms | 64ms | 256ms | 1s | 4s | 16s | gt | max |
|---|---|---|---|---|---|---|---|---|---|---|---|
| pg174_o2nofp.cx10a_c32r128 | 99.989 | 0.007 | 0.003 | nonzero | nonzero | nonzero | 0.089 | ||||
| pg175_o2nofp.cx10a_c32r128 | 99.990 | 0.007 | 0.003 | nonzero | nonzero | nonzero | 0.066 | ||||
| pg18beta1_o2nofp.cx10b_c32r128 | 99.989 | 0.007 | 0.004 | nonzero | nonzero | 0.064 | |||||
| pg18beta1_o2nofp.cx10cw4_c32r128 | 99.989 | 0.007 | 0.004 | nonzero | nonzero | nonzero | 0.069 | ||||
| pg18beta1_o2nofp.cx10d_c32r128 | 99.989 | 0.007 | 0.003 | nonzero | nonzero | 0.062 | |||||
| pg18beta2_o2nofp.cx10b_c32r128 | 99.989 | 0.008 | 0.003 | nonzero | nonzero | nonzero | 0.081 | ||||
| pg18beta2_o2nofp.cx10cw4_c32r128 | 99.989 | 0.007 | 0.004 | nonzero | nonzero | nonzero | 0.070 | ||||
| pg18beta2_o2nofp.cx10d_c32r128 | 99.989 | 0.008 | 0.003 | nonzero | nonzero | 0.023 |
Insert response time histogram: each cell has the percentage of responses that take <= the time in the header and max is the max response time in seconds. For max values in the top 25% of the range have a red background and in the bottom 25% of the range have a green background. The red background is not used when the min value is within 80% of the max value.
| dbms | 256us | 1ms | 4ms | 16ms | 64ms | 256ms | 1s | 4s | 16s | gt | max |
|---|---|---|---|---|---|---|---|---|---|---|---|
| pg174_o2nofp.cx10a_c32r128 | 11.164 | 88.131 | 0.683 | 0.021 | 0.045 | ||||||
| pg175_o2nofp.cx10a_c32r128 | 7.133 | 92.100 | 0.720 | 0.048 | 0.039 | ||||||
| pg18beta1_o2nofp.cx10b_c32r128 | 8.869 | 90.512 | 0.606 | 0.013 | 0.038 | ||||||
| pg18beta1_o2nofp.cx10cw4_c32r128 | 8.105 | 91.263 | 0.611 | 0.022 | 0.042 | ||||||
| pg18beta1_o2nofp.cx10d_c32r128 | 8.117 | 91.383 | 0.483 | 0.017 | 0.022 | ||||||
| pg18beta2_o2nofp.cx10b_c32r128 | 4.625 | 94.737 | 0.614 | 0.023 | 0.038 | ||||||
| pg18beta2_o2nofp.cx10cw4_c32r128 | 8.385 | 90.859 | 0.711 | 0.044 | 0.038 | ||||||
| pg18beta2_o2nofp.cx10d_c32r128 | 8.576 | 90.656 | 0.740 | 0.028 | 0.039 |
Delete response time histogram: each cell has the percentage of responses that take <= the time in the header and max is the max response time in seconds. For max values in the top 25% of the range have a red background and in the bottom 25% of the range have a green background. The red background is not used when the min value is within 80% of the max value.
| dbms | 256us | 1ms | 4ms | 16ms | 64ms | 256ms | 1s | 4s | 16s | gt | max |
|---|---|---|---|---|---|---|---|---|---|---|---|
| pg174_o2nofp.cx10a_c32r128 | 47.969 | 51.501 | 0.516 | 0.014 | 0.026 | ||||||
| pg175_o2nofp.cx10a_c32r128 | 47.044 | 52.360 | 0.555 | 0.041 | 0.038 | ||||||
| pg18beta1_o2nofp.cx10b_c32r128 | 48.063 | 51.513 | 0.412 | 0.012 | 0.031 | ||||||
| pg18beta1_o2nofp.cx10cw4_c32r128 | 44.428 | 55.092 | 0.462 | 0.018 | 0.050 | ||||||
| pg18beta1_o2nofp.cx10d_c32r128 | 46.629 | 52.993 | 0.363 | 0.016 | 0.032 | ||||||
| pg18beta2_o2nofp.cx10b_c32r128 | 44.873 | 54.604 | 0.506 | 0.016 | 0.032 | ||||||
| pg18beta2_o2nofp.cx10cw4_c32r128 | 47.041 | 52.384 | 0.540 | 0.035 | 0.036 | ||||||
| pg18beta2_o2nofp.cx10d_c32r128 | 48.260 | 51.223 | 0.495 | 0.022 | 0.023 |
Performance metrics for the DBMS listed above. Some are normalized by throughput, others are not. Legend for results is here.
ips	qps	rps	rmbps	wps	wmbps	rpq	rkbpq	wpi	wkbpi	csps	cpups	cspq	cpupq	dbgb1	dbgb2	rss	maxop	p50	p99	tag
9885	195661	0	0.0	341.7	29.0	0.000	0.000	0.035	3.000	752506	41.9	3.846	103	56.2	138.4	32.8	0.089	9941	9621	pg174_o2nofp.cx10a_c32r128
9885	197586	0	0.0	341.6	29.2	0.000	0.000	0.035	3.020	759873	41.9	3.846	102	56.4	138.4	20.1	0.066	9989	9689	pg175_o2nofp.cx10a_c32r128
9879	195721	4	0.2	346.1	28.0	0.000	0.001	0.035	2.901	753239	42.1	3.849	103	56.5	138.6	8.5	0.064	9909	9628	pg18beta1_o2nofp.cx10b_c32r128
9885	196855	0	0.0	344.2	27.6	0.000	0.000	0.035	2.860	757201	42.0	3.846	102	56.2	138.1	3.4	0.069	10037	9717	pg18beta1_o2nofp.cx10cw4_c32r128
9879	194291	0	0.0	338.3	27.4	0.000	0.000	0.034	2.837	747937	42.0	3.850	104	56.3	138.3	2.9	0.062	9765	9494	pg18beta1_o2nofp.cx10d_c32r128
9885	194856	0	0.0	342.2	27.8	0.000	0.000	0.035	2.884	749409	42.0	3.846	103	56.8	138.8	4.5	0.081	9941	9622	pg18beta2_o2nofp.cx10b_c32r128
9885	195419	0	0.0	339.7	27.7	0.000	0.000	0.034	2.869	751714	42.1	3.847	103	56.2	138.2	7.9	0.070	9960	9701	pg18beta2_o2nofp.cx10cw4_c32r128
9885	195338	0	0.0	341.4	27.5	0.000	0.000	0.035	2.852	751459	42.0	3.847	103	56.2	138.4	12.7	0.023	9893	9590	pg18beta2_o2nofp.cx10d_c32r128
qr1000.L5
qr1000.L5: range queries with 1000 insert/s per client. Graphs for performance per 1-second interval are here.
Average throughput:
Query response time histogram: each cell has the percentage of responses that take <= the time in the header and max is the max response time in seconds. For max values in the top 25% of the range have a red background and in the bottom 25% of the range have a green background. The red background is not used when the min value is within 80% of the max value.
| dbms | 256us | 1ms | 4ms | 16ms | 64ms | 256ms | 1s | 4s | 16s | gt | max |
|---|---|---|---|---|---|---|---|---|---|---|---|
| pg174_o2nofp.cx10a_c32r128 | 99.990 | 0.006 | 0.004 | nonzero | nonzero | nonzero | 0.071 | ||||
| pg175_o2nofp.cx10a_c32r128 | 99.990 | 0.006 | 0.004 | nonzero | nonzero | nonzero | 0.078 | ||||
| pg18beta1_o2nofp.cx10b_c32r128 | 99.990 | 0.006 | 0.004 | nonzero | nonzero | nonzero | 0.103 | ||||
| pg18beta1_o2nofp.cx10cw4_c32r128 | 99.989 | 0.007 | 0.004 | nonzero | nonzero | nonzero | 0.102 | ||||
| pg18beta1_o2nofp.cx10d_c32r128 | 99.989 | 0.007 | 0.004 | nonzero | nonzero | nonzero | 0.093 | ||||
| pg18beta2_o2nofp.cx10b_c32r128 | 99.989 | 0.007 | 0.004 | nonzero | nonzero | nonzero | 0.096 | ||||
| pg18beta2_o2nofp.cx10cw4_c32r128 | 99.989 | 0.007 | 0.004 | nonzero | nonzero | nonzero | 0.099 | ||||
| pg18beta2_o2nofp.cx10d_c32r128 | 99.989 | 0.007 | 0.004 | nonzero | nonzero | nonzero | 0.101 |
Insert response time histogram: each cell has the percentage of responses that take <= the time in the header and max is the max response time in seconds. For max values in the top 25% of the range have a red background and in the bottom 25% of the range have a green background. The red background is not used when the min value is within 80% of the max value.
| dbms | 256us | 1ms | 4ms | 16ms | 64ms | 256ms | 1s | 4s | 16s | gt | max |
|---|---|---|---|---|---|---|---|---|---|---|---|
| pg174_o2nofp.cx10a_c32r128 | 31.495 | 67.964 | 0.533 | 0.009 | 0.025 | ||||||
| pg175_o2nofp.cx10a_c32r128 | 21.932 | 77.477 | 0.581 | 0.009 | 0.031 | ||||||
| pg18beta1_o2nofp.cx10b_c32r128 | 34.401 | 65.055 | 0.503 | 0.041 | 0.038 | ||||||
| pg18beta1_o2nofp.cx10cw4_c32r128 | 35.719 | 63.737 | 0.506 | 0.037 | 0.036 | ||||||
| pg18beta1_o2nofp.cx10d_c32r128 | 30.490 | 69.028 | 0.460 | 0.022 | 0.042 | ||||||
| pg18beta2_o2nofp.cx10b_c32r128 | 17.978 | 81.450 | 0.546 | 0.026 | nonzero | 0.087 | |||||
| pg18beta2_o2nofp.cx10cw4_c32r128 | 29.226 | 70.200 | 0.558 | 0.016 | nonzero | 0.099 | |||||
| pg18beta2_o2nofp.cx10d_c32r128 | 33.566 | 65.786 | 0.620 | 0.028 | 0.037 |
Delete response time histogram: each cell has the percentage of responses that take <= the time in the header and max is the max response time in seconds. For max values in the top 25% of the range have a red background and in the bottom 25% of the range have a green background. The red background is not used when the min value is within 80% of the max value.
| dbms | 256us | 1ms | 4ms | 16ms | 64ms | 256ms | 1s | 4s | 16s | gt | max |
|---|---|---|---|---|---|---|---|---|---|---|---|
| pg174_o2nofp.cx10a_c32r128 | 54.080 | 45.644 | 0.273 | 0.003 | 0.033 | ||||||
| pg175_o2nofp.cx10a_c32r128 | 52.811 | 46.889 | 0.297 | 0.003 | 0.032 | ||||||
| pg18beta1_o2nofp.cx10b_c32r128 | 54.953 | 44.668 | 0.359 | 0.019 | 0.035 | ||||||
| pg18beta1_o2nofp.cx10cw4_c32r128 | 51.267 | 48.365 | 0.350 | 0.018 | 0.032 | ||||||
| pg18beta1_o2nofp.cx10d_c32r128 | 52.775 | 46.896 | 0.318 | 0.011 | 0.028 | ||||||
| pg18beta2_o2nofp.cx10b_c32r128 | 54.349 | 45.249 | 0.392 | 0.010 | nonzero | 0.086 | |||||
| pg18beta2_o2nofp.cx10cw4_c32r128 | 55.018 | 44.627 | 0.348 | 0.006 | nonzero | 0.098 | |||||
| pg18beta2_o2nofp.cx10d_c32r128 | 55.250 | 44.363 | 0.373 | 0.015 | 0.025 |
Performance metrics for the DBMS listed above. Some are normalized by throughput, others are not. Legend for results is here.
ips	qps	rps	rmbps	wps	wmbps	rpq	rkbpq	wpi	wkbpi	csps	cpups	cspq	cpupq	dbgb1	dbgb2	rss	maxop	p50	p99	tag
19758	379160	0	0.0	397.1	33.4	0.000	0.000	0.020	1.732	1435304	44.5	3.785	56	56.3	134.7	35.8	0.071	19282	18060	pg174_o2nofp.cx10a_c32r128
19758	378895	0	0.0	391.5	33.4	0.000	0.000	0.020	1.732	1434190	44.5	3.785	56	56.3	134.6	28.6	0.078	18907	17677	pg175_o2nofp.cx10a_c32r128
19758	375844	0	0.0	409.6	35.1	0.000	0.000	0.021	1.817	1423055	44.5	3.786	57	56.4	135.0	11.5	0.103	18764	17581	pg18beta1_o2nofp.cx10b_c32r128
19758	380142	0	0.0	415.0	35.4	0.000	0.000	0.021	1.837	1439666	44.6	3.787	56	56.1	134.6	3.7	0.102	19350	18075	pg18beta1_o2nofp.cx10cw4_c32r128
19758	372142	4	0.2	409.1	35.4	0.000	0.000	0.021	1.837	1408802	44.6	3.786	58	56.2	134.8	5.4	0.093	18732	17439	pg18beta1_o2nofp.cx10d_c32r128
19758	374028	0	0.0	407.4	35.2	0.000	0.000	0.021	1.824	1415281	44.6	3.784	57	56.7	135.2	12.1	0.096	18891	17580	pg18beta2_o2nofp.cx10b_c32r128
19758	375702	0	0.0	405.1	35.0	0.000	0.000	0.021	1.816	1422035	44.5	3.785	57	56.3	134.8	5.5	0.099	18987	17785	pg18beta2_o2nofp.cx10cw4_c32r128
19758	377862	0	0.0	408.9	35.4	0.000	0.000	0.021	1.836	1430890	44.5	3.787	57	56.2	134.8	8.8	0.101	19036	17613	pg18beta2_o2nofp.cx10d_c32r128
qp1000.L6
qp1000.L6: point queries with 1000 insert/s per client. Graphs for performance per 1-second interval are here.
Average throughput:
Query response time histogram: each cell has the percentage of responses that take <= the time in the header and max is the max response time in seconds. For max values in the top 25% of the range have a red background and in the bottom 25% of the range have a green background. The red background is not used when the min value is within 80% of the max value.
| dbms | 256us | 1ms | 4ms | 16ms | 64ms | 256ms | 1s | 4s | 16s | gt | max |
|---|---|---|---|---|---|---|---|---|---|---|---|
| pg174_o2nofp.cx10a_c32r128 | 99.982 | 0.013 | 0.005 | nonzero | nonzero | nonzero | 0.088 | ||||
| pg175_o2nofp.cx10a_c32r128 | 99.982 | 0.013 | 0.005 | nonzero | nonzero | nonzero | 0.082 | ||||
| pg18beta1_o2nofp.cx10b_c32r128 | 99.981 | 0.013 | 0.005 | nonzero | nonzero | nonzero | 0.101 | ||||
| pg18beta1_o2nofp.cx10cw4_c32r128 | 99.981 | 0.013 | 0.005 | nonzero | nonzero | nonzero | 0.099 | ||||
| pg18beta1_o2nofp.cx10d_c32r128 | 99.982 | 0.013 | 0.005 | nonzero | nonzero | nonzero | 0.096 | ||||
| pg18beta2_o2nofp.cx10b_c32r128 | 99.981 | 0.014 | 0.005 | nonzero | nonzero | nonzero | 0.104 | ||||
| pg18beta2_o2nofp.cx10cw4_c32r128 | 99.981 | 0.014 | 0.005 | nonzero | nonzero | nonzero | 0.095 | ||||
| pg18beta2_o2nofp.cx10d_c32r128 | 99.981 | 0.014 | 0.005 | nonzero | nonzero | nonzero | 0.102 |
Insert response time histogram: each cell has the percentage of responses that take <= the time in the header and max is the max response time in seconds. For max values in the top 25% of the range have a red background and in the bottom 25% of the range have a green background. The red background is not used when the min value is within 80% of the max value.
| dbms | 256us | 1ms | 4ms | 16ms | 64ms | 256ms | 1s | 4s | 16s | gt | max |
|---|---|---|---|---|---|---|---|---|---|---|---|
| pg174_o2nofp.cx10a_c32r128 | 32.860 | 66.533 | 0.586 | 0.021 | 0.045 | ||||||
| pg175_o2nofp.cx10a_c32r128 | 23.852 | 75.661 | 0.474 | 0.012 | 0.059 | ||||||
| pg18beta1_o2nofp.cx10b_c32r128 | 31.909 | 67.582 | 0.487 | 0.022 | 0.041 | ||||||
| pg18beta1_o2nofp.cx10cw4_c32r128 | 29.142 | 70.392 | 0.446 | 0.020 | 0.063 | ||||||
| pg18beta1_o2nofp.cx10d_c32r128 | 30.010 | 69.538 | 0.435 | 0.017 | 0.037 | ||||||
| pg18beta2_o2nofp.cx10b_c32r128 | 20.267 | 79.281 | 0.436 | 0.016 | nonzero | 0.083 | |||||
| pg18beta2_o2nofp.cx10cw4_c32r128 | 33.715 | 65.919 | 0.352 | 0.014 | 0.046 | ||||||
| pg18beta2_o2nofp.cx10d_c32r128 | 33.156 | 66.366 | 0.457 | 0.021 | 0.033 |
Delete response time histogram: each cell has the percentage of responses that take <= the time in the header and max is the max response time in seconds. For max values in the top 25% of the range have a red background and in the bottom 25% of the range have a green background. The red background is not used when the min value is within 80% of the max value.
| dbms | 256us | 1ms | 4ms | 16ms | 64ms | 256ms | 1s | 4s | 16s | gt | max |
|---|---|---|---|---|---|---|---|---|---|---|---|
| pg174_o2nofp.cx10a_c32r128 | 55.308 | 44.277 | 0.405 | 0.010 | 0.047 | ||||||
| pg175_o2nofp.cx10a_c32r128 | 55.141 | 44.513 | 0.339 | 0.008 | 0.059 | ||||||
| pg18beta1_o2nofp.cx10b_c32r128 | 57.055 | 42.430 | 0.498 | 0.017 | 0.036 | ||||||
| pg18beta1_o2nofp.cx10cw4_c32r128 | 55.223 | 44.270 | 0.489 | 0.018 | 0.055 | ||||||
| pg18beta1_o2nofp.cx10d_c32r128 | 58.512 | 40.927 | 0.545 | 0.017 | 0.034 | ||||||
| pg18beta2_o2nofp.cx10b_c32r128 | 56.607 | 42.818 | 0.561 | 0.014 | nonzero | 0.082 | |||||
| pg18beta2_o2nofp.cx10cw4_c32r128 | 58.903 | 40.703 | 0.381 | 0.012 | 0.035 | ||||||
| pg18beta2_o2nofp.cx10d_c32r128 | 59.141 | 40.447 | 0.395 | 0.017 | 0.035 |
Performance metrics for the DBMS listed above. Some are normalized by throughput, others are not. Legend for results is here.
ips	qps	rps	rmbps	wps	wmbps	rpq	rkbpq	wpi	wkbpi	csps	cpups	cspq	cpupq	dbgb1	dbgb2	rss	maxop	p50	p99	tag
19758	194506	0	0.0	407.3	35.8	0.000	0.000	0.021	1.854	747294	43.1	3.842	106	56.1	133.4	33.3	0.088	9813	9398	pg174_o2nofp.cx10a_c32r128
19758	196025	0	0.0	404.4	35.8	0.000	0.000	0.020	1.854	752960	43.1	3.841	106	56.3	133.5	23.8	0.082	10009	9529	pg175_o2nofp.cx10a_c32r128
19758	193883	0	0.0	397.5	35.0	0.000	0.000	0.020	1.813	744945	43.1	3.842	107	56.0	133.3	4.0	0.101	9893	9434	pg18beta1_o2nofp.cx10b_c32r128
19758	195350	0	0.0	404.4	34.9	0.000	0.000	0.020	1.809	750392	43.2	3.841	106	55.9	133.1	3.2	0.099	9946	9401	pg18beta1_o2nofp.cx10cw4_c32r128
19758	193014	0	0.0	396.9	35.0	0.000	0.000	0.020	1.814	741327	43.2	3.841	107	56.1	133.4	2.3	0.096	9821	9395	pg18beta1_o2nofp.cx10d_c32r128
19758	192619	0	0.0	395.6	35.1	0.000	0.000	0.020	1.820	739698	43.1	3.840	107	56.2	133.5	8.9	0.104	9845	9350	pg18beta2_o2nofp.cx10b_c32r128
19758	193496	0	0.0	397.7	35.0	0.000	0.000	0.020	1.815	743531	43.1	3.843	107	56.0	133.2	16.0	0.095	9797	9382	pg18beta2_o2nofp.cx10cw4_c32r128
19758	193708	0	0.0	392.9	34.8	0.000	0.000	0.020	1.801	744210	43.1	3.842	107	56.0	133.3	8.1	0.102	9817	9429	pg18beta2_o2nofp.cx10d_c32r128
l.i0
l.i0: load without secondary indexes
Performance metrics for all DBMS, not just the ones listed above. Some are normalized by throughput, others are not. Legend for results is here.
ips	qps	rps	rmbps	wps	wmbps	rpq	rkbpq	wpi	wkbpi	csps	cpups	cspq	cpupq	dbgb1	dbgb2	rss	maxop	p50	p99	tag
1709402	0	1	0.0	6861.5	722.7	0.000	0.000	0.004	0.433	287250	45.3	0.168	13	19.1	51.7	1.4	0.639	112979	41556	pg174_o2nofp.cx10a_c32r128
1709402	0	4	0.0	6917.3	730.3	0.000	0.000	0.004	0.437	276641	47.2	0.162	13	19.1	51.7	1.4	0.634	113944	40887	pg175_o2nofp.cx10a_c32r128
1724138	0	77	2.2	6848.9	724.0	0.000	0.001	0.004	0.430	264641	47.5	0.153	13	19.1	51.7	1.4	0.451	114777	55141	pg18beta1_o2nofp.cx10b_c32r128
1724138	0	4	0.0	6889.5	730.9	0.000	0.000	0.004	0.434	267553	46.9	0.155	13	19.1	51.7	1.4	0.544	115962	45751	pg18beta1_o2nofp.cx10cw4_c32r128
1709402	0	4	0.0	6797.1	719.9	0.000	0.000	0.004	0.431	268945	46.9	0.157	13	19.1	51.7	7.9	0.550	115276	45851	pg18beta1_o2nofp.cx10d_c32r128
1724138	0	4	0.0	6839.3	724.7	0.000	0.000	0.004	0.430	263266	46.7	0.153	13	19.1	51.7	0.5	0.597	116425	43167	pg18beta2_o2nofp.cx10b_c32r128
1724138	0	3	0.0	6844.8	724.4	0.000	0.000	0.004	0.430	265107	46.9	0.154	13	19.1	51.7	0.4	0.485	116775	47748	pg18beta2_o2nofp.cx10cw4_c32r128
1754386	0	4	0.0	6881.9	729.4	0.000	0.000	0.004	0.426	266590	46.6	0.152	13	19.1	51.7	11.6	0.379	116175	45351	pg18beta2_o2nofp.cx10d_c32r128
l.x
l.x: create secondary indexes
Performance metrics for all DBMS, not just the ones listed above. Some are normalized by throughput, others are not. Legend for results is here.
ips	qps	rps	rmbps	wps	wmbps	rpq	rkbpq	wpi	wkbpi	csps	cpups	cspq	cpupq	dbgb1	dbgb2	rss	maxop	p50	p99	tag
2816903	0	0	0.0	7278.5	845.3	0.000	0.000	0.003	0.307	41312	15.9	0.015	3	38.4	88.5	7.2	0.043	NA	NA	pg174_o2nofp.cx10a_c32r128
2702704	0	4	0.0	6783.6	787.8	0.000	0.000	0.003	0.298	41634	16.6	0.015	3	38.4	88.5	6.4	0.036	NA	NA	pg175_o2nofp.cx10a_c32r128
2739727	0	5	0.0	7214.5	835.9	0.000	0.000	0.003	0.312	35705	17.4	0.013	3	38.4	88.5	6.4	0.036	NA	NA	pg18beta1_o2nofp.cx10b_c32r128
2739727	0	5	0.0	7036.3	817.1	0.000	0.000	0.003	0.305	36225	17.4	0.013	3	38.4	88.5	6.4	0.043	NA	NA	pg18beta1_o2nofp.cx10cw4_c32r128
2777779	0	5	0.0	7269.5	844.4	0.000	0.000	0.003	0.311	35652	17.4	0.013	3	38.4	88.5	6.4	0.036	NA	NA	pg18beta1_o2nofp.cx10d_c32r128
2777779	0	5	0.0	7221.6	838.3	0.000	0.000	0.003	0.309	35312	17.6	0.013	3	38.4	88.5	7.2	0.027	NA	NA	pg18beta2_o2nofp.cx10b_c32r128
2739727	0	5	0.0	7201.3	835.8	0.000	0.000	0.003	0.312	36362	17.5	0.013	3	38.4	88.5	6.4	0.044	NA	NA	pg18beta2_o2nofp.cx10cw4_c32r128
2777779	0	5	0.0	7382.7	857.2	0.000	0.000	0.003	0.316	36698	17.5	0.013	3	38.4	88.5	7.1	0.034	NA	NA	pg18beta2_o2nofp.cx10d_c32r128
l.i1
l.i1: continue load after secondary indexes created with 50 inserts per transaction
Performance metrics for all DBMS, not just the ones listed above. Some are normalized by throughput, others are not. Legend for results is here.
ips	qps	rps	rmbps	wps	wmbps	rpq	rkbpq	wpi	wkbpi	csps	cpups	cspq	cpupq	dbgb1	dbgb2	rss	maxop	p50	p99	tag
386007	0	686	3.1	6263.2	599.6	0.002	0.008	0.016	1.591	248886	52.2	0.645	65	55.9	152.0	23.9	0.998	22675	3146	pg174_o2nofp.cx10a_c32r128
394089	0	724	3.2	6446.9	612.1	0.002	0.008	0.016	1.590	251099	53.5	0.637	65	55.9	152.0	10.7	0.703	22930	3346	pg175_o2nofp.cx10a_c32r128
403531	0	90	0.4	6647.7	631.5	0.000	0.001	0.016	1.602	247938	54.5	0.614	65	56.2	152.2	32.1	0.598	23257	3596	pg18beta1_o2nofp.cx10b_c32r128
402516	0	87	0.5	6555.0	624.7	0.000	0.001	0.016	1.589	261059	54.2	0.649	65	55.8	151.9	21.5	0.490	22885	3546	pg18beta1_o2nofp.cx10cw4_c32r128
402010	0	111	0.5	6598.0	629.0	0.000	0.001	0.016	1.602	258977	54.3	0.644	65	55.9	152.0	27.6	0.474	22894	3596	pg18beta1_o2nofp.cx10d_c32r128
402516	0	93	0.4	6592.5	627.9	0.000	0.001	0.016	1.597	248074	54.4	0.616	65	56.6	152.7	34.4	0.700	23275	3348	pg18beta2_o2nofp.cx10b_c32r128
404551	0	90	0.5	6604.7	627.1	0.000	0.001	0.016	1.587	263144	53.8	0.650	64	55.9	151.9	37.8	0.452	23020	3496	pg18beta2_o2nofp.cx10cw4_c32r128
400501	0	95	0.5	6551.3	623.6	0.000	0.001	0.016	1.594	254150	53.6	0.635	64	55.9	152.0	35.4	0.738	23075	3498	pg18beta2_o2nofp.cx10d_c32r128
l.i2
l.i2: continue load after secondary indexes created with 5 inserts per transaction
Performance metrics for all DBMS, not just the ones listed above. Some are normalized by throughput, others are not. Legend for results is here.
ips	qps	rps	rmbps	wps	wmbps	rpq	rkbpq	wpi	wkbpi	csps	cpups	cspq	cpupq	dbgb1	dbgb2	rss	maxop	p50	p99	tag
104167	0	1	0.0	1555.6	148.7	0.000	0.000	0.015	1.462	390251	53.0	3.746	244	56.1	152.2	1.2	0.071	4036	2447	pg174_o2nofp.cx10a_c32r128
102960	0	0	0.0	1569.2	149.7	0.000	0.000	0.015	1.489	386972	53.1	3.758	248	56.2	152.2	12.6	0.064	4287	3061	pg175_o2nofp.cx10a_c32r128
107095	0	1	0.0	1600.1	153.6	0.000	0.000	0.015	1.469	398333	54.6	3.719	245	56.4	152.5	5.6	0.063	5079	2233	pg18beta1_o2nofp.cx10b_c32r128
105263	0	0	0.0	1583.0	152.0	0.000	0.000	0.015	1.478	391081	53.8	3.715	245	56.0	152.1	38.5	0.068	4945	2248	pg18beta1_o2nofp.cx10cw4_c32r128
105402	0	1	0.0	1551.7	148.6	0.000	0.000	0.015	1.443	391615	53.8	3.715	245	56.1	152.2	4.1	0.063	4825	2347	pg18beta1_o2nofp.cx10d_c32r128
108844	0	0	0.0	1648.8	157.6	0.000	0.000	0.015	1.483	400096	54.6	3.676	241	56.8	152.9	6.2	0.019	5147	2298	pg18beta2_o2nofp.cx10b_c32r128
107527	0	1	0.0	1632.5	156.2	0.000	0.000	0.015	1.487	396654	54.4	3.689	243	56.1	152.2	2.3	0.070	5016	2303	pg18beta2_o2nofp.cx10cw4_c32r128
102302	0	0	0.0	1551.7	148.2	0.000	0.000	0.015	1.484	381713	52.1	3.731	244	56.1	152.2	22.3	0.061	4686	2303	pg18beta2_o2nofp.cx10d_c32r128
qr100.L1
qr100.L1: range queries with 100 insert/s per client
Performance metrics for all DBMS, not just the ones listed above. Some are normalized by throughput, others are not. Legend for results is here.
ips	qps	rps	rmbps	wps	wmbps	rpq	rkbpq	wpi	wkbpi	csps	cpups	cspq	cpupq	dbgb1	dbgb2	rss	maxop	p50	p99	tag
1977	395158	0	0.0	123.0	10.5	0.000	0.000	0.062	5.420	1505072	42.8	3.809	52	56.1	152.1	0.5	0.008	20090	19435	pg174_o2nofp.cx10a_c32r128
1977	395337	0	0.0	126.3	10.5	0.000	0.000	0.064	5.416	1505834	42.7	3.809	52	56.2	152.2	0.4	0.016	20058	19323	pg175_o2nofp.cx10a_c32r128
1976	389626	0	0.0	120.9	10.5	0.000	0.000	0.061	5.417	1485078	42.7	3.812	53	56.4	152.4	0.5	0.005	19483	18834	pg18beta1_o2nofp.cx10b_c32r128
1977	394628	0	0.0	121.1	10.4	0.000	0.000	0.061	5.411	1503340	42.9	3.810	52	56.0	152.1	0.5	0.008	19786	19131	pg18beta1_o2nofp.cx10cw4_c32r128
1977	387844	0	0.0	120.3	10.5	0.000	0.000	0.061	5.415	1477471	42.7	3.809	53	56.1	152.2	0.4	0.008	19691	18987	pg18beta1_o2nofp.cx10d_c32r128
1977	388556	0	0.0	121.4	10.4	0.000	0.000	0.061	5.401	1480207	42.8	3.810	53	56.8	152.9	0.5	0.028	19834	19136	pg18beta2_o2nofp.cx10b_c32r128
1977	393904	0	0.0	121.2	10.4	0.000	0.000	0.061	5.409	1500500	42.9	3.809	52	56.1	152.1	0.5	0.009	20098	19409	pg18beta2_o2nofp.cx10cw4_c32r128
1977	392702	0	0.0	126.2	10.5	0.000	0.000	0.064	5.423	1495907	42.8	3.809	52	56.1	152.2	0.5	0.009	19819	19051	pg18beta2_o2nofp.cx10d_c32r128
qp100.L2
qp100.L2: point queries with 100 insert/s per client
Performance metrics for all DBMS, not just the ones listed above. Some are normalized by throughput, others are not. Legend for results is here.
ips	qps	rps	rmbps	wps	wmbps	rpq	rkbpq	wpi	wkbpi	csps	cpups	cspq	cpupq	dbgb1	dbgb2	rss	maxop	p50	p99	tag
1977	197320	0	0.0	339.8	17.8	0.000	0.000	0.172	9.223	760092	41.5	3.852	101	56.1	149.0	0.5	0.010	10005	9749	pg174_o2nofp.cx10a_c32r128
1977	198067	0	0.0	343.0	17.8	0.000	0.000	0.174	9.235	763054	41.1	3.852	100	56.2	149.0	0.5	0.010	10021	9781	pg175_o2nofp.cx10a_c32r128
1977	196234	0	0.0	337.8	17.8	0.000	0.000	0.171	9.223	756087	41.4	3.853	101	56.4	149.3	0.1	0.006	9893	9702	pg18beta1_o2nofp.cx10b_c32r128
1977	197758	0	0.0	338.8	17.8	0.000	0.000	0.171	9.216	761899	41.3	3.853	100	56.1	148.8	0.5	0.008	10101	9893	pg18beta1_o2nofp.cx10cw4_c32r128
1978	195817	0	0.0	337.9	17.8	0.000	0.000	0.171	9.214	754018	41.3	3.851	101	56.1	149.0	0.4	0.006	9925	9717	pg18beta1_o2nofp.cx10d_c32r128
1977	195689	1	0.0	340.4	17.9	0.000	0.000	0.172	9.249	753950	41.4	3.853	102	56.8	149.7	0.5	0.008	9724	9526	pg18beta2_o2nofp.cx10b_c32r128
1977	195961	0	0.0	337.8	17.8	0.000	0.000	0.171	9.218	754949	41.5	3.853	102	56.1	148.9	0.5	0.012	10037	9845	pg18beta2_o2nofp.cx10cw4_c32r128
1977	196612	0	0.0	338.1	17.8	0.000	0.000	0.171	9.224	757515	41.3	3.853	101	56.1	149.1	0.5	0.009	10021	9813	pg18beta2_o2nofp.cx10d_c32r128
qr500.L3
qr500.L3: range queries with 500 insert/s per client
Performance metrics for all DBMS, not just the ones listed above. Some are normalized by throughput, others are not. Legend for results is here.
ips	qps	rps	rmbps	wps	wmbps	rpq	rkbpq	wpi	wkbpi	csps	cpups	cspq	cpupq	dbgb1	dbgb2	rss	maxop	p50	p99	tag
9885	382722	0	0.0	512.5	27.4	0.000	0.000	0.052	2.838	1453421	43.5	3.798	55	56.2	142.4	48.5	0.065	19307	18131	pg174_o2nofp.cx10a_c32r128
9874	382515	0	0.0	515.3	27.4	0.000	0.000	0.052	2.843	1453940	43.6	3.801	55	56.3	142.4	35.0	0.065	19403	18044	pg175_o2nofp.cx10a_c32r128
9879	381016	0	0.0	513.3	27.9	0.000	0.000	0.052	2.889	1447699	43.5	3.800	55	56.4	142.6	15.1	0.062	19291	18172	pg18beta1_o2nofp.cx10b_c32r128
9885	382306	0	0.0	510.2	27.5	0.000	0.000	0.052	2.853	1451856	43.6	3.798	55	56.1	142.2	4.4	0.063	19252	18156	pg18beta1_o2nofp.cx10cw4_c32r128
9885	380116	0	0.0	510.7	27.7	0.000	0.000	0.052	2.875	1443351	43.5	3.797	55	56.2	142.4	6.4	0.069	19115	17996	pg18beta1_o2nofp.cx10d_c32r128
9885	378877	0	0.0	516.7	27.7	0.000	0.000	0.052	2.873	1438698	43.5	3.797	55	56.8	142.9	8.0	0.080	19051	17996	pg18beta2_o2nofp.cx10b_c32r128
9885	380643	0	0.0	508.9	27.7	0.000	0.000	0.051	2.864	1445181	43.6	3.797	55	56.1	142.2	7.0	0.076	18818	17709	pg18beta2_o2nofp.cx10cw4_c32r128
9885	382885	1	0.0	514.3	27.8	0.000	0.000	0.052	2.885	1454294	43.6	3.798	55	56.2	142.4	4.4	0.074	19429	18307	pg18beta2_o2nofp.cx10d_c32r128
qp500.L4
qp500.L4: point queries with 500 insert/s per client
Performance metrics for all DBMS, not just the ones listed above. Some are normalized by throughput, others are not. Legend for results is here.
ips	qps	rps	rmbps	wps	wmbps	rpq	rkbpq	wpi	wkbpi	csps	cpups	cspq	cpupq	dbgb1	dbgb2	rss	maxop	p50	p99	tag
9885	195661	0	0.0	341.7	29.0	0.000	0.000	0.035	3.000	752506	41.9	3.846	103	56.2	138.4	32.8	0.089	9941	9621	pg174_o2nofp.cx10a_c32r128
9885	197586	0	0.0	341.6	29.2	0.000	0.000	0.035	3.020	759873	41.9	3.846	102	56.4	138.4	20.1	0.066	9989	9689	pg175_o2nofp.cx10a_c32r128
9879	195721	4	0.2	346.1	28.0	0.000	0.001	0.035	2.901	753239	42.1	3.849	103	56.5	138.6	8.5	0.064	9909	9628	pg18beta1_o2nofp.cx10b_c32r128
9885	196855	0	0.0	344.2	27.6	0.000	0.000	0.035	2.860	757201	42.0	3.846	102	56.2	138.1	3.4	0.069	10037	9717	pg18beta1_o2nofp.cx10cw4_c32r128
9879	194291	0	0.0	338.3	27.4	0.000	0.000	0.034	2.837	747937	42.0	3.850	104	56.3	138.3	2.9	0.062	9765	9494	pg18beta1_o2nofp.cx10d_c32r128
9885	194856	0	0.0	342.2	27.8	0.000	0.000	0.035	2.884	749409	42.0	3.846	103	56.8	138.8	4.5	0.081	9941	9622	pg18beta2_o2nofp.cx10b_c32r128
9885	195419	0	0.0	339.7	27.7	0.000	0.000	0.034	2.869	751714	42.1	3.847	103	56.2	138.2	7.9	0.070	9960	9701	pg18beta2_o2nofp.cx10cw4_c32r128
9885	195338	0	0.0	341.4	27.5	0.000	0.000	0.035	2.852	751459	42.0	3.847	103	56.2	138.4	12.7	0.023	9893	9590	pg18beta2_o2nofp.cx10d_c32r128
qr1000.L5
qr1000.L5: range queries with 1000 insert/s per client
Performance metrics for all DBMS, not just the ones listed above. Some are normalized by throughput, others are not. Legend for results is here.
ips	qps	rps	rmbps	wps	wmbps	rpq	rkbpq	wpi	wkbpi	csps	cpups	cspq	cpupq	dbgb1	dbgb2	rss	maxop	p50	p99	tag
19758	379160	0	0.0	397.1	33.4	0.000	0.000	0.020	1.732	1435304	44.5	3.785	56	56.3	134.7	35.8	0.071	19282	18060	pg174_o2nofp.cx10a_c32r128
19758	378895	0	0.0	391.5	33.4	0.000	0.000	0.020	1.732	1434190	44.5	3.785	56	56.3	134.6	28.6	0.078	18907	17677	pg175_o2nofp.cx10a_c32r128
19758	375844	0	0.0	409.6	35.1	0.000	0.000	0.021	1.817	1423055	44.5	3.786	57	56.4	135.0	11.5	0.103	18764	17581	pg18beta1_o2nofp.cx10b_c32r128
19758	380142	0	0.0	415.0	35.4	0.000	0.000	0.021	1.837	1439666	44.6	3.787	56	56.1	134.6	3.7	0.102	19350	18075	pg18beta1_o2nofp.cx10cw4_c32r128
19758	372142	4	0.2	409.1	35.4	0.000	0.000	0.021	1.837	1408802	44.6	3.786	58	56.2	134.8	5.4	0.093	18732	17439	pg18beta1_o2nofp.cx10d_c32r128
19758	374028	0	0.0	407.4	35.2	0.000	0.000	0.021	1.824	1415281	44.6	3.784	57	56.7	135.2	12.1	0.096	18891	17580	pg18beta2_o2nofp.cx10b_c32r128
19758	375702	0	0.0	405.1	35.0	0.000	0.000	0.021	1.816	1422035	44.5	3.785	57	56.3	134.8	5.5	0.099	18987	17785	pg18beta2_o2nofp.cx10cw4_c32r128
19758	377862	0	0.0	408.9	35.4	0.000	0.000	0.021	1.836	1430890	44.5	3.787	57	56.2	134.8	8.8	0.101	19036	17613	pg18beta2_o2nofp.cx10d_c32r128
qp1000.L6
qp1000.L6: point queries with 1000 insert/s per client
Performance metrics for all DBMS, not just the ones listed above. Some are normalized by throughput, others are not. Legend for results is here.
ips	qps	rps	rmbps	wps	wmbps	rpq	rkbpq	wpi	wkbpi	csps	cpups	cspq	cpupq	dbgb1	dbgb2	rss	maxop	p50	p99	tag
19758	194506	0	0.0	407.3	35.8	0.000	0.000	0.021	1.854	747294	43.1	3.842	106	56.1	133.4	33.3	0.088	9813	9398	pg174_o2nofp.cx10a_c32r128
19758	196025	0	0.0	404.4	35.8	0.000	0.000	0.020	1.854	752960	43.1	3.841	106	56.3	133.5	23.8	0.082	10009	9529	pg175_o2nofp.cx10a_c32r128
19758	193883	0	0.0	397.5	35.0	0.000	0.000	0.020	1.813	744945	43.1	3.842	107	56.0	133.3	4.0	0.101	9893	9434	pg18beta1_o2nofp.cx10b_c32r128
19758	195350	0	0.0	404.4	34.9	0.000	0.000	0.020	1.809	750392	43.2	3.841	106	55.9	133.1	3.2	0.099	9946	9401	pg18beta1_o2nofp.cx10cw4_c32r128
19758	193014	0	0.0	396.9	35.0	0.000	0.000	0.020	1.814	741327	43.2	3.841	107	56.1	133.4	2.3	0.096	9821	9395	pg18beta1_o2nofp.cx10d_c32r128
19758	192619	0	0.0	395.6	35.1	0.000	0.000	0.020	1.820	739698	43.1	3.840	107	56.2	133.5	8.9	0.104	9845	9350	pg18beta2_o2nofp.cx10b_c32r128
19758	193496	0	0.0	397.7	35.0	0.000	0.000	0.020	1.815	743531	43.1	3.843	107	56.0	133.2	16.0	0.095	9797	9382	pg18beta2_o2nofp.cx10cw4_c32r128
19758	193708	0	0.0	392.9	34.8	0.000	0.000	0.020	1.801	744210	43.1	3.842	107	56.0	133.3	8.1	0.102	9817	9429	pg18beta2_o2nofp.cx10d_c32r128
l.i0
- l.i0: load without secondary indexes
- Legend for results is here.
- Each entry lists the percentage of responses that fit in that bucket (slower than max time for previous bucket, faster than min time for next bucket).
Insert response time histogram
256us	1ms	4ms	16ms	64ms	256ms	1s	4s	16s	gt	max	tag
0.000	94.027	5.940	0.015	0.002	0.010	0.006	0.000	0.000	0.000	0.639	pg174_o2nofp.cx10a_c32r128
0.000	94.811	5.148	0.019	0.003	0.012	0.006	0.000	0.000	0.000	0.634	pg175_o2nofp.cx10a_c32r128
0.000	95.284	4.661	0.025	0.013	0.012	0.005	0.000	0.000	0.000	0.451	pg18beta1_o2nofp.cx10b_c32r128
0.000	95.602	4.350	0.020	0.011	0.010	0.008	0.000	0.000	0.000	0.544	pg18beta1_o2nofp.cx10cw4_c32r128
0.000	95.422	4.534	0.021	0.007	0.009	0.007	0.000	0.000	0.000	0.550	pg18beta1_o2nofp.cx10d_c32r128
0.000	95.921	4.027	0.024	0.012	0.009	0.007	0.000	0.000	0.000	0.597	pg18beta2_o2nofp.cx10b_c32r128
0.000	95.562	4.383	0.023	0.013	0.014	0.005	0.000	0.000	0.000	0.485	pg18beta2_o2nofp.cx10cw4_c32r128
0.000	95.773	4.169	0.028	0.013	0.014	0.004	0.000	0.000	0.000	0.379	pg18beta2_o2nofp.cx10d_c32r128
l.x
- l.x: create secondary indexes
- Legend for results is here.
- Each entry lists the percentage of responses that fit in that bucket (slower than max time for previous bucket, faster than min time for next bucket).
TODO - determine whether there is data for create index response time
l.i1
- l.i1: continue load after secondary indexes created with 50 inserts per transaction
- Legend for results is here.
- Each entry lists the percentage of responses that fit in that bucket (slower than max time for previous bucket, faster than min time for next bucket).
Insert response time histogram
256us	1ms	4ms	16ms	64ms	256ms	1s	4s	16s	gt	max	tag
0.000	2.012	89.825	7.624	0.532	0.006	0.001	0.000	0.000	0.000	0.998	pg174_o2nofp.cx10a_c32r128
0.000	2.045	90.037	7.370	0.543	0.004	0.001	0.000	0.000	0.000	0.703	pg175_o2nofp.cx10a_c32r128
0.000	1.966	90.856	6.537	0.636	0.005	nonzero	0.000	0.000	0.000	0.598	pg18beta1_o2nofp.cx10b_c32r128
0.000	1.781	90.640	6.970	0.605	0.003	0.001	0.000	0.000	0.000	0.490	pg18beta1_o2nofp.cx10cw4_c32r128
0.000	1.593	90.759	7.010	0.632	0.005	0.001	0.000	0.000	0.000	0.474	pg18beta1_o2nofp.cx10d_c32r128
0.000	2.091	90.756	6.528	0.620	0.004	0.001	0.000	0.000	0.000	0.700	pg18beta2_o2nofp.cx10b_c32r128
0.000	1.820	90.748	6.811	0.615	0.005	0.001	0.000	0.000	0.000	0.452	pg18beta2_o2nofp.cx10cw4_c32r128
0.000	1.950	90.572	6.846	0.626	0.005	0.001	0.000	0.000	0.000	0.738	pg18beta2_o2nofp.cx10d_c32r128
Delete response time histogram
256us	1ms	4ms	16ms	64ms	256ms	1s	4s	16s	gt	max	tag
0.000	20.618	76.103	3.026	0.249	0.004	nonzero	nonzero	0.000	0.000	1.074	pg174_o2nofp.cx10a_c32r128
0.000	20.908	75.901	2.935	0.252	0.003	0.001	0.000	0.000	0.000	0.702	pg175_o2nofp.cx10a_c32r128
0.000	20.957	76.010	2.691	0.338	0.004	nonzero	0.000	0.000	0.000	0.598	pg18beta1_o2nofp.cx10b_c32r128
0.000	20.820	76.204	2.657	0.316	0.002	nonzero	0.000	0.000	0.000	0.494	pg18beta1_o2nofp.cx10cw4_c32r128
0.000	21.072	75.904	2.681	0.340	0.003	0.001	0.000	0.000	0.000	0.464	pg18beta1_o2nofp.cx10d_c32r128
0.000	20.652	76.423	2.594	0.328	0.003	nonzero	0.000	0.000	0.000	0.685	pg18beta2_o2nofp.cx10b_c32r128
0.000	22.199	75.114	2.374	0.308	0.004	nonzero	0.000	0.000	0.000	0.450	pg18beta2_o2nofp.cx10cw4_c32r128
0.000	21.555	75.611	2.507	0.324	0.003	nonzero	0.000	0.000	0.000	0.737	pg18beta2_o2nofp.cx10d_c32r128
l.i2
- l.i2: continue load after secondary indexes created with 5 inserts per transaction
- Legend for results is here.
- Each entry lists the percentage of responses that fit in that bucket (slower than max time for previous bucket, faster than min time for next bucket).
Insert response time histogram
256us	1ms	4ms	16ms	64ms	256ms	1s	4s	16s	gt	max	tag
92.669	7.123	0.199	0.009	nonzero	nonzero	0.000	0.000	0.000	0.000	0.071	pg174_o2nofp.cx10a_c32r128
92.783	7.022	0.181	0.014	nonzero	0.000	0.000	0.000	0.000	0.000	0.064	pg175_o2nofp.cx10a_c32r128
92.168	7.621	0.186	0.024	nonzero	0.000	0.000	0.000	0.000	0.000	0.063	pg18beta1_o2nofp.cx10b_c32r128
92.477	7.328	0.176	0.019	0.001	nonzero	0.000	0.000	0.000	0.000	0.068	pg18beta1_o2nofp.cx10cw4_c32r128
92.673	7.138	0.174	0.015	nonzero	0.000	0.000	0.000	0.000	0.000	0.063	pg18beta1_o2nofp.cx10d_c32r128
92.142	7.663	0.186	0.009	nonzero	0.000	0.000	0.000	0.000	0.000	0.019	pg18beta2_o2nofp.cx10b_c32r128
92.561	7.243	0.188	0.009	nonzero	nonzero	0.000	0.000	0.000	0.000	0.070	pg18beta2_o2nofp.cx10cw4_c32r128
92.413	7.397	0.175	0.015	nonzero	0.000	0.000	0.000	0.000	0.000	0.061	pg18beta2_o2nofp.cx10d_c32r128
Delete response time histogram
256us	1ms	4ms	16ms	64ms	256ms	1s	4s	16s	gt	max	tag
3.208	59.110	37.638	0.044	nonzero	nonzero	0.000	0.000	0.000	0.000	0.072	pg174_o2nofp.cx10a_c32r128
3.302	56.252	40.389	0.057	nonzero	nonzero	0.000	0.000	0.000	0.000	0.064	pg175_o2nofp.cx10a_c32r128
2.584	62.020	35.320	0.075	0.001	0.000	0.000	0.000	0.000	0.000	0.064	pg18beta1_o2nofp.cx10b_c32r128
2.701	61.289	35.942	0.067	0.001	nonzero	0.000	0.000	0.000	0.000	0.068	pg18beta1_o2nofp.cx10cw4_c32r128
2.725	60.149	37.066	0.058	0.001	0.000	0.000	0.000	0.000	0.000	0.063	pg18beta1_o2nofp.cx10d_c32r128
2.594	65.027	32.330	0.049	nonzero	0.000	0.000	0.000	0.000	0.000	0.026	pg18beta2_o2nofp.cx10b_c32r128
2.645	63.564	33.741	0.049	nonzero	nonzero	0.000	0.000	0.000	0.000	0.070	pg18beta2_o2nofp.cx10cw4_c32r128
2.683	62.363	34.893	0.060	0.001	0.000	0.000	0.000	0.000	0.000	0.061	pg18beta2_o2nofp.cx10d_c32r128
qr100.L1
- qr100.L1: range queries with 100 insert/s per client
- Legend for results is here.
- Each entry lists the percentage of responses that fit in that bucket (slower than max time for previous bucket, faster than min time for next bucket).
Query response time histogram
256us	1ms	4ms	16ms	64ms	256ms	1s	4s	16s	gt	max	tag
99.998	0.001	0.001	nonzero	0.000	0.000	0.000	0.000	0.000	0.000	0.008	pg174_o2nofp.cx10a_c32r128
99.998	0.001	0.001	nonzero	nonzero	0.000	0.000	0.000	0.000	0.000	0.016	pg175_o2nofp.cx10a_c32r128
99.998	0.001	0.001	nonzero	0.000	0.000	0.000	0.000	0.000	0.000	0.005	pg18beta1_o2nofp.cx10b_c32r128
99.998	0.001	0.001	nonzero	0.000	0.000	0.000	0.000	0.000	0.000	0.008	pg18beta1_o2nofp.cx10cw4_c32r128
99.998	0.001	0.001	nonzero	0.000	0.000	0.000	0.000	0.000	0.000	0.008	pg18beta1_o2nofp.cx10d_c32r128
99.998	0.001	0.001	nonzero	nonzero	0.000	0.000	0.000	0.000	0.000	0.028	pg18beta2_o2nofp.cx10b_c32r128
99.998	0.001	0.001	nonzero	0.000	0.000	0.000	0.000	0.000	0.000	0.009	pg18beta2_o2nofp.cx10cw4_c32r128
99.998	0.001	0.001	nonzero	0.000	0.000	0.000	0.000	0.000	0.000	0.009	pg18beta2_o2nofp.cx10d_c32r128
Insert response time histogram
256us	1ms	4ms	16ms	64ms	256ms	1s	4s	16s	gt	max	tag
0.000	0.010	99.725	0.265	0.000	0.000	0.000	0.000	0.000	0.000	0.009	pg174_o2nofp.cx10a_c32r128
0.000	0.001	99.701	0.297	0.000	0.000	0.000	0.000	0.000	0.000	0.012	pg175_o2nofp.cx10a_c32r128
0.000	0.013	99.706	0.282	0.000	0.000	0.000	0.000	0.000	0.000	0.014	pg18beta1_o2nofp.cx10b_c32r128
0.000	0.019	99.753	0.228	0.000	0.000	0.000	0.000	0.000	0.000	0.010	pg18beta1_o2nofp.cx10cw4_c32r128
0.000	0.003	99.747	0.250	0.000	0.000	0.000	0.000	0.000	0.000	0.011	pg18beta1_o2nofp.cx10d_c32r128
0.000	0.008	99.708	0.279	0.004	0.000	0.000	0.000	0.000	0.000	0.028	pg18beta2_o2nofp.cx10b_c32r128
0.000	0.021	99.721	0.258	0.000	0.000	0.000	0.000	0.000	0.000	0.010	pg18beta2_o2nofp.cx10cw4_c32r128
0.000	0.000	99.694	0.306	0.000	0.000	0.000	0.000	0.000	0.000	0.015	pg18beta2_o2nofp.cx10d_c32r128
Delete response time histogram
256us	1ms	4ms	16ms	64ms	256ms	1s	4s	16s	gt	max	tag
0.000	67.778	32.193	0.029	0.000	0.000	0.000	0.000	0.000	0.000	0.009	pg174_o2nofp.cx10a_c32r128
0.000	67.924	32.062	0.011	0.003	0.000	0.000	0.000	0.000	0.000	0.021	pg175_o2nofp.cx10a_c32r128
0.000	67.972	32.015	0.013	0.000	0.000	0.000	0.000	0.000	0.000	0.013	pg18beta1_o2nofp.cx10b_c32r128
0.000	68.243	31.751	0.006	0.000	0.000	0.000	0.000	0.000	0.000	0.005	pg18beta1_o2nofp.cx10cw4_c32r128
0.000	67.464	32.519	0.017	0.000	0.000	0.000	0.000	0.000	0.000	0.011	pg18beta1_o2nofp.cx10d_c32r128
0.000	68.872	31.110	0.017	0.001	0.000	0.000	0.000	0.000	0.000	0.026	pg18beta2_o2nofp.cx10b_c32r128
0.000	69.632	30.347	0.021	0.000	0.000	0.000	0.000	0.000	0.000	0.007	pg18beta2_o2nofp.cx10cw4_c32r128
0.000	69.935	30.047	0.018	0.000	0.000	0.000	0.000	0.000	0.000	0.015	pg18beta2_o2nofp.cx10d_c32r128
qp100.L2
- qp100.L2: point queries with 100 insert/s per client
- Legend for results is here.
- Each entry lists the percentage of responses that fit in that bucket (slower than max time for previous bucket, faster than min time for next bucket).
Query response time histogram
256us	1ms	4ms	16ms	64ms	256ms	1s	4s	16s	gt	max	tag
99.995	0.004	0.001	nonzero	0.000	0.000	0.000	0.000	0.000	0.000	0.010	pg174_o2nofp.cx10a_c32r128
99.995	0.004	0.001	nonzero	0.000	0.000	0.000	0.000	0.000	0.000	0.010	pg175_o2nofp.cx10a_c32r128
99.995	0.004	0.001	nonzero	0.000	0.000	0.000	0.000	0.000	0.000	0.006	pg18beta1_o2nofp.cx10b_c32r128
99.995	0.004	0.001	nonzero	0.000	0.000	0.000	0.000	0.000	0.000	0.008	pg18beta1_o2nofp.cx10cw4_c32r128
99.995	0.004	0.001	nonzero	0.000	0.000	0.000	0.000	0.000	0.000	0.006	pg18beta1_o2nofp.cx10d_c32r128
99.994	0.004	0.001	nonzero	0.000	0.000	0.000	0.000	0.000	0.000	0.008	pg18beta2_o2nofp.cx10b_c32r128
99.995	0.004	0.001	nonzero	0.000	0.000	0.000	0.000	0.000	0.000	0.012	pg18beta2_o2nofp.cx10cw4_c32r128
99.994	0.004	0.001	nonzero	0.000	0.000	0.000	0.000	0.000	0.000	0.009	pg18beta2_o2nofp.cx10d_c32r128
Insert response time histogram
256us	1ms	4ms	16ms	64ms	256ms	1s	4s	16s	gt	max	tag
0.000	0.000	99.694	0.306	0.000	0.000	0.000	0.000	0.000	0.000	0.012	pg174_o2nofp.cx10a_c32r128
0.000	0.000	99.736	0.264	0.000	0.000	0.000	0.000	0.000	0.000	0.014	pg175_o2nofp.cx10a_c32r128
0.000	0.000	99.743	0.251	0.006	0.000	0.000	0.000	0.000	0.000	0.024	pg18beta1_o2nofp.cx10b_c32r128
0.000	0.000	99.750	0.246	0.004	0.000	0.000	0.000	0.000	0.000	0.020	pg18beta1_o2nofp.cx10cw4_c32r128
0.000	0.000	99.758	0.236	0.006	0.000	0.000	0.000	0.000	0.000	0.021	pg18beta1_o2nofp.cx10d_c32r128
0.000	0.000	99.731	0.269	0.000	0.000	0.000	0.000	0.000	0.000	0.014	pg18beta2_o2nofp.cx10b_c32r128
0.000	0.000	99.700	0.293	0.007	0.000	0.000	0.000	0.000	0.000	0.025	pg18beta2_o2nofp.cx10cw4_c32r128
0.000	0.000	99.614	0.385	0.001	0.000	0.000	0.000	0.000	0.000	0.024	pg18beta2_o2nofp.cx10d_c32r128
Delete response time histogram
256us	1ms	4ms	16ms	64ms	256ms	1s	4s	16s	gt	max	tag
0.000	19.518	80.404	0.078	0.000	0.000	0.000	0.000	0.000	0.000	0.009	pg174_o2nofp.cx10a_c32r128
0.000	19.089	80.849	0.062	0.000	0.000	0.000	0.000	0.000	0.000	0.009	pg175_o2nofp.cx10a_c32r128
0.000	19.206	80.722	0.072	0.000	0.000	0.000	0.000	0.000	0.000	0.010	pg18beta1_o2nofp.cx10b_c32r128
0.000	19.774	80.165	0.060	0.001	0.000	0.000	0.000	0.000	0.000	0.019	pg18beta1_o2nofp.cx10cw4_c32r128
0.000	19.250	80.692	0.057	0.001	0.000	0.000	0.000	0.000	0.000	0.020	pg18beta1_o2nofp.cx10d_c32r128
0.000	16.367	83.574	0.060	0.000	0.000	0.000	0.000	0.000	0.000	0.010	pg18beta2_o2nofp.cx10b_c32r128
0.000	18.606	81.333	0.061	0.000	0.000	0.000	0.000	0.000	0.000	0.011	pg18beta2_o2nofp.cx10cw4_c32r128
0.000	20.453	79.454	0.093	0.000	0.000	0.000	0.000	0.000	0.000	0.012	pg18beta2_o2nofp.cx10d_c32r128
qr500.L3
- qr500.L3: range queries with 500 insert/s per client
- Legend for results is here.
- Each entry lists the percentage of responses that fit in that bucket (slower than max time for previous bucket, faster than min time for next bucket).
Query response time histogram
256us	1ms	4ms	16ms	64ms	256ms	1s	4s	16s	gt	max	tag
99.994	0.003	0.003	nonzero	nonzero	nonzero	0.000	0.000	0.000	0.000	0.065	pg174_o2nofp.cx10a_c32r128
99.994	0.003	0.003	nonzero	nonzero	nonzero	0.000	0.000	0.000	0.000	0.065	pg175_o2nofp.cx10a_c32r128
99.994	0.003	0.003	nonzero	nonzero	0.000	0.000	0.000	0.000	0.000	0.062	pg18beta1_o2nofp.cx10b_c32r128
99.994	0.003	0.003	nonzero	nonzero	0.000	0.000	0.000	0.000	0.000	0.063	pg18beta1_o2nofp.cx10cw4_c32r128
99.994	0.003	0.003	nonzero	nonzero	nonzero	0.000	0.000	0.000	0.000	0.069	pg18beta1_o2nofp.cx10d_c32r128
99.994	0.003	0.003	nonzero	nonzero	nonzero	0.000	0.000	0.000	0.000	0.080	pg18beta2_o2nofp.cx10b_c32r128
99.994	0.003	0.003	nonzero	nonzero	nonzero	0.000	0.000	0.000	0.000	0.076	pg18beta2_o2nofp.cx10cw4_c32r128
99.994	0.003	0.003	nonzero	nonzero	nonzero	0.000	0.000	0.000	0.000	0.074	pg18beta2_o2nofp.cx10d_c32r128
Insert response time histogram
256us	1ms	4ms	16ms	64ms	256ms	1s	4s	16s	gt	max	tag
0.000	10.428	88.583	0.961	0.028	0.000	0.000	0.000	0.000	0.000	0.032	pg174_o2nofp.cx10a_c32r128
0.000	5.807	93.497	0.682	0.014	0.000	0.000	0.000	0.000	0.000	0.023	pg175_o2nofp.cx10a_c32r128
0.000	11.692	87.193	1.076	0.039	0.000	0.000	0.000	0.000	0.000	0.037	pg18beta1_o2nofp.cx10b_c32r128
0.000	11.482	87.661	0.828	0.029	0.000	0.000	0.000	0.000	0.000	0.053	pg18beta1_o2nofp.cx10cw4_c32r128
0.000	9.155	89.767	1.026	0.052	0.000	0.000	0.000	0.000	0.000	0.035	pg18beta1_o2nofp.cx10d_c32r128
0.000	6.109	93.154	0.703	0.034	0.000	0.000	0.000	0.000	0.000	0.042	pg18beta2_o2nofp.cx10b_c32r128
0.000	10.371	88.733	0.864	0.033	0.000	0.000	0.000	0.000	0.000	0.030	pg18beta2_o2nofp.cx10cw4_c32r128
0.000	12.166	86.667	1.105	0.062	0.000	0.000	0.000	0.000	0.000	0.033	pg18beta2_o2nofp.cx10d_c32r128
Delete response time histogram
256us	1ms	4ms	16ms	64ms	256ms	1s	4s	16s	gt	max	tag
0.000	54.087	45.333	0.569	0.011	0.000	0.000	0.000	0.000	0.000	0.026	pg174_o2nofp.cx10a_c32r128
0.000	52.480	47.056	0.458	0.006	0.000	0.000	0.000	0.000	0.000	0.021	pg175_o2nofp.cx10a_c32r128
0.000	51.549	47.774	0.657	0.021	0.000	0.000	0.000	0.000	0.000	0.031	pg18beta1_o2nofp.cx10b_c32r128
0.000	52.778	46.708	0.496	0.018	0.000	0.000	0.000	0.000	0.000	0.052	pg18beta1_o2nofp.cx10cw4_c32r128
0.000	52.249	47.137	0.593	0.021	0.000	0.000	0.000	0.000	0.000	0.027	pg18beta1_o2nofp.cx10d_c32r128
0.000	49.759	49.778	0.444	0.019	0.000	0.000	0.000	0.000	0.000	0.038	pg18beta2_o2nofp.cx10b_c32r128
0.000	52.822	46.653	0.516	0.010	0.000	0.000	0.000	0.000	0.000	0.020	pg18beta2_o2nofp.cx10cw4_c32r128
0.000	54.280	45.080	0.613	0.027	0.000	0.000	0.000	0.000	0.000	0.025	pg18beta2_o2nofp.cx10d_c32r128
qp500.L4
- qp500.L4: point queries with 500 insert/s per client
- Legend for results is here.
- Each entry lists the percentage of responses that fit in that bucket (slower than max time for previous bucket, faster than min time for next bucket).
Query response time histogram
256us	1ms	4ms	16ms	64ms	256ms	1s	4s	16s	gt	max	tag
99.989	0.007	0.003	nonzero	nonzero	nonzero	0.000	0.000	0.000	0.000	0.089	pg174_o2nofp.cx10a_c32r128
99.990	0.007	0.003	nonzero	nonzero	nonzero	0.000	0.000	0.000	0.000	0.066	pg175_o2nofp.cx10a_c32r128
99.989	0.007	0.004	nonzero	nonzero	0.000	0.000	0.000	0.000	0.000	0.064	pg18beta1_o2nofp.cx10b_c32r128
99.989	0.007	0.004	nonzero	nonzero	nonzero	0.000	0.000	0.000	0.000	0.069	pg18beta1_o2nofp.cx10cw4_c32r128
99.989	0.007	0.003	nonzero	nonzero	0.000	0.000	0.000	0.000	0.000	0.062	pg18beta1_o2nofp.cx10d_c32r128
99.989	0.008	0.003	nonzero	nonzero	nonzero	0.000	0.000	0.000	0.000	0.081	pg18beta2_o2nofp.cx10b_c32r128
99.989	0.007	0.004	nonzero	nonzero	nonzero	0.000	0.000	0.000	0.000	0.070	pg18beta2_o2nofp.cx10cw4_c32r128
99.989	0.008	0.003	nonzero	nonzero	0.000	0.000	0.000	0.000	0.000	0.023	pg18beta2_o2nofp.cx10d_c32r128
Insert response time histogram
256us	1ms	4ms	16ms	64ms	256ms	1s	4s	16s	gt	max	tag
0.000	11.164	88.131	0.683	0.021	0.000	0.000	0.000	0.000	0.000	0.045	pg174_o2nofp.cx10a_c32r128
0.000	7.133	92.100	0.720	0.048	0.000	0.000	0.000	0.000	0.000	0.039	pg175_o2nofp.cx10a_c32r128
0.000	8.869	90.512	0.606	0.013	0.000	0.000	0.000	0.000	0.000	0.038	pg18beta1_o2nofp.cx10b_c32r128
0.000	8.105	91.263	0.611	0.022	0.000	0.000	0.000	0.000	0.000	0.042	pg18beta1_o2nofp.cx10cw4_c32r128
0.000	8.117	91.383	0.483	0.017	0.000	0.000	0.000	0.000	0.000	0.022	pg18beta1_o2nofp.cx10d_c32r128
0.000	4.625	94.737	0.614	0.023	0.000	0.000	0.000	0.000	0.000	0.038	pg18beta2_o2nofp.cx10b_c32r128
0.000	8.385	90.859	0.711	0.044	0.000	0.000	0.000	0.000	0.000	0.038	pg18beta2_o2nofp.cx10cw4_c32r128
0.000	8.576	90.656	0.740	0.028	0.000	0.000	0.000	0.000	0.000	0.039	pg18beta2_o2nofp.cx10d_c32r128
Delete response time histogram
256us	1ms	4ms	16ms	64ms	256ms	1s	4s	16s	gt	max	tag
0.000	47.969	51.501	0.516	0.014	0.000	0.000	0.000	0.000	0.000	0.026	pg174_o2nofp.cx10a_c32r128
0.000	47.044	52.360	0.555	0.041	0.000	0.000	0.000	0.000	0.000	0.038	pg175_o2nofp.cx10a_c32r128
0.000	48.063	51.513	0.412	0.012	0.000	0.000	0.000	0.000	0.000	0.031	pg18beta1_o2nofp.cx10b_c32r128
0.000	44.428	55.092	0.462	0.018	0.000	0.000	0.000	0.000	0.000	0.050	pg18beta1_o2nofp.cx10cw4_c32r128
0.000	46.629	52.993	0.363	0.016	0.000	0.000	0.000	0.000	0.000	0.032	pg18beta1_o2nofp.cx10d_c32r128
0.000	44.873	54.604	0.506	0.016	0.000	0.000	0.000	0.000	0.000	0.032	pg18beta2_o2nofp.cx10b_c32r128
0.000	47.041	52.384	0.540	0.035	0.000	0.000	0.000	0.000	0.000	0.036	pg18beta2_o2nofp.cx10cw4_c32r128
0.000	48.260	51.223	0.495	0.022	0.000	0.000	0.000	0.000	0.000	0.023	pg18beta2_o2nofp.cx10d_c32r128
qr1000.L5
- qr1000.L5: range queries with 1000 insert/s per client
- Legend for results is here.
- Each entry lists the percentage of responses that fit in that bucket (slower than max time for previous bucket, faster than min time for next bucket).
Query response time histogram
256us	1ms	4ms	16ms	64ms	256ms	1s	4s	16s	gt	max	tag
99.990	0.006	0.004	nonzero	nonzero	nonzero	0.000	0.000	0.000	0.000	0.071	pg174_o2nofp.cx10a_c32r128
99.990	0.006	0.004	nonzero	nonzero	nonzero	0.000	0.000	0.000	0.000	0.078	pg175_o2nofp.cx10a_c32r128
99.990	0.006	0.004	nonzero	nonzero	nonzero	0.000	0.000	0.000	0.000	0.103	pg18beta1_o2nofp.cx10b_c32r128
99.989	0.007	0.004	nonzero	nonzero	nonzero	0.000	0.000	0.000	0.000	0.102	pg18beta1_o2nofp.cx10cw4_c32r128
99.989	0.007	0.004	nonzero	nonzero	nonzero	0.000	0.000	0.000	0.000	0.093	pg18beta1_o2nofp.cx10d_c32r128
99.989	0.007	0.004	nonzero	nonzero	nonzero	0.000	0.000	0.000	0.000	0.096	pg18beta2_o2nofp.cx10b_c32r128
99.989	0.007	0.004	nonzero	nonzero	nonzero	0.000	0.000	0.000	0.000	0.099	pg18beta2_o2nofp.cx10cw4_c32r128
99.989	0.007	0.004	nonzero	nonzero	nonzero	0.000	0.000	0.000	0.000	0.101	pg18beta2_o2nofp.cx10d_c32r128
Insert response time histogram
256us	1ms	4ms	16ms	64ms	256ms	1s	4s	16s	gt	max	tag
0.000	31.495	67.964	0.533	0.009	0.000	0.000	0.000	0.000	0.000	0.025	pg174_o2nofp.cx10a_c32r128
0.000	21.932	77.477	0.581	0.009	0.000	0.000	0.000	0.000	0.000	0.031	pg175_o2nofp.cx10a_c32r128
0.000	34.401	65.055	0.503	0.041	0.000	0.000	0.000	0.000	0.000	0.038	pg18beta1_o2nofp.cx10b_c32r128
0.000	35.719	63.737	0.506	0.037	0.000	0.000	0.000	0.000	0.000	0.036	pg18beta1_o2nofp.cx10cw4_c32r128
0.000	30.490	69.028	0.460	0.022	0.000	0.000	0.000	0.000	0.000	0.042	pg18beta1_o2nofp.cx10d_c32r128
0.000	17.978	81.450	0.546	0.026	nonzero	0.000	0.000	0.000	0.000	0.087	pg18beta2_o2nofp.cx10b_c32r128
0.000	29.226	70.200	0.558	0.016	nonzero	0.000	0.000	0.000	0.000	0.099	pg18beta2_o2nofp.cx10cw4_c32r128
0.000	33.566	65.786	0.620	0.028	0.000	0.000	0.000	0.000	0.000	0.037	pg18beta2_o2nofp.cx10d_c32r128
Delete response time histogram
256us	1ms	4ms	16ms	64ms	256ms	1s	4s	16s	gt	max	tag
0.000	54.080	45.644	0.273	0.003	0.000	0.000	0.000	0.000	0.000	0.033	pg174_o2nofp.cx10a_c32r128
0.000	52.811	46.889	0.297	0.003	0.000	0.000	0.000	0.000	0.000	0.032	pg175_o2nofp.cx10a_c32r128
0.000	54.953	44.668	0.359	0.019	0.000	0.000	0.000	0.000	0.000	0.035	pg18beta1_o2nofp.cx10b_c32r128
0.000	51.267	48.365	0.350	0.018	0.000	0.000	0.000	0.000	0.000	0.032	pg18beta1_o2nofp.cx10cw4_c32r128
0.000	52.775	46.896	0.318	0.011	0.000	0.000	0.000	0.000	0.000	0.028	pg18beta1_o2nofp.cx10d_c32r128
0.000	54.349	45.249	0.392	0.010	nonzero	0.000	0.000	0.000	0.000	0.086	pg18beta2_o2nofp.cx10b_c32r128
0.000	55.018	44.627	0.348	0.006	nonzero	0.000	0.000	0.000	0.000	0.098	pg18beta2_o2nofp.cx10cw4_c32r128
0.000	55.250	44.363	0.373	0.015	0.000	0.000	0.000	0.000	0.000	0.025	pg18beta2_o2nofp.cx10d_c32r128
qp1000.L6
- qp1000.L6: point queries with 1000 insert/s per client
- Legend for results is here.
- Each entry lists the percentage of responses that fit in that bucket (slower than max time for previous bucket, faster than min time for next bucket).
Query response time histogram
256us	1ms	4ms	16ms	64ms	256ms	1s	4s	16s	gt	max	tag
99.982	0.013	0.005	nonzero	nonzero	nonzero	0.000	0.000	0.000	0.000	0.088	pg174_o2nofp.cx10a_c32r128
99.982	0.013	0.005	nonzero	nonzero	nonzero	0.000	0.000	0.000	0.000	0.082	pg175_o2nofp.cx10a_c32r128
99.981	0.013	0.005	nonzero	nonzero	nonzero	0.000	0.000	0.000	0.000	0.101	pg18beta1_o2nofp.cx10b_c32r128
99.981	0.013	0.005	nonzero	nonzero	nonzero	0.000	0.000	0.000	0.000	0.099	pg18beta1_o2nofp.cx10cw4_c32r128
99.982	0.013	0.005	nonzero	nonzero	nonzero	0.000	0.000	0.000	0.000	0.096	pg18beta1_o2nofp.cx10d_c32r128
99.981	0.014	0.005	nonzero	nonzero	nonzero	0.000	0.000	0.000	0.000	0.104	pg18beta2_o2nofp.cx10b_c32r128
99.981	0.014	0.005	nonzero	nonzero	nonzero	0.000	0.000	0.000	0.000	0.095	pg18beta2_o2nofp.cx10cw4_c32r128
99.981	0.014	0.005	nonzero	nonzero	nonzero	0.000	0.000	0.000	0.000	0.102	pg18beta2_o2nofp.cx10d_c32r128
Insert response time histogram
256us	1ms	4ms	16ms	64ms	256ms	1s	4s	16s	gt	max	tag
0.000	32.860	66.533	0.586	0.021	0.000	0.000	0.000	0.000	0.000	0.045	pg174_o2nofp.cx10a_c32r128
0.000	23.852	75.661	0.474	0.012	0.000	0.000	0.000	0.000	0.000	0.059	pg175_o2nofp.cx10a_c32r128
0.000	31.909	67.582	0.487	0.022	0.000	0.000	0.000	0.000	0.000	0.041	pg18beta1_o2nofp.cx10b_c32r128
0.000	29.142	70.392	0.446	0.020	0.000	0.000	0.000	0.000	0.000	0.063	pg18beta1_o2nofp.cx10cw4_c32r128
0.000	30.010	69.538	0.435	0.017	0.000	0.000	0.000	0.000	0.000	0.037	pg18beta1_o2nofp.cx10d_c32r128
0.000	20.267	79.281	0.436	0.016	nonzero	0.000	0.000	0.000	0.000	0.083	pg18beta2_o2nofp.cx10b_c32r128
0.000	33.715	65.919	0.352	0.014	0.000	0.000	0.000	0.000	0.000	0.046	pg18beta2_o2nofp.cx10cw4_c32r128
0.000	33.156	66.366	0.457	0.021	0.000	0.000	0.000	0.000	0.000	0.033	pg18beta2_o2nofp.cx10d_c32r128
Delete response time histogram
256us	1ms	4ms	16ms	64ms	256ms	1s	4s	16s	gt	max	tag
0.000	55.308	44.277	0.405	0.010	0.000	0.000	0.000	0.000	0.000	0.047	pg174_o2nofp.cx10a_c32r128
0.000	55.141	44.513	0.339	0.008	0.000	0.000	0.000	0.000	0.000	0.059	pg175_o2nofp.cx10a_c32r128
0.000	57.055	42.430	0.498	0.017	0.000	0.000	0.000	0.000	0.000	0.036	pg18beta1_o2nofp.cx10b_c32r128
0.000	55.223	44.270	0.489	0.018	0.000	0.000	0.000	0.000	0.000	0.055	pg18beta1_o2nofp.cx10cw4_c32r128
0.000	58.512	40.927	0.545	0.017	0.000	0.000	0.000	0.000	0.000	0.034	pg18beta1_o2nofp.cx10d_c32r128
0.000	56.607	42.818	0.561	0.014	nonzero	0.000	0.000	0.000	0.000	0.082	pg18beta2_o2nofp.cx10b_c32r128
0.000	58.903	40.703	0.381	0.012	0.000	0.000	0.000	0.000	0.000	0.035	pg18beta2_o2nofp.cx10cw4_c32r128
0.000	59.141	40.447	0.395	0.017	0.000	0.000	0.000	0.000	0.000	0.035	pg18beta2_o2nofp.cx10d_c32r128