Introduction
This is a report for the insert benchmark with 50M docs and 1 client(s). It is generated by scripts (bash, awk, sed) and Tufte might not be impressed. An overview of the insert benchmark is here and a short update is here. Below, by DBMS, I mean DBMS+version.config. An example is my8020.c10b40 where my means MySQL, 8020 is version 8.0.20 and c10b40 is the name for the configuration file.
The test server has 48 AMD cores, 128G RAM and RAID 10 with 2 NVMe devices. It is described here. The benchmark was run with 1 client and there were 1 or 3 connections per client (1 for queries or inserts without rate limits, 1+1 for rate limited inserts+deletes). It uses 1 table with a table per client. It loads 50M rows per table without secondary indexes, creates 3 secondary indexes per table, then inserts 16m+4m rows per table with a delete per insert to avoid growing the table. It then does 6 read+write tests for 1800s each that do queries as fast as possible with 100,100,500,500,1000,1000 inserts/s and the same for deletes/s per client concurrent with the queries. The database is cached by Postgres. Clients and the DBMS share one server. The per-database configs are in the per-database subdirectories here.
The tested DBMS are:
- pg174_o2nofp.cx10a_c32r128 - Postgres 17.4 with the cx10a_c32r128 config
- pg175_o2nofp.cx10a_c32r128 - Postgres 17.5 with the cx10a_c32r128 config
- pg18beta1_o2nofp.cx10b_c32r128 - Postgres 18 beta1 with the cx10b_c32r128 config that uses io_method='sync'
- pg18beta1_o2nofp.cx10cw4_c32r128 - Postgres 18 beta1 with the cx10cw4_c32r128 config that uses io_method='worker' and io_workers=4
- pg18beta1_o2nofp.cx10d_c32r128 - Postgres 18 beta1 with the cx10d_c32r128 config that uses io_method='io_uring'
- pg18beta2_o2nofp.cx10b_c32r128 - Postgres 18 beta1 with the cx10b_c32r128 config that uses io_method='sync'
- pg18beta2_o2nofp.cx10cw4_c32r128 - Postgres 18 beta2 with the cx10cw4_c32r128 config that uses io_method='worker' and io_workers=4
- pg18beta2_o2nofp.cx10d_c32r128 - Postgres 18 beta1 with the cx10d_c32r128 config that uses io_method='io_uring'
Contents
- Summary
- l.i0: load without secondary indexes
- l.x: create secondary indexes
- l.i1: continue load after secondary indexes created with 50 inserts per transaction
- l.i2: continue load after secondary indexes created with 5 inserts per transaction
- qr100.L1: range queries with 100 insert/s per client
- qp100.L2: point queries with 100 insert/s per client
- qr500.L3: range queries with 500 insert/s per client
- qp500.L4: point queries with 500 insert/s per client
- qr1000.L5: range queries with 1000 insert/s per client
- qp1000.L6: point queries with 1000 insert/s per client
Summary
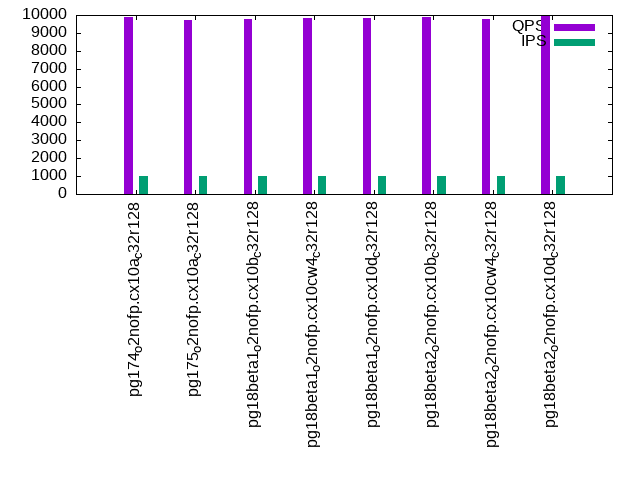
The numbers are inserts/s for l.i0, l.i1 and l.i2, indexed docs (or rows) /s for l.x and queries/s for qr100, qp100 thru qr1000, qp1000" The values are the average rate over the entire test for inserts (IPS) and queries (QPS). The range of values for IPS and QPS is split into 3 parts: bottom 25%, middle 50%, top 25%. Values in the bottom 25% have a red background, values in the top 25% have a green background and values in the middle have no color. A gray background is used for values that can be ignored because the DBMS did not sustain the target insert rate. Red backgrounds are not used when the minimum value is within 80% of the max value.
| dbms | l.i0 | l.x | l.i1 | l.i2 | qr100 | qp100 | qr500 | qp500 | qr1000 | qp1000 |
|---|---|---|---|---|---|---|---|---|---|---|
| pg174_o2nofp.cx10a_c32r128 | 159236 | 375941 | 13356 | 1610 | 19450 | 9892 | 18761 | 9949 | 18484 | 9881 |
| pg175_o2nofp.cx10a_c32r128 | 160772 | 375941 | 14828 | 1454 | 19481 | 9788 | 18581 | 9789 | 18385 | 9738 |
| pg18beta1_o2nofp.cx10b_c32r128 | 157233 | 381680 | 13769 | 1418 | 19418 | 9851 | 18373 | 9868 | 18292 | 9793 |
| pg18beta1_o2nofp.cx10cw4_c32r128 | 157729 | 384616 | 13548 | 1440 | 19473 | 9872 | 18484 | 9906 | 18532 | 9812 |
| pg18beta1_o2nofp.cx10d_c32r128 | 157729 | 381680 | 13434 | 1337 | 19207 | 9736 | 18338 | 9901 | 18183 | 9832 |
| pg18beta2_o2nofp.cx10b_c32r128 | 158730 | 381680 | 13536 | 1650 | 19545 | 9960 | 18581 | 9874 | 18457 | 9862 |
| pg18beta2_o2nofp.cx10cw4_c32r128 | 161290 | 381680 | 14060 | 1487 | 19306 | 9956 | 18649 | 9837 | 18400 | 9770 |
| pg18beta2_o2nofp.cx10d_c32r128 | 160256 | 381680 | 13853 | 1450 | 19352 | 9936 | 18490 | 9920 | 18416 | 9953 |
This table has relative throughput, throughput for the DBMS relative to the DBMS in the first line, using the absolute throughput from the previous table. Values less than 0.95 have a yellow background. Values greater than 1.05 have a blue background.
| dbms | l.i0 | l.x | l.i1 | l.i2 | qr100 | qp100 | qr500 | qp500 | qr1000 | qp1000 |
|---|---|---|---|---|---|---|---|---|---|---|
| pg174_o2nofp.cx10a_c32r128 | 1.00 | 1.00 | 1.00 | 1.00 | 1.00 | 1.00 | 1.00 | 1.00 | 1.00 | 1.00 |
| pg175_o2nofp.cx10a_c32r128 | 1.01 | 1.00 | 1.11 | 0.90 | 1.00 | 0.99 | 0.99 | 0.98 | 0.99 | 0.99 |
| pg18beta1_o2nofp.cx10b_c32r128 | 0.99 | 1.02 | 1.03 | 0.88 | 1.00 | 1.00 | 0.98 | 0.99 | 0.99 | 0.99 |
| pg18beta1_o2nofp.cx10cw4_c32r128 | 0.99 | 1.02 | 1.01 | 0.89 | 1.00 | 1.00 | 0.99 | 1.00 | 1.00 | 0.99 |
| pg18beta1_o2nofp.cx10d_c32r128 | 0.99 | 1.02 | 1.01 | 0.83 | 0.99 | 0.98 | 0.98 | 1.00 | 0.98 | 1.00 |
| pg18beta2_o2nofp.cx10b_c32r128 | 1.00 | 1.02 | 1.01 | 1.02 | 1.00 | 1.01 | 0.99 | 0.99 | 1.00 | 1.00 |
| pg18beta2_o2nofp.cx10cw4_c32r128 | 1.01 | 1.02 | 1.05 | 0.92 | 0.99 | 1.01 | 0.99 | 0.99 | 1.00 | 0.99 |
| pg18beta2_o2nofp.cx10d_c32r128 | 1.01 | 1.02 | 1.04 | 0.90 | 0.99 | 1.00 | 0.99 | 1.00 | 1.00 | 1.01 |
This lists the average rate of inserts/s for the tests that do inserts concurrent with queries. For such tests the query rate is listed in the table above. The read+write tests are setup so that the insert rate should match the target rate every second. Cells that are not at least 95% of the target have a red background to indicate a failure to satisfy the target.
| dbms | qr100.L1 | qp100.L2 | qr500.L3 | qp500.L4 | qr1000.L5 | qp1000.L6 |
|---|---|---|---|---|---|---|
| pg174_o2nofp.cx10a_c32r128 | 100 | 100 | 499 | 499 | 999 | 999 |
| pg175_o2nofp.cx10a_c32r128 | 100 | 100 | 499 | 499 | 999 | 999 |
| pg18beta1_o2nofp.cx10b_c32r128 | 100 | 100 | 499 | 499 | 999 | 999 |
| pg18beta1_o2nofp.cx10cw4_c32r128 | 100 | 100 | 499 | 499 | 999 | 999 |
| pg18beta1_o2nofp.cx10d_c32r128 | 100 | 100 | 499 | 499 | 998 | 999 |
| pg18beta2_o2nofp.cx10b_c32r128 | 100 | 100 | 499 | 499 | 999 | 999 |
| pg18beta2_o2nofp.cx10cw4_c32r128 | 100 | 100 | 499 | 499 | 999 | 999 |
| pg18beta2_o2nofp.cx10d_c32r128 | 100 | 100 | 499 | 499 | 999 | 999 |
| target | 100 | 100 | 500 | 500 | 1000 | 1000 |
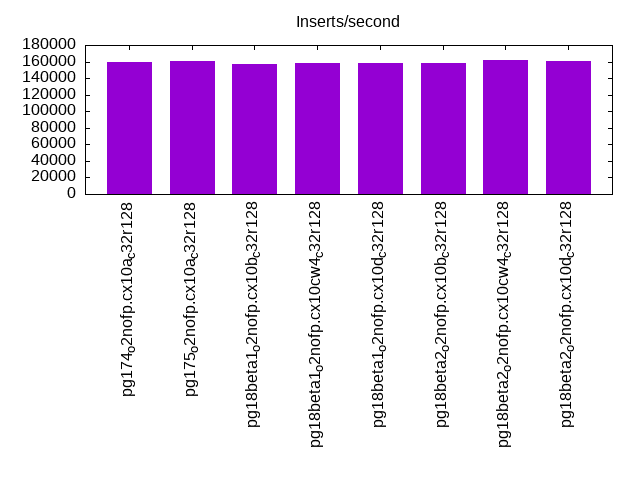
l.i0
l.i0: load without secondary indexes. Graphs for performance per 1-second interval are here.
Average throughput:
Insert response time histogram: each cell has the percentage of responses that take <= the time in the header and max is the max response time in seconds. For the max column values in the top 25% of the range have a red background and in the bottom 25% of the range have a green background. The red background is not used when the min value is within 80% of the max value.
| dbms | 256us | 1ms | 4ms | 16ms | 64ms | 256ms | 1s | 4s | 16s | gt | max |
|---|---|---|---|---|---|---|---|---|---|---|---|
| pg174_o2nofp.cx10a_c32r128 | 99.999 | nonzero | nonzero | nonzero | 0.017 | ||||||
| pg175_o2nofp.cx10a_c32r128 | 99.999 | 0.001 | nonzero | 0.025 | |||||||
| pg18beta1_o2nofp.cx10b_c32r128 | 99.998 | 0.002 | 0.002 | ||||||||
| pg18beta1_o2nofp.cx10cw4_c32r128 | 99.998 | 0.001 | 0.001 | nonzero | 0.019 | ||||||
| pg18beta1_o2nofp.cx10d_c32r128 | 99.999 | 0.001 | nonzero | 0.011 | |||||||
| pg18beta2_o2nofp.cx10b_c32r128 | 99.998 | 0.001 | 0.001 | 0.010 | |||||||
| pg18beta2_o2nofp.cx10cw4_c32r128 | 99.999 | 0.001 | nonzero | 0.010 | |||||||
| pg18beta2_o2nofp.cx10d_c32r128 | 99.999 | 0.001 | nonzero | 0.009 |
Performance metrics for the DBMS listed above. Some are normalized by throughput, others are not. Legend for results is here.
ips	qps	rps	rmbps	wps	wmbps	rpq	rkbpq	wpi	wkbpi	csps	cpups	cspq	cpupq	dbgb1	dbgb2	rss	maxop	p50	p99	tag
159236	0	1	0.0	602.1	67.6	0.000	0.000	0.004	0.435	17386	3.6	0.109	11	4.8	13.0	0.5	0.017	159716	159016	pg174_o2nofp.cx10a_c32r128
160772	0	0	0.0	608.4	68.2	0.000	0.000	0.004	0.434	17468	3.8	0.109	11	4.8	13.0	4.8	0.025	160815	157618	pg175_o2nofp.cx10a_c32r128
157233	0	0	0.0	597.3	66.8	0.000	0.000	0.004	0.435	16899	3.5	0.107	11	4.8	13.0	0.5	0.002	156817	155823	pg18beta1_o2nofp.cx10b_c32r128
157729	0	0	0.0	610.3	67.2	0.000	0.000	0.004	0.436	16904	3.4	0.107	10	4.8	13.0	4.7	0.019	158415	154022	pg18beta1_o2nofp.cx10cw4_c32r128
157729	0	0	0.0	600.3	66.9	0.000	0.000	0.004	0.434	16915	3.5	0.107	11	4.8	13.0	2.9	0.011	158219	155625	pg18beta1_o2nofp.cx10d_c32r128
158730	0	0	0.0	600.6	67.2	0.000	0.000	0.004	0.433	16968	3.3	0.107	10	4.8	13.0	4.7	0.010	158721	156516	pg18beta2_o2nofp.cx10b_c32r128
161290	0	0	0.0	611.8	68.2	0.000	0.000	0.004	0.433	17551	4.1	0.109	12	4.8	13.0	0.5	0.010	161913	159113	pg18beta2_o2nofp.cx10cw4_c32r128
160256	0	0	0.0	607.1	68.0	0.000	0.000	0.004	0.434	17429	3.8	0.109	11	4.8	13.0	0.5	0.009	161311	158318	pg18beta2_o2nofp.cx10d_c32r128
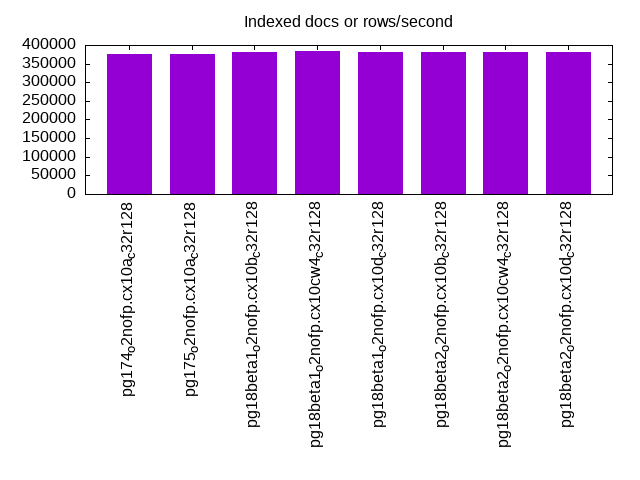
l.x
l.x: create secondary indexes.
Average throughput:
Performance metrics for the DBMS listed above. Some are normalized by throughput, others are not. Legend for results is here.
ips	qps	rps	rmbps	wps	wmbps	rpq	rkbpq	wpi	wkbpi	csps	cpups	cspq	cpupq	dbgb1	dbgb2	rss	maxop	p50	p99	tag
375941	0	1	0.0	943.1	113.4	0.000	0.000	0.003	0.309	2088	3.1	0.006	4	9.6	22.1	5.1	0.002	NA	NA	pg174_o2nofp.cx10a_c32r128
375941	0	0	0.0	944.7	113.3	0.000	0.000	0.003	0.309	2162	3.0	0.006	4	9.6	22.2	5.1	0.002	NA	NA	pg175_o2nofp.cx10a_c32r128
381680	0	0	0.0	964.8	115.9	0.000	0.000	0.003	0.311	2201	3.0	0.006	4	9.6	22.2	5.1	0.002	NA	NA	pg18beta1_o2nofp.cx10b_c32r128
384616	0	0	0.0	996.9	118.4	0.000	0.000	0.003	0.315	2259	2.9	0.006	4	9.6	22.2	5.1	0.002	NA	NA	pg18beta1_o2nofp.cx10cw4_c32r128
381680	0	0	0.0	962.1	115.3	0.000	0.000	0.003	0.309	2383	2.9	0.006	4	9.6	22.2	5.1	0.002	NA	NA	pg18beta1_o2nofp.cx10d_c32r128
381680	0	0	0.0	976.2	117.0	0.000	0.000	0.003	0.314	2444	2.9	0.006	4	9.6	22.2	5.1	0.002	NA	NA	pg18beta2_o2nofp.cx10b_c32r128
381680	0	0	0.0	976.6	116.9	0.000	0.000	0.003	0.314	2339	2.9	0.006	4	9.6	22.2	5.1	0.002	NA	NA	pg18beta2_o2nofp.cx10cw4_c32r128
381680	0	0	0.0	944.1	113.2	0.000	0.000	0.002	0.304	2399	2.8	0.006	4	9.6	22.2	5.1	0.002	NA	NA	pg18beta2_o2nofp.cx10d_c32r128
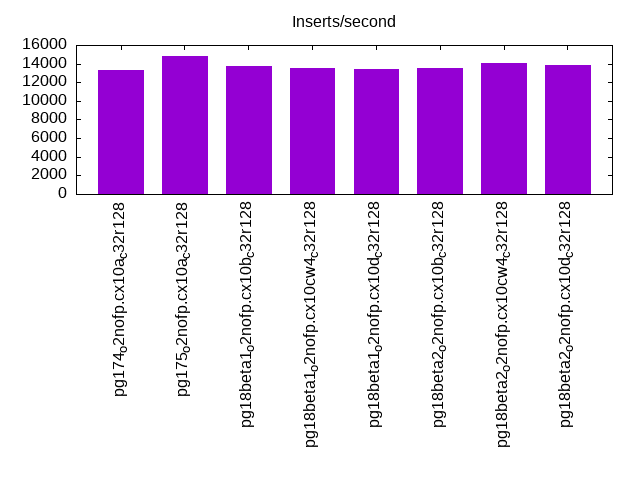
l.i1
l.i1: continue load after secondary indexes created with 50 inserts per transaction. Graphs for performance per 1-second interval are here.
Average throughput:
Insert response time histogram: each cell has the percentage of responses that take <= the time in the header and max is the max response time in seconds. For the max column values in the top 25% of the range have a red background and in the bottom 25% of the range have a green background. The red background is not used when the min value is within 80% of the max value.
| dbms | 256us | 1ms | 4ms | 16ms | 64ms | 256ms | 1s | 4s | 16s | gt | max |
|---|---|---|---|---|---|---|---|---|---|---|---|
| pg174_o2nofp.cx10a_c32r128 | 44.432 | 55.567 | 0.001 | 0.007 | |||||||
| pg175_o2nofp.cx10a_c32r128 | 34.979 | 65.019 | 0.001 | 0.007 | |||||||
| pg18beta1_o2nofp.cx10b_c32r128 | 32.992 | 67.006 | 0.002 | 0.001 | 0.021 | ||||||
| pg18beta1_o2nofp.cx10cw4_c32r128 | 33.580 | 66.419 | 0.001 | 0.007 | |||||||
| pg18beta1_o2nofp.cx10d_c32r128 | 39.845 | 60.154 | 0.001 | 0.007 | |||||||
| pg18beta2_o2nofp.cx10b_c32r128 | 45.182 | 54.817 | 0.002 | 0.007 | |||||||
| pg18beta2_o2nofp.cx10cw4_c32r128 | 41.440 | 58.559 | 0.001 | 0.007 | |||||||
| pg18beta2_o2nofp.cx10d_c32r128 | 43.428 | 56.570 | 0.002 | 0.001 | 0.018 |
Delete response time histogram: each cell has the percentage of responses that take <= the time in the header and max is the max response time in seconds. For the max column values in the top 25% of the range have a red background and in the bottom 25% of the range have a green background. The red background is not used when the min value is within 80% of the max value.
| dbms | 256us | 1ms | 4ms | 16ms | 64ms | 256ms | 1s | 4s | 16s | gt | max |
|---|---|---|---|---|---|---|---|---|---|---|---|
| pg174_o2nofp.cx10a_c32r128 | 12.043 | 51.314 | 36.643 | 0.011 | |||||||
| pg175_o2nofp.cx10a_c32r128 | 12.078 | 55.093 | 32.829 | 0.011 | |||||||
| pg18beta1_o2nofp.cx10b_c32r128 | 11.680 | 38.984 | 49.335 | nonzero | 0.021 | ||||||
| pg18beta1_o2nofp.cx10cw4_c32r128 | 11.597 | 37.564 | 50.838 | 0.010 | |||||||
| pg18beta1_o2nofp.cx10d_c32r128 | 7.655 | 59.567 | 32.778 | nonzero | 0.017 | ||||||
| pg18beta2_o2nofp.cx10b_c32r128 | 12.024 | 48.692 | 39.284 | 0.010 | |||||||
| pg18beta2_o2nofp.cx10cw4_c32r128 | 12.031 | 44.914 | 43.056 | 0.010 | |||||||
| pg18beta2_o2nofp.cx10d_c32r128 | 12.012 | 49.443 | 38.545 | 0.012 |
Performance metrics for the DBMS listed above. Some are normalized by throughput, others are not. Legend for results is here.
ips	qps	rps	rmbps	wps	wmbps	rpq	rkbpq	wpi	wkbpi	csps	cpups	cspq	cpupq	dbgb1	dbgb2	rss	maxop	p50	p99	tag
13356	0	0	0.0	146.0	16.1	0.000	0.000	0.011	1.231	6301	2.9	0.472	104	10.8	31.2	8.4	0.007	8540	4895	pg174_o2nofp.cx10a_c32r128
14828	0	0	0.0	166.5	18.0	0.000	0.000	0.011	1.240	7018	3.1	0.473	100	10.9	31.2	9.1	0.007	12435	7441	pg175_o2nofp.cx10a_c32r128
13769	0	0	0.0	154.7	16.9	0.000	0.000	0.011	1.258	6485	3.1	0.471	108	10.9	31.3	2.6	0.021	10039	7292	pg18beta1_o2nofp.cx10b_c32r128
13548	0	0	0.0	159.8	16.7	0.000	0.000	0.012	1.260	6536	3.1	0.482	110	10.9	31.3	9.1	0.007	9789	7192	pg18beta1_o2nofp.cx10cw4_c32r128
13434	0	0	0.0	152.4	16.5	0.000	0.000	0.011	1.259	6504	2.9	0.484	104	10.9	31.3	9.0	0.007	10938	3596	pg18beta1_o2nofp.cx10d_c32r128
13536	0	0	0.0	151.5	16.5	0.000	0.000	0.011	1.249	6378	2.9	0.471	103	10.9	31.2	8.8	0.007	8690	5244	pg18beta2_o2nofp.cx10b_c32r128
14060	0	0	0.0	157.7	17.2	0.000	0.000	0.011	1.251	6723	3.1	0.478	106	10.8	31.2	2.6	0.007	9489	6243	pg18beta2_o2nofp.cx10cw4_c32r128
13853	0	0	0.0	153.3	16.9	0.000	0.000	0.011	1.250	6602	2.9	0.477	100	10.8	31.2	2.5	0.018	9090	5643	pg18beta2_o2nofp.cx10d_c32r128
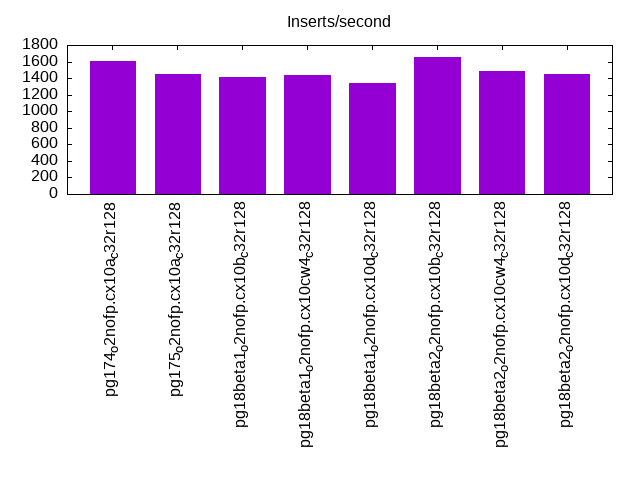
l.i2
l.i2: continue load after secondary indexes created with 5 inserts per transaction. Graphs for performance per 1-second interval are here.
Average throughput:
Insert response time histogram: each cell has the percentage of responses that take <= the time in the header and max is the max response time in seconds. For the max column values in the top 25% of the range have a red background and in the bottom 25% of the range have a green background. The red background is not used when the min value is within 80% of the max value.
| dbms | 256us | 1ms | 4ms | 16ms | 64ms | 256ms | 1s | 4s | 16s | gt | max |
|---|---|---|---|---|---|---|---|---|---|---|---|
| pg174_o2nofp.cx10a_c32r128 | 50.472 | 49.527 | nonzero | nonzero | 0.011 | ||||||
| pg175_o2nofp.cx10a_c32r128 | 26.530 | 73.469 | 0.001 | 0.004 | |||||||
| pg18beta1_o2nofp.cx10b_c32r128 | 16.396 | 83.603 | nonzero | 0.002 | |||||||
| pg18beta1_o2nofp.cx10cw4_c32r128 | 21.739 | 78.261 | nonzero | 0.003 | |||||||
| pg18beta1_o2nofp.cx10d_c32r128 | 33.381 | 66.619 | nonzero | 0.002 | |||||||
| pg18beta2_o2nofp.cx10b_c32r128 | 52.049 | 47.941 | 0.006 | 0.004 | 0.014 | ||||||
| pg18beta2_o2nofp.cx10cw4_c32r128 | 40.395 | 59.604 | 0.001 | nonzero | 0.005 | ||||||
| pg18beta2_o2nofp.cx10d_c32r128 | 38.264 | 61.736 | nonzero | 0.002 |
Delete response time histogram: each cell has the percentage of responses that take <= the time in the header and max is the max response time in seconds. For the max column values in the top 25% of the range have a red background and in the bottom 25% of the range have a green background. The red background is not used when the min value is within 80% of the max value.
| dbms | 256us | 1ms | 4ms | 16ms | 64ms | 256ms | 1s | 4s | 16s | gt | max |
|---|---|---|---|---|---|---|---|---|---|---|---|
| pg174_o2nofp.cx10a_c32r128 | 1.477 | 19.049 | 38.838 | 40.636 | nonzero | 0.031 | |||||
| pg175_o2nofp.cx10a_c32r128 | 0.517 | 9.556 | 55.784 | 34.143 | nonzero | 0.021 | |||||
| pg18beta1_o2nofp.cx10b_c32r128 | 0.330 | 9.679 | 51.532 | 38.459 | 0.015 | ||||||
| pg18beta1_o2nofp.cx10cw4_c32r128 | 0.355 | 9.599 | 50.131 | 39.915 | 0.014 | ||||||
| pg18beta1_o2nofp.cx10d_c32r128 | 0.318 | 9.617 | 65.304 | 24.761 | 0.015 | ||||||
| pg18beta2_o2nofp.cx10b_c32r128 | 1.127 | 19.425 | 40.907 | 38.540 | 0.001 | 0.033 | |||||
| pg18beta2_o2nofp.cx10cw4_c32r128 | 1.024 | 19.507 | 30.699 | 48.770 | nonzero | 0.032 | |||||
| pg18beta2_o2nofp.cx10d_c32r128 | 0.944 | 19.773 | 29.331 | 49.952 | nonzero | 0.030 |
Performance metrics for the DBMS listed above. Some are normalized by throughput, others are not. Legend for results is here.
ips	qps	rps	rmbps	wps	wmbps	rpq	rkbpq	wpi	wkbpi	csps	cpups	cspq	cpupq	dbgb1	dbgb2	rss	maxop	p50	p99	tag
1610	0	0	0.0	113.1	10.0	0.000	0.000	0.070	6.360	7106	2.0	4.415	596	11.1	36.0	0.5	0.011	954	694	pg174_o2nofp.cx10a_c32r128
1454	0	0	0.0	105.1	9.1	0.000	0.000	0.072	6.388	6521	2.0	4.483	660	11.1	36.3	0.6	0.004	1229	794	pg175_o2nofp.cx10a_c32r128
1418	0	0	0.0	100.0	8.9	0.000	0.000	0.070	6.421	6344	2.0	4.473	677	11.1	36.0	0.6	0.002	1219	799	pg18beta1_o2nofp.cx10b_c32r128
1440	0	0	0.0	101.3	9.0	0.000	0.000	0.070	6.401	6403	2.0	4.445	666	11.1	36.0	0.7	0.003	1194	804	pg18beta1_o2nofp.cx10cw4_c32r128
1337	0	0	0.0	96.4	8.5	0.000	0.000	0.072	6.525	5984	2.0	4.477	718	11.1	35.9	0.6	0.002	1184	449	pg18beta1_o2nofp.cx10d_c32r128
1650	0	0	0.0	113.8	10.1	0.000	0.000	0.069	6.264	7326	2.0	4.440	582	11.1	36.0	0.5	0.014	969	699	pg18beta2_o2nofp.cx10b_c32r128
1487	0	0	0.0	109.5	9.3	0.000	0.000	0.074	6.433	6618	2.0	4.451	646	11.1	36.0	9.3	0.005	1004	714	pg18beta2_o2nofp.cx10cw4_c32r128
1450	0	0	0.0	102.4	9.1	0.000	0.000	0.071	6.459	6454	2.0	4.450	662	11.1	36.0	7.7	0.002	994	739	pg18beta2_o2nofp.cx10d_c32r128
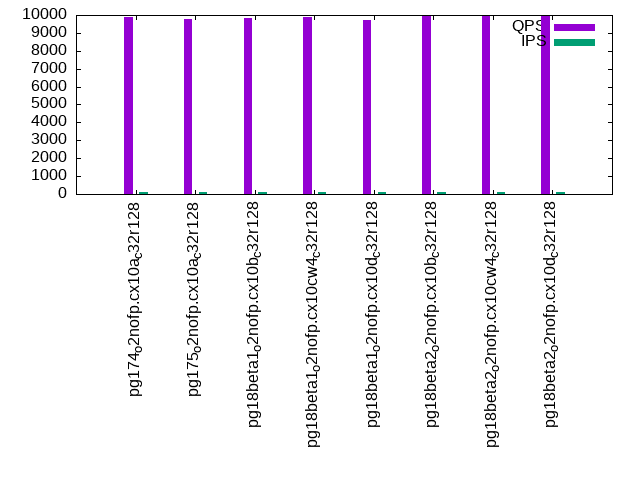
qr100.L1
qr100.L1: range queries with 100 insert/s per client. Graphs for performance per 1-second interval are here.
Average throughput:

Query response time histogram: each cell has the percentage of responses that take <= the time in the header and max is the max response time in seconds. For max values in the top 25% of the range have a red background and in the bottom 25% of the range have a green background. The red background is not used when the min value is within 80% of the max value.
| dbms | 256us | 1ms | 4ms | 16ms | 64ms | 256ms | 1s | 4s | 16s | gt | max |
|---|---|---|---|---|---|---|---|---|---|---|---|
| pg174_o2nofp.cx10a_c32r128 | 100.000 | nonzero | nonzero | 0.001 | |||||||
| pg175_o2nofp.cx10a_c32r128 | 100.000 | nonzero | nonzero | 0.001 | |||||||
| pg18beta1_o2nofp.cx10b_c32r128 | 100.000 | nonzero | nonzero | 0.001 | |||||||
| pg18beta1_o2nofp.cx10cw4_c32r128 | 100.000 | nonzero | nonzero | 0.001 | |||||||
| pg18beta1_o2nofp.cx10d_c32r128 | 100.000 | nonzero | nonzero | nonzero | 0.004 | ||||||
| pg18beta2_o2nofp.cx10b_c32r128 | 100.000 | nonzero | nonzero | 0.001 | |||||||
| pg18beta2_o2nofp.cx10cw4_c32r128 | 100.000 | nonzero | nonzero | nonzero | 0.004 | ||||||
| pg18beta2_o2nofp.cx10d_c32r128 | 100.000 | nonzero | nonzero | 0.001 |
Insert response time histogram: each cell has the percentage of responses that take <= the time in the header and max is the max response time in seconds. For max values in the top 25% of the range have a red background and in the bottom 25% of the range have a green background. The red background is not used when the min value is within 80% of the max value.
| dbms | 256us | 1ms | 4ms | 16ms | 64ms | 256ms | 1s | 4s | 16s | gt | max |
|---|---|---|---|---|---|---|---|---|---|---|---|
| pg174_o2nofp.cx10a_c32r128 | 99.889 | 0.111 | 0.007 | ||||||||
| pg175_o2nofp.cx10a_c32r128 | 99.889 | 0.111 | 0.008 | ||||||||
| pg18beta1_o2nofp.cx10b_c32r128 | 99.889 | 0.111 | 0.008 | ||||||||
| pg18beta1_o2nofp.cx10cw4_c32r128 | 99.889 | 0.111 | 0.008 | ||||||||
| pg18beta1_o2nofp.cx10d_c32r128 | 99.889 | 0.111 | 0.008 | ||||||||
| pg18beta2_o2nofp.cx10b_c32r128 | 99.889 | 0.111 | 0.008 | ||||||||
| pg18beta2_o2nofp.cx10cw4_c32r128 | 99.889 | 0.111 | 0.008 | ||||||||
| pg18beta2_o2nofp.cx10d_c32r128 | 99.889 | 0.111 | 0.008 |
Delete response time histogram: each cell has the percentage of responses that take <= the time in the header and max is the max response time in seconds. For max values in the top 25% of the range have a red background and in the bottom 25% of the range have a green background. The red background is not used when the min value is within 80% of the max value.
| dbms | 256us | 1ms | 4ms | 16ms | 64ms | 256ms | 1s | 4s | 16s | gt | max |
|---|---|---|---|---|---|---|---|---|---|---|---|
| pg174_o2nofp.cx10a_c32r128 | 55.306 | 44.694 | 0.002 | ||||||||
| pg175_o2nofp.cx10a_c32r128 | 54.944 | 45.056 | 0.002 | ||||||||
| pg18beta1_o2nofp.cx10b_c32r128 | 55.333 | 44.667 | 0.002 | ||||||||
| pg18beta1_o2nofp.cx10cw4_c32r128 | 52.750 | 47.250 | 0.002 | ||||||||
| pg18beta1_o2nofp.cx10d_c32r128 | 52.556 | 47.444 | 0.002 | ||||||||
| pg18beta2_o2nofp.cx10b_c32r128 | 55.167 | 44.833 | 0.002 | ||||||||
| pg18beta2_o2nofp.cx10cw4_c32r128 | 54.250 | 45.750 | 0.002 | ||||||||
| pg18beta2_o2nofp.cx10d_c32r128 | 57.694 | 42.306 | 0.002 |
Performance metrics for the DBMS listed above. Some are normalized by throughput, others are not. Legend for results is here.
ips	qps	rps	rmbps	wps	wmbps	rpq	rkbpq	wpi	wkbpi	csps	cpups	cspq	cpupq	dbgb1	dbgb2	rss	maxop	p50	p99	tag
100	19450	0	0.0	14.4	1.0	0.000	0.000	0.144	10.587	74368	2.0	3.824	49	11.1	36.0	0.2	0.001	19498	19130	pg174_o2nofp.cx10a_c32r128
100	19481	0	0.0	21.3	1.1	0.000	0.000	0.214	10.900	74556	2.0	3.827	49	11.2	36.3	0.2	0.001	19529	19242	pg175_o2nofp.cx10a_c32r128
100	19418	0	0.0	15.6	1.0	0.000	0.000	0.156	10.687	74291	2.0	3.826	49	11.1	36.0	0.2	0.001	19497	19177	pg18beta1_o2nofp.cx10b_c32r128
100	19473	0	0.0	17.2	1.0	0.000	0.000	0.172	10.763	74467	2.0	3.824	49	11.1	36.0	0.2	0.001	19497	19225	pg18beta1_o2nofp.cx10cw4_c32r128
100	19207	0	0.0	16.8	1.0	0.000	0.000	0.169	10.744	73451	2.0	3.824	50	11.1	35.9	0.2	0.004	19130	18986	pg18beta1_o2nofp.cx10d_c32r128
100	19545	0	0.0	14.5	1.0	0.000	0.000	0.146	10.614	74731	2.0	3.823	49	11.1	36.0	0.2	0.001	19481	19305	pg18beta2_o2nofp.cx10b_c32r128
100	19306	0	0.0	18.6	1.0	0.000	0.000	0.186	10.772	73839	2.0	3.825	50	11.1	36.0	0.2	0.004	19306	19034	pg18beta2_o2nofp.cx10cw4_c32r128
100	19352	0	0.0	15.3	1.0	0.000	0.000	0.154	10.612	73999	2.0	3.824	50	11.1	36.0	0.2	0.001	19401	19066	pg18beta2_o2nofp.cx10d_c32r128
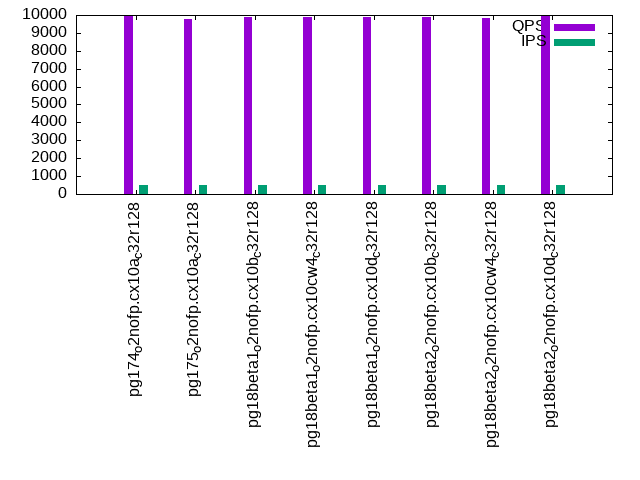
qp100.L2
qp100.L2: point queries with 100 insert/s per client. Graphs for performance per 1-second interval are here.
Average throughput:
Query response time histogram: each cell has the percentage of responses that take <= the time in the header and max is the max response time in seconds. For max values in the top 25% of the range have a red background and in the bottom 25% of the range have a green background. The red background is not used when the min value is within 80% of the max value.
| dbms | 256us | 1ms | 4ms | 16ms | 64ms | 256ms | 1s | 4s | 16s | gt | max |
|---|---|---|---|---|---|---|---|---|---|---|---|
| pg174_o2nofp.cx10a_c32r128 | 100.000 | nonzero | 0.001 | ||||||||
| pg175_o2nofp.cx10a_c32r128 | 100.000 | nonzero | 0.001 | ||||||||
| pg18beta1_o2nofp.cx10b_c32r128 | 100.000 | nonzero | nonzero | 0.004 | |||||||
| pg18beta1_o2nofp.cx10cw4_c32r128 | 100.000 | nonzero | nonzero | 0.001 | |||||||
| pg18beta1_o2nofp.cx10d_c32r128 | 100.000 | nonzero | 0.001 | ||||||||
| pg18beta2_o2nofp.cx10b_c32r128 | 100.000 | nonzero | 0.001 | ||||||||
| pg18beta2_o2nofp.cx10cw4_c32r128 | 100.000 | nonzero | 0.001 | ||||||||
| pg18beta2_o2nofp.cx10d_c32r128 | 100.000 | nonzero | 0.001 |
Insert response time histogram: each cell has the percentage of responses that take <= the time in the header and max is the max response time in seconds. For max values in the top 25% of the range have a red background and in the bottom 25% of the range have a green background. The red background is not used when the min value is within 80% of the max value.
| dbms | 256us | 1ms | 4ms | 16ms | 64ms | 256ms | 1s | 4s | 16s | gt | max |
|---|---|---|---|---|---|---|---|---|---|---|---|
| pg174_o2nofp.cx10a_c32r128 | 99.889 | 0.111 | 0.007 | ||||||||
| pg175_o2nofp.cx10a_c32r128 | 99.889 | 0.111 | 0.007 | ||||||||
| pg18beta1_o2nofp.cx10b_c32r128 | 99.889 | 0.111 | 0.007 | ||||||||
| pg18beta1_o2nofp.cx10cw4_c32r128 | 99.917 | 0.083 | 0.007 | ||||||||
| pg18beta1_o2nofp.cx10d_c32r128 | 99.889 | 0.111 | 0.008 | ||||||||
| pg18beta2_o2nofp.cx10b_c32r128 | 99.889 | 0.111 | 0.008 | ||||||||
| pg18beta2_o2nofp.cx10cw4_c32r128 | 99.889 | 0.111 | 0.008 | ||||||||
| pg18beta2_o2nofp.cx10d_c32r128 | 99.944 | 0.056 | 0.008 |
Delete response time histogram: each cell has the percentage of responses that take <= the time in the header and max is the max response time in seconds. For max values in the top 25% of the range have a red background and in the bottom 25% of the range have a green background. The red background is not used when the min value is within 80% of the max value.
| dbms | 256us | 1ms | 4ms | 16ms | 64ms | 256ms | 1s | 4s | 16s | gt | max |
|---|---|---|---|---|---|---|---|---|---|---|---|
| pg174_o2nofp.cx10a_c32r128 | 99.972 | 0.028 | 0.007 | ||||||||
| pg175_o2nofp.cx10a_c32r128 | 99.972 | 0.028 | 0.007 | ||||||||
| pg18beta1_o2nofp.cx10b_c32r128 | 99.972 | 0.028 | 0.007 | ||||||||
| pg18beta1_o2nofp.cx10cw4_c32r128 | 99.972 | 0.028 | 0.007 | ||||||||
| pg18beta1_o2nofp.cx10d_c32r128 | 99.972 | 0.028 | 0.007 | ||||||||
| pg18beta2_o2nofp.cx10b_c32r128 | 99.972 | 0.028 | 0.007 | ||||||||
| pg18beta2_o2nofp.cx10cw4_c32r128 | 99.972 | 0.028 | 0.007 | ||||||||
| pg18beta2_o2nofp.cx10d_c32r128 | 99.972 | 0.028 | 0.007 |
Performance metrics for the DBMS listed above. Some are normalized by throughput, others are not. Legend for results is here.
ips	qps	rps	rmbps	wps	wmbps	rpq	rkbpq	wpi	wkbpi	csps	cpups	cspq	cpupq	dbgb1	dbgb2	rss	maxop	p50	p99	tag
100	9892	0	0.0	81.3	2.0	0.000	0.000	0.814	20.426	38328	2.3	3.875	112	11.1	36.0	0.2	0.001	9893	9829	pg174_o2nofp.cx10a_c32r128
100	9788	0	0.0	86.0	2.0	0.000	0.000	0.862	20.702	37942	2.4	3.876	118	11.2	36.3	0.2	0.001	9780	9717	pg175_o2nofp.cx10a_c32r128
100	9851	0	0.0	82.6	2.0	0.000	0.000	0.828	20.563	38173	2.3	3.875	112	11.2	36.0	0.2	0.004	9860	9781	pg18beta1_o2nofp.cx10b_c32r128
100	9872	0	0.0	83.1	2.0	0.000	0.000	0.833	20.560	38255	2.4	3.875	117	11.1	36.0	0.2	0.001	9876	9781	pg18beta1_o2nofp.cx10cw4_c32r128
100	9736	0	0.0	80.7	2.0	0.000	0.000	0.809	20.493	37723	2.3	3.874	113	11.2	35.9	0.2	0.001	9733	9685	pg18beta1_o2nofp.cx10d_c32r128
100	9960	0	0.0	80.9	2.0	0.000	0.000	0.810	20.480	38585	2.4	3.874	116	11.1	36.0	0.2	0.001	9972	9876	pg18beta2_o2nofp.cx10b_c32r128
100	9956	0	0.0	82.8	2.0	0.000	0.000	0.829	20.503	38598	2.4	3.877	116	11.1	36.0	0.2	0.001	9972	9893	pg18beta2_o2nofp.cx10cw4_c32r128
100	9936	0	0.0	81.7	2.0	0.000	0.000	0.818	20.446	38497	2.3	3.875	111	11.1	36.0	0.2	0.001	9940	9860	pg18beta2_o2nofp.cx10d_c32r128
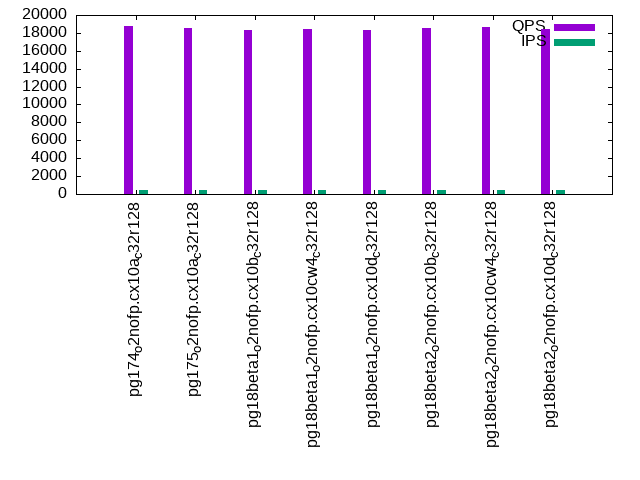
qr500.L3
qr500.L3: range queries with 500 insert/s per client. Graphs for performance per 1-second interval are here.
Average throughput:
Query response time histogram: each cell has the percentage of responses that take <= the time in the header and max is the max response time in seconds. For max values in the top 25% of the range have a red background and in the bottom 25% of the range have a green background. The red background is not used when the min value is within 80% of the max value.
| dbms | 256us | 1ms | 4ms | 16ms | 64ms | 256ms | 1s | 4s | 16s | gt | max |
|---|---|---|---|---|---|---|---|---|---|---|---|
| pg174_o2nofp.cx10a_c32r128 | 100.000 | nonzero | nonzero | 0.003 | |||||||
| pg175_o2nofp.cx10a_c32r128 | 100.000 | nonzero | nonzero | 0.002 | |||||||
| pg18beta1_o2nofp.cx10b_c32r128 | 100.000 | nonzero | nonzero | nonzero | 0.004 | ||||||
| pg18beta1_o2nofp.cx10cw4_c32r128 | 100.000 | nonzero | nonzero | nonzero | 0.004 | ||||||
| pg18beta1_o2nofp.cx10d_c32r128 | 100.000 | nonzero | nonzero | 0.003 | |||||||
| pg18beta2_o2nofp.cx10b_c32r128 | 100.000 | nonzero | nonzero | 0.003 | |||||||
| pg18beta2_o2nofp.cx10cw4_c32r128 | 100.000 | nonzero | nonzero | 0.003 | |||||||
| pg18beta2_o2nofp.cx10d_c32r128 | 100.000 | nonzero | nonzero | nonzero | 0.004 |
Insert response time histogram: each cell has the percentage of responses that take <= the time in the header and max is the max response time in seconds. For max values in the top 25% of the range have a red background and in the bottom 25% of the range have a green background. The red background is not used when the min value is within 80% of the max value.
| dbms | 256us | 1ms | 4ms | 16ms | 64ms | 256ms | 1s | 4s | 16s | gt | max |
|---|---|---|---|---|---|---|---|---|---|---|---|
| pg174_o2nofp.cx10a_c32r128 | 14.556 | 85.428 | 0.017 | 0.007 | |||||||
| pg175_o2nofp.cx10a_c32r128 | 11.444 | 88.539 | 0.017 | 0.008 | |||||||
| pg18beta1_o2nofp.cx10b_c32r128 | 15.100 | 84.883 | 0.017 | 0.008 | |||||||
| pg18beta1_o2nofp.cx10cw4_c32r128 | 14.067 | 85.917 | 0.017 | 0.008 | |||||||
| pg18beta1_o2nofp.cx10d_c32r128 | 13.344 | 86.639 | 0.017 | 0.008 | |||||||
| pg18beta2_o2nofp.cx10b_c32r128 | 13.378 | 86.606 | 0.017 | 0.007 | |||||||
| pg18beta2_o2nofp.cx10cw4_c32r128 | 16.906 | 83.078 | 0.017 | 0.008 | |||||||
| pg18beta2_o2nofp.cx10d_c32r128 | 17.606 | 82.378 | 0.017 | 0.008 |
Delete response time histogram: each cell has the percentage of responses that take <= the time in the header and max is the max response time in seconds. For max values in the top 25% of the range have a red background and in the bottom 25% of the range have a green background. The red background is not used when the min value is within 80% of the max value.
| dbms | 256us | 1ms | 4ms | 16ms | 64ms | 256ms | 1s | 4s | 16s | gt | max |
|---|---|---|---|---|---|---|---|---|---|---|---|
| pg174_o2nofp.cx10a_c32r128 | 94.861 | 5.139 | 0.010 | ||||||||
| pg175_o2nofp.cx10a_c32r128 | 95.011 | 4.989 | 0.010 | ||||||||
| pg18beta1_o2nofp.cx10b_c32r128 | 94.911 | 5.089 | 0.010 | ||||||||
| pg18beta1_o2nofp.cx10cw4_c32r128 | 94.817 | 5.183 | 0.011 | ||||||||
| pg18beta1_o2nofp.cx10d_c32r128 | 95.050 | 4.950 | 0.011 | ||||||||
| pg18beta2_o2nofp.cx10b_c32r128 | 95.533 | 4.467 | 0.010 | ||||||||
| pg18beta2_o2nofp.cx10cw4_c32r128 | 95.478 | 4.522 | 0.011 | ||||||||
| pg18beta2_o2nofp.cx10d_c32r128 | 95.744 | 4.256 | 0.011 |
Performance metrics for the DBMS listed above. Some are normalized by throughput, others are not. Legend for results is here.
ips	qps	rps	rmbps	wps	wmbps	rpq	rkbpq	wpi	wkbpi	csps	cpups	cspq	cpupq	dbgb1	dbgb2	rss	maxop	p50	p99	tag
499	18761	0	0.0	91.0	3.1	0.000	0.000	0.182	6.311	71926	2.0	3.834	51	11.2	36.1	0.4	0.003	18794	18283	pg174_o2nofp.cx10a_c32r128
499	18581	0	0.0	92.9	3.1	0.000	0.000	0.186	6.342	71203	2.1	3.832	54	11.3	36.4	0.5	0.002	18538	18123	pg175_o2nofp.cx10a_c32r128
499	18373	0	0.0	89.2	3.1	0.000	0.000	0.179	6.317	70398	2.1	3.832	55	11.2	36.1	0.4	0.004	18379	17819	pg18beta1_o2nofp.cx10b_c32r128
499	18484	0	0.0	92.5	3.1	0.000	0.000	0.185	6.346	70830	2.0	3.832	52	11.2	36.1	0.4	0.004	18490	17915	pg18beta1_o2nofp.cx10cw4_c32r128
499	18338	0	0.0	88.5	3.1	0.000	0.000	0.177	6.309	70264	2.1	3.832	55	11.2	36.0	0.4	0.003	18347	17851	pg18beta1_o2nofp.cx10d_c32r128
499	18581	0	0.0	90.0	3.1	0.000	0.000	0.180	6.309	71239	2.0	3.834	52	11.2	36.1	0.4	0.003	18587	18106	pg18beta2_o2nofp.cx10b_c32r128
499	18649	0	0.0	90.5	3.1	0.000	0.000	0.181	6.272	71453	2.0	3.832	51	11.2	36.0	0.4	0.003	18635	18171	pg18beta2_o2nofp.cx10cw4_c32r128
499	18490	0	0.0	88.8	3.1	0.000	0.000	0.178	6.259	70878	2.1	3.833	55	11.2	36.0	0.4	0.004	18442	18027	pg18beta2_o2nofp.cx10d_c32r128
qp500.L4
qp500.L4: point queries with 500 insert/s per client. Graphs for performance per 1-second interval are here.
Average throughput:
Query response time histogram: each cell has the percentage of responses that take <= the time in the header and max is the max response time in seconds. For max values in the top 25% of the range have a red background and in the bottom 25% of the range have a green background. The red background is not used when the min value is within 80% of the max value.
| dbms | 256us | 1ms | 4ms | 16ms | 64ms | 256ms | 1s | 4s | 16s | gt | max |
|---|---|---|---|---|---|---|---|---|---|---|---|
| pg174_o2nofp.cx10a_c32r128 | 100.000 | nonzero | 0.001 | ||||||||
| pg175_o2nofp.cx10a_c32r128 | 100.000 | nonzero | 0.001 | ||||||||
| pg18beta1_o2nofp.cx10b_c32r128 | 100.000 | nonzero | 0.001 | ||||||||
| pg18beta1_o2nofp.cx10cw4_c32r128 | 100.000 | nonzero | 0.001 | ||||||||
| pg18beta1_o2nofp.cx10d_c32r128 | 100.000 | nonzero | nonzero | 0.001 | |||||||
| pg18beta2_o2nofp.cx10b_c32r128 | 100.000 | nonzero | nonzero | 0.003 | |||||||
| pg18beta2_o2nofp.cx10cw4_c32r128 | 99.999 | 0.001 | 0.001 | ||||||||
| pg18beta2_o2nofp.cx10d_c32r128 | 100.000 | nonzero | 0.001 |
Insert response time histogram: each cell has the percentage of responses that take <= the time in the header and max is the max response time in seconds. For max values in the top 25% of the range have a red background and in the bottom 25% of the range have a green background. The red background is not used when the min value is within 80% of the max value.
| dbms | 256us | 1ms | 4ms | 16ms | 64ms | 256ms | 1s | 4s | 16s | gt | max |
|---|---|---|---|---|---|---|---|---|---|---|---|
| pg174_o2nofp.cx10a_c32r128 | 6.922 | 93.061 | 0.017 | 0.008 | |||||||
| pg175_o2nofp.cx10a_c32r128 | 10.517 | 89.461 | 0.022 | 0.008 | |||||||
| pg18beta1_o2nofp.cx10b_c32r128 | 11.556 | 88.428 | 0.017 | 0.007 | |||||||
| pg18beta1_o2nofp.cx10cw4_c32r128 | 12.350 | 87.633 | 0.017 | 0.007 | |||||||
| pg18beta1_o2nofp.cx10d_c32r128 | 13.200 | 86.783 | 0.017 | 0.007 | |||||||
| pg18beta2_o2nofp.cx10b_c32r128 | 12.361 | 87.622 | 0.017 | 0.008 | |||||||
| pg18beta2_o2nofp.cx10cw4_c32r128 | 13.706 | 86.278 | 0.017 | 0.007 | |||||||
| pg18beta2_o2nofp.cx10d_c32r128 | 11.033 | 88.950 | 0.017 | 0.008 |
Delete response time histogram: each cell has the percentage of responses that take <= the time in the header and max is the max response time in seconds. For max values in the top 25% of the range have a red background and in the bottom 25% of the range have a green background. The red background is not used when the min value is within 80% of the max value.
| dbms | 256us | 1ms | 4ms | 16ms | 64ms | 256ms | 1s | 4s | 16s | gt | max |
|---|---|---|---|---|---|---|---|---|---|---|---|
| pg174_o2nofp.cx10a_c32r128 | 45.278 | 54.717 | 0.006 | 0.022 | |||||||
| pg175_o2nofp.cx10a_c32r128 | 42.789 | 57.206 | 0.006 | 0.022 | |||||||
| pg18beta1_o2nofp.cx10b_c32r128 | 40.372 | 59.622 | 0.006 | 0.022 | |||||||
| pg18beta1_o2nofp.cx10cw4_c32r128 | 44.200 | 55.794 | 0.006 | 0.023 | |||||||
| pg18beta1_o2nofp.cx10d_c32r128 | 39.428 | 60.567 | 0.006 | 0.024 | |||||||
| pg18beta2_o2nofp.cx10b_c32r128 | 42.656 | 57.339 | 0.006 | 0.022 | |||||||
| pg18beta2_o2nofp.cx10cw4_c32r128 | 42.856 | 57.139 | 0.006 | 0.024 | |||||||
| pg18beta2_o2nofp.cx10d_c32r128 | 45.361 | 54.633 | 0.006 | 0.023 |
Performance metrics for the DBMS listed above. Some are normalized by throughput, others are not. Legend for results is here.
ips	qps	rps	rmbps	wps	wmbps	rpq	rkbpq	wpi	wkbpi	csps	cpups	cspq	cpupq	dbgb1	dbgb2	rss	maxop	p50	p99	tag
499	9949	0	0.0	69.5	3.9	0.000	0.000	0.139	8.034	38675	2.5	3.887	121	11.3	36.2	0.5	0.001	9941	9877	pg174_o2nofp.cx10a_c32r128
499	9789	0	0.0	73.1	3.9	0.000	0.000	0.146	8.062	38066	2.5	3.888	123	11.4	36.5	0.6	0.001	9781	9717	pg175_o2nofp.cx10a_c32r128
499	9868	2	0.2	70.8	4.2	0.000	0.020	0.142	8.672	38363	2.4	3.888	117	11.4	36.2	0.6	0.001	9876	9796	pg18beta1_o2nofp.cx10b_c32r128
499	9906	0	0.0	72.3	3.9	0.000	0.000	0.145	8.069	38518	2.5	3.888	121	11.4	36.2	0.6	0.001	9909	9781	pg18beta1_o2nofp.cx10cw4_c32r128
499	9901	0	0.0	67.8	3.9	0.000	0.000	0.136	8.040	38504	2.5	3.889	121	11.4	36.1	0.6	0.001	9908	9845	pg18beta1_o2nofp.cx10d_c32r128
499	9874	0	0.0	69.4	3.9	0.000	0.000	0.139	8.052	38405	2.4	3.889	117	11.3	36.2	0.5	0.003	9876	9812	pg18beta2_o2nofp.cx10b_c32r128
499	9837	0	0.0	68.6	3.9	0.000	0.000	0.137	8.014	38239	2.4	3.887	117	11.3	36.2	0.5	0.001	9828	9765	pg18beta2_o2nofp.cx10cw4_c32r128
499	9920	0	0.0	68.5	3.9	0.000	0.000	0.137	8.020	38582	2.3	3.889	111	11.3	36.1	0.5	0.001	9924	9860	pg18beta2_o2nofp.cx10d_c32r128
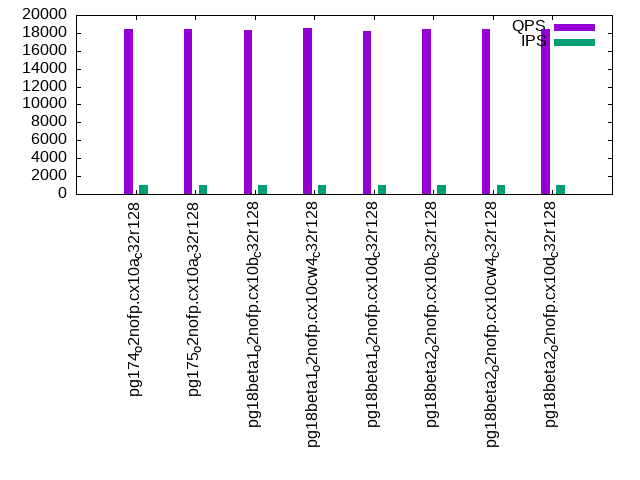
qr1000.L5
qr1000.L5: range queries with 1000 insert/s per client. Graphs for performance per 1-second interval are here.
Average throughput:
Query response time histogram: each cell has the percentage of responses that take <= the time in the header and max is the max response time in seconds. For max values in the top 25% of the range have a red background and in the bottom 25% of the range have a green background. The red background is not used when the min value is within 80% of the max value.
| dbms | 256us | 1ms | 4ms | 16ms | 64ms | 256ms | 1s | 4s | 16s | gt | max |
|---|---|---|---|---|---|---|---|---|---|---|---|
| pg174_o2nofp.cx10a_c32r128 | 99.998 | 0.001 | nonzero | nonzero | 0.011 | ||||||
| pg175_o2nofp.cx10a_c32r128 | 99.998 | 0.001 | nonzero | nonzero | 0.011 | ||||||
| pg18beta1_o2nofp.cx10b_c32r128 | 99.998 | 0.001 | nonzero | nonzero | 0.011 | ||||||
| pg18beta1_o2nofp.cx10cw4_c32r128 | 99.998 | 0.001 | nonzero | nonzero | 0.012 | ||||||
| pg18beta1_o2nofp.cx10d_c32r128 | 99.998 | 0.001 | nonzero | nonzero | 0.012 | ||||||
| pg18beta2_o2nofp.cx10b_c32r128 | 99.998 | 0.001 | nonzero | nonzero | 0.011 | ||||||
| pg18beta2_o2nofp.cx10cw4_c32r128 | 99.998 | 0.001 | nonzero | nonzero | 0.012 | ||||||
| pg18beta2_o2nofp.cx10d_c32r128 | 99.998 | 0.001 | nonzero | nonzero | 0.012 |
Insert response time histogram: each cell has the percentage of responses that take <= the time in the header and max is the max response time in seconds. For max values in the top 25% of the range have a red background and in the bottom 25% of the range have a green background. The red background is not used when the min value is within 80% of the max value.
| dbms | 256us | 1ms | 4ms | 16ms | 64ms | 256ms | 1s | 4s | 16s | gt | max |
|---|---|---|---|---|---|---|---|---|---|---|---|
| pg174_o2nofp.cx10a_c32r128 | 45.697 | 54.283 | 0.017 | 0.003 | 0.020 | ||||||
| pg175_o2nofp.cx10a_c32r128 | 44.017 | 55.958 | 0.025 | 0.013 | |||||||
| pg18beta1_o2nofp.cx10b_c32r128 | 46.722 | 53.258 | 0.019 | 0.014 | |||||||
| pg18beta1_o2nofp.cx10cw4_c32r128 | 48.147 | 51.828 | 0.025 | 0.014 | |||||||
| pg18beta1_o2nofp.cx10d_c32r128 | 46.119 | 53.858 | 0.017 | 0.006 | 0.022 | ||||||
| pg18beta2_o2nofp.cx10b_c32r128 | 49.822 | 50.153 | 0.025 | 0.013 | |||||||
| pg18beta2_o2nofp.cx10cw4_c32r128 | 46.981 | 52.994 | 0.019 | 0.006 | 0.023 | ||||||
| pg18beta2_o2nofp.cx10d_c32r128 | 46.053 | 53.925 | 0.022 | 0.015 |
Delete response time histogram: each cell has the percentage of responses that take <= the time in the header and max is the max response time in seconds. For max values in the top 25% of the range have a red background and in the bottom 25% of the range have a green background. The red background is not used when the min value is within 80% of the max value.
| dbms | 256us | 1ms | 4ms | 16ms | 64ms | 256ms | 1s | 4s | 16s | gt | max |
|---|---|---|---|---|---|---|---|---|---|---|---|
| pg174_o2nofp.cx10a_c32r128 | 8.736 | 69.908 | 21.353 | 0.003 | 0.032 | ||||||
| pg175_o2nofp.cx10a_c32r128 | 8.389 | 70.733 | 20.875 | 0.003 | 0.031 | ||||||
| pg18beta1_o2nofp.cx10b_c32r128 | 8.333 | 81.550 | 10.114 | 0.003 | 0.032 | ||||||
| pg18beta1_o2nofp.cx10cw4_c32r128 | 8.644 | 81.717 | 9.636 | 0.003 | 0.033 | ||||||
| pg18beta1_o2nofp.cx10d_c32r128 | 8.169 | 82.311 | 9.517 | 0.003 | 0.034 | ||||||
| pg18beta2_o2nofp.cx10b_c32r128 | 8.492 | 81.883 | 9.622 | 0.003 | 0.032 | ||||||
| pg18beta2_o2nofp.cx10cw4_c32r128 | 10.644 | 81.728 | 7.625 | 0.003 | 0.033 | ||||||
| pg18beta2_o2nofp.cx10d_c32r128 | 9.856 | 83.219 | 6.922 | 0.003 | 0.033 |
Performance metrics for the DBMS listed above. Some are normalized by throughput, others are not. Legend for results is here.
ips	qps	rps	rmbps	wps	wmbps	rpq	rkbpq	wpi	wkbpi	csps	cpups	cspq	cpupq	dbgb1	dbgb2	rss	maxop	p50	p99	tag
999	18484	0	0.0	79.5	4.5	0.000	0.000	0.080	4.633	71013	2.6	3.842	68	11.4	36.2	0.5	0.011	18586	17196	pg174_o2nofp.cx10a_c32r128
999	18385	0	0.0	83.0	4.5	0.000	0.000	0.083	4.637	70649	2.6	3.843	68	11.4	36.6	0.5	0.011	18491	17116	pg175_o2nofp.cx10a_c32r128
999	18292	0	0.0	79.1	4.5	0.000	0.000	0.079	4.589	70287	2.7	3.842	71	11.4	36.3	0.4	0.011	18298	17004	pg18beta1_o2nofp.cx10b_c32r128
999	18532	0	0.0	84.3	4.5	0.000	0.000	0.084	4.629	71210	2.7	3.843	70	11.4	36.3	4.4	0.012	18539	17164	pg18beta1_o2nofp.cx10cw4_c32r128
998	18183	0	0.0	78.5	4.5	0.000	0.000	0.079	4.593	69907	2.7	3.845	71	11.4	36.1	9.5	0.012	18235	16844	pg18beta1_o2nofp.cx10d_c32r128
999	18457	0	0.0	81.2	4.5	0.000	0.000	0.081	4.631	70921	2.6	3.842	68	11.4	36.3	0.4	0.011	18475	17228	pg18beta2_o2nofp.cx10b_c32r128
999	18400	0	0.0	80.9	4.5	0.000	0.000	0.081	4.613	70705	2.6	3.843	68	11.3	36.2	0.4	0.012	18379	17196	pg18beta2_o2nofp.cx10cw4_c32r128
999	18416	0	0.0	81.2	4.5	0.000	0.000	0.081	4.638	70769	2.6	3.843	68	11.4	36.3	0.4	0.012	18380	17245	pg18beta2_o2nofp.cx10d_c32r128
qp1000.L6
qp1000.L6: point queries with 1000 insert/s per client. Graphs for performance per 1-second interval are here.
Average throughput:
Query response time histogram: each cell has the percentage of responses that take <= the time in the header and max is the max response time in seconds. For max values in the top 25% of the range have a red background and in the bottom 25% of the range have a green background. The red background is not used when the min value is within 80% of the max value.
| dbms | 256us | 1ms | 4ms | 16ms | 64ms | 256ms | 1s | 4s | 16s | gt | max |
|---|---|---|---|---|---|---|---|---|---|---|---|
| pg174_o2nofp.cx10a_c32r128 | 99.999 | 0.001 | 0.001 | ||||||||
| pg175_o2nofp.cx10a_c32r128 | 99.999 | 0.001 | nonzero | 0.004 | |||||||
| pg18beta1_o2nofp.cx10b_c32r128 | 99.999 | 0.001 | 0.001 | ||||||||
| pg18beta1_o2nofp.cx10cw4_c32r128 | 99.999 | 0.001 | 0.001 | ||||||||
| pg18beta1_o2nofp.cx10d_c32r128 | 100.000 | nonzero | 0.001 | ||||||||
| pg18beta2_o2nofp.cx10b_c32r128 | 99.999 | 0.001 | 0.001 | ||||||||
| pg18beta2_o2nofp.cx10cw4_c32r128 | 99.999 | 0.001 | nonzero | 0.002 | |||||||
| pg18beta2_o2nofp.cx10d_c32r128 | 100.000 | nonzero | nonzero | 0.001 |
Insert response time histogram: each cell has the percentage of responses that take <= the time in the header and max is the max response time in seconds. For max values in the top 25% of the range have a red background and in the bottom 25% of the range have a green background. The red background is not used when the min value is within 80% of the max value.
| dbms | 256us | 1ms | 4ms | 16ms | 64ms | 256ms | 1s | 4s | 16s | gt | max |
|---|---|---|---|---|---|---|---|---|---|---|---|
| pg174_o2nofp.cx10a_c32r128 | 30.217 | 69.772 | 0.011 | 0.015 | |||||||
| pg175_o2nofp.cx10a_c32r128 | 31.128 | 68.861 | 0.011 | 0.014 | |||||||
| pg18beta1_o2nofp.cx10b_c32r128 | 38.394 | 61.594 | 0.011 | 0.011 | |||||||
| pg18beta1_o2nofp.cx10cw4_c32r128 | 39.800 | 60.186 | 0.014 | 0.012 | |||||||
| pg18beta1_o2nofp.cx10d_c32r128 | 40.158 | 59.825 | 0.017 | 0.013 | |||||||
| pg18beta2_o2nofp.cx10b_c32r128 | 42.144 | 57.842 | 0.014 | 0.014 | |||||||
| pg18beta2_o2nofp.cx10cw4_c32r128 | 44.475 | 55.500 | 0.025 | 0.014 | |||||||
| pg18beta2_o2nofp.cx10d_c32r128 | 45.131 | 54.853 | 0.017 | 0.014 |
Delete response time histogram: each cell has the percentage of responses that take <= the time in the header and max is the max response time in seconds. For max values in the top 25% of the range have a red background and in the bottom 25% of the range have a green background. The red background is not used when the min value is within 80% of the max value.
| dbms | 256us | 1ms | 4ms | 16ms | 64ms | 256ms | 1s | 4s | 16s | gt | max |
|---|---|---|---|---|---|---|---|---|---|---|---|
| pg174_o2nofp.cx10a_c32r128 | 8.878 | 47.233 | 43.886 | 0.003 | 0.024 | ||||||
| pg175_o2nofp.cx10a_c32r128 | 8.792 | 46.175 | 45.031 | 0.003 | 0.024 | ||||||
| pg18beta1_o2nofp.cx10b_c32r128 | 14.825 | 53.017 | 32.156 | 0.003 | 0.027 | ||||||
| pg18beta1_o2nofp.cx10cw4_c32r128 | 14.278 | 53.986 | 31.733 | 0.003 | 0.028 | ||||||
| pg18beta1_o2nofp.cx10d_c32r128 | 15.122 | 52.922 | 31.953 | 0.003 | 0.029 | ||||||
| pg18beta2_o2nofp.cx10b_c32r128 | 15.300 | 54.333 | 30.364 | 0.003 | 0.027 | ||||||
| pg18beta2_o2nofp.cx10cw4_c32r128 | 16.597 | 57.181 | 26.219 | 0.003 | 0.028 | ||||||
| pg18beta2_o2nofp.cx10d_c32r128 | 16.975 | 56.261 | 26.761 | 0.003 | 0.029 |
Performance metrics for the DBMS listed above. Some are normalized by throughput, others are not. Legend for results is here.
ips	qps	rps	rmbps	wps	wmbps	rpq	rkbpq	wpi	wkbpi	csps	cpups	cspq	cpupq	dbgb1	dbgb2	rss	maxop	p50	p99	tag
999	9881	0	0.0	70.6	4.8	0.000	0.000	0.071	4.893	38620	2.4	3.908	117	11.5	36.4	0.6	0.001	9892	9796	pg174_o2nofp.cx10a_c32r128
999	9738	0	0.0	68.1	4.7	0.000	0.000	0.068	4.863	38058	2.5	3.908	123	11.5	36.6	1.8	0.004	9749	9637	pg175_o2nofp.cx10a_c32r128
999	9793	1	0.0	70.8	4.8	0.000	0.000	0.071	4.890	38276	2.6	3.909	127	11.5	36.3	0.5	0.001	9797	9732	pg18beta1_o2nofp.cx10b_c32r128
999	9812	0	0.0	75.8	4.8	0.000	0.000	0.076	4.933	38375	2.6	3.911	127	11.5	36.4	0.5	0.001	9813	9748	pg18beta1_o2nofp.cx10cw4_c32r128
999	9832	0	0.0	67.7	4.7	0.000	0.000	0.068	4.854	38416	2.7	3.907	132	11.4	36.2	0.5	0.001	9844	9749	pg18beta1_o2nofp.cx10d_c32r128
999	9862	0	0.0	67.4	4.8	0.000	0.000	0.068	4.885	38535	2.5	3.907	122	11.5	36.4	0.5	0.001	9861	9797	pg18beta2_o2nofp.cx10b_c32r128
999	9770	0	0.0	69.4	4.7	0.000	0.000	0.069	4.865	38184	2.6	3.908	128	11.4	36.3	0.4	0.002	9765	9701	pg18beta2_o2nofp.cx10cw4_c32r128
999	9953	0	0.0	66.5	4.8	0.000	0.000	0.067	4.877	38876	2.4	3.906	116	11.4	36.3	0.4	0.001	9956	9876	pg18beta2_o2nofp.cx10d_c32r128
l.i0
l.i0: load without secondary indexes
Performance metrics for all DBMS, not just the ones listed above. Some are normalized by throughput, others are not. Legend for results is here.
ips	qps	rps	rmbps	wps	wmbps	rpq	rkbpq	wpi	wkbpi	csps	cpups	cspq	cpupq	dbgb1	dbgb2	rss	maxop	p50	p99	tag
159236	0	1	0.0	602.1	67.6	0.000	0.000	0.004	0.435	17386	3.6	0.109	11	4.8	13.0	0.5	0.017	159716	159016	pg174_o2nofp.cx10a_c32r128
160772	0	0	0.0	608.4	68.2	0.000	0.000	0.004	0.434	17468	3.8	0.109	11	4.8	13.0	4.8	0.025	160815	157618	pg175_o2nofp.cx10a_c32r128
157233	0	0	0.0	597.3	66.8	0.000	0.000	0.004	0.435	16899	3.5	0.107	11	4.8	13.0	0.5	0.002	156817	155823	pg18beta1_o2nofp.cx10b_c32r128
157729	0	0	0.0	610.3	67.2	0.000	0.000	0.004	0.436	16904	3.4	0.107	10	4.8	13.0	4.7	0.019	158415	154022	pg18beta1_o2nofp.cx10cw4_c32r128
157729	0	0	0.0	600.3	66.9	0.000	0.000	0.004	0.434	16915	3.5	0.107	11	4.8	13.0	2.9	0.011	158219	155625	pg18beta1_o2nofp.cx10d_c32r128
158730	0	0	0.0	600.6	67.2	0.000	0.000	0.004	0.433	16968	3.3	0.107	10	4.8	13.0	4.7	0.010	158721	156516	pg18beta2_o2nofp.cx10b_c32r128
161290	0	0	0.0	611.8	68.2	0.000	0.000	0.004	0.433	17551	4.1	0.109	12	4.8	13.0	0.5	0.010	161913	159113	pg18beta2_o2nofp.cx10cw4_c32r128
160256	0	0	0.0	607.1	68.0	0.000	0.000	0.004	0.434	17429	3.8	0.109	11	4.8	13.0	0.5	0.009	161311	158318	pg18beta2_o2nofp.cx10d_c32r128
l.x
l.x: create secondary indexes
Performance metrics for all DBMS, not just the ones listed above. Some are normalized by throughput, others are not. Legend for results is here.
ips	qps	rps	rmbps	wps	wmbps	rpq	rkbpq	wpi	wkbpi	csps	cpups	cspq	cpupq	dbgb1	dbgb2	rss	maxop	p50	p99	tag
375941	0	1	0.0	943.1	113.4	0.000	0.000	0.003	0.309	2088	3.1	0.006	4	9.6	22.1	5.1	0.002	NA	NA	pg174_o2nofp.cx10a_c32r128
375941	0	0	0.0	944.7	113.3	0.000	0.000	0.003	0.309	2162	3.0	0.006	4	9.6	22.2	5.1	0.002	NA	NA	pg175_o2nofp.cx10a_c32r128
381680	0	0	0.0	964.8	115.9	0.000	0.000	0.003	0.311	2201	3.0	0.006	4	9.6	22.2	5.1	0.002	NA	NA	pg18beta1_o2nofp.cx10b_c32r128
384616	0	0	0.0	996.9	118.4	0.000	0.000	0.003	0.315	2259	2.9	0.006	4	9.6	22.2	5.1	0.002	NA	NA	pg18beta1_o2nofp.cx10cw4_c32r128
381680	0	0	0.0	962.1	115.3	0.000	0.000	0.003	0.309	2383	2.9	0.006	4	9.6	22.2	5.1	0.002	NA	NA	pg18beta1_o2nofp.cx10d_c32r128
381680	0	0	0.0	976.2	117.0	0.000	0.000	0.003	0.314	2444	2.9	0.006	4	9.6	22.2	5.1	0.002	NA	NA	pg18beta2_o2nofp.cx10b_c32r128
381680	0	0	0.0	976.6	116.9	0.000	0.000	0.003	0.314	2339	2.9	0.006	4	9.6	22.2	5.1	0.002	NA	NA	pg18beta2_o2nofp.cx10cw4_c32r128
381680	0	0	0.0	944.1	113.2	0.000	0.000	0.002	0.304	2399	2.8	0.006	4	9.6	22.2	5.1	0.002	NA	NA	pg18beta2_o2nofp.cx10d_c32r128
l.i1
l.i1: continue load after secondary indexes created with 50 inserts per transaction
Performance metrics for all DBMS, not just the ones listed above. Some are normalized by throughput, others are not. Legend for results is here.
ips	qps	rps	rmbps	wps	wmbps	rpq	rkbpq	wpi	wkbpi	csps	cpups	cspq	cpupq	dbgb1	dbgb2	rss	maxop	p50	p99	tag
13356	0	0	0.0	146.0	16.1	0.000	0.000	0.011	1.231	6301	2.9	0.472	104	10.8	31.2	8.4	0.007	8540	4895	pg174_o2nofp.cx10a_c32r128
14828	0	0	0.0	166.5	18.0	0.000	0.000	0.011	1.240	7018	3.1	0.473	100	10.9	31.2	9.1	0.007	12435	7441	pg175_o2nofp.cx10a_c32r128
13769	0	0	0.0	154.7	16.9	0.000	0.000	0.011	1.258	6485	3.1	0.471	108	10.9	31.3	2.6	0.021	10039	7292	pg18beta1_o2nofp.cx10b_c32r128
13548	0	0	0.0	159.8	16.7	0.000	0.000	0.012	1.260	6536	3.1	0.482	110	10.9	31.3	9.1	0.007	9789	7192	pg18beta1_o2nofp.cx10cw4_c32r128
13434	0	0	0.0	152.4	16.5	0.000	0.000	0.011	1.259	6504	2.9	0.484	104	10.9	31.3	9.0	0.007	10938	3596	pg18beta1_o2nofp.cx10d_c32r128
13536	0	0	0.0	151.5	16.5	0.000	0.000	0.011	1.249	6378	2.9	0.471	103	10.9	31.2	8.8	0.007	8690	5244	pg18beta2_o2nofp.cx10b_c32r128
14060	0	0	0.0	157.7	17.2	0.000	0.000	0.011	1.251	6723	3.1	0.478	106	10.8	31.2	2.6	0.007	9489	6243	pg18beta2_o2nofp.cx10cw4_c32r128
13853	0	0	0.0	153.3	16.9	0.000	0.000	0.011	1.250	6602	2.9	0.477	100	10.8	31.2	2.5	0.018	9090	5643	pg18beta2_o2nofp.cx10d_c32r128
l.i2
l.i2: continue load after secondary indexes created with 5 inserts per transaction
Performance metrics for all DBMS, not just the ones listed above. Some are normalized by throughput, others are not. Legend for results is here.
ips	qps	rps	rmbps	wps	wmbps	rpq	rkbpq	wpi	wkbpi	csps	cpups	cspq	cpupq	dbgb1	dbgb2	rss	maxop	p50	p99	tag
1610	0	0	0.0	113.1	10.0	0.000	0.000	0.070	6.360	7106	2.0	4.415	596	11.1	36.0	0.5	0.011	954	694	pg174_o2nofp.cx10a_c32r128
1454	0	0	0.0	105.1	9.1	0.000	0.000	0.072	6.388	6521	2.0	4.483	660	11.1	36.3	0.6	0.004	1229	794	pg175_o2nofp.cx10a_c32r128
1418	0	0	0.0	100.0	8.9	0.000	0.000	0.070	6.421	6344	2.0	4.473	677	11.1	36.0	0.6	0.002	1219	799	pg18beta1_o2nofp.cx10b_c32r128
1440	0	0	0.0	101.3	9.0	0.000	0.000	0.070	6.401	6403	2.0	4.445	666	11.1	36.0	0.7	0.003	1194	804	pg18beta1_o2nofp.cx10cw4_c32r128
1337	0	0	0.0	96.4	8.5	0.000	0.000	0.072	6.525	5984	2.0	4.477	718	11.1	35.9	0.6	0.002	1184	449	pg18beta1_o2nofp.cx10d_c32r128
1650	0	0	0.0	113.8	10.1	0.000	0.000	0.069	6.264	7326	2.0	4.440	582	11.1	36.0	0.5	0.014	969	699	pg18beta2_o2nofp.cx10b_c32r128
1487	0	0	0.0	109.5	9.3	0.000	0.000	0.074	6.433	6618	2.0	4.451	646	11.1	36.0	9.3	0.005	1004	714	pg18beta2_o2nofp.cx10cw4_c32r128
1450	0	0	0.0	102.4	9.1	0.000	0.000	0.071	6.459	6454	2.0	4.450	662	11.1	36.0	7.7	0.002	994	739	pg18beta2_o2nofp.cx10d_c32r128
qr100.L1
qr100.L1: range queries with 100 insert/s per client
Performance metrics for all DBMS, not just the ones listed above. Some are normalized by throughput, others are not. Legend for results is here.
ips	qps	rps	rmbps	wps	wmbps	rpq	rkbpq	wpi	wkbpi	csps	cpups	cspq	cpupq	dbgb1	dbgb2	rss	maxop	p50	p99	tag
100	19450	0	0.0	14.4	1.0	0.000	0.000	0.144	10.587	74368	2.0	3.824	49	11.1	36.0	0.2	0.001	19498	19130	pg174_o2nofp.cx10a_c32r128
100	19481	0	0.0	21.3	1.1	0.000	0.000	0.214	10.900	74556	2.0	3.827	49	11.2	36.3	0.2	0.001	19529	19242	pg175_o2nofp.cx10a_c32r128
100	19418	0	0.0	15.6	1.0	0.000	0.000	0.156	10.687	74291	2.0	3.826	49	11.1	36.0	0.2	0.001	19497	19177	pg18beta1_o2nofp.cx10b_c32r128
100	19473	0	0.0	17.2	1.0	0.000	0.000	0.172	10.763	74467	2.0	3.824	49	11.1	36.0	0.2	0.001	19497	19225	pg18beta1_o2nofp.cx10cw4_c32r128
100	19207	0	0.0	16.8	1.0	0.000	0.000	0.169	10.744	73451	2.0	3.824	50	11.1	35.9	0.2	0.004	19130	18986	pg18beta1_o2nofp.cx10d_c32r128
100	19545	0	0.0	14.5	1.0	0.000	0.000	0.146	10.614	74731	2.0	3.823	49	11.1	36.0	0.2	0.001	19481	19305	pg18beta2_o2nofp.cx10b_c32r128
100	19306	0	0.0	18.6	1.0	0.000	0.000	0.186	10.772	73839	2.0	3.825	50	11.1	36.0	0.2	0.004	19306	19034	pg18beta2_o2nofp.cx10cw4_c32r128
100	19352	0	0.0	15.3	1.0	0.000	0.000	0.154	10.612	73999	2.0	3.824	50	11.1	36.0	0.2	0.001	19401	19066	pg18beta2_o2nofp.cx10d_c32r128
qp100.L2
qp100.L2: point queries with 100 insert/s per client
Performance metrics for all DBMS, not just the ones listed above. Some are normalized by throughput, others are not. Legend for results is here.
ips	qps	rps	rmbps	wps	wmbps	rpq	rkbpq	wpi	wkbpi	csps	cpups	cspq	cpupq	dbgb1	dbgb2	rss	maxop	p50	p99	tag
100	9892	0	0.0	81.3	2.0	0.000	0.000	0.814	20.426	38328	2.3	3.875	112	11.1	36.0	0.2	0.001	9893	9829	pg174_o2nofp.cx10a_c32r128
100	9788	0	0.0	86.0	2.0	0.000	0.000	0.862	20.702	37942	2.4	3.876	118	11.2	36.3	0.2	0.001	9780	9717	pg175_o2nofp.cx10a_c32r128
100	9851	0	0.0	82.6	2.0	0.000	0.000	0.828	20.563	38173	2.3	3.875	112	11.2	36.0	0.2	0.004	9860	9781	pg18beta1_o2nofp.cx10b_c32r128
100	9872	0	0.0	83.1	2.0	0.000	0.000	0.833	20.560	38255	2.4	3.875	117	11.1	36.0	0.2	0.001	9876	9781	pg18beta1_o2nofp.cx10cw4_c32r128
100	9736	0	0.0	80.7	2.0	0.000	0.000	0.809	20.493	37723	2.3	3.874	113	11.2	35.9	0.2	0.001	9733	9685	pg18beta1_o2nofp.cx10d_c32r128
100	9960	0	0.0	80.9	2.0	0.000	0.000	0.810	20.480	38585	2.4	3.874	116	11.1	36.0	0.2	0.001	9972	9876	pg18beta2_o2nofp.cx10b_c32r128
100	9956	0	0.0	82.8	2.0	0.000	0.000	0.829	20.503	38598	2.4	3.877	116	11.1	36.0	0.2	0.001	9972	9893	pg18beta2_o2nofp.cx10cw4_c32r128
100	9936	0	0.0	81.7	2.0	0.000	0.000	0.818	20.446	38497	2.3	3.875	111	11.1	36.0	0.2	0.001	9940	9860	pg18beta2_o2nofp.cx10d_c32r128
qr500.L3
qr500.L3: range queries with 500 insert/s per client
Performance metrics for all DBMS, not just the ones listed above. Some are normalized by throughput, others are not. Legend for results is here.
ips	qps	rps	rmbps	wps	wmbps	rpq	rkbpq	wpi	wkbpi	csps	cpups	cspq	cpupq	dbgb1	dbgb2	rss	maxop	p50	p99	tag
499	18761	0	0.0	91.0	3.1	0.000	0.000	0.182	6.311	71926	2.0	3.834	51	11.2	36.1	0.4	0.003	18794	18283	pg174_o2nofp.cx10a_c32r128
499	18581	0	0.0	92.9	3.1	0.000	0.000	0.186	6.342	71203	2.1	3.832	54	11.3	36.4	0.5	0.002	18538	18123	pg175_o2nofp.cx10a_c32r128
499	18373	0	0.0	89.2	3.1	0.000	0.000	0.179	6.317	70398	2.1	3.832	55	11.2	36.1	0.4	0.004	18379	17819	pg18beta1_o2nofp.cx10b_c32r128
499	18484	0	0.0	92.5	3.1	0.000	0.000	0.185	6.346	70830	2.0	3.832	52	11.2	36.1	0.4	0.004	18490	17915	pg18beta1_o2nofp.cx10cw4_c32r128
499	18338	0	0.0	88.5	3.1	0.000	0.000	0.177	6.309	70264	2.1	3.832	55	11.2	36.0	0.4	0.003	18347	17851	pg18beta1_o2nofp.cx10d_c32r128
499	18581	0	0.0	90.0	3.1	0.000	0.000	0.180	6.309	71239	2.0	3.834	52	11.2	36.1	0.4	0.003	18587	18106	pg18beta2_o2nofp.cx10b_c32r128
499	18649	0	0.0	90.5	3.1	0.000	0.000	0.181	6.272	71453	2.0	3.832	51	11.2	36.0	0.4	0.003	18635	18171	pg18beta2_o2nofp.cx10cw4_c32r128
499	18490	0	0.0	88.8	3.1	0.000	0.000	0.178	6.259	70878	2.1	3.833	55	11.2	36.0	0.4	0.004	18442	18027	pg18beta2_o2nofp.cx10d_c32r128
qp500.L4
qp500.L4: point queries with 500 insert/s per client
Performance metrics for all DBMS, not just the ones listed above. Some are normalized by throughput, others are not. Legend for results is here.
ips	qps	rps	rmbps	wps	wmbps	rpq	rkbpq	wpi	wkbpi	csps	cpups	cspq	cpupq	dbgb1	dbgb2	rss	maxop	p50	p99	tag
499	9949	0	0.0	69.5	3.9	0.000	0.000	0.139	8.034	38675	2.5	3.887	121	11.3	36.2	0.5	0.001	9941	9877	pg174_o2nofp.cx10a_c32r128
499	9789	0	0.0	73.1	3.9	0.000	0.000	0.146	8.062	38066	2.5	3.888	123	11.4	36.5	0.6	0.001	9781	9717	pg175_o2nofp.cx10a_c32r128
499	9868	2	0.2	70.8	4.2	0.000	0.020	0.142	8.672	38363	2.4	3.888	117	11.4	36.2	0.6	0.001	9876	9796	pg18beta1_o2nofp.cx10b_c32r128
499	9906	0	0.0	72.3	3.9	0.000	0.000	0.145	8.069	38518	2.5	3.888	121	11.4	36.2	0.6	0.001	9909	9781	pg18beta1_o2nofp.cx10cw4_c32r128
499	9901	0	0.0	67.8	3.9	0.000	0.000	0.136	8.040	38504	2.5	3.889	121	11.4	36.1	0.6	0.001	9908	9845	pg18beta1_o2nofp.cx10d_c32r128
499	9874	0	0.0	69.4	3.9	0.000	0.000	0.139	8.052	38405	2.4	3.889	117	11.3	36.2	0.5	0.003	9876	9812	pg18beta2_o2nofp.cx10b_c32r128
499	9837	0	0.0	68.6	3.9	0.000	0.000	0.137	8.014	38239	2.4	3.887	117	11.3	36.2	0.5	0.001	9828	9765	pg18beta2_o2nofp.cx10cw4_c32r128
499	9920	0	0.0	68.5	3.9	0.000	0.000	0.137	8.020	38582	2.3	3.889	111	11.3	36.1	0.5	0.001	9924	9860	pg18beta2_o2nofp.cx10d_c32r128
qr1000.L5
qr1000.L5: range queries with 1000 insert/s per client
Performance metrics for all DBMS, not just the ones listed above. Some are normalized by throughput, others are not. Legend for results is here.
ips	qps	rps	rmbps	wps	wmbps	rpq	rkbpq	wpi	wkbpi	csps	cpups	cspq	cpupq	dbgb1	dbgb2	rss	maxop	p50	p99	tag
999	18484	0	0.0	79.5	4.5	0.000	0.000	0.080	4.633	71013	2.6	3.842	68	11.4	36.2	0.5	0.011	18586	17196	pg174_o2nofp.cx10a_c32r128
999	18385	0	0.0	83.0	4.5	0.000	0.000	0.083	4.637	70649	2.6	3.843	68	11.4	36.6	0.5	0.011	18491	17116	pg175_o2nofp.cx10a_c32r128
999	18292	0	0.0	79.1	4.5	0.000	0.000	0.079	4.589	70287	2.7	3.842	71	11.4	36.3	0.4	0.011	18298	17004	pg18beta1_o2nofp.cx10b_c32r128
999	18532	0	0.0	84.3	4.5	0.000	0.000	0.084	4.629	71210	2.7	3.843	70	11.4	36.3	4.4	0.012	18539	17164	pg18beta1_o2nofp.cx10cw4_c32r128
998	18183	0	0.0	78.5	4.5	0.000	0.000	0.079	4.593	69907	2.7	3.845	71	11.4	36.1	9.5	0.012	18235	16844	pg18beta1_o2nofp.cx10d_c32r128
999	18457	0	0.0	81.2	4.5	0.000	0.000	0.081	4.631	70921	2.6	3.842	68	11.4	36.3	0.4	0.011	18475	17228	pg18beta2_o2nofp.cx10b_c32r128
999	18400	0	0.0	80.9	4.5	0.000	0.000	0.081	4.613	70705	2.6	3.843	68	11.3	36.2	0.4	0.012	18379	17196	pg18beta2_o2nofp.cx10cw4_c32r128
999	18416	0	0.0	81.2	4.5	0.000	0.000	0.081	4.638	70769	2.6	3.843	68	11.4	36.3	0.4	0.012	18380	17245	pg18beta2_o2nofp.cx10d_c32r128
qp1000.L6
qp1000.L6: point queries with 1000 insert/s per client
Performance metrics for all DBMS, not just the ones listed above. Some are normalized by throughput, others are not. Legend for results is here.
ips	qps	rps	rmbps	wps	wmbps	rpq	rkbpq	wpi	wkbpi	csps	cpups	cspq	cpupq	dbgb1	dbgb2	rss	maxop	p50	p99	tag
999	9881	0	0.0	70.6	4.8	0.000	0.000	0.071	4.893	38620	2.4	3.908	117	11.5	36.4	0.6	0.001	9892	9796	pg174_o2nofp.cx10a_c32r128
999	9738	0	0.0	68.1	4.7	0.000	0.000	0.068	4.863	38058	2.5	3.908	123	11.5	36.6	1.8	0.004	9749	9637	pg175_o2nofp.cx10a_c32r128
999	9793	1	0.0	70.8	4.8	0.000	0.000	0.071	4.890	38276	2.6	3.909	127	11.5	36.3	0.5	0.001	9797	9732	pg18beta1_o2nofp.cx10b_c32r128
999	9812	0	0.0	75.8	4.8	0.000	0.000	0.076	4.933	38375	2.6	3.911	127	11.5	36.4	0.5	0.001	9813	9748	pg18beta1_o2nofp.cx10cw4_c32r128
999	9832	0	0.0	67.7	4.7	0.000	0.000	0.068	4.854	38416	2.7	3.907	132	11.4	36.2	0.5	0.001	9844	9749	pg18beta1_o2nofp.cx10d_c32r128
999	9862	0	0.0	67.4	4.8	0.000	0.000	0.068	4.885	38535	2.5	3.907	122	11.5	36.4	0.5	0.001	9861	9797	pg18beta2_o2nofp.cx10b_c32r128
999	9770	0	0.0	69.4	4.7	0.000	0.000	0.069	4.865	38184	2.6	3.908	128	11.4	36.3	0.4	0.002	9765	9701	pg18beta2_o2nofp.cx10cw4_c32r128
999	9953	0	0.0	66.5	4.8	0.000	0.000	0.067	4.877	38876	2.4	3.906	116	11.4	36.3	0.4	0.001	9956	9876	pg18beta2_o2nofp.cx10d_c32r128
l.i0
- l.i0: load without secondary indexes
- Legend for results is here.
- Each entry lists the percentage of responses that fit in that bucket (slower than max time for previous bucket, faster than min time for next bucket).
Insert response time histogram
256us	1ms	4ms	16ms	64ms	256ms	1s	4s	16s	gt	max	tag
0.000	99.999	nonzero	nonzero	nonzero	0.000	0.000	0.000	0.000	0.000	0.017	pg174_o2nofp.cx10a_c32r128
0.000	99.999	0.001	0.000	nonzero	0.000	0.000	0.000	0.000	0.000	0.025	pg175_o2nofp.cx10a_c32r128
0.000	99.998	0.002	0.000	0.000	0.000	0.000	0.000	0.000	0.000	0.002	pg18beta1_o2nofp.cx10b_c32r128
0.000	99.998	0.001	0.001	nonzero	0.000	0.000	0.000	0.000	0.000	0.019	pg18beta1_o2nofp.cx10cw4_c32r128
0.000	99.999	0.001	nonzero	0.000	0.000	0.000	0.000	0.000	0.000	0.011	pg18beta1_o2nofp.cx10d_c32r128
0.000	99.998	0.001	0.001	0.000	0.000	0.000	0.000	0.000	0.000	0.010	pg18beta2_o2nofp.cx10b_c32r128
0.000	99.999	0.001	nonzero	0.000	0.000	0.000	0.000	0.000	0.000	0.010	pg18beta2_o2nofp.cx10cw4_c32r128
0.000	99.999	0.001	nonzero	0.000	0.000	0.000	0.000	0.000	0.000	0.009	pg18beta2_o2nofp.cx10d_c32r128
l.x
- l.x: create secondary indexes
- Legend for results is here.
- Each entry lists the percentage of responses that fit in that bucket (slower than max time for previous bucket, faster than min time for next bucket).
TODO - determine whether there is data for create index response time
l.i1
- l.i1: continue load after secondary indexes created with 50 inserts per transaction
- Legend for results is here.
- Each entry lists the percentage of responses that fit in that bucket (slower than max time for previous bucket, faster than min time for next bucket).
Insert response time histogram
256us	1ms	4ms	16ms	64ms	256ms	1s	4s	16s	gt	max	tag
0.000	44.432	55.567	0.001	0.000	0.000	0.000	0.000	0.000	0.000	0.007	pg174_o2nofp.cx10a_c32r128
0.000	34.979	65.019	0.001	0.000	0.000	0.000	0.000	0.000	0.000	0.007	pg175_o2nofp.cx10a_c32r128
0.000	32.992	67.006	0.002	0.001	0.000	0.000	0.000	0.000	0.000	0.021	pg18beta1_o2nofp.cx10b_c32r128
0.000	33.580	66.419	0.001	0.000	0.000	0.000	0.000	0.000	0.000	0.007	pg18beta1_o2nofp.cx10cw4_c32r128
0.000	39.845	60.154	0.001	0.000	0.000	0.000	0.000	0.000	0.000	0.007	pg18beta1_o2nofp.cx10d_c32r128
0.000	45.182	54.817	0.002	0.000	0.000	0.000	0.000	0.000	0.000	0.007	pg18beta2_o2nofp.cx10b_c32r128
0.000	41.440	58.559	0.001	0.000	0.000	0.000	0.000	0.000	0.000	0.007	pg18beta2_o2nofp.cx10cw4_c32r128
0.000	43.428	56.570	0.002	0.001	0.000	0.000	0.000	0.000	0.000	0.018	pg18beta2_o2nofp.cx10d_c32r128
Delete response time histogram
256us	1ms	4ms	16ms	64ms	256ms	1s	4s	16s	gt	max	tag
0.000	12.043	51.314	36.643	0.000	0.000	0.000	0.000	0.000	0.000	0.011	pg174_o2nofp.cx10a_c32r128
0.000	12.078	55.093	32.829	0.000	0.000	0.000	0.000	0.000	0.000	0.011	pg175_o2nofp.cx10a_c32r128
0.000	11.680	38.984	49.335	nonzero	0.000	0.000	0.000	0.000	0.000	0.021	pg18beta1_o2nofp.cx10b_c32r128
0.000	11.597	37.564	50.838	0.000	0.000	0.000	0.000	0.000	0.000	0.010	pg18beta1_o2nofp.cx10cw4_c32r128
0.000	7.655	59.567	32.778	nonzero	0.000	0.000	0.000	0.000	0.000	0.017	pg18beta1_o2nofp.cx10d_c32r128
0.000	12.024	48.692	39.284	0.000	0.000	0.000	0.000	0.000	0.000	0.010	pg18beta2_o2nofp.cx10b_c32r128
0.000	12.031	44.914	43.056	0.000	0.000	0.000	0.000	0.000	0.000	0.010	pg18beta2_o2nofp.cx10cw4_c32r128
0.000	12.012	49.443	38.545	0.000	0.000	0.000	0.000	0.000	0.000	0.012	pg18beta2_o2nofp.cx10d_c32r128
l.i2
- l.i2: continue load after secondary indexes created with 5 inserts per transaction
- Legend for results is here.
- Each entry lists the percentage of responses that fit in that bucket (slower than max time for previous bucket, faster than min time for next bucket).
Insert response time histogram
256us	1ms	4ms	16ms	64ms	256ms	1s	4s	16s	gt	max	tag
50.472	49.527	nonzero	nonzero	0.000	0.000	0.000	0.000	0.000	0.000	0.011	pg174_o2nofp.cx10a_c32r128
26.530	73.469	0.001	0.000	0.000	0.000	0.000	0.000	0.000	0.000	0.004	pg175_o2nofp.cx10a_c32r128
16.396	83.603	nonzero	0.000	0.000	0.000	0.000	0.000	0.000	0.000	0.002	pg18beta1_o2nofp.cx10b_c32r128
21.739	78.261	nonzero	0.000	0.000	0.000	0.000	0.000	0.000	0.000	0.003	pg18beta1_o2nofp.cx10cw4_c32r128
33.381	66.619	nonzero	0.000	0.000	0.000	0.000	0.000	0.000	0.000	0.002	pg18beta1_o2nofp.cx10d_c32r128
52.049	47.941	0.006	0.004	0.000	0.000	0.000	0.000	0.000	0.000	0.014	pg18beta2_o2nofp.cx10b_c32r128
40.395	59.604	0.001	nonzero	0.000	0.000	0.000	0.000	0.000	0.000	0.005	pg18beta2_o2nofp.cx10cw4_c32r128
38.264	61.736	nonzero	0.000	0.000	0.000	0.000	0.000	0.000	0.000	0.002	pg18beta2_o2nofp.cx10d_c32r128
Delete response time histogram
256us	1ms	4ms	16ms	64ms	256ms	1s	4s	16s	gt	max	tag
1.477	19.049	38.838	40.636	nonzero	0.000	0.000	0.000	0.000	0.000	0.031	pg174_o2nofp.cx10a_c32r128
0.517	9.556	55.784	34.143	nonzero	0.000	0.000	0.000	0.000	0.000	0.021	pg175_o2nofp.cx10a_c32r128
0.330	9.679	51.532	38.459	0.000	0.000	0.000	0.000	0.000	0.000	0.015	pg18beta1_o2nofp.cx10b_c32r128
0.355	9.599	50.131	39.915	0.000	0.000	0.000	0.000	0.000	0.000	0.014	pg18beta1_o2nofp.cx10cw4_c32r128
0.318	9.617	65.304	24.761	0.000	0.000	0.000	0.000	0.000	0.000	0.015	pg18beta1_o2nofp.cx10d_c32r128
1.127	19.425	40.907	38.540	0.001	0.000	0.000	0.000	0.000	0.000	0.033	pg18beta2_o2nofp.cx10b_c32r128
1.024	19.507	30.699	48.770	nonzero	0.000	0.000	0.000	0.000	0.000	0.032	pg18beta2_o2nofp.cx10cw4_c32r128
0.944	19.773	29.331	49.952	nonzero	0.000	0.000	0.000	0.000	0.000	0.030	pg18beta2_o2nofp.cx10d_c32r128
qr100.L1
- qr100.L1: range queries with 100 insert/s per client
- Legend for results is here.
- Each entry lists the percentage of responses that fit in that bucket (slower than max time for previous bucket, faster than min time for next bucket).
Query response time histogram
256us	1ms	4ms	16ms	64ms	256ms	1s	4s	16s	gt	max	tag
100.000	nonzero	nonzero	0.000	0.000	0.000	0.000	0.000	0.000	0.000	0.001	pg174_o2nofp.cx10a_c32r128
100.000	nonzero	nonzero	0.000	0.000	0.000	0.000	0.000	0.000	0.000	0.001	pg175_o2nofp.cx10a_c32r128
100.000	nonzero	nonzero	0.000	0.000	0.000	0.000	0.000	0.000	0.000	0.001	pg18beta1_o2nofp.cx10b_c32r128
100.000	nonzero	nonzero	0.000	0.000	0.000	0.000	0.000	0.000	0.000	0.001	pg18beta1_o2nofp.cx10cw4_c32r128
100.000	nonzero	nonzero	nonzero	0.000	0.000	0.000	0.000	0.000	0.000	0.004	pg18beta1_o2nofp.cx10d_c32r128
100.000	nonzero	nonzero	0.000	0.000	0.000	0.000	0.000	0.000	0.000	0.001	pg18beta2_o2nofp.cx10b_c32r128
100.000	nonzero	nonzero	nonzero	0.000	0.000	0.000	0.000	0.000	0.000	0.004	pg18beta2_o2nofp.cx10cw4_c32r128
100.000	nonzero	nonzero	0.000	0.000	0.000	0.000	0.000	0.000	0.000	0.001	pg18beta2_o2nofp.cx10d_c32r128
Insert response time histogram
256us	1ms	4ms	16ms	64ms	256ms	1s	4s	16s	gt	max	tag
0.000	0.000	99.889	0.111	0.000	0.000	0.000	0.000	0.000	0.000	0.007	pg174_o2nofp.cx10a_c32r128
0.000	0.000	99.889	0.111	0.000	0.000	0.000	0.000	0.000	0.000	0.008	pg175_o2nofp.cx10a_c32r128
0.000	0.000	99.889	0.111	0.000	0.000	0.000	0.000	0.000	0.000	0.008	pg18beta1_o2nofp.cx10b_c32r128
0.000	0.000	99.889	0.111	0.000	0.000	0.000	0.000	0.000	0.000	0.008	pg18beta1_o2nofp.cx10cw4_c32r128
0.000	0.000	99.889	0.111	0.000	0.000	0.000	0.000	0.000	0.000	0.008	pg18beta1_o2nofp.cx10d_c32r128
0.000	0.000	99.889	0.111	0.000	0.000	0.000	0.000	0.000	0.000	0.008	pg18beta2_o2nofp.cx10b_c32r128
0.000	0.000	99.889	0.111	0.000	0.000	0.000	0.000	0.000	0.000	0.008	pg18beta2_o2nofp.cx10cw4_c32r128
0.000	0.000	99.889	0.111	0.000	0.000	0.000	0.000	0.000	0.000	0.008	pg18beta2_o2nofp.cx10d_c32r128
Delete response time histogram
256us	1ms	4ms	16ms	64ms	256ms	1s	4s	16s	gt	max	tag
0.000	55.306	44.694	0.000	0.000	0.000	0.000	0.000	0.000	0.000	0.002	pg174_o2nofp.cx10a_c32r128
0.000	54.944	45.056	0.000	0.000	0.000	0.000	0.000	0.000	0.000	0.002	pg175_o2nofp.cx10a_c32r128
0.000	55.333	44.667	0.000	0.000	0.000	0.000	0.000	0.000	0.000	0.002	pg18beta1_o2nofp.cx10b_c32r128
0.000	52.750	47.250	0.000	0.000	0.000	0.000	0.000	0.000	0.000	0.002	pg18beta1_o2nofp.cx10cw4_c32r128
0.000	52.556	47.444	0.000	0.000	0.000	0.000	0.000	0.000	0.000	0.002	pg18beta1_o2nofp.cx10d_c32r128
0.000	55.167	44.833	0.000	0.000	0.000	0.000	0.000	0.000	0.000	0.002	pg18beta2_o2nofp.cx10b_c32r128
0.000	54.250	45.750	0.000	0.000	0.000	0.000	0.000	0.000	0.000	0.002	pg18beta2_o2nofp.cx10cw4_c32r128
0.000	57.694	42.306	0.000	0.000	0.000	0.000	0.000	0.000	0.000	0.002	pg18beta2_o2nofp.cx10d_c32r128
qp100.L2
- qp100.L2: point queries with 100 insert/s per client
- Legend for results is here.
- Each entry lists the percentage of responses that fit in that bucket (slower than max time for previous bucket, faster than min time for next bucket).
Query response time histogram
256us	1ms	4ms	16ms	64ms	256ms	1s	4s	16s	gt	max	tag
100.000	nonzero	0.000	0.000	0.000	0.000	0.000	0.000	0.000	0.000	0.001	pg174_o2nofp.cx10a_c32r128
100.000	nonzero	0.000	0.000	0.000	0.000	0.000	0.000	0.000	0.000	0.001	pg175_o2nofp.cx10a_c32r128
100.000	nonzero	0.000	nonzero	0.000	0.000	0.000	0.000	0.000	0.000	0.004	pg18beta1_o2nofp.cx10b_c32r128
100.000	nonzero	nonzero	0.000	0.000	0.000	0.000	0.000	0.000	0.000	0.001	pg18beta1_o2nofp.cx10cw4_c32r128
100.000	nonzero	0.000	0.000	0.000	0.000	0.000	0.000	0.000	0.000	0.001	pg18beta1_o2nofp.cx10d_c32r128
100.000	nonzero	0.000	0.000	0.000	0.000	0.000	0.000	0.000	0.000	0.001	pg18beta2_o2nofp.cx10b_c32r128
100.000	nonzero	0.000	0.000	0.000	0.000	0.000	0.000	0.000	0.000	0.001	pg18beta2_o2nofp.cx10cw4_c32r128
100.000	nonzero	0.000	0.000	0.000	0.000	0.000	0.000	0.000	0.000	0.001	pg18beta2_o2nofp.cx10d_c32r128
Insert response time histogram
256us	1ms	4ms	16ms	64ms	256ms	1s	4s	16s	gt	max	tag
0.000	0.000	99.889	0.111	0.000	0.000	0.000	0.000	0.000	0.000	0.007	pg174_o2nofp.cx10a_c32r128
0.000	0.000	99.889	0.111	0.000	0.000	0.000	0.000	0.000	0.000	0.007	pg175_o2nofp.cx10a_c32r128
0.000	0.000	99.889	0.111	0.000	0.000	0.000	0.000	0.000	0.000	0.007	pg18beta1_o2nofp.cx10b_c32r128
0.000	0.000	99.917	0.083	0.000	0.000	0.000	0.000	0.000	0.000	0.007	pg18beta1_o2nofp.cx10cw4_c32r128
0.000	0.000	99.889	0.111	0.000	0.000	0.000	0.000	0.000	0.000	0.008	pg18beta1_o2nofp.cx10d_c32r128
0.000	0.000	99.889	0.111	0.000	0.000	0.000	0.000	0.000	0.000	0.008	pg18beta2_o2nofp.cx10b_c32r128
0.000	0.000	99.889	0.111	0.000	0.000	0.000	0.000	0.000	0.000	0.008	pg18beta2_o2nofp.cx10cw4_c32r128
0.000	0.000	99.944	0.056	0.000	0.000	0.000	0.000	0.000	0.000	0.008	pg18beta2_o2nofp.cx10d_c32r128
Delete response time histogram
256us	1ms	4ms	16ms	64ms	256ms	1s	4s	16s	gt	max	tag
0.000	0.000	99.972	0.028	0.000	0.000	0.000	0.000	0.000	0.000	0.007	pg174_o2nofp.cx10a_c32r128
0.000	0.000	99.972	0.028	0.000	0.000	0.000	0.000	0.000	0.000	0.007	pg175_o2nofp.cx10a_c32r128
0.000	0.000	99.972	0.028	0.000	0.000	0.000	0.000	0.000	0.000	0.007	pg18beta1_o2nofp.cx10b_c32r128
0.000	0.000	99.972	0.028	0.000	0.000	0.000	0.000	0.000	0.000	0.007	pg18beta1_o2nofp.cx10cw4_c32r128
0.000	0.000	99.972	0.028	0.000	0.000	0.000	0.000	0.000	0.000	0.007	pg18beta1_o2nofp.cx10d_c32r128
0.000	0.000	99.972	0.028	0.000	0.000	0.000	0.000	0.000	0.000	0.007	pg18beta2_o2nofp.cx10b_c32r128
0.000	0.000	99.972	0.028	0.000	0.000	0.000	0.000	0.000	0.000	0.007	pg18beta2_o2nofp.cx10cw4_c32r128
0.000	0.000	99.972	0.028	0.000	0.000	0.000	0.000	0.000	0.000	0.007	pg18beta2_o2nofp.cx10d_c32r128
qr500.L3
- qr500.L3: range queries with 500 insert/s per client
- Legend for results is here.
- Each entry lists the percentage of responses that fit in that bucket (slower than max time for previous bucket, faster than min time for next bucket).
Query response time histogram
256us	1ms	4ms	16ms	64ms	256ms	1s	4s	16s	gt	max	tag
100.000	nonzero	nonzero	0.000	0.000	0.000	0.000	0.000	0.000	0.000	0.003	pg174_o2nofp.cx10a_c32r128
100.000	nonzero	nonzero	0.000	0.000	0.000	0.000	0.000	0.000	0.000	0.002	pg175_o2nofp.cx10a_c32r128
100.000	nonzero	nonzero	nonzero	0.000	0.000	0.000	0.000	0.000	0.000	0.004	pg18beta1_o2nofp.cx10b_c32r128
100.000	nonzero	nonzero	nonzero	0.000	0.000	0.000	0.000	0.000	0.000	0.004	pg18beta1_o2nofp.cx10cw4_c32r128
100.000	nonzero	nonzero	0.000	0.000	0.000	0.000	0.000	0.000	0.000	0.003	pg18beta1_o2nofp.cx10d_c32r128
100.000	nonzero	nonzero	0.000	0.000	0.000	0.000	0.000	0.000	0.000	0.003	pg18beta2_o2nofp.cx10b_c32r128
100.000	nonzero	nonzero	0.000	0.000	0.000	0.000	0.000	0.000	0.000	0.003	pg18beta2_o2nofp.cx10cw4_c32r128
100.000	nonzero	nonzero	nonzero	0.000	0.000	0.000	0.000	0.000	0.000	0.004	pg18beta2_o2nofp.cx10d_c32r128
Insert response time histogram
256us	1ms	4ms	16ms	64ms	256ms	1s	4s	16s	gt	max	tag
0.000	14.556	85.428	0.017	0.000	0.000	0.000	0.000	0.000	0.000	0.007	pg174_o2nofp.cx10a_c32r128
0.000	11.444	88.539	0.017	0.000	0.000	0.000	0.000	0.000	0.000	0.008	pg175_o2nofp.cx10a_c32r128
0.000	15.100	84.883	0.017	0.000	0.000	0.000	0.000	0.000	0.000	0.008	pg18beta1_o2nofp.cx10b_c32r128
0.000	14.067	85.917	0.017	0.000	0.000	0.000	0.000	0.000	0.000	0.008	pg18beta1_o2nofp.cx10cw4_c32r128
0.000	13.344	86.639	0.017	0.000	0.000	0.000	0.000	0.000	0.000	0.008	pg18beta1_o2nofp.cx10d_c32r128
0.000	13.378	86.606	0.017	0.000	0.000	0.000	0.000	0.000	0.000	0.007	pg18beta2_o2nofp.cx10b_c32r128
0.000	16.906	83.078	0.017	0.000	0.000	0.000	0.000	0.000	0.000	0.008	pg18beta2_o2nofp.cx10cw4_c32r128
0.000	17.606	82.378	0.017	0.000	0.000	0.000	0.000	0.000	0.000	0.008	pg18beta2_o2nofp.cx10d_c32r128
Delete response time histogram
256us	1ms	4ms	16ms	64ms	256ms	1s	4s	16s	gt	max	tag
0.000	0.000	94.861	5.139	0.000	0.000	0.000	0.000	0.000	0.000	0.010	pg174_o2nofp.cx10a_c32r128
0.000	0.000	95.011	4.989	0.000	0.000	0.000	0.000	0.000	0.000	0.010	pg175_o2nofp.cx10a_c32r128
0.000	0.000	94.911	5.089	0.000	0.000	0.000	0.000	0.000	0.000	0.010	pg18beta1_o2nofp.cx10b_c32r128
0.000	0.000	94.817	5.183	0.000	0.000	0.000	0.000	0.000	0.000	0.011	pg18beta1_o2nofp.cx10cw4_c32r128
0.000	0.000	95.050	4.950	0.000	0.000	0.000	0.000	0.000	0.000	0.011	pg18beta1_o2nofp.cx10d_c32r128
0.000	0.000	95.533	4.467	0.000	0.000	0.000	0.000	0.000	0.000	0.010	pg18beta2_o2nofp.cx10b_c32r128
0.000	0.000	95.478	4.522	0.000	0.000	0.000	0.000	0.000	0.000	0.011	pg18beta2_o2nofp.cx10cw4_c32r128
0.000	0.000	95.744	4.256	0.000	0.000	0.000	0.000	0.000	0.000	0.011	pg18beta2_o2nofp.cx10d_c32r128
qp500.L4
- qp500.L4: point queries with 500 insert/s per client
- Legend for results is here.
- Each entry lists the percentage of responses that fit in that bucket (slower than max time for previous bucket, faster than min time for next bucket).
Query response time histogram
256us	1ms	4ms	16ms	64ms	256ms	1s	4s	16s	gt	max	tag
100.000	nonzero	0.000	0.000	0.000	0.000	0.000	0.000	0.000	0.000	0.001	pg174_o2nofp.cx10a_c32r128
100.000	nonzero	0.000	0.000	0.000	0.000	0.000	0.000	0.000	0.000	0.001	pg175_o2nofp.cx10a_c32r128
100.000	nonzero	0.000	0.000	0.000	0.000	0.000	0.000	0.000	0.000	0.001	pg18beta1_o2nofp.cx10b_c32r128
100.000	nonzero	0.000	0.000	0.000	0.000	0.000	0.000	0.000	0.000	0.001	pg18beta1_o2nofp.cx10cw4_c32r128
100.000	nonzero	nonzero	0.000	0.000	0.000	0.000	0.000	0.000	0.000	0.001	pg18beta1_o2nofp.cx10d_c32r128
100.000	nonzero	nonzero	0.000	0.000	0.000	0.000	0.000	0.000	0.000	0.003	pg18beta2_o2nofp.cx10b_c32r128
99.999	0.001	0.000	0.000	0.000	0.000	0.000	0.000	0.000	0.000	0.001	pg18beta2_o2nofp.cx10cw4_c32r128
100.000	nonzero	0.000	0.000	0.000	0.000	0.000	0.000	0.000	0.000	0.001	pg18beta2_o2nofp.cx10d_c32r128
Insert response time histogram
256us	1ms	4ms	16ms	64ms	256ms	1s	4s	16s	gt	max	tag
0.000	6.922	93.061	0.017	0.000	0.000	0.000	0.000	0.000	0.000	0.008	pg174_o2nofp.cx10a_c32r128
0.000	10.517	89.461	0.022	0.000	0.000	0.000	0.000	0.000	0.000	0.008	pg175_o2nofp.cx10a_c32r128
0.000	11.556	88.428	0.017	0.000	0.000	0.000	0.000	0.000	0.000	0.007	pg18beta1_o2nofp.cx10b_c32r128
0.000	12.350	87.633	0.017	0.000	0.000	0.000	0.000	0.000	0.000	0.007	pg18beta1_o2nofp.cx10cw4_c32r128
0.000	13.200	86.783	0.017	0.000	0.000	0.000	0.000	0.000	0.000	0.007	pg18beta1_o2nofp.cx10d_c32r128
0.000	12.361	87.622	0.017	0.000	0.000	0.000	0.000	0.000	0.000	0.008	pg18beta2_o2nofp.cx10b_c32r128
0.000	13.706	86.278	0.017	0.000	0.000	0.000	0.000	0.000	0.000	0.007	pg18beta2_o2nofp.cx10cw4_c32r128
0.000	11.033	88.950	0.017	0.000	0.000	0.000	0.000	0.000	0.000	0.008	pg18beta2_o2nofp.cx10d_c32r128
Delete response time histogram
256us	1ms	4ms	16ms	64ms	256ms	1s	4s	16s	gt	max	tag
0.000	0.000	45.278	54.717	0.006	0.000	0.000	0.000	0.000	0.000	0.022	pg174_o2nofp.cx10a_c32r128
0.000	0.000	42.789	57.206	0.006	0.000	0.000	0.000	0.000	0.000	0.022	pg175_o2nofp.cx10a_c32r128
0.000	0.000	40.372	59.622	0.006	0.000	0.000	0.000	0.000	0.000	0.022	pg18beta1_o2nofp.cx10b_c32r128
0.000	0.000	44.200	55.794	0.006	0.000	0.000	0.000	0.000	0.000	0.023	pg18beta1_o2nofp.cx10cw4_c32r128
0.000	0.000	39.428	60.567	0.006	0.000	0.000	0.000	0.000	0.000	0.024	pg18beta1_o2nofp.cx10d_c32r128
0.000	0.000	42.656	57.339	0.006	0.000	0.000	0.000	0.000	0.000	0.022	pg18beta2_o2nofp.cx10b_c32r128
0.000	0.000	42.856	57.139	0.006	0.000	0.000	0.000	0.000	0.000	0.024	pg18beta2_o2nofp.cx10cw4_c32r128
0.000	0.000	45.361	54.633	0.006	0.000	0.000	0.000	0.000	0.000	0.023	pg18beta2_o2nofp.cx10d_c32r128
qr1000.L5
- qr1000.L5: range queries with 1000 insert/s per client
- Legend for results is here.
- Each entry lists the percentage of responses that fit in that bucket (slower than max time for previous bucket, faster than min time for next bucket).
Query response time histogram
256us	1ms	4ms	16ms	64ms	256ms	1s	4s	16s	gt	max	tag
99.998	0.001	nonzero	nonzero	0.000	0.000	0.000	0.000	0.000	0.000	0.011	pg174_o2nofp.cx10a_c32r128
99.998	0.001	nonzero	nonzero	0.000	0.000	0.000	0.000	0.000	0.000	0.011	pg175_o2nofp.cx10a_c32r128
99.998	0.001	nonzero	nonzero	0.000	0.000	0.000	0.000	0.000	0.000	0.011	pg18beta1_o2nofp.cx10b_c32r128
99.998	0.001	nonzero	nonzero	0.000	0.000	0.000	0.000	0.000	0.000	0.012	pg18beta1_o2nofp.cx10cw4_c32r128
99.998	0.001	nonzero	nonzero	0.000	0.000	0.000	0.000	0.000	0.000	0.012	pg18beta1_o2nofp.cx10d_c32r128
99.998	0.001	nonzero	nonzero	0.000	0.000	0.000	0.000	0.000	0.000	0.011	pg18beta2_o2nofp.cx10b_c32r128
99.998	0.001	nonzero	nonzero	0.000	0.000	0.000	0.000	0.000	0.000	0.012	pg18beta2_o2nofp.cx10cw4_c32r128
99.998	0.001	nonzero	nonzero	0.000	0.000	0.000	0.000	0.000	0.000	0.012	pg18beta2_o2nofp.cx10d_c32r128
Insert response time histogram
256us	1ms	4ms	16ms	64ms	256ms	1s	4s	16s	gt	max	tag
0.000	45.697	54.283	0.017	0.003	0.000	0.000	0.000	0.000	0.000	0.020	pg174_o2nofp.cx10a_c32r128
0.000	44.017	55.958	0.025	0.000	0.000	0.000	0.000	0.000	0.000	0.013	pg175_o2nofp.cx10a_c32r128
0.000	46.722	53.258	0.019	0.000	0.000	0.000	0.000	0.000	0.000	0.014	pg18beta1_o2nofp.cx10b_c32r128
0.000	48.147	51.828	0.025	0.000	0.000	0.000	0.000	0.000	0.000	0.014	pg18beta1_o2nofp.cx10cw4_c32r128
0.000	46.119	53.858	0.017	0.006	0.000	0.000	0.000	0.000	0.000	0.022	pg18beta1_o2nofp.cx10d_c32r128
0.000	49.822	50.153	0.025	0.000	0.000	0.000	0.000	0.000	0.000	0.013	pg18beta2_o2nofp.cx10b_c32r128
0.000	46.981	52.994	0.019	0.006	0.000	0.000	0.000	0.000	0.000	0.023	pg18beta2_o2nofp.cx10cw4_c32r128
0.000	46.053	53.925	0.022	0.000	0.000	0.000	0.000	0.000	0.000	0.015	pg18beta2_o2nofp.cx10d_c32r128
Delete response time histogram
256us	1ms	4ms	16ms	64ms	256ms	1s	4s	16s	gt	max	tag
0.000	8.736	69.908	21.353	0.003	0.000	0.000	0.000	0.000	0.000	0.032	pg174_o2nofp.cx10a_c32r128
0.000	8.389	70.733	20.875	0.003	0.000	0.000	0.000	0.000	0.000	0.031	pg175_o2nofp.cx10a_c32r128
0.000	8.333	81.550	10.114	0.003	0.000	0.000	0.000	0.000	0.000	0.032	pg18beta1_o2nofp.cx10b_c32r128
0.000	8.644	81.717	9.636	0.003	0.000	0.000	0.000	0.000	0.000	0.033	pg18beta1_o2nofp.cx10cw4_c32r128
0.000	8.169	82.311	9.517	0.003	0.000	0.000	0.000	0.000	0.000	0.034	pg18beta1_o2nofp.cx10d_c32r128
0.000	8.492	81.883	9.622	0.003	0.000	0.000	0.000	0.000	0.000	0.032	pg18beta2_o2nofp.cx10b_c32r128
0.000	10.644	81.728	7.625	0.003	0.000	0.000	0.000	0.000	0.000	0.033	pg18beta2_o2nofp.cx10cw4_c32r128
0.000	9.856	83.219	6.922	0.003	0.000	0.000	0.000	0.000	0.000	0.033	pg18beta2_o2nofp.cx10d_c32r128
qp1000.L6
- qp1000.L6: point queries with 1000 insert/s per client
- Legend for results is here.
- Each entry lists the percentage of responses that fit in that bucket (slower than max time for previous bucket, faster than min time for next bucket).
Query response time histogram
256us	1ms	4ms	16ms	64ms	256ms	1s	4s	16s	gt	max	tag
99.999	0.001	0.000	0.000	0.000	0.000	0.000	0.000	0.000	0.000	0.001	pg174_o2nofp.cx10a_c32r128
99.999	0.001	0.000	nonzero	0.000	0.000	0.000	0.000	0.000	0.000	0.004	pg175_o2nofp.cx10a_c32r128
99.999	0.001	0.000	0.000	0.000	0.000	0.000	0.000	0.000	0.000	0.001	pg18beta1_o2nofp.cx10b_c32r128
99.999	0.001	0.000	0.000	0.000	0.000	0.000	0.000	0.000	0.000	0.001	pg18beta1_o2nofp.cx10cw4_c32r128
100.000	nonzero	0.000	0.000	0.000	0.000	0.000	0.000	0.000	0.000	0.001	pg18beta1_o2nofp.cx10d_c32r128
99.999	0.001	0.000	0.000	0.000	0.000	0.000	0.000	0.000	0.000	0.001	pg18beta2_o2nofp.cx10b_c32r128
99.999	0.001	nonzero	0.000	0.000	0.000	0.000	0.000	0.000	0.000	0.002	pg18beta2_o2nofp.cx10cw4_c32r128
100.000	nonzero	nonzero	0.000	0.000	0.000	0.000	0.000	0.000	0.000	0.001	pg18beta2_o2nofp.cx10d_c32r128
Insert response time histogram
256us	1ms	4ms	16ms	64ms	256ms	1s	4s	16s	gt	max	tag
0.000	30.217	69.772	0.011	0.000	0.000	0.000	0.000	0.000	0.000	0.015	pg174_o2nofp.cx10a_c32r128
0.000	31.128	68.861	0.011	0.000	0.000	0.000	0.000	0.000	0.000	0.014	pg175_o2nofp.cx10a_c32r128
0.000	38.394	61.594	0.011	0.000	0.000	0.000	0.000	0.000	0.000	0.011	pg18beta1_o2nofp.cx10b_c32r128
0.000	39.800	60.186	0.014	0.000	0.000	0.000	0.000	0.000	0.000	0.012	pg18beta1_o2nofp.cx10cw4_c32r128
0.000	40.158	59.825	0.017	0.000	0.000	0.000	0.000	0.000	0.000	0.013	pg18beta1_o2nofp.cx10d_c32r128
0.000	42.144	57.842	0.014	0.000	0.000	0.000	0.000	0.000	0.000	0.014	pg18beta2_o2nofp.cx10b_c32r128
0.000	44.475	55.500	0.025	0.000	0.000	0.000	0.000	0.000	0.000	0.014	pg18beta2_o2nofp.cx10cw4_c32r128
0.000	45.131	54.853	0.017	0.000	0.000	0.000	0.000	0.000	0.000	0.014	pg18beta2_o2nofp.cx10d_c32r128
Delete response time histogram
256us	1ms	4ms	16ms	64ms	256ms	1s	4s	16s	gt	max	tag
0.000	8.878	47.233	43.886	0.003	0.000	0.000	0.000	0.000	0.000	0.024	pg174_o2nofp.cx10a_c32r128
0.000	8.792	46.175	45.031	0.003	0.000	0.000	0.000	0.000	0.000	0.024	pg175_o2nofp.cx10a_c32r128
0.000	14.825	53.017	32.156	0.003	0.000	0.000	0.000	0.000	0.000	0.027	pg18beta1_o2nofp.cx10b_c32r128
0.000	14.278	53.986	31.733	0.003	0.000	0.000	0.000	0.000	0.000	0.028	pg18beta1_o2nofp.cx10cw4_c32r128
0.000	15.122	52.922	31.953	0.003	0.000	0.000	0.000	0.000	0.000	0.029	pg18beta1_o2nofp.cx10d_c32r128
0.000	15.300	54.333	30.364	0.003	0.000	0.000	0.000	0.000	0.000	0.027	pg18beta2_o2nofp.cx10b_c32r128
0.000	16.597	57.181	26.219	0.003	0.000	0.000	0.000	0.000	0.000	0.028	pg18beta2_o2nofp.cx10cw4_c32r128
0.000	16.975	56.261	26.761	0.003	0.000	0.000	0.000	0.000	0.000	0.029	pg18beta2_o2nofp.cx10d_c32r128