Introduction
This is a report for the insert benchmark with 4000M docs and 20 client(s). It is generated by scripts (bash, awk, sed) and Tufte might not be impressed. An overview of the insert benchmark is here and a short update is here. Below, by DBMS, I mean DBMS+version.config. An example is my8020.c10b40 where my means MySQL, 8020 is version 8.0.20 and c10b40 is the name for the configuration file.
The test server has 48 AMD cores, 128G RAM and RAID 10 with 2 NVMe devices. It is described here. The benchmark was run with 20 clients and there were 1 or 3 connections per client (1 for queries or inserts without rate limits, 1+1 for rate limited inserts+deletes). It uses 20 tables with a table per client. It loads 200M rows per table without secondary indexes, creates 3 secondary indexes per table, then inserts 4m+1m rows per table with a delete per insert to avoid growing the table. It then does 6 read+write tests for 1800s each that do queries as fast as possible with 100,100,500,500,1000,1000 inserts/s and the same for deletes/s per client concurrent with the queries. The database is larger than memory. Clients and the DBMS share one server. The per-database configs are in the per-database subdirectories here.
The tested DBMS are:
- pg174_o2nofp.cx10a_c32r128 - Postgres 17.4 with the cx10a_c32r128 config
- pg175_o2nofp.cx10a_c32r128 - Postgres 17.5 with the cx10a_c32r128 config
- pg18beta1_o2nofp.cx10b_c32r128 - Postgres 18 beta1 with the cx10b_c32r128 config that uses io_method='sync'
- pg18beta1_o2nofp.cx10cw4_c32r128 - Postgres 18 beta1 with the cx10cw4_c32r128 config that uses io_method='worker' and io_workers=4
- pg18beta1_o2nofp.cx10d_c32r128 - Postgres 18 beta1 with the cx10d_c32r128 config that uses io_method='io_uring'
- pg18beta2_o2nofp.cx10b_c32r128 - Postgres 18 beta1 with the cx10b_c32r128 config that uses io_method='sync'
- pg18beta2_o2nofp.cx10cw4_c32r128 - Postgres 18 beta2 with the cx10cw4_c32r128 config that uses io_method='worker' and io_workers=4
- pg18beta2_o2nofp.cx10d_c32r128 - Postgres 18 beta1 with the cx10d_c32r128 config that uses io_method='io_uring'
Contents
- Summary
- l.i0: load without secondary indexes
- l.x: create secondary indexes
- l.i1: continue load after secondary indexes created with 50 inserts per transaction
- l.i2: continue load after secondary indexes created with 5 inserts per transaction
- qr100.L1: range queries with 100 insert/s per client
- qp100.L2: point queries with 100 insert/s per client
- qr500.L3: range queries with 500 insert/s per client
- qp500.L4: point queries with 500 insert/s per client
- qr1000.L5: range queries with 1000 insert/s per client
- qp1000.L6: point queries with 1000 insert/s per client
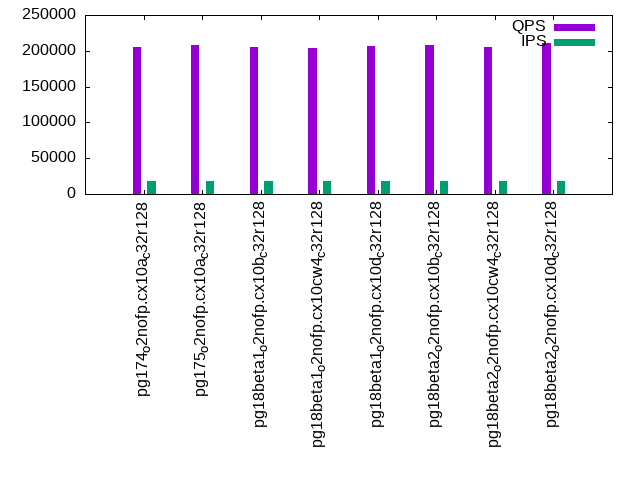
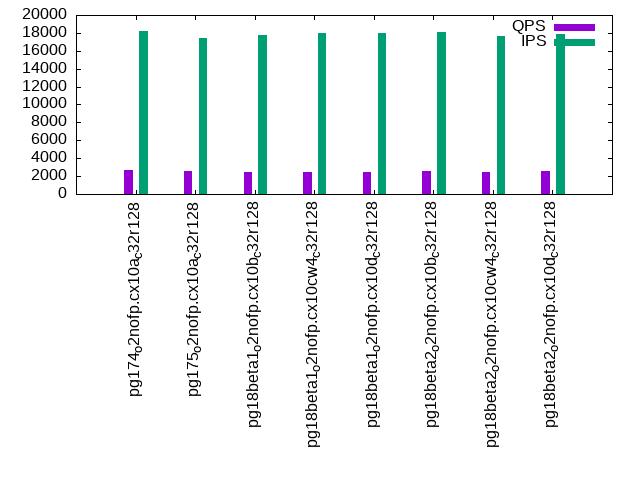
Summary
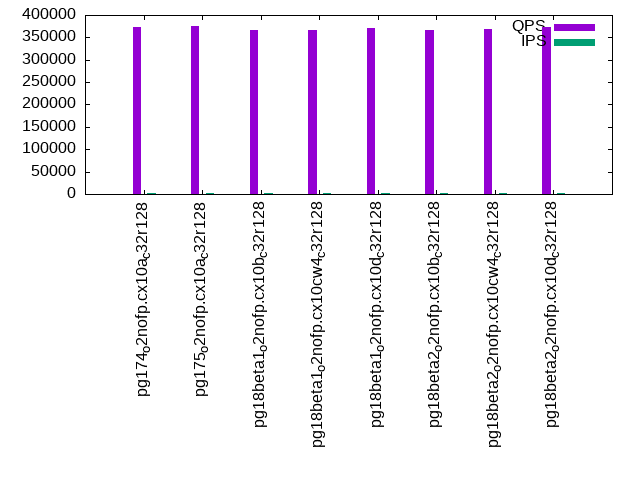
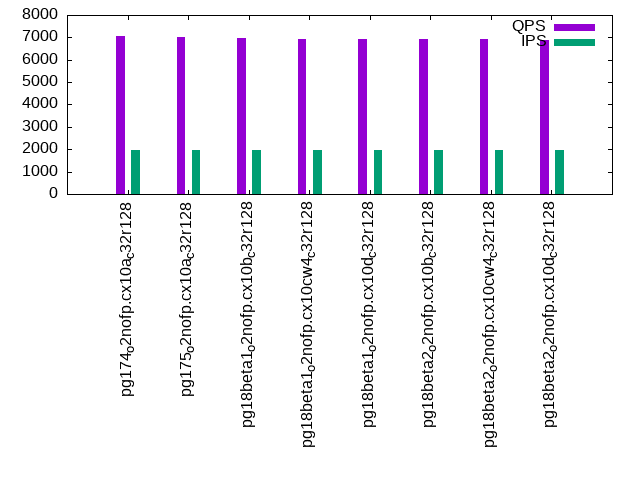
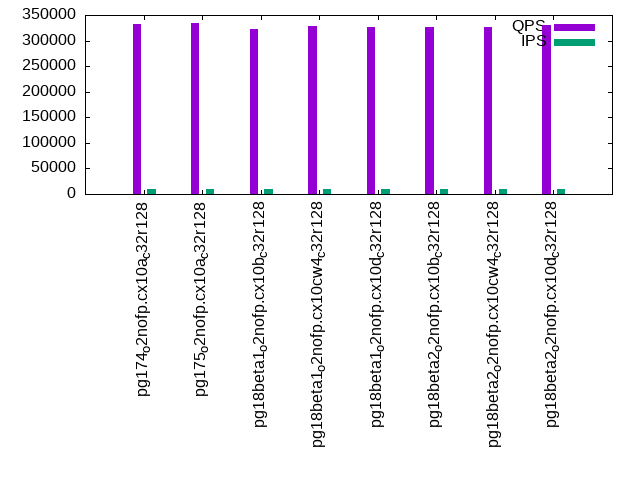
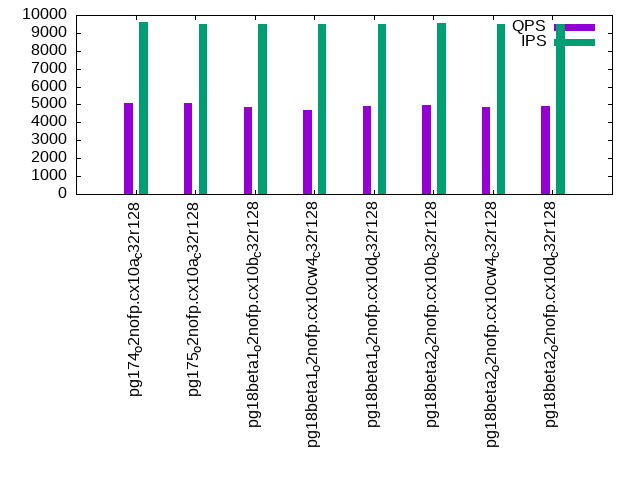
The numbers are inserts/s for l.i0, l.i1 and l.i2, indexed docs (or rows) /s for l.x and queries/s for qr100, qp100 thru qr1000, qp1000" The values are the average rate over the entire test for inserts (IPS) and queries (QPS). The range of values for IPS and QPS is split into 3 parts: bottom 25%, middle 50%, top 25%. Values in the bottom 25% have a red background, values in the top 25% have a green background and values in the middle have no color. A gray background is used for values that can be ignored because the DBMS did not sustain the target insert rate. Red backgrounds are not used when the minimum value is within 80% of the max value.
| dbms | l.i0 | l.x | l.i1 | l.i2 | qr100 | qp100 | qr500 | qp500 | qr1000 | qp1000 |
|---|---|---|---|---|---|---|---|---|---|---|
| pg174_o2nofp.cx10a_c32r128 | 2077922 | 3436426 | 23195 | 2451 | 372847 | 7068 | 333101 | 5066 | 205627 | 2657 |
| pg175_o2nofp.cx10a_c32r128 | 2056555 | 3418804 | 23330 | 2314 | 376506 | 7001 | 334424 | 5064 | 207535 | 2533 |
| pg18beta1_o2nofp.cx10b_c32r128 | 2097535 | 3372681 | 23317 | 2437 | 365365 | 6974 | 322117 | 4878 | 204655 | 2469 |
| pg18beta1_o2nofp.cx10cw4_c32r128 | 2087683 | 3407155 | 23115 | 2398 | 367400 | 6906 | 328490 | 4694 | 204012 | 2450 |
| pg18beta1_o2nofp.cx10d_c32r128 | 2074689 | 3666361 | 23358 | 2403 | 370226 | 6923 | 327476 | 4936 | 207126 | 2502 |
| pg18beta2_o2nofp.cx10b_c32r128 | 2157497 | 3460208 | 23732 | 2526 | 366552 | 6912 | 326432 | 4975 | 208486 | 2550 |
| pg18beta2_o2nofp.cx10cw4_c32r128 | 2094241 | 3401361 | 23135 | 4400 | 367784 | 6912 | 327128 | 4883 | 205929 | 2458 |
| pg18beta2_o2nofp.cx10d_c32r128 | 2088773 | 3649635 | 23571 | 2522 | 372750 | 6893 | 331377 | 4922 | 210748 | 2535 |
This table has relative throughput, throughput for the DBMS relative to the DBMS in the first line, using the absolute throughput from the previous table. Values less than 0.95 have a yellow background. Values greater than 1.05 have a blue background.
| dbms | l.i0 | l.x | l.i1 | l.i2 | qr100 | qp100 | qr500 | qp500 | qr1000 | qp1000 |
|---|---|---|---|---|---|---|---|---|---|---|
| pg174_o2nofp.cx10a_c32r128 | 1.00 | 1.00 | 1.00 | 1.00 | 1.00 | 1.00 | 1.00 | 1.00 | 1.00 | 1.00 |
| pg175_o2nofp.cx10a_c32r128 | 0.99 | 0.99 | 1.01 | 0.94 | 1.01 | 0.99 | 1.00 | 1.00 | 1.01 | 0.95 |
| pg18beta1_o2nofp.cx10b_c32r128 | 1.01 | 0.98 | 1.01 | 0.99 | 0.98 | 0.99 | 0.97 | 0.96 | 1.00 | 0.93 |
| pg18beta1_o2nofp.cx10cw4_c32r128 | 1.00 | 0.99 | 1.00 | 0.98 | 0.99 | 0.98 | 0.99 | 0.93 | 0.99 | 0.92 |
| pg18beta1_o2nofp.cx10d_c32r128 | 1.00 | 1.07 | 1.01 | 0.98 | 0.99 | 0.98 | 0.98 | 0.97 | 1.01 | 0.94 |
| pg18beta2_o2nofp.cx10b_c32r128 | 1.04 | 1.01 | 1.02 | 1.03 | 0.98 | 0.98 | 0.98 | 0.98 | 1.01 | 0.96 |
| pg18beta2_o2nofp.cx10cw4_c32r128 | 1.01 | 0.99 | 1.00 | 1.80 | 0.99 | 0.98 | 0.98 | 0.96 | 1.00 | 0.93 |
| pg18beta2_o2nofp.cx10d_c32r128 | 1.01 | 1.06 | 1.02 | 1.03 | 1.00 | 0.98 | 0.99 | 0.97 | 1.02 | 0.95 |
This lists the average rate of inserts/s for the tests that do inserts concurrent with queries. For such tests the query rate is listed in the table above. The read+write tests are setup so that the insert rate should match the target rate every second. Cells that are not at least 95% of the target have a red background to indicate a failure to satisfy the target.
| dbms | qr100.L1 | qp100.L2 | qr500.L3 | qp500.L4 | qr1000.L5 | qp1000.L6 |
|---|---|---|---|---|---|---|
| pg174_o2nofp.cx10a_c32r128 | 1977 | 1977 | 9874 | 9590 | 18200 | 18246 |
| pg175_o2nofp.cx10a_c32r128 | 1977 | 1977 | 9793 | 9509 | 18256 | 17467 |
| pg18beta1_o2nofp.cx10b_c32r128 | 1976 | 1976 | 9804 | 9474 | 18036 | 17804 |
| pg18beta1_o2nofp.cx10cw4_c32r128 | 1977 | 1976 | 9858 | 9474 | 17982 | 17955 |
| pg18beta1_o2nofp.cx10d_c32r128 | 1977 | 1977 | 9798 | 9504 | 18163 | 18009 |
| pg18beta2_o2nofp.cx10b_c32r128 | 1977 | 1977 | 9831 | 9539 | 18145 | 18090 |
| pg18beta2_o2nofp.cx10cw4_c32r128 | 1976 | 1977 | 9798 | 9519 | 17955 | 17664 |
| pg18beta2_o2nofp.cx10d_c32r128 | 1976 | 1977 | 9820 | 9489 | 18100 | 17884 |
| target | 2000 | 2000 | 10000 | 10000 | 20000 | 20000 |
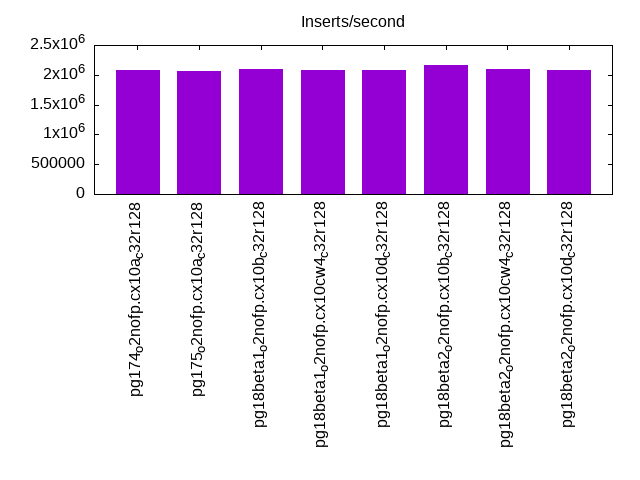
l.i0
l.i0: load without secondary indexes. Graphs for performance per 1-second interval are here.
Average throughput:
Insert response time histogram: each cell has the percentage of responses that take <= the time in the header and max is the max response time in seconds. For the max column values in the top 25% of the range have a red background and in the bottom 25% of the range have a green background. The red background is not used when the min value is within 80% of the max value.
| dbms | 256us | 1ms | 4ms | 16ms | 64ms | 256ms | 1s | 4s | 16s | gt | max |
|---|---|---|---|---|---|---|---|---|---|---|---|
| pg174_o2nofp.cx10a_c32r128 | 90.409 | 9.378 | 0.120 | 0.077 | 0.011 | 0.004 | nonzero | 1.365 | |||
| pg175_o2nofp.cx10a_c32r128 | 91.521 | 8.234 | 0.142 | 0.082 | 0.014 | 0.006 | nonzero | 1.562 | |||
| pg18beta1_o2nofp.cx10b_c32r128 | 93.087 | 6.620 | 0.183 | 0.100 | 0.005 | 0.005 | nonzero | 1.368 | |||
| pg18beta1_o2nofp.cx10cw4_c32r128 | 93.166 | 6.573 | 0.160 | 0.089 | 0.005 | 0.006 | nonzero | 1.591 | |||
| pg18beta1_o2nofp.cx10d_c32r128 | 93.067 | 6.635 | 0.186 | 0.100 | 0.005 | 0.006 | nonzero | 1.386 | |||
| pg18beta2_o2nofp.cx10b_c32r128 | 93.599 | 6.111 | 0.199 | 0.081 | 0.006 | 0.003 | nonzero | 1.369 | |||
| pg18beta2_o2nofp.cx10cw4_c32r128 | 93.262 | 6.425 | 0.199 | 0.104 | 0.005 | 0.006 | nonzero | 1.951 | |||
| pg18beta2_o2nofp.cx10d_c32r128 | 93.001 | 6.672 | 0.210 | 0.106 | 0.005 | 0.005 | nonzero | 2.568 |
Performance metrics for the DBMS listed above. Some are normalized by throughput, others are not. Legend for results is here.
ips	qps	rps	rmbps	wps	wmbps	rpq	rkbpq	wpi	wkbpi	csps	cpups	cspq	cpupq	dbgb1	dbgb2	rss	maxop	p50	p99	tag
2077922	0	1731	13.9	8698.7	828.2	0.001	0.007	0.004	0.408	400682	58.5	0.193	14	382.7	478.8	97.0	1.365	111081	47068	pg174_o2nofp.cx10a_c32r128
2056555	0	1724	13.8	8581.8	822.5	0.001	0.007	0.004	0.410	377749	57.8	0.184	13	382.7	478.8	97.2	1.562	111580	33870	pg175_o2nofp.cx10a_c32r128
2097535	0	1787	14.3	8745.7	838.2	0.001	0.007	0.004	0.409	362478	58.5	0.173	13	382.7	478.8	97.2	1.368	113971	36161	pg18beta1_o2nofp.cx10b_c32r128
2087683	0	1804	14.4	8745.2	834.3	0.001	0.007	0.004	0.409	358126	58.3	0.172	13	382.7	478.8	97.2	1.591	114087	27171	pg18beta1_o2nofp.cx10cw4_c32r128
2074689	0	1774	14.2	8668.8	826.8	0.001	0.007	0.004	0.408	358779	58.0	0.173	13	382.7	478.8	97.1	1.386	113617	39655	pg18beta1_o2nofp.cx10d_c32r128
2157497	0	1836	14.7	9001.2	862.9	0.001	0.007	0.004	0.410	369606	59.7	0.171	13	382.7	478.8	97.2	1.369	115583	52045	pg18beta2_o2nofp.cx10b_c32r128
2094241	0	1814	14.5	8776.6	839.0	0.001	0.007	0.004	0.410	365500	58.1	0.175	13	382.7	478.8	97.0	1.951	114376	31066	pg18beta2_o2nofp.cx10cw4_c32r128
2088773	0	1758	14.1	8748.6	836.1	0.001	0.007	0.004	0.410	372758	58.2	0.178	13	382.7	478.8	97.2	2.568	114312	28369	pg18beta2_o2nofp.cx10d_c32r128
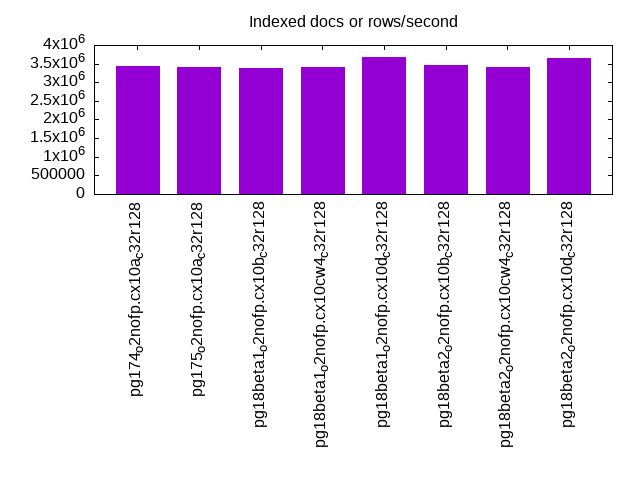
l.x
l.x: create secondary indexes.
Average throughput:
Performance metrics for the DBMS listed above. Some are normalized by throughput, others are not. Legend for results is here.
ips	qps	rps	rmbps	wps	wmbps	rpq	rkbpq	wpi	wkbpi	csps	cpups	cspq	cpupq	dbgb1	dbgb2	rss	maxop	p50	p99	tag
3436426	0	11308	1091.3	8895.7	981.4	0.003	0.325	0.003	0.292	89477	23.8	0.026	3	768.4	863.7	31.4	0.081	NA	NA	pg174_o2nofp.cx10a_c32r128
3418804	0	11259	1086.5	8741.1	976.1	0.003	0.325	0.003	0.292	89975	23.4	0.026	3	768.4	863.7	30.8	0.021	NA	NA	pg175_o2nofp.cx10a_c32r128
3372681	0	11202	1074.7	8749.5	969.0	0.003	0.326	0.003	0.294	89331	23.3	0.026	3	768.4	864.0	41.9	0.003	NA	NA	pg18beta1_o2nofp.cx10b_c32r128
3407155	0	11492	1082.0	8871.8	980.8	0.003	0.325	0.003	0.295	94391	24.3	0.028	3	768.4	863.7	58.6	0.056	NA	NA	pg18beta1_o2nofp.cx10cw4_c32r128
3666361	0	12298	1166.4	9345.1	1048.2	0.003	0.326	0.003	0.293	116194	26.0	0.032	3	768.4	863.7	41.2	0.316	NA	NA	pg18beta1_o2nofp.cx10d_c32r128
3460208	0	11308	1100.7	8913.6	992.8	0.003	0.326	0.003	0.294	92118	23.7	0.027	3	768.4	863.7	31.4	0.060	NA	NA	pg18beta2_o2nofp.cx10b_c32r128
3401361	0	11401	1081.9	8840.3	973.9	0.003	0.326	0.003	0.293	93126	23.7	0.027	3	768.4	864.0	56.0	0.003	NA	NA	pg18beta2_o2nofp.cx10cw4_c32r128
3649635	0	12266	1162.8	9326.2	1046.3	0.003	0.326	0.003	0.294	117587	25.8	0.032	3	768.4	863.8	31.9	0.003	NA	NA	pg18beta2_o2nofp.cx10d_c32r128
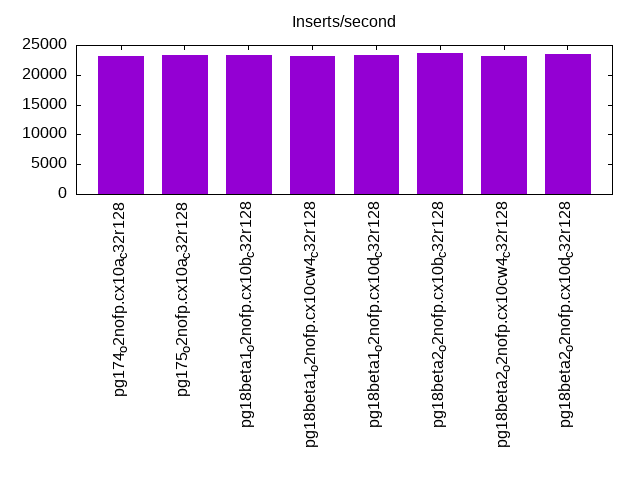
l.i1
l.i1: continue load after secondary indexes created with 50 inserts per transaction. Graphs for performance per 1-second interval are here.
Average throughput:
Insert response time histogram: each cell has the percentage of responses that take <= the time in the header and max is the max response time in seconds. For the max column values in the top 25% of the range have a red background and in the bottom 25% of the range have a green background. The red background is not used when the min value is within 80% of the max value.
| dbms | 256us | 1ms | 4ms | 16ms | 64ms | 256ms | 1s | 4s | 16s | gt | max |
|---|---|---|---|---|---|---|---|---|---|---|---|
| pg174_o2nofp.cx10a_c32r128 | 19.267 | 65.279 | 15.278 | 0.069 | 0.105 | 0.001 | 6.705 | ||||
| pg175_o2nofp.cx10a_c32r128 | 19.572 | 66.370 | 13.859 | 0.098 | 0.099 | 0.001 | 4.653 | ||||
| pg18beta1_o2nofp.cx10b_c32r128 | 15.956 | 70.725 | 13.079 | 0.118 | 0.121 | 0.001 | 4.706 | ||||
| pg18beta1_o2nofp.cx10cw4_c32r128 | 15.593 | 68.220 | 15.990 | 0.078 | 0.119 | 2.905 | |||||
| pg18beta1_o2nofp.cx10d_c32r128 | 15.986 | 69.218 | 14.615 | 0.067 | 0.115 | nonzero | 4.267 | ||||
| pg18beta2_o2nofp.cx10b_c32r128 | 16.427 | 70.529 | 12.819 | 0.117 | 0.108 | 0.001 | 5.485 | ||||
| pg18beta2_o2nofp.cx10cw4_c32r128 | 14.987 | 69.659 | 15.129 | 0.094 | 0.131 | nonzero | 4.013 | ||||
| pg18beta2_o2nofp.cx10d_c32r128 | 16.209 | 70.025 | 13.555 | 0.091 | 0.120 | nonzero | 5.186 |
Delete response time histogram: each cell has the percentage of responses that take <= the time in the header and max is the max response time in seconds. For the max column values in the top 25% of the range have a red background and in the bottom 25% of the range have a green background. The red background is not used when the min value is within 80% of the max value.
| dbms | 256us | 1ms | 4ms | 16ms | 64ms | 256ms | 1s | 4s | 16s | gt | max |
|---|---|---|---|---|---|---|---|---|---|---|---|
| pg174_o2nofp.cx10a_c32r128 | 2.442 | 8.414 | 24.268 | 60.727 | 4.059 | 0.034 | 0.056 | 2.453 | |||
| pg175_o2nofp.cx10a_c32r128 | 2.551 | 8.731 | 23.830 | 60.250 | 4.527 | 0.052 | 0.059 | nonzero | 4.006 | ||
| pg18beta1_o2nofp.cx10b_c32r128 | 2.379 | 8.189 | 23.959 | 63.676 | 1.683 | 0.055 | 0.059 | 2.584 | |||
| pg18beta1_o2nofp.cx10cw4_c32r128 | 2.464 | 8.329 | 23.151 | 63.743 | 2.211 | 0.038 | 0.065 | 2.798 | |||
| pg18beta1_o2nofp.cx10d_c32r128 | 2.392 | 8.736 | 23.346 | 63.381 | 2.046 | 0.028 | 0.070 | nonzero | 4.073 | ||
| pg18beta2_o2nofp.cx10b_c32r128 | 2.475 | 8.238 | 28.512 | 59.236 | 1.426 | 0.055 | 0.057 | 3.202 | |||
| pg18beta2_o2nofp.cx10cw4_c32r128 | 2.423 | 8.731 | 26.039 | 60.746 | 1.948 | 0.044 | 0.068 | 2.640 | |||
| pg18beta2_o2nofp.cx10d_c32r128 | 2.491 | 8.410 | 23.201 | 63.763 | 2.031 | 0.043 | 0.060 | 2.887 |
Performance metrics for the DBMS listed above. Some are normalized by throughput, others are not. Legend for results is here.
ips	qps	rps	rmbps	wps	wmbps	rpq	rkbpq	wpi	wkbpi	csps	cpups	cspq	cpupq	dbgb1	dbgb2	rss	maxop	p50	p99	tag
23195	0	29362	235.0	34833.0	761.2	1.266	10.373	1.502	33.606	81262	30.5	3.503	631	781.5	877.6	86.7	6.705	1149	0	pg174_o2nofp.cx10a_c32r128
23330	0	29567	235.6	34822.7	758.3	1.267	10.340	1.493	33.284	81696	30.8	3.502	634	781.5	877.6	88.8	4.653	1149	0	pg175_o2nofp.cx10a_c32r128
23317	0	29498	235.5	34738.6	765.5	1.265	10.344	1.490	33.616	83498	30.7	3.581	632	781.5	877.6	85.2	4.706	1199	0	pg18beta1_o2nofp.cx10b_c32r128
23115	0	29237	234.1	34054.9	758.4	1.265	10.370	1.473	33.600	82602	30.9	3.574	642	781.5	923.6	78.4	2.905	1149	0	pg18beta1_o2nofp.cx10cw4_c32r128
23358	0	29479	234.5	34749.5	762.8	1.262	10.280	1.488	33.441	83327	30.6	3.567	629	781.5	877.6	80.7	4.267	1149	0	pg18beta1_o2nofp.cx10d_c32r128
23732	0	29992	238.7	35326.4	776.0	1.264	10.301	1.489	33.484	84219	29.7	3.549	601	781.5	877.6	83.5	5.485	1199	0	pg18beta2_o2nofp.cx10b_c32r128
23135	0	29250	233.6	33840.7	753.6	1.264	10.340	1.463	33.355	83101	30.2	3.592	627	781.5	933.5	78.4	4.013	1149	0	pg18beta2_o2nofp.cx10cw4_c32r128
23571	0	29818	237.8	34840.7	769.9	1.265	10.329	1.478	33.448	84409	31.2	3.581	635	781.5	919.9	75.6	5.186	1199	0	pg18beta2_o2nofp.cx10d_c32r128
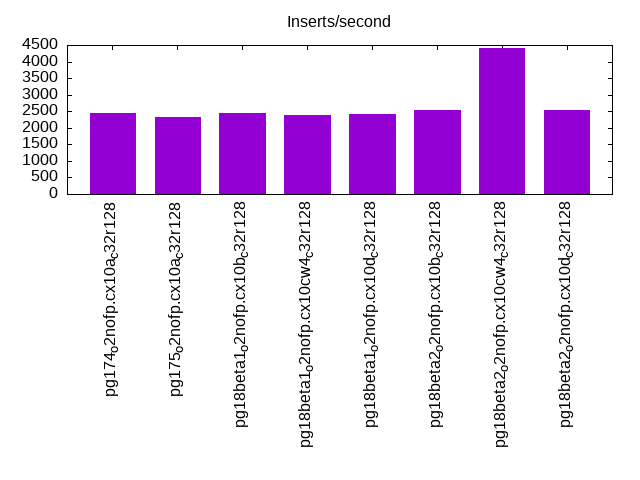
l.i2
l.i2: continue load after secondary indexes created with 5 inserts per transaction. Graphs for performance per 1-second interval are here.
Average throughput:
Insert response time histogram: each cell has the percentage of responses that take <= the time in the header and max is the max response time in seconds. For the max column values in the top 25% of the range have a red background and in the bottom 25% of the range have a green background. The red background is not used when the min value is within 80% of the max value.
| dbms | 256us | 1ms | 4ms | 16ms | 64ms | 256ms | 1s | 4s | 16s | gt | max |
|---|---|---|---|---|---|---|---|---|---|---|---|
| pg174_o2nofp.cx10a_c32r128 | 0.014 | 39.075 | 60.668 | 0.044 | 0.110 | 0.025 | 0.052 | 0.013 | nonzero | 5.447 | |
| pg175_o2nofp.cx10a_c32r128 | 42.491 | 57.392 | 0.013 | 0.038 | 0.016 | 0.029 | 0.020 | nonzero | 5.541 | ||
| pg18beta1_o2nofp.cx10b_c32r128 | 0.141 | 40.665 | 58.698 | 0.111 | 0.308 | 0.021 | 0.037 | 0.018 | 0.001 | 6.117 | |
| pg18beta1_o2nofp.cx10cw4_c32r128 | 0.005 | 35.639 | 63.874 | 0.102 | 0.212 | 0.037 | 0.086 | 0.044 | nonzero | 5.517 | |
| pg18beta1_o2nofp.cx10d_c32r128 | 0.003 | 37.377 | 62.192 | 0.079 | 0.222 | 0.023 | 0.050 | 0.050 | 0.004 | 6.089 | |
| pg18beta2_o2nofp.cx10b_c32r128 | 0.001 | 41.576 | 58.133 | 0.052 | 0.134 | 0.024 | 0.049 | 0.031 | nonzero | 5.355 | |
| pg18beta2_o2nofp.cx10cw4_c32r128 | 0.084 | 36.273 | 62.851 | 0.133 | 0.508 | 0.032 | 0.067 | 0.051 | 0.002 | 5.447 | |
| pg18beta2_o2nofp.cx10d_c32r128 | 0.077 | 38.334 | 61.138 | 0.078 | 0.238 | 0.031 | 0.062 | 0.041 | 0.001 | 5.888 |
Delete response time histogram: each cell has the percentage of responses that take <= the time in the header and max is the max response time in seconds. For the max column values in the top 25% of the range have a red background and in the bottom 25% of the range have a green background. The red background is not used when the min value is within 80% of the max value.
| dbms | 256us | 1ms | 4ms | 16ms | 64ms | 256ms | 1s | 4s | 16s | gt | max |
|---|---|---|---|---|---|---|---|---|---|---|---|
| pg174_o2nofp.cx10a_c32r128 | 0.095 | 1.345 | 0.020 | 0.073 | 98.464 | 0.002 | 0.001 | nonzero | 1.177 | ||
| pg175_o2nofp.cx10a_c32r128 | 0.043 | 99.954 | 0.002 | 0.001 | nonzero | 2.575 | |||||
| pg18beta1_o2nofp.cx10b_c32r128 | 0.205 | 3.880 | 2.167 | 0.064 | 93.678 | 0.005 | 0.001 | nonzero | 2.115 | ||
| pg18beta1_o2nofp.cx10cw4_c32r128 | 0.061 | 0.928 | 0.019 | 0.097 | 98.891 | 0.002 | 0.001 | 0.001 | 2.999 | ||
| pg18beta1_o2nofp.cx10d_c32r128 | 0.019 | 0.813 | 1.389 | 0.131 | 97.645 | 0.002 | 0.001 | 0.001 | nonzero | 4.776 | |
| pg18beta2_o2nofp.cx10b_c32r128 | 0.114 | 0.595 | 0.002 | 0.108 | 99.177 | 0.003 | 0.001 | nonzero | 3.361 | ||
| pg18beta2_o2nofp.cx10cw4_c32r128 | 0.109 | 2.511 | 2.565 | 0.671 | 94.139 | 0.002 | 0.002 | 0.001 | nonzero | 4.775 | |
| pg18beta2_o2nofp.cx10d_c32r128 | 0.059 | 1.532 | 2.740 | 0.199 | 95.467 | 0.002 | 0.001 | 0.001 | 3.133 |
Performance metrics for the DBMS listed above. Some are normalized by throughput, others are not. Legend for results is here.
ips	qps	rps	rmbps	wps	wmbps	rpq	rkbpq	wpi	wkbpi	csps	cpups	cspq	cpupq	dbgb1	dbgb2	rss	maxop	p50	p99	tag
2451	0	3072	26.8	4641.5	72.8	1.254	11.196	1.894	30.439	18652	29.7	7.611	5817	784.8	880.9	81.0	5.447	225	95	pg174_o2nofp.cx10a_c32r128
2314	0	2811	22.4	4138.8	66.6	1.215	9.925	1.789	29.462	17274	32.0	7.465	6638	784.9	880.9	77.8	5.541	215	25	pg175_o2nofp.cx10a_c32r128
2437	0	3162	30.5	4746.6	76.0	1.297	12.826	1.948	31.948	18315	28.4	7.515	5593	784.8	880.8	85.8	6.117	225	40	pg18beta1_o2nofp.cx10b_c32r128
2398	0	3035	26.1	4891.1	74.9	1.266	11.146	2.040	31.993	18494	25.9	7.712	5184	784.8	880.9	79.0	5.517	215	0	pg18beta1_o2nofp.cx10cw4_c32r128
2403	0	3028	26.6	4706.1	72.9	1.260	11.329	1.958	31.064	18504	26.8	7.700	5353	784.8	880.9	82.5	6.089	120	0	pg18beta1_o2nofp.cx10d_c32r128
2526	0	3221	29.3	4898.0	78.5	1.275	11.896	1.939	31.823	18995	30.6	7.520	5815	784.9	880.9	78.4	5.355	225	0	pg18beta2_o2nofp.cx10b_c32r128
4400	0	5670	52.3	8500.0	136.9	1.289	12.173	1.932	31.851	33669	40.0	7.651	4363	784.8	880.8	81.1	5.447	230	0	pg18beta2_o2nofp.cx10cw4_c32r128
2522	0	3134	27.3	4986.7	76.5	1.243	11.076	1.978	31.052	19275	24.9	7.644	4740	784.7	880.8	80.0	5.888	260	0	pg18beta2_o2nofp.cx10d_c32r128
qr100.L1
qr100.L1: range queries with 100 insert/s per client. Graphs for performance per 1-second interval are here.
Average throughput:
Query response time histogram: each cell has the percentage of responses that take <= the time in the header and max is the max response time in seconds. For max values in the top 25% of the range have a red background and in the bottom 25% of the range have a green background. The red background is not used when the min value is within 80% of the max value.
| dbms | 256us | 1ms | 4ms | 16ms | 64ms | 256ms | 1s | 4s | 16s | gt | max |
|---|---|---|---|---|---|---|---|---|---|---|---|
| pg174_o2nofp.cx10a_c32r128 | 99.995 | 0.004 | nonzero | nonzero | nonzero | nonzero | nonzero | 0.306 | |||
| pg175_o2nofp.cx10a_c32r128 | 99.996 | 0.004 | nonzero | nonzero | nonzero | nonzero | 0.075 | ||||
| pg18beta1_o2nofp.cx10b_c32r128 | 99.995 | 0.004 | 0.001 | nonzero | nonzero | nonzero | nonzero | 0.470 | |||
| pg18beta1_o2nofp.cx10cw4_c32r128 | 99.996 | 0.004 | nonzero | nonzero | nonzero | nonzero | nonzero | nonzero | 1.829 | ||
| pg18beta1_o2nofp.cx10d_c32r128 | 99.995 | 0.004 | nonzero | nonzero | nonzero | nonzero | 0.251 | ||||
| pg18beta2_o2nofp.cx10b_c32r128 | 99.996 | 0.004 | 0.001 | nonzero | nonzero | nonzero | 0.146 | ||||
| pg18beta2_o2nofp.cx10cw4_c32r128 | 99.996 | 0.004 | nonzero | nonzero | nonzero | nonzero | nonzero | 0.324 | |||
| pg18beta2_o2nofp.cx10d_c32r128 | 99.996 | 0.003 | nonzero | nonzero | nonzero | 0.051 |
Insert response time histogram: each cell has the percentage of responses that take <= the time in the header and max is the max response time in seconds. For max values in the top 25% of the range have a red background and in the bottom 25% of the range have a green background. The red background is not used when the min value is within 80% of the max value.
| dbms | 256us | 1ms | 4ms | 16ms | 64ms | 256ms | 1s | 4s | 16s | gt | max |
|---|---|---|---|---|---|---|---|---|---|---|---|
| pg174_o2nofp.cx10a_c32r128 | 99.136 | 0.817 | 0.042 | 0.006 | 0.276 | ||||||
| pg175_o2nofp.cx10a_c32r128 | 98.812 | 1.106 | 0.051 | 0.031 | 0.947 | ||||||
| pg18beta1_o2nofp.cx10b_c32r128 | 99.369 | 0.519 | 0.058 | 0.053 | 0.878 | ||||||
| pg18beta1_o2nofp.cx10cw4_c32r128 | 99.247 | 0.711 | 0.021 | 0.014 | 0.007 | 2.264 | |||||
| pg18beta1_o2nofp.cx10d_c32r128 | 99.269 | 0.681 | 0.042 | 0.008 | 0.481 | ||||||
| pg18beta2_o2nofp.cx10b_c32r128 | 98.889 | 1.008 | 0.078 | 0.025 | 0.859 | ||||||
| pg18beta2_o2nofp.cx10cw4_c32r128 | 98.974 | 0.886 | 0.032 | 0.103 | 0.006 | 1.258 | |||||
| pg18beta2_o2nofp.cx10d_c32r128 | 98.808 | 1.092 | 0.057 | 0.036 | 0.007 | 2.333 |
Delete response time histogram: each cell has the percentage of responses that take <= the time in the header and max is the max response time in seconds. For max values in the top 25% of the range have a red background and in the bottom 25% of the range have a green background. The red background is not used when the min value is within 80% of the max value.
| dbms | 256us | 1ms | 4ms | 16ms | 64ms | 256ms | 1s | 4s | 16s | gt | max |
|---|---|---|---|---|---|---|---|---|---|---|---|
| pg174_o2nofp.cx10a_c32r128 | 45.672 | 54.290 | 0.036 | 0.001 | 0.090 | ||||||
| pg175_o2nofp.cx10a_c32r128 | 49.878 | 50.061 | 0.056 | 0.004 | 0.001 | 0.256 | |||||
| pg18beta1_o2nofp.cx10b_c32r128 | 43.825 | 56.128 | 0.046 | 0.001 | 0.060 | ||||||
| pg18beta1_o2nofp.cx10cw4_c32r128 | 46.774 | 53.190 | 0.035 | 0.001 | 0.025 | ||||||
| pg18beta1_o2nofp.cx10d_c32r128 | 43.353 | 56.572 | 0.065 | 0.008 | 0.001 | 0.069 | |||||
| pg18beta2_o2nofp.cx10b_c32r128 | 45.535 | 54.408 | 0.050 | 0.007 | 0.035 | ||||||
| pg18beta2_o2nofp.cx10cw4_c32r128 | 47.426 | 52.521 | 0.037 | 0.015 | 0.034 | ||||||
| pg18beta2_o2nofp.cx10d_c32r128 | 48.039 | 51.906 | 0.047 | 0.008 | 0.023 |
Performance metrics for the DBMS listed above. Some are normalized by throughput, others are not. Legend for results is here.
ips	qps	rps	rmbps	wps	wmbps	rpq	rkbpq	wpi	wkbpi	csps	cpups	cspq	cpupq	dbgb1	dbgb2	rss	maxop	p50	p99	tag
1977	372847	2721	22.0	1234.3	36.0	0.007	0.060	0.624	18.670	1421774	43.0	3.813	55	785.0	881.0	94.8	0.306	18955	18140	pg174_o2nofp.cx10a_c32r128
1977	376506	2722	22.0	1213.0	35.8	0.007	0.060	0.614	18.558	1436110	43.1	3.814	55	785.0	881.0	95.4	0.075	19115	18380	pg175_o2nofp.cx10a_c32r128
1976	365365	2666	21.4	1298.5	36.6	0.007	0.060	0.657	18.984	1394620	43.1	3.817	57	784.9	880.9	96.0	0.470	18803	18052	pg18beta1_o2nofp.cx10b_c32r128
1977	367400	2666	21.4	1266.0	36.4	0.007	0.060	0.640	18.841	1401305	43.2	3.814	56	785.0	881.0	95.7	1.829	18748	17965	pg18beta1_o2nofp.cx10cw4_c32r128
1977	370226	2669	21.5	1278.6	36.5	0.007	0.059	0.647	18.901	1412129	43.2	3.814	56	784.9	881.0	95.7	0.251	18716	17949	pg18beta1_o2nofp.cx10d_c32r128
1977	366552	2672	21.5	1313.4	36.8	0.007	0.060	0.664	19.039	1398651	43.2	3.816	57	785.0	881.0	96.1	0.146	18636	17892	pg18beta2_o2nofp.cx10b_c32r128
1976	367784	2660	21.3	1323.2	37.0	0.007	0.059	0.670	19.153	1403818	43.1	3.817	56	785.0	881.1	95.8	0.324	18540	17667	pg18beta2_o2nofp.cx10cw4_c32r128
1976	372750	2666	21.5	1304.2	36.7	0.007	0.059	0.660	19.031	1422802	43.0	3.817	55	784.9	880.9	95.8	0.051	19051	18268	pg18beta2_o2nofp.cx10d_c32r128
qp100.L2
qp100.L2: point queries with 100 insert/s per client. Graphs for performance per 1-second interval are here.
Average throughput:
Query response time histogram: each cell has the percentage of responses that take <= the time in the header and max is the max response time in seconds. For max values in the top 25% of the range have a red background and in the bottom 25% of the range have a green background. The red background is not used when the min value is within 80% of the max value.
| dbms | 256us | 1ms | 4ms | 16ms | 64ms | 256ms | 1s | 4s | 16s | gt | max |
|---|---|---|---|---|---|---|---|---|---|---|---|
| pg174_o2nofp.cx10a_c32r128 | nonzero | 2.638 | 94.203 | 0.383 | 2.658 | 0.061 | 0.040 | 0.015 | 0.002 | 5.415 | |
| pg175_o2nofp.cx10a_c32r128 | 2.731 | 94.173 | 0.331 | 2.643 | 0.063 | 0.042 | 0.017 | 0.002 | 5.630 | ||
| pg18beta1_o2nofp.cx10b_c32r128 | nonzero | 2.473 | 94.364 | 0.378 | 2.670 | 0.060 | 0.039 | 0.016 | 0.001 | 5.591 | |
| pg18beta1_o2nofp.cx10cw4_c32r128 | 2.314 | 94.401 | 0.342 | 2.818 | 0.071 | 0.037 | 0.015 | 0.001 | 4.697 | ||
| pg18beta1_o2nofp.cx10d_c32r128 | nonzero | 2.419 | 94.439 | 0.326 | 2.690 | 0.065 | 0.044 | 0.015 | 0.001 | 5.051 | |
| pg18beta2_o2nofp.cx10b_c32r128 | nonzero | 2.437 | 94.458 | 0.357 | 2.631 | 0.059 | 0.040 | 0.016 | 0.001 | 4.806 | |
| pg18beta2_o2nofp.cx10cw4_c32r128 | nonzero | 2.329 | 94.384 | 0.331 | 2.840 | 0.067 | 0.032 | 0.014 | 0.002 | 5.457 | |
| pg18beta2_o2nofp.cx10d_c32r128 | 2.520 | 94.442 | 0.292 | 2.617 | 0.065 | 0.048 | 0.016 | 0.001 | 4.902 |
Insert response time histogram: each cell has the percentage of responses that take <= the time in the header and max is the max response time in seconds. For max values in the top 25% of the range have a red background and in the bottom 25% of the range have a green background. The red background is not used when the min value is within 80% of the max value.
| dbms | 256us | 1ms | 4ms | 16ms | 64ms | 256ms | 1s | 4s | 16s | gt | max |
|---|---|---|---|---|---|---|---|---|---|---|---|
| pg174_o2nofp.cx10a_c32r128 | 60.368 | 35.990 | 1.097 | 1.261 | 1.182 | 0.101 | 4.784 | ||||
| pg175_o2nofp.cx10a_c32r128 | 62.085 | 34.104 | 1.115 | 1.343 | 1.290 | 0.062 | 4.924 | ||||
| pg18beta1_o2nofp.cx10b_c32r128 | 62.101 | 34.351 | 0.985 | 1.118 | 1.339 | 0.106 | 5.051 | ||||
| pg18beta1_o2nofp.cx10cw4_c32r128 | 59.374 | 37.101 | 1.218 | 1.221 | 1.029 | 0.057 | 4.390 | ||||
| pg18beta1_o2nofp.cx10d_c32r128 | 61.235 | 35.139 | 1.151 | 1.113 | 1.304 | 0.058 | 4.999 | ||||
| pg18beta2_o2nofp.cx10b_c32r128 | 62.457 | 34.126 | 1.021 | 0.889 | 1.454 | 0.053 | 4.595 | ||||
| pg18beta2_o2nofp.cx10cw4_c32r128 | 62.596 | 34.126 | 1.167 | 0.853 | 1.206 | 0.053 | 4.671 | ||||
| pg18beta2_o2nofp.cx10d_c32r128 | 62.324 | 34.249 | 0.932 | 1.276 | 1.197 | 0.022 | 4.607 |
Delete response time histogram: each cell has the percentage of responses that take <= the time in the header and max is the max response time in seconds. For max values in the top 25% of the range have a red background and in the bottom 25% of the range have a green background. The red background is not used when the min value is within 80% of the max value.
| dbms | 256us | 1ms | 4ms | 16ms | 64ms | 256ms | 1s | 4s | 16s | gt | max |
|---|---|---|---|---|---|---|---|---|---|---|---|
| pg174_o2nofp.cx10a_c32r128 | 94.647 | 1.522 | 3.725 | 0.019 | 0.056 | 0.029 | 0.001 | 4.336 | |||
| pg175_o2nofp.cx10a_c32r128 | 94.908 | 1.476 | 3.493 | 0.019 | 0.067 | 0.036 | 3.411 | ||||
| pg18beta1_o2nofp.cx10b_c32r128 | 93.476 | 2.503 | 3.811 | 0.035 | 0.099 | 0.076 | 3.840 | ||||
| pg18beta1_o2nofp.cx10cw4_c32r128 | 93.800 | 2.100 | 3.988 | 0.042 | 0.035 | 0.035 | 0.001 | 4.251 | |||
| pg18beta1_o2nofp.cx10d_c32r128 | 95.061 | 1.229 | 3.586 | 0.032 | 0.047 | 0.043 | 0.001 | 4.453 | |||
| pg18beta2_o2nofp.cx10b_c32r128 | 94.283 | 1.851 | 3.711 | 0.025 | 0.088 | 0.042 | 3.771 | ||||
| pg18beta2_o2nofp.cx10cw4_c32r128 | 95.546 | 0.681 | 3.658 | 0.040 | 0.035 | 0.040 | 3.924 | ||||
| pg18beta2_o2nofp.cx10d_c32r128 | 95.793 | 0.508 | 3.560 | 0.015 | 0.083 | 0.039 | 0.001 | 4.497 |
Performance metrics for the DBMS listed above. Some are normalized by throughput, others are not. Legend for results is here.
ips	qps	rps	rmbps	wps	wmbps	rpq	rkbpq	wpi	wkbpi	csps	cpups	cspq	cpupq	dbgb1	dbgb2	rss	maxop	p50	p99	tag
1977	7068	99927	784.2	6634.0	76.5	14.138	113.609	3.356	39.630	223156	19.1	31.572	1297	785.0	881.1	90.9	5.415	416	0	pg174_o2nofp.cx10a_c32r128
1977	7001	99052	777.3	6678.9	76.9	14.149	113.698	3.378	39.812	221153	18.8	31.590	1289	785.1	881.1	92.2	5.630	416	0	pg175_o2nofp.cx10a_c32r128
1976	6974	98742	774.9	6608.0	76.2	14.159	113.781	3.344	39.518	220583	19.2	31.630	1322	785.0	881.0	93.5	5.591	416	0	pg18beta1_o2nofp.cx10b_c32r128
1976	6906	97844	767.6	6589.7	76.2	14.167	113.810	3.335	39.487	218834	20.1	31.686	1397	785.0	881.1	90.6	4.697	400	0	pg18beta1_o2nofp.cx10cw4_c32r128
1977	6923	98026	769.3	6615.4	76.4	14.159	113.781	3.346	39.556	218815	19.6	31.605	1359	785.0	881.1	91.2	5.051	400	0	pg18beta1_o2nofp.cx10d_c32r128
1977	6912	97867	768.1	6568.6	76.0	14.160	113.794	3.323	39.343	218442	18.7	31.605	1299	785.0	881.1	92.7	4.806	416	0	pg18beta2_o2nofp.cx10b_c32r128
1977	6912	97884	767.7	6561.8	76.0	14.161	113.734	3.319	39.386	218867	20.1	31.663	1396	785.3	881.3	91.2	5.457	400	0	pg18beta2_o2nofp.cx10cw4_c32r128
1977	6893	97632	766.3	6582.6	76.1	14.165	113.844	3.330	39.420	217692	19.0	31.583	1323	784.9	881.0	91.2	4.902	400	0	pg18beta2_o2nofp.cx10d_c32r128
qr500.L3
qr500.L3: range queries with 500 insert/s per client. Graphs for performance per 1-second interval are here.
Average throughput:
Query response time histogram: each cell has the percentage of responses that take <= the time in the header and max is the max response time in seconds. For max values in the top 25% of the range have a red background and in the bottom 25% of the range have a green background. The red background is not used when the min value is within 80% of the max value.
| dbms | 256us | 1ms | 4ms | 16ms | 64ms | 256ms | 1s | 4s | 16s | gt | max |
|---|---|---|---|---|---|---|---|---|---|---|---|
| pg174_o2nofp.cx10a_c32r128 | 99.977 | 0.018 | 0.003 | 0.001 | 0.001 | nonzero | nonzero | nonzero | 1.887 | ||
| pg175_o2nofp.cx10a_c32r128 | 99.976 | 0.019 | 0.003 | 0.001 | 0.001 | nonzero | nonzero | nonzero | 3.747 | ||
| pg18beta1_o2nofp.cx10b_c32r128 | 99.976 | 0.019 | 0.003 | 0.001 | 0.001 | nonzero | nonzero | nonzero | nonzero | 4.769 | |
| pg18beta1_o2nofp.cx10cw4_c32r128 | 99.978 | 0.017 | 0.003 | 0.001 | 0.001 | nonzero | nonzero | nonzero | 2.282 | ||
| pg18beta1_o2nofp.cx10d_c32r128 | 99.975 | 0.020 | 0.003 | 0.001 | 0.001 | nonzero | nonzero | nonzero | 3.074 | ||
| pg18beta2_o2nofp.cx10b_c32r128 | 99.975 | 0.020 | 0.003 | 0.001 | 0.001 | nonzero | nonzero | nonzero | nonzero | 4.331 | |
| pg18beta2_o2nofp.cx10cw4_c32r128 | 99.975 | 0.020 | 0.003 | 0.001 | 0.001 | nonzero | nonzero | nonzero | 1.418 | ||
| pg18beta2_o2nofp.cx10d_c32r128 | 99.976 | 0.019 | 0.003 | 0.001 | 0.001 | nonzero | nonzero | nonzero | nonzero | 4.469 |
Insert response time histogram: each cell has the percentage of responses that take <= the time in the header and max is the max response time in seconds. For max values in the top 25% of the range have a red background and in the bottom 25% of the range have a green background. The red background is not used when the min value is within 80% of the max value.
| dbms | 256us | 1ms | 4ms | 16ms | 64ms | 256ms | 1s | 4s | 16s | gt | max |
|---|---|---|---|---|---|---|---|---|---|---|---|
| pg174_o2nofp.cx10a_c32r128 | 85.427 | 13.756 | 0.354 | 0.371 | 0.092 | 2.381 | |||||
| pg175_o2nofp.cx10a_c32r128 | 82.915 | 16.430 | 0.333 | 0.220 | 0.091 | 0.011 | 5.518 | ||||
| pg18beta1_o2nofp.cx10b_c32r128 | 82.844 | 16.322 | 0.376 | 0.298 | 0.148 | 0.011 | 5.640 | ||||
| pg18beta1_o2nofp.cx10cw4_c32r128 | 85.745 | 13.536 | 0.370 | 0.238 | 0.111 | 2.846 | |||||
| pg18beta1_o2nofp.cx10d_c32r128 | 83.467 | 15.792 | 0.379 | 0.237 | 0.119 | 0.006 | 5.777 | ||||
| pg18beta2_o2nofp.cx10b_c32r128 | 83.886 | 15.447 | 0.293 | 0.274 | 0.094 | 0.006 | 4.602 | ||||
| pg18beta2_o2nofp.cx10cw4_c32r128 | 82.953 | 16.326 | 0.347 | 0.254 | 0.107 | 0.013 | 5.335 | ||||
| pg18beta2_o2nofp.cx10d_c32r128 | 84.664 | 14.670 | 0.344 | 0.216 | 0.097 | 0.009 | 5.059 |
Delete response time histogram: each cell has the percentage of responses that take <= the time in the header and max is the max response time in seconds. For max values in the top 25% of the range have a red background and in the bottom 25% of the range have a green background. The red background is not used when the min value is within 80% of the max value.
| dbms | 256us | 1ms | 4ms | 16ms | 64ms | 256ms | 1s | 4s | 16s | gt | max |
|---|---|---|---|---|---|---|---|---|---|---|---|
| pg174_o2nofp.cx10a_c32r128 | 39.057 | 59.553 | 1.374 | 0.006 | 0.008 | 0.001 | 1.886 | ||||
| pg175_o2nofp.cx10a_c32r128 | 39.114 | 59.306 | 1.563 | 0.007 | 0.003 | 0.006 | 0.001 | 4.933 | |||
| pg18beta1_o2nofp.cx10b_c32r128 | 34.225 | 64.004 | 1.752 | 0.008 | 0.007 | 0.003 | 2.976 | ||||
| pg18beta1_o2nofp.cx10cw4_c32r128 | 41.335 | 57.229 | 1.421 | 0.006 | 0.007 | 0.003 | 2.223 | ||||
| pg18beta1_o2nofp.cx10d_c32r128 | 36.902 | 61.328 | 1.751 | 0.008 | 0.003 | 0.005 | 0.003 | 5.576 | |||
| pg18beta2_o2nofp.cx10b_c32r128 | 36.490 | 61.931 | 1.564 | 0.007 | 0.005 | 0.002 | 0.001 | 4.299 | |||
| pg18beta2_o2nofp.cx10cw4_c32r128 | 41.960 | 56.276 | 1.754 | 0.004 | 0.004 | 0.003 | 2.327 | ||||
| pg18beta2_o2nofp.cx10d_c32r128 | 42.325 | 56.144 | 1.518 | 0.006 | 0.005 | 0.003 | nonzero | 4.793 |
Performance metrics for the DBMS listed above. Some are normalized by throughput, others are not. Legend for results is here.
ips	qps	rps	rmbps	wps	wmbps	rpq	rkbpq	wpi	wkbpi	csps	cpups	cspq	cpupq	dbgb1	dbgb2	rss	maxop	p50	p99	tag
9874	333101	13802	111.4	14502.0	242.9	0.041	0.343	1.469	25.188	1252077	49.4	3.759	71	785.5	881.5	87.5	1.887	17253	15295	pg174_o2nofp.cx10a_c32r128
9793	334424	13687	110.4	14385.4	241.0	0.041	0.338	1.469	25.197	1256143	49.4	3.756	71	785.5	881.5	86.9	3.747	16958	15061	pg175_o2nofp.cx10a_c32r128
9804	322117	13725	110.7	14378.3	241.2	0.043	0.352	1.467	25.193	1210877	49.9	3.759	74	785.4	881.5	84.5	4.769	16206	14213	pg18beta1_o2nofp.cx10b_c32r128
9858	328490	13799	111.6	14472.9	242.8	0.042	0.348	1.468	25.226	1240484	49.6	3.776	72	785.5	881.5	86.4	2.282	16829	14672	pg18beta1_o2nofp.cx10cw4_c32r128
9798	327476	13714	110.2	14388.1	241.5	0.042	0.345	1.468	25.240	1231216	49.5	3.760	73	786.1	882.1	86.4	3.074	16766	14576	pg18beta1_o2nofp.cx10d_c32r128
9831	326432	13759	111.0	14447.0	241.9	0.042	0.348	1.470	25.202	1226588	49.5	3.758	73	785.4	881.5	87.0	4.331	16381	14400	pg18beta2_o2nofp.cx10b_c32r128
9798	327128	13710	109.8	14382.5	241.6	0.042	0.344	1.468	25.250	1230947	49.3	3.763	72	786.7	882.8	88.5	1.418	16719	14783	pg18beta2_o2nofp.cx10cw4_c32r128
9820	331377	13728	110.8	14393.6	241.2	0.041	0.342	1.466	25.151	1248430	49.4	3.767	72	785.4	881.4	86.7	4.469	16750	14800	pg18beta2_o2nofp.cx10d_c32r128
qp500.L4
qp500.L4: point queries with 500 insert/s per client. Graphs for performance per 1-second interval are here.
Average throughput:
Query response time histogram: each cell has the percentage of responses that take <= the time in the header and max is the max response time in seconds. For max values in the top 25% of the range have a red background and in the bottom 25% of the range have a green background. The red background is not used when the min value is within 80% of the max value.
| dbms | 256us | 1ms | 4ms | 16ms | 64ms | 256ms | 1s | 4s | 16s | gt | max |
|---|---|---|---|---|---|---|---|---|---|---|---|
| pg174_o2nofp.cx10a_c32r128 | 0.225 | 93.568 | 1.302 | 4.847 | 0.028 | 0.017 | 0.011 | 0.002 | 6.648 | ||
| pg175_o2nofp.cx10a_c32r128 | 0.229 | 93.633 | 1.277 | 4.806 | 0.026 | 0.015 | 0.012 | 0.003 | 6.169 | ||
| pg18beta1_o2nofp.cx10b_c32r128 | 0.195 | 93.533 | 1.351 | 4.858 | 0.030 | 0.019 | 0.012 | 0.002 | 8.677 | ||
| pg18beta1_o2nofp.cx10cw4_c32r128 | 0.174 | 93.112 | 1.458 | 5.172 | 0.047 | 0.022 | 0.012 | 0.003 | 9.487 | ||
| pg18beta1_o2nofp.cx10d_c32r128 | 0.205 | 93.487 | 1.423 | 4.825 | 0.030 | 0.016 | 0.013 | 0.002 | 7.767 | ||
| pg18beta2_o2nofp.cx10b_c32r128 | 0.206 | 93.657 | 1.251 | 4.828 | 0.026 | 0.015 | 0.016 | 0.002 | 8.735 | ||
| pg18beta2_o2nofp.cx10cw4_c32r128 | 0.191 | 93.265 | 1.486 | 4.992 | 0.032 | 0.019 | 0.011 | 0.003 | 9.210 | ||
| pg18beta2_o2nofp.cx10d_c32r128 | 0.200 | 93.583 | 1.331 | 4.829 | 0.027 | 0.013 | 0.014 | 0.003 | 7.650 |
Insert response time histogram: each cell has the percentage of responses that take <= the time in the header and max is the max response time in seconds. For max values in the top 25% of the range have a red background and in the bottom 25% of the range have a green background. The red background is not used when the min value is within 80% of the max value.
| dbms | 256us | 1ms | 4ms | 16ms | 64ms | 256ms | 1s | 4s | 16s | gt | max |
|---|---|---|---|---|---|---|---|---|---|---|---|
| pg174_o2nofp.cx10a_c32r128 | 39.204 | 59.296 | 0.860 | 0.321 | 0.284 | 0.035 | 6.377 | ||||
| pg175_o2nofp.cx10a_c32r128 | 38.665 | 60.028 | 0.643 | 0.313 | 0.309 | 0.042 | 6.016 | ||||
| pg18beta1_o2nofp.cx10b_c32r128 | 37.622 | 60.875 | 0.802 | 0.360 | 0.290 | 0.051 | 8.490 | ||||
| pg18beta1_o2nofp.cx10cw4_c32r128 | 37.130 | 60.926 | 1.186 | 0.430 | 0.279 | 0.049 | 9.495 | ||||
| pg18beta1_o2nofp.cx10d_c32r128 | 36.433 | 61.794 | 1.083 | 0.337 | 0.308 | 0.046 | 9.530 | ||||
| pg18beta2_o2nofp.cx10b_c32r128 | 38.671 | 59.909 | 0.701 | 0.316 | 0.370 | 0.034 | 9.532 | ||||
| pg18beta2_o2nofp.cx10cw4_c32r128 | 35.841 | 62.551 | 0.928 | 0.360 | 0.272 | 0.048 | 10.292 | ||||
| pg18beta2_o2nofp.cx10d_c32r128 | 39.154 | 59.418 | 0.761 | 0.298 | 0.301 | 0.068 | 7.610 |
Delete response time histogram: each cell has the percentage of responses that take <= the time in the header and max is the max response time in seconds. For max values in the top 25% of the range have a red background and in the bottom 25% of the range have a green background. The red background is not used when the min value is within 80% of the max value.
| dbms | 256us | 1ms | 4ms | 16ms | 64ms | 256ms | 1s | 4s | 16s | gt | max |
|---|---|---|---|---|---|---|---|---|---|---|---|
| pg174_o2nofp.cx10a_c32r128 | 67.089 | 32.522 | 0.096 | 0.206 | 0.086 | 0.001 | 4.696 | ||||
| pg175_o2nofp.cx10a_c32r128 | 74.251 | 25.354 | 0.081 | 0.218 | 0.096 | nonzero | 4.834 | ||||
| pg18beta1_o2nofp.cx10b_c32r128 | 65.173 | 34.392 | 0.111 | 0.227 | 0.095 | 0.002 | 5.444 | ||||
| pg18beta1_o2nofp.cx10cw4_c32r128 | 65.001 | 34.531 | 0.175 | 0.212 | 0.081 | 0.001 | 7.499 | ||||
| pg18beta1_o2nofp.cx10d_c32r128 | 65.026 | 34.540 | 0.145 | 0.208 | 0.081 | nonzero | 6.350 | ||||
| pg18beta2_o2nofp.cx10b_c32r128 | 69.628 | 29.950 | 0.092 | 0.204 | 0.126 | 3.730 | |||||
| pg18beta2_o2nofp.cx10cw4_c32r128 | 73.679 | 25.919 | 0.134 | 0.206 | 0.060 | 0.001 | 6.540 | ||||
| pg18beta2_o2nofp.cx10d_c32r128 | 71.912 | 27.721 | 0.076 | 0.198 | 0.093 | 0.001 | 6.419 |
Performance metrics for the DBMS listed above. Some are normalized by throughput, others are not. Legend for results is here.
ips	qps	rps	rmbps	wps	wmbps	rpq	rkbpq	wpi	wkbpi	csps	cpups	cspq	cpupq	dbgb1	dbgb2	rss	maxop	p50	p99	tag
9590	5066	91498	718.7	21615.8	291.5	18.062	145.284	2.254	31.124	209262	35.8	41.310	3392	786.0	882.0	77.3	6.648	288	0	pg174_o2nofp.cx10a_c32r128
9509	5064	91118	715.7	21489.3	288.7	17.994	144.733	2.260	31.089	208814	34.7	41.236	3289	785.9	882.0	31.5	6.169	288	0	pg175_o2nofp.cx10a_c32r128
9474	4878	88562	695.7	21297.9	287.5	18.157	146.048	2.248	31.072	202244	35.8	41.465	3523	785.9	881.9	34.3	8.677	272	0	pg18beta1_o2nofp.cx10b_c32r128
9474	4694	86018	675.4	21280.7	287.0	18.325	147.347	2.246	31.018	197779	36.1	42.134	3692	786.2	882.3	36.4	9.487	256	0	pg18beta1_o2nofp.cx10cw4_c32r128
9504	4936	89365	701.3	21426.8	289.0	18.105	145.482	2.255	31.140	204118	36.0	41.354	3501	787.4	883.5	33.6	7.767	272	0	pg18beta1_o2nofp.cx10d_c32r128
9539	4975	90123	707.8	21456.1	289.2	18.117	145.692	2.249	31.045	206181	35.5	41.447	3425	785.9	882.0	32.7	8.735	272	0	pg18beta2_o2nofp.cx10b_c32r128
9519	4883	88737	696.2	21297.2	288.5	18.174	146.011	2.237	31.035	203154	35.6	41.607	3500	788.2	884.2	34.4	9.210	272	0	pg18beta2_o2nofp.cx10cw4_c32r128
9489	4922	89274	701.2	21268.2	287.6	18.137	145.871	2.241	31.040	204218	35.2	41.488	3433	785.9	881.9	33.2	7.650	272	0	pg18beta2_o2nofp.cx10d_c32r128
qr1000.L5
qr1000.L5: range queries with 1000 insert/s per client. Graphs for performance per 1-second interval are here.
Average throughput:
Query response time histogram: each cell has the percentage of responses that take <= the time in the header and max is the max response time in seconds. For max values in the top 25% of the range have a red background and in the bottom 25% of the range have a green background. The red background is not used when the min value is within 80% of the max value.
| dbms | 256us | 1ms | 4ms | 16ms | 64ms | 256ms | 1s | 4s | 16s | gt | max |
|---|---|---|---|---|---|---|---|---|---|---|---|
| pg174_o2nofp.cx10a_c32r128 | 99.698 | 0.215 | 0.027 | 0.035 | 0.026 | 0.001 | nonzero | nonzero | 2.647 | ||
| pg175_o2nofp.cx10a_c32r128 | 99.711 | 0.206 | 0.026 | 0.033 | 0.024 | 0.001 | nonzero | nonzero | 2.455 | ||
| pg18beta1_o2nofp.cx10b_c32r128 | 99.693 | 0.227 | 0.027 | 0.030 | 0.021 | nonzero | nonzero | nonzero | nonzero | 4.308 | |
| pg18beta1_o2nofp.cx10cw4_c32r128 | 99.693 | 0.227 | 0.027 | 0.031 | 0.022 | nonzero | nonzero | nonzero | nonzero | 9.658 | |
| pg18beta1_o2nofp.cx10d_c32r128 | 99.698 | 0.223 | 0.027 | 0.030 | 0.021 | nonzero | nonzero | nonzero | 2.267 | ||
| pg18beta2_o2nofp.cx10b_c32r128 | 99.710 | 0.211 | 0.027 | 0.030 | 0.022 | nonzero | nonzero | nonzero | nonzero | 4.222 | |
| pg18beta2_o2nofp.cx10cw4_c32r128 | 99.708 | 0.212 | 0.027 | 0.031 | 0.022 | nonzero | nonzero | nonzero | 2.599 | ||
| pg18beta2_o2nofp.cx10d_c32r128 | 99.721 | 0.203 | 0.026 | 0.029 | 0.020 | nonzero | nonzero | nonzero | nonzero | 5.650 |
Insert response time histogram: each cell has the percentage of responses that take <= the time in the header and max is the max response time in seconds. For max values in the top 25% of the range have a red background and in the bottom 25% of the range have a green background. The red background is not used when the min value is within 80% of the max value.
| dbms | 256us | 1ms | 4ms | 16ms | 64ms | 256ms | 1s | 4s | 16s | gt | max |
|---|---|---|---|---|---|---|---|---|---|---|---|
| pg174_o2nofp.cx10a_c32r128 | 38.247 | 44.091 | 17.450 | 0.109 | 0.095 | 0.008 | 6.192 | ||||
| pg175_o2nofp.cx10a_c32r128 | 40.427 | 42.304 | 17.034 | 0.133 | 0.101 | nonzero | 4.259 | ||||
| pg18beta1_o2nofp.cx10b_c32r128 | 35.981 | 45.357 | 18.442 | 0.097 | 0.111 | 0.013 | 6.721 | ||||
| pg18beta1_o2nofp.cx10cw4_c32r128 | 35.405 | 44.825 | 19.552 | 0.106 | 0.107 | 0.005 | 9.947 | ||||
| pg18beta1_o2nofp.cx10d_c32r128 | 35.610 | 46.182 | 17.992 | 0.104 | 0.108 | 0.003 | 6.670 | ||||
| pg18beta2_o2nofp.cx10b_c32r128 | 35.148 | 46.387 | 18.258 | 0.099 | 0.095 | 0.013 | 7.291 | ||||
| pg18beta2_o2nofp.cx10cw4_c32r128 | 33.624 | 46.489 | 19.677 | 0.086 | 0.120 | 0.004 | 6.460 | ||||
| pg18beta2_o2nofp.cx10d_c32r128 | 35.357 | 46.646 | 17.806 | 0.084 | 0.098 | 0.008 | 8.950 |
Delete response time histogram: each cell has the percentage of responses that take <= the time in the header and max is the max response time in seconds. For max values in the top 25% of the range have a red background and in the bottom 25% of the range have a green background. The red background is not used when the min value is within 80% of the max value.
| dbms | 256us | 1ms | 4ms | 16ms | 64ms | 256ms | 1s | 4s | 16s | gt | max |
|---|---|---|---|---|---|---|---|---|---|---|---|
| pg174_o2nofp.cx10a_c32r128 | 35.922 | 59.058 | 4.930 | 0.040 | 0.050 | nonzero | 4.784 | ||||
| pg175_o2nofp.cx10a_c32r128 | 37.177 | 57.934 | 4.775 | 0.064 | 0.050 | 2.027 | |||||
| pg18beta1_o2nofp.cx10b_c32r128 | 35.589 | 60.821 | 3.496 | 0.039 | 0.054 | nonzero | 5.203 | ||||
| pg18beta1_o2nofp.cx10cw4_c32r128 | 33.533 | 62.744 | 3.623 | 0.046 | 0.054 | nonzero | 9.601 | ||||
| pg18beta1_o2nofp.cx10d_c32r128 | 34.927 | 61.729 | 3.252 | 0.036 | 0.056 | 2.222 | |||||
| pg18beta2_o2nofp.cx10b_c32r128 | 38.855 | 58.006 | 3.057 | 0.040 | 0.043 | 3.732 | |||||
| pg18beta2_o2nofp.cx10cw4_c32r128 | 38.073 | 58.561 | 3.274 | 0.032 | 0.059 | 3.180 | |||||
| pg18beta2_o2nofp.cx10d_c32r128 | 39.217 | 57.667 | 3.039 | 0.034 | 0.044 | nonzero | 5.163 |
Performance metrics for the DBMS listed above. Some are normalized by throughput, others are not. Legend for results is here.
ips	qps	rps	rmbps	wps	wmbps	rpq	rkbpq	wpi	wkbpi	csps	cpups	cspq	cpupq	dbgb1	dbgb2	rss	maxop	p50	p99	tag
18200	205627	24269	195.3	26501.7	558.1	0.118	0.973	1.456	31.402	658296	64.6	3.201	151	788.6	932.8	74.5	2.647	10853	879	pg174_o2nofp.cx10a_c32r128
18256	207535	24328	195.9	26760.8	560.5	0.117	0.966	1.466	31.440	664945	64.8	3.204	150	788.6	928.2	76.3	2.455	10790	1266	pg175_o2nofp.cx10a_c32r128
18036	204655	24002	193.3	26117.3	552.4	0.117	0.967	1.448	31.364	650245	65.6	3.177	154	788.4	929.5	75.4	4.308	10666	527	pg18beta1_o2nofp.cx10b_c32r128
17982	204012	23930	192.3	26103.6	552.6	0.117	0.965	1.452	31.470	644993	65.8	3.162	155	789.3	927.3	75.0	9.658	10533	1135	pg18beta1_o2nofp.cx10cw4_c32r128
18163	207126	24194	194.5	26552.8	559.1	0.117	0.962	1.462	31.519	656764	65.9	3.171	153	790.5	928.8	76.0	2.267	10772	1727	pg18beta1_o2nofp.cx10d_c32r128
18145	208486	24128	194.1	26502.7	557.8	0.116	0.953	1.461	31.479	670293	65.2	3.215	150	788.8	930.0	74.9	4.222	10744	2397	pg18beta2_o2nofp.cx10b_c32r128
17955	205929	23874	191.8	26071.0	554.2	0.116	0.954	1.452	31.606	653188	65.1	3.172	152	791.3	925.6	75.3	2.599	10701	1039	pg18beta2_o2nofp.cx10cw4_c32r128
18100	210748	24084	193.8	26484.8	556.9	0.114	0.942	1.463	31.510	674234	65.2	3.199	148	788.8	929.1	78.3	5.650	10948	1215	pg18beta2_o2nofp.cx10d_c32r128
qp1000.L6
qp1000.L6: point queries with 1000 insert/s per client. Graphs for performance per 1-second interval are here.
Average throughput:
Query response time histogram: each cell has the percentage of responses that take <= the time in the header and max is the max response time in seconds. For max values in the top 25% of the range have a red background and in the bottom 25% of the range have a green background. The red background is not used when the min value is within 80% of the max value.
| dbms | 256us | 1ms | 4ms | 16ms | 64ms | 256ms | 1s | 4s | 16s | gt | max |
|---|---|---|---|---|---|---|---|---|---|---|---|
| pg174_o2nofp.cx10a_c32r128 | 0.002 | 70.997 | 19.625 | 9.131 | 0.169 | 0.052 | 0.024 | 0.002 | 7.334 | ||
| pg175_o2nofp.cx10a_c32r128 | 0.001 | 71.619 | 18.840 | 9.276 | 0.166 | 0.058 | 0.034 | 0.005 | 9.368 | ||
| pg18beta1_o2nofp.cx10b_c32r128 | 0.001 | 68.294 | 21.854 | 9.515 | 0.238 | 0.067 | 0.027 | 0.004 | 9.807 | ||
| pg18beta1_o2nofp.cx10cw4_c32r128 | 0.001 | 67.516 | 22.041 | 10.096 | 0.256 | 0.066 | 0.021 | 0.002 | 8.882 | ||
| pg18beta1_o2nofp.cx10d_c32r128 | 0.001 | 68.569 | 21.554 | 9.552 | 0.243 | 0.056 | 0.021 | 0.004 | 9.625 | ||
| pg18beta2_o2nofp.cx10b_c32r128 | 0.001 | 69.035 | 21.248 | 9.464 | 0.172 | 0.048 | 0.031 | 0.002 | 7.118 | ||
| pg18beta2_o2nofp.cx10cw4_c32r128 | 0.001 | 69.040 | 20.924 | 9.740 | 0.203 | 0.065 | 0.021 | 0.006 | 9.504 | ||
| pg18beta2_o2nofp.cx10d_c32r128 | 0.001 | 69.850 | 20.650 | 9.229 | 0.187 | 0.053 | 0.025 | 0.005 | 9.942 |
Insert response time histogram: each cell has the percentage of responses that take <= the time in the header and max is the max response time in seconds. For max values in the top 25% of the range have a red background and in the bottom 25% of the range have a green background. The red background is not used when the min value is within 80% of the max value.
| dbms | 256us | 1ms | 4ms | 16ms | 64ms | 256ms | 1s | 4s | 16s | gt | max |
|---|---|---|---|---|---|---|---|---|---|---|---|
| pg174_o2nofp.cx10a_c32r128 | 10.708 | 76.523 | 12.196 | 0.369 | 0.192 | 0.013 | 7.527 | ||||
| pg175_o2nofp.cx10a_c32r128 | 10.934 | 75.652 | 12.675 | 0.418 | 0.284 | 0.037 | 9.458 | ||||
| pg18beta1_o2nofp.cx10b_c32r128 | 10.342 | 72.985 | 15.972 | 0.452 | 0.222 | 0.028 | 10.718 | ||||
| pg18beta1_o2nofp.cx10cw4_c32r128 | 8.968 | 71.975 | 18.428 | 0.434 | 0.179 | 0.015 | 8.346 | ||||
| pg18beta1_o2nofp.cx10d_c32r128 | 9.537 | 73.571 | 16.282 | 0.418 | 0.167 | 0.024 | 9.549 | ||||
| pg18beta2_o2nofp.cx10b_c32r128 | 9.520 | 76.183 | 13.721 | 0.318 | 0.243 | 0.015 | 7.387 | ||||
| pg18beta2_o2nofp.cx10cw4_c32r128 | 9.431 | 74.091 | 15.802 | 0.448 | 0.190 | 0.037 | 10.713 | ||||
| pg18beta2_o2nofp.cx10d_c32r128 | 10.382 | 75.904 | 13.110 | 0.384 | 0.190 | 0.031 | 10.760 |
Delete response time histogram: each cell has the percentage of responses that take <= the time in the header and max is the max response time in seconds. For max values in the top 25% of the range have a red background and in the bottom 25% of the range have a green background. The red background is not used when the min value is within 80% of the max value.
| dbms | 256us | 1ms | 4ms | 16ms | 64ms | 256ms | 1s | 4s | 16s | gt | max |
|---|---|---|---|---|---|---|---|---|---|---|---|
| pg174_o2nofp.cx10a_c32r128 | 0.026 | 97.000 | 2.627 | 0.252 | 0.096 | nonzero | 5.033 | ||||
| pg175_o2nofp.cx10a_c32r128 | 0.032 | 97.042 | 2.524 | 0.264 | 0.136 | 0.002 | 9.345 | ||||
| pg18beta1_o2nofp.cx10b_c32r128 | 0.022 | 96.641 | 2.939 | 0.286 | 0.111 | nonzero | 4.136 | ||||
| pg18beta1_o2nofp.cx10cw4_c32r128 | 0.009 | 96.353 | 3.306 | 0.251 | 0.081 | 3.812 | |||||
| pg18beta1_o2nofp.cx10d_c32r128 | 0.026 | 96.619 | 3.040 | 0.242 | 0.073 | nonzero | 6.012 | ||||
| pg18beta2_o2nofp.cx10b_c32r128 | 0.042 | 97.394 | 2.259 | 0.185 | 0.118 | 0.003 | 4.676 | ||||
| pg18beta2_o2nofp.cx10cw4_c32r128 | 0.046 | 96.963 | 2.635 | 0.280 | 0.076 | nonzero | 9.486 | ||||
| pg18beta2_o2nofp.cx10d_c32r128 | 0.053 | 97.443 | 2.192 | 0.221 | 0.090 | nonzero | 8.632 |
Performance metrics for the DBMS listed above. Some are normalized by throughput, others are not. Legend for results is here.
ips	qps	rps	rmbps	wps	wmbps	rpq	rkbpq	wpi	wkbpi	csps	cpups	cspq	cpupq	dbgb1	dbgb2	rss	maxop	p50	p99	tag
18246	2657	73139	574.5	36677.7	538.7	27.525	221.393	2.010	30.234	171580	61.0	64.572	11019	793.0	889.0	56.3	7.334	144	0	pg174_o2nofp.cx10a_c32r128
17467	2533	69956	549.5	35150.4	514.4	27.622	222.183	2.012	30.158	163890	58.4	64.712	11068	792.9	889.0	52.5	9.368	144	0	pg175_o2nofp.cx10a_c32r128
17804	2469	69547	546.3	35686.9	529.3	28.166	226.546	2.004	30.443	163069	60.9	66.041	11839	792.8	888.8	59.2	9.807	128	0	pg18beta1_o2nofp.cx10b_c32r128
17955	2450	69445	545.5	35970.7	535.8	28.340	227.967	2.003	30.555	162116	62.6	66.159	12262	793.6	889.6	51.7	8.882	128	0	pg18beta1_o2nofp.cx10cw4_c32r128
18009	2502	70316	552.4	35826.5	532.1	28.100	226.046	1.989	30.254	164248	61.6	65.639	11816	794.8	890.9	51.4	9.625	128	0	pg18beta1_o2nofp.cx10d_c32r128
18090	2550	71239	559.6	36409.5	538.6	27.941	224.762	2.013	30.486	167391	60.7	65.654	11428	793.1	889.2	60.4	7.118	143	0	pg18beta2_o2nofp.cx10b_c32r128
17664	2458	69167	543.2	34981.6	522.0	28.141	226.326	1.980	30.259	161735	60.0	65.802	11717	795.6	891.7	48.9	9.504	128	0	pg18beta2_o2nofp.cx10cw4_c32r128
17884	2535	70760	555.8	35685.0	526.9	27.911	224.492	1.995	30.170	165721	59.7	65.368	11303	793.1	889.2	52.1	9.942	144	0	pg18beta2_o2nofp.cx10d_c32r128
l.i0
l.i0: load without secondary indexes
Performance metrics for all DBMS, not just the ones listed above. Some are normalized by throughput, others are not. Legend for results is here.
ips	qps	rps	rmbps	wps	wmbps	rpq	rkbpq	wpi	wkbpi	csps	cpups	cspq	cpupq	dbgb1	dbgb2	rss	maxop	p50	p99	tag
2077922	0	1731	13.9	8698.7	828.2	0.001	0.007	0.004	0.408	400682	58.5	0.193	14	382.7	478.8	97.0	1.365	111081	47068	pg174_o2nofp.cx10a_c32r128
2056555	0	1724	13.8	8581.8	822.5	0.001	0.007	0.004	0.410	377749	57.8	0.184	13	382.7	478.8	97.2	1.562	111580	33870	pg175_o2nofp.cx10a_c32r128
2097535	0	1787	14.3	8745.7	838.2	0.001	0.007	0.004	0.409	362478	58.5	0.173	13	382.7	478.8	97.2	1.368	113971	36161	pg18beta1_o2nofp.cx10b_c32r128
2087683	0	1804	14.4	8745.2	834.3	0.001	0.007	0.004	0.409	358126	58.3	0.172	13	382.7	478.8	97.2	1.591	114087	27171	pg18beta1_o2nofp.cx10cw4_c32r128
2074689	0	1774	14.2	8668.8	826.8	0.001	0.007	0.004	0.408	358779	58.0	0.173	13	382.7	478.8	97.1	1.386	113617	39655	pg18beta1_o2nofp.cx10d_c32r128
2157497	0	1836	14.7	9001.2	862.9	0.001	0.007	0.004	0.410	369606	59.7	0.171	13	382.7	478.8	97.2	1.369	115583	52045	pg18beta2_o2nofp.cx10b_c32r128
2094241	0	1814	14.5	8776.6	839.0	0.001	0.007	0.004	0.410	365500	58.1	0.175	13	382.7	478.8	97.0	1.951	114376	31066	pg18beta2_o2nofp.cx10cw4_c32r128
2088773	0	1758	14.1	8748.6	836.1	0.001	0.007	0.004	0.410	372758	58.2	0.178	13	382.7	478.8	97.2	2.568	114312	28369	pg18beta2_o2nofp.cx10d_c32r128
l.x
l.x: create secondary indexes
Performance metrics for all DBMS, not just the ones listed above. Some are normalized by throughput, others are not. Legend for results is here.
ips	qps	rps	rmbps	wps	wmbps	rpq	rkbpq	wpi	wkbpi	csps	cpups	cspq	cpupq	dbgb1	dbgb2	rss	maxop	p50	p99	tag
3436426	0	11308	1091.3	8895.7	981.4	0.003	0.325	0.003	0.292	89477	23.8	0.026	3	768.4	863.7	31.4	0.081	NA	NA	pg174_o2nofp.cx10a_c32r128
3418804	0	11259	1086.5	8741.1	976.1	0.003	0.325	0.003	0.292	89975	23.4	0.026	3	768.4	863.7	30.8	0.021	NA	NA	pg175_o2nofp.cx10a_c32r128
3372681	0	11202	1074.7	8749.5	969.0	0.003	0.326	0.003	0.294	89331	23.3	0.026	3	768.4	864.0	41.9	0.003	NA	NA	pg18beta1_o2nofp.cx10b_c32r128
3407155	0	11492	1082.0	8871.8	980.8	0.003	0.325	0.003	0.295	94391	24.3	0.028	3	768.4	863.7	58.6	0.056	NA	NA	pg18beta1_o2nofp.cx10cw4_c32r128
3666361	0	12298	1166.4	9345.1	1048.2	0.003	0.326	0.003	0.293	116194	26.0	0.032	3	768.4	863.7	41.2	0.316	NA	NA	pg18beta1_o2nofp.cx10d_c32r128
3460208	0	11308	1100.7	8913.6	992.8	0.003	0.326	0.003	0.294	92118	23.7	0.027	3	768.4	863.7	31.4	0.060	NA	NA	pg18beta2_o2nofp.cx10b_c32r128
3401361	0	11401	1081.9	8840.3	973.9	0.003	0.326	0.003	0.293	93126	23.7	0.027	3	768.4	864.0	56.0	0.003	NA	NA	pg18beta2_o2nofp.cx10cw4_c32r128
3649635	0	12266	1162.8	9326.2	1046.3	0.003	0.326	0.003	0.294	117587	25.8	0.032	3	768.4	863.8	31.9	0.003	NA	NA	pg18beta2_o2nofp.cx10d_c32r128
l.i1
l.i1: continue load after secondary indexes created with 50 inserts per transaction
Performance metrics for all DBMS, not just the ones listed above. Some are normalized by throughput, others are not. Legend for results is here.
ips	qps	rps	rmbps	wps	wmbps	rpq	rkbpq	wpi	wkbpi	csps	cpups	cspq	cpupq	dbgb1	dbgb2	rss	maxop	p50	p99	tag
23195	0	29362	235.0	34833.0	761.2	1.266	10.373	1.502	33.606	81262	30.5	3.503	631	781.5	877.6	86.7	6.705	1149	0	pg174_o2nofp.cx10a_c32r128
23330	0	29567	235.6	34822.7	758.3	1.267	10.340	1.493	33.284	81696	30.8	3.502	634	781.5	877.6	88.8	4.653	1149	0	pg175_o2nofp.cx10a_c32r128
23317	0	29498	235.5	34738.6	765.5	1.265	10.344	1.490	33.616	83498	30.7	3.581	632	781.5	877.6	85.2	4.706	1199	0	pg18beta1_o2nofp.cx10b_c32r128
23115	0	29237	234.1	34054.9	758.4	1.265	10.370	1.473	33.600	82602	30.9	3.574	642	781.5	923.6	78.4	2.905	1149	0	pg18beta1_o2nofp.cx10cw4_c32r128
23358	0	29479	234.5	34749.5	762.8	1.262	10.280	1.488	33.441	83327	30.6	3.567	629	781.5	877.6	80.7	4.267	1149	0	pg18beta1_o2nofp.cx10d_c32r128
23732	0	29992	238.7	35326.4	776.0	1.264	10.301	1.489	33.484	84219	29.7	3.549	601	781.5	877.6	83.5	5.485	1199	0	pg18beta2_o2nofp.cx10b_c32r128
23135	0	29250	233.6	33840.7	753.6	1.264	10.340	1.463	33.355	83101	30.2	3.592	627	781.5	933.5	78.4	4.013	1149	0	pg18beta2_o2nofp.cx10cw4_c32r128
23571	0	29818	237.8	34840.7	769.9	1.265	10.329	1.478	33.448	84409	31.2	3.581	635	781.5	919.9	75.6	5.186	1199	0	pg18beta2_o2nofp.cx10d_c32r128
l.i2
l.i2: continue load after secondary indexes created with 5 inserts per transaction
Performance metrics for all DBMS, not just the ones listed above. Some are normalized by throughput, others are not. Legend for results is here.
ips	qps	rps	rmbps	wps	wmbps	rpq	rkbpq	wpi	wkbpi	csps	cpups	cspq	cpupq	dbgb1	dbgb2	rss	maxop	p50	p99	tag
2451	0	3072	26.8	4641.5	72.8	1.254	11.196	1.894	30.439	18652	29.7	7.611	5817	784.8	880.9	81.0	5.447	225	95	pg174_o2nofp.cx10a_c32r128
2314	0	2811	22.4	4138.8	66.6	1.215	9.925	1.789	29.462	17274	32.0	7.465	6638	784.9	880.9	77.8	5.541	215	25	pg175_o2nofp.cx10a_c32r128
2437	0	3162	30.5	4746.6	76.0	1.297	12.826	1.948	31.948	18315	28.4	7.515	5593	784.8	880.8	85.8	6.117	225	40	pg18beta1_o2nofp.cx10b_c32r128
2398	0	3035	26.1	4891.1	74.9	1.266	11.146	2.040	31.993	18494	25.9	7.712	5184	784.8	880.9	79.0	5.517	215	0	pg18beta1_o2nofp.cx10cw4_c32r128
2403	0	3028	26.6	4706.1	72.9	1.260	11.329	1.958	31.064	18504	26.8	7.700	5353	784.8	880.9	82.5	6.089	120	0	pg18beta1_o2nofp.cx10d_c32r128
2526	0	3221	29.3	4898.0	78.5	1.275	11.896	1.939	31.823	18995	30.6	7.520	5815	784.9	880.9	78.4	5.355	225	0	pg18beta2_o2nofp.cx10b_c32r128
4400	0	5670	52.3	8500.0	136.9	1.289	12.173	1.932	31.851	33669	40.0	7.651	4363	784.8	880.8	81.1	5.447	230	0	pg18beta2_o2nofp.cx10cw4_c32r128
2522	0	3134	27.3	4986.7	76.5	1.243	11.076	1.978	31.052	19275	24.9	7.644	4740	784.7	880.8	80.0	5.888	260	0	pg18beta2_o2nofp.cx10d_c32r128
qr100.L1
qr100.L1: range queries with 100 insert/s per client
Performance metrics for all DBMS, not just the ones listed above. Some are normalized by throughput, others are not. Legend for results is here.
ips	qps	rps	rmbps	wps	wmbps	rpq	rkbpq	wpi	wkbpi	csps	cpups	cspq	cpupq	dbgb1	dbgb2	rss	maxop	p50	p99	tag
1977	372847	2721	22.0	1234.3	36.0	0.007	0.060	0.624	18.670	1421774	43.0	3.813	55	785.0	881.0	94.8	0.306	18955	18140	pg174_o2nofp.cx10a_c32r128
1977	376506	2722	22.0	1213.0	35.8	0.007	0.060	0.614	18.558	1436110	43.1	3.814	55	785.0	881.0	95.4	0.075	19115	18380	pg175_o2nofp.cx10a_c32r128
1976	365365	2666	21.4	1298.5	36.6	0.007	0.060	0.657	18.984	1394620	43.1	3.817	57	784.9	880.9	96.0	0.470	18803	18052	pg18beta1_o2nofp.cx10b_c32r128
1977	367400	2666	21.4	1266.0	36.4	0.007	0.060	0.640	18.841	1401305	43.2	3.814	56	785.0	881.0	95.7	1.829	18748	17965	pg18beta1_o2nofp.cx10cw4_c32r128
1977	370226	2669	21.5	1278.6	36.5	0.007	0.059	0.647	18.901	1412129	43.2	3.814	56	784.9	881.0	95.7	0.251	18716	17949	pg18beta1_o2nofp.cx10d_c32r128
1977	366552	2672	21.5	1313.4	36.8	0.007	0.060	0.664	19.039	1398651	43.2	3.816	57	785.0	881.0	96.1	0.146	18636	17892	pg18beta2_o2nofp.cx10b_c32r128
1976	367784	2660	21.3	1323.2	37.0	0.007	0.059	0.670	19.153	1403818	43.1	3.817	56	785.0	881.1	95.8	0.324	18540	17667	pg18beta2_o2nofp.cx10cw4_c32r128
1976	372750	2666	21.5	1304.2	36.7	0.007	0.059	0.660	19.031	1422802	43.0	3.817	55	784.9	880.9	95.8	0.051	19051	18268	pg18beta2_o2nofp.cx10d_c32r128
qp100.L2
qp100.L2: point queries with 100 insert/s per client
Performance metrics for all DBMS, not just the ones listed above. Some are normalized by throughput, others are not. Legend for results is here.
ips	qps	rps	rmbps	wps	wmbps	rpq	rkbpq	wpi	wkbpi	csps	cpups	cspq	cpupq	dbgb1	dbgb2	rss	maxop	p50	p99	tag
1977	7068	99927	784.2	6634.0	76.5	14.138	113.609	3.356	39.630	223156	19.1	31.572	1297	785.0	881.1	90.9	5.415	416	0	pg174_o2nofp.cx10a_c32r128
1977	7001	99052	777.3	6678.9	76.9	14.149	113.698	3.378	39.812	221153	18.8	31.590	1289	785.1	881.1	92.2	5.630	416	0	pg175_o2nofp.cx10a_c32r128
1976	6974	98742	774.9	6608.0	76.2	14.159	113.781	3.344	39.518	220583	19.2	31.630	1322	785.0	881.0	93.5	5.591	416	0	pg18beta1_o2nofp.cx10b_c32r128
1976	6906	97844	767.6	6589.7	76.2	14.167	113.810	3.335	39.487	218834	20.1	31.686	1397	785.0	881.1	90.6	4.697	400	0	pg18beta1_o2nofp.cx10cw4_c32r128
1977	6923	98026	769.3	6615.4	76.4	14.159	113.781	3.346	39.556	218815	19.6	31.605	1359	785.0	881.1	91.2	5.051	400	0	pg18beta1_o2nofp.cx10d_c32r128
1977	6912	97867	768.1	6568.6	76.0	14.160	113.794	3.323	39.343	218442	18.7	31.605	1299	785.0	881.1	92.7	4.806	416	0	pg18beta2_o2nofp.cx10b_c32r128
1977	6912	97884	767.7	6561.8	76.0	14.161	113.734	3.319	39.386	218867	20.1	31.663	1396	785.3	881.3	91.2	5.457	400	0	pg18beta2_o2nofp.cx10cw4_c32r128
1977	6893	97632	766.3	6582.6	76.1	14.165	113.844	3.330	39.420	217692	19.0	31.583	1323	784.9	881.0	91.2	4.902	400	0	pg18beta2_o2nofp.cx10d_c32r128
qr500.L3
qr500.L3: range queries with 500 insert/s per client
Performance metrics for all DBMS, not just the ones listed above. Some are normalized by throughput, others are not. Legend for results is here.
ips	qps	rps	rmbps	wps	wmbps	rpq	rkbpq	wpi	wkbpi	csps	cpups	cspq	cpupq	dbgb1	dbgb2	rss	maxop	p50	p99	tag
9874	333101	13802	111.4	14502.0	242.9	0.041	0.343	1.469	25.188	1252077	49.4	3.759	71	785.5	881.5	87.5	1.887	17253	15295	pg174_o2nofp.cx10a_c32r128
9793	334424	13687	110.4	14385.4	241.0	0.041	0.338	1.469	25.197	1256143	49.4	3.756	71	785.5	881.5	86.9	3.747	16958	15061	pg175_o2nofp.cx10a_c32r128
9804	322117	13725	110.7	14378.3	241.2	0.043	0.352	1.467	25.193	1210877	49.9	3.759	74	785.4	881.5	84.5	4.769	16206	14213	pg18beta1_o2nofp.cx10b_c32r128
9858	328490	13799	111.6	14472.9	242.8	0.042	0.348	1.468	25.226	1240484	49.6	3.776	72	785.5	881.5	86.4	2.282	16829	14672	pg18beta1_o2nofp.cx10cw4_c32r128
9798	327476	13714	110.2	14388.1	241.5	0.042	0.345	1.468	25.240	1231216	49.5	3.760	73	786.1	882.1	86.4	3.074	16766	14576	pg18beta1_o2nofp.cx10d_c32r128
9831	326432	13759	111.0	14447.0	241.9	0.042	0.348	1.470	25.202	1226588	49.5	3.758	73	785.4	881.5	87.0	4.331	16381	14400	pg18beta2_o2nofp.cx10b_c32r128
9798	327128	13710	109.8	14382.5	241.6	0.042	0.344	1.468	25.250	1230947	49.3	3.763	72	786.7	882.8	88.5	1.418	16719	14783	pg18beta2_o2nofp.cx10cw4_c32r128
9820	331377	13728	110.8	14393.6	241.2	0.041	0.342	1.466	25.151	1248430	49.4	3.767	72	785.4	881.4	86.7	4.469	16750	14800	pg18beta2_o2nofp.cx10d_c32r128
qp500.L4
qp500.L4: point queries with 500 insert/s per client
Performance metrics for all DBMS, not just the ones listed above. Some are normalized by throughput, others are not. Legend for results is here.
ips	qps	rps	rmbps	wps	wmbps	rpq	rkbpq	wpi	wkbpi	csps	cpups	cspq	cpupq	dbgb1	dbgb2	rss	maxop	p50	p99	tag
9590	5066	91498	718.7	21615.8	291.5	18.062	145.284	2.254	31.124	209262	35.8	41.310	3392	786.0	882.0	77.3	6.648	288	0	pg174_o2nofp.cx10a_c32r128
9509	5064	91118	715.7	21489.3	288.7	17.994	144.733	2.260	31.089	208814	34.7	41.236	3289	785.9	882.0	31.5	6.169	288	0	pg175_o2nofp.cx10a_c32r128
9474	4878	88562	695.7	21297.9	287.5	18.157	146.048	2.248	31.072	202244	35.8	41.465	3523	785.9	881.9	34.3	8.677	272	0	pg18beta1_o2nofp.cx10b_c32r128
9474	4694	86018	675.4	21280.7	287.0	18.325	147.347	2.246	31.018	197779	36.1	42.134	3692	786.2	882.3	36.4	9.487	256	0	pg18beta1_o2nofp.cx10cw4_c32r128
9504	4936	89365	701.3	21426.8	289.0	18.105	145.482	2.255	31.140	204118	36.0	41.354	3501	787.4	883.5	33.6	7.767	272	0	pg18beta1_o2nofp.cx10d_c32r128
9539	4975	90123	707.8	21456.1	289.2	18.117	145.692	2.249	31.045	206181	35.5	41.447	3425	785.9	882.0	32.7	8.735	272	0	pg18beta2_o2nofp.cx10b_c32r128
9519	4883	88737	696.2	21297.2	288.5	18.174	146.011	2.237	31.035	203154	35.6	41.607	3500	788.2	884.2	34.4	9.210	272	0	pg18beta2_o2nofp.cx10cw4_c32r128
9489	4922	89274	701.2	21268.2	287.6	18.137	145.871	2.241	31.040	204218	35.2	41.488	3433	785.9	881.9	33.2	7.650	272	0	pg18beta2_o2nofp.cx10d_c32r128
qr1000.L5
qr1000.L5: range queries with 1000 insert/s per client
Performance metrics for all DBMS, not just the ones listed above. Some are normalized by throughput, others are not. Legend for results is here.
ips	qps	rps	rmbps	wps	wmbps	rpq	rkbpq	wpi	wkbpi	csps	cpups	cspq	cpupq	dbgb1	dbgb2	rss	maxop	p50	p99	tag
18200	205627	24269	195.3	26501.7	558.1	0.118	0.973	1.456	31.402	658296	64.6	3.201	151	788.6	932.8	74.5	2.647	10853	879	pg174_o2nofp.cx10a_c32r128
18256	207535	24328	195.9	26760.8	560.5	0.117	0.966	1.466	31.440	664945	64.8	3.204	150	788.6	928.2	76.3	2.455	10790	1266	pg175_o2nofp.cx10a_c32r128
18036	204655	24002	193.3	26117.3	552.4	0.117	0.967	1.448	31.364	650245	65.6	3.177	154	788.4	929.5	75.4	4.308	10666	527	pg18beta1_o2nofp.cx10b_c32r128
17982	204012	23930	192.3	26103.6	552.6	0.117	0.965	1.452	31.470	644993	65.8	3.162	155	789.3	927.3	75.0	9.658	10533	1135	pg18beta1_o2nofp.cx10cw4_c32r128
18163	207126	24194	194.5	26552.8	559.1	0.117	0.962	1.462	31.519	656764	65.9	3.171	153	790.5	928.8	76.0	2.267	10772	1727	pg18beta1_o2nofp.cx10d_c32r128
18145	208486	24128	194.1	26502.7	557.8	0.116	0.953	1.461	31.479	670293	65.2	3.215	150	788.8	930.0	74.9	4.222	10744	2397	pg18beta2_o2nofp.cx10b_c32r128
17955	205929	23874	191.8	26071.0	554.2	0.116	0.954	1.452	31.606	653188	65.1	3.172	152	791.3	925.6	75.3	2.599	10701	1039	pg18beta2_o2nofp.cx10cw4_c32r128
18100	210748	24084	193.8	26484.8	556.9	0.114	0.942	1.463	31.510	674234	65.2	3.199	148	788.8	929.1	78.3	5.650	10948	1215	pg18beta2_o2nofp.cx10d_c32r128
qp1000.L6
qp1000.L6: point queries with 1000 insert/s per client
Performance metrics for all DBMS, not just the ones listed above. Some are normalized by throughput, others are not. Legend for results is here.
ips	qps	rps	rmbps	wps	wmbps	rpq	rkbpq	wpi	wkbpi	csps	cpups	cspq	cpupq	dbgb1	dbgb2	rss	maxop	p50	p99	tag
18246	2657	73139	574.5	36677.7	538.7	27.525	221.393	2.010	30.234	171580	61.0	64.572	11019	793.0	889.0	56.3	7.334	144	0	pg174_o2nofp.cx10a_c32r128
17467	2533	69956	549.5	35150.4	514.4	27.622	222.183	2.012	30.158	163890	58.4	64.712	11068	792.9	889.0	52.5	9.368	144	0	pg175_o2nofp.cx10a_c32r128
17804	2469	69547	546.3	35686.9	529.3	28.166	226.546	2.004	30.443	163069	60.9	66.041	11839	792.8	888.8	59.2	9.807	128	0	pg18beta1_o2nofp.cx10b_c32r128
17955	2450	69445	545.5	35970.7	535.8	28.340	227.967	2.003	30.555	162116	62.6	66.159	12262	793.6	889.6	51.7	8.882	128	0	pg18beta1_o2nofp.cx10cw4_c32r128
18009	2502	70316	552.4	35826.5	532.1	28.100	226.046	1.989	30.254	164248	61.6	65.639	11816	794.8	890.9	51.4	9.625	128	0	pg18beta1_o2nofp.cx10d_c32r128
18090	2550	71239	559.6	36409.5	538.6	27.941	224.762	2.013	30.486	167391	60.7	65.654	11428	793.1	889.2	60.4	7.118	143	0	pg18beta2_o2nofp.cx10b_c32r128
17664	2458	69167	543.2	34981.6	522.0	28.141	226.326	1.980	30.259	161735	60.0	65.802	11717	795.6	891.7	48.9	9.504	128	0	pg18beta2_o2nofp.cx10cw4_c32r128
17884	2535	70760	555.8	35685.0	526.9	27.911	224.492	1.995	30.170	165721	59.7	65.368	11303	793.1	889.2	52.1	9.942	144	0	pg18beta2_o2nofp.cx10d_c32r128
l.i0
- l.i0: load without secondary indexes
- Legend for results is here.
- Each entry lists the percentage of responses that fit in that bucket (slower than max time for previous bucket, faster than min time for next bucket).
Insert response time histogram
256us	1ms	4ms	16ms	64ms	256ms	1s	4s	16s	gt	max	tag
0.000	90.409	9.378	0.120	0.077	0.011	0.004	nonzero	0.000	0.000	1.365	pg174_o2nofp.cx10a_c32r128
0.000	91.521	8.234	0.142	0.082	0.014	0.006	nonzero	0.000	0.000	1.562	pg175_o2nofp.cx10a_c32r128
0.000	93.087	6.620	0.183	0.100	0.005	0.005	nonzero	0.000	0.000	1.368	pg18beta1_o2nofp.cx10b_c32r128
0.000	93.166	6.573	0.160	0.089	0.005	0.006	nonzero	0.000	0.000	1.591	pg18beta1_o2nofp.cx10cw4_c32r128
0.000	93.067	6.635	0.186	0.100	0.005	0.006	nonzero	0.000	0.000	1.386	pg18beta1_o2nofp.cx10d_c32r128
0.000	93.599	6.111	0.199	0.081	0.006	0.003	nonzero	0.000	0.000	1.369	pg18beta2_o2nofp.cx10b_c32r128
0.000	93.262	6.425	0.199	0.104	0.005	0.006	nonzero	0.000	0.000	1.951	pg18beta2_o2nofp.cx10cw4_c32r128
0.000	93.001	6.672	0.210	0.106	0.005	0.005	nonzero	0.000	0.000	2.568	pg18beta2_o2nofp.cx10d_c32r128
l.x
- l.x: create secondary indexes
- Legend for results is here.
- Each entry lists the percentage of responses that fit in that bucket (slower than max time for previous bucket, faster than min time for next bucket).
TODO - determine whether there is data for create index response time
l.i1
- l.i1: continue load after secondary indexes created with 50 inserts per transaction
- Legend for results is here.
- Each entry lists the percentage of responses that fit in that bucket (slower than max time for previous bucket, faster than min time for next bucket).
Insert response time histogram
256us	1ms	4ms	16ms	64ms	256ms	1s	4s	16s	gt	max	tag
0.000	0.000	0.000	19.267	65.279	15.278	0.069	0.105	0.001	0.000	6.705	pg174_o2nofp.cx10a_c32r128
0.000	0.000	0.000	19.572	66.370	13.859	0.098	0.099	0.001	0.000	4.653	pg175_o2nofp.cx10a_c32r128
0.000	0.000	0.000	15.956	70.725	13.079	0.118	0.121	0.001	0.000	4.706	pg18beta1_o2nofp.cx10b_c32r128
0.000	0.000	0.000	15.593	68.220	15.990	0.078	0.119	0.000	0.000	2.905	pg18beta1_o2nofp.cx10cw4_c32r128
0.000	0.000	0.000	15.986	69.218	14.615	0.067	0.115	nonzero	0.000	4.267	pg18beta1_o2nofp.cx10d_c32r128
0.000	0.000	0.000	16.427	70.529	12.819	0.117	0.108	0.001	0.000	5.485	pg18beta2_o2nofp.cx10b_c32r128
0.000	0.000	0.000	14.987	69.659	15.129	0.094	0.131	nonzero	0.000	4.013	pg18beta2_o2nofp.cx10cw4_c32r128
0.000	0.000	0.000	16.209	70.025	13.555	0.091	0.120	nonzero	0.000	5.186	pg18beta2_o2nofp.cx10d_c32r128
Delete response time histogram
256us	1ms	4ms	16ms	64ms	256ms	1s	4s	16s	gt	max	tag
0.000	2.442	8.414	24.268	60.727	4.059	0.034	0.056	0.000	0.000	2.453	pg174_o2nofp.cx10a_c32r128
0.000	2.551	8.731	23.830	60.250	4.527	0.052	0.059	nonzero	0.000	4.006	pg175_o2nofp.cx10a_c32r128
0.000	2.379	8.189	23.959	63.676	1.683	0.055	0.059	0.000	0.000	2.584	pg18beta1_o2nofp.cx10b_c32r128
0.000	2.464	8.329	23.151	63.743	2.211	0.038	0.065	0.000	0.000	2.798	pg18beta1_o2nofp.cx10cw4_c32r128
0.000	2.392	8.736	23.346	63.381	2.046	0.028	0.070	nonzero	0.000	4.073	pg18beta1_o2nofp.cx10d_c32r128
0.000	2.475	8.238	28.512	59.236	1.426	0.055	0.057	0.000	0.000	3.202	pg18beta2_o2nofp.cx10b_c32r128
0.000	2.423	8.731	26.039	60.746	1.948	0.044	0.068	0.000	0.000	2.640	pg18beta2_o2nofp.cx10cw4_c32r128
0.000	2.491	8.410	23.201	63.763	2.031	0.043	0.060	0.000	0.000	2.887	pg18beta2_o2nofp.cx10d_c32r128
l.i2
- l.i2: continue load after secondary indexes created with 5 inserts per transaction
- Legend for results is here.
- Each entry lists the percentage of responses that fit in that bucket (slower than max time for previous bucket, faster than min time for next bucket).
Insert response time histogram
256us	1ms	4ms	16ms	64ms	256ms	1s	4s	16s	gt	max	tag
0.014	39.075	60.668	0.044	0.110	0.025	0.052	0.013	nonzero	0.000	5.447	pg174_o2nofp.cx10a_c32r128
0.000	42.491	57.392	0.013	0.038	0.016	0.029	0.020	nonzero	0.000	5.541	pg175_o2nofp.cx10a_c32r128
0.141	40.665	58.698	0.111	0.308	0.021	0.037	0.018	0.001	0.000	6.117	pg18beta1_o2nofp.cx10b_c32r128
0.005	35.639	63.874	0.102	0.212	0.037	0.086	0.044	nonzero	0.000	5.517	pg18beta1_o2nofp.cx10cw4_c32r128
0.003	37.377	62.192	0.079	0.222	0.023	0.050	0.050	0.004	0.000	6.089	pg18beta1_o2nofp.cx10d_c32r128
0.001	41.576	58.133	0.052	0.134	0.024	0.049	0.031	nonzero	0.000	5.355	pg18beta2_o2nofp.cx10b_c32r128
0.084	36.273	62.851	0.133	0.508	0.032	0.067	0.051	0.002	0.000	5.447	pg18beta2_o2nofp.cx10cw4_c32r128
0.077	38.334	61.138	0.078	0.238	0.031	0.062	0.041	0.001	0.000	5.888	pg18beta2_o2nofp.cx10d_c32r128
Delete response time histogram
256us	1ms	4ms	16ms	64ms	256ms	1s	4s	16s	gt	max	tag
0.095	1.345	0.020	0.073	98.464	0.002	0.001	nonzero	0.000	0.000	1.177	pg174_o2nofp.cx10a_c32r128
0.000	0.000	0.000	0.043	99.954	0.002	0.001	nonzero	0.000	0.000	2.575	pg175_o2nofp.cx10a_c32r128
0.205	3.880	2.167	0.064	93.678	0.005	0.001	nonzero	0.000	0.000	2.115	pg18beta1_o2nofp.cx10b_c32r128
0.061	0.928	0.019	0.097	98.891	0.002	0.001	0.001	0.000	0.000	2.999	pg18beta1_o2nofp.cx10cw4_c32r128
0.019	0.813	1.389	0.131	97.645	0.002	0.001	0.001	nonzero	0.000	4.776	pg18beta1_o2nofp.cx10d_c32r128
0.114	0.595	0.002	0.108	99.177	0.003	0.001	nonzero	0.000	0.000	3.361	pg18beta2_o2nofp.cx10b_c32r128
0.109	2.511	2.565	0.671	94.139	0.002	0.002	0.001	nonzero	0.000	4.775	pg18beta2_o2nofp.cx10cw4_c32r128
0.059	1.532	2.740	0.199	95.467	0.002	0.001	0.001	0.000	0.000	3.133	pg18beta2_o2nofp.cx10d_c32r128
qr100.L1
- qr100.L1: range queries with 100 insert/s per client
- Legend for results is here.
- Each entry lists the percentage of responses that fit in that bucket (slower than max time for previous bucket, faster than min time for next bucket).
Query response time histogram
256us	1ms	4ms	16ms	64ms	256ms	1s	4s	16s	gt	max	tag
99.995	0.004	nonzero	nonzero	nonzero	nonzero	nonzero	0.000	0.000	0.000	0.306	pg174_o2nofp.cx10a_c32r128
99.996	0.004	nonzero	nonzero	nonzero	nonzero	0.000	0.000	0.000	0.000	0.075	pg175_o2nofp.cx10a_c32r128
99.995	0.004	0.001	nonzero	nonzero	nonzero	nonzero	0.000	0.000	0.000	0.470	pg18beta1_o2nofp.cx10b_c32r128
99.996	0.004	nonzero	nonzero	nonzero	nonzero	nonzero	nonzero	0.000	0.000	1.829	pg18beta1_o2nofp.cx10cw4_c32r128
99.995	0.004	nonzero	nonzero	nonzero	nonzero	0.000	0.000	0.000	0.000	0.251	pg18beta1_o2nofp.cx10d_c32r128
99.996	0.004	0.001	nonzero	nonzero	nonzero	0.000	0.000	0.000	0.000	0.146	pg18beta2_o2nofp.cx10b_c32r128
99.996	0.004	nonzero	nonzero	nonzero	nonzero	nonzero	0.000	0.000	0.000	0.324	pg18beta2_o2nofp.cx10cw4_c32r128
99.996	0.003	nonzero	nonzero	nonzero	0.000	0.000	0.000	0.000	0.000	0.051	pg18beta2_o2nofp.cx10d_c32r128
Insert response time histogram
256us	1ms	4ms	16ms	64ms	256ms	1s	4s	16s	gt	max	tag
0.000	0.000	0.000	99.136	0.817	0.042	0.006	0.000	0.000	0.000	0.276	pg174_o2nofp.cx10a_c32r128
0.000	0.000	0.000	98.812	1.106	0.051	0.031	0.000	0.000	0.000	0.947	pg175_o2nofp.cx10a_c32r128
0.000	0.000	0.000	99.369	0.519	0.058	0.053	0.000	0.000	0.000	0.878	pg18beta1_o2nofp.cx10b_c32r128
0.000	0.000	0.000	99.247	0.711	0.021	0.014	0.007	0.000	0.000	2.264	pg18beta1_o2nofp.cx10cw4_c32r128
0.000	0.000	0.000	99.269	0.681	0.042	0.008	0.000	0.000	0.000	0.481	pg18beta1_o2nofp.cx10d_c32r128
0.000	0.000	0.000	98.889	1.008	0.078	0.025	0.000	0.000	0.000	0.859	pg18beta2_o2nofp.cx10b_c32r128
0.000	0.000	0.000	98.974	0.886	0.032	0.103	0.006	0.000	0.000	1.258	pg18beta2_o2nofp.cx10cw4_c32r128
0.000	0.000	0.000	98.808	1.092	0.057	0.036	0.007	0.000	0.000	2.333	pg18beta2_o2nofp.cx10d_c32r128
Delete response time histogram
256us	1ms	4ms	16ms	64ms	256ms	1s	4s	16s	gt	max	tag
0.000	45.672	54.290	0.036	0.000	0.001	0.000	0.000	0.000	0.000	0.090	pg174_o2nofp.cx10a_c32r128
0.000	49.878	50.061	0.056	0.004	0.000	0.001	0.000	0.000	0.000	0.256	pg175_o2nofp.cx10a_c32r128
0.000	43.825	56.128	0.046	0.001	0.000	0.000	0.000	0.000	0.000	0.060	pg18beta1_o2nofp.cx10b_c32r128
0.000	46.774	53.190	0.035	0.001	0.000	0.000	0.000	0.000	0.000	0.025	pg18beta1_o2nofp.cx10cw4_c32r128
0.000	43.353	56.572	0.065	0.008	0.001	0.000	0.000	0.000	0.000	0.069	pg18beta1_o2nofp.cx10d_c32r128
0.000	45.535	54.408	0.050	0.007	0.000	0.000	0.000	0.000	0.000	0.035	pg18beta2_o2nofp.cx10b_c32r128
0.000	47.426	52.521	0.037	0.015	0.000	0.000	0.000	0.000	0.000	0.034	pg18beta2_o2nofp.cx10cw4_c32r128
0.000	48.039	51.906	0.047	0.008	0.000	0.000	0.000	0.000	0.000	0.023	pg18beta2_o2nofp.cx10d_c32r128
qp100.L2
- qp100.L2: point queries with 100 insert/s per client
- Legend for results is here.
- Each entry lists the percentage of responses that fit in that bucket (slower than max time for previous bucket, faster than min time for next bucket).
Query response time histogram
256us	1ms	4ms	16ms	64ms	256ms	1s	4s	16s	gt	max	tag
nonzero	2.638	94.203	0.383	2.658	0.061	0.040	0.015	0.002	0.000	5.415	pg174_o2nofp.cx10a_c32r128
0.000	2.731	94.173	0.331	2.643	0.063	0.042	0.017	0.002	0.000	5.630	pg175_o2nofp.cx10a_c32r128
nonzero	2.473	94.364	0.378	2.670	0.060	0.039	0.016	0.001	0.000	5.591	pg18beta1_o2nofp.cx10b_c32r128
0.000	2.314	94.401	0.342	2.818	0.071	0.037	0.015	0.001	0.000	4.697	pg18beta1_o2nofp.cx10cw4_c32r128
nonzero	2.419	94.439	0.326	2.690	0.065	0.044	0.015	0.001	0.000	5.051	pg18beta1_o2nofp.cx10d_c32r128
nonzero	2.437	94.458	0.357	2.631	0.059	0.040	0.016	0.001	0.000	4.806	pg18beta2_o2nofp.cx10b_c32r128
nonzero	2.329	94.384	0.331	2.840	0.067	0.032	0.014	0.002	0.000	5.457	pg18beta2_o2nofp.cx10cw4_c32r128
0.000	2.520	94.442	0.292	2.617	0.065	0.048	0.016	0.001	0.000	4.902	pg18beta2_o2nofp.cx10d_c32r128
Insert response time histogram
256us	1ms	4ms	16ms	64ms	256ms	1s	4s	16s	gt	max	tag
0.000	0.000	0.000	60.368	35.990	1.097	1.261	1.182	0.101	0.000	4.784	pg174_o2nofp.cx10a_c32r128
0.000	0.000	0.000	62.085	34.104	1.115	1.343	1.290	0.062	0.000	4.924	pg175_o2nofp.cx10a_c32r128
0.000	0.000	0.000	62.101	34.351	0.985	1.118	1.339	0.106	0.000	5.051	pg18beta1_o2nofp.cx10b_c32r128
0.000	0.000	0.000	59.374	37.101	1.218	1.221	1.029	0.057	0.000	4.390	pg18beta1_o2nofp.cx10cw4_c32r128
0.000	0.000	0.000	61.235	35.139	1.151	1.113	1.304	0.058	0.000	4.999	pg18beta1_o2nofp.cx10d_c32r128
0.000	0.000	0.000	62.457	34.126	1.021	0.889	1.454	0.053	0.000	4.595	pg18beta2_o2nofp.cx10b_c32r128
0.000	0.000	0.000	62.596	34.126	1.167	0.853	1.206	0.053	0.000	4.671	pg18beta2_o2nofp.cx10cw4_c32r128
0.000	0.000	0.000	62.324	34.249	0.932	1.276	1.197	0.022	0.000	4.607	pg18beta2_o2nofp.cx10d_c32r128
Delete response time histogram
256us	1ms	4ms	16ms	64ms	256ms	1s	4s	16s	gt	max	tag
0.000	0.000	94.647	1.522	3.725	0.019	0.056	0.029	0.001	0.000	4.336	pg174_o2nofp.cx10a_c32r128
0.000	0.000	94.908	1.476	3.493	0.019	0.067	0.036	0.000	0.000	3.411	pg175_o2nofp.cx10a_c32r128
0.000	0.000	93.476	2.503	3.811	0.035	0.099	0.076	0.000	0.000	3.840	pg18beta1_o2nofp.cx10b_c32r128
0.000	0.000	93.800	2.100	3.988	0.042	0.035	0.035	0.001	0.000	4.251	pg18beta1_o2nofp.cx10cw4_c32r128
0.000	0.000	95.061	1.229	3.586	0.032	0.047	0.043	0.001	0.000	4.453	pg18beta1_o2nofp.cx10d_c32r128
0.000	0.000	94.283	1.851	3.711	0.025	0.088	0.042	0.000	0.000	3.771	pg18beta2_o2nofp.cx10b_c32r128
0.000	0.000	95.546	0.681	3.658	0.040	0.035	0.040	0.000	0.000	3.924	pg18beta2_o2nofp.cx10cw4_c32r128
0.000	0.000	95.793	0.508	3.560	0.015	0.083	0.039	0.001	0.000	4.497	pg18beta2_o2nofp.cx10d_c32r128
qr500.L3
- qr500.L3: range queries with 500 insert/s per client
- Legend for results is here.
- Each entry lists the percentage of responses that fit in that bucket (slower than max time for previous bucket, faster than min time for next bucket).
Query response time histogram
256us	1ms	4ms	16ms	64ms	256ms	1s	4s	16s	gt	max	tag
99.977	0.018	0.003	0.001	0.001	nonzero	nonzero	nonzero	0.000	0.000	1.887	pg174_o2nofp.cx10a_c32r128
99.976	0.019	0.003	0.001	0.001	nonzero	nonzero	nonzero	0.000	0.000	3.747	pg175_o2nofp.cx10a_c32r128
99.976	0.019	0.003	0.001	0.001	nonzero	nonzero	nonzero	nonzero	0.000	4.769	pg18beta1_o2nofp.cx10b_c32r128
99.978	0.017	0.003	0.001	0.001	nonzero	nonzero	nonzero	0.000	0.000	2.282	pg18beta1_o2nofp.cx10cw4_c32r128
99.975	0.020	0.003	0.001	0.001	nonzero	nonzero	nonzero	0.000	0.000	3.074	pg18beta1_o2nofp.cx10d_c32r128
99.975	0.020	0.003	0.001	0.001	nonzero	nonzero	nonzero	nonzero	0.000	4.331	pg18beta2_o2nofp.cx10b_c32r128
99.975	0.020	0.003	0.001	0.001	nonzero	nonzero	nonzero	0.000	0.000	1.418	pg18beta2_o2nofp.cx10cw4_c32r128
99.976	0.019	0.003	0.001	0.001	nonzero	nonzero	nonzero	nonzero	0.000	4.469	pg18beta2_o2nofp.cx10d_c32r128
Insert response time histogram
256us	1ms	4ms	16ms	64ms	256ms	1s	4s	16s	gt	max	tag
0.000	0.000	0.000	85.427	13.756	0.354	0.371	0.092	0.000	0.000	2.381	pg174_o2nofp.cx10a_c32r128
0.000	0.000	0.000	82.915	16.430	0.333	0.220	0.091	0.011	0.000	5.518	pg175_o2nofp.cx10a_c32r128
0.000	0.000	0.000	82.844	16.322	0.376	0.298	0.148	0.011	0.000	5.640	pg18beta1_o2nofp.cx10b_c32r128
0.000	0.000	0.000	85.745	13.536	0.370	0.238	0.111	0.000	0.000	2.846	pg18beta1_o2nofp.cx10cw4_c32r128
0.000	0.000	0.000	83.467	15.792	0.379	0.237	0.119	0.006	0.000	5.777	pg18beta1_o2nofp.cx10d_c32r128
0.000	0.000	0.000	83.886	15.447	0.293	0.274	0.094	0.006	0.000	4.602	pg18beta2_o2nofp.cx10b_c32r128
0.000	0.000	0.000	82.953	16.326	0.347	0.254	0.107	0.013	0.000	5.335	pg18beta2_o2nofp.cx10cw4_c32r128
0.000	0.000	0.000	84.664	14.670	0.344	0.216	0.097	0.009	0.000	5.059	pg18beta2_o2nofp.cx10d_c32r128
Delete response time histogram
256us	1ms	4ms	16ms	64ms	256ms	1s	4s	16s	gt	max	tag
0.000	0.000	39.057	59.553	1.374	0.006	0.008	0.001	0.000	0.000	1.886	pg174_o2nofp.cx10a_c32r128
0.000	0.000	39.114	59.306	1.563	0.007	0.003	0.006	0.001	0.000	4.933	pg175_o2nofp.cx10a_c32r128
0.000	0.000	34.225	64.004	1.752	0.008	0.007	0.003	0.000	0.000	2.976	pg18beta1_o2nofp.cx10b_c32r128
0.000	0.000	41.335	57.229	1.421	0.006	0.007	0.003	0.000	0.000	2.223	pg18beta1_o2nofp.cx10cw4_c32r128
0.000	0.000	36.902	61.328	1.751	0.008	0.003	0.005	0.003	0.000	5.576	pg18beta1_o2nofp.cx10d_c32r128
0.000	0.000	36.490	61.931	1.564	0.007	0.005	0.002	0.001	0.000	4.299	pg18beta2_o2nofp.cx10b_c32r128
0.000	0.000	41.960	56.276	1.754	0.004	0.004	0.003	0.000	0.000	2.327	pg18beta2_o2nofp.cx10cw4_c32r128
0.000	0.000	42.325	56.144	1.518	0.006	0.005	0.003	nonzero	0.000	4.793	pg18beta2_o2nofp.cx10d_c32r128
qp500.L4
- qp500.L4: point queries with 500 insert/s per client
- Legend for results is here.
- Each entry lists the percentage of responses that fit in that bucket (slower than max time for previous bucket, faster than min time for next bucket).
Query response time histogram
256us	1ms	4ms	16ms	64ms	256ms	1s	4s	16s	gt	max	tag
0.000	0.225	93.568	1.302	4.847	0.028	0.017	0.011	0.002	0.000	6.648	pg174_o2nofp.cx10a_c32r128
0.000	0.229	93.633	1.277	4.806	0.026	0.015	0.012	0.003	0.000	6.169	pg175_o2nofp.cx10a_c32r128
0.000	0.195	93.533	1.351	4.858	0.030	0.019	0.012	0.002	0.000	8.677	pg18beta1_o2nofp.cx10b_c32r128
0.000	0.174	93.112	1.458	5.172	0.047	0.022	0.012	0.003	0.000	9.487	pg18beta1_o2nofp.cx10cw4_c32r128
0.000	0.205	93.487	1.423	4.825	0.030	0.016	0.013	0.002	0.000	7.767	pg18beta1_o2nofp.cx10d_c32r128
0.000	0.206	93.657	1.251	4.828	0.026	0.015	0.016	0.002	0.000	8.735	pg18beta2_o2nofp.cx10b_c32r128
0.000	0.191	93.265	1.486	4.992	0.032	0.019	0.011	0.003	0.000	9.210	pg18beta2_o2nofp.cx10cw4_c32r128
0.000	0.200	93.583	1.331	4.829	0.027	0.013	0.014	0.003	0.000	7.650	pg18beta2_o2nofp.cx10d_c32r128
Insert response time histogram
256us	1ms	4ms	16ms	64ms	256ms	1s	4s	16s	gt	max	tag
0.000	0.000	0.000	39.204	59.296	0.860	0.321	0.284	0.035	0.000	6.377	pg174_o2nofp.cx10a_c32r128
0.000	0.000	0.000	38.665	60.028	0.643	0.313	0.309	0.042	0.000	6.016	pg175_o2nofp.cx10a_c32r128
0.000	0.000	0.000	37.622	60.875	0.802	0.360	0.290	0.051	0.000	8.490	pg18beta1_o2nofp.cx10b_c32r128
0.000	0.000	0.000	37.130	60.926	1.186	0.430	0.279	0.049	0.000	9.495	pg18beta1_o2nofp.cx10cw4_c32r128
0.000	0.000	0.000	36.433	61.794	1.083	0.337	0.308	0.046	0.000	9.530	pg18beta1_o2nofp.cx10d_c32r128
0.000	0.000	0.000	38.671	59.909	0.701	0.316	0.370	0.034	0.000	9.532	pg18beta2_o2nofp.cx10b_c32r128
0.000	0.000	0.000	35.841	62.551	0.928	0.360	0.272	0.048	0.000	10.292	pg18beta2_o2nofp.cx10cw4_c32r128
0.000	0.000	0.000	39.154	59.418	0.761	0.298	0.301	0.068	0.000	7.610	pg18beta2_o2nofp.cx10d_c32r128
Delete response time histogram
256us	1ms	4ms	16ms	64ms	256ms	1s	4s	16s	gt	max	tag
0.000	0.000	0.000	67.089	32.522	0.096	0.206	0.086	0.001	0.000	4.696	pg174_o2nofp.cx10a_c32r128
0.000	0.000	0.000	74.251	25.354	0.081	0.218	0.096	nonzero	0.000	4.834	pg175_o2nofp.cx10a_c32r128
0.000	0.000	0.000	65.173	34.392	0.111	0.227	0.095	0.002	0.000	5.444	pg18beta1_o2nofp.cx10b_c32r128
0.000	0.000	0.000	65.001	34.531	0.175	0.212	0.081	0.001	0.000	7.499	pg18beta1_o2nofp.cx10cw4_c32r128
0.000	0.000	0.000	65.026	34.540	0.145	0.208	0.081	nonzero	0.000	6.350	pg18beta1_o2nofp.cx10d_c32r128
0.000	0.000	0.000	69.628	29.950	0.092	0.204	0.126	0.000	0.000	3.730	pg18beta2_o2nofp.cx10b_c32r128
0.000	0.000	0.000	73.679	25.919	0.134	0.206	0.060	0.001	0.000	6.540	pg18beta2_o2nofp.cx10cw4_c32r128
0.000	0.000	0.000	71.912	27.721	0.076	0.198	0.093	0.001	0.000	6.419	pg18beta2_o2nofp.cx10d_c32r128
qr1000.L5
- qr1000.L5: range queries with 1000 insert/s per client
- Legend for results is here.
- Each entry lists the percentage of responses that fit in that bucket (slower than max time for previous bucket, faster than min time for next bucket).
Query response time histogram
256us	1ms	4ms	16ms	64ms	256ms	1s	4s	16s	gt	max	tag
99.698	0.215	0.027	0.035	0.026	0.001	nonzero	nonzero	0.000	0.000	2.647	pg174_o2nofp.cx10a_c32r128
99.711	0.206	0.026	0.033	0.024	0.001	nonzero	nonzero	0.000	0.000	2.455	pg175_o2nofp.cx10a_c32r128
99.693	0.227	0.027	0.030	0.021	nonzero	nonzero	nonzero	nonzero	0.000	4.308	pg18beta1_o2nofp.cx10b_c32r128
99.693	0.227	0.027	0.031	0.022	nonzero	nonzero	nonzero	nonzero	0.000	9.658	pg18beta1_o2nofp.cx10cw4_c32r128
99.698	0.223	0.027	0.030	0.021	nonzero	nonzero	nonzero	0.000	0.000	2.267	pg18beta1_o2nofp.cx10d_c32r128
99.710	0.211	0.027	0.030	0.022	nonzero	nonzero	nonzero	nonzero	0.000	4.222	pg18beta2_o2nofp.cx10b_c32r128
99.708	0.212	0.027	0.031	0.022	nonzero	nonzero	nonzero	0.000	0.000	2.599	pg18beta2_o2nofp.cx10cw4_c32r128
99.721	0.203	0.026	0.029	0.020	nonzero	nonzero	nonzero	nonzero	0.000	5.650	pg18beta2_o2nofp.cx10d_c32r128
Insert response time histogram
256us	1ms	4ms	16ms	64ms	256ms	1s	4s	16s	gt	max	tag
0.000	0.000	0.000	38.247	44.091	17.450	0.109	0.095	0.008	0.000	6.192	pg174_o2nofp.cx10a_c32r128
0.000	0.000	0.000	40.427	42.304	17.034	0.133	0.101	nonzero	0.000	4.259	pg175_o2nofp.cx10a_c32r128
0.000	0.000	0.000	35.981	45.357	18.442	0.097	0.111	0.013	0.000	6.721	pg18beta1_o2nofp.cx10b_c32r128
0.000	0.000	0.000	35.405	44.825	19.552	0.106	0.107	0.005	0.000	9.947	pg18beta1_o2nofp.cx10cw4_c32r128
0.000	0.000	0.000	35.610	46.182	17.992	0.104	0.108	0.003	0.000	6.670	pg18beta1_o2nofp.cx10d_c32r128
0.000	0.000	0.000	35.148	46.387	18.258	0.099	0.095	0.013	0.000	7.291	pg18beta2_o2nofp.cx10b_c32r128
0.000	0.000	0.000	33.624	46.489	19.677	0.086	0.120	0.004	0.000	6.460	pg18beta2_o2nofp.cx10cw4_c32r128
0.000	0.000	0.000	35.357	46.646	17.806	0.084	0.098	0.008	0.000	8.950	pg18beta2_o2nofp.cx10d_c32r128
Delete response time histogram
256us	1ms	4ms	16ms	64ms	256ms	1s	4s	16s	gt	max	tag
0.000	0.000	0.000	35.922	59.058	4.930	0.040	0.050	nonzero	0.000	4.784	pg174_o2nofp.cx10a_c32r128
0.000	0.000	0.000	37.177	57.934	4.775	0.064	0.050	0.000	0.000	2.027	pg175_o2nofp.cx10a_c32r128
0.000	0.000	0.000	35.589	60.821	3.496	0.039	0.054	nonzero	0.000	5.203	pg18beta1_o2nofp.cx10b_c32r128
0.000	0.000	0.000	33.533	62.744	3.623	0.046	0.054	nonzero	0.000	9.601	pg18beta1_o2nofp.cx10cw4_c32r128
0.000	0.000	0.000	34.927	61.729	3.252	0.036	0.056	0.000	0.000	2.222	pg18beta1_o2nofp.cx10d_c32r128
0.000	0.000	0.000	38.855	58.006	3.057	0.040	0.043	0.000	0.000	3.732	pg18beta2_o2nofp.cx10b_c32r128
0.000	0.000	0.000	38.073	58.561	3.274	0.032	0.059	0.000	0.000	3.180	pg18beta2_o2nofp.cx10cw4_c32r128
0.000	0.000	0.000	39.217	57.667	3.039	0.034	0.044	nonzero	0.000	5.163	pg18beta2_o2nofp.cx10d_c32r128
qp1000.L6
- qp1000.L6: point queries with 1000 insert/s per client
- Legend for results is here.
- Each entry lists the percentage of responses that fit in that bucket (slower than max time for previous bucket, faster than min time for next bucket).
Query response time histogram
256us	1ms	4ms	16ms	64ms	256ms	1s	4s	16s	gt	max	tag
0.000	0.002	70.997	19.625	9.131	0.169	0.052	0.024	0.002	0.000	7.334	pg174_o2nofp.cx10a_c32r128
0.000	0.001	71.619	18.840	9.276	0.166	0.058	0.034	0.005	0.000	9.368	pg175_o2nofp.cx10a_c32r128
0.000	0.001	68.294	21.854	9.515	0.238	0.067	0.027	0.004	0.000	9.807	pg18beta1_o2nofp.cx10b_c32r128
0.000	0.001	67.516	22.041	10.096	0.256	0.066	0.021	0.002	0.000	8.882	pg18beta1_o2nofp.cx10cw4_c32r128
0.000	0.001	68.569	21.554	9.552	0.243	0.056	0.021	0.004	0.000	9.625	pg18beta1_o2nofp.cx10d_c32r128
0.000	0.001	69.035	21.248	9.464	0.172	0.048	0.031	0.002	0.000	7.118	pg18beta2_o2nofp.cx10b_c32r128
0.000	0.001	69.040	20.924	9.740	0.203	0.065	0.021	0.006	0.000	9.504	pg18beta2_o2nofp.cx10cw4_c32r128
0.000	0.001	69.850	20.650	9.229	0.187	0.053	0.025	0.005	0.000	9.942	pg18beta2_o2nofp.cx10d_c32r128
Insert response time histogram
256us	1ms	4ms	16ms	64ms	256ms	1s	4s	16s	gt	max	tag
0.000	0.000	0.000	10.708	76.523	12.196	0.369	0.192	0.013	0.000	7.527	pg174_o2nofp.cx10a_c32r128
0.000	0.000	0.000	10.934	75.652	12.675	0.418	0.284	0.037	0.000	9.458	pg175_o2nofp.cx10a_c32r128
0.000	0.000	0.000	10.342	72.985	15.972	0.452	0.222	0.028	0.000	10.718	pg18beta1_o2nofp.cx10b_c32r128
0.000	0.000	0.000	8.968	71.975	18.428	0.434	0.179	0.015	0.000	8.346	pg18beta1_o2nofp.cx10cw4_c32r128
0.000	0.000	0.000	9.537	73.571	16.282	0.418	0.167	0.024	0.000	9.549	pg18beta1_o2nofp.cx10d_c32r128
0.000	0.000	0.000	9.520	76.183	13.721	0.318	0.243	0.015	0.000	7.387	pg18beta2_o2nofp.cx10b_c32r128
0.000	0.000	0.000	9.431	74.091	15.802	0.448	0.190	0.037	0.000	10.713	pg18beta2_o2nofp.cx10cw4_c32r128
0.000	0.000	0.000	10.382	75.904	13.110	0.384	0.190	0.031	0.000	10.760	pg18beta2_o2nofp.cx10d_c32r128
Delete response time histogram
256us	1ms	4ms	16ms	64ms	256ms	1s	4s	16s	gt	max	tag
0.000	0.000	0.000	0.026	97.000	2.627	0.252	0.096	nonzero	0.000	5.033	pg174_o2nofp.cx10a_c32r128
0.000	0.000	0.000	0.032	97.042	2.524	0.264	0.136	0.002	0.000	9.345	pg175_o2nofp.cx10a_c32r128
0.000	0.000	0.000	0.022	96.641	2.939	0.286	0.111	nonzero	0.000	4.136	pg18beta1_o2nofp.cx10b_c32r128
0.000	0.000	0.000	0.009	96.353	3.306	0.251	0.081	0.000	0.000	3.812	pg18beta1_o2nofp.cx10cw4_c32r128
0.000	0.000	0.000	0.026	96.619	3.040	0.242	0.073	nonzero	0.000	6.012	pg18beta1_o2nofp.cx10d_c32r128
0.000	0.000	0.000	0.042	97.394	2.259	0.185	0.118	0.003	0.000	4.676	pg18beta2_o2nofp.cx10b_c32r128
0.000	0.000	0.000	0.046	96.963	2.635	0.280	0.076	nonzero	0.000	9.486	pg18beta2_o2nofp.cx10cw4_c32r128
0.000	0.000	0.000	0.053	97.443	2.192	0.221	0.090	nonzero	0.000	8.632	pg18beta2_o2nofp.cx10d_c32r128